earnhart hill regional water and sewer district … overview of the district and its financial...
TRANSCRIPT

Earnhart Hill Regional Water and Sewer DistrictPickaway County
Basic Financial StatementsFor the Years Ended December 31, 2017 and 2016
Millhuff-Stang, CPA, Inc.1428 Gallia Street / Portsmouth, Ohio 45662 / Phone: 740.876.8548
45 West Second Street, Suite D / Chillicothe, Ohio 45601 / Phone: 740.851.4978Fax: 888.876.8549

Earnhart Hill Regional Water and Sewer DistrictPickaway CountyTable of Contents
For the Years Ended December 31, 2017 and 2016
Title Page
Independent Accountant’s Compilation Report ..............................................................................................1
Management’s Discussion and Analysis .........................................................................................................3
Basic Financial Statements:
Statements of Net Position .......................................................................................................................8
Statements of Revenues, Expenses and Changes in Net Position .......................................................... 10
Statements of Cash Flows ...................................................................................................................... 11
Notes to the Basic Financial Statements ................................................................................................ 13
Required Supplementary Information:
Schedule of District’s Proportionate Share of the Net Pension Liability – Last Four Years.................. 33
Schedule of District Contributions – Last Ten Years............................................................................. 34

Millhuff-Stang, CPA, Inc.1428 Gallia Street / Portsmouth, Ohio 45662 / Phone: 740.876.8548
45 West Second Street, Suite D / Chillicothe, Ohio 45601 / Phone: 740.851.4978Fax: 888.876.8549
[email protected] / [email protected]
1
Independent Accountant’s Compilation Report
Members of the BoardEarnhart Hill Regional Water and Sewer District2030 Stoneridge DriveCircleville, Ohio 43113
Management is responsible for the accompanying financial statements of Earnhart Hill Regional Water and Sewer District, Pickaway County, (the District) as of and for the years ended December 31, 2017 and 2016, and the related notes to the financial statements in accordance with accounting principles generally accepted in the United States of America. We have performed a compilation engagement in accordance with Statements on Standards for Accounting and Review Services promulgated by the Accounting and Review Services Committee of the AICPA. We did not audit or review the financial statements nor were we required to perform any procedures to verify the accuracy or the completeness of the information provided by management. Accordingly, we do not express an opinion, a conclusion, nor provide any form of assurance on these financial statements.
Accounting principles generally accepted in the United States of America requires that management’s discussion and analysis on pages 3 through 7 and the net pension liability and employer contributions schedules on pages 33 and 34be presented to supplement the basic financial statements. Such information, although not a part of the basic financial statements, is required by the Governmental Accounting Standards Board who considers it to be an essential part of financial reporting and for placing the basic financial statements in an appropriate operational, economic, or historical context. Such information has been compiled by us without audit or review and, accordingly, we do not express an opinion, a conclusion, nor provide any assurance on it.
Robyn Roush, CPA, CITPVice-President/OwnerMillhuff-Stang CPA, Inc.Chillicothe, Ohio
March 27, 2018

2
This page was intentionally left blank.
Earnhart Hill Regional Water and Sewer DistrictManagement’s Discussion and Analysis
For the Years Ended December 31, 2017 and 2016(Unaudited)
3
This discussion and analysis, along with the accompanying financial report, of Earnhart Hill Regional Water and Sewer District (the District) is designed to provide our customers, creditors and other interested parties with a general overview of the District and its financial activities.
Financial Highlights
The total assets and deferred outflows of resources of the District exceeded liabilities and deferred inflows ofresources on December 31, 2017 and 2016 by $18,329,068 and $17,628,695, respectively. The District's netposition increased by $700,373 or 4% in 2017 and $397,185 or 2% in 2016.
The District's operating revenues increased by $370,504 or 10% in 2017 and $321,340 or 10% in 2016.Operating expenses increased $491,663 or 15% in 2017 and $350,278 or 12% in 2016.
The District issued no additional long term debt in 2016. In April 2017, the District entered into anobligation with the USDA Rural Development to upgrade the River Drive Waste Water Treatment Plant.The loan will be in the amount of $4,959,000, with an interest rate of 2.75% for 40 years, with an expectedproject completion date of May 2019. In July 2017, the District entered into a second obligation withUSDA Rural Development for the upgrade project. The loan will be in the amount of $214,000, with aninterest rate of 2.625% for 40 years and a grant in the amount of $369,000. None of these funds weredrawn in 2017. It is expected the loan will be signed in the first half of 2018.
Overview of the Basic Financial Statements
The District is a single enterprise fund using proprietary fund accounting, similar to private sector business. The basic financial statements are presented using the accrual basis of accounting.
The statement of net position includes all of the District's assets, liabilities and deferred inflows/outflows of resources. This statement provides information about the nature and amounts of investments in resources (assets) owned by the District, and obligations owed by the District (liabilities) on December 31. The District's net position (equity) is the difference between assets plus deferred outflows of resources and liabilities plus deferred inflows of resources.
The statement of revenues, expenses and changes in net position provides information on the District's operations over the past year and the success of recovering all its costs through service charges, capacity charges and tap fees, and other income. Revenues are reported when earned and expenses are reported when incurred.
The statement of cash flows provides information about the District's cash receipts and cash disbursements. It summarizes the net changes in cash resulting from operating, investing, capital and related financing, and non-capital and related financing activities.
Net Position
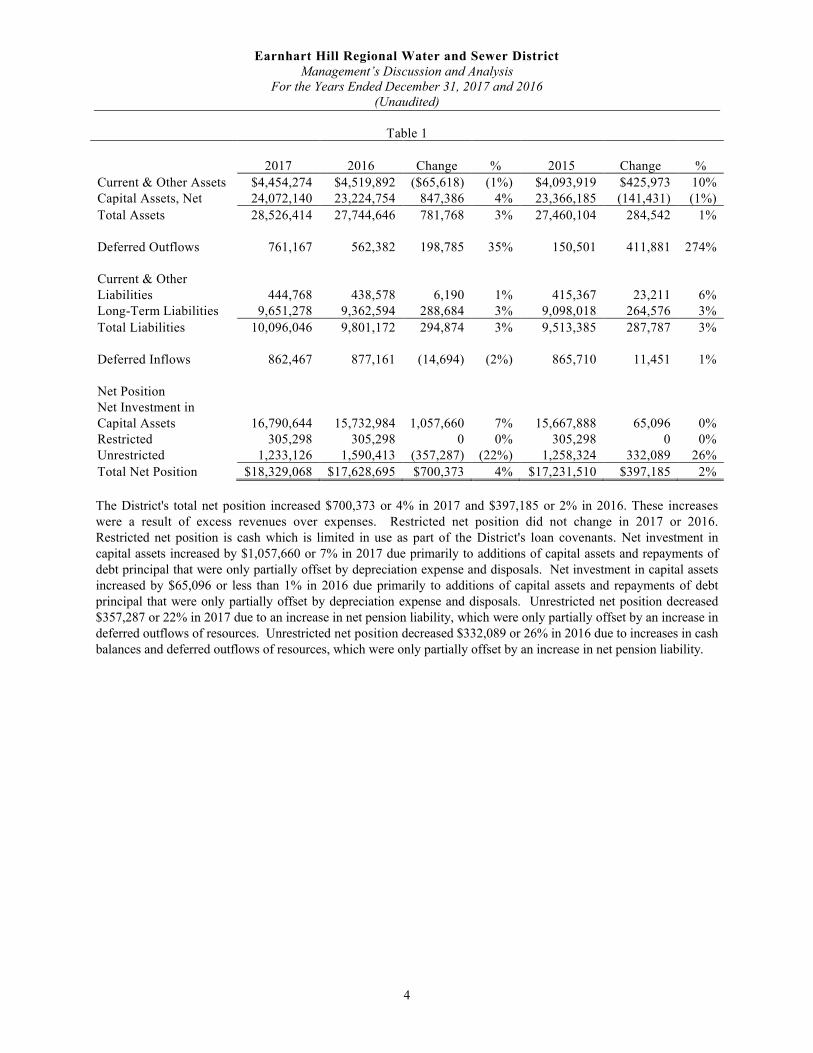
Table 1 summarizes the net position of the District. Capital assets are reported less accumulated depreciation. "Net investment in capital assets" are capital assets less outstanding debt that was used to acquire those assets.
Earnhart Hill Regional Water and Sewer DistrictManagement’s Discussion and Analysis
For the Years Ended December 31, 2017 and 2016(Unaudited)
4
Table 1
2017 2016 Change % 2015 Change %
Current & Other Assets $4,454,274 $4,519,892 ($65,618) (1%) $4,093,919 $425,973 10%Capital Assets, Net 24,072,140 23,224,754 847,386 4% 23,366,185 (141,431) (1%)
Total Assets 28,526,414 27,744,646 781,768 3% 27,460,104 284,542 1%
Deferred Outflows 761,167 562,382 198,785 35% 150,501 411,881 274%
Current & Other Liabilities 444,768 438,578 6,190 1% 415,367 23,211 6%Long-Term Liabilities 9,651,278 9,362,594 288,684 3% 9,098,018 264,576 3%
Total Liabilities 10,096,046 9,801,172 294,874 3% 9,513,385 287,787 3%
Deferred Inflows 862,467 877,161 (14,694) (2%) 865,710 11,451 1%
Net PositionNet Investment in Capital Assets 16,790,644 15,732,984 1,057,660 7% 15,667,888 65,096 0%Restricted 305,298 305,298 0 0% 305,298 0 0%Unrestricted 1,233,126 1,590,413 (357,287) (22%) 1,258,324 332,089 26%
Total Net Position $18,329,068 $17,628,695 $700,373 4% $17,231,510 $397,185 2%
The District's total net position increased $700,373 or 4% in 2017 and $397,185 or 2% in 2016. These increaseswere a result of excess revenues over expenses. Restricted net position did not change in 2017 or 2016. Restricted net position is cash which is limited in use as part of the District's loan covenants. Net investment in capital assets increased by $1,057,660 or 7% in 2017 due primarily to additions of capital assets and repayments of debt principal that were only partially offset by depreciation expense and disposals. Net investment in capital assets increased by $65,096 or less than 1% in 2016 due primarily to additions of capital assets and repayments of debt principal that were only partially offset by depreciation expense and disposals. Unrestricted net position decreased $357,287 or 22% in 2017 due to an increase in net pension liability, which were only partially offset by an increase in deferred outflows of resources. Unrestricted net position decreased $332,089 or 26% in 2016 due to increases in cash balances and deferred outflows of resources, which were only partially offset by an increase in net pension liability.
Earnhart Hill Regional Water and Sewer DistrictManagement’s Discussion and Analysis
For the Years Ended December 31, 2017 and 2016(Unaudited)
5
Statement of Revenues, Expenses and Changes in Net Position
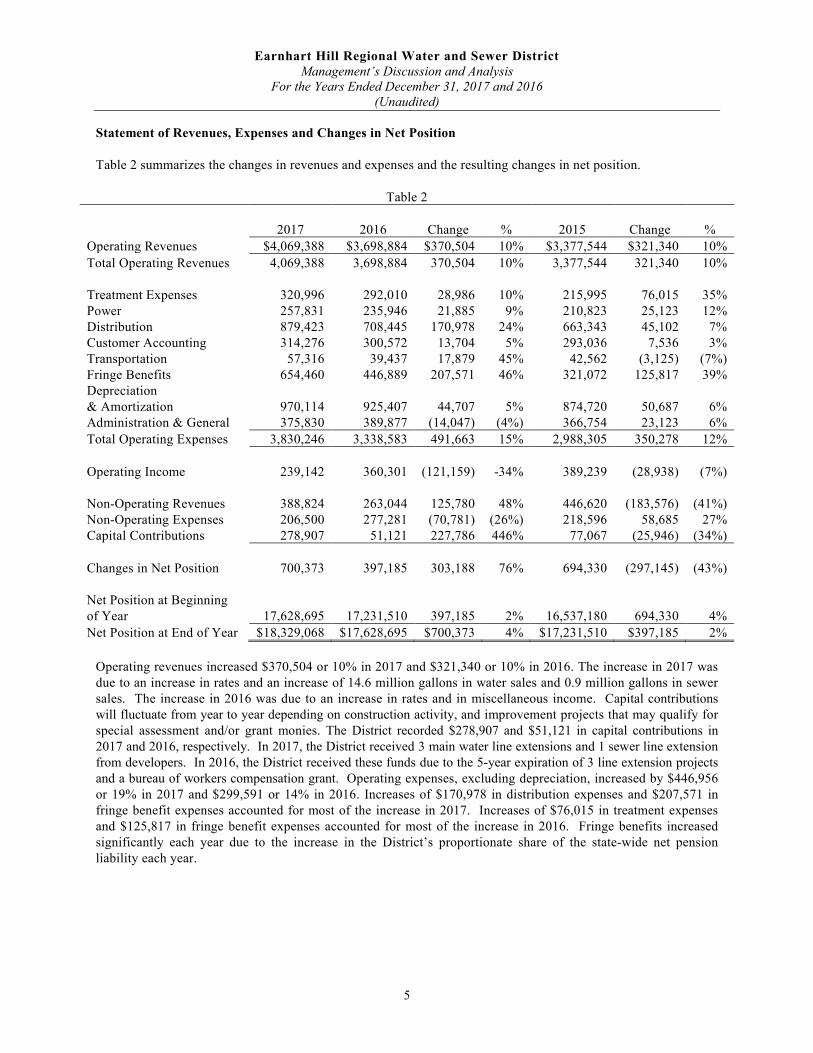
Table 2 summarizes the changes in revenues and expenses and the resulting changes in net position.
Table 2
2017 2016 Change % 2015 Change %
Operating Revenues $4,069,388 $3,698,884 $370,504 10% $3,377,544 $321,340 10%
Total Operating Revenues 4,069,388 3,698,884 370,504 10% 3,377,544 321,340 10%
Treatment Expenses 320,996 292,010 28,986 10% 215,995 76,015 35%Power 257,831 235,946 21,885 9% 210,823 25,123 12%Distribution 879,423 708,445 170,978 24% 663,343 45,102 7%Customer Accounting 314,276 300,572 13,704 5% 293,036 7,536 3%Transportation 57,316 39,437 17,879 45% 42,562 (3,125) (7%)Fringe Benefits 654,460 446,889 207,571 46% 321,072 125,817 39%Depreciation & Amortization 970,114 925,407 44,707 5% 874,720 50,687 6%Administration & General 375,830 389,877 (14,047) (4%) 366,754 23,123 6%
Total Operating Expenses 3,830,246 3,338,583 491,663 15% 2,988,305 350,278 12%
Operating Income 239,142 360,301 (121,159) -34% 389,239 (28,938) (7%)
Non-Operating Revenues 388,824 263,044 125,780 48% 446,620 (183,576) (41%)Non-Operating Expenses 206,500 277,281 (70,781) (26%) 218,596 58,685 27%Capital Contributions 278,907 51,121 227,786 446% 77,067 (25,946) (34%)
Changes in Net Position 700,373 397,185 303,188 76% 694,330 (297,145) (43%)
Net Position at Beginning of Year 17,628,695 17,231,510 397,185 2% 16,537,180 694,330 4%
Net Position at End of Year $18,329,068 $17,628,695 $700,373 4% $17,231,510 $397,185 2%
Operating revenues increased $370,504 or 10% in 2017 and $321,340 or 10% in 2016. The increase in 2017 was due to an increase in rates and an increase of 14.6 million gallons in water sales and 0.9 million gallons in sewer sales. The increase in 2016 was due to an increase in rates and in miscellaneous income. Capital contributions will fluctuate from year to year depending on construction activity, and improvement projects that may qualify for special assessment and/or grant monies. The District recorded $278,907 and $51,121 in capital contributions in 2017 and 2016, respectively. In 2017, the District received 3 main water line extensions and 1 sewer line extension from developers. In 2016, the District received these funds due to the 5-year expiration of 3 line extension projects and a bureau of workers compensation grant. Operating expenses, excluding depreciation, increased by $446,956or 19% in 2017 and $299,591 or 14% in 2016. Increases of $170,978 in distribution expenses and $207,571 in fringe benefit expenses accounted for most of the increase in 2017. Increases of $76,015 in treatment expensesand $125,817 in fringe benefit expenses accounted for most of the increase in 2016. Fringe benefits increased significantly each year due to the increase in the District’s proportionate share of the state-wide net pension liability each year.
Earnhart Hill Regional Water and Sewer DistrictManagement’s Discussion and Analysis
For the Years Ended December 31, 2017 and 2016(Unaudited)
6
Capital Assets
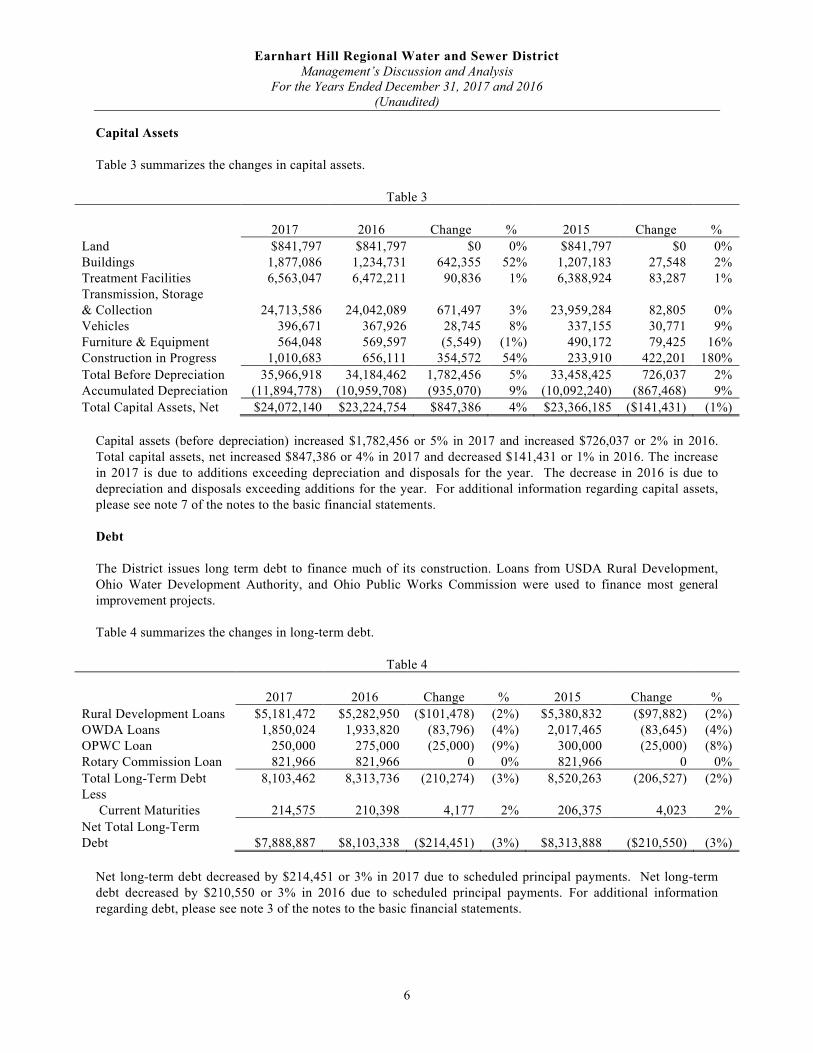
Table 3 summarizes the changes in capital assets.
Table 3
2017 2016 Change % 2015 Change %
Land $841,797 $841,797 $0 0% $841,797 $0 0%Buildings 1,877,086 1,234,731 642,355 52% 1,207,183 27,548 2%Treatment Facilities 6,563,047 6,472,211 90,836 1% 6,388,924 83,287 1%Transmission, Storage & Collection 24,713,586 24,042,089 671,497 3% 23,959,284 82,805 0%Vehicles 396,671 367,926 28,745 8% 337,155 30,771 9%Furniture & Equipment 564,048 569,597 (5,549) (1%) 490,172 79,425 16%Construction in Progress 1,010,683 656,111 354,572 54% 233,910 422,201 180%
Total Before Depreciation 35,966,918 34,184,462 1,782,456 5% 33,458,425 726,037 2%Accumulated Depreciation (11,894,778) (10,959,708) (935,070) 9% (10,092,240) (867,468) 9%
Total Capital Assets, Net $24,072,140 $23,224,754 $847,386 4% $23,366,185 ($141,431) (1%)
Capital assets (before depreciation) increased $1,782,456 or 5% in 2017 and increased $726,037 or 2% in 2016. Total capital assets, net increased $847,386 or 4% in 2017 and decreased $141,431 or 1% in 2016. The increase in 2017 is due to additions exceeding depreciation and disposals for the year. The decrease in 2016 is due to depreciation and disposals exceeding additions for the year. For additional information regarding capital assets, please see note 7 of the notes to the basic financial statements.
Debt
The District issues long term debt to finance much of its construction. Loans from USDA Rural Development, Ohio Water Development Authority, and Ohio Public Works Commission were used to finance most general improvement projects.
Table 4 summarizes the changes in long-term debt.
Table 4
2017 2016 Change % 2015 Change %
Rural Development Loans $5,181,472 $5,282,950 ($101,478) (2%) $5,380,832 ($97,882) (2%)OWDA Loans 1,850,024 1,933,820 (83,796) (4%) 2,017,465 (83,645) (4%)OPWC Loan 250,000 275,000 (25,000) (9%) 300,000 (25,000) (8%)Rotary Commission Loan 821,966 821,966 0 0% 821,966 0 0%
Total Long-Term Debt 8,103,462 8,313,736 (210,274) (3%) 8,520,263 (206,527) (2%)Less Current Maturities 214,575 210,398 4,177 2% 206,375 4,023 2%
Net Total Long-Term Debt $7,888,887 $8,103,338 ($214,451) (3%) $8,313,888 ($210,550) (3%)
Net long-term debt decreased by $214,451 or 3% in 2017 due to scheduled principal payments. Net long-term debt decreased by $210,550 or 3% in 2016 due to scheduled principal payments. For additional information regarding debt, please see note 3 of the notes to the basic financial statements.
Earnhart Hill Regional Water and Sewer DistrictManagement’s Discussion and Analysis
For the Years Ended December 31, 2017 and 2016(Unaudited)
7
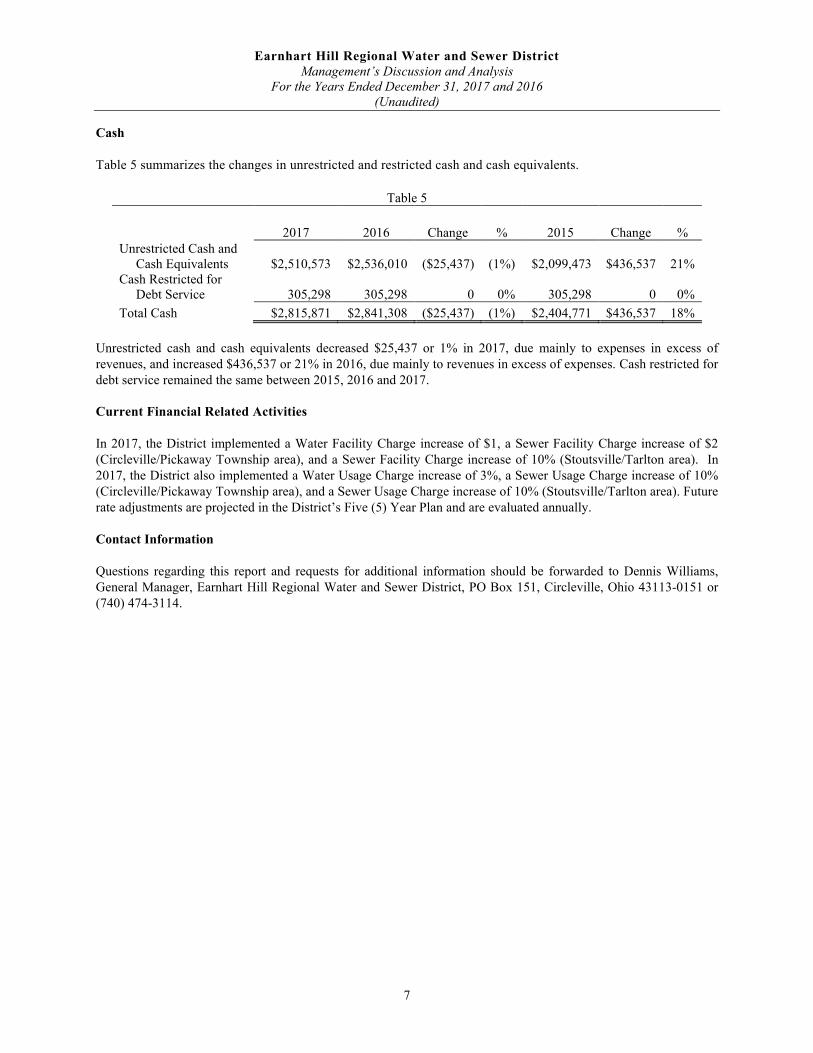
Cash
Table 5 summarizes the changes in unrestricted and restricted cash and cash equivalents.
Table 5
2017 2016 Change % 2015 Change %Unrestricted Cash and Cash Equivalents $2,510,573 $2,536,010 ($25,437) (1%) $2,099,473 $436,537 21%Cash Restricted for Debt Service 305,298 305,298 0 0% 305,298 0 0%
Total Cash $2,815,871 $2,841,308 ($25,437) (1%) $2,404,771 $436,537 18%
Unrestricted cash and cash equivalents decreased $25,437 or 1% in 2017, due mainly to expenses in excess of revenues, and increased $436,537 or 21% in 2016, due mainly to revenues in excess of expenses. Cash restricted for debt service remained the same between 2015, 2016 and 2017.
Current Financial Related Activities
In 2017, the District implemented a Water Facility Charge increase of $1, a Sewer Facility Charge increase of $2(Circleville/Pickaway Township area), and a Sewer Facility Charge increase of 10% (Stoutsville/Tarlton area). In 2017, the District also implemented a Water Usage Charge increase of 3%, a Sewer Usage Charge increase of 10% (Circleville/Pickaway Township area), and a Sewer Usage Charge increase of 10% (Stoutsville/Tarlton area). Future rate adjustments are projected in the District’s Five (5) Year Plan and are evaluated annually.
Contact Information
Questions regarding this report and requests for additional information should be forwarded to Dennis Williams, General Manager, Earnhart Hill Regional Water and Sewer District, PO Box 151, Circleville, Ohio 43113-0151 or (740) 474-3114.
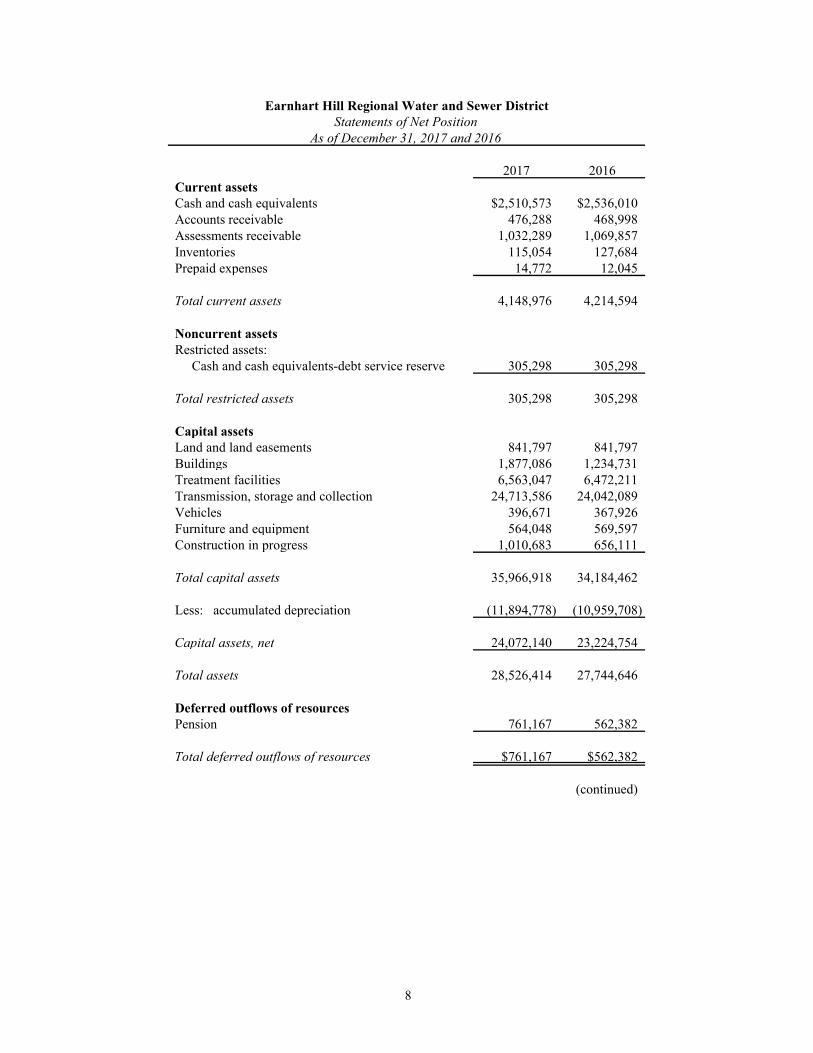
2017 2016Current assetsCash and cash equivalents $2,510,573 $2,536,010Accounts receivable 476,288 468,998Assessments receivable 1,032,289 1,069,857Inventories 115,054 127,684Prepaid expenses 14,772 12,045
Total current assets 4,148,976 4,214,594
Noncurrent assetsRestricted assets: Cash and cash equivalents-debt service reserve 305,298 305,298
Total restricted assets 305,298 305,298
Capital assetsLand and land easements 841,797 841,797Buildings 1,877,086 1,234,731Treatment facilities 6,563,047 6,472,211Transmission, storage and collection 24,713,586 24,042,089Vehicles 396,671 367,926Furniture and equipment 564,048 569,597Construction in progress 1,010,683 656,111
Total capital assets 35,966,918 34,184,462
Less: accumulated depreciation (11,894,778) (10,959,708)
Capital assets, net 24,072,140 23,224,754
Total assets 28,526,414 27,744,646
Deferred outflows of resourcesPension 761,167 562,382
Total deferred outflows of resources $761,167 $562,382
(continued)
Earnhart Hill Regional Water and Sewer DistrictStatements of Net Position
As of December 31, 2017 and 2016
8
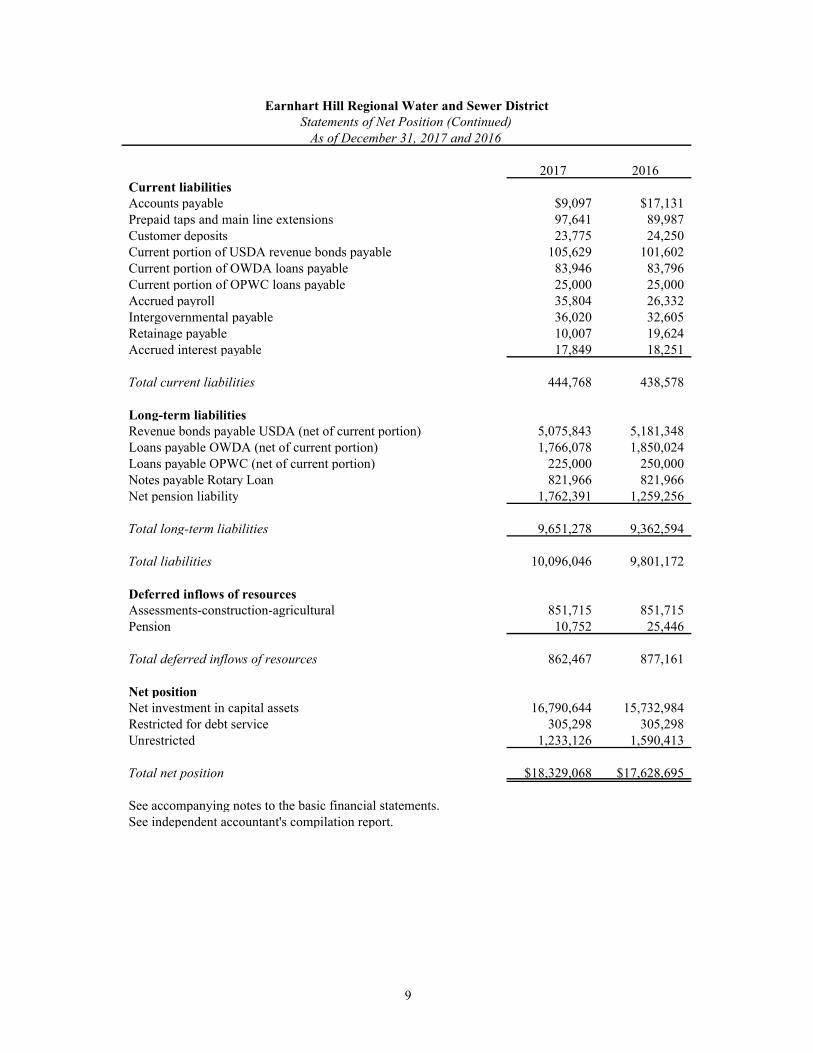
2017 2016Current liabilitiesAccounts payable $9,097 $17,131Prepaid taps and main line extensions 97,641 89,987Customer deposits 23,775 24,250Current portion of USDA revenue bonds payable 105,629 101,602Current portion of OWDA loans payable 83,946 83,796Current portion of OPWC loans payable 25,000 25,000Accrued payroll 35,804 26,332Intergovernmental payable 36,020 32,605Retainage payable 10,007 19,624Accrued interest payable 17,849 18,251
Total current liabilities 444,768 438,578
Long-term liabilitiesRevenue bonds payable USDA (net of current portion) 5,075,843 5,181,348Loans payable OWDA (net of current portion) 1,766,078 1,850,024Loans payable OPWC (net of current portion) 225,000 250,000Notes payable Rotary Loan 821,966 821,966Net pension liability 1,762,391 1,259,256
Total long-term liabilities 9,651,278 9,362,594
Total liabilities 10,096,046 9,801,172
Deferred inflows of resourcesAssessments-construction-agricultural 851,715 851,715Pension 10,752 25,446
Total deferred inflows of resources 862,467 877,161
Net positionNet investment in capital assets 16,790,644 15,732,984Restricted for debt service 305,298 305,298Unrestricted 1,233,126 1,590,413
Total net position $18,329,068 $17,628,695
See accompanying notes to the basic financial statements.See independent accountant's compilation report.
Earnhart Hill Regional Water and Sewer DistrictStatements of Net Position (Continued)
As of December 31, 2017 and 2016
9

2017 2016Operating revenuesService charges $3,929,807 $3,589,254
Other 139,581 109,630
Total operating revenues 4,069,388 3,698,884
Operating expensesTreatment expense 320,996 292,010
Power 257,831 235,946
Distribution 879,423 708,445
Customer accounting 314,276 300,572
Transportation 57,316 39,437
Fringe benefits 654,460 446,889
Depreciation and amortization 970,114 925,407
Administrative and general 375,830 389,877
Total operating expenses 3,830,246 3,338,583
Operating income 239,142 360,301
Nonoperating revenues (expenses)Capacity charges 292,200 160,150
Tap fee revenue 48,211 41,200
Interest income 27,869 29,030
Gain on sale of assets 77 10,075
Interest expense (206,500) (210,539)
Loss on disposal of assets 0 (66,742)
Rental income 20,467 22,589
Net nonoperating revenues (expenses) 182,324 (14,237)
Changes in net position before capital contributions 421,466 346,064
Capital Contributions-intergovernmental 0 40,000
Capital contributions-cash 0 11,121
Capital Contributions - developer 278,907 0
Total capital contributions 278,907 51,121
Changes in net position 700,373 397,185
Net position, beginning of year 17,628,695 17,231,510
Net position, end of year $18,329,068 $17,628,695
See accompanying notes to the basic financial statements.See independent accountant's compilation report.
Earnhart Hill Regional Water and Sewer DistrictStatements of Revenues, Expenses and Changes in Net Position
For the Years Ended December 31, 2017 and 2016
10

2017 2016Cash flows from operating activitiesCash received from customers $3,922,517 $3,563,916Cash paid for employee salaries and benefits (1,163,320) (1,296,074)Cash payments to suppliers for goods and services (1,392,400) (1,025,662)Cash received from other receipts 139,581 109,630
Net cash provided by operating activities 1,506,378 1,351,810
Cash flows from noncapital and related financial activitiesRefundable line extensions 7,654 (14,621)Deposits received (returned) (475) (325)
Net cash provided by (used for) noncapital and related financing activities 7,179 (14,946)
Cash flows from capital and related financing activitiesTap fees 48,211 41,200Capacity charges 292,200 160,150Rental income 20,467 22,589Revenue bond principal payments (101,478) (97,882)Revenue bond interest payments (203,075) (206,953)Loan principal payments (108,796) (108,645)Loan interest payments (3,827) (3,976)Special assessments received 37,568 34,057Special assessment interest 14,241 16,701Cash received for sale of assets 77 10,075Proceeds from capital cash contributions 278,907 51,121Capital outlay (1,827,118) (831,093)
Net cash used for capital and related financing activities (1,552,623) (912,656)
Cash flows from investing activitiesInterest on cash and cash equivalents 13,628 12,329
Net increase (decrease) in cash and cash equivalents (25,438) 436,537
Cash and cash equivalents, beginning of year 2,841,308 2,404,771
Cash and cash equivalents, end of year $2,815,870 $2,841,308
Non-Cash Transactions:As of December 31, 2017, the District had retainage payable of $10,007 relating to a capitalized asset.As of December 31, 2016, the District had retainage payable of $19,624 relating to a capitalized asset.
(continued)
Earnhart Hill Regional Water and Sewer DistrictStatements of Cash Flows
For the Years Ended December 31, 2017 and 2016
11

2017 2016Reconciliation of operating income to net cash providedby operating activities:
Operating income $239,142 $360,301
Adjustments to reconcile operating income tonet cash provided by operating activities:
Depreciation and amortization 970,114 925,407
Changes in assets and liabilities:Decrease (increase) in accounts receivable (7,290) (25,338)Decrease (increase) in inventories 12,630 91Decrease (increase) in prepaid expenses (2,727) 1,754Increase (decrease) in accounts payable (trade only) (8,034) (24,119)Increase (decrease) in accrued payroll 9,472 6,413Increase (decrease) in intergovernmental payable 3,415 32,605(Increase) decrease in deferred outflows of resources-pension (198,785) (411,881)Increase (decrease) in deferred inflows of resources-pension (14,694) 11,451Increase (decrease) in net pension liability 503,135 475,126
Total adjustments 1,267,236 991,509
Net cash provided by operating activities $1,506,378 $1,351,810
See accompanying notes to the basic financial statements.See independent accountant's compilation report.
Earnhart Hill Regional Water and Sewer DistrictStatements of Cash Flows (Continued)
For the Years Ended December 31, 2017 and 2016
12
Earnhart Hill Regional Water and Sewer DistrictNotes to the Basic Financial Statements
For the Years Ended December 31, 2017 and 2016
13
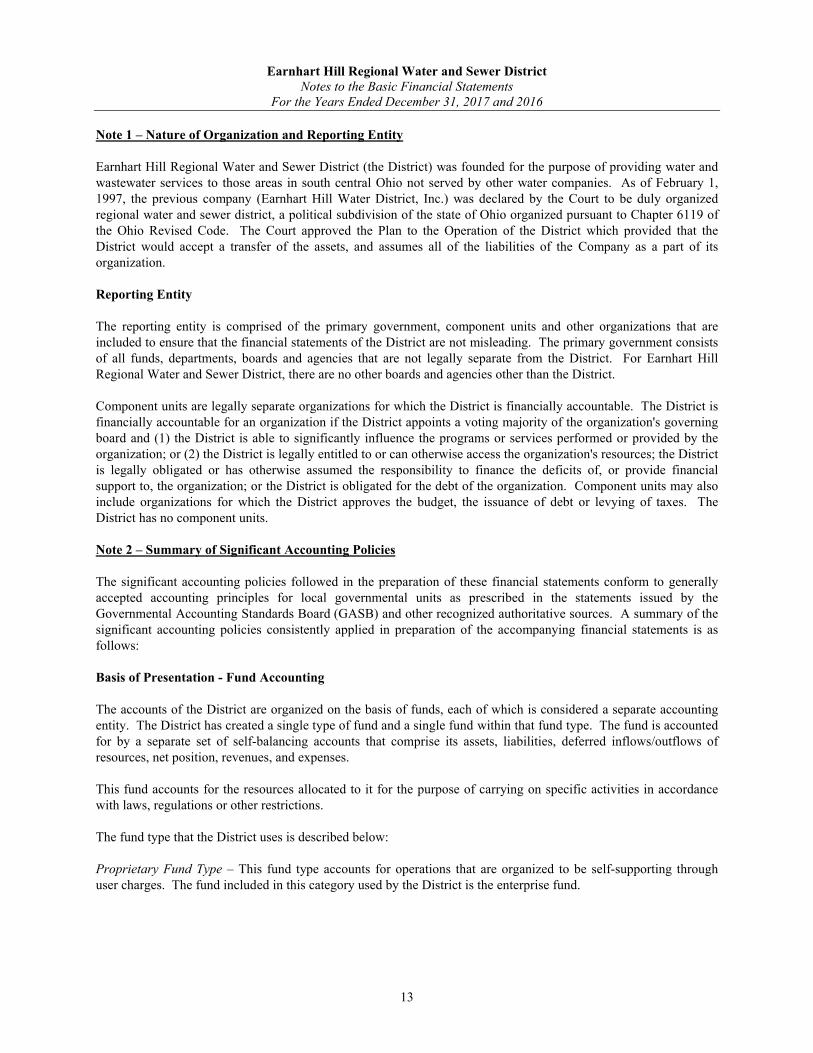
Note 1 – Nature of Organization and Reporting Entity
Earnhart Hill Regional Water and Sewer District (the District) was founded for the purpose of providing water and wastewater services to those areas in south central Ohio not served by other water companies. As of February 1, 1997, the previous company (Earnhart Hill Water District, Inc.) was declared by the Court to be duly organized regional water and sewer district, a political subdivision of the state of Ohio organized pursuant to Chapter 6119 of the Ohio Revised Code. The Court approved the Plan to the Operation of the District which provided that the District would accept a transfer of the assets, and assumes all of the liabilities of the Company as a part of its organization.
Reporting Entity
The reporting entity is comprised of the primary government, component units and other organizations that are included to ensure that the financial statements of the District are not misleading. The primary government consists of all funds, departments, boards and agencies that are not legally separate from the District. For Earnhart Hill Regional Water and Sewer District, there are no other boards and agencies other than the District.
Component units are legally separate organizations for which the District is financially accountable. The District is financially accountable for an organization if the District appoints a voting majority of the organization's governing board and (1) the District is able to significantly influence the programs or services performed or provided by the organization; or (2) the District is legally entitled to or can otherwise access the organization's resources; the District is legally obligated or has otherwise assumed the responsibility to finance the deficits of, or provide financial support to, the organization; or the District is obligated for the debt of the organization. Component units may also include organizations for which the District approves the budget, the issuance of debt or levying of taxes. The District has no component units.
Note 2 – Summary of Significant Accounting Policies
The significant accounting policies followed in the preparation of these financial statements conform to generally accepted accounting principles for local governmental units as prescribed in the statements issued by the Governmental Accounting Standards Board (GASB) and other recognized authoritative sources. A summary of the significant accounting policies consistently applied in preparation of the accompanying financial statements is as follows:
Basis of Presentation - Fund Accounting
The accounts of the District are organized on the basis of funds, each of which is considered a separate accounting entity. The District has created a single type of fund and a single fund within that fund type. The fund is accounted for by a separate set of self-balancing accounts that comprise its assets, liabilities, deferred inflows/outflows of resources, net position, revenues, and expenses.
This fund accounts for the resources allocated to it for the purpose of carrying on specific activities in accordance with laws, regulations or other restrictions.
The fund type that the District uses is described below:
Proprietary Fund Type – This fund type accounts for operations that are organized to be self-supporting through user charges. The fund included in this category used by the District is the enterprise fund.
Earnhart Hill Regional Water and Sewer DistrictNotes to the Basic Financial Statements
For the Years Ended December 31, 2017 and 2016
14
Enterprise Fund – This fund is established to account for operations that are financed and operated in a manner similar to private business enterprises where the intent is that costs of providing goods or services to the general public on a continuing basis be financed or recovered primarily through user charges. The District’s enterprise fund provides water and sewer services to its users.
Basis of Accounting
The accounting records are maintained on the accrual basis of accounting for financial reporting purposes.
Process
The Ohio Revised Code requires that each fund be budgeted annually. The District adopted budgets and adopted and passed annual appropriations for the years ended December 31, 2017 and 2016.
Appropriations – Budgetary expenditures (that is, disbursements and encumbrances) may not exceed appropriations at the legal level of control, and appropriations may not exceed estimated resources. For the District, the legal level of control is at the object level. The District must annually approve appropriation measures and subsequent amendments. Unencumbered appropriations lapse at year-end.
Estimated Resources – Estimated resources include estimates of cash to be received (budgeted receipts) plus unencumbered cash as of January 1.
Encumbrances – The Ohio Revised Code requires the District to reserve (encumber) appropriations when commitments are made.
Revenue Recognition
Revenues for service fees are recorded in the period the service is provided. Revenue for tap fees are recorded when the taps have been installed and the customer is using the service. All other revenue is recognized when earned.
Accounts Receivable
Accounts receivable are presented at their net realizable value. Uncollectible account balances are certified to the County Auditor after administrative collection efforts have been exhausted.
Restricted Assets
As explained in Note 3, a restricted account was established for the required reserve for the Rural Development Loans and is recorded as a restricted asset in the accompanying basic financial statements.
Capital Assets
Capital assets are presented at cost or estimated historical cost. Contributed capital assets are recorded at their acquisition value as of the date received. These assets are depreciated over the following estimated useful lives:
Buildings 15-30 yearsTreatment Facilities 5-50 yearsTransmission & Collections 10-50 yearsVehicles 3-10 yearsFurniture & Equipment 3-20 years
Earnhart Hill Regional Water and Sewer DistrictNotes to the Basic Financial Statements
For the Years Ended December 31, 2017 and 2016
15
Depreciation is computed using the straight-line method for financial reporting purposes. Repairs and maintenance costs are charged to operations when incurred. Improvements and additions over $5,000 are capitalized.
Cash and Cash Equivalents
For purposes of the statement of cash flows, the District does not have any investments; therefore, all cash balances are included in the statement of cash flows.
Interest Expense
Interest expense represents the interest portion of loan payments to the United States Department of Agriculture, Rural Development, and the Ohio Water Development Authority.
Interest Income
Interest income represents earnings from all of the District’s bank accounts and interest earned on assessments.
Inventory of Supplies
Inventories are stated at the lower of cost or market. Cost is determined on a first-in, first-out basis. The costs of inventory items are recorded as expenses when used.
Prepaid Expenses
Payments made to vendors for services that will benefit periods beyond December 31, 2017 and 2016 are recorded as prepaid items by using the consumption method. A current asset for the prepaid amount is recorded at the time of the purchase and an expense is reported in the year in which services are consumed.
Compensated Absences
Vacation benefits are accrued as a liability as the benefits are earned if the employees' rights to receive compensation are attributable to services already rendered and it is probable that the employer will compensate the employees for the benefits through paid time off or some other means. The amount of vacation leave liability was insignificant as of December 31, 2017 and 2016 and is not recorded in the accompanying basic financial statements. Sick leave benefits are not accrued as a liability as employees receive no payment for accrued sick leave upon termination or retirement.
Intergovernmental Payable
The District bills and collects sewer fees and penalties for the City of Circleville Sewer and Pickaway County Sewer. Intergovernmental payable represents those amounts collected on behalf of those districts but not yet paid as of December 31, 2017 and 2016.
Earnhart Hill Regional Water and Sewer DistrictNotes to the Basic Financial Statements
For the Years Ended December 31, 2017 and 2016
16
Net Position
Net position represents the difference between assets plus deferred outflows of resources and liabilities plus deferred inflows of resources. Net investment in capital assets consists of capital assets, net of accumulated depreciation, reduced by the outstanding balances of any borrowings used for the acquisition, construction or improvements of those assets. Net position is reported as restricted for debt service reserves as required by the Rural Development Loan requirements. The District applies restricted resources when an expense is incurred for purposes for which both restricted and unrestricted net position is available. None of the District’s restricted net position as of December 31, 2017 and 2016 was restricted by enabling legislation.
Operating Revenues and Expenses
Operating revenues are those revenues that are generated directly from the primary activity of the proprietary funds. For the District, these revenues are fees and contract fee revenue for water and sewer services provided. Operating expenses are necessary costs incurred to provide the goods and/or services that are the primary activity of the fund. All revenues and expenses not meeting these definitions are recorded as non-operating revenues and expenses.
Capital Contributions
The District records capital contributions of capital assets or grants and other outside contributions restricted to capital acquisition and construction. During 2017 and 2016, the following capital contributions were received:
2017 2016Ohio Bureau of Workers Compensation Grant $0 $40,000Kingston Pike Line Extension 0 5,846State Route 159 Line Extension 0 2,336Morris Leist Road Line Extension 0 2,939OCU Developer Line Extension 97,652 0Loves Truck Stop Improvements 125,000 0Kingston Mounds III Water Line Extensions 33,950 0Kingston Mounds III Gravity Sewer 22,305 0 Totals $278,907 $51,121
Deferred Inflows and Outflows of Resources
In addition to assets, the statement of net position will sometimes report a separate section for deferred outflows of resources. This separate financial statement element represents a consumption of net position that applies to a future period(s) and so will not be recognized as an outflow of resources (expense) until then. The District has deferred outflows of resources related to pensions, which is further discussed in note 8.
In addition to liabilities, the statement of net position will sometimes report a separate section for deferred inflows of resources. This separate financial statement element represents an acquisition of net position that applies to a future period(s) and so will not be recognized as an inflow of resources (revenue) until that time. The District has deferred inflows of resources related to special assessments and pensions. The $851,715 balance of the deferred inflow of resources for assessments at December 31, 2017 and 2016 will be recognized as revenue and increase unrestricted net position only when those properties assessed no longer qualify for agricultural status, as defined in Ohio Revised Code Chapter 929, and as certified by the County Auditor. The time frame for collection is therefore undeterminable. Deferred inflows related to pensions will be further discussed in note 8.
Earnhart Hill Regional Water and Sewer DistrictNotes to the Basic Financial Statements
For the Years Ended December 31, 2017 and 2016
17
Pensions
For purposes of measuring the net pension liability, deferred outflows of resources and deferred inflows of resources related to pensions, and pension expense, information about the fiduciary net position of the pension plans and additions to/deductions from their fiduciary net position have been determined on the same basis as they are reported by the pension systems. For this purpose, benefit payments (including refunds of employee contributions) are recognized when due and payable in accordance with the benefit terms. The pension systems report investments at fair value.
Comparative Information
Comparative data for the prior year has been presented in the basic financial statements in order to provide an understanding of the changes in the District’s financial position and operations. Such information includes sufficient detail to constitute a presentation in conformity with GAAP. Accordingly, such information should be read in conjunction with the District’s basic financial statements for the year ended December 31, 2016, from which the comparative data was derived.
Estimates
The preparation of financial statements in conformity with generally accepted accounting principles requires management to make estimates and assumptions that affect the amounts reported in the financial statements and accompanying notes. Actual results may differ from those estimates.
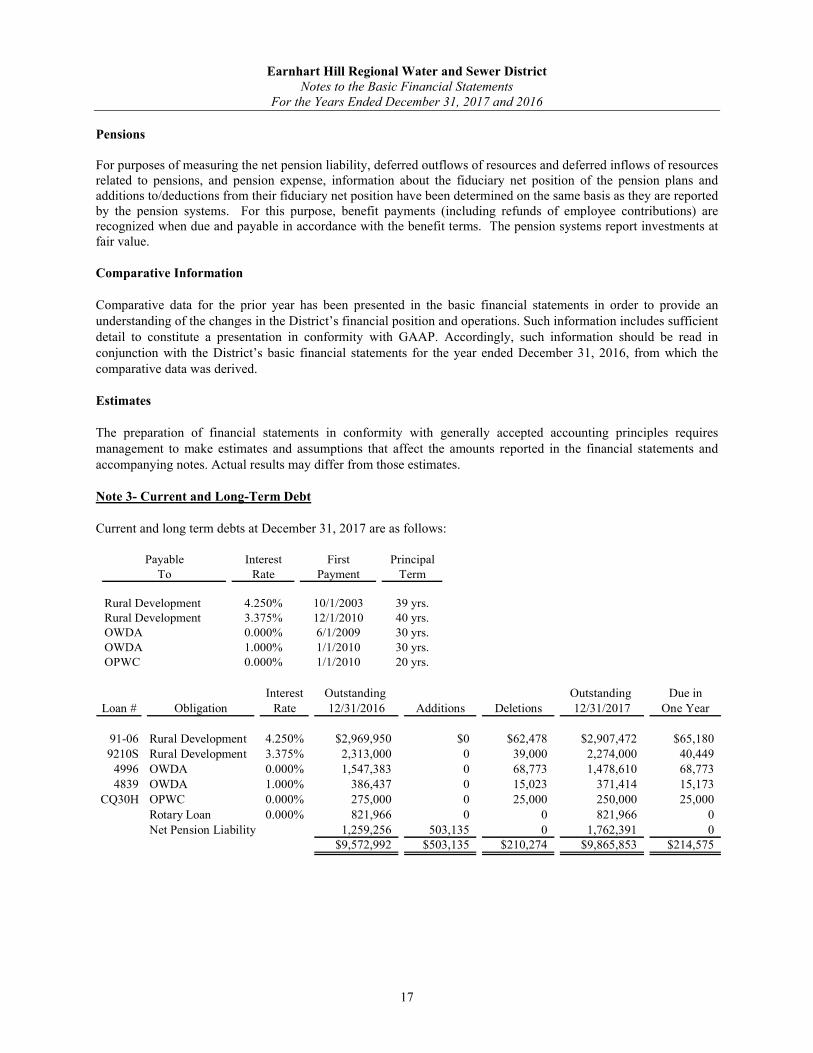
Note 3- Current and Long-Term Debt
Current and long term debts at December 31, 2017 are as follows:
Payable Interest First PrincipalTo Rate Payment Term
Rural Development 4.250% 10/1/2003 39 yrs.Rural Development 3.375% 12/1/2010 40 yrs.OWDA 0.000% 6/1/2009 30 yrs.OWDA 1.000% 1/1/2010 30 yrs.OPWC 0.000% 1/1/2010 20 yrs.
Interest Outstanding Outstanding Due inLoan # Obligation Rate 12/31/2016 Additions Deletions 12/31/2017 One Year
91-06 Rural Development 4.250% $2,969,950 $0 $62,478 $2,907,472 $65,1809210S Rural Development 3.375% 2,313,000 0 39,000 2,274,000 40,449
4996 OWDA 0.000% 1,547,383 0 68,773 1,478,610 68,7734839 OWDA 1.000% 386,437 0 15,023 371,414 15,173
CQ30H OPWC 0.000% 275,000 0 25,000 250,000 25,000Rotary Loan 0.000% 821,966 0 0 821,966 0Net Pension Liability 1,259,256 503,135 0 1,762,391 0
$9,572,992 $503,135 $210,274 $9,865,853 $214,575
Earnhart Hill Regional Water and Sewer DistrictNotes to the Basic Financial Statements
For the Years Ended December 31, 2017 and 2016
18
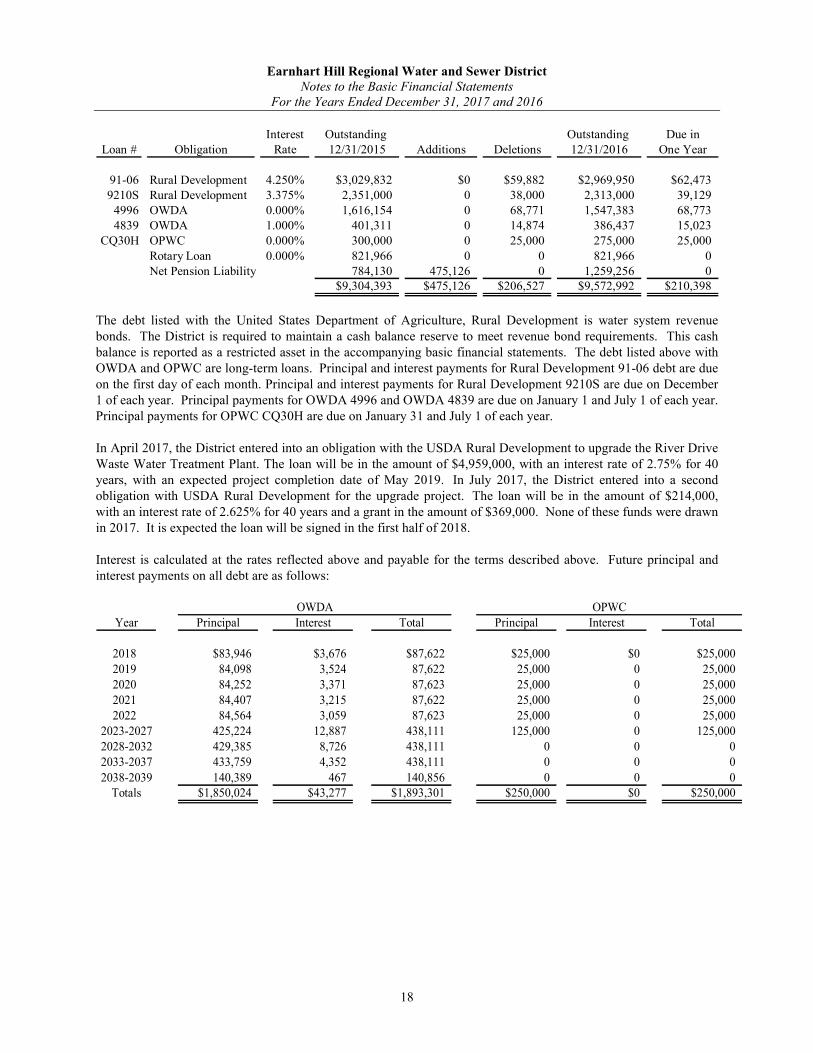
Interest Outstanding Outstanding Due inLoan # Obligation Rate 12/31/2015 Additions Deletions 12/31/2016 One Year
91-06 Rural Development 4.250% $3,029,832 $0 $59,882 $2,969,950 $62,4739210S Rural Development 3.375% 2,351,000 0 38,000 2,313,000 39,129
4996 OWDA 0.000% 1,616,154 0 68,771 1,547,383 68,7734839 OWDA 1.000% 401,311 0 14,874 386,437 15,023
CQ30H OPWC 0.000% 300,000 0 25,000 275,000 25,000Rotary Loan 0.000% 821,966 0 0 821,966 0Net Pension Liability 784,130 475,126 0 1,259,256 0
$9,304,393 $475,126 $206,527 $9,572,992 $210,398
The debt listed with the United States Department of Agriculture, Rural Development is water system revenue bonds. The District is required to maintain a cash balance reserve to meet revenue bond requirements. This cash balance is reported as a restricted asset in the accompanying basic financial statements. The debt listed above with OWDA and OPWC are long-term loans. Principal and interest payments for Rural Development 91-06 debt are due on the first day of each month. Principal and interest payments for Rural Development 9210S are due on December 1 of each year. Principal payments for OWDA 4996 and OWDA 4839 are due on January 1 and July 1 of each year. Principal payments for OPWC CQ30H are due on January 31 and July 1 of each year.
In April 2017, the District entered into an obligation with the USDA Rural Development to upgrade the River Drive Waste Water Treatment Plant. The loan will be in the amount of $4,959,000, with an interest rate of 2.75% for 40 years, with an expected project completion date of May 2019. In July 2017, the District entered into a second obligation with USDA Rural Development for the upgrade project. The loan will be in the amount of $214,000, with an interest rate of 2.625% for 40 years and a grant in the amount of $369,000. None of these funds were drawn in 2017. It is expected the loan will be signed in the first half of 2018.
Interest is calculated at the rates reflected above and payable for the terms described above. Future principal andinterest payments on all debt are as follows:
Year Principal Interest Total Principal Interest Total
2018 $83,946 $3,676 $87,622 $25,000 $0 $25,0002019 84,098 3,524 87,622 25,000 0 25,0002020 84,252 3,371 87,623 25,000 0 25,0002021 84,407 3,215 87,622 25,000 0 25,0002022 84,564 3,059 87,623 25,000 0 25,000
2023-2027 425,224 12,887 438,111 125,000 0 125,0002028-2032 429,385 8,726 438,111 0 0 02033-2037 433,759 4,352 438,111 0 0 02038-2039 140,389 467 140,856 0 0 0
Totals $1,850,024 $43,277 $1,893,301 $250,000 $0 $250,000
OWDA OPWC
Earnhart Hill Regional Water and Sewer DistrictNotes to the Basic Financial Statements
For the Years Ended December 31, 2017 and 2016
19
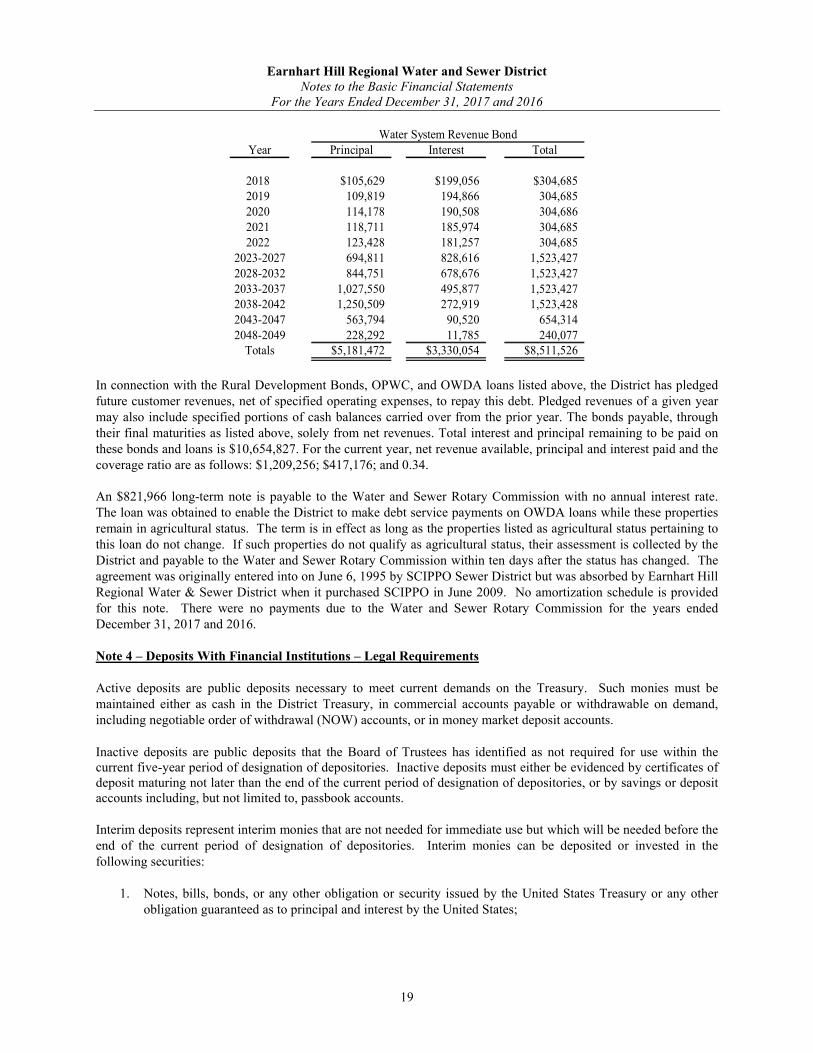
Year Principal Interest Total
2018 $105,629 $199,056 $304,6852019 109,819 194,866 304,6852020 114,178 190,508 304,6862021 118,711 185,974 304,6852022 123,428 181,257 304,685
2023-2027 694,811 828,616 1,523,4272028-2032 844,751 678,676 1,523,4272033-2037 1,027,550 495,877 1,523,4272038-2042 1,250,509 272,919 1,523,4282043-2047 563,794 90,520 654,3142048-2049 228,292 11,785 240,077
Totals $5,181,472 $3,330,054 $8,511,526
Water System Revenue Bond
In connection with the Rural Development Bonds, OPWC, and OWDA loans listed above, the District has pledgedfuture customer revenues, net of specified operating expenses, to repay this debt. Pledged revenues of a given year may also include specified portions of cash balances carried over from the prior year. The bonds payable, through their final maturities as listed above, solely from net revenues. Total interest and principal remaining to be paid on these bonds and loans is $10,654,827. For the current year, net revenue available, principal and interest paid and the coverage ratio are as follows: $1,209,256; $417,176; and 0.34.
An $821,966 long-term note is payable to the Water and Sewer Rotary Commission with no annual interest rate. The loan was obtained to enable the District to make debt service payments on OWDA loans while these properties remain in agricultural status. The term is in effect as long as the properties listed as agricultural status pertaining to this loan do not change. If such properties do not qualify as agricultural status, their assessment is collected by the District and payable to the Water and Sewer Rotary Commission within ten days after the status has changed. The agreement was originally entered into on June 6, 1995 by SCIPPO Sewer District but was absorbed by Earnhart Hill Regional Water & Sewer District when it purchased SCIPPO in June 2009. No amortization schedule is provided for this note. There were no payments due to the Water and Sewer Rotary Commission for the years ended December 31, 2017 and 2016.
Note 4 – Deposits With Financial Institutions – Legal Requirements
Active deposits are public deposits necessary to meet current demands on the Treasury. Such monies must be maintained either as cash in the District Treasury, in commercial accounts payable or withdrawable on demand, including negotiable order of withdrawal (NOW) accounts, or in money market deposit accounts.
Inactive deposits are public deposits that the Board of Trustees has identified as not required for use within the current five-year period of designation of depositories. Inactive deposits must either be evidenced by certificates of deposit maturing not later than the end of the current period of designation of depositories, or by savings or deposit accounts including, but not limited to, passbook accounts.
Interim deposits represent interim monies that are not needed for immediate use but which will be needed before the end of the current period of designation of depositories. Interim monies can be deposited or invested in the following securities:
1. Notes, bills, bonds, or any other obligation or security issued by the United States Treasury or any other obligation guaranteed as to principal and interest by the United States;
Earnhart Hill Regional Water and Sewer DistrictNotes to the Basic Financial Statements
For the Years Ended December 31, 2017 and 2016
20
2. Bonds, notes, debentures, or any other obligations or securities issued by any federal government agency or instrumentality, including but not limited to, the Federal National Mortgage Association, Federal Home Loan Bank, Federal Farm Credit Bank, Federal Home Loan Mortgage Corporation, Government National Mortgage Association, and Student Loan Marketing Association. All federal agency securities shall be direct issuances of federal government agencies or instrumentalities;
3. Written repurchase agreements in the securities listed above, provided that the market value of the securities subject to the repurchase agreement must exceed the principal value of the agreement by at least two percent and be marked to market daily, and that the term of the agreement must not exceed thirty days;
4. Bonds and other obligations of the State of Ohio; its political subdivisions, or other units or agencies of this State or its political subdivisions;
5. Time certificates of deposit or savings or deposit accounts, including, but not limited to, passbook accounts;
6. No-load money market mutual funds consisting exclusively of obligations described in divisions (1) and (2) of this footnote and repurchase agreements secured by such obligations, provided that investments in securities described in this division are made only through eligible institutions;
7. The State Treasurer’s investment pool (STAR Ohio);8. Securities lending agreements in which the District lends securities and the eligible institution agrees to
exchange either securities described in division (1) or (2), or cash, or both securities and cash, equal value for equal value;
9. High grade commercial paper in an amount not to exceed five percent of the District’s total average portfolio; and
10. Banker’s acceptances for a period not to exceed 270 days and in an amount not to exceed ten percent of the District’s average portfolio.
Protection of the District’s deposits is provided by the Federal Deposit Insurance Corporation (FDIC), by eligible securities pledged by the financial institution as security for repayment, by surety company bonds deposited with the Treasurer by the financial institution, or by a single collateral pool established by the financial institution to secure the repayment of all public monies deposited with the institution.
Investments in stripped principal or interest obligations, reverse repurchase agreements, and derivatives are prohibited. The issuance of taxable notes for the purpose of arbitrage, the use of leverage, and short selling are also prohibited. An investment must mature within five years from the date of purchase unless matched to a specific obligation or debt of the District, and must be purchased with the expectation that it will be held to maturity.
Investments may only be made through specified dealers and institutions. Payment for investments may be made only upon delivery of the securities representing the investments to the Treasurer or, if the securities are not represented by a certificate, upon receipt of confirmation of transfer from the custodian.
Deposits – Custodial credit risk for deposits is the risk that in the event of bank failure, the District will not be able to recover deposits or collateral securities that are in the possession of an outside party. As of December 31, 2017and 2016, $250,000 and $250,000 of the District’s bank balances of $3,109,170 and $2,871,482 were covered by federal depository insurance. The remaining balances were covered by specific securities held by the pledging financial institution’s trust department in the District’s name and therefore, not subject to custodial credit risk. Although all State statutory requirements for the deposit of money have been followed, non-compliance with federal requirements could potentially subject the District to a successful claim by the FDIC.
The District has no deposit policy for custodial risk beyond the requirements of State statute. Ohio law requires that deposits be either insured or be protected by eligible securities pledged to and deposited either with the District or a qualified trustee by the financial institution as security for repayment, or by a collateral pool of eligible securities deposited with a qualified trustee and pledged to secure the repayment of all public monies deposited in the financial institution whose market value at all times shall be at least one hundred five percent of the deposits being secured.

Earnhart Hill Regional Water and Sewer DistrictNotes to the Basic Financial Statements
For the Years Ended December 31, 2017 and 2016
21
Note 5 – Accounts Receivable
The following are accounts receivable balances presented by aging classifications as of December 31, 2017 and 2016:
2017 2016
Current receivables (0-30 days) $346,063 $317,471Delinquent receivables (31-60 days) 29,827 44,424Delinquent receivables (over 60 days) 37,705 39,452
Total accounts receivable $413,595 $401,347
As of December 31, 2017 and 2016, the District also had miscellaneous receivables totaling $62,693 and $67,651, respectively.
Note 6 – Risk Management
The District is exposed to various risks of loss related to torts; theft of, damage to, or destruction of assets; errors and omissions; injuries to employees; and natural disasters. During 2017 and 2016, the District contracted with Rinehart, Walters, Danner Insurance and the Ohio Plan for liability, property, and related insurance. Coverages provided by the program as of December 31 are as follows:
2017 2016
General Liability $5,000,000 per occurrence $5,000,000 per occurrence$7,000,000 aggregate $7,000,000 aggregate
Public Officials Liability $5,000,000 per occurrence $5,000,000 per occurrence$7,000,000 aggregate $7,000,000 aggregate
Automobile Liability $5,000,000 $5,000,000Property, Boiler & Machinery $13,121,020 $12,277,110Inland Marine $375,354 $309,601Electronic Media $161,727 $159,337Faithful Performance & Employee Bond $425,000 $425,000
There has been no significant reduction in coverage from the prior year. There have been no claims that exceed commercial insurance coverage during the past three years.
Medical Mutual of Ohio provided health insurance during 2017 and 2016. Workers' compensation benefits are provided through the State Bureau of Workers' Compensation.
Earnhart Hill Regional Water and Sewer DistrictNotes to the Basic Financial Statements
For the Years Ended December 31, 2017 and 2016
22
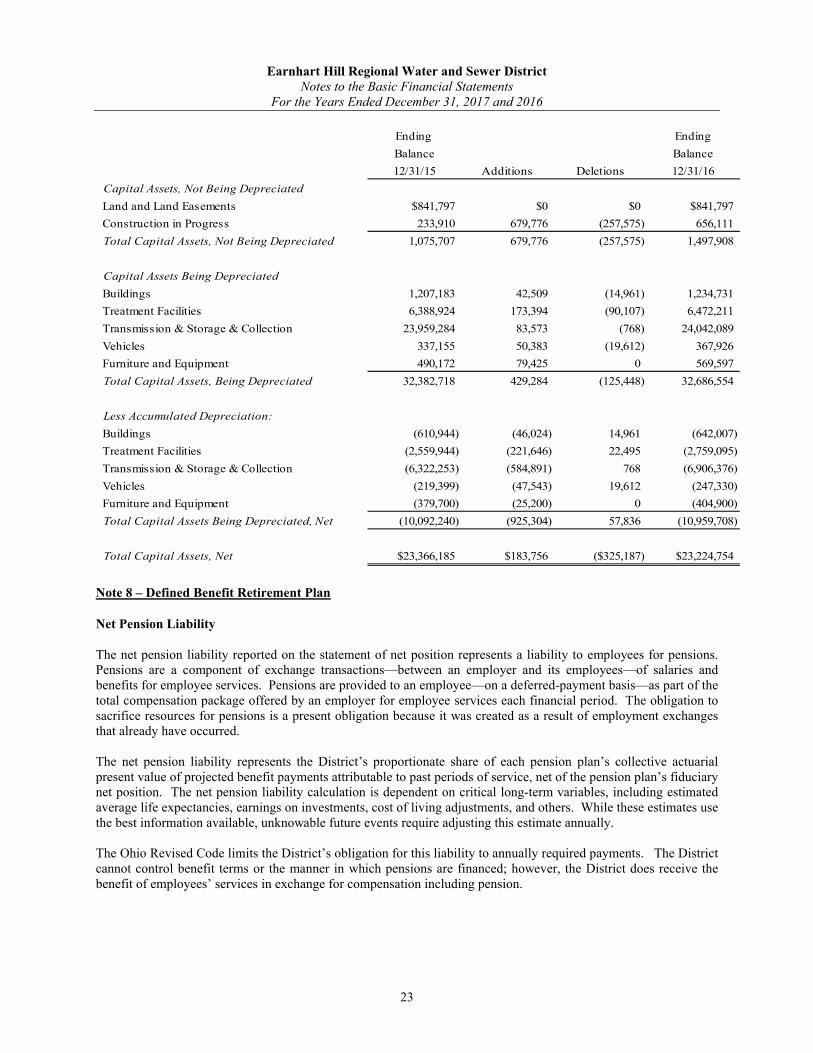
Note 7 – Capital Assets
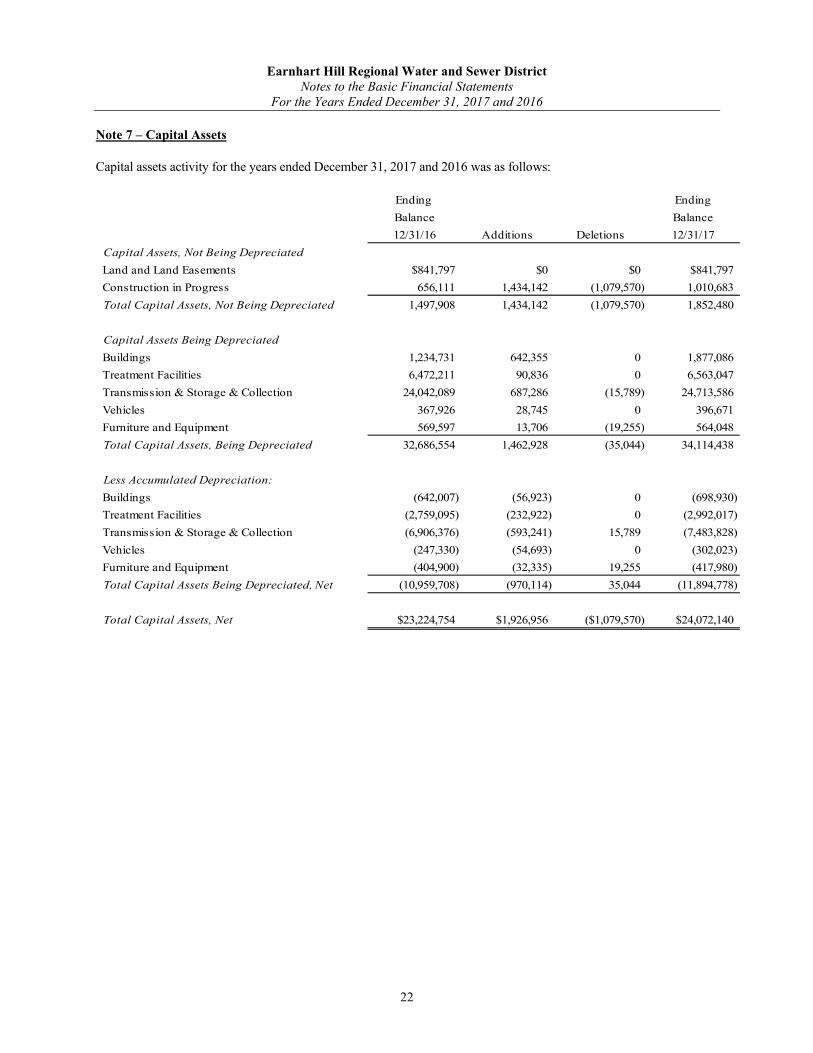
Capital assets activity for the years ended December 31, 2017 and 2016 was as follows:
Ending Ending
Balance Balance
12/31/16 Additions Deletions 12/31/17
Capital Assets, Not Being Depreciated
Land and Land Easements $841,797 $0 $0 $841,797
Construction in Progress 656,111 1,434,142 (1,079,570) 1,010,683
Total Capital Assets, Not Being Depreciated 1,497,908 1,434,142 (1,079,570) 1,852,480
Capital Assets Being Depreciated
Buildings 1,234,731 642,355 0 1,877,086
Treatment Facilities 6,472,211 90,836 0 6,563,047
Transmission & Storage & Collection 24,042,089 687,286 (15,789) 24,713,586
Vehicles 367,926 28,745 0 396,671
Furniture and Equipment 569,597 13,706 (19,255) 564,048
Total Capital Assets, Being Depreciated 32,686,554 1,462,928 (35,044) 34,114,438
Less Accumulated Depreciation:
Buildings (642,007) (56,923) 0 (698,930)
Treatment Facilities (2,759,095) (232,922) 0 (2,992,017)
Transmission & Storage & Collection (6,906,376) (593,241) 15,789 (7,483,828)
Vehicles (247,330) (54,693) 0 (302,023)
Furniture and Equipment (404,900) (32,335) 19,255 (417,980)
Total Capital Assets Being Depreciated, Net (10,959,708) (970,114) 35,044 (11,894,778)
Total Capital Assets, Net $23,224,754 $1,926,956 ($1,079,570) $24,072,140
Earnhart Hill Regional Water and Sewer DistrictNotes to the Basic Financial Statements
For the Years Ended December 31, 2017 and 2016
23
Ending Ending
Balance Balance
12/31/15 Additions Deletions 12/31/16
Capital Assets, Not Being Depreciated
Land and Land Easements $841,797 $0 $0 $841,797
Construction in Progress 233,910 679,776 (257,575) 656,111
Total Capital Assets, Not Being Depreciated 1,075,707 679,776 (257,575) 1,497,908
Capital Assets Being Depreciated
Buildings 1,207,183 42,509 (14,961) 1,234,731
Treatment Facilities 6,388,924 173,394 (90,107) 6,472,211
Transmission & Storage & Collection 23,959,284 83,573 (768) 24,042,089
Vehicles 337,155 50,383 (19,612) 367,926
Furniture and Equipment 490,172 79,425 0 569,597
Total Capital Assets, Being Depreciated 32,382,718 429,284 (125,448) 32,686,554
Less Accumulated Depreciation:
Buildings (610,944) (46,024) 14,961 (642,007)
Treatment Facilities (2,559,944) (221,646) 22,495 (2,759,095)
Transmission & Storage & Collection (6,322,253) (584,891) 768 (6,906,376)
Vehicles (219,399) (47,543) 19,612 (247,330)
Furniture and Equipment (379,700) (25,200) 0 (404,900)
Total Capital Assets Being Depreciated, Net (10,092,240) (925,304) 57,836 (10,959,708)
Total Capital Assets, Net $23,366,185 $183,756 ($325,187) $23,224,754
Note 8 – Defined Benefit Retirement Plan
Net Pension Liability
The net pension liability reported on the statement of net position represents a liability to employees for pensions. Pensions are a component of exchange transactions—between an employer and its employees—of salaries and benefits for employee services. Pensions are provided to an employee—on a deferred-payment basis—as part of the total compensation package offered by an employer for employee services each financial period. The obligation to sacrifice resources for pensions is a present obligation because it was created as a result of employment exchanges that already have occurred.
The net pension liability represents the District’s proportionate share of each pension plan’s collective actuarial present value of projected benefit payments attributable to past periods of service, net of the pension plan’s fiduciary net position. The net pension liability calculation is dependent on critical long-term variables, including estimated average life expectancies, earnings on investments, cost of living adjustments, and others. While these estimates use the best information available, unknowable future events require adjusting this estimate annually.
The Ohio Revised Code limits the District’s obligation for this liability to annually required payments. The District cannot control benefit terms or the manner in which pensions are financed; however, the District does receive the benefit of employees’ services in exchange for compensation including pension.
Earnhart Hill Regional Water and Sewer DistrictNotes to the Basic Financial Statements
For the Years Ended December 31, 2017 and 2016
24
GASB 68 assumes the liability is solely the obligation of the employer, because (1) they benefit from employee services; and (2) State statute requires all funding to come from these employers. All contributions to date have come solely from these employers (which also includes costs paid in the form of withholdings from employees). State statute requires the pension plan to amortize unfunded liabilities within 30 years. If the amortization period exceeds 30 years, the pension plan’s board must propose corrective action to the State legislature. Any resulting legislative change to benefits or funding could significantly affect the net pension liability. Resulting adjustments to the net pension liability would be effective when the changes are legally enforceable.
The proportionate share of the plan’s unfunded benefits is presented as a long-term net pension liability on the accrual basis of accounting. Any liability for the contractually-required pension contribution outstanding at the end of the year is included in intergovernmental payable on the accrual basis of accounting.
Plan Description – Ohio Public Employees Retirement System (OPERS)
Plan Description - District employees participate in the Ohio Public Employees Retirement System (OPERS). OPERS administers three separate pension plans. The traditional pension plan is a cost-sharing, multiple-employer defined benefit pension plan. The member-directed plan is a defined contribution plan and the combined plan is a cost-sharing, multiple-employer defined benefit pension plan with defined contribution features. While members (e.g. District employees) may elect the member-directed plan and the combined plan, substantially all employee members are in OPERS’ traditional plan; therefore, the following disclosure focuses on the traditional pension plan.
OPERS provides retirement, disability, survivor and death benefits, and annual cost of living adjustments to members of the traditional plan. Authority to establish and amend benefits is provided by Chapter 145 of the Ohio Revised Code. OPERS issues a stand-alone financial report that includes financial statements, required supplementary information and detailed information about OPERS’ fiduciary net position that may be obtained by visiting https://www.opers.org/financial/reports.shtml#CAFR, by writing to OPERS, 277 East Town Street, Columbus, Ohio 43215-4642, or by calling 614-222-5601 or 800-222-7377.
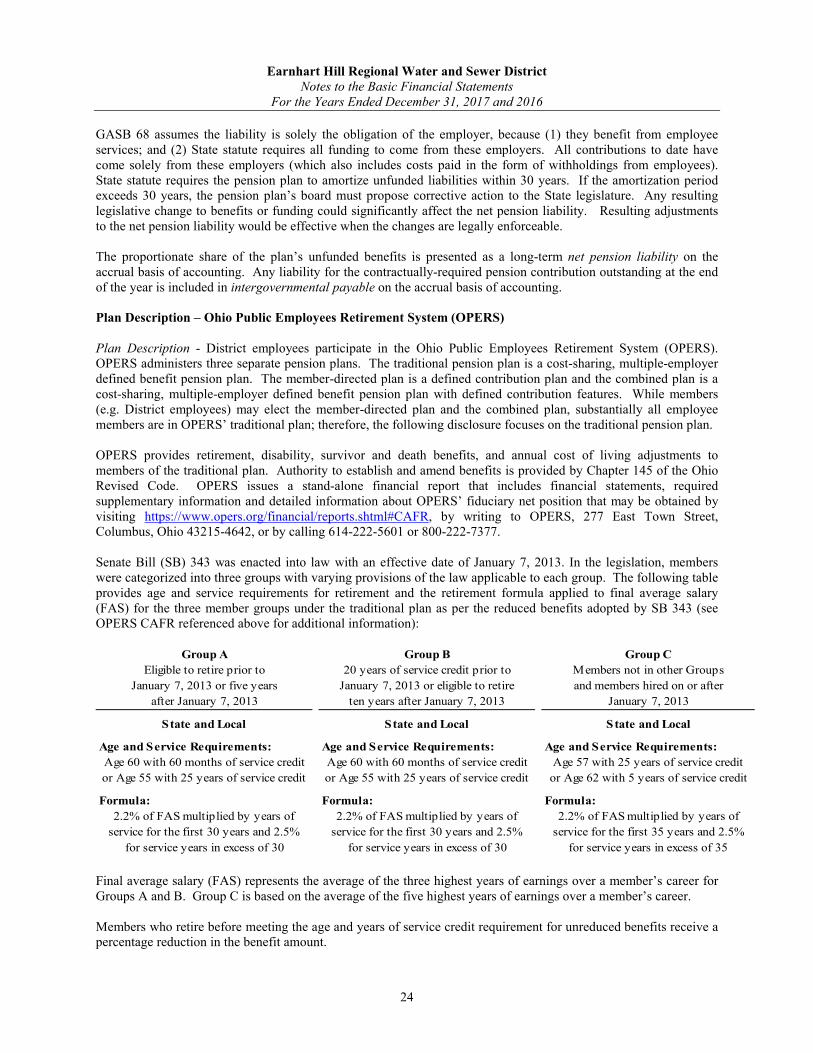
Senate Bill (SB) 343 was enacted into law with an effective date of January 7, 2013. In the legislation, members were categorized into three groups with varying provisions of the law applicable to each group. The following table provides age and service requirements for retirement and the retirement formula applied to final average salary (FAS) for the three member groups under the traditional plan as per the reduced benefits adopted by SB 343 (see OPERS CAFR referenced above for additional information):
Group A Group B Group C
Eligible to retire prior to 20 years of service credit prior to Members not in other Groups
January 7, 2013 or five years January 7, 2013 or eligible to retire and members hired on or after
after January 7, 2013 ten years after January 7, 2013 January 7, 2013
State and Local State and Local State and Local
Age and Service Requirements: Age and Service Requirements: Age and Service Requirements:
Age 60 with 60 months of service credit Age 60 with 60 months of service credit Age 57 with 25 years of service credit
or Age 55 with 25 years of service credit or Age 55 with 25 years of service credit or Age 62 with 5 years of service credit
Formula: Formula: Formula:
2.2% of FAS multiplied by years of 2.2% of FAS multiplied by years of 2.2% of FAS multiplied by years of
service for the first 30 years and 2.5% service for the first 30 years and 2.5% service for the first 35 years and 2.5%
for service years in excess of 30 for service years in excess of 30 for service years in excess of 35
Final average salary (FAS) represents the average of the three highest years of earnings over a member’s career for Groups A and B. Group C is based on the average of the five highest years of earnings over a member’s career.
Members who retire before meeting the age and years of service credit requirement for unreduced benefits receive a percentage reduction in the benefit amount.
Earnhart Hill Regional Water and Sewer DistrictNotes to the Basic Financial Statements
For the Years Ended December 31, 2017 and 2016
25
When a benefit recipient has received benefits for 12 months, an annual cost of living adjustment (COLA) is provided. This COLA is calculated on the base retirement benefit at the date of retirement and is not compounded. For those retiring prior to January 7, 2013, the COLA will continue to be a 3 percent simple annual COLA. For those retiring subsequent to January 7, 2013, beginning in calendar year 2019, the COLA will be based on the average percentage increase in the Consumer Price Index, capped at 3 percent.
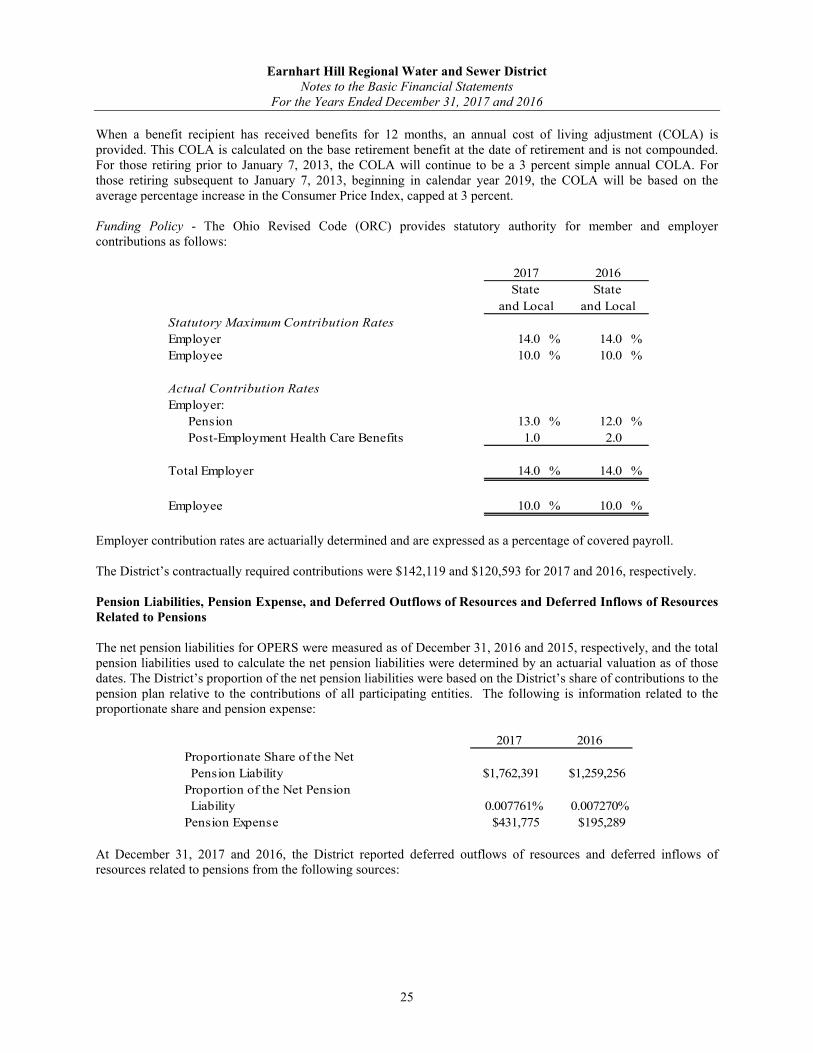
Funding Policy - The Ohio Revised Code (ORC) provides statutory authority for member and employer contributions as follows:
State State
and Local and Local
Statutory Maximum Contribution Rates
Employer 14.0 % 14.0 %
Employee 10.0 % 10.0 %
Actual Contribution Rates
Employer:
Pension 13.0 % 12.0 %
Post-Employment Health Care Benefits 1.0 2.0
Total Employer 14.0 % 14.0 %
Employee 10.0 % 10.0 %
2017 2016
Employer contribution rates are actuarially determined and are expressed as a percentage of covered payroll.
The District’s contractually required contributions were $142,119 and $120,593 for 2017 and 2016, respectively.
Pension Liabilities, Pension Expense, and Deferred Outflows of Resources and Deferred Inflows of Resources Related to Pensions
The net pension liabilities for OPERS were measured as of December 31, 2016 and 2015, respectively, and the total pension liabilities used to calculate the net pension liabilities were determined by an actuarial valuation as of thosedates. The District’s proportion of the net pension liabilities were based on the District’s share of contributions to the pension plan relative to the contributions of all participating entities. The following is information related to the proportionate share and pension expense:
2017 2016
Proportionate Share of the Net
Pension Liability $1,762,391 $1,259,256
Proportion of the Net Pension
Liability 0.007761% 0.007270%
Pension Expense $431,775 $195,289
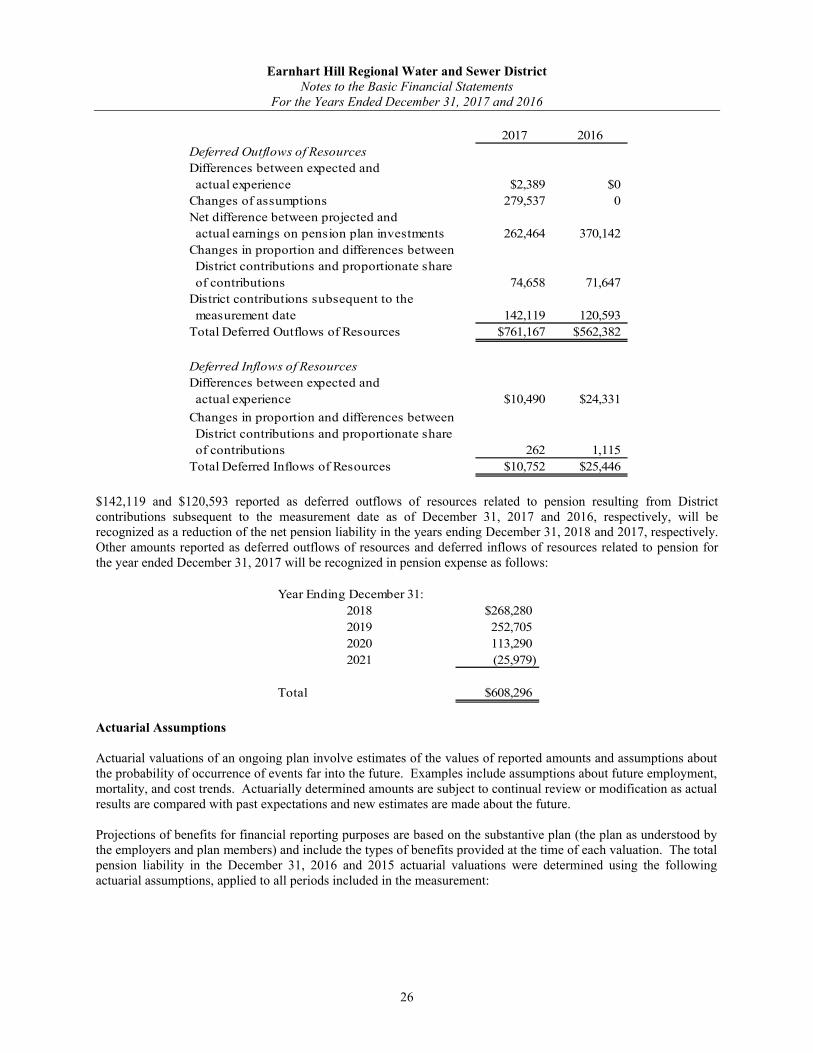
At December 31, 2017 and 2016, the District reported deferred outflows of resources and deferred inflows of resources related to pensions from the following sources:
Earnhart Hill Regional Water and Sewer DistrictNotes to the Basic Financial Statements
For the Years Ended December 31, 2017 and 2016
26
2017 2016
Deferred Outflows of Resources
Differences between expected and
actual experience $2,389 $0
Changes of assumptions 279,537 0
Net difference between projected and
actual earnings on pension plan investments 262,464 370,142
Changes in proportion and differences between
District contributions and proportionate share
of contributions 74,658 71,647
District contributions subsequent to the
measurement date 142,119 120,593
Total Deferred Outflows of Resources $761,167 $562,382
Deferred Inflows of Resources
Differences between expected and
actual experience $10,490 $24,331
Changes in proportion and differences between
District contributions and proportionate share
of contributions 262 1,115
Total Deferred Inflows of Resources $10,752 $25,446
$142,119 and $120,593 reported as deferred outflows of resources related to pension resulting from Districtcontributions subsequent to the measurement date as of December 31, 2017 and 2016, respectively, will be recognized as a reduction of the net pension liability in the years ending December 31, 2018 and 2017, respectively. Other amounts reported as deferred outflows of resources and deferred inflows of resources related to pension for the year ended December 31, 2017 will be recognized in pension expense as follows:
Year Ending December 31:
2018 $268,280
2019 252,705
2020 113,290
2021 (25,979)
Total $608,296
Actuarial Assumptions
Actuarial valuations of an ongoing plan involve estimates of the values of reported amounts and assumptions about the probability of occurrence of events far into the future. Examples include assumptions about future employment, mortality, and cost trends. Actuarially determined amounts are subject to continual review or modification as actual results are compared with past expectations and new estimates are made about the future.
Projections of benefits for financial reporting purposes are based on the substantive plan (the plan as understood by the employers and plan members) and include the types of benefits provided at the time of each valuation. The total pension liability in the December 31, 2016 and 2015 actuarial valuations were determined using the following actuarial assumptions, applied to all periods included in the measurement:
Earnhart Hill Regional Water and Sewer DistrictNotes to the Basic Financial Statements
For the Years Ended December 31, 2017 and 2016
27
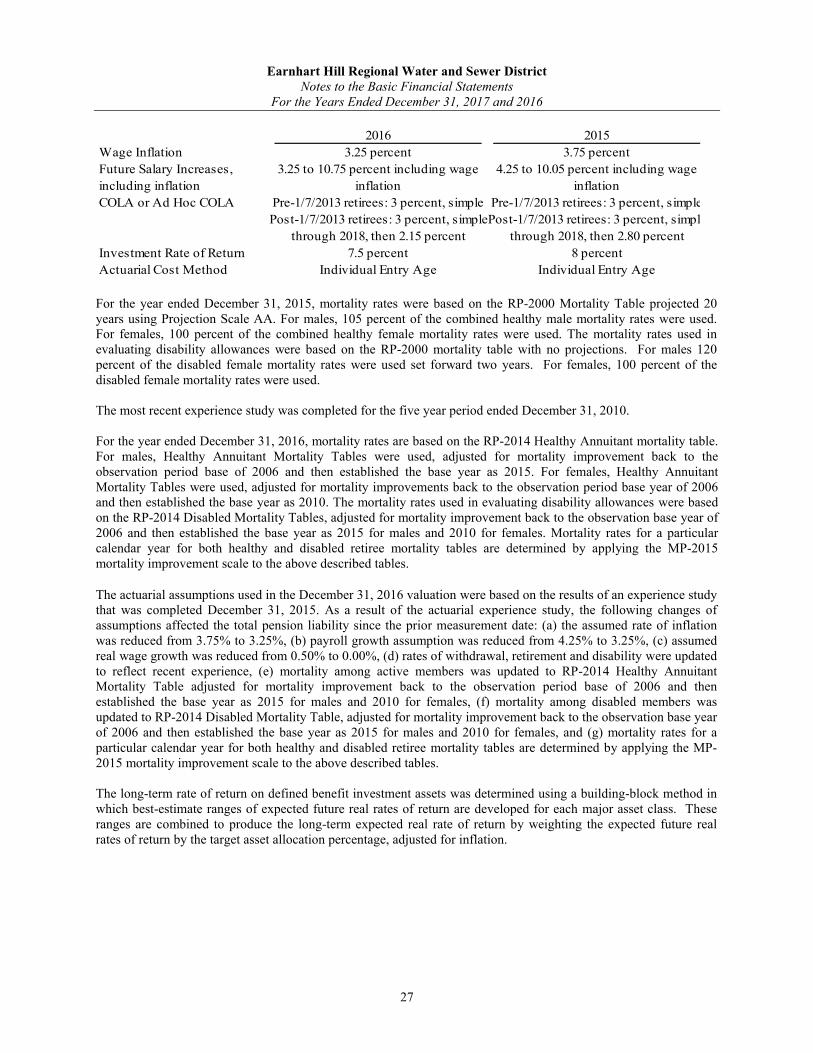
2016 2015
Wage Inflation 3.25 percent 3.75 percent
Future Salary Increases,
including inflation
3.25 to 10.75 percent including wage
inflation
4.25 to 10.05 percent including wage
inflation
COLA or Ad Hoc COLA Pre-1/7/2013 retirees: 3 percent, simple Pre-1/7/2013 retirees: 3 percent, simple
Post-1/7/2013 retirees: 3 percent, simplePost-1/7/2013 retirees: 3 percent, simple
through 2018, then 2.15 percent through 2018, then 2.80 percent
Investment Rate of Return 7.5 percent 8 percent
Actuarial Cost Method Individual Entry Age Individual Entry Age
For the year ended December 31, 2015, mortality rates were based on the RP-2000 Mortality Table projected 20 years using Projection Scale AA. For males, 105 percent of the combined healthy male mortality rates were used. For females, 100 percent of the combined healthy female mortality rates were used. The mortality rates used in evaluating disability allowances were based on the RP-2000 mortality table with no projections. For males 120 percent of the disabled female mortality rates were used set forward two years. For females, 100 percent of the disabled female mortality rates were used.
The most recent experience study was completed for the five year period ended December 31, 2010.
For the year ended December 31, 2016, mortality rates are based on the RP-2014 Healthy Annuitant mortality table. For males, Healthy Annuitant Mortality Tables were used, adjusted for mortality improvement back to the observation period base of 2006 and then established the base year as 2015. For females, Healthy Annuitant Mortality Tables were used, adjusted for mortality improvements back to the observation period base year of 2006 and then established the base year as 2010. The mortality rates used in evaluating disability allowances were based on the RP-2014 Disabled Mortality Tables, adjusted for mortality improvement back to the observation base year of 2006 and then established the base year as 2015 for males and 2010 for females. Mortality rates for a particular calendar year for both healthy and disabled retiree mortality tables are determined by applying the MP-2015 mortality improvement scale to the above described tables.
The actuarial assumptions used in the December 31, 2016 valuation were based on the results of an experience study that was completed December 31, 2015. As a result of the actuarial experience study, the following changes of assumptions affected the total pension liability since the prior measurement date: (a) the assumed rate of inflation was reduced from 3.75% to 3.25%, (b) payroll growth assumption was reduced from 4.25% to 3.25%, (c) assumed real wage growth was reduced from 0.50% to 0.00%, (d) rates of withdrawal, retirement and disability were updated to reflect recent experience, (e) mortality among active members was updated to RP-2014 Healthy Annuitant Mortality Table adjusted for mortality improvement back to the observation period base of 2006 and then established the base year as 2015 for males and 2010 for females, (f) mortality among disabled members was updated to RP-2014 Disabled Mortality Table, adjusted for mortality improvement back to the observation base year of 2006 and then established the base year as 2015 for males and 2010 for females, and (g) mortality rates for a particular calendar year for both healthy and disabled retiree mortality tables are determined by applying the MP-2015 mortality improvement scale to the above described tables.
The long-term rate of return on defined benefit investment assets was determined using a building-block method inwhich best-estimate ranges of expected future real rates of return are developed for each major asset class. These ranges are combined to produce the long-term expected real rate of return by weighting the expected future real rates of return by the target asset allocation percentage, adjusted for inflation.
Earnhart Hill Regional Water and Sewer DistrictNotes to the Basic Financial Statements
For the Years Ended December 31, 2017 and 2016
28
For the year ended December 31, 2015, OPERS managed investments in four investment portfolios: the Defined Benefits portfolio, the Health Care portfolio, the 115 Health Care Trust portfolio and the Defined Contribution portfolio. The Defined Benefit portfolio includes the investment assets of the Traditional Pension Plan, the defined benefit component of the Combined Plan, the annuitized accounts of the Member-Directed Plan and the VEBA Trust. Within the Defined Benefit portfolio, contributions into the plans are all recorded at the same time, and benefit payments all occur on the first of the month. Accordingly, the money-weighted rate of return is considered to be the same for all plans within the portfolio. The money weighted rates of return, net of investments expense, for the Defined Benefit portfolio are 0.4 percent 2015.
For the year ended December 31, 2016, OPERS managed investments in four investment portfolios: the Defined Benefit portfolio, the 401(h) Health Care Trust portfolio, the 115 Health Care Trust portfolio and the Defined Contribution portfolio. The 401(h) Health Care Trust portfolio was closed as of June 30, 2016 and the net position transferred to the 115 Health Care Trust portfolio on July 1, 2016. The Defined Benefit portfolio contains the investment assets of the Traditional Pension Plan, the defined benefit component of the Combined Plan and the annuitized accounts of the Member-Directed Plan. The Defined Benefit portfolio historically included the assets of the Member-Directed retiree medical accounts funded through the VEBA Trust. However, the VEBA Trust was closed as of June 30, 2016 and the net position transferred to the 115 Health Care Trust portfolio on July 1, 2016. Within the Defined Benefit portfolio, contributions into the plans are all recorded at the same time, and benefit payments all occur on the first of the month. Accordingly, the money-weighted rate of return is considered to be the same for all plans within the portfolio. The annual money-weighted rate of return expressing investment performance, net of investment expenses and adjusted for the changing amounts actually invested, for the Defined Benefit portfolio is 8.3% for 2016.
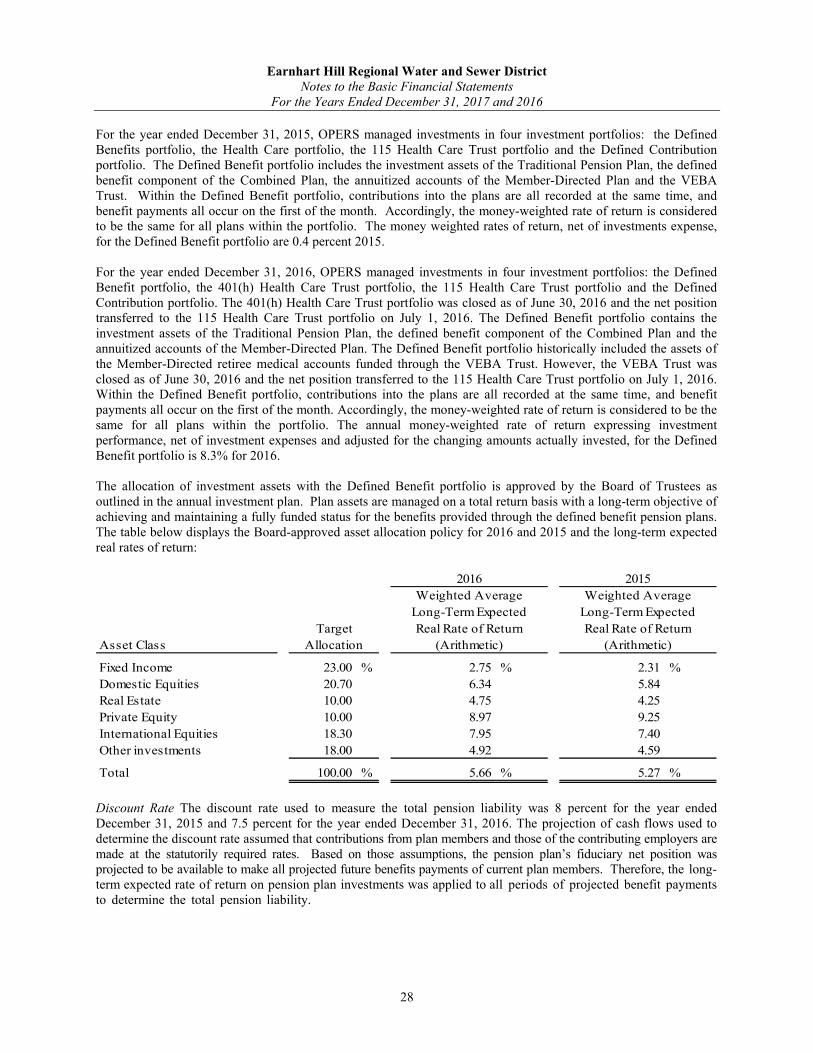
The allocation of investment assets with the Defined Benefit portfolio is approved by the Board of Trustees as outlined in the annual investment plan. Plan assets are managed on a total return basis with a long-term objective of achieving and maintaining a fully funded status for the benefits provided through the defined benefit pension plans. The table below displays the Board-approved asset allocation policy for 2016 and 2015 and the long-term expected real rates of return:
Target
Asset Class Allocation
Fixed Income 23.00 % 2.75 % 2.31 %
Domestic Equities 20.70 6.34 5.84
Real Estate 10.00 4.75 4.25
Private Equity 10.00 8.97 9.25
International Equities 18.30 7.95 7.40
Other investments 18.00 4.92 4.59
Total 100.00 % 5.66 % 5.27 %
2016
Weighted Average
Long-Term Expected
Real Rate of Return
(Arithmetic)
2015
(Arithmetic)
Weighted Average
Long-Term Expected
Real Rate of Return
Discount Rate The discount rate used to measure the total pension liability was 8 percent for the year ended December 31, 2015 and 7.5 percent for the year ended December 31, 2016. The projection of cash flows used todetermine the discount rate assumed that contributions from plan members and those of the contributing employers are made at the statutorily required rates. Based on those assumptions, the pension plan’s fiduciary net position was projected to be available to make all projected future benefits payments of current plan members. Therefore, the long-term expected rate of return on pension plan investments was applied to all periods of projected benefit paymentsto determine the total pension liability.
Earnhart Hill Regional Water and Sewer DistrictNotes to the Basic Financial Statements
For the Years Ended December 31, 2017 and 2016
29
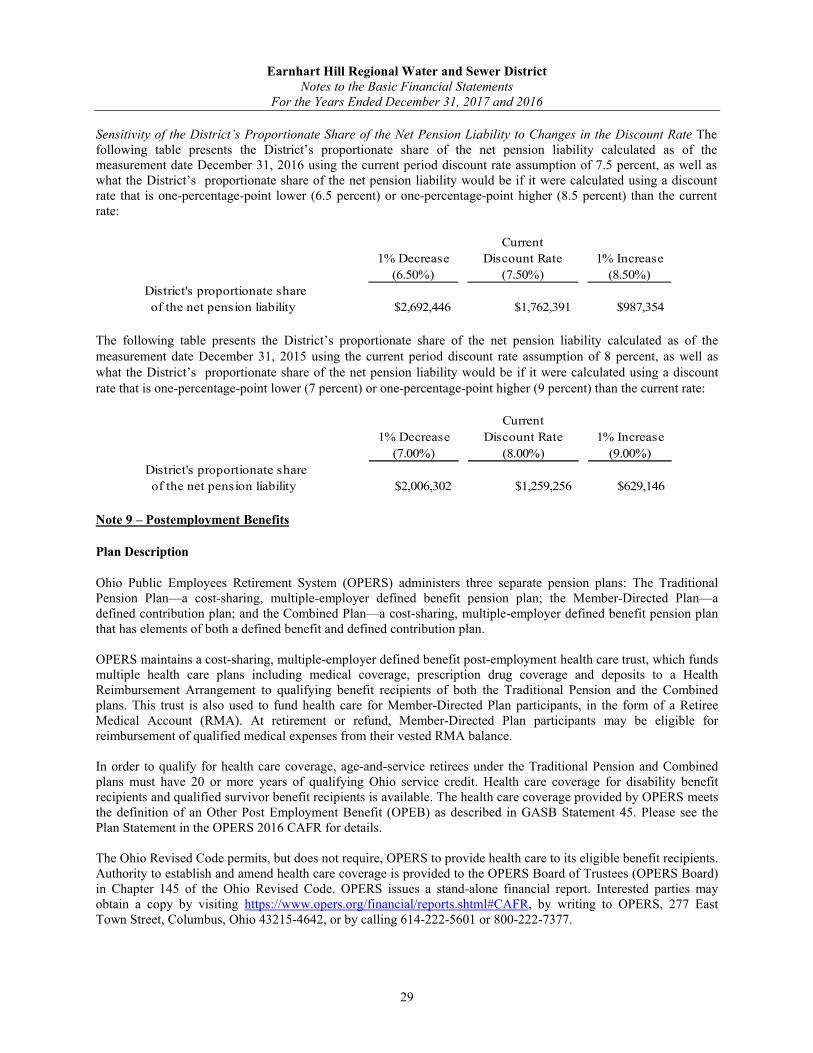
Sensitivity of the District’s Proportionate Share of the Net Pension Liability to Changes in the Discount Rate The following table presents the District’s proportionate share of the net pension liability calculated as of the measurement date December 31, 2016 using the current period discount rate assumption of 7.5 percent, as well as what the District’s proportionate share of the net pension liability would be if it were calculated using a discount rate that is one-percentage-point lower (6.5 percent) or one-percentage-point higher (8.5 percent) than the current rate:
Current
1% Decrease Discount Rate 1% Increase
(6.50%) (7.50%) (8.50%)
District's proportionate share
of the net pension liability $2,692,446 $1,762,391 $987,354
The following table presents the District’s proportionate share of the net pension liability calculated as of the measurement date December 31, 2015 using the current period discount rate assumption of 8 percent, as well as what the District’s proportionate share of the net pension liability would be if it were calculated using a discount rate that is one-percentage-point lower (7 percent) or one-percentage-point higher (9 percent) than the current rate:
Current
1% Decrease Discount Rate 1% Increase
(7.00%) (8.00%) (9.00%)
District's proportionate share
of the net pension liability $2,006,302 $1,259,256 $629,146
Note 9 – Postemployment Benefits
Plan Description
Ohio Public Employees Retirement System (OPERS) administers three separate pension plans: The Traditional Pension Plan—a cost-sharing, multiple-employer defined benefit pension plan; the Member-Directed Plan—a defined contribution plan; and the Combined Plan—a cost-sharing, multiple-employer defined benefit pension plan that has elements of both a defined benefit and defined contribution plan.
OPERS maintains a cost-sharing, multiple-employer defined benefit post-employment health care trust, which funds multiple health care plans including medical coverage, prescription drug coverage and deposits to a Health Reimbursement Arrangement to qualifying benefit recipients of both the Traditional Pension and the Combined plans. This trust is also used to fund health care for Member-Directed Plan participants, in the form of a Retiree Medical Account (RMA). At retirement or refund, Member-Directed Plan participants may be eligible for reimbursement of qualified medical expenses from their vested RMA balance.
In order to qualify for health care coverage, age-and-service retirees under the Traditional Pension and Combined plans must have 20 or more years of qualifying Ohio service credit. Health care coverage for disability benefit recipients and qualified survivor benefit recipients is available. The health care coverage provided by OPERS meets the definition of an Other Post Employment Benefit (OPEB) as described in GASB Statement 45. Please see the Plan Statement in the OPERS 2016 CAFR for details.
The Ohio Revised Code permits, but does not require, OPERS to provide health care to its eligible benefit recipients. Authority to establish and amend health care coverage is provided to the OPERS Board of Trustees (OPERS Board) in Chapter 145 of the Ohio Revised Code. OPERS issues a stand-alone financial report. Interested parties may obtain a copy by visiting https://www.opers.org/financial/reports.shtml#CAFR, by writing to OPERS, 277 East Town Street, Columbus, Ohio 43215-4642, or by calling 614-222-5601 or 800-222-7377.
Earnhart Hill Regional Water and Sewer DistrictNotes to the Basic Financial Statements
For the Years Ended December 31, 2017 and 2016
30
Funding Policy
The Ohio Revised Code provides the statutory authority requiring public employers to fund health care through their contributions to OPERS. A portion of each employer’s contribution to OPERS may be set aside to fund OPERS health care plans.
Employer contribution rates are expressed as a percentage of the earnable salary of active members. In 2017, state and local employers contributed at a rate of 14.0% of earnable salary. These are the maximum employer contribution rates permitted by the Ohio Revised Code. Active member contributions do not fund health care.
Each year, the OPERS Board determines the portion of the employer contribution rate that will be set aside to fund health care plans. The portions of employer contributions allocated to health care for members in the Traditional Pension Plan and Combined Plan were 1.0 percent and 2.0 percent during calendar years 2017 and 2016, respectively. As recommended by OPERS’ actuary, the portion of employer contributions allocated to health care beginning January 1, 2018 decreased to 0.0% for both plans. The OPERS Board is also authorized to establish rules for the retiree or their surviving beneficiaries to pay a portion of the health care provided. Payment amounts vary depending on the number of covered dependents and the coverage selected. The employer contribution as a percentage of covered payroll deposited for Member-Directed Plan participants for 2017 and 2016 was 4.0%.
The employer contributions that were used to fund postemployment benefits for the years ended December 2017, 2016, 2015 were $10,933, $20,099, and $18,110, respectfully. All required contributions have been made for each year.
Note 10 – Budget
Budgetary activity for the years ended December 31, 2017 and 2016 follows:
Budgeted vs. Actual Receipts
2017 2016Budgeted Receipts $4,324,600 $3,957,000Actual Receipts 4,775,051 4,021,768Variance $450,451 $64,768
Budgeted vs. Actual Budgetary Basis Expenditures
2017 2016Appropriation Authority $5,862,138 $5,697,526Budgetary Expenditures 5,777,794 4,525,176Variance $84,344 $1,172,350
Note 11 – Pending Litigation
The District’s general legal counsel is Bricker & Eckler, LLP, Columbus, Ohio.
There was no material litigation pending or outstanding as of December 31, 2017 that management believes might have a significant effect on the accompanying financial statements.
Note 12 – Federal Financial Assistance
The District received $0 in financial assistance in 2017 and 2016.
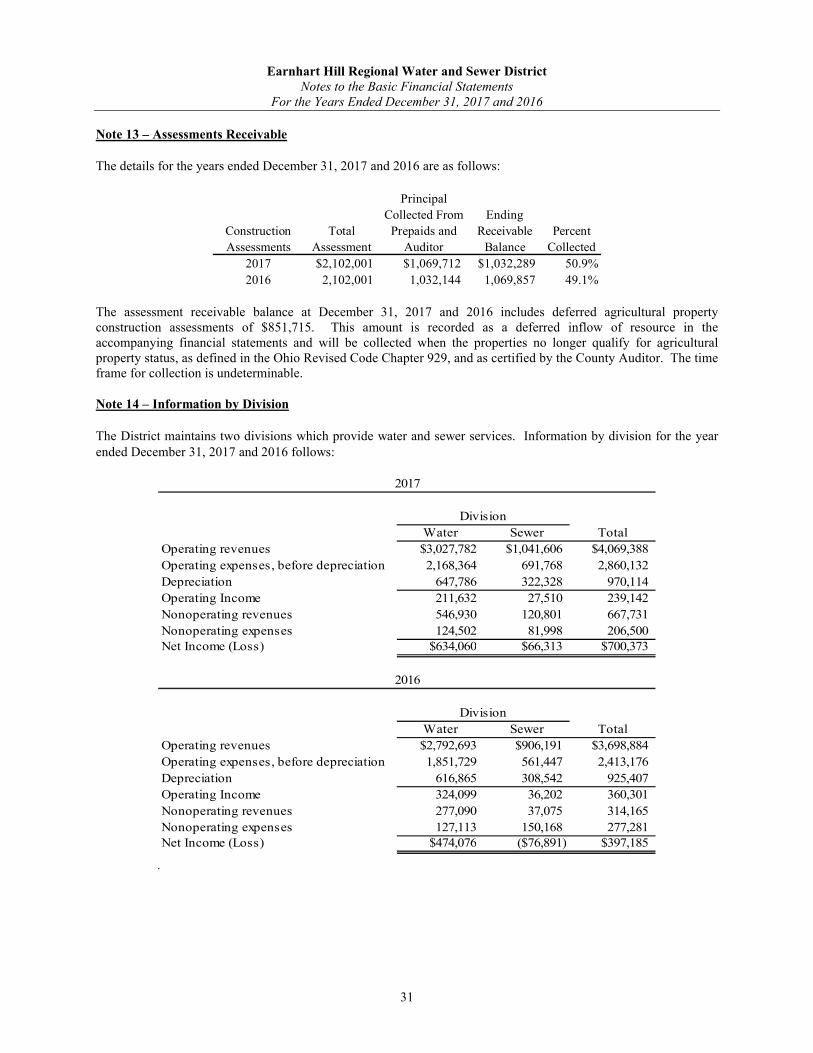
Earnhart Hill Regional Water and Sewer DistrictNotes to the Basic Financial Statements
For the Years Ended December 31, 2017 and 2016
31
Note 13 – Assessments Receivable
The details for the years ended December 31, 2017 and 2016 are as follows:
Construction
Assessments
Total
Assessment
Principal
Collected From
Prepaids and
Auditor
Ending
Receivable
Balance
Percent
Collected
2017 $2,102,001 $1,069,712 $1,032,289 50.9%
2016 2,102,001 1,032,144 1,069,857 49.1%
The assessment receivable balance at December 31, 2017 and 2016 includes deferred agricultural property construction assessments of $851,715. This amount is recorded as a deferred inflow of resource in the accompanying financial statements and will be collected when the properties no longer qualify for agricultural property status, as defined in the Ohio Revised Code Chapter 929, and as certified by the County Auditor. The time frame for collection is undeterminable.
Note 14 – Information by Division
The District maintains two divisions which provide water and sewer services. Information by division for the year ended December 31, 2017 and 2016 follows:
Water Sewer Total
Operating revenues $3,027,782 $1,041,606 $4,069,388
Operating expenses, before depreciation 2,168,364 691,768 2,860,132
Depreciation 647,786 322,328 970,114
Operating Income 211,632 27,510 239,142
Nonoperating revenues 546,930 120,801 667,731
Nonoperating expenses 124,502 81,998 206,500Net Income (Loss) $634,060 $66,313 $700,373
Water Sewer Total
Operating revenues $2,792,693 $906,191 $3,698,884
Operating expenses, before depreciation 1,851,729 561,447 2,413,176
Depreciation 616,865 308,542 925,407
Operating Income 324,099 36,202 360,301
Nonoperating revenues 277,090 37,075 314,165
Nonoperating expenses 127,113 150,168 277,281Net Income (Loss) $474,076 ($76,891) $397,185
Division
2017
2016
Division
Earnhart Hill Regional Water and Sewer DistrictNotes to the Basic Financial Statements
For the Years Ended December 31, 2017 and 2016
32
Note 15 – Implementation of New Accounting Pronouncements
For the year ended December 31, 2017, the District was required to implement Governmental Accounting Standards Board Statements No. 74, “Financial Reporting for Postemployment Benefits Plans Other Than Pension Plans,” No. 80, “Blending Requirements for Certain Component Units,” No. 81, “Irrevocable Split-Interest Agreements,” and No. 82, “Pension Issues.”
GASB Statement No. 74 replaces GASB Statement No. 43, “Financial Reporting for Postemployment Benefit Plans Other Than Pension Plans.” Statement 74 addresses the financial reports of defined benefit OPEB plans that are administered through trusts that meet specified criteria. The Statement follows the framework for financial reporting of defined benefit OPEB plans in Statement 45 by requiring a statement of fiduciary net position and a statement of changes in fiduciary net position. The Statement requires more extensive note disclosures and RSI related to the measurement of the OPEB liabilities for which assets have been accumulated, including information about the annual money-weighted rates of return on plan investments. Statement 74 also sets forth note disclosure requirements for defined contribution OPEB plans.
GASB Statement No. 80 clarifies the display requirements in GASB Statement No. 14, “The Financial Reporting Entity,” by requiring these component units to be blended into the primary state or local government’s financial statements in a manner similar to a department or activity of the primary government. The guidance addresses diversity in practice regarding the presentation of not-for-profit corporations in which the primary government is the sole corporate member. Although GASB 80 applies to a limited number of governmental units, such as, for example, public hospitals, the GASB intends for it to enhance the comparability of financial statements among those units and improve the value of this information for users of state and local government financial statements.
GASB Statement No. 81 requires that a government that receives resources pursuant to an irrevocable split-interest agreement recognize assets, liabilities, and deferred inflows of resources at the inception of the agreement. Furthermore, this Statement requires that a government recognize assets representing its beneficial interests in irrevocable split-interest agreements that are administered by a third party, if the government controls the present service capacity of the beneficial interests. GASB 81 requires that a government recognize revenue when the resources become applicable to the reporting period.
GASB Statement No. 82 addresses, among other things, presentation of payroll-related measures in required supplementary information, selection of assumptions and the treatment of deviations from guidance in Actuarial Standards of Practice for financial reporting purposes, and classification of payments made by employers to satisfy plan member contribution requirements. GASB 82 is designed to improve consistency in the application of the pension standards by clarifying or amending related areas of existing guidance. Specifically, the practice issues raised by stakeholders during implementation relate to GASB 67, 68, and 73.
None of these Statements had an impact on the District’s financial statements or note disclosures.

2014 2015 2016 2017Ohio Public Employees Retirement System
District's proportion of the net pension liability 0.006501% 0.006501% 0.007270% 0.007761%
District's proportionate share of the net pension liability $766,419 $784,130 $1,259,256 $1,762,391
District's covered-employee payroll $741,432 $797,417 $905,517 $1,004,942
District's proportionate share of the net pension liability as a percentage of its
covered-employee payroll 103.37% 98.33% 139.06% 175.37%
Plan fiduciary net position as a percentage of the total pension liability 86.36% 86.45% 81.08% 77.25%
The amounts presented for each year were determined as of December 31 of the previous year, which is the District's measurement date.
(1) Information not available prior to 2014.
Earnhart Hill Regional Water and Sewer DistrictRequired Supplementary Information
Schedule of District's Proportionate Share of the Net Pension LiabilityLast Four Years (1)
33
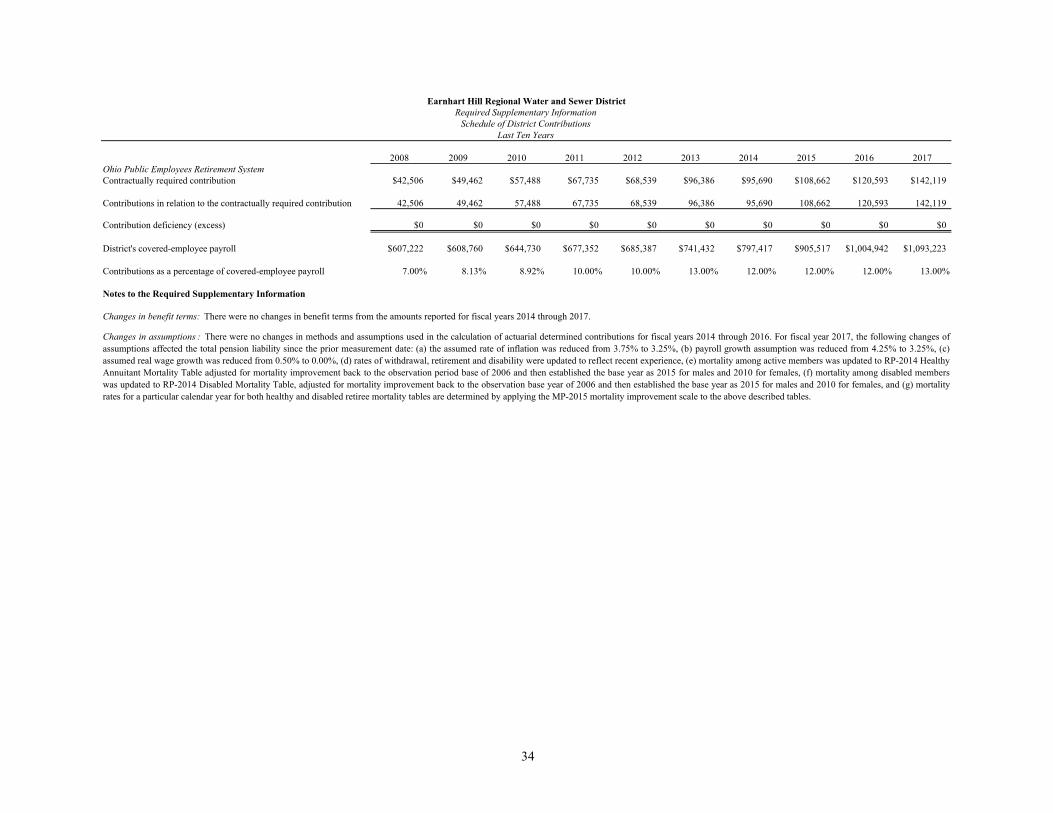
2008 2009 2010 2011 2012 2013 2014 2015 2016 2017Ohio Public Employees Retirement SystemContractually required contribution $42,506 $49,462 $57,488 $67,735 $68,539 $96,386 $95,690 $108,662 $120,593 $142,119
Contributions in relation to the contractually required contribution 42,506 49,462 57,488 67,735 68,539 96,386 95,690 108,662 120,593 142,119
Contribution deficiency (excess) $0 $0 $0 $0 $0 $0 $0 $0 $0 $0
District's covered-employee payroll $607,222 $608,760 $644,730 $677,352 $685,387 $741,432 $797,417 $905,517 $1,004,942 $1,093,223
Contributions as a percentage of covered-employee payroll 7.00% 8.13% 8.92% 10.00% 10.00% 13.00% 12.00% 12.00% 12.00% 13.00%
Notes to the Required Supplementary Information
Changes in assumptions : There were no changes in methods and assumptions used in the calculation of actuarial determined contributions for fiscal years 2014 through 2016. For fiscal year 2017, the following changes of
assumptions affected the total pension liability since the prior measurement date: (a) the assumed rate of inflation was reduced from 3.75% to 3.25%, (b) payroll growth assumption was reduced from 4.25% to 3.25%, (c)
assumed real wage growth was reduced from 0.50% to 0.00%, (d) rates of withdrawal, retirement and disability were updated to reflect recent experience, (e) mortality among active members was updated to RP-2014 Healthy
Annuitant Mortality Table adjusted for mortality improvement back to the observation period base of 2006 and then established the base year as 2015 for males and 2010 for females, (f) mortality among disabled members
was updated to RP-2014 Disabled Mortality Table, adjusted for mortality improvement back to the observation base year of 2006 and then established the base year as 2015 for males and 2010 for females, and (g) mortality
rates for a particular calendar year for both healthy and disabled retiree mortality tables are determined by applying the MP-2015 mortality improvement scale to the above described tables.
Changes in benefit terms: There were no changes in benefit terms from the amounts reported for fiscal years 2014 through 2017.
Earnhart Hill Regional Water and Sewer DistrictRequired Supplementary Information
Schedule of District ContributionsLast Ten Years
34