early-stage detection of breakthrough-class scientific
TRANSCRIPT

Cover Page
The handle http://hdl.handle.net/1887/46101 holds various files of this Leiden University dissertation. Author: Winnink, J.J. Title: Early-stage detection of breakthrough-class scientific research : using micro-level citation dynamics Issue Date: 2017-02-22

Chapter6Validation study
The content of this chapter is equivalent to the manuscript:
Winnink, J.J. Tijssen, Robert J.W., and van Raan, A.F.J. (Submitted for publication). Canearly-detection algorithms of breakout papers uncover scientific breakthroughs?.
The only differences between the article to be published and the text in this chapter are
of typographic nature to assure that the layout is in line with the typographic design
of this PhD thesis. The information presented in section ‘Appendix 6.A Supplementary
material’ on page 125 will also be available on the website of the publisher in a separate
file accompanying the journal article.
Abstract
In order to test our hypothesis “It is possible to design, develop, implement, and test ananalytical framework and measurement model as a general-purpose tool using biblio-graphic information for early detection of breakthroughs in science?” we have conduc-ted in the past few years a series of case studies to develop computerized algorithms.The algorithms facilitate the early detection of ‘breakout’ papers that emerge as highlycited and distinctive. These search & detection algorithms, combining computer-aideddata mining with decision heuristics, assess structural changes within citation patternswith the international scientific literature. The citation impact time window in thisstudy is 24–36 months after publication of research papers. The wider applicability ofthese algorithms, across all science fields, had not yet been ascertained. In this paperwe report on our test results, in which five algorithms were applied to the entire Webof Science database, i.e., to all research articles from the period 1990–1994 presentingoriginal scientific or technical research. We succeeded in detecting many ‘breakout’
99
Validation study
papers with distinctive citation impact profiles. A small subset of these breakouts isclassified as ‘breakthroughs’: Nobel Prize research papers. Furthermore papers oc-curring in Nature’s Top-100 Most Cited Papers Ever, or papers that are still (highly)cited by review papers, by patents, or frequently mentioned in today’s social mediawere found. We also compare the outcomes of our algorithms with the results of thebreakthrough-detection algorithm developed by Redner in 2005. The detection rates ofthe algorithms developed in this study vary but overall they present a superior tool fortracing breakout papers in science, when compared to methods that select the world’smost highly cited ‘hot papers’. For the final conclusion, if an identified early-stagebreakout paper presents a ‘breakthrough’ in science, the opinion of subject experts isneeded.
6.1 Introduction
6.1.1 Theoretical and conceptual issues
In this study we try to prove the validity of our hypothesis “It is possibleto design, develop, implement, and test an analytical framework and meas-urement model as a general-purpose tool using bibliographic information forearly detection of breakthroughs in science?”. Scientific discoveries that havean above average impact on science are often called ‘breakthroughs’. As thereis no strict and general accepted definition of the term ‘breakthrough’ char-acterizing a scientific discovery, as a breakthrough is not a straightforwardprocess. In order to understand the evolution of science various theoreticalmodels have been proposed. Bettencourt and colleagues (Bettencourt andKaiser, 2011, 2015; Bettencourt et al., 2009) propose a percolation model.Bonacorsi and his co-authors focus on dynamic patterns in the evolution ofscience (Bonaccorsi, 2008), and on the way new fields of science come intoexistence (Bonaccorsi, 2010; Bonaccorsi and Vargas, 2010). In (Chen et al.,2009) an explanatory and computational theory of transformative discover-ies in science in proposed. The use of disease-propagation models to describeknowledge diffusion is discussed in Cintron-Arias et al. (2005). Perla andCarifio (Perla and Carifio, 2005) use a catastrophe theory representation todepict and develop a formal nonlinear model of scientific change in concord-ance with Kuhn’s hypotheses (Kuhn, 1962). Experiments play a crucial rolein formulating an explanation of the RNAi anomaly as is explained in (Sung,2008). Population dynamic models can be used to explain the diffusion ofideas among scientists (Vitanov and Ausloos, 2012).
These and other theoretical models describe the behaviour of science asa system; linking the evolution of the science system with individual public-ations remains a challenge. The purpose of this study is to identify at earlystage areas that evolve into ‘hot spots’ in science. Science is not a gradualevolving system but a system that alternates between incremental advance-ments and major high-impact discoveries. Kuhn (Kuhn, 1962) calls thesetwo states ‘normal science’ and ‘revolutionary science’. In the latter case a
100

6.1 Introduction
‘paradigm shift ’ is involved, and in the first case not. High-impact discov-eries represent major steps forward. Identifying such sudden high-impactchanges is complicated as it takes time before the conclusion can be drawna discovery has a major influence on future science, and secondly becausethere is not a well defined general-accepted objective definition for a break-through. In this study the approach is taken to analyse citation profiles ofscholarly papers that present scientific discoveries classified by subject ex-perts as a ‘breakthrough’. These citation profiles are searched for character-istic breakthrough-signalling patterns. Such breakthrough-signalling patternsare then used as the basis for computerised automatic algorithms. In this waythe need for a strict definition of the term breakthrough is circumvented andreplaced by a more pragmatic definition based on expert opinions. The focusis herewith on the impact of an individual paper on the evolution of science.Our research question is answered by searching from multiple perspectivesfor scholarly publications that mark a major system change in the sciencesystem. We think the approach using a small number of cases studies tobase our algorithms on is sound as Bettencourt and colleagues theorize thatthere is a universal character in discoveries and inventions (Bettencourt et al.,2009, p.220), and argue that circumstantial evidence found in several otherstudies, such as (Gerstein and Douglas, 2007; Leskovec et al., 2005; Uzzi andSpiro, 2005), supports this theory. If such a universal character does exist itopens up the possibility to analyse individual discoveries, as we do, that arerecognised by experts as a breakthrough and search the bibliographic datafor characteristic patterns. Such patterns should result in generally applic-able computerised search algorithms to identify – at an early stage – thosescientific papers in the open scholarly literature that signify scientific dis-coveries. We call scholarly publications identified by our search algorithms‘breakout’ papers.
Our research focuses on constructing algorithms to improve the under-standing of discoveries in science, and more particularly in scientific break-throughs. Early stage identification of breakout papers could help in findinggeneral mechanisms related to scientific discoveries. Bettencourt et al. (2009,p.219) assert “. . . It has long been a goal of the history, philosophy, and so-ciology of science and, more recently, of bibliometrics and a new ‘science ofscience’, to identify (quantitative) indicators or circumstances that reveal mo-ments of scientific and technological discovery . . . ”. These authors furtherstate “. . . Thus, a more quantitative ‘science of science’ may allow society toreap the benefits of new discoveries sooner . . . ”. We advance the followinghypothesis:
“It is possible to design, develop, implement, and test ab analyticalframework and measurement model as a general-purpose tool us-ing bibliographic information for early detection of breakthroughsin science.”
To find out if this hypothesis can be validated we have conducted in the pastfew years a series of case studies to develop computerized algorithms. By
101

Validation study
running a series of algorithm-driven large-scale systematic searches on cita-tion patterns, we aim to identify research papers that mark a major change inthe science system; we call these ‘breakout papers’. These papers are likelyto have an above-average impact on follow-up scientific literature, as markedby a relatively large quantity of citations that accumulated rapidly after thepublications appeared in the public domain. Research papers that achieverapid impact are usually cited within months after publication, and certainlywithin two or three years.
Discoveries and inventions often come in a manifold, according to Og-burn and Thomas (1922); they may have different appearances, even if onlyslightly different; they emerge at various moments, or appear at differentplaces. De Solla Price (Price, 1963, p.65–66) discusses this ‘multiplicity ofdiscoveries’ while citing Merton Merton (1961) who confirmed Ogburn’s ob-servations, and linking multiplicity to Kuhn’s (Kuhn, 1962) concept of ‘nor-mal science’ in which discoveries are ‘expected’ outcomes of ‘evolutionary’scientific progress. Scientific discoveries come in several flavours based onthe impact a discovery has on this evolution. Only a small number of sci-entific discoveries lead to major structural changes in science – at the level ofresearch fields or disciplines – and providing novel insights and opening aven-ues for further productive research. Such rare discoveries are often referredto as ‘breakthroughs’, or by synonyms such as ‘step forward’, ‘quantum leap’,‘revolution’, and other variations. Subject experts are able, with the benefit ofhindsight, to assess the impact of a particular breakthrough on evolutionaryprocesses in science. Major general and interdisciplinary journals like Na-tional Geographic, Nature and Science, regularly publish overviews of whatthey perceive as the major scientific discoveries in a preceding period. Theselists are usually based on expert opinions and do not specify what exactly ismeant by a breakthrough or major discovery. And for a good reason: there is,as mentioned before, no generally accepted description, let alone a universalone, of the term breakthrough (or synonyms) that can count on full supportthroughout the scientific community.
6.1.2 Classification and identification of scientific discoveries
In order to pragmatically operationalize and classify scientific discoveries, ina way that enables large-scale systematic searches across worldwide researchliterature, we rely on the conceptual work by Hollingsworth (Hollingsworth,2008, p.317) who argues “. . . A major breakthrough or discovery is a findingor process, often preceded by numerous small advances, which leads to anew way of thinking about a problem . . . ”. Secondly, we follow Koshland’s‘Cha-Cha-Cha’ theory (Koshland, 2007, p.761) in which three main types ofdiscoveries are distinguished:
“. . . In looking back on centuries of scientific discoveries, how-ever, a pattern emerges which suggests that they fall into threecategories —Charge, Challenge, and Chance— that combine into a’Cha-Cha-Cha’ Theory of Scientific Discovery . . . ”
102

6.1 Introduction
According to Koshland: “Charge discoveries solve problems that are quite ob-vious . . . ”, while “Challenge discoveries are a response to an accumulation offacts or concepts that are unexplained by or incongruous with scientific theor-ies of the time . . . ”, where “Chance discoveries are those that are often calledserendipitous . . . ”. As for the latter category, Koshland states: “. . . not onlywould include Pasteur’s discovery of optical activity (D and L isomers), butalso W. C. Röntgen’s X-rays and Roy Plunkett’s Teflon® . . . ”. When framed withThomas Kuhn’s general theory of scientific progress, these Charge discover-ies are more likely to occur during periods of ‘normal’ science, whereas Chal-lenge and Chance contribute to ‘revolutionary’ science, which is marked byparadigm-shifting breakthroughs and major epistemological changes withinfields of science.
The occurrence of a breakthrough is hard to foresee (Bettencourt et al.,2009). Even within weeks or months, and sometimes many years, after thefact, the significance of a major scientific discovery is not always clear orobvious. Ball Ball (2004) states that in general systems, such as in this caseresearch fields and fields in science, need a certain ‘critical mass’ to undergo amajor change. As mentioned before Bettencourt and co-authors (Bettencourtand Kaiser, 2015) conclude that is it possible to develop a general theory anddetailed models that govern the formation of fields in science. Recent pub-lications (Scheffer, 2010; Scheffer et al., 2009) show that information trans-mitted by ‘dynamic systems’ may contain specific patterns that precede andsignal an upcoming phase-shift or transition to a new stable state, possiblyat meta level. Rather than trying to find such early-warning signals, our re-search objective had a more modest goal: we focus our attention on detectingand analysing citation patterns of papers in the world’s scientific literatureacross a two or three year time-span. However, even in retrospect, the precisemoment of a breakthrough is often impossible to pinpoint on any time scale.We therefore take the publication date of the seminal research paper as timereference in order to determine a discovery’s entry into the science system.
6.1.3 Research framework and detection algorithms
Various types of literature search-methods exist to track and trace high-impactpapers. High-impact papers in this context receive an above-average numberof citations when compared to other publications in the same field and timeperiod. Without additional information, particularly the opinion of subjectexperts, these methods are unable to conclude whether a high-impact pa-per really presents a breakthrough in science as the information providedby these methods is in principle first evidence based on quantitative consid-erations. This unavoidable restriction holds for methods like the algorithmpresented in (Redner, 2005), in which a set of citation counts is introducedthat, in Redner’s opinion, identify ‘breakthroughs’ in science, and for themethods used by Schneider and Costas (2014). The algorithms come upwith what we dub ‘breakout’ papers. Thomson Reuters’ (TR) concept of ‘hotpapers’ which represents another early detection method. These ‘hot’ pa-
103

Validation study
Figure 6.1: Overview of conceptual and analytical framework
pers are selected by virtue of being among the top 0.1% of the most highlycited papers in a current bimonthly period within their field of science (seehttp://archive.sciencewatch.com/about/met/core-hp/). Most of these paperseventually qualify as ‘citation classics’, i.e. they continue to be cited signi-ficantly over time. TR identifies hot papers in four of the areas (Physiologyor Medicine, Physics, Chemistry, and Economics) for which Nobel Prizes areawarded. This information is supplemented with information about the ‘No-bel Prize history’ for both the papers and the authors (Pendlebury, 2015). TRpublishes on its Science Watch website (http://ScienceWatch.com) - an openWeb resource for science metrics and research performance analysis - underthe heading ‘Predictions’ what TR sees as candidates that might be awardeda Nobel Prize.
Ponomarev et al. (2014b) studied the dynamics of fast-growth citation im-pact. A key question they asked is whether the use of the interdisciplinarityin scientific fields of the referenced and cited papers, or the geographical di-versity in the affiliations of the authors of citing papers, could improve theidentification of ‘breakthrough paper candidates’ (Ponomarev et al., 2014a).All these detection algorithms are designed to identify breakout papers. Somemethods focus on identifying papers as quickly and as reliably as possible,after their publication, as breakout papers. The underlying implicit assump-tion is that only a small subset of these papers are likely to be generallyaccepted scientific ‘breakthroughs’. Our ‘early warning algorithms’ also fit inthis citations-based analytical approach. Clearly, the various algorithms mayidentify the same breakout papers. We will test this assumption by comparingthe results of our set of algorithms with those of Redner’s algorithm (Redner,
104

6.1 Introduction
2005). Figure 6.1 presents a stylized overview of the conceptual framework,and shows possible overlap between the search results produced by the vari-ous detection methods.
In this study we test five algorithms to identify breakout papers at anearly stage. These algorithms were developed as outcomes of a series of fourcase studies in which we analysed the citation patterns of scientific discov-eries that subject experts regarded as breakthroughs. These studies wereon: HIV/AIDS medicine (Winnink and Tijssen, 2014), Graphene (Winnink andTijssen, 2015), Introns (Winnink et al., 2013), and Ubiquitin-mediated proteo-lytic system (Winnink et al., 2015). In each case we went beyond straight-forward ‘hot papers’ citation counting; we searched systematically for anykind of remarkable change in those citation patterns that characterised theunderlying breakout papers.
How generic are these algorithms in terms of their efficacy across all fieldsof science? This paper presents the test results, focusing on three researchquestions.
• Can the algorithms be used as a generally applicable method to identifybreakout papers, and if so under what data availability conditions?
• What are the similarities and differences between the algorithms in termsof their ability to detect breakouts?
• Can we determine the effectiveness of each algorithm in terms of identi-fying breakout papers that are generally regarded as breakouts and po-tential breakthroughs?
The next sections describe and interpret the main findings of our study, andthe general conclusions one can draw. Detailed information concerning theresults of this research is added to this manuscript as Supporting Informa-tion. References from the main text to tables and figures in the supportinginformation are Table 6.10, Figure 6.3 etc.
6.1.4 Data source and methods
Our bibliographic database consists of research papers extracted from CWTS’sin-house offline version of Thomson Reuters; Web of Science database (WoS).We selected all 2,715,651 papers published in the period 1990–1994 thatwere tagged with the WoS document types ‘article’ or ‘letter’. These doc-uments are most likely to report on ‘original research’. We opted for thetime period 1990–1994 to track the effect of a discovery over an extendedperiod of time, and to verify and validate whether selected papers are cur-rently – in retrospect – (still) regarded as breakouts or breakthroughs. Forreasons of citation impact normalisation, we adopt two publication-based de-lineations of scientific disciplines: (1) ‘Categories’, the equivalent of ThomsonReuters’ subject categories – information on subject categories can be foundat ‘http://ip-science.thomsonreuters.com/cgi-bin/jrnlst/jlsubcatg.cgi?PC=D’,and (2) ‘Clusters’ derived from a citation-based clustering algorithm developedat CWTS (Waltman and van Eck, 2012); we refer to this method as the ‘CWTSdocument clustering method’. Each of the 251 Categories comprises a set of
105

Validation study
entire WoS-indexed journals; the 865 Clusters each consist of large numbersof individual research papers. In line with other scholars we assume thateach these disciplines is: “. . . an area of science consisting of the followingelements: a central problem, a domain consisting of items taken to be factsrelated to that problem, general explanatory factors and goals providing ex-pectations as to how the problem is to be solved, techniques and methods. . . ” (Darden and Maull, 1977).
To narrow down our search, we selected those papers that belong to thetop 10% most highly cited during the first 24 months after publication perCategory or Cluster per year. The Categories subset contains 253,558 highlycited papers, Clusters subset is comprised of 214,827. Table 6.1 presentssummary statistics of both datasets. All computations and analyses werecarried out separately on both datasets.
6.1.5 Breakout detection algorithms
Our algorithms meet the following general specifications: (1) directly derivedfrom data-analytical results in our case studies; (2) systematically applicableacross the Web of Science; (3) systematically applicable at the level of indi-vidual research papers; and (4) their implementation does not require anyspecial pre-processing of WoS-based bibliographical data. We developed five‘general purpose’ algorithms, each representing a specific characteristic ofcitation impact patterns:
• Application-oriented Research Impact (ari): citations to the breakoutpaper come in majority from papers within the application-oriented do-mains of science (application-science papers), whereas the breakout pa-per is in the discovery-science domain (discovery-science papers);
• Cross-Disciplinary Impact (cdi): citations to the breakout papers comefrom an expanding number of science disciplines;
• Researchers-Inflow Impact (rii): influx of new researchers citing thebreakout paper;
• Discoverers-Intra-group Impact (dii): citations to the breakout paper areconcentrated within papers mainly produced by members of the sameresearch group that produced the breakout paper;
• Research-Niche Impact (rni): the breakout paper and its citing papersare tightly interconnected within a small research domain.
Further details of each algorithm are presented below. ari, cdi and riiare more likely to identify Charge discoveries (i.e. solving well-known andwell-defined problems – Kuhn’s normal science), while dii and rni are betterequipped to find Challenge discoveries (i.e. explaining strange, unexpectedphenomena – Kuhn’s revolutionary science). As for Chance discoveries andbreakthroughs, given their random nature, we discarded the search for gener-ally applicable algorithms that may systematically identify such cases withina short time-span.
106

6.1 Introduction
ARI algorithm (Application-oriented Research Impact)
The purpose of this algorithm is to identify papers that describe new know-ledge on the boundary of ‘discovery-oriented science’ and ‘application-orientedscience’ (Tijssen, 2010). The algorithm emerged from the case study in whichwe noticed remarkable shifts over time in the ratio of citations from discovery-science papers and applied-science papers in the field of Introns (Winnink andTijssen, 2013). The focus is on papers having a substantial list of referencesand are highly cited within the first 24 months after publication. The ma-jority of the referenced papers focus on ‘discovery-oriented science’, whereasthe citing publications focus mainly on ‘application-oriented science’. Eachbreakout paper should meet the following selection criteria that are based onall papers in the Category and Cluster document sets:
• Number of cited papers ≥30, this is the lower boundary for the topdecile of the number of original-research papers in the reference lists;
• Number of citing papers within 24 months ≥ 49, this is the lower bound-ary for the top decile of the number of citations received within the first24 months by the most-highly-cited papers;
• Number of citing papers > number of cited papers;• Majority of the cited papers focus on ‘discovery-oriented science’;• Majority of the citing papers focus on ‘application-oriented research’.
CDI algorithm (Cross-Disciplinary Impact)
This algorithm captures the diffusion of citing sources among multiple re-search disciplines. We expect to find breakout papers that are cited by anincreasingly larger number of disciplines over time. The level or cross-disci-plinary impact is defined as the number of different disciplines (either Cat-egories or Clusters) that are assigned to each of the citing papers. Given themore homogenous disciplinary composition of each Cluster, as compared toeach Category, one would expect less interdisciplinary citation flows betweenClusters. This aspect is especially noticeable during the first few years afterpublication, as is illustrated in the support information in Figure 6.6 andFigure 6.7. Breakout papers meet the following lower threshold values percitation time window, and that are based on the values for the ‘Hazuda paper’(Hazuda et al., 2000) , which is central in our case study of HIV/AIDS research(Winnink and Tijssen, 2014):
• Categories: 1 year: >9 citing disciplines; 2 years >17 disciplines; 3 years>24 disciplines;
• Clusters: 1 year: >2 citing disciplines; 2 years >5 disciplines; 3 years >8disciplines.
RII algorithm (Researchers-Inflow Impact)
Our case study of Graphene research (Winnink and Tijssen, 2015) identifiedpapers that attract a remarkable increase in different citing researchers. Herewe expect to identify breakout papers that have an impact on an increasingly
107

Validation study
large community of research-active scholars in the research domain. Focusingon the annual number of these unique authors, who are first-authors on citingresearch papers, we measure the inflow rate by comparing the increase in thenumber of researchers at the end of the 1st year after publication, and atthe end of the 3rd year. Selected papers should show an increase of at least52 new citing first-authors. This threshold results from the increase in newciting first-authors between the end of the 1st year after publication, and atthe end of the 3rd year for the paper on the Graphene discovery (Novoselovet al., 2004), which was central in the analysis shown in (Winnink and Tijssen,2015).
DII algorithm (Discoverers-Intra-group Impact)
In our study of Ubiquitin research (Winnink et al., 2015), we find that thebreakout papers that describe the breakthrough received most of its cita-tions, within the first two years, from papers (co) authored by authors fromthe same ‘core group’. The discovery is at first predominately recognizedand built upon by members of the same group. This algorithm is designedto find breakout papers where many citations are from papers with authorsthat share co-authorship relationships with the cited authors. The followingselection were applied:
• 90% of the citations are ‘within-group’ citations;• Within-group papers are defined as papers of which at least 66% of the
authors belong to the core group. This specific lower threshold avoidsthe inclusion of those papers for which only one member of a smallgroup — 3 or 4 members — is (co) author;
• The minimum size of a core group is three, which value is chosen toguarantee that in combination with the above-mentioned 66% threshold,only papers written by at least two authors of the core group are con-sidered;
• Citations are tracked within the first two years after publication.
RNI algorithm (Research-Niche Impact)
This algorithm, also originating from the Ubiquitin case study, searches forsets of citing and cited papers, within Categories or Clusters, with above-average rates of citation-interconnectedness. A breakout paper creates a ‘cita-tion knot’, i.e. a set of papers that cite the breakout paper but also cite atleast one ‘auxiliary’ paper with direct citation ties to the breakout paper. Thisclosely-knit set of citing and cited papers represents a ‘research niche’. Thenext threshold values are determined by analysing for the period 1980–1982the network of papers citing the two breakthrough papers from 1980 that inconjunction describe the ubiquitin discovery (Winnink et al., 2015).
• The number of citations received by the breakout paper, within thisniche and within the first year, is larger or equal to three times thenumber of interconnected papers within a citation cluster;
108

6.2 Robustness of the algorithms
• The lower threshold for the number of breakout-related papers in the‘citation knot’ is 8.
6.2 Robustness of the algorithms
We define ‘robustness’ as the ability of each algorithm to identify the samebreakout paper(s) irrespective of the total number of citations a paper re-ceived within two years. We tested the robustness empirically by implement-ing citation count thresholds of 1, 2, 4, . . . , 1024 citations. in Table 6.1 wepresents a subset of the findings for threshold values of 1, 4, 16, 64, and 256citations. For all threshold values the results are presented in Table 6.13 andTable 6.14.
The rii and cdi detection algorithms manage to capture many break-outs, and are most effective for both datasets (Categories and Clusters) be-cause these algorithms focus on the more frequently occurring of discoverytype ‘Charge’. The cdi rates are much higher in Clusters because the CWTSdocument-clustering method groups documents together on the basis of cita-tion relations. These document-clusters may contain papers from multipleWoS subject categories; this means that diversity is in fact already achievedwithin a cluster, thereby reducing inter-cluster relations. The consequenceis that a different and lower threshold level is used when cdi is applied toClusters. In the long run, this ‘vanishing diversity’ effect largely disappears,as is shown in Figure 6.6 and Figure 6.7.
ari and especially rni are much more targeted towards rarer types ofbreakouts, because ari focuses on breakouts that bridge the gap betweendiscovery-oriented science and more application-oriented science.The focusof rni is on areas where the fabric of the citation network is more dense.dii sits between these extremes, but is by far the most threshold-sensitivealgorithm, within both Categories and Clusters; it ceases to be effective abovethe threshold of 16 citations. By virtue of their search criteria, dii and rniwork best within social networks and micro research areas with low-citationlevels.
In contrast, the breakout hit rate of rii is only affected by higher (≥ 64)values of the threshold, which follows directly from the requirement that inorder to be selected as a breakout paper, it has to be cited by at least 52 pa-pers within 24 months; this high threshold for rii is explained above. Theperformance of rni is only slightly threshold sensitive until a threshold of 64citations. rni is a very selective algorithm as it searches for sets of citing pa-pers with relatively large numbers of cross-citation relationships. The resultsare identical for Categories and Cluster, and decrease above the threshold of64 citations within 2 years. ari selects four times more papers in Categoriesthan in Clusters. In the section on ‘Discussion and overall findings’ we give apossible explanation for this phenomenon.
cdi-generated hit rates are significantly affected within Clusters, althoughthe number of identified breakouts remains large, because of the already dis-
109

Validation study
Table 6.1: Robustness of algorithms
CategoriesLower threshold for the number of
citations within 24 months
1 4 16 64
Total number of papers above threshold 253,558 238,009 53,014 2,996
Number of breakout papers detected
Application-oriented Research Impact(ari)
264 264 204 0
Cross-Disciplinary Impact (cdi) 1,276 1,276 1,275 924
Researchers-Inflow Impact (rii) 3,543 3,543 3,543 2,891
Discoverers Intra-group Impact (dii) 577 410 2 0
Research-Niche Impact (rni) 19 19 19 13
ClustersLower threshold for the number of
citations within 24 months
1 4 16 64
Total number of papers above threshold 214,827 201,514 51,666 2,926
Number of breakout papers detected
Application-oriented Research Impact(ari)
60 60 60 0
Cross-Disciplinary Impact (cdi) 13,477 13,477 12,096 2,320
Researchers-Inflow Impact (rii) 3,501 3,501 3,501 2,857
Discoverers Intra-group Impact (dii) 674 483 2 0
Research-Niche Impact (rni) 8 8 8 7
Figure 6.2: Share of papers recognised as breakout as a function of thethreshold value applied on Categories
110

6.2 Robustness of the algorithms
Table 6.2: Performance of the algorithms on the two datasets
Number ofbreakout papers
identified
of whichmatched by
one algorithm
of which alsomatched by oneor more of the
other algorithmsCategories
Total 4,946
ari 264 99.6% 0.4%
cdi 1,276 21.2% 78.8%
rii 3,544 71.4% 28.6%
dii 577 99.8% 0.2%
rni 19 31.6% 68.4%
Clusters
Total 15,074
ari 60 50.0% 50.0%
cdi 13,477 78.9% 21.1%
rii 3,544 20.8% 79.2%
dii 674 100.0% 0.0%
rni 8 12.5% 87.5%
cussed way the datasets are constructed. In all, rii is robust up to a thresholdvalue of 32 citations, and for cdi and rni the robustness starts to break downat a threshold value of 16 citations. Beyond this threshold value the hit ratesstart to decrease (see Table 6.13 and Table 6.14). For ari this hit-rate break-down starts for Categories at a threshold value of 8, but for Clusters at 16 –the same value as for cdi and rni. The dii algorithm should be considerednot to be robust, as its hit rates already start to decrease at a threshold valueof 2 citations.
As an indication of the performance of the algorithms, we calculated onthe basis of both datasets for each algorithm the number of papers recog-nized uniquely by an algorithm as well as the number of papers recognizedby multiple algorithms. Table 6.2 presents the results of these calculations.We observe that, except for rii, the performance of the algorithms varies forthe datasets when measured in absolute numbers of breakout papers. Thistable also shows the ability of each of the algorithms, regardless of the data-set, to select papers that are not selected by any of the other algorithms thatwe developed. Because papers can be selected by multiple algorithms thetotal count is not an add-up of the counts for the individual algorithms.
Figure 6.2 shows the performance of the algorithms as a function of thethreshold values applied on Categories. For Clusters this behaviour is visu-alised in Figure 6.11. Both cdi and rii select above a threshold value of 128almost all documents, and reach the 100%-level for higher threshold values.
111

Validation study
6.3 But is it a breakthrough?
As explained above, there is no objective measure to qualify or classify ascientific discovery, or its underpinning papers, as a breakthrough. Con-cepts or criteria from information science cannot be used because there isno straightforward or transparent heuristics for decision-making. One has torely on assessments based on expert opinion and therefore accept a degreeof subjectivity. Various assessment methods, each with relatively high levelsof inter-rater reliability, offer guidance. The following additional verificationmetrics were used:
1. Papers documented to be relevant for awarded Nobel Prizes. If a No-bel Prize in physics, chemistry, or physiology or medicine is awardedfor a single discovery or invention it considered a ‘breakthrough’. Thesingle publication or group of closely related publications in which sucha discovery is presented signal this breakthrough;
2. Occurrence of a paper on Nature‘s ‘Top-100 list of papers most citedever’ (van Noorden et al., 2014). The papers appearing in this list ofpublications are considered by the scientific community of particularimportance. Not all papers on this list are scientific breakthroughs asis mentioned in one of the comments to this Top-100 list (Padhi, 2014).Although these papers do not display breakthroughs in science by defin-ition, experts are able to judge if a paper presents a scientific break-through;
3. The number of times a paper is cited in WoS-indexed review papers;review papers provide an overview of the developments that occurredin a topical field of science over a certain period of time. Of all scholarlypapers of types articles and letters published between 1990 and 1994review papers cite 50%; this equals 62% of the papers that are cited atleast one time. Special attention should be given to papers that arehighly cited for instance papers belonging to the Top 1% (Table 6.4);
4. The number of times a paper is cited in worldwide social media (2012–2014). We conclude that a breakout paper stands out when it is still citedin social media 20 years after publication (1990–1994). Such scholarlypapers should be at least looked at to see if they are really special;
5. The number of times a paper is cited in patents. Scholarly papers citedin patents bare relevance to the invention described in the patent, andare part of the scientific basis for the developments in a field of techno-logy. In total 6% of the scholarly papers are cited in patents. Based on henumber of times cited by patents 11 out of the 60 papers from the ‘testset’ belong to the top 2% percentile. Citations to scholarly publicationsin patents link the two domains ‘science’ and ‘technology’. From thesecitations alone the conclusion can be drawn that the paper is interestingenough to be classified as a break out publication.
112

6.3 But is it a breakthrough?
Awarded Nobel Prizes
Perhaps the best known of these are the annually awarded Nobel Prizes forinternationally outstanding scientific achievements. We found eight awardedNobel Prizes where scholarly work published between 1990 and 1994 wasseen by the Nobel Prize committee as being of seminal importance. Five ofthose cases involve at least one of our identified breakout papers, now verifiedas a ‘breakthrough’ paper. Detailed information is presented in Table 6.16.
Nature’s ‘Top-100 list of papers most cited ever’
As a general frame of reference to assess the performance of the algorithms,we use Nature’s ‘Top-100 list of papers most cited ever’, published in 2014by Van Noorden and co-workers (van Noorden et al., 2014), which providesa list of the 100 most cited papers of all times. The top 100 include 13 ofour breakouts (Table 6.15). The bibliographic information for these papersis presented in Table 6.18. Two of those 13 papers (Laskowski et al., 1993;Moncada et al., 1991) are not included in our tests because of their docu-ment types ‘software review paper’ respectively ‘review paper’, which wereexcluded from our analysis.
Additional verification metrics
We apply three additional methods, numbers 3–5 in the list discussed in theforegoing section, to help verify our identified breakout papers - all are basedagain on citation impact. But now these citations are from sources other thanthe WoS: patents and social media. For reasons of resource constraints ourverification study cannot be applied to the full set of breakouts, but was donewithin a small sample of breakout papers. These were selected by applyingthe five algorithms to the two datasets (Clusters and Categories) separately.From each of these 10 applications, we selected the top-10 most cited papersin terms of citation count frequencies. This test set included 60 unique papers(40 of the 100 papers occurred more than once), of which 25 occur both inCategories and in Clusters, 20 exclusively in Categories, and 15 are foundonly in Clusters. The bibliographic information of these papers is providedin Table 6.19.
Table 6.3 presents the test results, highlighting the ability of the rii andcdi algorithms to identify Nature’s Top 100 most-cited publications. Moreimportantly, all these breakouts were also cited in at least one review pa-per. Patents also cite more than half of all breakouts detected by the rii,cdi and rni algorithms, thus giving an indicator of the technological impactof the scientific discovery. These three algorithms also captured breakoutsthat generate, or still generate, a wider societal impact, when measured onthe basis of social media (‘altmetrics’) for the years 2012–2014. The CWTS’social media database contains social-media data related to Internet blogs,news, Twitter and Facebook messages collected from the altmetric database
113

Validation study
Table 6.3: Performance of algorithms within the test set
Breakoutpapers
of which inNature’s
Top-100 list
of which citedin
review papers
of which citedin patents
of which citedin
social media
ari 15 0 15 7 0
cdi 33 11 33 25 10
rii 26 8 26 20 9
dii 16 0 16 2 0
rni 12 0 12 6 4
provider Altmetric.com (http://www.altmetric.com) The two ‘large-output’ al-gorithms in Table 6.3 (rii and cdi) manage to produce the largest number ofverified breakouts.
The algorithms developed in this study are constructed on the basis ofthe outcomes of case studies. One of the criteria used to select cases wasthat the scientific breakthrough discoveries resulted in new technological de-velopment, as shown by the occurrence of citations from patents. In this waythe algorithms may contain in an implicit form a link between science andtechnology that could explain the occurrence of patent citations. Table 6.4displays characteristics of the breakout papers identified by each algorithm.The detailed results are presented in Table 6.17. In Table 6.18 we commenton all 60 papers in the test set, and present the bibliographic information forthese papers in Table 6.19.
Applying each of the algorithms to the test set results in two groups ofdocuments for each algorithm. One group contains the papers that are se-lected (breakout papers), and the other group the papers not selected (non-breakout papers). To search for differences in the characteristics of the docu-ments in both groups, the share of papers belonging to the top 3% percentilesis used. As the often-used top 10% percentile did not show differences in be-haviour between breakout and non-breakout papers, we chose to use the top3% percentile. These top 3% percentiles are based on the distribution of thenumber of citations received from the different sources by all papers (lettersand articles) published in 1990–1994 that are covered in the WoS database;Table 6.5 shows the results.
Redner‘s algorithm
We implemented the algorithm to identify breakthrough papers published byRedner (2005), and use it as another benchmark for our algorithms. Rednerargues the choice of the parameters as “. . . I arbitrarily define a discovery pa-per as having more than 500 citations and a ratio of average citation age topublication age of less than 0.4 . . . ”. The concepts ‘average citation age’ and‘publications’ age are best illustrated with the following example. A public-ation published in 2000 is cited 1 time in 2005 and two times in 2010. Theaverage citation-age is in this case 8.33 years: (1×5)+(2×10)
3 , because 1 cita-
114
6.3 But is it a breakthrough?
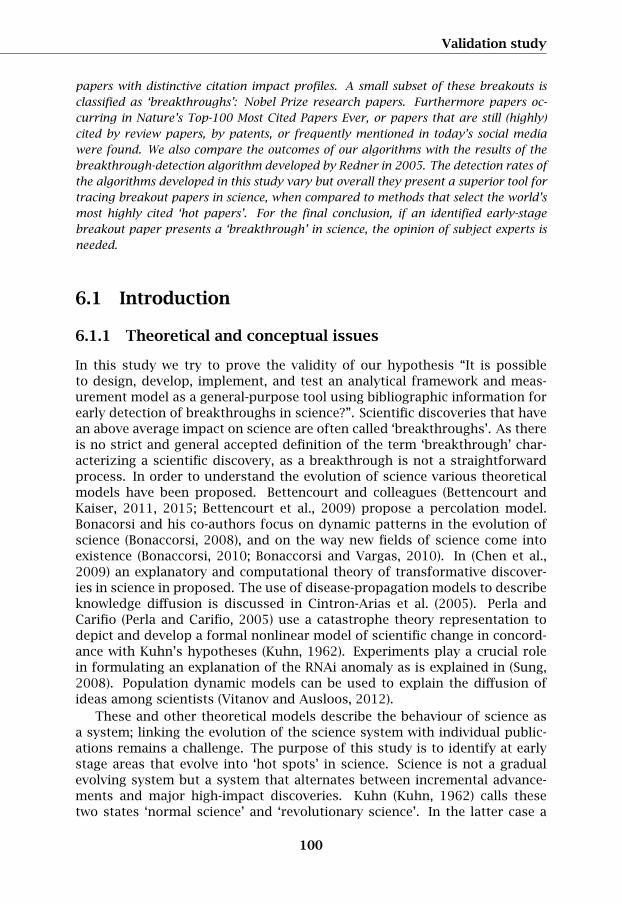
Table 6.4: The citation impact of the breakout papers based on the numberof citations received from three different citing sources. The classification isbased on the distribution of the numbers of citations received by all papers(letters and articles) published in the period 1990–1994 and covered in theWoS database.
Number ofbreakoutpapers
Citation impact (Percentile boundary)
Not cited insource
Low(≤ 70%)
Medium(70–97%)
High(97–98%)
Very high(≥ 99%)
Citing source: patents
ari 15 8 3 3 1 0
cdi 32 8 2 9 5 8
rii 26 6 2 7 4 7
dii 16 14 1 1 0 0
rni 12 6 1 3 1 1
Citing source: review papers
ari 15 0 0 1 5 9
cdi 32 0 0 0 1 31
rii 26 0 0 0 1 25
dii 16 1 5 9 1 0
rni 12 0 1 0 1 10
Citing source: original research papers
ari 15 0 0 0 2 13
cdi 32 0 0 0 1 31
rii 26 0 0 0 0 26
dii 16 0 2 13 1 0
rni 12 0 0 0 0 12
Table 6.5: Characteristics of the breakout and non-breakout papers in thetest set as a percentage of papers that belong to the top 3% percentile for allpapers (articles and letters) based on the number of citations received fromthe different sources.
Cited byreview papers
Cited bypatents
Times citedwithin 24 months
Breakoutpapers
Non-breakoutpapers
Breakoutpapers
Non-breakoutpapers
Breakout papers
ari 93% 64% 7% 27% 100%
cdi 100% 39% 41% 0% 100%
rii 100% 50% 42% 6% 100%
dii 6% 95% 0% 30% 6%
rni 92% 67% 17% 23% 100%
115

Validation study
tion is from 2005 and 2 citations are from 2010. The ‘publication age’ is (5years + 10 years) = 15 years. We applied this algorithm to all papers of typesarticle and letter from the period 1990–1994. No restrictions on the citation-windows or the minimum number of citations were imposed. In Table 6.12 weshow the number of papers in both data sets Categories and Clusters that areselected by Redner’s algorithm, and also the overlap between this algorithmand our algorithms. In our opinion is what we call a ‘breakout’ identical towhat Redner calls a ‘breakthrough’.
The robustness of Redner’s algorithm is tested in the same way that theother algorithms are tested. We show the results in Tables 6.13 and 6.14, andin Figure 6.7 and Figure 6.8.
Classification of breakouts
We classified the results of the algorithms across the two dimensions (1) thenumber of times cited by review papers and (2) the number of times citedby patents. Because the distribution of papers with a certain number of cita-tions is skewed we focus on the Top 10% of the distribution. The top 10%percentile is subdivided into three ranges. In the analyses we use a groupingwith the following four classes (1) ‘< Top 10%’ = [0.0-90.0)%, (2) ‘Top 10%’=[90.0-95.0)%, (3) ‘Top 5%’= [95.0-99.0)%, and (4) ‘Top 1%’= [99.0-100.0]%. (seealso Table 6.31). Table 6.7 shows that nearly 60% of the papers cited within24 months are not in the Top 10% for both dimensions. In Table 6.32 the ab-solute numbers are presented. For all publications from 1990–1994 the shareof papers outside the Top 10% simultaneously on both dimensions exceedsthe 78% mark as is shown in the Tables 6.34 and 6.35. Based on this ana-lysis we conclude that the algorithms distinguish papers along the followingclassification:
1. Breakthroughs: publications that are part of the scientific basis of NobelPrize awarded discoveries.
2. Breakthrough by proxy’ publications that belong to the top 1% percentileon the basis of the number of citations from review publications and atthe same time to the top 1% percentile of the number of citations frompatents. These are the publication in the Top 1% row and at the sametime in the Top 1% column.
3. Science-oriented breakthrough by proxy: publications that belong to thetop 1% based on the number of citations from review publications butare not significantly cited from patents. These are the publications inthe Top 1% row
4. Technology-oriented breakthrough by proxy: publications that not par-ticularly highly by review publications but are in the top 1% based oncitation from patents. These are the publications in the Top 1% column
5. Breakout: a publication identified by at least one of the implementedalgorithms not belonging to one of the four types defined above.
6. Non-breakout: a paper not selected by any of the algorithmsIn Table 6.6 we show the distribution of all 1990–1994 (articles & letters)
116
6.3 But is it a breakthrough?
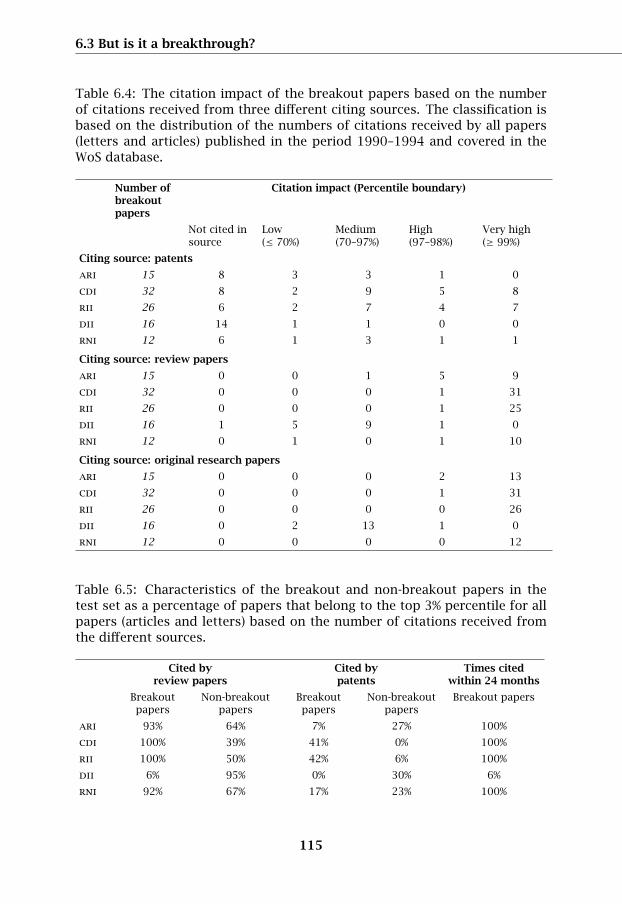
Table 6.6: Distribution of all 1990-1994 (articles & letters) identified as abreakout paper, along the two dimensions ‘cited by review papers’ and ‘citedby patents’. Based on citation counts from the moment of publication until2015. (n=1,805,245)
Citations by patents
Citations byreview papers
< Top 10% Top 10% Top 5% Top 1%
Top 1% 17.53% 10.46% 8.25% 2.40%
Top 5% 15.70% 6.71% 3.41% 0.63%
Top 10% 9.94% 2.67% 1.15% 0.15%
< Top 10% 16.49% 3.39% 0.98% 0.13%
Table 6.7: Distribution of all 1990–1994 (articles & letters) cited within 24months, along the two dimensions ‘cited by review papers’ and ‘cited by pat-ents’. Based on citation counts from the moment of publication until 2015.(n=408,292)
Citations by patents
Citations byreview papers
< Top 10% Top 10% Top 5% Top 1%
Top 1% 0.79% 0.13% 0.09% 0.03%
Top 5% 8.11% 0.41% 0.18% 0.03%
Top 10% 29.07% 0.52% 0.18% 0.02%
< Top 10% 59.44% 0.73% 0.23% 0.03%
Table 6.8: Effect of applying the algorithms to the complete dataset withpapers (articles, letters) from 1990–1994 A ‘+’ indicates that share of papersin this category increased, and a ‘-’ that it decreased as result of the selectiondone by the algorithms.
Citations by patents
Citations byreview papers
< Top 10% Top 10% Top 5% Top 1%
Top 1% + + + +
Top 5% - + + +
Top 10% - + + +
< Top 10% - + + +
117

Validation study
identified as a breakout paper, along the two dimensions ‘cited by review pa-pers’ (rows) and ‘cited by patents’ (columns), and in Table 6.7 the informationfor publications from 1990-1994 identified as a breakout is presented. Com-paring the information in these two tables shows the effect of applying thealgorithms – the share of papers in the Top 10% percentiles increases. InTable 6.8 this effect is illustrated; a ‘+’ in a cell means that after applyingthe algorithms the concentration of the papers in this cell is higher than incomparable cell in the total dataset, and a ‘-’ means that the concentrationis lower. The algorithms succeed in selecting at early stage papers that after20+ years belong to the papers highly cited by review papers, and by pat-ents. Detailed information for all publications from 1990–1994, the papersidentified as a breakout and those not seen as a breakoout are shown in theTables 6.32–6.40. For the papers from 1990–1994 that are not cited withinthe first 24 months after publication ≈ 85% of the papers is outside the Top10% percentiles. The data illustrates that no major error is made by not in-cluding papers that are not cited within 24 months, as even after 20+ yearsmost these publications stay low cited, and do not fulfil the criteria to be seenas a breakout publication.
6.4 Discussion and overall findings
6.4.1 Number of citation at early stage as predictor for thetotal number of citations
Adams (2005) found that in general it is likely that a publication that is highlycited at early stage is also highly cited in the long run. In this study we findthat a similar relation holds for citations a publication receives from reviewarticles. Wang et al. (2013) built a model that adequately predicts the num-ber of citation a publication will receive based on the number of citation inthe first 5 years and conclude “Although additional variables combined withdata mining could further enhance the demonstrated predictive power, anultimate understanding of long-term impact will benefit from a mechanisticunderstanding of the factors that govern the research community’s responseto a discovery.”
6.4.2 Citations from review articles
The breakthrough publications that form the basis of the four case studies(HIV/AIDS, Graphene, Ubiquitin, and Intron) received from review articleswithin 24 months minimal 4 citations, and until the beginning of 2016 atleast 73. Of the papers in the validation test-set 32 belong to the top 1%percentile based on the citations from review papers received within the first24 months after publication. These 32 publications in the top 1% percentileafter 24 months are also in the top 1% in the beginning of 2016. We classify
118

6.4 Discussion and overall findings
Table 6.9: Key figures for Clusters and Categories
DatasetTotal number
of papers
of whichdiscovery-science
papers (share)
Categories 253,558 91,775 (36%)
Clusters 214,827 87,061 (41%)
In Categories and in Clusters 160,943 62,767 (39%)
In Categories not in Clusters 92,785 29,008 (30%)
In Clusters not in Categories 53,965 24,924 (45%)
publications that are highly referenced by review articles – belong to the top1% percentile – as potential breakthroughs.
6.4.3 The algorithms
Based on the concept of what characterizes a breakthrough we implemen-ted and tested the following five breakout detection algorithms ‘Application-oriented Research Impact’ (ari), ‘Discoverers Intra-group Impact’ (dii),‘Researchers-Inflow Impact’ (rii), ‘Cross-Disciplinary Impact’ (cdi), and‘Research-Niche Impact’ (rni). The ari, cdi, and rii algorithms were de-veloped to identify ‘Charge’-type breakouts, and dii as well as rni focus onthe detection of ‘Challenge’-type breakouts. It appears, based on the num-bers of breakout papers as presented in Table 6.2, that the algorithms makeup three distinct groups. The algorithms rii and cdi that select the largestnumbers of breakout papers populate one group. dii forms a second groupby itself with an intermediate number of breakout papers. The third groupis formed by the rni and ari algorithms that select the smallest numbers ofpapers.
The performance of ari on the two datasets (Clusters and Categories) dif-fers; it detects four times as many breakout papers in Categories as it does inClusters. ari searches for papers that are supposed to act as bridges betweendiscovery-oriented science and application-oriented science. An analysis ofthe share of discovery-science papers in both datasets, their intersection, anddifferences are shown in Table 6.9.
Approximately 36% of the papers in the source data set are character-ised as discovery-science oriented. Table 6.9 also shows that the share ofdiscovery-science papers is above this average for Clusters and equal to thisaverage or Categories. This finding in combination with the fact that thenumber of discovery-science papers is 5% lower in Clusters as compared toCategories makes that the behaviour of ari seems to be counterintuitive. Asthe datasets are constructed from the same data source by a conceptuallyequivalent method - for each year and for each category or cluster the top10% of papers most cited in the first 24 months after publication - the differ-ence in performance of ari on both datasets must be caused by a side effectof the applied selection method. Assuming that the probability for a paper
119

Validation study
to be selected only depends on the citation characteristics of a paper the per-formance difference of ari by a factor 4 is not caused by the difference inthe number of discovery-science papers in both datasets as is illustrated inTable 6.9. The five factors that we believe play a role in this ‘ari anomaly’ are:
1. The document selection process distributes the papers among 823 clus-ters (out of 865), and among 199 categories (out of 251). This resultsin an average of 106 discovery-science papers per cluster, and 461 percategory;
2. For 60% of the 199 categories, the share of discovery-science papers isabove the overall average of 36%; for the 823 clusters this share is equalto the overall average;
3. Discovery-science papers receive within 24 months on average 4.7 cita-tions compared to 3.8 for application-science papers;
4. Papers can have more than one ‘subject category’ – on average 1.5 –assigned to them, but can be a member of only one document cluster.Therefore the same paper might occur multiple times for different cat-egories during the selection of documents for Categories, thereby pre-venting other papers from being selected. The selection method we ap-ply to build the Categories dataset may select the same paper for dif-ferent categories. Hereby providing a bias towards highly cited papersto which multiple categories are assigned. In this way preventing otherless cited papers to be selected;
5. On average fewer subject categories are assigned to discovery-sciencepapers than to the more applied-science oriented papers.
In our opinion these factors in combination with the method of constructingthe two data sets mean that higher cited discovery-science papers are pre-ferred in the selection of papers for Categories, and thereby account for thehigher performance of ari on Categories than on Clusters.
The dii algorithm is the most sensitive of our five algorithms for thresh-olds imposed on the data. As ‘Charge’ breakouts are the more common vari-ant, because there is no change in the theoretical framework or paradigmshift involved, it comes as no surprise that rii and cdi are the algorithmsthat select the most papers as a breakout. There is no ‘overall winner’ amongthe algorithms due to the fact that each is developed with a particular typeof breakthrough paper in mind. But the conclusion that a breakout paperreally presents a breakthrough must be based on information other than bib-liographic information. The fact that the cdi algorithm behaves differentlyon both datasets is to be expected. This difference in behaviour is caused bythe different definitions used in both datasets for the ‘discipline’ concept.
Comparing with Redner’s algorithm
The method proposed by Redner takes into account all citations, whereas thealgorithms we developed focus on the citation dynamics of a paper within 24–36 months after publication. Except in the case of the dii algorithm - there isoverlap between the results of our algorithms and Redner’s algorithm, some-
120

6.4 Discussion and overall findings
times a very small one; for details we refer to Table 6.12. Redner’s algorithmselects 6,150 papers in Categories and 6,311 in Clusters; 5,907 of these pa-pers belong to both datasets, 243 belong only to Categories, and 404 only toClusters. From this we conclude that the performance of Redner’s algorithmis largely independent of the dataset to which the algorithm is applied. Thisresult is expected, as ‘disciplines’ are not addressed in Redner’s algorithm,and therefore the differences are caused by differences in the contents of thedatasets.
Redner’s algorithm identifies in total 36 of the 60 papers in the test set.In Table 6.17 detailed information is provided for all 60 papers in the testset. In 12 cases the cdi algorithm when applied to the Clusters-set selected apaper, but not when applied to the Categories dataset; the coloured fields inTable 6.15 and Table 6.17 indicate these cases.
Overall findings:
• All our detection algorithms are able to identify breakout papers.• Some of the breakout papers also stand out in citations given in patents
and review papers, and are cited by social media sources;• The analysis of the datasets Categories and Clusters shows the ability of
each algorithm, regardless of the dataset, to select papers that are notselected by the other algorithms;
• The outcomes of the robustness calculations (Table 6.13, Table 6.14,Figure 6.8, and Figure 6.12) show that the algorithms cdi, rii, and rniare the ones that - up to a threshold value of 32 citations - are almostunaffected by the value of the threshold;
• The five algorithms combined identified all 11 papers of WoS-type ‘art-icle’ or ‘letter’ that were published in the period 1990–1994 and occurin Nature’s ‘Top-100 list of most cited papers ever’;
• For five of the eight Nobel Prizes in Chemistry, Physics, and Physiologyor Medicine for which scholarly work published between 1990 and 1994forms the scientific basis, at least one of the founding papers was de-tected;
• In the test set 42 out of the 60 papers in the test set belong to the Top2% of papers based on the number times cited in review articles, and 35(58%) belong to the Top 0.5%;
• Half of the 60 papers in the test set are cited in patents, and thereforeprovide a link between science and technology;
• Except for one algorithm (dii) the selected papers are ‘high’ or ‘very high’cited by review papers, they are cited in patents, and received citationswithin 24 months;
• Both ari and cdi perform different when applied to Categories andClusters; this is not the case for rii, dii, and rni.
• The results produced by our detection algorithms, except dii, and theresults produced by Redner’s algorithm show overlap as indicated inTable 6.12. We notice that Redner’s algorithm selects more publications.
121

Validation study
6.4.4 Conclusions
The aim of this study is to develop general applicable algorithms to capturethe dynamics of the diffusion of scholarly knowledge, and conclude at earlystage if a paper should be considered a breakout. To decide which of thedetected breakout papers really presents a breakthrough in science, we needadditional information, particularly expert opinions. Our basic assumptionis that the mechanisms responsible for a scientific discovery to evolve intoa breakthrough already provide characteristic signals in the bibliographic in-formation at an early stage. By focusing on the first 24–36 months afterpublication of a paper we ignore ‘sleeping beauties’ (van Raan, 2004, 2015).We also did not address the situation in which the citation profile of a paperat an early stage give the impression that it presents a ‘breakthrough’, thatat a later stage turns out not to be the case. An example is (Fleischmannand Pons, 1989) in which the authors claim the existence of nuclear fusionat room temperature -‘cold fusion’. It was almost immediately criticized, andit was concluded that “. . . According to our calculations, the experimentallymeasured excess heat can be accounted for fully by this chemical reaction. . . ” (Dmitriyeva et al., 2012).
The retraction of scientific publications is increasing, and the numberof retracted papers in Medline (: U.S. National Library of Medicine® (NLM)premier bibliographic database) reached the 1% level in 2006 (Cokol et al.,2008). Retracted publications however do not vanish from the scientific-knowledge base and are still cited even after their retraction, and in only 8%of the citations the retraction is mentioned (van Noorden, 2011). Retractedarticles live on in personal libraries and on the Internet (Davis, 2012). Pub-lications that at some point in time will be retracted are therefore in generalpresent in the data selected as input to the algorithms.
Within the context described above, this study addresses the followingthree objectives:
1. Construction of general-purpose algorithms to detect breakout papers;2. Comparison of the algorithms on their ability to detect breakout papers;3. Determination of the effectiveness of the algorithms in identifying break-
out papers.To do so we constructed and applied five different citation-based algorithms:‘Application-oriented Research Impact’ (ari), ‘Discoverers Intra-group Impact’(dii), ‘Researchers Inflow Impact’ (rii), ‘Cross-Disciplinary Impact’ (cdi), and‘Research Niche Impact’ (rni). These five algorithms can be divided intothree groups based on the breakout-detection specificity (recall rate). Group1 consists of the cdi and rii algorithms. For these algorithms the recallrate increases with increasing threshold values, and reaching above a certainthreshold value (64 for rii, and 128 for cdi) the situation where the algorithmselects all remaining papers. The second group consists of ari and rni. Thesealgorithms also show an increasing recall rate, but above a certain thresholdvalue (32 for ari, and 128 for rni) they break down and fail to select anydocuments. dii forms a group by itself as the recall rate continuously de-creases with increasing threshold values; detailed information can be found
122

6.4 Discussion and overall findings
in Tables 6.24 and 6.25, and is illustrated with Figure 6.10 and Figure 6.11.
The detection algorithm developed by Redner (2005) can be considered ahigh-performance algorithm and therefore falls in group 1 together with ourcdi and rii algorithms. For threshold values from 256 citations and above,these algorithms select the same documents as breakout papers.
For each algorithm we calculated (Table 6.26) the probability to select a pa-per as breakout paper in a dataset (Categories or Clusters) when no thresholdsare applied. Using these probabilities we calculated for each algorithm thenumber of breakout papers that is to be expected when different thresholdsare applied on the datasets. We also compared our results with the resultsobtained after applying Redner’s algorithm. The conclusion is that, except fordii, all algorithms select more papers than expected which means that thesealgorithms select ‘genuine’ breakout papers and are less sensitive to changesin the thresholds; details can be found in Tables 6.26–6.30. The behaviourof the dii algorithm is different as it focuses on work where the discoveryinvolves a paradigm-shift that starts within a small group of researchers; thecore group. Given the short measuring period after publication, the prob-ability for such a paper to get cited by authors outside of the core group islimited; therefore the number of papers selected by dii shows a sharp de-crease for larger threshold values.
The remarkable observation that rni, our ‘lowest-output’ algorithm, hassuch a high hit rate in terms of selecting breakout papers raises the question‘How effective is the rni algorithm in detecting breakthroughs?’ Further in-depth research is needed to answer this question as no definitive answer canbe given on the basis of the available bibliographic information.
As there is no objective measure to identify a breakthrough at early stage,we used the impact of the breakout papers as a measure. The findings in thisstudy suggest that the early detection algorithms that we developed provideadded value for tracing breakout papers. We tried to validate the outcomesof the algorithms against other information sources like Nobel Prize awards,Nature’s ‘Top-100 list of papers most cited ever’, and citations from patents,review papers and social media. The conclusion of this validation is that partof the identified breakout papers are considered to be important for devel-opments in science, and some of these papers might indeed be considereda breakthrough. We therefore conclude that our algorithms are able to de-tect important scientific papers at an early stage and provide opportunitiesto reap the benefits of new discoveries sooner; compared to simple citationcounts only; we believe that our algorithms have considerable added value inidentifying breakthroughs in science at early stage.
In our opinion we prove our hypothesis “It is possible to design, develop,implement, and test an analytical framework and measurement model as ageneral-purpose tool using bibliographic information for early detection ofbreakthroughs in science?” to be true. On-going and future research will alsoinclude further refinement of the current algorithms, investigation of the sim-ilarities and differences between the algorithms, and the construction of newalgorithms for early stage identification of breakout papers.
123

Validation study
6.5 Acknowledgments
We thank Professor Redner for answering questions on details of his algorithm,and our colleague Ludo Waltman for his help in applying the CWTS publication-clustering method to produce the dataset Clusters. We also like to thankDavid Pendlebury for providing insight into the method used by ThomsonReuters to identify Nobel prize class papers.
124

6.A Supplementary material
Appendix 6.A Supplementary material
This supporting information is organized in nine subsections:6.A.1 The datasets: Categories and ClustersDescribes the two datasets Categories and Clusters, and shows the distribution ofthe number of papers versus the number of citations received in 24 months for allpapers (articles, letters) published in 1990–1994 and the papers in the Categories andClusters dataset.
6.A.2 Effect of the CWTS document-clustering method on ‘multidisciplinarity‘This subsection illustrates the effect of the CWTS document-clustering algorithm,which is used to construct the Clusters dataset, on the ‘multidisciplinarity’ measure.
6.A.3 Overlap with Redner’s algorithmThe outcomes of Redner’s algorithm are compared with the outcomes of the five al-gorithms that make up the analytical framework.
6.A.4 Robustness of the algorithmsThis subsection shows the robustness of the five algorithms (ari, cdi, rii, dii, rni)developed in this study and Redner’s algorithm when applied to the datasets forClusters and Categories. It presents the overlap in the outcomes of the five algorithmsand those produced by Redner’s algorithm.
6.A.5 Performance of the algorithmsThe performances of the implemented algorithms was tested by looking at papersfrom 1990–1994 considered fundamental to Nobel Prize awarded research, or papersthat appear in Nature’s Top 100 list of papers most cited ever. In addition, a test setof 60 papers was used to examine citations from review papers, patents, and socialmedia (2012–2014).
6.A.6 Key figures of the papers in the test setIn this chapter the outcomes of applying the algorithms to the test set of 60 papersare further broken down.
6.A.7 Breakout detection specificity (recall rate) of the algorithmsThe recall rate for the algorithms is presented for various threshold values.
6.A.8 Detection probability and expected breakout recall rate of the algorithmsIn this subsection the performance of the algorithms is compared with what mightbe expected.
6.A.9 Breakout classificationIn this section the ‘breakout character’ of the results after applying the algorithms ispresented.
125

Validation study
Table 6.10: Key figures for the two datasets used
Dataset Number of papers
Categories 253,558
Clusters 214,827
In Categories and in Clusters 160,943
In Categories not in Clusters 92,785
In Clusters not in Categories 53,965
Figure 6.3: Distribution of the number of citations within 24 months for allpapers (articles and letters published in the period 1990–1994), and papersin the datasets Categories, and Clusters
6.A.1 The datasets: Categories and Clusters
In the studies we used two datasets – Categories and Clusters. In this sectionthe key figures for these datasets are presented. Table 6.10 shows for thedatasets Categories and Clusters the numbers of papers, and also the over-lap and the differences. Figure 6.3 shows for all papers (articles and letters)covered in the WoS published in the period 1990–1994, the papers in Cat-egories, and those in Clusters the distribution of the number of papers andthe number of citations received within the first 24 months after publication.The effect of the selection method used to construct the datasets Categoriesand Clusters, which is explained in the methods section of the main text, isclearly visible in this figure.
The cumulative citation distributions for papers cited by review papers isshown in Figure 6.4 and for papers cited in patents in Figure 6.5. Shown isthe fact that for these those parameters ‘Breakout papers’ obtain on averagehigher more citatons from review papers and from patents than ‘Not-breakoutpapers’. Included are in papers (articles and letters) published in the period1990–1994, and covered by the WoS.
126

6.A Supplementary material
Figure 6.4: Cumulative distribution for number of papers vs. number oftimes cited by review papers. Included are all publication (articles, letters) inthe WoS published in 1990–1994
Figure 6.5: Cumulative distribution for number of papers vs. number oftimes cited by patents. Included are all publication (articles, letters) in theWoS published in 1990–1994
127
Validation study
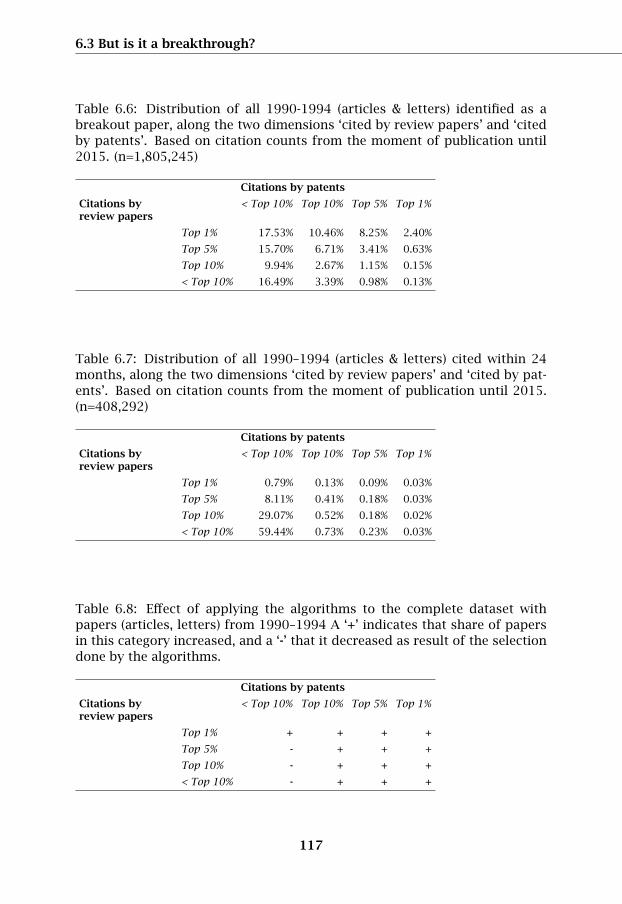
Figure 6.6: Cross Disciplinary Impact for a sample of seven papers using asmeasure the number of different ‘WoS subject categories’ of the citing papersat a certain point in time
6.A.2 Effect of the CWTS document-clustering method on ‘mul-tidisciplinarity’
This section illustrates the effect the CWTS document-clustering, which isused to construct the Clusters dataset, has on ‘multidisciplinarity98’. Fig-ure 6.6 and Figure 6.7 show the differences for the seven papers that wereused to determine the parameters for the ‘Cross Disciplinary Impact’ algo-rithm (cdi); the differences are particularly noticeable in the greyish areasthat indicate the period of particular interest in this study. The Cross Discip-linary Impact (CDI) algorithm comes therefore in two flavours, one for Cat-egories (cdisc) and the other for CWTS document clusters (cdidc). The X-axisin these figures shows the number of years after the publication, and theY-axis the multidisciplinarity of the documents citing the publications. Thebibliographic information for the seven papers is presented in Table 6.11.
6.A.3 Overlap with Redner’s algorithm
Redner introduced an algorithm to identify — what he calls — breakthroughpapers (Redner, 2005). Redner took an approach different from the one wetook in constructing our algorithms. It is therefore interesting to comparethe outcomes of our algorithms with those of Redner’s algorithm. Table 6.12shows the results.
98Multidisciplinarity is defined as the number of different categories or clusters. Categoriesand clusters are the basic categorisation dimension in the two datasets
128

6.A Supplementary material
Figure 6.7: Cross Disciplinary Impact for a sample of seven papers using asmeasure the number of different ‘CWTS paper clusters’ of the citing papersat a certain point in time.
Table 6.11: Bibliograhic information for the papers mentioned in Figure 6.6and Figure 6.7
Baba, M., Tanaka, H., De Clercq, E., Pauwels, R., Balzarini, J., Schols, D., Nakashima, H., Perno,C. F., Walker, R. T., and Miyasaka, T. (1989). Highly specific-inhibition of human immunodefi-ciency virus type-1 by a novel 6-substituted acyclouridine derivative. Biochemical and Biophys-ical Research Communications, 165(3):1375–1381.
Esté, J. A. and Telenti, A. (2007). HIV entry inhibitors. The Lancet, 370(9581):8 –88.
Hazuda, D. J., Felock, P., Witmer, M., Wolfe, A., Stillmock, K., Grobler, J. A., Espeseth, A., Gabryel-ski, L., Schleif, W., Blau, C., and Miller, M. D. (2000). Inhibitors of strand transfer that preventintegration and inhibit HIV-1 replication in cells. Science, 287(5453):646–650.
Miyasaka, T., Tanaka, H., Baba, M., Hayakawa, H., Walker, R. T., Balzarini, J., and DeClercq, E. (1989). A novel lead for specific anti-HIV-1 agents: 1-[(2-hydroxyethoxy)methyl]-6-(phenylthio)thymine. Journal of Medicinal Chemistry, 32(12):2507–2509.
Pauwels, R., Andries, K., Desmyter, J., Schols, D., Kukla, M. J., Breslin, H. J., Raeymaeckers, A.,Gelder, J. V., Woestenborghs, R., Heykants, J., Schellekens, K., Janssen, M. A. C., De Clercq, E.,and Janssen, P. A. J. (1990). Potent and selective inhibition of HIV-1 replication in vitro by anovel series of TIBO derivatives. Nature, 343(6257):470–474.
Roberts, N., Martin, J., Kinchington, D., Broadhurst, A., Craig, J., Duncan, I., Galpin, S., Handa, B.,Kay, J., Krohn, A., Lambert, R., Merrett, J., Mills, J., Parkes, K., Redshaw, S., Ritchie, A., Taylor, D.,Thomas, G., and Machin, P. (1990). Rational design of peptide-based HIV proteinase inhibitors.Science, 248(4953):358–361.
Wild, C., Greenwell, T., and Matthews, T. (1993). A synthetic peptide from HIV-1 gp41 is apotent inhibitor of virus-mediated cell—cell fusion. AIDS Research and Human Retroviruses,9(11):1051–1053.
129

Validation study
Table 6.12: Overlap of the results of Redner’s algorithm and the five al-gorithms (ari, dii, rii, cdi, rni) (no threshold applied)
Categories Clusters
Algorithms Number of papers marked as breakout
Redner 6,150 6,311
Redner ∩ ari 8 11
Redner ∩ cdi 943 3,210
Redner ∩ rii 2,119 2,108
Redner ∩ dii 0 0
Redner ∩ rni 13 6
Figure 6.8: Categories: normalized number of papers as a function of theapplied threshold. For each variable the number of papers for the thresholdvalue 1 is taken as reference.
6.A.4 Robustness of the algorithms
Robustness in this context is the ability of an algorithm to produce the sameresults irrespective of the different thresholds applied to the data. This sub-section shows the robustness of the five algorithms (ari, cdi, rii, dii, rni)developed in this study and Redner’s algorithm when applied to the datasetsfor Clusters and Categories. It presents the overlap in the outcomes of the fivealgorithms and those produced by Redner’s algorithm. Tables 6.13 and 6.14contain detailed information for Categories and Clusters on the outcomes forthe five algorithms ari, dii, rii, cdi, rni, and for the algorithm introduced byRedner (Redner, 2005) when thresholds on the number of citations a paperreceived within 24 months are applied. In Figure 6.7 and 6.8 we present thenumber of papers as a share of the number of papers for the situation whenno threshold is applied (≥1); this is done for the datasets as a whole (‘All’)and for the outcomes of the various algorithms.
130

6.A Supplementary material
Table 6.13: Categories: number of papers in the Categories dataset, and inthe various result sets in relation to the applied threshold
Categoriesdataset
ari cdisc rii dii rni Redner’salgo-rithm
Threshold (Number oftimes cited within 24months)
≥ 1 253,558 264 1,276 3,543 577 19 6,150
≥ 2 252,316 264 1,276 3,543 576 19 6,150
≥ 4 238,009 264 1,276 3,543 410 19 6,133
≥ 8 156,765 264 1,276 3,543 74 19 5,883
≥ 16 53,014 204 1,275 3,543 2 19 5,017
≥ 32 13,583 36 1,246 3,543 0 14 3,748
≥ 64 2,996 0 924 2,891 0 13 1,915
≥ 128 539 0 375 539 0 4 511
≥ 256 55 0 53 55 0 0 55
≥ 512 7 0 7 7 0 0 7
≥ 1024 0 0 0 0 0 0 0
Table 6.14: Clusters: number of papers in the dataset and in the various resultsets in relation to the applied threshold
Categoriesdataset
ari cdidc rii dii rni Redner’salgo-rithm
Threshold (Number oftimes cited within 24months)
≥ 1 214,827 60 13,477 3,501 674 8 6,311
≥ 2 214,119 60 13,477 3,501 673 8 6,311
≥ 4 201,514 60 13,477 3,501 483 8 6,299
≥ 8 137,969 60 13,451 3,501 74 8 5,839
≥ 16 51,666 60 12,096 3,501 2 8 5,179
≥ 32 13,369 56 6,930 3,501 0 7 3,748
≥ 64 2,926 0 2,320 2,857 0 7 1,904
≥ 128 534 0 486 534 0 4 508
≥ 256 54 0 54 53 0 0 54
≥ 512 7 0 7 7 0 0 7
≥ 1024 0 0 0 0 0 0 0
131

Validation study
Figure 6.9: Clusters: normalized number of papers as a function of the ap-plied threshold. For each variable the number of papers for the thresholdvalue 1 is taken as reference.
6.A.5 Performance of the algorithms
The performances of the implemented algorithms was tested by looking atpapers from 1990–1994 considered fundamental to Nobel Prize awarded re-search, or papers that appear in Nature’s Top 100 list of papers most citedever. In addition, a test set of 60 papers was used to examine citations fromreview papers, patents, and social media (2012–2014). The five algorithms(ari, dii, rii, cdi, rni) were tested against (1) Nature’s Top-100 list of papersmost cited ever, (2) Nobel prizes based on scholarly work from the period1990–1994, (3) the test set of 60 papers.
Nature’s Top-100 list of papers most cited ever
Table 6.15 shows the results of the test of the paper in the test set againstNaturetextquoterights ‘Top-100 list of papers most cited ever’. The biblio-graphic information for these papers is presented in Table 6.19.
132
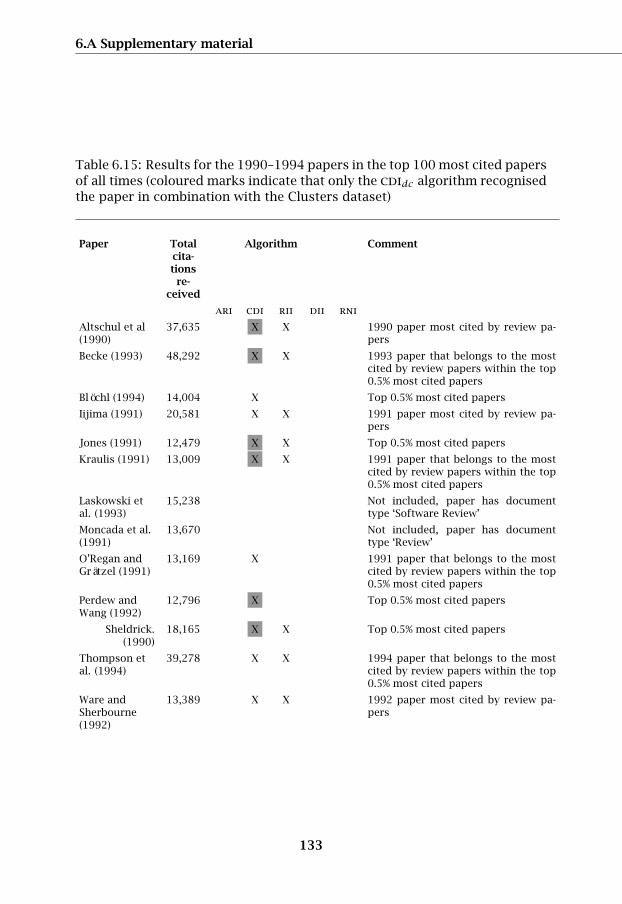
6.A Supplementary material
Table 6.15: Results for the 1990–1994 papers in the top 100 most cited papersof all times (coloured marks indicate that only the cdidc algorithm recognisedthe paper in combination with the Clusters dataset)
Paper Totalcita-tionsre-
ceived
Algorithm Comment
ari cdi rii dii rni
Altschul et al(1990)
37,635 X X 1990 paper most cited by review pa-pers
Becke (1993) 48,292 X X 1993 paper that belongs to the mostcited by review papers within the top0.5% most cited papers
Blöchl (1994) 14,004 X Top 0.5% most cited papers
Iijima (1991) 20,581 X X 1991 paper most cited by review pa-pers
Jones (1991) 12,479 X X Top 0.5% most cited papers
Kraulis (1991) 13,009 X X 1991 paper that belongs to the mostcited by review papers within the top0.5% most cited papers
Laskowski etal. (1993)
15,238 Not included, paper has documenttype ‘Software Review’
Moncada et al.(1991)
13,670 Not included, paper has documenttype ‘Review’
O’Regan andGrätzel (1991)
13,169 X 1991 paper that belongs to the mostcited by review papers within the top0.5% most cited papers
Perdew andWang (1992)
12,796 X Top 0.5% most cited papers
Sheldrick.(1990)
18,165 X X Top 0.5% most cited papers
Thompson etal. (1994)
39,278 X X 1994 paper that belongs to the mostcited by review papers within the top0.5% most cited papers
Ware andSherbourne(1992)
13,389 X X 1992 paper most cited by review pa-pers
133
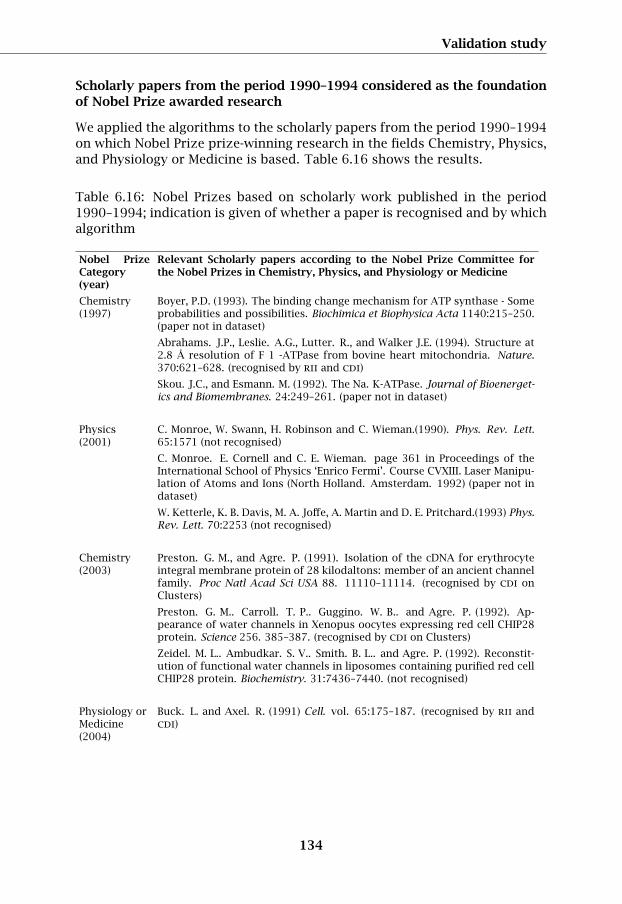
Validation study
Scholarly papers from the period 1990–1994 considered as the foundationof Nobel Prize awarded research
We applied the algorithms to the scholarly papers from the period 1990–1994on which Nobel Prize prize-winning research in the fields Chemistry, Physics,and Physiology or Medicine is based. Table 6.16 shows the results.
Table 6.16: Nobel Prizes based on scholarly work published in the period1990–1994; indication is given of whether a paper is recognised and by whichalgorithm
Nobel PrizeCategory(year)
Relevant Scholarly papers according to the Nobel Prize Committee forthe Nobel Prizes in Chemistry, Physics, and Physiology or Medicine
Chemistry(1997)
Boyer, P.D. (1993). The binding change mechanism for ATP synthase - Someprobabilities and possibilities. Biochimica et Biophysica Acta 1140:215–250.(paper not in dataset)
Abrahams. J.P., Leslie. A.G., Lutter. R., and Walker J.E. (1994). Structure at2.8 Å resolution of F 1 -ATPase from bovine heart mitochondria. Nature.370:621–628. (recognised by rii and cdi)
Skou. J.C., and Esmann. M. (1992). The Na. K-ATPase. Journal of Bioenerget-ics and Biomembranes. 24:249–261. (paper not in dataset)
Physics(2001)
C. Monroe, W. Swann, H. Robinson and C. Wieman.(1990). Phys. Rev. Lett.65:1571 (not recognised)
C. Monroe. E. Cornell and C. E. Wieman. page 361 in Proceedings of theInternational School of Physics ‘Enrico Fermi’. Course CVXIII. Laser Manipu-lation of Atoms and Ions (North Holland. Amsterdam. 1992) (paper not indataset)
W. Ketterle, K. B. Davis, M. A. Joffe, A. Martin and D. E. Pritchard.(1993) Phys.Rev. Lett. 70:2253 (not recognised)
Chemistry(2003)
Preston. G. M., and Agre. P. (1991). Isolation of the cDNA for erythrocyteintegral membrane protein of 28 kilodaltons: member of an ancient channelfamily. Proc Natl Acad Sci USA 88. 11110–11114. (recognised by cdi onClusters)
Preston. G. M.. Carroll. T. P.. Guggino. W. B.. and Agre. P. (1992). Ap-pearance of water channels in Xenopus oocytes expressing red cell CHIP28protein. Science 256. 385–387. (recognised by cdi on Clusters)
Zeidel. M. L.. Ambudkar. S. V.. Smith. B. L.. and Agre. P. (1992). Reconstit-ution of functional water channels in liposomes containing purified red cellCHIP28 protein. Biochemistry. 31:7436–7440. (not recognised)
Physiology orMedicine(2004)
Buck. L. and Axel. R. (1991) Cell. vol. 65:175–187. (recognised by rii andcdi)
134

6.A Supplementary material
Table 6.16 (continued from previous page)
Nobel PrizeCategory(year)
Relevant Scholarly papers according to the Nobel Prize Committee forthe Nobel Prizes in Chemistry, Physics, and Physiology or Medicine
Physics(2006)
Mather, J.C. et al. (1990) Astrophys. J. (Letter) 354:37 (recognised by rii)
Mather, J.C. (1994). Astrophys. J. 420. 440 (recognised by rii)
Smoot, G. et al. (1990) Astrophys. J. 360. 685 (!volume number in Nobelprize document is incorrect (380)). (not recognized)
Smoot, G. et al. (1992) Astrophys. J. (Letters) 396. 1 (recognised by rii andcdi)
Chemistry(2012)
Cotecchia, S., Exum, S., Caron, MG. and Lefkowitz RJ (1990) Regions of thealpha 1-adrenergic receptor involved in coupling to phosphatidylinositol hy-drolysis and enhanced sensitivity of biological function. Proc Natl Acad SciUSA. 87:2896–2900. (not recognised)
Physics(2014)
Akasaki H., Amano, K., Itoh, N., Koide and K. Manabe.(1992). Int. Phys. Conf.Ser. 129:851. (paper not in dataset)
S. Nakamura, M. Senoh and T. Mukai. Jpn. J. Appl. Phys.. 32. L8 (1993) (notrecognised)
S. Nakamura et al., (1993). J. Appl. Phys. 74:3911 . (paper not in dataset)
S. Nakamura, T. Mukai, and M. Senoh. (1994). Appl. Phys. Lett. 64:1687.(recognised by rii)
S. Nakamura, (1991). Jpn. J. Appl. Phys.. 30:L1705 (not recognised)
S. Nakamura, M. Senoh and T. Mukai. (1991) Jpn. J. Appl. Phys.. 30:L1998.(not recognised)
Chemistry(2014)
Hell, S.W. and Wichman, J. (1994). Breaking the diffraction resolutionlimit by stimulated emission: stimulated-emission-depletion-microscopy.Opt.Lett.. 19:780–782. (paper not in dataset)
Test set
After applying the five algorithms to the papers in the datasets Categoriesen Clusters, we selected for each combination of algorithm and dataset thepapers in the top 10 based on times cited within 24 months after publication.The result is a set of 60 unique papers, and we show the key indicators forthese papers in Table 6.17. The bibliographic information for these papersis contained in Table 6.19. We applied not only our five algorithms but alsoRedner’s algorithms. In this table we also show if a paper is identifed, andif so by which algorithm. For the papers in the test set we checked whetherthey occur on Nature’s ‘Top-100 list of most cited papers’, whether they arecited in social media papers from the period 2012–2014, the number of timesthese papers are cited as non-patent literature in patents, and the times theyare cited by review papers; the results are shown in Table 6.18.
135

Validation study
Table 6.17: Papers in the test set, selected on the basis of belonging to thetop 10 most cited papers within 24 months for each of the algorithms (an‘X’ in a cell indicates that the paper is recognised as a breakout paper bythe corresponding algorithm; coloured marks indicate that only the cdidcalgorithm recognised the paper in combination with the Clusters dataset)
Paper Dataset Times citeda Detecting algorithm
(total) (≤ 12months)
(≤ 24months)
ari cdi rii dii rni Redner
Adeva et al. (1990) Clusters 471 24 50 X
Ahmet (1991) Clusters 452 20 50 X
Altschul et al.(1990)
Clusters +Categories
37,635 21 161 X X X
Angell (1991) Clusters +Categories
1,146 3 39 X X X
‘Anonymous’(1991)
Categories 422 19 42 X
‘Anonymous’b
(1992)Clusters +Categories
1,539 64 193 X X X X
Bailey (1994) Clusters +Categories
17,178 140 479 X X X
Becke (1993) Clusters +Categories
48,292 7 75 X X X
Blöchl (1994) Clusters 14,004 9 24 X X
Brown et al. (1990) Clusters +Categories
1,207 45 169 X X X X
Coussot et al.(1993)
Categories 94 1 6 X
Delerue et al.(1993)
Clusters +Categories
639 6 32 X X
Dixon et al. (1994) Clusters +Categories
1,095 7 51 X X X
Duschek et al.(1990)
Categories 91 1 4 X
Eldeiry et al.(1993)
Categories 6,078 171 597 X X X
Fang et al. (1994) Clusters 100 2 8 X
Fischman et al.(1994)
Clusters +Categories
2,503 42 199 X X X
Frabetti et al.(1992)
Clusters +Categories
110 11 19 X
Frostig et al.(1992)
Categories 187 2 3 X
136

6.A Supplementary material
(Table 6.17 continued from previous page)
Paper Dataset Times citeda Detecting algorithm
(total) (≤ 12months)
(≤ 24months)
ari cdi rii dii rni Redner
Gasser et al.(1993)
Clusters 211 2 7 X
Gavrieli et al.(1992)
Categories 7,741 19 154 X X X
Hafner et al.(1992)
Categories 275 3 8 X
Hodges et al.(1992)
Categories 856 3 17 X X
Huntington (1993) Clusters +Categories
1,042 33 88 X X X X
Iijima (1991) Clusters +Categories
20,581 55 182 X X X
Inoue et al. (1990) Clusters +Categories
162 3 8 X
Jones et al. (1991) Clusters +Categories
12,479 13 65 X X X
Keller et al. (1993) Clusters +Categories
591 10 33 X X X
Kessler et al.(1994)
Categories 6,302 44 193 X X X
Kiranoudis et al.(1993)
Clusters +Categories
128 3 6 X
Koudstaal et al.(1993)
Categories 879 27 68 X X X
Kraulis (1991) Clusters +Categories
13,009 39 234 X X X
Kubota et al.(1992)
Clusters 547 15 47 X X
Kumbharkhane etal. (1991)
Clusters 101 3 4 X
Larsson et al.(1994)
Clusters 119 2 3 X
Lauck et al. (1990) Clusters 104 2 7 X
Lebel et al. (1990) Categories 186 1 6 X
Manabe et al.(1993)
Categories 438 9 24 X
Mccormick andPape (1990)
Clusters 641 9 42 X X X
Middlemas et al.(1991)
Clusters 582 14 43 X X X
Miller et al. (1992) Clusters 373 37 76 X X X
Ohara et al. (1993) Categories 405 10 45 X
O‘Regan andGrätzel (1991)
Clusters 13,169 12 49 X X
137

Validation study
(Table 6.17 continued from previous page)
Paper Dataset Times citeda Detecting algorithm
(total) (≤ 12months)
(≤ 24months)
ari cdi rii dii rni Redner
Pause andSonenberg (1992)
Categories 413 8 32 X
Probstfield (1991) Clusters +Categories
2,260 51 164 X X X X
Riggs et al. (1990) Categories 567 26 84 X X X X
Rudman et al.(1990)
Categories 764 32 78 X X X X
Ryder (1993) Clusters 39 26 30 X
Sakai et al. (1990) Clusters 127 2 6 X
Shamoon et al.(1993)
Clusters +Categories
9,957 141 449 X X X
Sheldrick (1990) Clusters +Categories
18,165 13 84 X X X
Stampfer et al.(1991)
Categories 1,345 29 87 X X
Stave et al. (1990) Categories 96 2 10 X X
Svoboda et al.(1994)
Clusters +Categories
101 5 5 X
Swedberg et al.(1992)
Clusters +Categories
518 36 115 X X X X
Thompson et al.(1994)
Clusters +Categories
39,278 57 326 X X X
Ware andSherbourne (1992)
Clusters +Categories
13,389 23 76 X X X
Whitesides andLaibinis (1990)
Clusters +Categories
806 7 50 X X
Williams et al.(1990)
Categories 7,441 24 141 X X X
Zhang et al. (1994) Categories 6,058 84 342 X X X
Total number ofpapers from thetest set recognized
15 32 26 16 12 36
a Only citations from papers of the types ‘article’ or ‘letter’ are taken intoaccountb According to the on-line version of Thomson Reuters Web of Science thispaper is never cited, whereas in the CWTS’s in house version of the databaseit is cited 1,539 times by papers of the type ‘article’ or ‘letter’
138

6.A Supplementary material
Table 6.18: Validation of the papers mentioned in Table 6.16
Paper Position inNature’s
list ofTop-100
most citedpapers
Timescited byreviewpapers
Cited bypatent
families(PATSTAT
spring2014
edition)
Cited by socialmedia papers(2012–2014)
Notes
Adeva et al.(1990)
38
Ahmet (1991) 37
Altschul et al.(1990)
12 1,155 2,412 1 Blog post BLAST software
Angell (1991) 72
“Anonymous”(1992)
34 1
“Anonymous”(1991)
350
Bailey (1994) 149 18 CCP4 software
Becke (1993) 8 1,664 6 1 Twitter post,1 Facebook post,1 News message,1 Blog post
Blöchl (1994) 85 162 1
Brown et al.(1990)
385 16
Coussot et al.(1993)
4
Delerue et al.(1993)
37 1
Dixon et al.(1994)
98
Duschek et al.(1990)
9
Eldeiry et al.(1993)
942 6
Fang et al.(1994)
1
Fischman et al.(1994)
378 24 1 Twitter post
Frabetti et al.(1992)
7
139
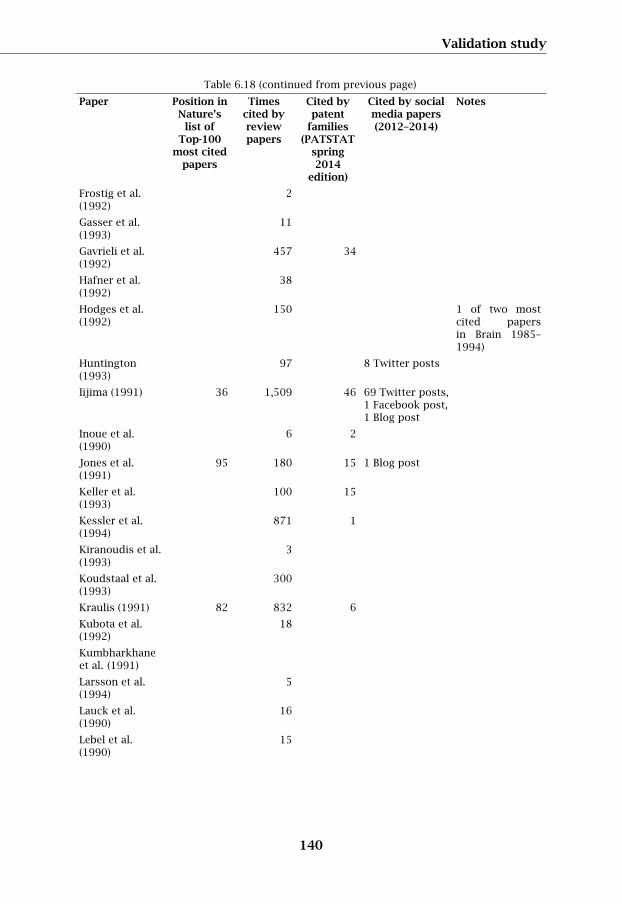
Validation study
Table 6.18 (continued from previous page)
Paper Position inNature’s
list ofTop-100
most citedpapers
Timescited byreviewpapers
Cited bypatent
families(PATSTAT
spring2014
edition)
Cited by socialmedia papers(2012–2014)
Notes
Frostig et al.(1992)
2
Gasser et al.(1993)
11
Gavrieli et al.(1992)
457 34
Hafner et al.(1992)
38
Hodges et al.(1992)
150 1 of two mostcited papersin Brain 1985–1994)
Huntington(1993)
97 8 Twitter posts
Iijima (1991) 36 1,509 46 69 Twitter posts,1 Facebook post,1 Blog post
Inoue et al.(1990)
6 2
Jones et al.(1991)
95 180 15 1 Blog post
Keller et al.(1993)
100 15
Kessler et al.(1994)
871 1
Kiranoudis et al.(1993)
3
Koudstaal et al.(1993)
300
Kraulis (1991) 82 832 6
Kubota et al.(1992)
18
Kumbharkhaneet al. (1991)
Larsson et al.(1994)
5
Lauck et al.(1990)
16
Lebel et al.(1990)
15
140

6.A Supplementary material
Table 6.18 (continued from previous page)
Paper Position inNature’s
list ofTop-100
most citedpapers
Timescited byreviewpapers
Cited bypatent
families(PATSTAT
spring2014
edition)
Cited by socialmedia papers(2012–2014)
Notes
Manabe et al.(1993)
35
Mccormick andPape (1990)
118
Middlemas et al.(1991)
91 6
Miller et al.(1992)
48
Ohara et al.(1993)
736 1
O’Regan andGrätzel (1991)
90 141 264 4 Blog posts,1 Facebook post
Pause andSonenberg(1992)
58 2
Probstfield(1991)
684
Riggs et al.(1990)
188 2 2 Twitter posts
Rudman et al.(1990)
282 6 2 Blog posts,1 Facebook post,2 Twitter posts,1 Google+ post
Ryder (1993) 1
Sakai et al.(1990)
4 1
Shamoon et al.(1993)
2133 16
Sheldrick (1990) 47 178
Stampfer et al.(1991)
275 1
Stave et al.(1990)
6
Svoboda et al.(1994)
7
Swedberg et al.(1992)
197 2
Thompson et al.(1994)
10 1154 475
141

Validation study
Table 6.18 (continued from previous page)
Paper Position inNature’s
list ofTop-100
most citedpapers
Timescited byreviewpapers
Cited bypatent
families(PATSTAT
spring2014
edition)
Cited by socialmedia papers(2012–2014)
Notes
Ware andSherbourne(1992)
72 1,102 5
Whitesides andLaibinis (1990)
80 5 1 of the top-25most cited Lang-muir papers inthe period 1985–2009
Williams et al.(1990)
379 33
Zhang et al.(1994)
1,607 83 2 Blog posts,1 News item
Table 6.19: Bibliographic information for the papers mentioned inTables 6.15, 6.16, and 6.17
Adeva, B., et al. (1990). The Construction of the L3 Experiment. Nuclear Instruments& Methods in Physics Research Section A-Accelerators Spectrometers Detectors andAssociated Equipment, 289(1–2):35–102.
Ahmet, K. (1991). The Opal Detector at LEP. Nuclear Instruments & Methods in PhysicsResearch Section A-Accelerators Spectrometers Detectors and Associated Equipment,305(2):275–319.
Altschul, S., Gish, W., Miller, W., Myers, E., and Lipman, D. (1990). Basic Local Align-ment Search Tool. Journal of Molecular Biology, 215(3):403–410.
Angell, C. (1991). Relaxation in Liquids, Polymers and Plastic Crystals - Strong FragilePatterns and Problems. Journal of Non-Crystalline Solids, 131(1):13–31.
“Anonymous” (1991). The Delphi Detector at LEP. Nuclear Instruments & Methods inPhysics Research Section A-Accelerators Spectrometers Detectors and Associated Equip-ment, 303(2):233–276.
“Anonymous” (1992). Systemic Treatment of Early Breast-Cancer by Hormonal, Cyto-toxic, or Immune Therapy - 133 Randomized Trials Involving 31000 Recurrences and24000 Deaths Among 75000 Women .1. Lancet, 339(8784):1–15.
Bailey, S. (1994). The CCP4 Suite - Programs for Protein Crystallography. Acta Crys-tallographica Section D-Biological Crystallography, 50(5):760–763.
Becke, A. (1993). Density-Functional ThermochemistryIII. the Role of Exact Exchange.Journal of Chemical Physics, 98(7):5648–5652.
Blöchl, P. (1994). Projector Augmented-Wave Method. Physical Review B,50(24):17953–17979.
142

6.A Supplementary material
Table 6.19 (continued from previous page)
Brown, G., Albers, J., Fisher, L., Schaefer, S., Lin, J., Kaplan, C., Zhao, X., Bisson, B.,Fitzpatrick, V., and Dodge, H. (1990). Regression of Coronary-Artery Disease as a Res-ult of Intensive Lipid-Lowering Therapy in Men With High-Levels of Apolipoprotein-B.New England Journal of Medicine, 323(19):1289–1298.
Coussot, P., Leonov, A., and Piau, J. (1993). Rheology of Concentrated Dispersed Sys-tems in a Low-Molecular-Weight Matrix. Journal of Non-Newtonian Fluid Mechanics,46(2–3):179–217.
Delerue, C., Allan, G., and Lannoo, M. (1993). Theoretical Aspects of the Luminescenceof Porous Silicon. Physical Review B, 48(15):11024–11036.
Dixon, R., Brown, S., Houghton, R., Solomon, A., Trexler, M., and Wisniewski, J. (1994).Carbon Pools and Flux of Global Forest Ecosystems. Science, 263(5144):185–190.
Duschek, W., Kleinrahm, R., and Wagner, W. (1990). Measurement and Correlationof the (Pressure, Density, Temperature) Relation of Carbon-Dioxide .1. the Homo-geneous Gas and Liquid Regions in the Temperature-Range from 217-K to 340-K AtPressures Up To 9 Mpa. Journal of Chemical Thermodynamics, 22(9):827–840.
Eldeiry, W., Tokino, T., Velculescu, V., Levy, D., Parsons, R., Trent, J., Lin, D., Mercer,W., Kinzler, K., and Vogelstein, B. (1993). WAF1, a Potential Mediator of P53 TumorSuppression. Cell, 75(4):817–825.
Fang, Z., Liu, Z., and Yao, K. (1994). Theoretical-Model and Numerical-Calculations fora Quasi-One-Dimensional Organic Ferromagnet. Physical Review B, 49(6):3916–3919.
Fischman, D., et al. (1994). A Randomized Comparison of Coronary-Stent Placementand Balloon Angioplasty in the Treatment of Coronary-Artery Disease. New EnglandJournal of Medicine, 331(8):496–501.
Frabetti, P., et al.(1992). Description and Performance of the Fermilab-E687 Spec-trometer. Nuclear Instruments & Methods in Physics Research Section A-AcceleratorsSpectrometers Detectors and Associated Equipment, 320(3):519–547.
Frostig, Y., Baruch, M., Vilnay, O., and Sheinman, I. (1992). High-Order Theory forSandwich-Beam Behavior With Transversely Flexible Core. Journal of EngineeringMechanics-Asce, 118(5):1026–1043.
Gasser, R., Chilton, N., Hoste, H., and Beveridge, I. (1993). Rapid Sequencing ofRdna from Single Worms and Eggs of Parasitic Helminths. Nucleic Acids Research,21(10):2525– 2526.
Gavrieli, Y., Sherman, Y., and Bensasson, S. (1992). Identification of ProgrammedCell-Death Insitu via Specific Labeling of Nuclear-Dna Fragmentation. Journal of CellBiology, 119(3):493–501.
Hafner, H., Riecherrossler, A., Hambrecht, M., Maurer, K., Meissner, S., Schmidtke, A.,Fatkenheuer, B., Loffer, W., and Vanderheiden, W. (1992). Iraos - an Instrument forthe Assessment of Onset and Early Course of Schizophrenia. Schizophrenia Research,6(3):209–223.
Hodges, J., Patterson, K., Oxbury, S., and Funnell, E. (1992). Semantic Dementia -Progressive Fluent Aphasia With Temporal-Lobe Atrophy. Brain, 115(6):1783–1806.
Huntington, S. (1993). The Clash of Civilizations. Foreign Affairs, 72(3):22–49.
Iijima, S. (1991). Helical Microtubules of Graphitic Carbon. Nature, 354(6348):56–58.
Inoue, A., Yamaguchi, H., Zhang, T., and Masumoto, T. (1990). Al-La-Cu amorphous-alloys with a wide supercooled liquid region. Materials Transactions Jim, 31(2):104–109.
143

Validation study
Table 6.19 (continued from previous page)
Jones, T., Zou, J., Cowan, S., and Kjeldgaard, M. (1991). Improved Methods for BuildingProtein Models in Electron-Density Maps and the Location of Errors in These Models.Acta Crystallographica Section A, 47(2):110–119.
Keller, G., Kennedy, M., Papayannopoulou, T., and Wiles, M. (1993). HematopoieticCommitment During Embryonic Stem-Cell Differentiation in Culture. Molecular andCellular Biology, 13(1):473–486.
Kessler, R., Mcgonagle, K., Zhao, S., Nelson, C., Hughes, M., Eshleman, S., Wittchen, H.,and Kendler, K. (1994). Lifetime and 12-Month Prevalence of DSM-III-R Psychiatric-Disorders in the United-States - Results from the National-Comorbidity-Survey.Archives of General Psychiatry, 51(1):8–19.
Kiranoudis, C., Maroulis, Z., Tsami, E., and Marinoskouris, D. (1993). EquilibriumMoisture-Content and Heat of Desorption of Some Vegetables. Journal of Food Engin-eering, 20(1):55–74.
Koudstaal, P., et al. (1993). Secondary Prevention in Nonrheumatic Atrial-Fibrillationafter Transient Ischemic Attack or Minor Stroke. Lancet, 342(8882):1255–1262.
Kraulis, P. (1991). MOLSCRIPT - a program to produce both detailed and schematicplots of protein structures. Journal of Applied Crystallography, 24(5):946–950.
Kubota, Y., et al. (1992). The Cleo-II Detector. Nuclear Instruments & Methods inPhysics Research Section A-Accelerators Spectrometers Detectors and Associated Equip-ment, 320(1–2):66–113.
Kumbharkhane, A., Puranik, S., and Mehrotra, S. (1991). Dielectric-Relaxation of TertButyl Alcohol-Water Mixtures Using A Time-Domain Technique. Journal of the Chem-ical Society-Faraday Transactions, 87(10):1569–1573.
Larsson, A., Stenberg, L., and Lidin, S. (1994). The Superstructure of Domain-TwinnedEta’-Cu6Sn5. Acta Crystallographica Section B-Structural Science, 50(6):636–643.
Laskowski, R., MW, M., Moss, D., and Thornton, J. (1993). PROCHECK - a program tochech the stereochemical quality of protein structures. Journal of Applied Crystallo-graphy, 26(2):283–291.
Lauck, L., Vasconcellos, A., and Luzzi, R. (1990). A Nonlinear Quantum Transport-Theory. Physica A-Statistical Mechanics and its Applications, 168(2):789–819.
Lebel, C., Ali, S., Mckee, M., and Bondy, S. (1990). Organometal-Induced Increasesin Oxygen Reactive Species - the Potential of 2’,7’-Dichlorofluorescin Diacetate as anIndex of Neurotoxic Damage. Toxicology and Applied Pharmacology, 104(1):17–24.
Manabe, T., Wyllie, D., Perkel, D., and Nicoll, R. (1993). Modulation of SynapticTransmission and Long-Term Potentiation - Effects on Paired-Pulse Facilitation andEpsc Variance in the Ca1 Region of the Hippocampus. Journal of Neurophysiology,70(4):1451–1459.
Mccormick, D. and Pape, H. (1990). Properties of A Hyperpolarization-ActivatedCation Current and its Role in Rhythmic Oscillation in Thalamic Relay Neurons.Journal of Physiology-London, 431:291–318.
Middlemas, D., Lindberg, R., and Hunter, T. (1991). TRKB, a neural receptor pro-teintyrosine kinase - evidence for a full-length and 2 truncated receptors. Molecularand Cellular Biology, 11(1):143–153.
Miller, A., Baines, C., To, T., and Wall, C. (1992). Canadian-National-Breast-Screening-Study .1. Breast-Cancer Detection and Death Rates Among Women Aged 40 to 49Years. Canadian Medical Association Journal, 147(10):1459–1476.
144

6.A Supplementary material
Table 6.19 (continued from previous page)
Moncada, S., Palmer, R., and Higgs, E. (1991). Nitric-oxide - physiology, patho-physiology, and pharmacology. Pharmacological Reviews, 43(2):109–142.
Ohara, P., Sheppard, P., Thogersen, H., Venezia, D., Haldeman, B., Mcgrane, V., Hou-amed, K., Thomsen, C., Gilbert, T., and Mulvihill, E. (1993). The Ligand-Binding Do-main in Metabotropic Glutamate Receptors Is Related to Bacterial Periplasmic Binding-Proteins. Neuron, 11(1):41–52.
O’Regan, B. and Grätzel, M. (1991). A low-cost, high-eïnCciency solar-cell based ondye-sensitized colloidal TiO2 films. Nature, 353(6346):737–740.
Pause, A. and Sonenberg, N. (1992). Mutational Analysis of A Dead Box Rna Helicase –the Mammalian Translation Initiation-Factor Eif-4a. Embo Journal, 11(7):2643–2654.
Perdew, J. and Wang, Y. (1992). Accurate and simple analytic representation of theelectron-gas correlation-energy. Physical Review B, 45(23):13244–13249.
ProbstïnAeld, J. (1991). Prevention of Stroke By Antihypertensive Drug-Treatmentin Older Persons With Isolated Systolic Hypertension - Final Results of the SystolicHypertension in the Elderly Program (Shep). Jama-Journal of the American MedicalAssociation, 265(24):3255–3264.
Riggs, B., Hodgson, S., Ofallon, W., Chao, E., Wahner, H., Muhs, J., Cedel, S., and Melton,L. (1990). Effect of Fluoride Treatment on the Fracture Rate in Postmenopausal Wo-men With Osteoporosis. New England Journal of Medicine, 322(12):802–809.
Rudman, D., Feller, A., Nagraj, H., Gergans, G., Lalitha, P., Goldberg, A., Schlenker, R.,Cohn, L., Rudman, I., and Mattson, D. (1990). Effects of Human Growth-Hormone inMen Over 60 Years Old. New England Journal of Medicine, 323(1):1–6.
Ryder, R. (1993). Natural Family-Planning - Effective Birth-Control Supported By theCatholic-Church. British Medical Journal, 307(6906):723–726.
Sakai, T., Miyamura, H., Kuriyama, N., Kato, A., Oguro, K., Ishikawa, H., and Iwak-ura, C. (1990). The Influence of Small Amounts of Added Elements on Various An-ode Performance-Characteristics for LaNi2.5Co2.5-Based Alloys. Journal of the Less-Common Metals, 159(1–2):127–139.
Shamoon, H., et al. (1993). The Effect of Intensive Treatment of Diabetes on the Devel-opment and Progression of Long-Term Complications in Insulin-Dependent Diabetes-Mellitus. New England Journal of Medicine, 329(14):977–986.
Sheldrick, G. (1990). Phase annealing in SHELX-90 - direct methods for larger struc-tures. Acta Crystallographica Section A, 46(6):467–473.
Stampfer, M., Colditz, G., Willett, W., Manson, J., Rosner, B., Speizer, F., and Hen-nekens, C. (1991). Postmenopausal Estrogen Therapy and Cardiovascular-Disease -10-Year Follow-Up from the Nurses Health Study. New England Journal of Medicine,325(11):756–762.
Stave, M., Sanders, D., Raeker, T., and Depristo, A. (1990). Corrected Effective Me-dium Method .5. Simplifications for Molecular-Dynamics and Monte-Carlo Simula-tions. Journal of Chemical Physics,
93(6):4413–4426.
Svoboda, J., Riedel, H., and Zipse, H. (1994). Equilibrium Pore Surfaces, SinteringStresses and Constitutive-Equations for the Intermediate and Late Stages of Sintering.1. Computation of Equilibrium Surfaces. Acta Metallurgica Et Materialia, 42(2):435–443.
145

Validation study
Table 6.19 (continued from previous page)
Swedberg, K., Held, P., Kjekshus, J., Rasmussen, K., Ryden, L., and Wedel, H. (1992).Effects of the Early Administration of Enalapril on Mortality in Patients With AcuteMyocardial-Infarction - Results of the Cooperative New Scandinavian Enalapril Sur-vival Study-Ii (Consensus-Ii). New England Journal of Medicine, 327(10):678–684.
Thompson, J., Higgins, D., and Gibson, T. (1994). Clustal-W - Improving the Sensitivityof Progressive Multiple Sequence Alignment Through Sequence Weighting, Position-Specific Gap Penalties and Weight Matrix Choice. Nucleic Acids Research, 22(22):4673–4680.
Ware, J. and Sherbourne, C. (1992). The MOS 36-item short-form health survey (SF-36).1. conceptual-framework and item selection. Medical Care, 30(6):473–483.
Whitesides, G. and Laibinis, P. (1990). Wet Chemical Approaches to the Character-ization of Organic-Surfaces - Self-Assembled Monolayers, Wetting, and the PhysicalOrganic-Chemistry of the Solid Liquid Interface. Langmuir, 6(1):87–96.
Williams, J., Kubelik, A., Livak, K., Rafalski, J., and Tingey, S. (1990). DNA polymorph-isms amplified by arbitrary primers are useful as genetic-markers. Nucleic Acids Re-search, 18(22):6531–6535.
Zhang, Y., Proenca, R., Maffei, M., Barone, M., Leopold, L., and Friedman, J. (1994).Positional Cloning of the Mouse Obese Gene and its Human Homolog. Nature,372(6505):425–432.
6.A.6 Key figures for the papers in the test set
In this section the outcomes of applying the algorithms to the test set of 60papers are further broken down. Table 6.20 shows some bibliographic keyfigures for the breakout papers in the test set. Some further characteristicsof the algorithms are presented in Table 6.21, where we differentiate for eachalgorithm between the papers that are selected (breakout papers) and thosethat are not selected (non-breakout papers). The table shows the percentagesof papers belonging to the Top 3%, based on the number of citations a pa-per received. Table 6.22 shows for the papers in the test set the number oftimes a paper is cited by a review paper, and provides also some commentinginformation.
Table 6.20: Key figures for the various algorithms applied to the test set with60 papers
Algorithm Number ofbreakoutpapers
Range oftimes-citedin 24months byarticles andletters
Occuring inNature’sTop-100most citedlist
Cited bypatentfamilies(PATSTATspring2014edition)
Cited inSocialMedia(2012–2014)
Range ofnumber oftimes citedby reviewpapers
ari 15 17–51 0 7 0 18–150
cdi 33 24–579 11 25 10 48–2133
rii 26 65–579 8 20 9 48–2133
dii 16 3–19 0 2 0 1–38
rni 12 30–199 0 6 4 1–684
146

6.A Supplementary material
Table 6.21: Characteristics of the algorithms by differentiating the papersfrom the test set in breakout papers and non-breakout papers. Shown arethe percentages of papers in each of the two groups that belong to the Top3% percentile of distribution of the number of citations received from thedifferent sources by all papers (letters and articles) published in 1990–1994and covered in the WoS database.
Algorithm Cited by review papers Cited by patents Times cited within 24 months
(Percentage of papers in Top 3%)
Breakoutpaper
Non-breakout
paper
Breakoutpaper
Non-breakout
paper
Breakoutpaper
Non-breakout
paper
ari 93% 64% 7% 27% 100% 67%
cdi 100% 39% 41% 0% 100% 46%
rii 100% 50% 42% 6% 100% 56%
dii 6% 95% 0% 30% 6% 100%
rni 92% 67% 17% 23% 100% 69%
Table 6.22: Number of times a paper in the test set is cited by a review paper
Paper Times cited byreview papers
until 1st Quarterof 2015
Notes
Adeva et al. (1990)38 Top 1.5%
Ahmet (1991) 37 Top 1.5%
Altschul et al.(1990)
1,155 1990 paper most cited by review papers
Angell (1991) 72 Top 0.5%
“Anonymous”(1992)
34 Top 2 %
“Anonymous”(1991)
350 Top 0.5%
Bailey (1994) 149 Top 0.5%
Becke (1993) 1,664 1993 paper that belongs to the most cited byreview papers within the top 0.5%
Blöchl et al. (1994) 162 Top 0.5%
Brown et al. (1990) 385 Top 0.5%
Coussot et al.(1993)
4 Top 40%
Delerue et al.(1993)
37 Top 2 %
Dixon et al. (1994) 98 Top 0.5%
147

Validation study
Table 6.22 (continued from previous page)
Paper Times cited byreview papers
until 1st Quarterof 2015
Notes
Duschek et al.(1990)
9 Top 20%
Eldeiry et al.(1993)
942 1993 paper that belongs to the most cited byreview papers within the top 0.5%
Fang et al. (1994) 1 Low cited
Fischman et al.(1994)
378 Top 0.5%
Frabetti et al.(1992)
7 Top 20%
Frostig et al.(1992)
2 Low cited
Gasser et al.(1993)
11 Top 20%
Gavrieli et al.(1992)
457 Top 0.5%
Hafner et al.(1992)
38 Top 2 %
Hodges et al.(1992)
150 Top 0.5%
Huntington et al.(1993)
97 Top 0.5%
Iijima (1991) 1,509 1991 paper most cited by review papers
Inoue et al. (1990) 6 Top 30%
Jones et al. (1991) 180 Top 0.5%
Keller et al. (1993) 100 Top 0.5%
Kessler et al.(1994)
871 1994 paper that belongs to the most cited byreview papers within the top 0.5%
Kiranoudis et al.(1993)
3 Top 50%
Koudstaal et al.(1993)
300 Top 0.5%
Kraulis (1991) 832 1991 paper that belongs to the most cited byreview papers within the top 0.5%
Kubota et al.(1992)
18 Top 10%
Kumbharkhane etal. (1991)
Not cited
Larsson et al.(1994)
5 Top 30%
Lauck et al. (1990) 16 Top 10%
Lebel et al. (1990) 15 Top 10%
148

6.A Supplementary material
Table 6.22 (continued from previous page)
Paper Times cited byreview papers
until 1st Quarterof 2015
Notes
Manabe et al.(1993)
35 Top 20%
Mccormick andPape (1990)
118 Top 0.5%
Middlemas et al.(1991)
91 Top 0.5%
Miller et al. (1992) 48 Top 1%
Ohara et al. (1993) 736 1991 paper that belongs to the most cited byreview papers within the top 0.5%
O’Regan andGrätzel (1991)
141 Top 0.5%
Pause andSonenberg (1992)
58 Top 1%
Probstfield (1991) 684 1991 paper that belongs to the most cited byreview papers within the top 0.5%
Riggs et al. (1990) 188 Top 0.5%
Rudman et al.(1990)
282 Top 0.5%
Ryder et al. (1993) 1 Low cited
Sakai et al. (1990) 4 Top 40%
Shamoon et al.(1993)
2,133 1993 paper most cited by review papers
Sheldrick (1990) 178 Top 0.5%
Stampfer et al.(1991)
275 Top 0.5%
Stave et al. (1990) 6 Top 30%
Svoboda et al.(1994)
7 Top 20%
Swedberg et al.(1992)
197 Top 0.5%
Thompson et al.(1994)
1,154 1994 paper that belongs to the most cited byreview papers within the top 0.5%
Ware andSherbourne (1992)
1,102 1992 paper most cited by review papers
Whitesides andLaibinis (1990)
80 Top 0.5%
Williams et al.(1990)
379 Top 0.5%
Zhang et al. (1994) 1,607 1994 paper most cited by review papers
149

Validation study
Table 6.23: Classification of the results based on the total number of citationsreceived in comparison with the distribution of the citation scores for all pa-pers (‘letters’ and ‘articles’) published in the period 1990–1994 and covered inthe WoS database; percentile boundaries are presented between parentheses.
Algorithm Papersrecognized
Not cited Low (<70%) Medium(70–97%)
High(97%–99%)
Very High(≥ 99%)
Citations from patents
ari 15 18 13 13 11 10
cdi 32 8 2 9 5 8
rii 26 6 2 7 4 7
dii 16 14 1 1 0 0
rni 12 6 1 3 1 1
Citations from review papers
ari 15 0 0 1 5 9
cdi 32 0 0 0 1 31
rii 26 0 0 0 1 25
dii 16 1 5 9 1 0
rni 12 0 1 0 1 10
Citations from original research papers within 24 months
ari 15 0 0 0 2 13
cdi 32 0 0 0 1 31
rii 26 0 0 0 0 26
dii 16 0 2 13 1 0
rni 12 0 0 0 0 12
The scores for each of the papers in the test set on the dimensions (1) num-ber of citations from patents, (2) number of citations from review papers,and (3) the number of citations received within 24 months after publicationis presented in 6.23. As the distribution of the number of citations is veryskewed, we use the following classification scheme: ‘Not cited’, ‘Low’ (<70%),‘Medium’ (70–97%), ‘High’ (97–99%), and ‘Very High’ (≥ 99%). The numbersbetween parentheses are the percentile boundaries.
6.A.7 Breakout detection specificity of the algorithms
The recall rate for the algorithms is presented for various threshold values.The specificity or recall rates of the algorithms when applied to the two data-sets as a function of the imposed thresholds are presented in Table 6.24 andTable 6.25. Table 6.24 focuses on the Categories dataset and Table 6.25 onthe Clusters dataset. In figures Figure 6.10 and Figure 6.11 this informationis presented in graphical form.
150
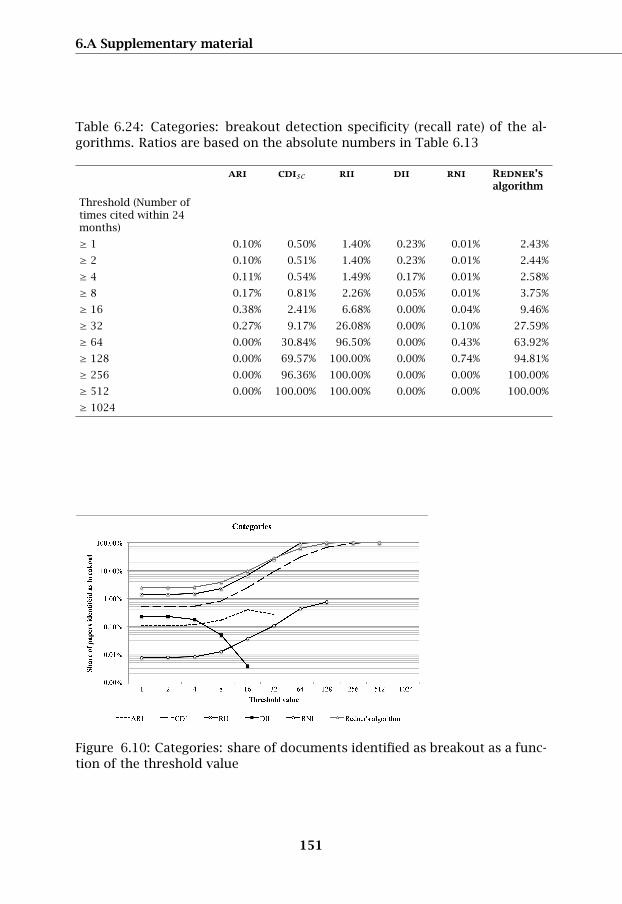
6.A Supplementary material
Table 6.24: Categories: breakout detection specificity (recall rate) of the al-gorithms. Ratios are based on the absolute numbers in Table 6.13
ari cdisc rii dii rni Redner’salgorithm
Threshold (Number oftimes cited within 24months)
≥ 1 0.10% 0.50% 1.40% 0.23% 0.01% 2.43%
≥ 2 0.10% 0.51% 1.40% 0.23% 0.01% 2.44%
≥ 4 0.11% 0.54% 1.49% 0.17% 0.01% 2.58%
≥ 8 0.17% 0.81% 2.26% 0.05% 0.01% 3.75%
≥ 16 0.38% 2.41% 6.68% 0.00% 0.04% 9.46%
≥ 32 0.27% 9.17% 26.08% 0.00% 0.10% 27.59%
≥ 64 0.00% 30.84% 96.50% 0.00% 0.43% 63.92%
≥ 128 0.00% 69.57% 100.00% 0.00% 0.74% 94.81%
≥ 256 0.00% 96.36% 100.00% 0.00% 0.00% 100.00%
≥ 512 0.00% 100.00% 100.00% 0.00% 0.00% 100.00%
≥ 1024
Figure 6.10: Categories: share of documents identified as breakout as a func-tion of the threshold value
151

Validation study
Table 6.25: Clusters: breakout detection specificity (recall rate) of the al-gorithms. Ratios are based on the absolute numbers in Table 6.14
ari cdidc rii dii rni Redner’salgorithm
Threshold (Number oftimes cited within 24months)
≥ 1 0.03% 6.27% 1.63% 0.31% 0.00% 2.94%
≥ 2 0.03% 6.29% 1.64% 0.31% 0.00% 2.95%
≥ 4 0.03% 6.69% 1.74% 0.24% 0.00% 3.13%
≥ 8 0.04% 9.75% 2.54% 0.05% 0.01% 4.23%
≥ 16 0.12% 23.41% 6.78% 0.00% 0.02% 10.02%
≥ 32 0.42% 51.84% 26.19% 0.00% 0.05% 28.04%
≥ 64 0.00% 79.29% 97.64% 0.00% 0.24% 65.07%
≥ 128 0.00% 91.01% 100.00% 0.00% 0.75% 95.13%
≥ 256 0.00% 100.00% 98.15% 0.00% 0.00% 100.00%
≥ 512 0.00% 100.00% 100.00% 0.00% 0.00% 100.00%
≥ 1024
Figure 6.11: Clusters: share of documents identified as breakout as a functionof the threshold value
152

6.A Supplementary material
Table 6.26: Detection probabilities for each algorithm on the two datasets
Categories Clusters
ari 1.041 × 10⁻³ 2.793 × 10⁻⁴
cdi 5.032 × 10⁻³ 6.273 × 10⁻²
rii 1.397 × 10⁻² 1.630 × 10⁻²
dii 2.276 × 10⁻³ 3.137 × 10⁻³
rni 7.494 × 10⁻⁵ 3.724 × 10⁻⁵
Redner 2.425 × 10⁻² 2.938 × 10⁻²
Table 6.27: Categories: expected breakout recall
ari cdisc rii dii rni Redner’salgorithm
Threshold (Number oftimes cited within 24months)
≥ 1 264 1,276 3,543 577 19 6,150
≥ 2 262 1,269 3,525 574 18 6,119
≥ 4 247 1,197 3,325 541 17 5,772
≥ 8 163 788 2,190 356 11 3,802
≥ 16 55 266 740 120 3 1,285
≥ 32 14 68 189 30 1 329
≥ 64 3 15 41 6 0 72
≥ 128 0 2 7 1 0 13
≥ 256 0 0 0 0 0 1
≥ 512 0 0 0 0 0 0
≥ 1024 0 0 0 0 0 0
6.A.8 Detection probability and expected breakout recall rateof the algorithms
In this section the performance of the algorithms, including Redner’s al-gorithm, on the datasets Categories and Clusters is compared with whatmight be expected. The ‘breakout detection probability’ of an algorithm isthe probability that the algorithm selects a paper as breakout paper. Forboth Categories and Clusters, these probabilities are calculated and shownin Table 6.26. We calculated the ‘expected breakout recall’ of the algorithmsby multiplying the appropriate detection probability with the number of pa-pers in a dataset after applying a particular threshold. The expected break-out recall of the algorithms for the two datasets as function of the thresholdis presented in Tables 6.27 and 6.29. The difference between the identifiednumber and the expected number of breakout papers as a percentage of theexpected number is presented in Tables 6.28 and 6.30, and is also shown inFigure 6.12 and Figure 6.13.
153

Validation study
Table 6.28: Categories: difference between the identified number and theexpected number of breakout papers as percentage of the expected numberof breakout papers.
ari cdidc rii dii rni Redner’salgorithm
Threshold (Number oftimes cited within 24months)
≥ 1 0% 0% 0% 0% 0% 0%
≥ 2 1% 1% 1% 0% 6% 1%
≥ 4 7% 7% 7% -24% 12% 6%
≥ 8 62% 62% 62% -79% 73% 55%
≥ 16 271% 379% 379% -98% 533% 290%
≥ 32 157% 1,732% 1,775% -100% 1,300% 1,039%
≥ 64 -100% 6,060% 6,951% -100% 2,560%
≥ 128 18,650% 7,600% -100% 3,831%
≥ 256 5,400%
≥ 512
≥ 1024
Figure 6.12: Categories: difference between the identified number and theexpected number of breakout papers as percentage of the expected numberof breakout papers
154

6.A Supplementary material
Table 6.29: Clusters: expected breakout recall
ari cdisc rii dii rni Redner’salgorithm
Threshold (Number oftimes cited within 24months)
≥ 1 60 13,477 3,501 674 8 6,311
≥ 2 59 13,410 3,483 670 7 6,280
≥ 4 56 12,650 3,286 632 7 5,923
≥ 8 37 8,332 2,164 416 4 3,901
≥ 16 12 2,817 731 140 1 1,319
≥ 32 3 721 187 36 0 338
≥ 64 0 159 41 7 0 74
≥ 128 0 28 7 1 0 13
≥ 256 0 2 0 0 0 1
≥ 512 0 0 0 0 0 0
≥ 1024 0 0 0 0 0 0
Table 6.30: Clusters: difference between the identified number and the ex-pected number of breakout papers as percentage of the expected number ofbreakout papers.
ari cdidc rii dii rni Redner’salgorithm
Threshold (Number oftimes cited within 24months)
≥ 1 0% 0% 0% 0% 0% 0%
≥ 2 2% 0% 1% 0% 14% 0%
≥ 4 7% 7% 7% -24% 14% 6%
≥ 8 62% 61% 62% -82% 100% 50%
≥ 16 400% 329% 379% -99% 700% 293%
≥ 32 1,767% 861% 1,772% -100% 1,009%
≥ 64 1,359% 6,868% -100% 2,473%
≥ 128 1,636% 7,529% -100% 3,808%
≥ 256 2,600% 5,300%
≥ 512
≥ 1024
155

Validation study
Figure 6.13: Categories: difference between the identified number and theexpected number of breakout papers as percentage of the expected numberof breakout papers
Table 6.31: Labels of distribution classes used in tables 6.32–6.40
Label Criterion Description
Top 1% [99.0-100.0% Top 1 %
Top 5% [95.0-99.0)% In Top 5% but not in Top 1%
Top 10% [90.0-95.0)% In Top 10% but not in Top 5%
< Top 10% [0.0-90.0)% Outside Top 10%
6.A.9 Breakout classification
In this section the ‘breakout character’ of the results after applying the al-gorithms is presented. We use the following classification scheme (Table 6.31)for the number of citations received by a paper. On the basis of this classi-fication scheme we obtain Tables 6.32–6.40 in which the number of citationsfrom review papers is the first dimension (rows) and the number of citationreceived from patents the second dimension (columns). In Table 6.35 we showthe effect of the algorithms by comparing the results presented in Table 6.34with identified breakouts with the distribution for all papers (Table 6.33). A‘+’ in a cell means that after applying the algorithms the concentration ofthe papers in this cell is higher than in comparable cell in the total dataset(Table 6.33), and a ‘-’ means that the concentration is lower. The algorithmssucceed in selecting papers after 20+ years belong to the papers highly citedby review papers, and by patents.
156

6.A Supplementary material
Table 6.32: Categorisation of all 1990–1994 papers (articles, letters) citedwithin 24 months, along the two dimensions ‘cited by review papers’ and‘cited by patents’. Based on citation counts from the moment of publicationuntil 2015.
Citations by patents
Citationsby reviewpapers
< Top 10% Top 10% Top 5% Top 1%
Top 1% 14,262 2,402 1,679 508
Top 5% 146,335 7,416 3,326 544
Top 10% 524,749 9,472 3,214 420
< Top 10% 1,073,108 13,137 4,102 571
Table 6.33: Distribution of all 1990–1994 papers (articles, letters) cited within24 months, along the two dimensions ‘cited by review papers’ and ‘cited bypatents’. Based on citation counts from the moment of publication until 2015.
Citations by patents
Citationsby reviewpapers
< Top 10% Top 10% Top 5% Top 1%
Top 1% 0.79% 0.13% 0.09% 0.03%
Top 5% 8.11% 0.41% 0.18% 0.03%
Top 10% 29.07% 0.52% 0.18% 0.02%
< Top 10% 59.44% 0.73% 0.23% 0.03%
Table 6.34: Categorisation of all 1990-1994 papers (articles, letters) includingpapers not citeda within 24 months, along the two dimensions ‘cited by reviewpapers’ and ‘cited by patents’. Based on citation counts from the moment ofpublication until 2015.
Citations by patents
Citationsby reviewpapers
< Top 10% Top 10% Top 5% Top 1%
Top 1% 14,263 2,403 1,680 511
Top 5% 146,378 7,428 3,327 548
Top 10% 524,874 9,488 3,223 420
< Top 10% 2,690,150 13,163 4,110 572a These papers are included in the cell (<Top 10%, <Top 10%)
157

Validation study
Table 6.35: Distribution of all 1990-1994 papers (articles, letters) includingpapers not citedb within 24 months, along the two dimensions ‘cited by reviewpapers’ and ‘cited by patents’. Based on citation counts from the moment ofpublication until 2015.
Citations by patents
Citationsby reviewpapers
< Top 10% Top 10% Top 5% Top 1%
Top 1% 0.42% 0.07% 0.05% 0.01%
Top 5% 4.28% 0.22% 0.10% 0.02%
Top 10% 15.34% 0.28% 0.09% 0.01%
< Top 10% 78.60% 0.38% 0.12% 0.02%b These papers are included in the cell (<Top 10%, <Top 10%)
Table 6.36: Categorisation of all 1990-1994 papers (articles, letters) identifiedas a breakout paper, along the two dimensions ‘cited by review papers’ and‘cited by patents’. Based on citation counts from the moment of publicationuntil 2015.
Citations by patents
Citationsby reviewpapers
< Top 10% Top 10% Top 5% Top 1%
Top 1% 1,947 1162 916 267
Top 5% 1,744 745 379 70
Top 10% 1,104 297 128 17
< Top 10% 1,831 376 109 14
Table 6.37: Distribution of all 1990-1994 papers (articles, letters) identifiedas a breakout paper, along the two dimensions ‘cited by review papers’ and‘cited by patents’. Based on citation counts from the moment of publicationuntil 2015.
Citations by patents
Citationsby reviewpapers
< Top 10% Top 10% Top 5% Top 1%
Top 1% 17.53% 10.46% 8.25% 2.40%
Top 5% 15.70% 6.71% 3.41% 0.63%
Top 10% 9.94% 2.67% 1.15% 0.15%
< Top 10% 16.49% 3.39% 0.98% 0.13%
158

6.A Supplementary material
Table 6.38: Effect of applying the algorithms to the complete dataset withpapers (articles, letters) from 1990–1994
Citations by patents
Citationsby reviewpapers
< Top 10% Top 10% Top 5% Top 1%
Top 1% + + + +
Top 5% - + + +
Top 10% - + + +
< Top 10% - + + +
Table 6.39: Categorisation along the two dimensions of all 1990-1994 papers(articles, letters) that are not cited within 24 months, but are cited at leastonce at a later moment. Based on citation counts from the moment of public-ation until 2015.
Citations by patents
Citationsby reviewpapers
< Top 10% Top 10% Top 5% Top 1%
Top 1% 34 1 2
Top 5% 2,788 63 27 4
Top 10% 53,586 509 141
< Top 10% 346,343 3,661 1,029 141
Table 6.40: Distribution along the two dimensions of all 1990–1994 papers(articles, letters) that are not cited within 24 months, but are cited at leastonce at a later moment. Based on citation counts from the moment of public-ation until 2015.
Citations by patents
Citationsby reviewpapers
< Top 10% Top 10% Top 5% Top 1%
Top 1% 0.01% 0.00% 0.00% 0.00%
Top 5% 0.68% 0.02% 0.01% 0.00%
Top 10% 13.12% 0.12% 0.03% 0.00%
< Top 10% 84.83% 0.90% 0.25% 0.03%
159

Validation study
160