ea/rir/irfa for 2 week closure of cape sarichef area to ... · viii regulatory impact review (rir)...
TRANSCRIPT

ENVIRONMENTAL ASSESSMENT/REGULATORY IMPACT REVIEW/
INITIAL REGULATORY FLEXIBILITY ANALYSIS
For a Regulatory Amendment to Provide a Two-Week Trawl Closure Near Unimak Passto Facilitate an Experiment Investigating the Effects of Commercial Fishing
on Local Abundance of Pacific Cod
Implemented Under The Authority Of The Fishery Management Plan For The
Groundfish Fishery of the Bering Sea and Aleutian Islands
September 2002
Lead Agency: National Marine Fisheries ServiceAlaska Fisheries Science CenterSeattle, Washington
and theAlaska Regional OfficeNational Marine Fisheries ServiceJuneau, Alaska
Responsible Official James W. BalsigerRegional AdministratorAlaska Regional Office
For Further Information Contact:M. Elizabeth ConnersAlaska Fisheries Science Center7600 Sand Point Way NESeattle, WA 98115-6349(206) 526-4465
orBen Muse National Marine Fisheries ServiceP. O. Box 21668Juneau, AK 99802(907) 586-7228
Abstract: This Environmental Assessment/Regulatory Impact Review/Initial Regulatory FlexibilityAnalysis (EA/RIR/IRFA) provides an analysis of a proposed regulatory amendment. Approval of theregulatory amendment would impose a two-week ban on trawl fishing in the specified area near UnimakPass in the eastern Bering Sea. This short-term closure would be in effect between March 15 and March31 in the years 2003 - 2006. The changes in fishing regulations are needed to permit NMFS to conductunimpeded experiments on the effects of commercial trawling on local abundance of Pacific cod, as partof a comprehensive research program on sea lion/fishery interactions. The EA/RIR/IRFA provides ananalysis of the expected impacts of proposed regulations on groundfish target species stock status, higherand lower trophic level species, and the physical and socioeconomic environment.

ii
(This page intentionally left blank)
iii
TABLE OF CONTENTS
LIST OF FIGURES . . . . . . . . . . . . . . . . . . . . . . . . . . . . . . . . . . . . . . . . . . . . . . . . . . . . . . . . . . . . . . . . . . v
LIST OF TABLES . . . . . . . . . . . . . . . . . . . . . . . . . . . . . . . . . . . . . . . . . . . . . . . . . . . . . . . . . . . . . . . . . . . v
EXECUTIVE SUMMARY . . . . . . . . . . . . . . . . . . . . . . . . . . . . . . . . . . . . . . . . . . . . . . . . . . . . . . . . . . . vii
1.0 PURPOSE AND NEED FOR ACTION . . . . . . . . . . . . . . . . . . . . . . . . . . . . . . . . . . . . . . . . . . . . . . 11.1 Overview of the Cape Sarichef Cod Pot Study and Need for Action . . . . . . . . . . . . . . . . . . . . 11.2 Alternatives Considered . . . . . . . . . . . . . . . . . . . . . . . . . . . . . . . . . . . . . . . . . . . . . . . . . . . . . 6
2.0 AFFECTED ENVIRONMENT . . . . . . . . . . . . . . . . . . . . . . . . . . . . . . . . . . . . . . . . . . . . . . . . . . . . 72.1 Study Area . . . . . . . . . . . . . . . . . . . . . . . . . . . . . . . . . . . . . . . . . . . . . . . . . . . . . . . . . . . . . . . 72.2 NEPA Documents Concerning the Affected Area . . . . . . . . . . . . . . . . . . . . . . . . . . . . . . . . . 72.3 Status of Groundfish Fisheries and Management in the Study Area . . . . . . . . . . . . . . . . . . . 82.4 Status of Prohibited Species . . . . . . . . . . . . . . . . . . . . . . . . . . . . . . . . . . . . . . . . . . . . . . . . . . 82.5 Status of Marine Mammal Species . . . . . . . . . . . . . . . . . . . . . . . . . . . . . . . . . . . . . . . . . . . . 122.6 Seabird Species Population Status . . . . . . . . . . . . . . . . . . . . . . . . . . . . . . . . . . . . . . . . . . . . 122.7 Status of Marine Habitat . . . . . . . . . . . . . . . . . . . . . . . . . . . . . . . . . . . . . . . . . . . . . . . . . . . . 132.8 Status of Endangered or Threatened Species . . . . . . . . . . . . . . . . . . . . . . . . . . . . . . . . . . . . 13
3.0 ENVIRONMENTAL IMPACTS OF THE ALTERNATIVES . . . . . . . . . . . . . . . . . . . . . . . . . . . 153.1 Environmental Impact of the No-Action Alternative . . . . . . . . . . . . . . . . . . . . . . . . . . . . . . 153.2 Environmental Impacts of Closure Alternatives . . . . . . . . . . . . . . . . . . . . . . . . . . . . . . . . . 15
3.2.1 Effects on Distribution of Fishing Effort . . . . . . . . . . . . . . . . . . . . . . . . . . . . . . . . . 153.2.2 Effects on BSAI Groundfish . . . . . . . . . . . . . . . . . . . . . . . . . . . . . . . . . . . . . . . . . . . 183.2.3 Effects on Bycatch and Incidental Catch of Prohibited Species . . . . . . . . . . . . . . . 183.2.4 Effects on Marine Mammals and ESA Listed Species . . . . . . . . . . . . . . . . . . . . . . . 183.2.5 Effects on Essential Fish Habitat, Benthic Habitat, and Water Quality . . . . . . . . . . 183.2.6 Socio-Economic Impacts . . . . . . . . . . . . . . . . . . . . . . . . . . . . . . . . . . . . . . . . . . . . . 19
4.0 EA SUMMARY & CONCLUSIONS . . . . . . . . . . . . . . . . . . . . . . . . . . . . . . . . . . . . . . . . . . . . . . 20
5.0 REGULATORY IMPACT REVIEW . . . . . . . . . . . . . . . . . . . . . . . . . . . . . . . . . . . . . . . . . . . . . . 235.1 Introduction . . . . . . . . . . . . . . . . . . . . . . . . . . . . . . . . . . . . . . . . . . . . . . . . . . . . . . . . . . . . . 235.2 What is a Regulatory Impact Review? . . . . . . . . . . . . . . . . . . . . . . . . . . . . . . . . . . . . . . . . . 235.3 Statutory authority . . . . . . . . . . . . . . . . . . . . . . . . . . . . . . . . . . . . . . . . . . . . . . . . . . . . . . . . 245.4 Purpose and need for action . . . . . . . . . . . . . . . . . . . . . . . . . . . . . . . . . . . . . . . . . . . . . . . . . 245.5 Alternatives considered . . . . . . . . . . . . . . . . . . . . . . . . . . . . . . . . . . . . . . . . . . . . . . . . . . . . 275.6 Description of fishery . . . . . . . . . . . . . . . . . . . . . . . . . . . . . . . . . . . . . . . . . . . . . . . . . . . . . . 285.7 Benefits of the alternatives . . . . . . . . . . . . . . . . . . . . . . . . . . . . . . . . . . . . . . . . . . . . . . . . . . 385.8 Costs of the alternatives . . . . . . . . . . . . . . . . . . . . . . . . . . . . . . . . . . . . . . . . . . . . . . . . . . . . 435.9 Impacts on fishing communities . . . . . . . . . . . . . . . . . . . . . . . . . . . . . . . . . . . . . . . . . . . . . . 445.10 Impacts on minority and low-income populations . . . . . . . . . . . . . . . . . . . . . . . . . . . . . . . . 455.11 Summary of the benefits and costs . . . . . . . . . . . . . . . . . . . . . . . . . . . . . . . . . . . . . . . . . . . . 455.12 Summary of the significance criteria . . . . . . . . . . . . . . . . . . . . . . . . . . . . . . . . . . . . . . . . . . 46
iv
5.13 Data Sources . . . . . . . . . . . . . . . . . . . . . . . . . . . . . . . . . . . . . . . . . . . . . . . . . . . . . . . . . . . . . 47
6.0 INITIAL REGULATORY FLEXIBILITY ANALYSIS . . . . . . . . . . . . . . . . . . . . . . . . . . . . . . . . 496.1 Introduction . . . . . . . . . . . . . . . . . . . . . . . . . . . . . . . . . . . . . . . . . . . . . . . . . . . . . . . . . . . . . 496.2 The purpose of an IRFA . . . . . . . . . . . . . . . . . . . . . . . . . . . . . . . . . . . . . . . . . . . . . . . . . . . . 496.3 What is required in an IRFA? . . . . . . . . . . . . . . . . . . . . . . . . . . . . . . . . . . . . . . . . . . . . . . . . 506.4 What is a small entity? . . . . . . . . . . . . . . . . . . . . . . . . . . . . . . . . . . . . . . . . . . . . . . . . . . . . . 506.5 What is this action? . . . . . . . . . . . . . . . . . . . . . . . . . . . . . . . . . . . . . . . . . . . . . . . . . . . . . . . 526.6 Reason for considering the proposed action . . . . . . . . . . . . . . . . . . . . . . . . . . . . . . . . . . . . . 526.7 Objectives of, and legal basis for, the proposed action . . . . . . . . . . . . . . . . . . . . . . . . . . . . 526.8 Number and description of small entities affected by the proposed action . . . . . . . . . . . . . 536.9 Impacts on regulated small entities . . . . . . . . . . . . . . . . . . . . . . . . . . . . . . . . . . . . . . . . . . . 546.10 Recordkeeping and reporting requirements . . . . . . . . . . . . . . . . . . . . . . . . . . . . . . . . . . . . . 556.11 Federal rules that may duplicate, overlap, or conflict with proposed action . . . . . . . . . . . . 556.12 Description of significant alternatives . . . . . . . . . . . . . . . . . . . . . . . . . . . . . . . . . . . . . . . . . 55
7.0 LIST OF PREPARERS . . . . . . . . . . . . . . . . . . . . . . . . . . . . . . . . . . . . . . . . . . . . . . . . . . . . . . . . . 57
8.0 LIST OF PEOPLE CONSULTED . . . . . . . . . . . . . . . . . . . . . . . . . . . . . . . . . . . . . . . . . . . . . . . . . 57
8.0 LITERATURE CITED . . . . . . . . . . . . . . . . . . . . . . . . . . . . . . . . . . . . . . . . . . . . . . . . . . . . . . . . . 59
APPENDIX A . . . . . . . . . . . . . . . . . . . . . . . . . . . . . . . . . . . . . . . . . . . . . . . . . . . . . . . . . . . . . . Appen. A-1

v
LIST OF FIGURES
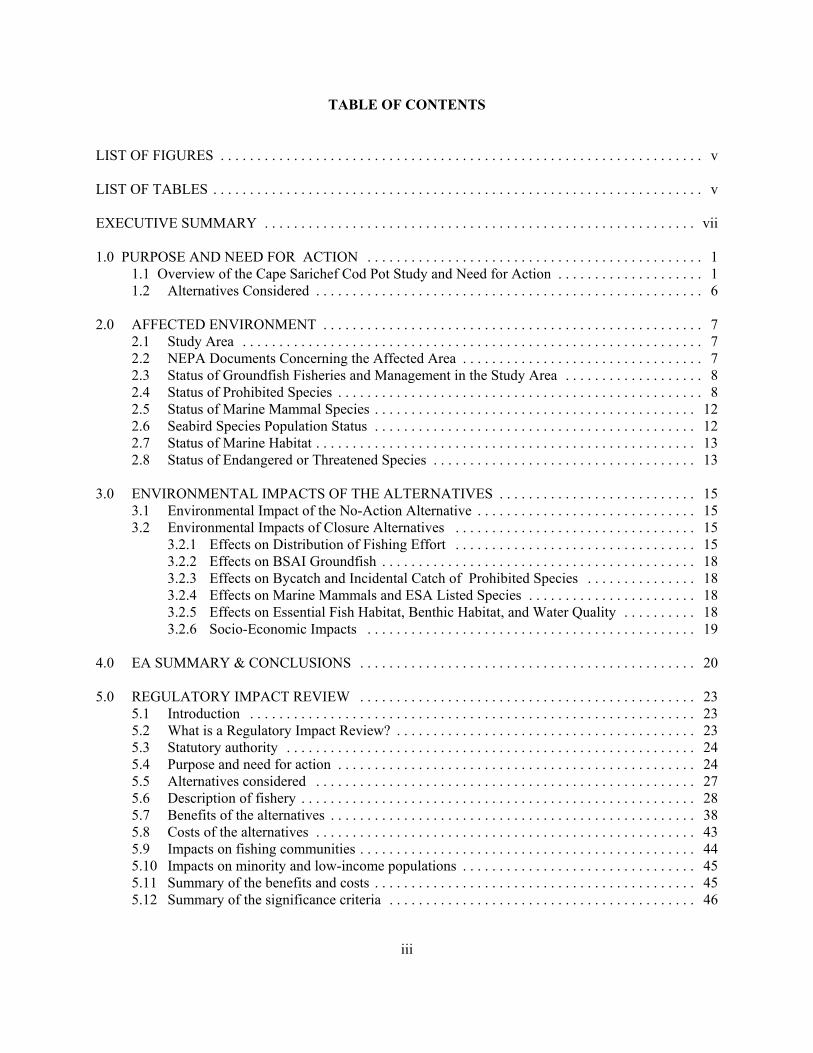
Figure 1.1-1 General location of Unimak Pass study area, and NMFS statistical reporting areas in thesoutheast Bering Sea. . . . . . . . . . . . . . . . . . . . . . . . . . . . . . . . . . . . . . . . . . . . . . . . . . . . . 3
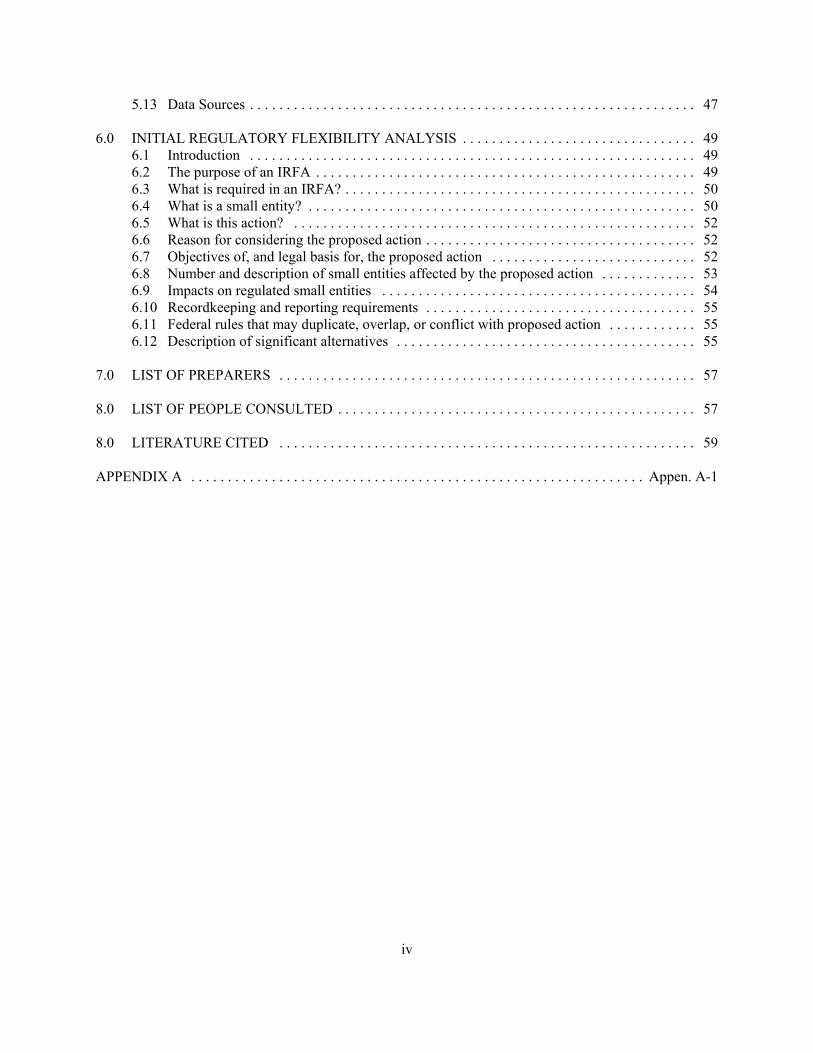
Figure 1.1-2 Closeup of study area for NMFS cod pot fishery interaction study, including 10 meterdepth contours. . . . . . . . . . . . . . . . . . . . . . . . . . . . . . . . . . . . . . . . . . . . . . . . . . . . . . . . . . 4
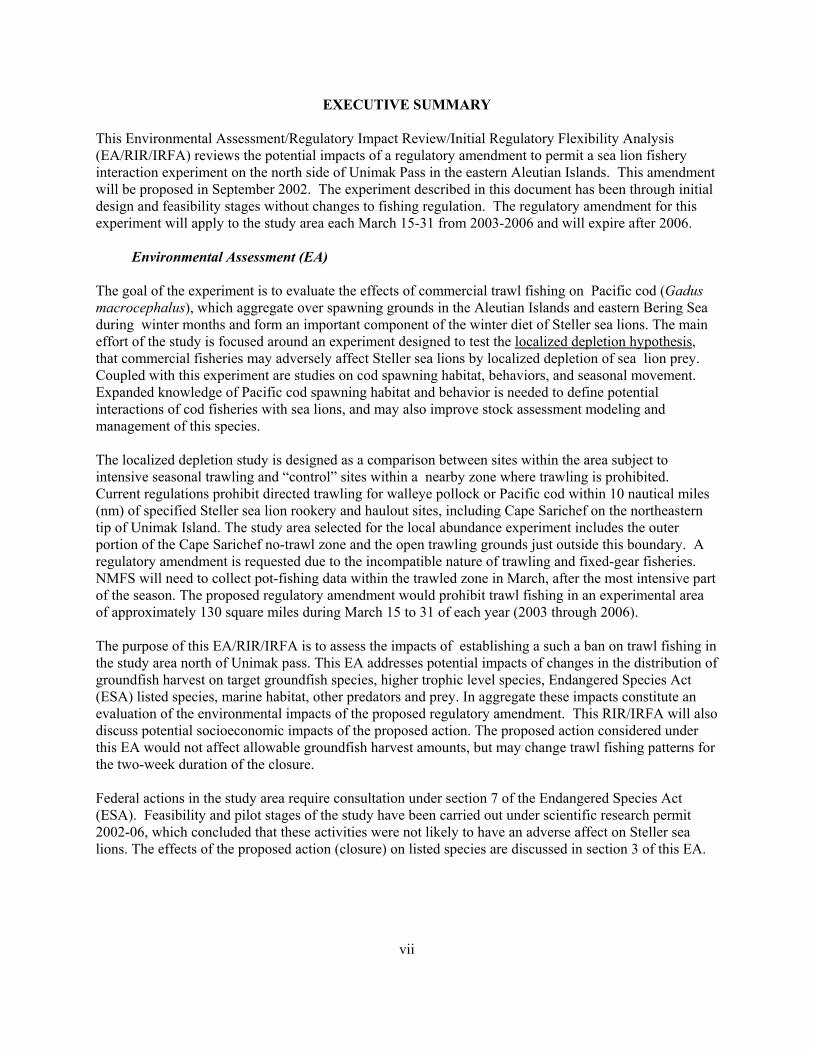
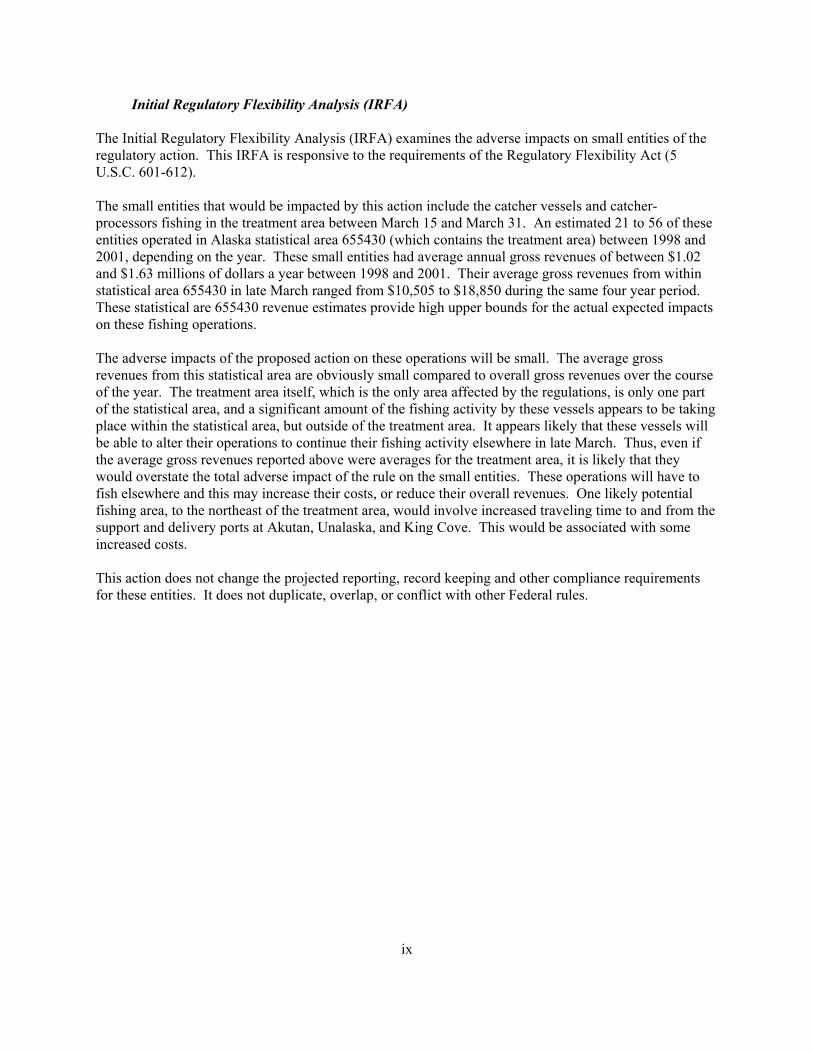
Figure 1.1-3 Location of proposed closure for cod fishery interaction study, March 2003-2006. . . . . 5Figure 3.2-1 Seasonal timing of cod harvest from federal statistical area 517 from 1998 through 2002.
. . . . . . . . . . . . . . . . . . . . . . . . . . . . . . . . . . . . . . . . . . . . . . . . . . . . . . . . . . . . . . . . . . . . 17Figure 5.5-1 Area to be closed under Alternatives 2 and 3 . . . . . . . . . . . . . . . . . . . . . . . . . . . . . . . . 25Figure 5.6-1 Communities where groundfish from the proposed closure area are landed . . . . . . . . . 36
LIST OF TABLES
Table 1.2-1 Description of the alternatives . . . . . . . . . . . . . . . . . . . . . . . . . . . . . . . . . . . . . . . . . . . . . 6Table 2.3-1 Estimated catch by weight from the Bering Sea/ Aleutian Islands region for 1999-2002,
by federal statistical reporting areas shown in Figure 1.1-1 . . . . . . . . . . . . . . . . . . . . . 10Table 2.3-2 Distribution of commercial catch of all species and of Pacific cod for the BSAI region by
quarter and gear type . . . . . . . . . . . . . . . . . . . . . . . . . . . . . . . . . . . . . . . . . . . . . . . . . . . 11Table 2.8-1 ESA listed and candidate species whose range inclused the Unimak Pass study area in the
eastern Bering Sea . . . . . . . . . . . . . . . . . . . . . . . . . . . . . . . . . . . . . . . . . . . . . . . . . . . . . 14Table 3.2-1 Use of Study Region by Gear Types . . . . . . . . . . . . . . . . . . . . . . . . . . . . . . . . . . . . . . . 16Table 5.5-1 Description of the alternatives . . . . . . . . . . . . . . . . . . . . . . . . . . . . . . . . . . . . . . . . . . . . 28Table 5.6-1 Numbers of vessels fishing groundfish in Alaska statistical area 655430 in the second
half of March by year and by gear type . . . . . . . . . . . . . . . . . . . . . . . . . . . . . . . . . . . . . 31Table 5.6-2 Groundfish harvests from Alaska statistical stat area 655430 in the second half of March
by year in metric tons . . . . . . . . . . . . . . . . . . . . . . . . . . . . . . . . . . . . . . . . . . . . . . . . . . . 31Table 5.6-3 Vessel level and processor level gross revenues from fishing groundfish in Alaska
statistical area 655430 in the second half of March . . . . . . . . . . . . . . . . . . . . . . . . . . . . 32Table 5.6-4 Second half of March Pacific cod harvests from Federal statistical reporting area 517,
1998-2002. . . . . . . . . . . . . . . . . . . . . . . . . . . . . . . . . . . . . . . . . . . . . . . . . . . . . . . . . . . . 33Table 5.6-5 Groundfish harvests from Area 655430 in the second half of March as a percent of
harvests from other areas in the second half of March for vessels fishing in Area 655430in the second half of March . . . . . . . . . . . . . . . . . . . . . . . . . . . . . . . . . . . . . . . . . . . . . . 34
Table 5.6-6 Numbers of vessels fishing groundfish in Alaska statistical area 655430 in the secondhalf of March in more than one year, 1998-2002 . . . . . . . . . . . . . . . . . . . . . . . . . . . . . 34
Table 5.6-7 Location and volume of deliveries of unprocessed groundfish harvested in Alaskastatistical area 655430 in the second half of March, 1998-2002 . . . . . . . . . . . . . . . . . . 36
Table 5.6-8 Percent of the population claiming membership in six racial groups on the 2000 census inUnalaska, Akutan, and King Cove . . . . . . . . . . . . . . . . . . . . . . . . . . . . . . . . . . . . . . . . . 37
Table 5.6.9 Low income populations in Akutan, Unalaska, and King Cove . . . . . . . . . . . . . . . . . . 37Table 5.6-10 Alaska statistical area 655430 vessel groundfish harvest values in the second half of
March by state of residence of vessel owner . . . . . . . . . . . . . . . . . . . . . . . . . . . . . . . . . 38Table 5.6-11 Communties with resident vessel owners whose vessels are active in the treatment area
. . . . . . . . . . . . . . . . . . . . . . . . . . . . . . . . . . . . . . . . . . . . . . . . . . . . . . . . . . . . . . . . . . . . 38

vi
Table 5.11-1 Summary of the cost and benefit analysis . . . . . . . . . . . . . . . . . . . . . . . . . . . . . . . . . . . 46Table 6.8-1 Large and small entities groundfish fishing in Alaska statistical area 655430 in the second
half of March . . . . . . . . . . . . . . . . . . . . . . . . . . . . . . . . . . . . . . . . . . . . . . . . . . . . . . . . . 53Table 6.12-1 Alternatives subjected to detailed study . . . . . . . . . . . . . . . . . . . . . . . . . . . . . . . . . . . . . 56
vii
EXECUTIVE SUMMARY
This Environmental Assessment/Regulatory Impact Review/Initial Regulatory Flexibility Analysis(EA/RIR/IRFA) reviews the potential impacts of a regulatory amendment to permit a sea lion fisheryinteraction experiment on the north side of Unimak Pass in the eastern Aleutian Islands. This amendmentwill be proposed in September 2002. The experiment described in this document has been through initialdesign and feasibility stages without changes to fishing regulation. The regulatory amendment for thisexperiment will apply to the study area each March 15-31 from 2003-2006 and will expire after 2006.
Environmental Assessment (EA)
The goal of the experiment is to evaluate the effects of commercial trawl fishing on Pacific cod (Gadusmacrocephalus), which aggregate over spawning grounds in the Aleutian Islands and eastern Bering Seaduring winter months and form an important component of the winter diet of Steller sea lions. The maineffort of the study is focused around an experiment designed to test the localized depletion hypothesis,that commercial fisheries may adversely affect Steller sea lions by localized depletion of sea lion prey.Coupled with this experiment are studies on cod spawning habitat, behaviors, and seasonal movement. Expanded knowledge of Pacific cod spawning habitat and behavior is needed to define potentialinteractions of cod fisheries with sea lions, and may also improve stock assessment modeling andmanagement of this species.
The localized depletion study is designed as a comparison between sites within the area subject tointensive seasonal trawling and “control” sites within a nearby zone where trawling is prohibited. Current regulations prohibit directed trawling for walleye pollock or Pacific cod within 10 nautical miles(nm) of specified Steller sea lion rookery and haulout sites, including Cape Sarichef on the northeasterntip of Unimak Island. The study area selected for the local abundance experiment includes the outerportion of the Cape Sarichef no-trawl zone and the open trawling grounds just outside this boundary. Aregulatory amendment is requested due to the incompatible nature of trawling and fixed-gear fisheries.NMFS will need to collect pot-fishing data within the trawled zone in March, after the most intensive partof the season. The proposed regulatory amendment would prohibit trawl fishing in an experimental areaof approximately 130 square miles during March 15 to 31 of each year (2003 through 2006).
The purpose of this EA/RIR/IRFA is to assess the impacts of establishing a such a ban on trawl fishing inthe study area north of Unimak pass. This EA addresses potential impacts of changes in the distribution ofgroundfish harvest on target groundfish species, higher trophic level species, Endangered Species Act(ESA) listed species, marine habitat, other predators and prey. In aggregate these impacts constitute anevaluation of the environmental impacts of the proposed regulatory amendment. This RIR/IRFA will alsodiscuss potential socioeconomic impacts of the proposed action. The proposed action considered underthis EA would not affect allowable groundfish harvest amounts, but may change trawl fishing patterns forthe two-week duration of the closure.
Federal actions in the study area require consultation under section 7 of the Endangered Species Act(ESA). Feasibility and pilot stages of the study have been carried out under scientific research permit2002-06, which concluded that these activities were not likely to have an adverse affect on Steller sealions. The effects of the proposed action (closure) on listed species are discussed in section 3 of this EA.

viii
Regulatory Impact Review (RIR)
The Regulatory Impact Review (RIR) provides a cost benefit analysis of this action, identifying andsummarizing the tradeoffs associated with the alternatives. The RIR is required under PresidentialExecutive Order (E.O.) 12866 (58 FR 51735; October 4, 1993).
The most important fleet segment in this statistical area in the second half of March in recent years (1998-2001) has been medium sized (60-125 foot) bottom trawlers targeting Pacific cod and delivering them toshoreside processors. The relative size of this fleet decreased, however, during this period. Vessels ofthis description harvested 78% of the groundfish from the statistical area in 1998, but (although thelargest number of active vessels remained bottom trawlers) their share declined to 31% of the harvest in2001. This decline was paralleled by an overall decline in harvests from this area over the period. It was,in fact, the decline in the harvests by this class of vessel which accounted for most of the decline inoverall harvest from the area.
The smaller numbers of vessels in 2000 and 2001, and potential confidentiality issues, make it difficult tocharacterize the changes in the fleet. However, as harvests by the vessels described above declined,harvests by vessels with other characteristics became relatively more important. Catcher-processorsbecame more important in 2000 and 2001. Pot gear, in particular became important in 2001, accountingfor a third of the harvest that year. Harvests from vessels targeting Pacific cod declined somewhat, butremained high.
The first wholesale value of production from this statistical area in the second half of March rangedbetween $1.24 and $2.67 million dollars per year over the period. Catcher vessels, which were the largestproducing segment in the fishery, delivered their product to Akutan, Unalaska/Dutch Harbor, and KingCove. The first wholesale value of deliveries to these ports ranged between $860,000 in 2001 and $2.55million in 1999. Most of the vessels active in the fishery were owned by persons in Washington andOregon. Some were owned by persons in Alaska, California, and Maine.
Alternative 1 is the status quo and no action alternative. It is used here as the baseline against which tocompare the other alternatives.
Alternative 2 will close the treatment area to all trawling between March 15 and March 31. This willprotect the statistical power of the experiment. Results have a greater likelihood of being useful formanagement decision making. The cost of experimental pot losses due to trawl-pot conflicts may belower. Vessels are expected to shift most of their fishing effort elsewhere. They may have increased costsdue to the additional travel time required to fish somewhat further from Akutan, Dutch Harbor or KingCove. Revenue losses are expected to be minor. Community impacts, and impacts on minority and lowincome communities are also expected to be minor.
Alternative 3 will close the treatment area to all trawling, and to longlining and fishing with pots, betweenMarch 15 and March 31. This alternative has benefits similar to those for Alt 2. In addition, thisalternative may prevent an influx of pot and longline gear into the treatment area while the trawl gear isrestricted. An influx of pot, and particularly of longline, gear may distort the harvest rates obtained fromthe experimental pots. Large removals during the period could result in decreases in local abundance thatwould be interpreted as a trawl effect. This alternative has costs similar to those for trawlers under Alt 2. The potential for cost and revenue impacts is increased due to the restriction on pot and longline gear.Total cost and revenues impacts are still expected to be small, as are community impacts, and impacts onminority and low income communities.
ix
Initial Regulatory Flexibility Analysis (IRFA)
The Initial Regulatory Flexibility Analysis (IRFA) examines the adverse impacts on small entities of theregulatory action. This IRFA is responsive to the requirements of the Regulatory Flexibility Act (5U.S.C. 601-612).
The small entities that would be impacted by this action include the catcher vessels and catcher-processors fishing in the treatment area between March 15 and March 31. An estimated 21 to 56 of theseentities operated in Alaska statistical area 655430 (which contains the treatment area) between 1998 and2001, depending on the year. These small entities had average annual gross revenues of between $1.02and $1.63 millions of dollars a year between 1998 and 2001. Their average gross revenues from withinstatistical area 655430 in late March ranged from $10,505 to $18,850 during the same four year period. These statistical are 655430 revenue estimates provide high upper bounds for the actual expected impactson these fishing operations.
The adverse impacts of the proposed action on these operations will be small. The average grossrevenues from this statistical area are obviously small compared to overall gross revenues over the courseof the year. The treatment area itself, which is the only area affected by the regulations, is only one partof the statistical area, and a significant amount of the fishing activity by these vessels appears to be takingplace within the statistical area, but outside of the treatment area. It appears likely that these vessels willbe able to alter their operations to continue their fishing activity elsewhere in late March. Thus, even ifthe average gross revenues reported above were averages for the treatment area, it is likely that theywould overstate the total adverse impact of the rule on the small entities. These operations will have tofish elsewhere and this may increase their costs, or reduce their overall revenues. One likely potentialfishing area, to the northeast of the treatment area, would involve increased traveling time to and from thesupport and delivery ports at Akutan, Unalaska, and King Cove. This would be associated with someincreased costs.
This action does not change the projected reporting, record keeping and other compliance requirementsfor these entities. It does not duplicate, overlap, or conflict with other Federal rules.

x
(This page intentionally left blank)

1
1.0 PURPOSE AND NEED FOR ACTION
An EA must include a brief discussion of the need for the proposal, the alternatives considered, theaffected environment, the environmental impacts of the proposed action and the alternatives, and a list ofdocument preparers. The purpose and alternatives will be in Sections 1.1 and 1.2. Section 2 describes theaffected environment. Section 3 and 4 contain a discussion of the environmental impacts includingimpacts on threatened and endangered species and marine mammals. Sections 5 and 6 provide theRIR/IRFA. The list of preparers is in Section 7.
1.1 Overview of the Cape Sarichef Cod Pot Study and Need for Action
The groundfish fisheries in the Exclusive Economic Zone (3 to 200 miles offshore) of the Bering Sea aremanaged under a fishery management plan (FMP). The Bering Sea FMP (NPFMC 1999) was developedby the North Pacific Fishery Management Council (Council) under the Magnuson-Stevens FisheryConservation and Management Act (MSFCMA), P. L. 94-265, 16 U.S.C. 1801 (MSFCMA). The BSAIFMP was approved by the Secretary of Commerce (Secretary) and became effective in 1978 and updatedJuly 6, 1999. In response to NMFS stewardship responsibilities identified in the MSFCMA, the ESA andthe Marine Mammal Protection Act (MMPA), fishery regulations were changed to ensure that the BSAIand GOA groundfish fisheries neither jeopardize the continued existence of the western distinctpopulation segment (DPS) of endangered Steller sea lions nor adversely modify its critical habitat.
Currently the information available to evaluate alternative methods for protecting Steller sea lions andtheir habitat is very limited. This can result in the use of less effective and less efficient managementmeasures. NMFS has proposed a field experiment near Unimak Pass in order to improve the informationavailable to assess further management actions to protect Steller sea lions and their habitat (See AppendixA for full project description). This study is an integral part of a NMFS comprehensive research programdesigned to evaluate effects of fishing on the foraging behavior of Steller sea lions.
The goal of the experiment is to evaluate the effects of commercial trawl fishing on of Pacific cod (Gadusmacrocephalus), which aggregate over spawning grounds in the Aleutian Islands and southeastern BeringSea during winter months and form an important component of the winter diet of Steller sea lions. Themain effort of the study is focused around an experiment designed to test the localized depletionhypothesis, that commercial fisheries may adversely affect Steller sea lions by localized depletion of sea lion prey. This study is designed as a comparison between sites within the area subject to intensiveseasonal trawling and “control” sites within a nearby zone where trawling is prohibited. Coupled withthis experiment are studies of on cod spawning habitat, behaviors, and seasonal movement. A completedescription of the localized depletion study and summaries of associated biological studies are attached asAppendix A Expanded knowledge of Pacific cod spawning habitat and behavior is needed to definepotential interactions of cod fisheries with sea lions, and may also improve stock assessment modelingand management of this species.
Commercial trawling for Pacific cod during the winter season is heavily focused on an area immediatelynorth of Unimak pass and Unimak Island in the southeastern Bering Sea (Figure 1.1-1). The revisedregulations for protection of Steller Sea Lions in 2002 prohibit directed trawling for walleye pollock orPacific cod within 10 nautical miles (nm) of specified BSAI Steller sea lion rookery and haulout sites,including a rookery at Billings Head on Akun Island and a haulout at Cape Sarichef on Unimak Island. These trawl exclusion zones bracket the northeastern and northwestern sides, respectively, of UnimakPass (Figure 1.1-2). The Cape Sarichef zone, in particular, intersects the area that has historically been
2
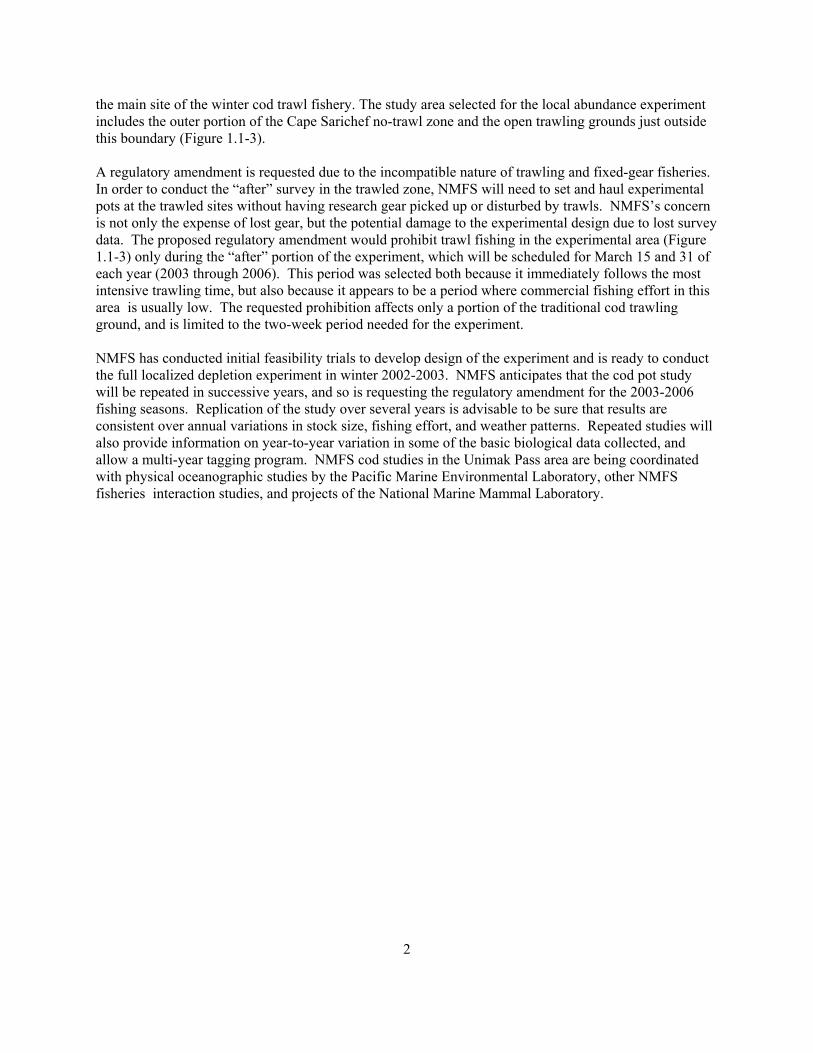
the main site of the winter cod trawl fishery. The study area selected for the local abundance experimentincludes the outer portion of the Cape Sarichef no-trawl zone and the open trawling grounds just outsidethis boundary (Figure 1.1-3).
A regulatory amendment is requested due to the incompatible nature of trawling and fixed-gear fisheries. In order to conduct the “after” survey in the trawled zone, NMFS will need to set and haul experimentalpots at the trawled sites without having research gear picked up or disturbed by trawls. NMFS’s concern is not only the expense of lost gear, but the potential damage to the experimental design due to lost surveydata. The proposed regulatory amendment would prohibit trawl fishing in the experimental area (Figure1.1-3) only during the “after” portion of the experiment, which will be scheduled for March 15 and 31 ofeach year (2003 through 2006). This period was selected both because it immediately follows the mostintensive trawling time, but also because it appears to be a period where commercial fishing effort in thisarea is usually low. The requested prohibition affects only a portion of the traditional cod trawlingground, and is limited to the two-week period needed for the experiment.
NMFS has conducted initial feasibility trials to develop design of the experiment and is ready to conductthe full localized depletion experiment in winter 2002-2003. NMFS anticipates that the cod pot studywill be repeated in successive years, and so is requesting the regulatory amendment for the 2003-2006fishing seasons. Replication of the study over several years is advisable to be sure that results areconsistent over annual variations in stock size, fishing effort, and weather patterns. Repeated studies willalso provide information on year-to-year variation in some of the basic biological data collected, andallow a multi-year tagging program. NMFS cod studies in the Unimak Pass area are being coordinatedwith physical oceanographic studies by the Pacific Marine Environmental Laboratory, other NMFSfisheries interaction studies, and projects of the National Marine Mammal Laboratory.

3

4
Figure 1.1-1 General location of Unimak Pass study area, and NMFS statistical reporting areasin the southeast Bering Sea.

5
Figure 1.1-2 Closeup of study area for NMFS cod pot fishery interaction study, including 10meter depth contours. Note the fairly broad plateau at 70-90 m that runs from the northside of Akun Island across the top of Unimak Pass. The “untrawled” portion of the studyarea is within the 10 nm trawl exclusion zone around Cape Sarichef on Unimak Island. The “trawled” portion is just outside this boundary on the northern side of Unimak Pass.
6
Figure 1.1-3 Location of proposed closure for cod fishery interaction study, March 2003-2006.
7
1.2 Alternatives Considered
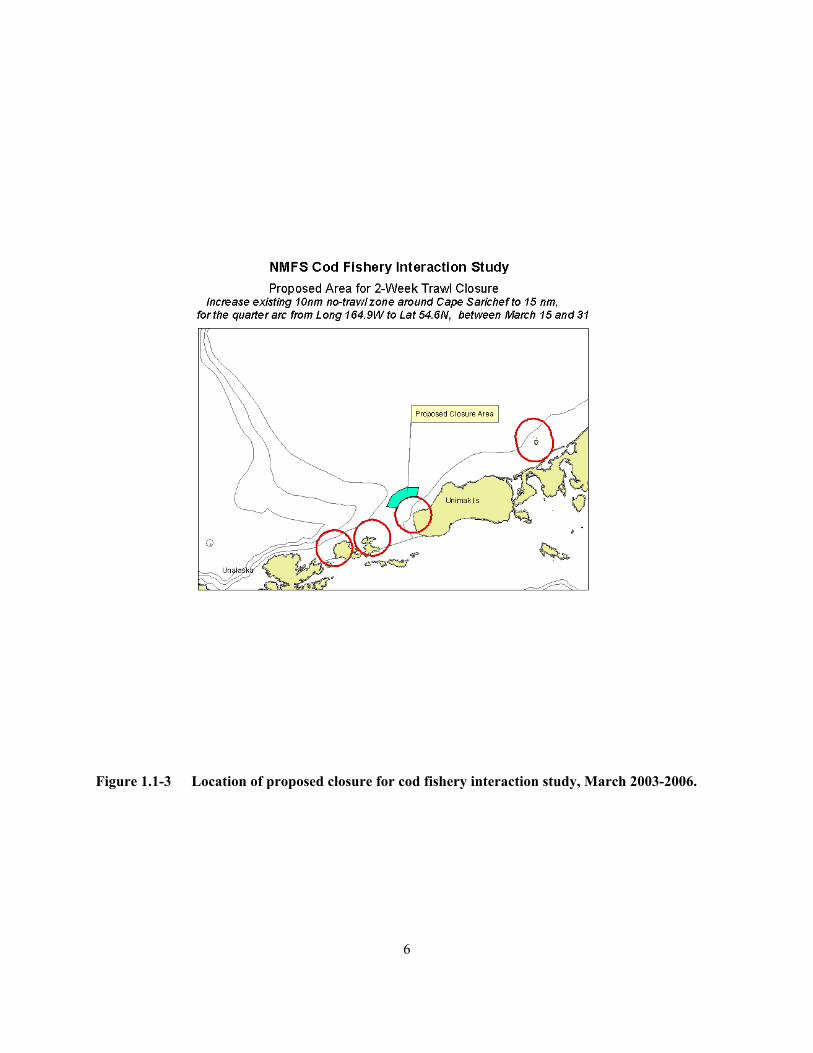
Table 1.2-1 Description of the alternatives
Alternative 1 No Action / Status Quo The experiment proceeds in 2003, 2004, 2005,and 2006 with no closure of the treatment area.
Alternative 2 Treatment AreaClosure
The experiment proceeds in 2003, 2004, 2005,and 2006.
In each of these years, no trawling would bepermitted in waters located west of 164.56.80 Wlong. and north of 54.34.30 N. lat. and locatedfrom 10 nm to 15 nm from the haulout at CapeSarichef, 164.56.8 W long. and 54.34.30 N. lat.,between March 15 and 31.
Regulations at 50 C.F.R. would be amended toaccomplish this.
Alternative 3 General Closure The experiment proceeds in 2003, 2004, 2005,and 2006.
In each of these years, no trawling would bepermitted in waters located west of 164.56.80 Wlong. and north of 54.34.30 N. lat. and locatedfrom 10 nm to 15 nm from the haulout at CapeSarichef, 164.56.8 W long. and 54.34.30 N. lat.,between March 15 and 31.
In addition, in each year, no directed pot orlongline fishing for Pacific cod or pollock isallowed in the treatment area during that period. This additional restriction would not apply tojigging for Pacific cod.
Regulations at 50 C.F.R. 679 would be amendedto accomplish this.
8
2.0 AFFECTED ENVIRONMENT
2.1 Study Area
The area selected for the localized depletion study is along the outer Bering sea shelf on the north side ofUnimak Pass and Unimak Island (Figure 1.1-1). This area has traditionally been a popular fishingground, and is a known spawning ground for Pacific cod. Commercial fishing has historically focused onthis area because 1) it often yields high concentrations of pollock and cod; 2) it is in close proximity tothe major commercial port of Dutch Harbor; and 3) its proximity to Unimak pass and the eastern AleutianIslands provide ready access to shelter from adverse weather. The pass is also an active internationalshipping channel.
The area that has historically been heavily fished is a plateau at 70-90 meters depth (40-50 fathoms)directly north of the pass and north of Cape Sarichef on the eastern tip of Unimak Island (Figure 1.1-2,see also Appendix A Figure A2 & Tables A1-A3). A popular trawl alley includes this plateau andgenerally runs along the 100 meter depth contour north and east from the pass. The proposed study areaincludes this plateau from 164°W to the horseshoe, approximately 166°W, and from the middle ofUnimak pass (GOA/BSAI boundary) north to approximately 55°N. The area for the proposed closure is “all waters located west of 164.56.80 W long. and north of 54.34.30 N. lat. and located from 10 nm to 15nm from Cape Sarichef, 164.56.8 W long. and 54.34.30 N. lat.” (Figure 1.1-3).
2.2 NEPA Documents Concerning the Affected Area
The proposed closure will affect the spatial distribution of groundfish fishing in the southeast Bering Seabetween March 15 and 31 of each study year.
Information on the status of the BSAI groundfish fisheries, management actions in the region, and theaffected environment are given in the draft programmatic SEIS for Alaska Groundfish Fisheries (NMFS2001a). Features of the physical environment are described in section 3.1. Fishing gear effects onsubstrate and benthic communities are described in section 3.2. Groundfish resources are in section 3.3,marine mammals in Section 3.4, seabirds in Section 3.5, other species in Section 3.6, prohibited species inSection 3.7, contaminants in Section 3.8, interactions between climate, commercial fishing and theecosystem in Section 3.9 and the socioeconomic environment in Section 3.10. This draft PSEIS (NMFS2001a) is available for public review and comment through the NMFS Alaska Region home page athttp://www.fakr.noaa.gov. Additionally, the status of each target species category, biomass estimates,and acceptable biological catch specifications are presented both in summary and in detail in the annualBSAI stock assessment and fishery evaluation (SAFE) reports (NPFMC 2001a). The economic status ofthe groundfish fisheries off Alaska are updated in NPFMC (2001b). Ecosystem considerations relevant tothe BSAI were presented in a special chapter of the SAFE (NPFMC 2001c). This chapter includesassessment of impacts to essential fish habitat.
Information on the impact of the groundfish fisheries on Steller sea lions is contained in the November2001 SEIS on Steller sea lion protection measures (NMFS 2001b). This document includes in AppendixA the biological opinion on the effects of the pollock, Pacific cod and Atka mackerel fisheries on Stellersea lions and other ESA listed species.

9
Designated target species and species groups in the BSAI are walleye pollock, Pacific cod, yellowfin sole,Greenland turbot , arrowtooth flounder, flathead sole, rock sole, other flatfish, sablefish, Pacific Oceanperch, other red rockfish, other rockfish, Atka mackerel, squid and other species. TACs and catch in2001, along with final 2002 specifications of OFLs, ABCs, and TACS for the BSAI and GOA arediscussed in the EA for the 2002 TAC Specifications (NMFS 2001c). For detailed life history, ecology,and fishery management information regarding groundfish stocks in the BSAI, see Section 3.3 of the draftprogrammatic SEIS (NMFS 2001a).
2.3 Status of Groundfish Fisheries and Management in the Study Area
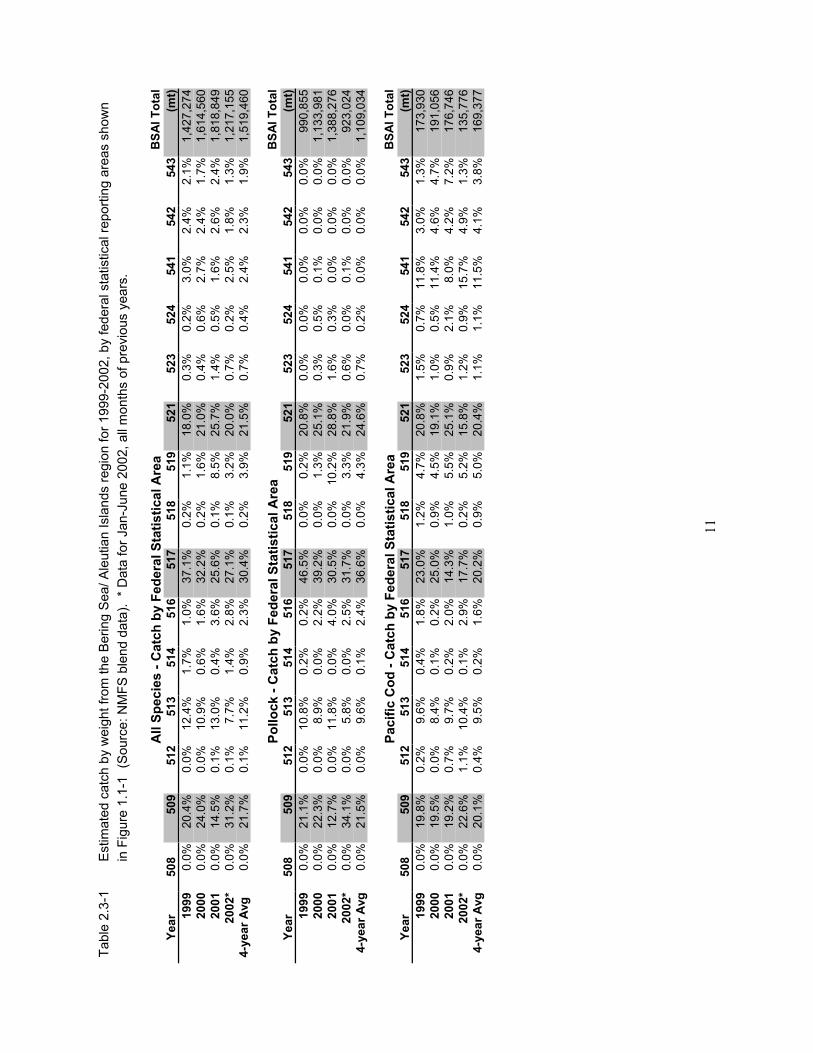
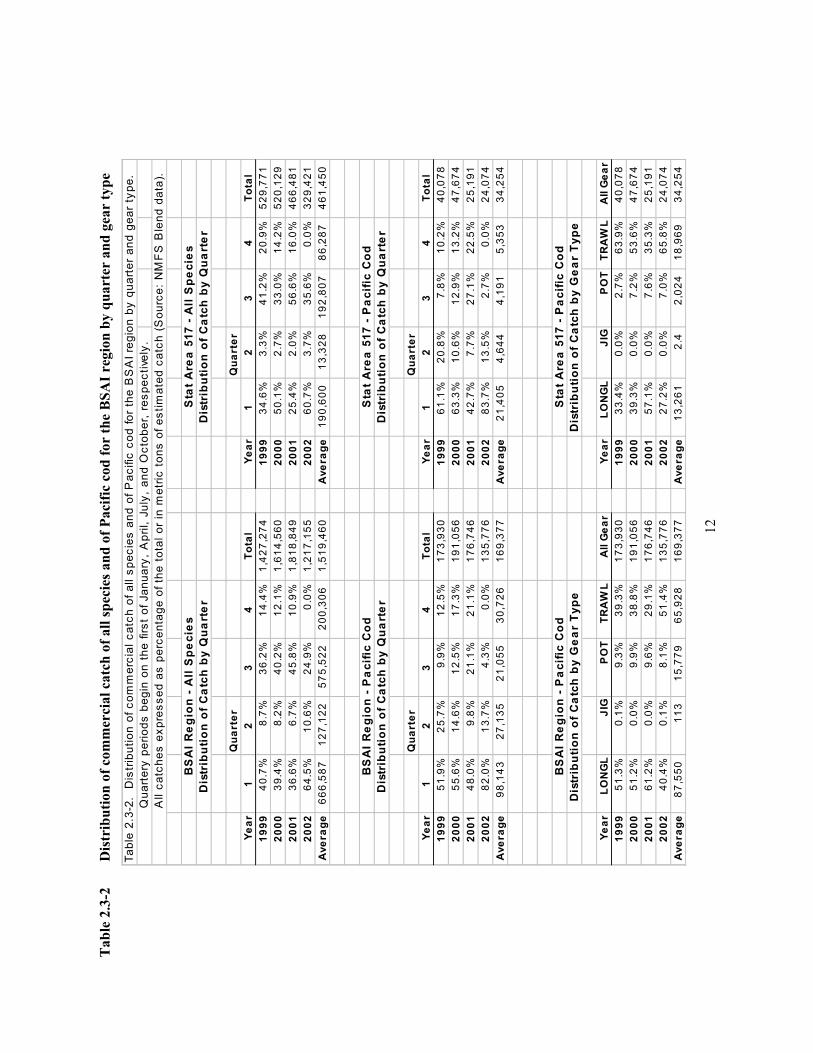
The primary commercial fisheries in the study area are for walleye pollock and Pacific cod. Somecommercial trawling for yellowfin sole and other flatfish occurs in the study area, but the amount of botheffort and take from these fisheries are minor. Table 2.3-1 shows the estimated total catch for the BSAIregion for 1999-2002, by federal statistical reporting area (source: NMFS Blend data). Theoverwhelming majority of both of the total catch and of catches for pollock and cod come from threereporting areas, with the greatest fraction of all three catches coming from area 517. Area 517 includesthe Unimak Pass study area and the outer shelf around the “horseshoe” north toward the Pribilof Islands(Figure 1.1-1). When catch is broken down to only the winter season (January-March), it is easy to seethat trawling for pollock and cod are the principal activities in the area (Table 2.3-2). Inshore and statewaters around Unimak and Akun Islands are also fished for cod with fixed gear, primarily pots.
The highest commercial catches from the study area are for walleye pollock. The status of this fishery isdescribed in 2001 BSAI SAFE (NPFMC 2001a). Estimates of total exploitable biomass for the pollockstock in the eastern Bering sea are currently over 11 million tons. The stock shows dramatic year-to yearvariation in biomass levels due to high annual variability in recruitment; a strong 1996 year-class isexpected to contribute to high levels of biomass over the next few years. The 2001 stock assessment forthis stock concluded that pollock stock levels are above MSST and that the stock is not overfished orapproaching overfished conditions.
While overall catches of Pacific cod are substantially less than for pollock, a major portion of the BSAIregional catch of Pacific cod comes from the eastern Bering sea. As shown in Table 2.3-2, the bottomtrawl take of Pacific cod is the major commercial catch in the study area during the winter season. Statusof the Pacific cod fishery is discussed in the 2001 SAFE (NPFMC 2001a). The 2002 estimate of adult(age 3+) biomass of Pacific cod for the eastern Bering sea in 2002 is 1.3 million tons. Various modelscenarios in the stock assessment show levels well above MSST and conclude that the stock is notoverfished or approaching overfished condition.
2.4 Status of Prohibited Species
Prohibited species taken incidentally in BSAI groundfish fisheries include: Pacific salmon (chinook,coho, sockeye, chum, and pink), steelhead trout, Pacific halibut, Pacific herring, Alaska king crab,Tanner, and snow crab. The Council recommends prohibited species catch (PSC) limits to control itsbycatch of prohibited species in the groundfish fisheries. During haul sorting, these species or speciesgroups are to be returned to the sea with a minimum of injury except when their retention is required byother applicable law. The status of the different prohibited species are summarized in Section 3.7 of thedraft programmatic SEIS (NMFS 2001a). Bycatch of prohibited species from the BSAI groundfish

10
industry are reported in Appendix C of the SAFE (NPFMC 2001a). Bycatch of Pacific halibut and kingcrab are closely monitored and can become a factor in closing of bottom trawl fisheries. Bycatch of otherspecies is generally well below PSC limits.
11
Tabl
e 2.
3-1
Estim
ated
cat
ch b
y w
eigh
t fro
m th
e Be
ring
Sea/
Ale
utia
n Is
land
s re
gion
for 1
999-
2002
, by
fede
ral s
tatis
tical
repo
rting
are
as s
how
nin
Fig
ure
1.1-
1 (S
ourc
e: N
MFS
ble
nd d
ata)
. * D
ata
for J
an-J
une
2002
, all
mon
ths
of p
revi
ous
year
s.
All
Spec
ies
- Cat
ch b
y Fe
dera
l Sta
tistic
al A
rea
BSA
I Tot
alYe
ar50
850
951
251
351
451
651
751
851
952
152
352
454
154
254
3(m
t)19
990.
0%20
.4%
0.0%
12.4
%1.
7%1.
0%37
.1%
0.2%
1.1%
18.0
%0.
3%0.
2%3.
0%2.
4%2.
1%1,
427,
274
2000
0.0%
24.0
%0.
0%10
.9%
0.6%
1.6%
32.2
%0.
2%1.
6%21
.0%
0.4%
0.6%
2.7%
2.4%
1.7%
1,61
4,56
020
010.
0%14
.5%
0.1%
13.0
%0.
4%3.
6%25
.6%
0.1%
8.5%
25.7
%1.
4%0.
5%1.
6%2.
6%2.
4%1,
818,
849
2002
*0.
0%31
.2%
0.1%
7.7%
1.4%
2.8%
27.1
%0.
1%3.
2%20
.0%
0.7%
0.2%
2.5%
1.8%
1.3%
1,21
7,15
54-
year
Avg
0.0%
21.7
%0.
1%11
.2%
0.9%
2.3%
30.4
%0.
2%3.
9%21
.5%
0.7%
0.4%
2.4%
2.3%
1.9%
1,51
9,46
0
Pollo
ck -
Cat
ch b
y Fe
dera
l Sta
tistic
al A
rea
BSA
I Tot
alYe
ar50
850
951
251
351
451
651
751
851
952
152
352
454
154
254
3(m
t)19
990.
0%21
.1%
0.0%
10.8
%0.
2%0.
2%46
.5%
0.0%
0.2%
20.8
%0.
0%0.
0%0.
0%0.
0%0.
0%99
0,85
520
000.
0%22
.3%
0.0%
8.9%
0.0%
2.2%
39.2
%0.
0%1.
3%25
.1%
0.3%
0.5%
0.1%
0.0%
0.0%
1,13
3,98
120
010.
0%12
.7%
0.0%
11.8
%0.
0%4.
0%30
.5%
0.0%
10.2
%28
.8%
1.6%
0.3%
0.0%
0.0%
0.0%
1,38
8,27
620
02*
0.0%
34.1
%0.
0%5.
8%0.
0%2.
5%31
.7%
0.0%
3.3%
21.9
%0.
6%0.
0%0.
1%0.
0%0.
0%92
3,02
44-
year
Avg
0.0%
21.5
%0.
0%9.
6%0.
1%2.
4%36
.6%
0.0%
4.3%
24.6
%0.
7%0.
2%0.
0%0.
0%0.
0%1,
109,
034
Paci
fic C
od -
Cat
ch b
y Fe
dera
l Sta
tistic
al A
rea
BSA
I Tot
alYe
ar50
850
951
251
351
451
651
751
851
952
152
352
454
154
254
3(m
t)19
990.
0%19
.8%
0.2%
9.6%
0.4%
1.8%
23.0
%1.
2%4.
7%20
.8%
1.5%
0.7%
11.8
%3.
0%1.
3%17
3,93
020
000.
0%19
.5%
0.0%
8.4%
0.1%
0.2%
25.0
%0.
9%4.
5%19
.1%
1.0%
0.5%
11.4
%4.
6%4.
7%19
1,05
620
010.
0%19
.2%
0.7%
9.7%
0.2%
2.0%
14.3
%1.
0%5.
5%25
.1%
0.9%
2.1%
8.0%
4.2%
7.2%
176,
746
2002
*0.
0%22
.6%
1.1%
10.4
%0.
1%2.
9%17
.7%
0.2%
5.2%
15.8
%1.
2%0.
9%15
.7%
4.9%
1.3%
135,
776
4-ye
ar A
vg0.
0%20
.1%
0.4%
9.5%
0.2%
1.6%
20.2
%0.
9%5.
0%20
.4%
1.1%
1.1%
11.5
%4.
1%3.
8%16
9,37
7
12
Tabl
e 2.
3-2.
D
istr
ibut
ion
of c
omm
erci
al c
atch
of a
ll sp
ecie
s an
d of
Pac
ific
cod
for
the
BS
AI r
egio
n by
qua
rter
and
gea
r ty
pe.
Q
uart
ery
perio
ds b
egin
on
the
first
of J
anua
ry,
Apr
il, J
uly,
and
Oct
ober
, re
spec
tivel
y.
All
catc
hes
expr
esse
d as
per
cent
age
of t
he t
otal
or
in m
etric
ton
s of
est
imat
ed c
atch
(S
ourc
e: N
MF
S B
lend
dat
a).
Qua
rter
Qua
rter
Year
12
34
Tota
lYe
ar1
23
4To
tal
1999
40.7
%8.
7%36
.2%
14.4
%1,
427,
274
19
9934
.6%
3.3%
41.2
%20
.9%
529,
771
20
0039
.4%
8.2%
40.2
%12
.1%
1,61
4,56
0
2000
50.1
%2.
7%33
.0%
14.2
%52
0,12
9
2001
36.6
%6.
7%45
.8%
10.9
%1,
818,
849
20
0125
.4%
2.0%
56.6
%16
.0%
466,
481
20
0264
.5%
10.6
%24
.9%
0.0%
1,21
7,15
5
2002
60.7
%3.
7%35
.6%
0.0%
329,
421
A
vera
ge66
6,58
7
127,
122
57
5,52
2
200,
306
1,
519,
460
A
vera
ge19
0,60
0
13,3
28
192,
807
86
,287
46
1,45
0
Qua
rter
Qua
rter
Year
12
34
Tota
lYe
ar1
23
4To
tal
1999
51.9
%25
.7%
9.9%
12.5
%17
3,93
0
19
9961
.1%
20.8
%7.
8%10
.2%
40,0
78
20
0055
.6%
14.6
%12
.5%
17.3
%19
1,05
6
20
0063
.3%
10.6
%12
.9%
13.2
%47
,674
2001
48.0
%9.
8%21
.1%
21.1
%17
6,74
6
20
0142
.7%
7.7%
27.1
%22
.5%
25,1
91
20
0282
.0%
13.7
%4.
3%0.
0%13
5,77
6
20
0283
.7%
13.5
%2.
7%0.
0%24
,074
Ave
rage
98,1
43
27
,135
21,0
55
30
,726
169,
377
Ave
rage
21,4
05
4,
644
4,19
1
5,
353
34,2
54
Year
LON
GL
JIG
PO
TTR
AW
LA
ll G
ear
Year
LON
GL
JIG
PO
TTR
AW
LA
ll G
ear
1999
51.3
%0.
1%9.
3%39
.3%
173,
930
1999
33.4
%0.
0%2.
7%63
.9%
40,0
78
20
0051
.2%
0.0%
9.9%
38.8
%19
1,05
6
20
0039
.3%
0.0%
7.2%
53.6
%47
,674
2001
61.2
%0.
0%9.
6%29
.1%
176,
746
2001
57.1
%0.
0%7.
6%35
.3%
25,1
91
20
0240
.4%
0.1%
8.1%
51.4
%13
5,77
6
20
0227
.2%
0.0%
7.0%
65.8
%24
,074
Ave
rage
87,5
50
11
3
15,7
79
65
,928
169,
377
Ave
rage
13,2
61
2.
4
2,02
4
18
,969
34
,254
BS
AI R
egio
n - A
ll S
peci
esD
istr
ibut
ion
of C
atch
by
Qua
rter
Sta
t Are
a 51
7 - A
ll S
peci
esD
istr
ibut
ion
of C
atch
by
Qua
rter
BS
AI R
egio
n - P
acifi
c C
odD
istr
ibut
ion
of C
atch
by
Qua
rter
Sta
t Are
a 51
7 - P
acifi
c C
odD
istr
ibut
ion
of C
atch
by
Qua
rter
BS
AI R
egio
n - P
acifi
c C
odD
istr
ibut
ion
of C
atch
by
Gea
r Ty
peS
tat A
rea
517
- Pac
ific
Cod
Dis
trib
utio
n of
Cat
ch b
y G
ear
Type
Tab
le 2
.3-2
Dis
trib
utio
n of
com
mer
cial
cat
ch o
f all
spec
ies a
nd o
f Pac
ific
cod
for
the
BSA
I reg
ion
by q
uart
er a
nd g
ear
type

13
2.5 Status of Marine Mammal Species
The status of marine mammal species in the eastern Bering sea and Aleutian Islands is reviewed in detailin stock assessments produced by the National Marine Mammal Laboratory (Angliss et al 2001). Thestudy area is part of the known range of several species of cetaceans, including the gray whale, humpbackwhale, fin whale, minke whale, northern right whale, killer whale, pacific white-sided dolphin, harborporpoise, Dall’s porpoise, and Stejners beaked whale. Of these species, the humpback whale, fin whale,and northern right whale are listed as endangered species under the ESA (see Section 2.8 below). Pinniped species whose range includes the Unimak Pass area include Steller sea lions, northern fur seals,and harbor seals; the western stock of Steller sea lions is listed as endangered under the ESA and northernfur seals are listed as “depleted” under the MMPA.
The draft programmatic SEIS for Alaska groundfish fisheries (NMFS 2001a) contains a detailed analysison the ecology, population trends, and the impacts of an array of alternative TAC specifications onmarine mammals. For further information see Section 3.4 and 4.2 of the draft programmatic SEIS , andthe section on marine mammals in the ecosystems chapter of the 2001 SAFE (NPFMC 2001a). Recentreviews of Steller sea lion population status in Alaska are contained in the Section 7 Biological Opinionon ESA listed species (NMFS 2001b.)
2.6 Seabird Species Population Status
Seabirds spend the majority of their life at sea rather than on land. Alaska's extensive estuaries andoffshore waters provide breeding, feeding, and migrating habitat for approximately 100 million seabirds. Thirty-four species breed in the Bering Sea/Aleutian Islands (BSAI) and Gulf of Alaska (GOA) regionsand number 36 million and 12 million individuals, respectively. Another 6 species breed at otherlocations in Alaska. In addition, up to 50 million shearwaters and 3 albatross species feed in Alaskanwaters during the summer months but breed farther south. Detailed seabird information on speciespopulation status, life history, ecology, and bycatch is contained in section 3.5 of the SEIS (NMFS1998a) and in the draft SEIS (NMFS 2001a).
Since publication of the 1998 SEIS, NMFS has reported the incidental take of 2 endangered short-tailedalbatrosses in the hook-and-line groundfish fishery of the BSAI. NMFS conducted section 7consultations with USFWS in 2000. The first FMP-level consultation is on the effects of the BSAI andGOA FMPs in their entirety on the listed species (and any designated critical habitat) under thejurisdiction of the USFWS. The second consultation is action-specific and is on the effects of the 2001 to2004 TAC specifications for the BSAI and GOA groundfish fisheries on the listed species (and anycritical habitat) under the jurisdiction of the USFWS. This action-specific consultation will incorporatethe alternatives proposed in this SSL PM SEIS for the 2002 groundfish fisheries. The most recentBiological Opinion on the effects of the groundfish fisheries on listed seabird species expired December31, 2000. NMFS requested and was granted an extension of that Biological Opinion and itsaccompanying Incidental Take Statement. USFWS intends to issue a Biological Opinion in late 2002.
2.7 Status of Marine Habitat

14
The environmental assessment prepared for the 2002 BSAI harvest specifications (NMFS 2001c) containsan assessment of impacts to essential fish habitat as required by amendments to the Magnuson-StevensFishery Conservation and Management Act of 1996. This assessment addresses the effects of theauthorization of the proposed and final specifications on EFH pursuant to the requirements of 50 CFR600.920(h) and in coordination with the review procedures required under the National EnvironmentalPolicy Act. The assessment of the impacts on EFH (NMFS 2001c) concludes that fishing actions mayhave substantial adverse impacts on fish habitat essential to the spawning, breeding, feeding and growthto maturity of managed and un-managed species. In formal response to the assessment dated December14, 2001, the NMFS Habitat Conservation Division, Alaska Region (HCD) concurred in the assessmentthat fishing may have adverse impacts on EFH for managed species but concluded that any adverseeffects have been minimized to the extent practicable (NMFS 2001d). The actions authorized by the year2002 harvest specifications have been mitigated, and are continually being mitigated, as a result ofprotective measures implemented under the Magnuson-Stevens Act. NMFS has already designated areasof essential habitat or has curtailed fishing in a season or location as a result of previous, and ongoingactions, or has taken measures to protect critical habitat for the Steller sea lion that also benefits EFH formanaged species in those areas. The NMFS HCD affirmed that these mitigative measures haveminimized any substantial impacts on EFH of this Federal action to the extent practicable, and offered noadditional EFH recommendations.
Given that an EFH assessment has been completed with the mandatory requirements and components ofan EFH assessment as specified in 50 CFR 600.920 (g)(2), and given that 50 CFR Section 600.920(h)(3)states that once a Federal agency has submitted to NMFS an EFH assessment completed in accordancewith paragraph (g) of this section that the Federal agency has fulfilled its consultation requirement underparagraph (a), NMFS affirms that the consultation requirements as required under the statute have beenfulfilled. For further information about the habitat and ongoing habitat studies in the fisheriesmanagement area, see Section 3.1 and 3.6 of the draft programmatic SEIS (NMFS 2001a), and theEcosystems Considerations Chapter for 2002 (NPFMC 2001c).
2.8 Status of Endangered or Threatened Species
The Endangered Species Act of 1973 as amended (16 U.S.C. 1531 et seq; ESA), provides for theconservation of endangered and threatened species of fish, wildlife, and plants. The program isadministered jointly by the NMFS for most marine mammal species, marine and anadromous fish species,and marine plants species, and by the USFWS for bird species, and terrestrial and freshwater wildlife andplant species. Twenty-three species occurring in the BSAI and GOA groundfish management areas arecurrently listed as endangered or threatened under the ESA. Of these species, Table 2.8-1 shows thosewhose range includes the Unimak Pass study area. Section 7 consultations with respect to actions of thefederal groundfish fisheries have been done for all the species listed in Table 2.8-1, either individually orin groups.

15
Table 2.8-1 ESA listed and candidate species whose range inclused the Unimak Pass study areain the eastern Bering Sea.
Common Name Scientific Name ESA Status Whether reinitiation of ESAConsultation is occurring
Blue Whale Balaenoptera musculus Endangered NoSei Whale Balaenoptera borealis Endangered NoFin Whale Balaenoptera physalus Endangered NoHumpback Whale Megaptera novaeangliae Endangered NoRight Whale Balaena glacialis Endangered NoSteller Sea Lion (WesternPopulation) Eumetopias jubatus Endangered No Steller’s Eider 1 Polysticta stelleri Threatened OngoingShort-tailed Albatross 1 Phoebaotria albatrus Endangered OngoingSpectacled Eider1 Somateria fishcheri Threatened OngoingNorthern Sea Otter1 Enhydra lutris Candidate No
1The Steller’s eider, short-tailed albatross, spectacled eider, and Northern sea otter are species under the jurisdiction ofthe U.S. Fish and Wildlife Service. For the bird species, critical habitat has been proposed only for the Steller’s eider (65 FR13262). The northern sea otter has been proposed by USFWS as a candidate species (November 9, 2000; 65 FR 67343).
16
3.0 ENVIRONMENTAL IMPACTS OF THE ALTERNATIVES
Areas to be examined for possible impacts from a proposed action include impacts to groundfish targetspecies, fishery bycatch, incidental catch of prohibited species, marine mammals, ESA listed species,essential fish habitat, benthic habitat, and water quality. Analysis of each of theses issues is detailedbelow. No significant impacts to any of these issues have been found. For a more complete explanationof issues pertinent to fisheries management actions, and description of what would comprise a significantimpact, refer to the EA for the 2002 TAC (NPFMC 2001a).
3.1 Environmental Impact of the No-Action Alternative
Since the no-action alternative involves no changes to normal fishing practices, it has no environmentalimpact other than those determined for the 2002 TAC process (NPFMC2001a). If no action is taken, theNMFS localized depletion study will still be conducted in 2003. Without the requested closure, NMFSanticipates increased expense to conduct the study and a greater risk of inadequate or inconclusive studyresults. Research pot gear damaged or disturbed by trawlers will lead not only to higher equipment costs,but to a smaller number of study sites being covered by the pot study. If the number of study sitessuccessfully completed is substantially reduced by gear conflicts, the power of the statistical test todetermine the presence or absence of a localized depletion effect could be jeopardized.
3.2 Environmental Impacts of Closure Alternatives
Both Alternatives 2 and 3 would prohibit commercial trawling from a small portion of the traditionalground near Unimak Pass between Mach 15 and 31, 2003 through 2006. Alternative 2 (trawl closure)would extend a quarter-arc of the existing Cape Sarichef no-trawl zone and close this area to all trawlingduring the latter half of March (Figure1.1-3). Alternative 3 is a general closure for the additional quarter-arc, restricting both trawl and fixed-gear fishing in the closed area. At present, there is little fixed-gearuse of the proposed closure area because of gear conflicts with trawl fisheries. Alternative 3 is designedto prevent fixed-gear vessels (primarily longliners) from making substantial removals of cod from thestudy area as the “after” leg of the experiment is being conducted. Large removals during this periodcould result in decreases in local abundance that would be interpreted as a trawl effect.
3.2.1 Effects on Distribution of Fishing Effort
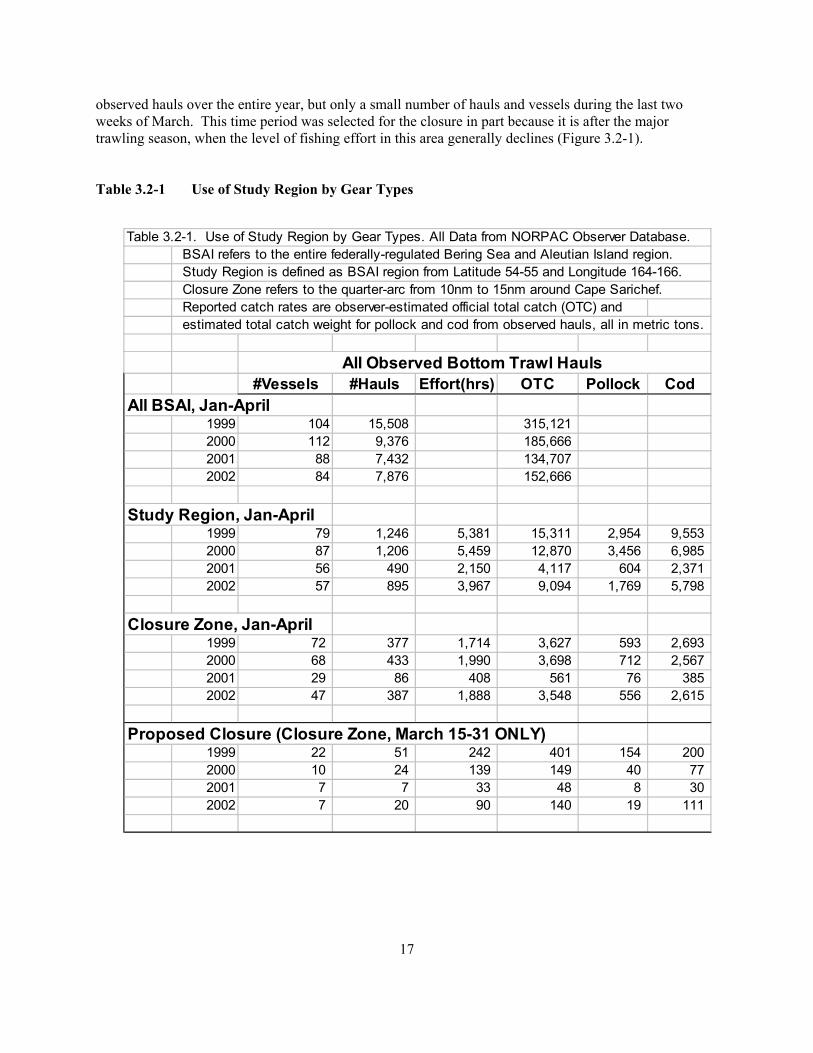
The closure alternatives will decrease the amount of catch taken from the target area during the two-weekperiod of closure, and may displace some trawling or general fishing effort during this period into otherareas of the eastern Bering sea. As described in section 5.6 of the attached RIR/IRFA, the number ofcommercial vessels fishing in Alaska state statistical area 655430 (which includes almost all of theproposed closure area) decreased from 53-54 in 1998-99 to only 16 vessels in 2002. Almost all of thesevessels are bottom trawlers. Twenty-seven vessels have fished in this area in three or more of the last fiveyears (Table 5.6-6). The RIR/IRFA annual estimates that revenues for bottom trawlers in 655430 duringthe second half of March made up roughly 0.23% of all revenues for these vessels in 1998, increasing to1.07% of all revenues in 2001 (Table 5.6-5). Table 3.2-1 shows analysis of trawling effort in theproposed closure region based on NMFS Observer data, which represents primarily the efforts of vesselsover 100ft. This analysis indicates that the proposed closure area accounts for a substantial fraction of
17
Table 3.2-1. Use of Study Region by Gear Types. All Data from NORPAC Observer Database. BSAI refers to the entire federally-regulated Bering Sea and Aleutian Island region. Study Region is defined as BSAI region from Latitude 54-55 and Longitude 164-166. Closure Zone refers to the quarter-arc from 10nm to 15nm around Cape Sarichef. Reported catch rates are observer-estimated official total catch (OTC) and estimated total catch weight for pollock and cod from observed hauls, all in metric tons.
#Vessels #Hauls Effort(hrs) OTC Pollock CodAll BSAI, Jan-April
1999 104 15,508 315,121 2000 112 9,376 185,666 2001 88 7,432 134,707 2002 84 7,876 152,666
Study Region, Jan-April1999 79 1,246 5,381 15,311 2,954 9,553 2000 87 1,206 5,459 12,870 3,456 6,985 2001 56 490 2,150 4,117 604 2,371 2002 57 895 3,967 9,094 1,769 5,798
Closure Zone, Jan-April1999 72 377 1,714 3,627 593 2,693 2000 68 433 1,990 3,698 712 2,567 2001 29 86 408 561 76 385 2002 47 387 1,888 3,548 556 2,615
Proposed Closure (Closure Zone, March 15-31 ONLY)1999 22 51 242 401 154 200 2000 10 24 139 149 40 77 2001 7 7 33 48 8 30 2002 7 20 90 140 19 111
All Observed Bottom Trawl Hauls
observed hauls over the entire year, but only a small number of hauls and vessels during the last twoweeks of March. This time period was selected for the closure in part because it is after the majortrawling season, when the level of fishing effort in this area generally declines (Figure 3.2-1).
Table 3.2-1 Use of Study Region by Gear Types

18
Wee
kly
Har
vest
of P
acifi
c C
od fr
om S
tat A
rea
517
050
010
0015
0020
0025
0030
0035
0040
00
Jan-98
May-98
Sep-98
Jan-99
May-99
Sep-99
Jan-00
May-00
Sep-00
Jan-01
May-01
Sep-01
Jan-02
May-02
Harvest (mt)
Figu
re 3
.2-1
Seas
onal
tim
ing
of c
od h
arve
st fr
om fe
dera
l sta
tistic
al a
rea
517
from
199
8 th
roug
h 20
02.
Solid
bar
s sho
w to
tal h
arve
st o
fco
d by
wee
k (S
ourc
e: A
lask
a R
egio
nal M
gmt D
ata)
. Sh
aded
per
iods
are
wee
ks in
ters
ectin
g th
e pr
opos
ed M
arch
15-
31 c
losu
re.
Each
yea
r, th
e pe
ak o
f the
cod
har
vest
in th
is a
rea
is in
from
Feb
ruar
y th
roug
h m
id-M
arch
. In
mos
t yea
rs, t
he p
ropo
sed
clos
ure
perio
d co
ncid
es w
ith a
tem
pora
ry lu
ll in
cod
har
vest
.

19
3.2.2 Effects on BSAI Groundfish
Since neither of the proposed closure alternatives changes the regional and seasonal TACs forgroundfish species, the alternatives are expected to have no impact on BSAI groundfish species. Redistribution of trawling effort during the two-week closure may have some small-scale effects ongroundfish in the immediate study area, however the amount of trawling affected by the closure isexpected to be small.
3.2.3 Effects on Bycatch and Incidental Catch of Prohibited Species
Alternative 1 would not change the expected catch of prohibited species. Fishing at the levelestablished by the final 2002 harvest specifications for groundfish in the BSAI (67 FR 956, January 8,2002) is not expected to adversely affect stocks of fish or invertebrates prohibited in groundfish fisheriesharvest. Catches of Pacific halibut in the BSAI are controlled by PSC limits. Section 4.3.5 of the draftprogrammatic SEIS (NMFS 2001a) describes the possible impacts on prohibited species. Newinformation presented in section 3.2 and the EA for final TAC specifications for 2002 (NMFS 2001c)does not demonstrate any impacts that NMFS considers to be significant or that were not alreadyanalyzed in the SEIS.
Alternatives 2 and 3 might result in some change in the species composition and/or rate of bycatchof prohibited species, since fishing effort will be moved to different areas. However, regionalbycatch of prohibited species will remain controlled by PSC limits, which have been set to minimizeimpacts on prohibited species. The proposed action is of short duration and the amount of trawlingredistributed to other areas is small, therefore the proposed action is not expected to impact overallbycatch rates or populations of prohibited species in the BSAI.
3.2.4 Effects on Marine Mammals and ESA Listed Species
In 2001, the RFRPA for the BSAI fishery were modified by a committee processes supported by theCouncil. The resulting Steller sea lion protection measures were approved by NMFS and implemented byemergency interim rule for 2002. Consultations were conducted for the Steller sea lion protectionmeasures (NMFS 2001b) and for the harvest specifications for 2002, as implemented by emergencyinterim rule (67 FR 956, January 8, 2002). These consultations found no likelihood of jeopardy oradverse modification of habitat for any endangered species with the actions. Based on this ruling, noneof the proposed alternatives for this action will have adverse environmental effect on endangeredspecies. Trawling excluded from the closure area is expected to move to other areas that are open underapproved RFRPAs.
3.2.5 Effects on Essential Fish Habitat, Benthic Habitat, and Water Quality
The management areas where the fisheries take place are identified as essential fish habitat (EFH) for allthe managed species listed in the fishery management plans. NMFS prepared an assessment of impacts toessential fish habitat (NMFS 2001c) and received a letter of consultation in reply (NMFS 2001d). In thatletter NMFS stated it concurs in the assessment that fishing may have adverse impacts on EFH for
20
managed species but concluded that any adverse effects have been minimized to the extentpracticable.
The potential shifts in trawl effort caused by the temporary no trawl zone are not expected to havea significant impact on essential fish habitat. The small area and short time frame of the proposedclosure would create only minor shifts in the geographic distribution of trawl effort. Trawling excludedfrom the closure area is expected to move to other areas routinely used by the trawl fishery, and theamount of additional trawling in any given area is not expected to increase significantly.
The proposed action will have no impact on water quality.
3.2.6 Socio-Economic Impacts
Section 5.6 of the Regulatory Impact Review (RIR), and Section 6.8 of the Initial Regulatory FlexibilityAnalysis (IRFA), provide detailed descriptions of the fishing operations and communities that will beaffected by this action. Sections 5.7 to 5.10 of the RIR summarize the impacts of this action on fishingoperations and communities, and Section 6.9 of the IRFA describes the socio-economic impacts of thisaction. A summary of these sections is provided here; the reader is referred to the relevant sections in theRIR and IRFA for detailed information.
The treatment area is a small portion of State of Alaska statistical reporting area 655430. The analysiswas able to make estimates of fishing activity and production for the statistical area, but was not able todo a finer breakdown and estimate statistics specifically for the treatment area. Therefore reportedstatistics must be thought of as placing an upper bound on activity and impacts of the action in thetreatment area.
The most important fleet segment in this statistical area in the second half of March in recent years (1998-2001) has been medium sized (60-125 foot) bottom trawlers targeting Pacific cod and delivering them toshoreside processors. The relative size of this fleet decreased, however, during this period. Vessels ofthis description harvested 78% of the groundfish from the statistical area in 1998, but (although thelargest number of active vessels remained bottom trawlers) their share declined to 31% of the harvest in2001. This decline was paralleled by an overall decline in harvests from this area over the period. It was,in fact, the decline in the harvests by this class of vessel which accounted for most of the decline inoverall harvest from the area.
The smaller numbers of vessels in 2000 and 2001, and potential confidentiality issues, make it difficult tocharacterize the changes in the fleet. However, as harvests by the vessels described above declined,harvests by vessels with other characteristics became relatively more important. Catcher-processorsbecame more important in 2000 and 2001. Pot gear, in particular became important in 2001, accountingfor a third of the harvest that year. Harvests from vessels targeting Pacific cod declined somewhat, butremained high.
The first wholesale value of production from this statistical area in the second half of March rangedbetween $1.24 and $2.67 million dollars per year over the period. Catcher vessels, which were the largestproducing segment in the fishery, delivered their product to Akutan, Unalaska/Dutch Harbor, and KingCove. The first wholesale value of deliveries to these ports ranged between $860,000 in 2001 and $2.55
21
million in 1999. Most of the vessels active in the fishery were owned by persons in Washington andOregon. Some were owned by persons in Alaska, California, and Maine.
The impacts of this action on fishermen, fish processors, communities, and low income or minoritypopulations, are expected to be insignificant. First, the estimates of harvest provided are for statisticalarea 655430, and are greater than the estimates of production from the treatment area itself. Second, thefishing operations in statistical area 655430 were not heavily dependent on activity in this area, even inthe second half of March. Table 5.6-5 indicates that they obtained between about 10% and 28% of theirgross revenues from this area between 1998 and 2001, depending on the year. Third, the RIR analysissuggests that these vessels could substantially compensate for lost fishing opportunities in this area byfishing nearby. This change in fishing patterns would be likely to increase operating costs somewhat,since the vessels may be fishing further from the support and delivery services available in Akutan,Unalaska, and King Cove. The impacts on communities, and minority and low income populations, areexpected to flow from any change in vessel activity patterns. Since the impacts on vessels are expected tobe relatively small, the other impacts are also expected to be relatively small.
4.0 EA SUMMARY & CONCLUSIONS
The setting of the proposed action is the trawl groundfish fisheries of the BSAI on the north side ofUnimak Pass. Any effects of the action are limited to this area. The effect on society within this area isisolated to the individuals who may participate in trawl fisheries in the Unimak Pass area during the latterhalf of the month of March. This action has no impacts on society as a whole or regionally.
Beneficial and adverse impacts are required to be considered in this action. Effects of the proposed actionare in section 3.0 of this EA/RIR/IRFA. The result of the action is the potential redistribution of trawlfishing effort in the BSAI region from March 15-31 of the years 2003-2006. The potential redistributionof trawl fishing effort due to the proposed closure is likely to be minor and would not be sufficient tocause a significant impact on other groundfish fisheries. Trawling occurs over many areas of the BSAIduring this period and the amount of trawling displaced is small. The potential shifts in trawl effort arenot expected to have an impact on essential fish habitat, marine mammal, or ESA listed species. Theaction is requested in support of research on localized changes in fish abundance associated with intensivetrawling operations. This information is important to regulatory policy regarding interactions ofcommercial fishing operations with endangered Steller sea lions.
Public Health and Safety are not impacted by this action due to the limited duration and coverage of thisaction. No geographic consideration is with this action because no activities are required by this actionthat may affect a geographic area. No known risks to the human environment will occur by taking thisaction. This action will have no effect on districts, sites, highways, structures, or objects listed or eligiblefor listing in the National Register of Historic Places, nor cause loss or destruction of significantscientific, cultural, or historical resources.
Cumulatively significant impacts are not anticipated with this action because no impacts have been identified. This action is associated with an NMFS research project that will be reviewed each yearthrough issuance of a research fishing permit; permits issued for this project in 2002 found no significantenvironmental impact of the research study and permits for successive years are expected to do the same. Because of the short duration and the limited area affected by the proposed closure, this action has nolong term effect on the fishing practices in the BSAI.

22
This action poses no known violation of Federal, State, or local laws or requirements for the protection ofthe environment. This action poses no known possibility of the introduction of non-indigenous speciesbecause it does not affect the activities of vessels that may introduce such organisms into the marineenvironment.

23
(This page intentionally left blank)
24
5.0 REGULATORY IMPACT REVIEW
5.1 Introduction
This Regulatory Impact Review (RIR) examines the costs and benefits of regulatory action to close about130 square miles of waters north of Unimak Pass to fishing for groundfish during the last two weeks ofMarch in 2003, 2004, 2005, and 2006. These waters are adjacent to an area already closed to trawling forPacific cod and pollock due to the proximity of a Steller sea lion haulout at Cape Sarichef on the westernend of Unimak Island in the Aleutians.
This closure is meant to increase the scientific value of an experiment to test the hypothesis that Pacificcod trawling causes localized depletion of Pacific cod stocks. The results of this experiment may haveimportant implications for regulations that currently restrict fishing activity in order to protect Steller sealion stocks.
5.2 What is a Regulatory Impact Review?
This RIR is required under Presidential Executive Order (E.O.) 12866 (58 FR 51735; October 4, 1993).The requirements for all regulatory actions specified in E.O. 12866 are summarized in the followingstatement from the order:
In deciding whether and how to regulate, agencies should assess all costs and benefits of availableregulatory alternatives, including the alternative of not regulating. Costs and benefits shall beunderstood to include both quantifiable measures (to the fullest extent that these can be usefullyestimated) and qualitative measures of costs and benefits that are difficult to quantify, butnonetheless essential to consider. Further, in choosing among alternative regulatory approachesagencies should select those approaches that maximize net benefits (including potential economic,environmental, public health and safety, and other advantages; distributive impacts; and equity),unless a statute requires another regulatory approach.
E.O. 12866 requires that the Office of Management and Budget review proposed regulatory programs thatare considered to be “significant”. A “significant regulatory action” is one that is likely to:
• Have an annual effect on the economy of $100 million or more or adversely affect in a material waythe economy, a sector of the economy, productivity, competition, jobs, local or tribal governmentsor communities;
• Create a serious inconsistency or otherwise interfere with an action taken or planned by anotheragency;
• Materially alter the budgetary impact of entitlements, grants, user fees, or loan programs or therights and obligations of recipients thereof; or
• Raise novel legal or policy issues arising out of legal mandates, the President’s priorities, or theprinciples set forth in this Executive Order.
The Regulatory Impact Review (RIR) provides information to help determine whether the proposedregulation is likely to be “significant.”

1The Pacific cod and trawl estimates are presented here because the proposed experiment would examinethe impact of Pacific cod trawling on localized depletion.
25
5.3 Statutory authority
The National Marine Fisheries Service manages the U.S. groundfish fisheries of the Bering Sea andAleutian Islands management area in the Exclusive Economic Zone under the Fishery Management Plan(FMP) for that area. The North Pacific Fishery Management Council prepared the FMP under theauthority of the Magnuson-Stevens Fishery Conservation and Management Act (MSA). Regulationsimplement the FMP at §50 CFR part 679. General regulations that also pertain to U.S. fisheries appear atsubpart H of §50 CFR part 600.
5.4 Purpose and need for action
What is localized depletion, and why does it matter?
The past 20 years have seen large declines in the population of the western distinct population segment(DPS) of the Steller sea lion. This population segment of the Steller sea lion has been listed asendangered under the Endangered Species Act (ESA). The reasons why the DPS has declined are notunderstood very well. However, the depletion of stocks of sea lion groundfish prey by commercialfishermen near the Stellers’ haulouts and rookeries has been identified as a possible cause. The principalgroundfish species of concern are pollock, Akta mackerel, and Pacific cod. The experiment discussed inthis analysis is concerned with the localized depletion of Pacific cod.
Fishing in an area removes part of the Pacific cod stock from that area. If harvested fish are replacedimmediately by fish that migrate in from nearby areas, there is no change in food availability. However,if the harvested fish are not replaced immediately, there may be a reduction in food availability for stocksof Steller sea lions feeding in that area. Sea lions of various sexes and ages will eat less, or they will usemore energy to capture any given amount of food.
Fishing regulations implemented with the 2002 fishing year have imposed restrictions on commercialfishing for pollock, Pacific cod and Atka mackerel near rookeries and haulouts. These restrictions arebelieved to be expensive for industry. The RIR prepared at the time the restrictions were underconsideration, estimated that the total annual value of Pacific cod formerly taken from the waters now tobe restricted was on the order of $21 million per year in the BSAI and GOA. The value taken by trawlgear was $6 million per year.1 While much of this gross value was undoubtedly offset by changes infishing patterns: (a) not all of it may have been, (b) it was likely done at increased cost, and (c) the burdenis widely believed to have fallen more heavily on small entities which are less able to travel further fromport. Moreover, the regulations imposed in 2002 were controversial. Many believe the appropriateregulations should be more restrictive. One alternative under consideration would have restricted watersfrom which Pacific cod worth an estimated $48 million were taken per year ($28 million a year worth oftrawl fish). (NMFS, 2001(c), pages C132-C140.)
What will this experiment tell us?

26
The issue of localized depletion raises several important questions. Does trawling locally deplete Pacificcod stocks? Do these stocks recover, and if so, how fast do they recover? Does localized depletioninteract with the foraging habits of Steller sea lions to affect Steller sea lion nutrition, morbidity, andmortality? There is very little information available about these important questions.
The Alaska Fisheries Science Center has obtained funding to perform an experiment designed todetermine whether or not trawling for Pacific cod will locally deplete cod resources. Funding is availableto perform the experiment in 2003, and the AFSC is trying to obtain funding to duplicate the experimentin 2004, 2005 and 2006. The details of the experiment are in Appendix A.
One area, to the north of Unimak Pass, which is subject to intensive bottom trawling for cod betweenJanuary and April (with the most intense fishing in February and early March) will be used as thetreatment area. Another area, within the adjacent no-trawl zone around Cape Sarichef, (including as faras is possible the same range of depths, slopes, and bottom types found in the treatment area) will be usedas a control area. Together, the treatment and control areas will allow the scientists to compare areas thatare heavily trawled and that are not heavily trawled.
These treatment and control areas are shown in Figure 5.5-1. The treatment area would be within thequarter-arc on the northwest side of the Cape Sarichef Pacific cod and pollock no-trawl zone. The controlarea would be within the zone in the waters close to the treatment area.
Figure 5.5-1 Area to be closed under Alternatives 2 and 3
The treatment andcontrol areas will be surveyed,using pot gear similar to that used for commercial fishing, both immediately before the opening of theseason and in the second half of March after the most heavily fished stage of the spawning season.
27
Within each area, changes in catch rates between the “before” and “after” surveys will be measured at anumber of sites. It is assumed that, in the absence of a fishing effect, all of the sites will exhibit the samerelative change in catch rates between the before and after surveys. This assumes that many factorsaffecting seasonal differences in cod density (spawning aggregation, migration, responses to weatherevents and tides, and localized movement) should be acting similarly over the region, regardless oflocation relative to the arbitrary no-trawl zone boundaries. A Fisher randomization test will be used totest the null hypothesis that the change in catch rates is the same for fished and unfished sites. Thisnonparametric test is expected to have greater power and far less sensitivity to outliers than a parametrict-test for difference in change between the two groups.
Pot catch rates are intended as a relative measure of fish density that will reveal changes over time at aparticular site. Pot gear is proposed because its catch variability is less than trawl samples and it is knownto be effective for Pacific Cod. Since Cod are most important in the SSL diet during the winter season,the experiment is designed around the winter-season fishery. Initial feasibility work was performed inJune 2001 and a pilot study was conducted at Unimak Pass in March-April 2002. The results of the pilotstudy suggest that the experimental design is feasible.
The proposed action will increase the value of the experiment
The “after” portion of the pot survey will take place in the treatment area in the second half of March. However, during this period Pacific cod and pollock trawling will still be taking place in the treatmentarea. The late March period has been chosen for the “after” data collection since Pacific cod trawlingtypically drops to lower levels at that time. Nevertheless, the absence of the proposed regulation closingthe treatment area waters, some trawling would still be taking place, and there would be potential for agear conflict between the trawlers and the pot gear used in the experiment. This gear conflict may lead tothe destruction of pots.
Any loss of pots caused by the gear conflicts would reduce the number of data observations obtained, andcould reduce the power of the statistical tests that would be performed on the data, and thus could reducethe ability of those tests to discriminate between alternative hypotheses. The results of an experiment thathad little power to discriminate between the hypotheses would be of limited use in framing fisheryregulations.
The purpose of this action
The purpose of the proposed action is to reduce the loss of pots in this experiment, and to increase thestatistical power and usefulness of the experimental results as a test of the localized depletion hypothesis.
Market failure rationale
U.S. Office of Management and Budget guidelines for analyses under E.O. 12866 state that
...in order to establish the need for the proposed action, the analysis should discusswhether the problem constitutes a significant market failure. If the problem does notconstitute a market failure, the analysis should provide an alternative demonstration ofcompelling public need, such as improving governmental processes or addressing

2Memorandum from Jacob Lew, OMB director, March 22, 2000. “Guidelines to Standardize Measures ofCosts and Benefits and the Format of Accounting Statements,” Section 1.
28
distributional concerns. If the proposed action is a result of a statutory or judicialdirective, that should be so stated.2
Government manages fisheries under the MSA in order to reduce the waste and social dislocation thatwould otherwise be associated with common-property fisheries. However, the specific action underconsideration in this RIR does not not have a direct market failure rationale. This action is necessary toreduce the costs and increase the effectiveness of rules implemented under the MSA and ESA to protectthe population of Steller sea lions. The government has this responsibility because it is responsible formanaging these common property fisheries.
5.5 Alternatives considered
This action is a closure of specified waters to fishing during the experiment by the Alaska FisheriesScience Center (AFSC). The experiment itself is not the action under consideration, and will proceedwhether or not the regulation is adopted. The three alternatives are described below in Table 5.5-1. Theareas under consideration were shown earlier in the map in Figure 5.5-1
Three alternatives are examined in this analysis. Alternative 1 is the status quo and no action alternative. Under Alternative 1, the experiment would proceed with no closure of the treatment area. Alternative 2 isa “trawl closure” option. Under Alternative 2, the treatment area would be closed to all trawling for thesecond half of March to avoid gear conflicts while the experimental pot fishing is taking place. Alternative 3 is an “all gear” closure. Alternative 3 would close the treatment area to longlining and potfishing as well as to trawling. This option would prevent longlining and pot fishing from growing in thetreatment area once the trawl fishermen are no longer operating there. Other fishing, and particularlylonglining, could affect the catch rates for the experimental Pacific cod pots. Alternative 3 does not closethe treatment area to jigging.
Table 5.5-1 Description of the alternatives

29
Alternative 1 No Action / Status Quo The experiment proceeds in 2003, 2004, 2005,and 2006 with no closure of the treatment area.
Alternative 2 Treatment AreaClosure
The experiment proceeds in 2003, 2004, 2005,and 2006.
In each of these years, no trawling would bepermitted in waters located west of 164.56.80 Wlong. and north of 54.34.30 N. lat. and locatedfrom 10 nm to 15 nm from the haulout at CapeSarichef, 164.56.8 W long. and 54.34.30 N. lat.,between March 15 and 31.
Regulations at 50 C.F.R. would be amended toaccomplish this.
Alternative 3 General Closure The experiment proceeds in 2003, 2004, 2005,and 2006.
In each of these years, no trawling would bepermitted in waters located west of 164.56.80 Wlong. and north of 54.34.30 N. lat. and locatedfrom 10 nm to 15 nm from the haulout at CapeSarichef, 164.56.8 W long. and 54.34.30 N. lat.,between March 15 and 31.
In addition, in each year, no directed pot orlongline fishing for Pacific cod or pollock isallowed in the treatment area during that period. This additional restriction would not apply tojigging for Pacific cod.
Regulations at 50 C.F.R. 679 would be amendedto accomplish this.
5.6 Description of fishery
Detailed descriptions of the BSAI groundfish fishery
As noted earlier in the EA, detailed descriptions of the social and economic backgrounds of thegroundfish fisheries may be found in the following reports:
Alaska Groundfish Fisheries. Draft Programmatic Supplemental Environmental Impact Statement(NMFS, 2001a). This report contains detailed fishery descriptions and statistics in Section 3.10, “Socialand Economic Conditions,” and in Appendix I, “Sector and Regional Profiles of the North PacificGroundfish Fisheries.”

3See Section 5.13 for a more detailed discussion of the data sources.
30
“Economic Status of the Groundfish Fisheries off Alaska, 2000" (Hiatt, Felthoven and Terry, 2001), alsoknown as the “2001 Economic SAFE Report.” This document is produced by NMFS and updatedannually. The 2001 edition contains 49 historical tables summarizing a wide range of fishery informationthrough the year 2000.
Steller Sea Lion Protection Measures Final Supplemental Environmental Impact Statement (NMFS,2001b. Referred to as “SSL SEIS” in the remainder of this section) contains several sections with usefulbackground information on the groundfish fishery (although the majority of information provided isfocused on three important species - pollock, Pacific cod, and Atka mackerel). Section 3.12.2 providesextensive background information on existing social institutions, patterns, and conditions in thesefisheries and associated communities, Appendix C provides extensive information on fishery economics,and Appendix D provides extensive background information on groundfish markets.
Final Environmental Impact Statement for American Fisheries Act Amendments 61/61/13/8 (NMFS 2002)provides a survey of the Bering Sea and Aleutian Islands groundfish fishery paying particular attention tothe pollock fishery and the management changes introduced into it following the American Fisheries Act. The information is contained in Section 3.3, “Features of the human environment.”
A note on harvest data3
The description of the fishery in this section depends on data collected by the State of Alaska through itsfish ticket system, and on data collected by the Federal government through Weekly Processor Reports(WPRs) and observer reports. Fish ticket data (covering catcher vessels delivering to port) is organizedby Alaska statistical reporting area, while Federal data (for catcher-processors) is organized by the largerFederal statistical reporting areas.
The area within which fishing would be restricted under these alternatives (the treatment area) is the arc(shown in Figure 5.5-1) along the northwest side of the area closed to Pacific cod and pollock trawlingaround Cape Sarichef. This area is much smaller than the Alaska statistical area (655430) within whichalmost all of it occurs, and also smaller than the Federal reporting area.
Given the small size of the treatment area, it has not been possible to estimate the appropriate amounts offish harvested from it with any confidence. The lowest level of aggregation used for data in this report isthe Alaska statistical area. State fish ticket data is organized on this basis. Estimates of harvests for thecatcher-processors from State stat area 655430 have been made from Federal data for the Federalreporting area within which Area 655430 occurs (this is Federal area 517). The observer data mapped inAppendix A shows that much of the fishing activity in Area 655430 takes place outside the treatmentarea. Because significant Pacific cod fishing takes place within Area 655430, but outside the treatmentarea, the reported harvests and vessel numbers for Area 6655430 are larger than those for the treatmentarea. The amount by which Area 655430 harvests exceed the treatment area harvests is believed to besignificant.
Dates of actual harvest are only known for observed hauls of fish. However, much activity by this fleet isunobserved. Most of these vessels have only 30% observer coverage. Harvest data during the closedperiod has been estimated using the volumes of deliveries made in weeks with week ending dates thatincluded some days within the March 15 to March 31 period. This approach to estimating the period

31
during which landings occurred tends to an upward bias in the harvest and vessel number estimates. Aweek than ends on March 17 would include several days of landings before March 15; a week ending onApril 4 would include several days of landings afterwards.
These upward biases in the harvest estimate are due to the level of spatial and temporal detail required bythe analysis. The estimation tools are “blunt instruments,” not capable of making fine enough distinctionsto estimate harvests in this small treatment area during this short period with precision.
Activity in Area 655430 in the second half of March
Appendix A shows that the treatment area is at the far western end of a popular fishing area. This area,referred to as “cod alley” in the EA, stretches to the Northeast, several miles off of the north coast of theAlaska Peninsula.
Figure 1.1-2 superimposes the location of the treatment area over a bathymetric map of the seafloor. Thetreatment area lies over a fairly broad plateau 70 to 90 meters deep, that runs from the north side of AkunIsland across the top of Unimak Pass. As the bathymetric map shows, this plateau lies on the southeasternslope of the tip of the “horseshoe” fishing area. To the southeast, the slope of the horseshoe is muchsteeper and there is much less Pacific cod trawling activity. To the northeast, the slope into the horseshoeappears to be even less steep, and there is considerable trawling activity.
Medium sized (60-125 foot) bottom trawlers targeting Pacific cod and delivering them to shoresideprocessors were the most important element in the fleet fishing for groundfish in Alaska statistical area655430 during the second half of March from 1998 to 2001. The relative size of this fleet decreased,however, during this period. Vessels of this description harvested 78% of the groundfish from thestatistical area in 1998, but their share declined to 31% in 2001. As shown in Table 2.3-1 this decline isparalleled by an overall decline in harvests from this area over the period. It was, in fact, the decline inthe harvests by this class of vessel which accounted for most of the decline in overall harvest from thearea. (NMFS Alaska Region Catch by Vessel data set)
The smaller numbers of vessels in 2000 and 2001, and potential confidentiality issues, make it difficult tocharacterize the changes in the fleet. However, as harvests by the vessels described above declined,harvests by vessels with other characteristics became relatively more important. Catcher-processorsbecame more important in 2000 and 2001. Pot gear, in particular became important in 2001, accountingfor a third of the harvest that year. Harvests from vessels targeting Pacific cod declined somewhat, butremained high. (NMFS Alaska Region Catch by Vessel data set).
Table 5.6-1, below, shows the estimated numbers of vessels fishing in Alaska statistical area 655430 inthe second half of March, by the gear type used, for the period 1998-2002. Bottom trawlers were themost important component of the fishery fleet during this period. These are estimated vessel counts forstatistical area 655430, and are likely to exceed the numbers of vessels that fished in the treatment area.
Table 5.6-1 Numbers of vessels fishing groundfish in Alaska statistical area 655430 in the secondhalf of March by year and by gear type
Alaskastatisticalarea
Year Hook and line Bottom trawl Pots Mid-water trawl Unidentifiedtrawl
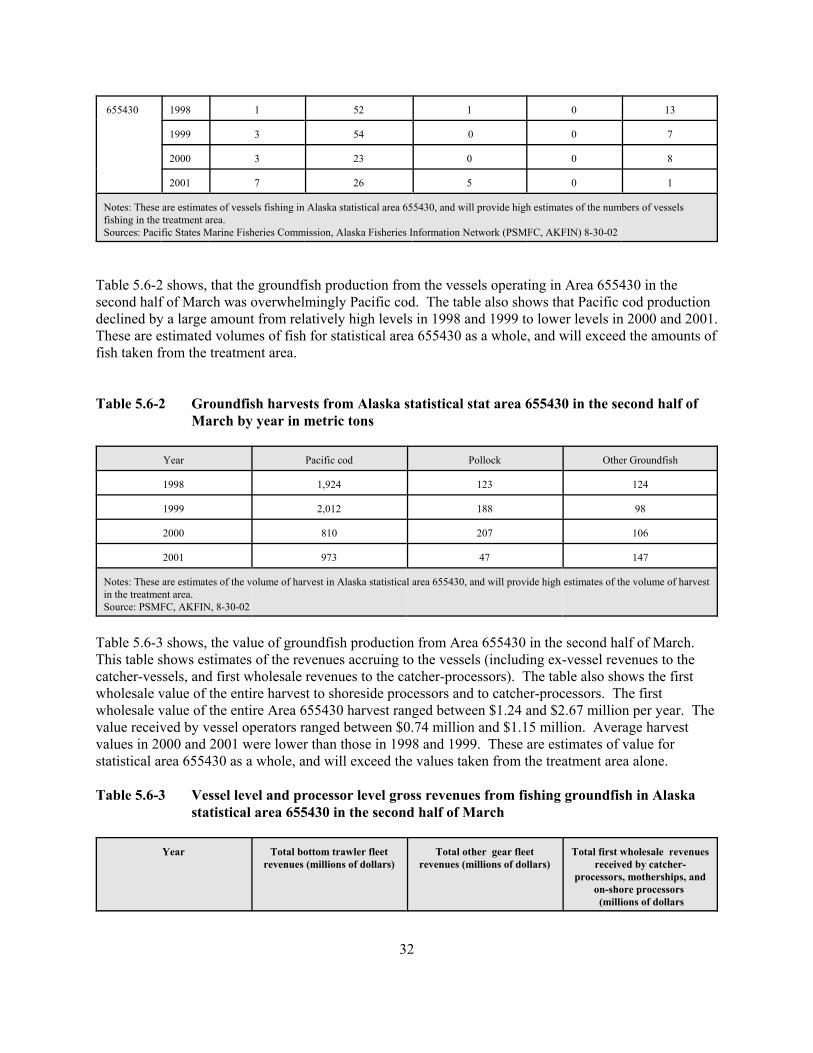
32
655430 1998 1 52 1 0 13
1999 3 54 0 0 7
2000 3 23 0 0 8
2001 7 26 5 0 1
Notes: These are estimates of vessels fishing in Alaska statistical area 655430, and will provide high estimates of the numbers of vesselsfishing in the treatment area.Sources: Pacific States Marine Fisheries Commission, Alaska Fisheries Information Network (PSMFC, AKFIN) 8-30-02
Table 5.6-2 shows, that the groundfish production from the vessels operating in Area 655430 in thesecond half of March was overwhelmingly Pacific cod. The table also shows that Pacific cod productiondeclined by a large amount from relatively high levels in 1998 and 1999 to lower levels in 2000 and 2001. These are estimated volumes of fish for statistical area 655430 as a whole, and will exceed the amounts offish taken from the treatment area.
Table 5.6-2 Groundfish harvests from Alaska statistical stat area 655430 in the second half ofMarch by year in metric tons
Year Pacific cod Pollock Other Groundfish
1998 1,924 123 124
1999 2,012 188 98
2000 810 207 106
2001 973 47 147
Notes: These are estimates of the volume of harvest in Alaska statistical area 655430, and will provide high estimates of the volume of harvestin the treatment area.Source: PSMFC, AKFIN, 8-30-02
Table 5.6-3 shows, the value of groundfish production from Area 655430 in the second half of March. This table shows estimates of the revenues accruing to the vessels (including ex-vessel revenues to thecatcher-vessels, and first wholesale revenues to the catcher-processors). The table also shows the firstwholesale value of the entire harvest to shoreside processors and to catcher-processors. The firstwholesale value of the entire Area 655430 harvest ranged between $1.24 and $2.67 million per year. Thevalue received by vessel operators ranged between $0.74 million and $1.15 million. Average harvestvalues in 2000 and 2001 were lower than those in 1998 and 1999. These are estimates of value forstatistical area 655430 as a whole, and will exceed the values taken from the treatment area alone.
Table 5.6-3 Vessel level and processor level gross revenues from fishing groundfish in Alaskastatistical area 655430 in the second half of March
Year Total bottom trawler fleetrevenues (millions of dollars)
Total other gear fleetrevenues (millions of dollars)
Total first wholesale revenuesreceived by catcher-
processors, motherships, andon-shore processors (millions of dollars

33
1998 $0.61 $0.13 $1.72
1999 $1.02 $0.13 $2.67
2000 $0.44 $0.29 $1.24
2001 $0.42 $0.27 $1.27
Notes: Bottom trawler and other gear revenues calculated using ex-vessel prices for catcher vessels, and first wholesale prices for catcher-processors. These are estimates of the value of harvest in Alaska statistical area 655430, and will provide high estimates of the value ofharvest in the treatment area. The “other gear revenues” include unidentified trawlers in 1998-2000, and may thus include some bottom trawlrevenues. Total first wholesale revenues and bottom trawl and other gear revenues are not additive.Source: PSMFC, AKFIN 8-30-02
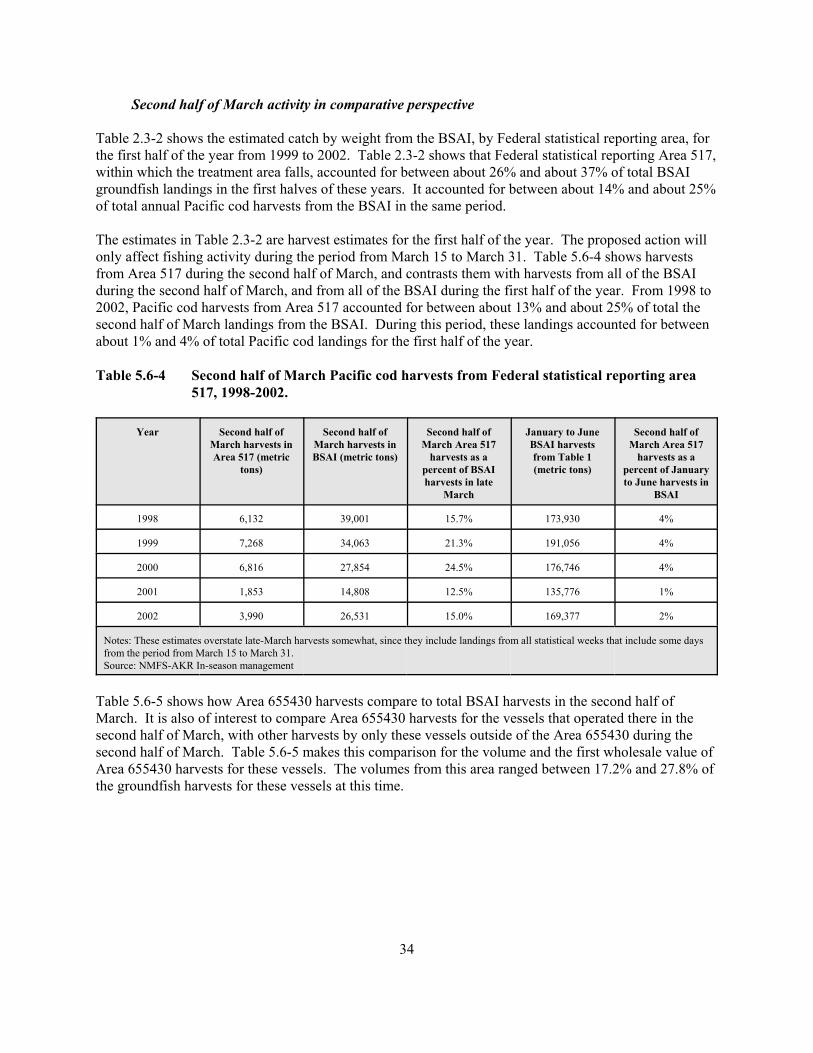
34
Second half of March activity in comparative perspective
Table 2.3-2 shows the estimated catch by weight from the BSAI, by Federal statistical reporting area, forthe first half of the year from 1999 to 2002. Table 2.3-2 shows that Federal statistical reporting Area 517,within which the treatment area falls, accounted for between about 26% and about 37% of total BSAIgroundfish landings in the first halves of these years. It accounted for between about 14% and about 25%of total annual Pacific cod harvests from the BSAI in the same period.
The estimates in Table 2.3-2 are harvest estimates for the first half of the year. The proposed action willonly affect fishing activity during the period from March 15 to March 31. Table 5.6-4 shows harvestsfrom Area 517 during the second half of March, and contrasts them with harvests from all of the BSAIduring the second half of March, and from all of the BSAI during the first half of the year. From 1998 to2002, Pacific cod harvests from Area 517 accounted for between about 13% and about 25% of total thesecond half of March landings from the BSAI. During this period, these landings accounted for betweenabout 1% and 4% of total Pacific cod landings for the first half of the year.
Table 5.6-4 Second half of March Pacific cod harvests from Federal statistical reporting area517, 1998-2002.
Year Second half ofMarch harvests inArea 517 (metric
tons)
Second half ofMarch harvests inBSAI (metric tons)
Second half ofMarch Area 517
harvests as apercent of BSAIharvests in late
March
January to JuneBSAI harvestsfrom Table 1(metric tons)
Second half ofMarch Area 517
harvests as apercent of Januaryto June harvests in
BSAI
1998 6,132 39,001 15.7% 173,930 4%
1999 7,268 34,063 21.3% 191,056 4%
2000 6,816 27,854 24.5% 176,746 4%
2001 1,853 14,808 12.5% 135,776 1%
2002 3,990 26,531 15.0% 169,377 2%
Notes: These estimates overstate late-March harvests somewhat, since they include landings from all statistical weeks that include some daysfrom the period from March 15 to March 31.Source: NMFS-AKR In-season management
Table 5.6-5 shows how Area 655430 harvests compare to total BSAI harvests in the second half ofMarch. It is also of interest to compare Area 655430 harvests for the vessels that operated there in thesecond half of March, with other harvests by only these vessels outside of the Area 655430 during thesecond half of March. Table 5.6-5 makes this comparison for the volume and the first wholesale value ofArea 655430 harvests for these vessels. The volumes from this area ranged between 17.2% and 27.8% ofthe groundfish harvests for these vessels at this time.
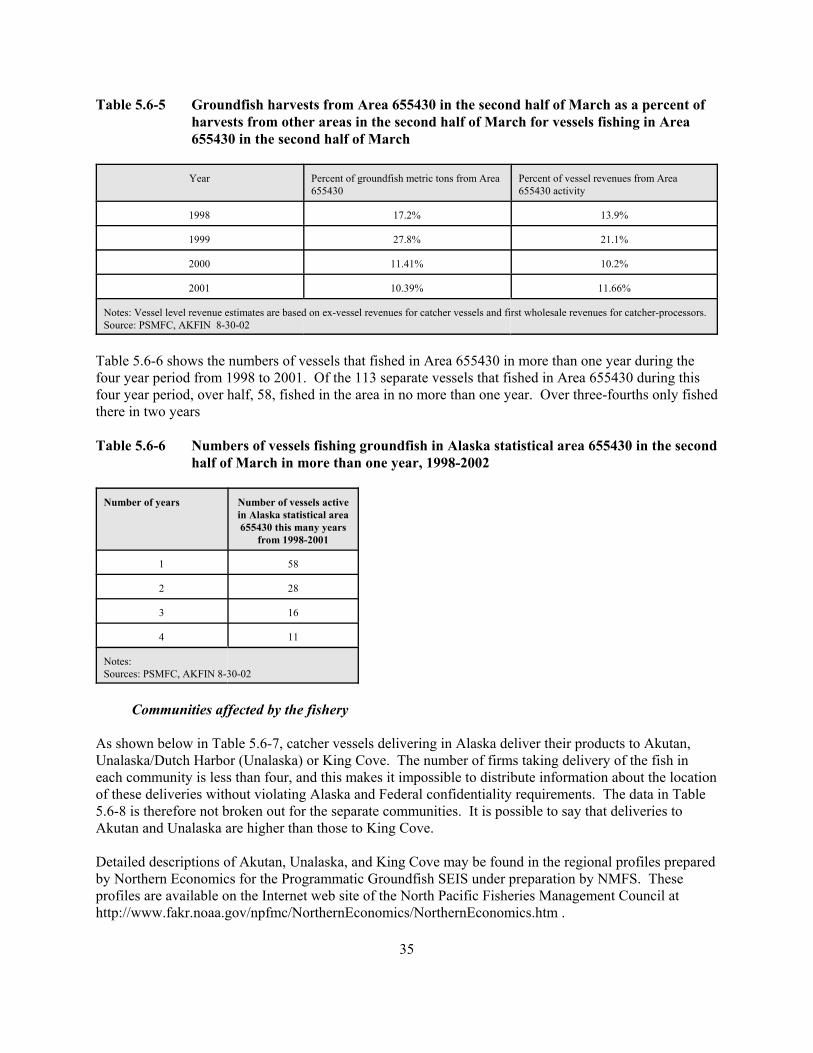
35
Table 5.6-5 Groundfish harvests from Area 655430 in the second half of March as a percent ofharvests from other areas in the second half of March for vessels fishing in Area655430 in the second half of March
Year Percent of groundfish metric tons from Area655430
Percent of vessel revenues from Area655430 activity
1998 17.2% 13.9%
1999 27.8% 21.1%
2000 11.41% 10.2%
2001 10.39% 11.66%
Notes: Vessel level revenue estimates are based on ex-vessel revenues for catcher vessels and first wholesale revenues for catcher-processors.Source: PSMFC, AKFIN 8-30-02
Table 5.6-6 shows the numbers of vessels that fished in Area 655430 in more than one year during thefour year period from 1998 to 2001. Of the 113 separate vessels that fished in Area 655430 during thisfour year period, over half, 58, fished in the area in no more than one year. Over three-fourths only fishedthere in two years
Table 5.6-6 Numbers of vessels fishing groundfish in Alaska statistical area 655430 in the secondhalf of March in more than one year, 1998-2002
Number of years Number of vessels activein Alaska statistical area655430 this many years
from 1998-2001
1 58
2 28
3 16
4 11
Notes:Sources: PSMFC, AKFIN 8-30-02
Communities affected by the fishery
As shown below in Table 5.6-7, catcher vessels delivering in Alaska deliver their products to Akutan,Unalaska/Dutch Harbor (Unalaska) or King Cove. The number of firms taking delivery of the fish ineach community is less than four, and this makes it impossible to distribute information about the locationof these deliveries without violating Alaska and Federal confidentiality requirements. The data in Table5.6-8 is therefore not broken out for the separate communities. It is possible to say that deliveries toAkutan and Unalaska are higher than those to King Cove.
Detailed descriptions of Akutan, Unalaska, and King Cove may be found in the regional profiles preparedby Northern Economics for the Programmatic Groundfish SEIS under preparation by NMFS. Theseprofiles are available on the Internet web site of the North Pacific Fisheries Management Council athttp://www.fakr.noaa.gov/npfmc/NorthernEconomics/NorthernEconomics.htm .

36
Akutan is a small Aleut community of about 100 persons located on the north side of Akutan Island in theAleutians, about 50 miles to the west of the treatment area. Akutan’s location is shown in Figure 5.6-1. Akutan’s actual 2000 census population is 713, but most of these persons live in the group housingconnected with a nearby fish processing plant. The profile of Akutan developed for the groundfish SEISnotes that “Akutan, while deriving economic benefits from the presence of a large shoreplant near thecommunity proper, has not articulated large-scale commercial fishing activity with the daily life of thecommunity. While US Census figures show Akutan had a population of 589 in 1990 and 713 in 2000, theTraditional Council considers the “local” resident population of the community to be around 80 persons,with the balance being considered “non-resident employees” of the seafood plant. This definition,obviously, differs from census, state, and electoral definitions of residency, but is reflective of the socialreality of Akutan.” (Regional Profiles, page 537-538). Harvests from the treatment area are believed tohave little impact on residents of Akutan.
Unalaska lies on the eastern end of Unalaska Island, about 35 miles west of Akutan and about 80 to 90miles from the treatment area. It’s location may be seen in Figure 5.6-1. The Unalaska economy is basedon fishing, fish processing and transportation, and support services for the groundfish and crab fisheries,and to a lesser extent halibut and salmon. Unalaska is arguably the most important fishing port in theUnited States; it routinely has the largest landings in volume, and for many years has normally had thelargest landings in value. In 2000, the estimated wholesale value of the fish products processed here wasabout $139 million dollars (Regional Profiles, page 520). The US census estimated the 2000 populationof Unalaska at 4,283. The Regional Profile notes that, in addition to the year-round population, Unalaskahas a “floating” population composed of crew members of “fishing fleets, floating processors,catcher/processors, and freighters that stop at the port of Unalaska for resupply.” In 1990 this floatingpopulation was estimated at about 18,000 persons. (Regional Profile, page 511). The Regional Profilealso notes, on the basis of field interviews, that population may have declined somewhat in 2001 and2002 due to rationalization of pollock fisheries following the introduction of the American Fisheries Act(AFA) “Anecdotal evidence cited by interviewees included less participation in city-sponsoredrecreational sports...and an easing of the shortage of housing...” (Regional Profile, page 514).
King Cove is located to the east of the treatment area on the south side of the Alaska Peninsula. TheAlaska Department of Community and Economic Development describes King Cove as dependent“...almost completely on the year-round commercial fishing and seafood processing industries.” TheRegional Profile notes that King Cove differs from Akutan in that the processing plant is much moreintegrated into the fabric of the community, and it has a resident fishing fleet delivering to the localseafood processor (Regional Profile, page 540). With respect to the King Cove processing plant, theRegional Profile notes, “The King Cove plant processes a good amount of crab and has developedgroundfish processing capability, with Pacific cod as the predominant species, and with significantamounts of cod being supplied from both the GOA and BSAI regions. The plant also processes a largeamount of salmon, and some herring and halibut.”(Regional Profile, page 544).

37
Table 5.6-7 Location and volume of deliveries of unprocessed groundfish harvested in Alaskastatistical area 655430 in the second half of March, 1998-2002
Year Communities withdeliveries
Volume from Area655430
(mt)
Value from Area655430
(Millions $)
Volume from allstat areas in thesecond half of
March(mt)
Area 655430 as apercent of total
volume
1998 Akutan, King Cove,Unalaska
1,973 $1.60 8,460 23%
1999 Akutan, King Cove,Unalaska
2,143 $2.55 8,574 25%
2000 Akutan, King Cove,Unalaska, floaters
840 $0.95 18,053 5%
2001 Akutan, King Cove,Unalaska, floaters
728 $0.86 46,453 2%
Notes: The small numbers of buyers make it impossible to report community deliveries separately. The large increase in overall volume fromall statistical areas in 2000 and 2001 is due to increases in pollock deliveries in those years.Source: PSMFC, AKFIN 8-30-02
Figure 5.6-1 Communities where groundfish from the proposed closure area are landed

38
There are significant minority populations in the three communities in which groundfish have beenlanded from the treatment area. The percentages of the population in each community claimingmembership in one of six racial groupings on the 2000 Federal census is shown in Table 5.10-1. Theprincipal minority populations identified include Alaska Natives and Asians (predominately people ofFilipino origin).
As noted earlier, Akutan is actually a composite “community.” Fish are delivered to a processing plantnear the town, but the town has little interaction with the plant or the fishing vessels that deliver fish to it. The census population estimates lump the population of the town with the population in group housing atthe processing plant. Therefore, the actual Alaska Native population percentage of the town itself isprobably understated by the estimate in Table 5.6-8.
Table 5.6-8 Percent of the population claiming membership in six racial groups on the 2000census in Unalaska, Akutan, and King Cove
Community White Black Native Asian PacificIslanders
Other
Akutan 17.8 1.6 47.9 28.8 0.6 7.2
Unalaska 25.0 2.1 16.4 39.4 0.3 18.4
King Cove 47.3 4.0 9.3 32.5 1.0 10.3
Notes: Percentages in a community may sum to more than 100 since persons may belong to one or more racial groups.Source: 2000 Census
Table 5.6-9 summarizes information on income levels, and poverty populations in Akutan, Unalaska, andKing Cove.
Table 5.6.9 Low income populations in Akutan, Unalaska, and King Cove
Community Per capita income Median householdincome
Median familyincome
Persons in poverty Percent of thepopulation belowthe poverty line
Akutan $12,259 $33,750 $43,125 297 45.5%
King Cove $17,791 $45,893 $47,188 97 11.9%
Unalaska $24,676 $69,539 $80,829 533 12.5%
State of Alaska $22,660 $51,571 $59,036 57,602 9.2%
Notes:Sources: Alaska Department of Community and Economic Development; 2000 U.S. Census
Another way to look at community involvement is to assign harvests to the communities where theowners of the vessels used in the fishery reside. Due to confidentiality restrictions, harvests by vesselowner community are not reported here, but Table 5.6-10 does report the value of harvest by vessel ownerstate. Most of the harvest in each year is taken by vessels whose owners reside in Washington, and to alesser extent, in Oregon. California, Maine, and Alaska are other states with resident vessel owners

39
whose vessels are active in this area. Vessel owners from Alaska do not have a big presence in this area. Table 5.6-11 below shows the communities in each state with vessel owners who operate in this area.
Table 5.6-10 Alaska statistical area 655430 vessel groundfish harvest values in the second half ofMarch by state of residence of vessel owner
Year Washington Oregon Other and unknown
1998 $434,000 $185,000 $122,000
1999 $1,029,000 $111,000
2000 $410,000 $305,000
2001 $478,000 $210,000
Notes: All estimates rounded to nearest $1,000. Revenues include ex-vessel revenues for catcher vessels, and first wholesale revenues forcatcher-processors. The “Other and unknown” category includes harvests by vessels with owners resident in Alaska, California, and Maine,and by vessels whose owner’s residence is unknown. Oregon revenues have been combined with Washington and other state revenues,depending on year, to preserve data confidentiality.Sources: PSMFC, AKFIN 8-30-02
Table 5.6-11 Communties with resident vessel owners whose vessels are active in the treatmentarea (Alaska statistical area 655430).
State Communities
Alaska Homer, Kodiak, Petersburg, Seward, Unalaska
California Half Moon Bay, San Francisco
Maine Rockland
Oregon Astoria, Newport, Prineville, Seal Rock, Siletz
Washington Aberdeen, Anacortes, Bainbridge Island, Bellingham, Blaine, Bothell, Duvall, Edmonds, Friday Harbor, Lynnwood,Mill Creek, Oysterville, Seattle, Shoreline, South Bend, Westport
Notes: The owner’s home was unknown for one vessel.Source: PSMFC, AKFIN 8-30-02
5.7 Benefits of the alternatives
As noted in Section 5.2, “Purpose and need for action,” the past 20 years have seen large declines in thepopulation of the western distinct population segment (DPS) of the Steller sea lion. This population ofthe Steller sea lion has been listed as endangered under the Endangered Species Act (ESA). Depletion ofstocks of sea lion groundfish prey by commercial fishermen near the Stellers’ haulouts and rookeries(“localized depletion”) has been identified as a possible cause. The principal groundfish species ofconcern are pollock, Akta mackerel, and Pacific cod.
Fishing regulations implemented with the 2002 fishing year have imposed restrictions on commercialfishing for pollock, Pacific cod and Atka mackerel near rookeries and haulouts. These restrictions arebelieved to be expensive for industry. The RIR prepared at the time the restrictions were under

4The Pacific cod and trawl estimates are presented here because the proposed experiment would examinethe impact of Pacific cod trawling on localized depletion.
5This is discussed extensively in the RIR that accompanies the EIS. See also Section 5.7 of this RIR.
40
consideration, estimated that the total annual value of Pacific cod formerly taken from the waters now tobe restricted was on the order of $21 million per year in the BSAI and GOA. The value taken by trawlgear was $6 million per year.4 While much of this gross value was undoubtedly offset by changes infishing patterns: (a) not all of it may have been, (b) it was likely done at increased cost, and (c) the burdenis widely believed to have fallen more heavily on small entities which are less able to travel further fromport.5 Moreover, the regulations imposed in 2002 were controversial. Many believe the appropriateregulations should be more restrictive. One alternative under consideration would have restricted watersfrom which Pacific cod worth an estimated $48 million were taken per year ($28 million a year worth oftrawl fish). (NMFS, 2001(c), pages C132-C140.)
The Alaska Fisheries Science Center (AFSC) is conducting an experiment in January and March 2003 totest the hypothesis of localized depletion of Pacific cod by trawl gear in an area to the northwest of CapeSarichef. In addition, the experiment should provide information on seasonal and spatial distributions ofPacific cod in the area of Unimak Pass, and on the feasibility of the use of pot gear in future scientificstudies of this type. The AFSC is seeking funding to continue the experiment in the years 2004 to 2006.
The test of the localized depletion hypothesis is the most important information expected from thisexperiment. The information will be valuable if it allows managers to make decisions that will increasethe value of the economic and ecological benefits provided by the BSAI and GOA groundfish fisheries.
This proposed action is designed to enhance the value of the experiment by increasing the power of thestatistical tests.
The mechanics of the experiment
The experiment is described in detail in Appendix A. The sampling unit is five Pacific cod pots. Eachgroup of five pots will be located closely together to maximize correlation among the pots within the unit. There are multiple pots in a sample unit to provide a smoothing effect for nuisance variability in the catchdata. This practice is established in other pot-based research.
It is anticipated that 40 pots will be launched and lifted on most days (eight sample units per day). Onsome days as few as 30 may be fished, while on other days as many as 50 (although both ends of therange are unlikely).
A chartered vessel will be in the treatment and control areas in the second half of March, after the periodof most intense trawling activity. Research fishing will take place every day of the closure, weatherpermitting. There are 16 days from March 16 to March 31. It is expected that only 1 or 2 days will belost to weather. The resulting fourteen fishing days will provide 560 pot fishing days, or 112observations (560/5).
Half of the samples will be placed in the treatment area, and half in the control area (a comparably sizedarea immediately adjacent to the treatment area). Each sample unit will be executed at a station. Thatstation will remain the same before and after the trawl fishery. If the regulation does not go into effect, 56

41
sample observations will be vulnerable to perturbation by trawlers. Sample units that are lost to trawlersdue to excessive pot loss will effectively cause the loss of the sampling done at the corresponding stationsbefore the fishery as well as the loss of the sample unit in the March closure.
Possible pot losses without the regulation
It is impossible to know in advance what the pot loss rate would be without the regulation. It is likely tobe high. The treatment area is relatively small and the number of stations is relatively large, so it is likelythat the pots will crowd the trawled experimental region enough to make it impossible for trawlers toavoid the pot gear. For the purpose of discussion, two levels of pot loss are examined. The two rates ofdaily pot loss considered here are 20 percent and 50 percent.
Assuming an average of 40 experimental pots fished each day, with half in the treatment area, a 20% lossrate translates into the loss of four pots a day. The impact will depend on the distribution of these lossesamong the observation units of five pots each. At one extreme, in which sample unit loss is minimizedand the losses occur as erosion of pots per sample, 4 out of 4 sample units could have their number ofpots reduced from 5 to 4 each day. Over 14 fishing days 56 sample units could have their number of potsreduced by 1, with an associated increase in the sample variance. At the other extreme, in which pot losscauses maximum loss of sample units, one sample unit could be lost entirely and another reduced from 5to 4 pots. Over 14 fishing days 14 sample units would be lost and 14 would have their number of potsreduced by 1, with an associated increase in the sample variance.
A 50% rate corresponds to a loss of 10 pots per day. At one extreme, in which sample unit loss isminimized and the losses occur as erosion of pots per sample, 1 sample unit is lost (all 5 pots lost), 2 arereduced from 5 to 3 pots, and one sample unit is reduced from 5 to 4 pots. Over 14 fishing days 14sample units are lost, 28 sample units are weakened from 5 to 3 pots, and 14 sample units are reducedfrom 5 to 4 pots. None of the sample units remain as originally planned, consisting of 5 pots, with anassociated increase in sample variance. At the other extreme, in which pot loss causes maximum loss ofsample units, 3 out of 4 daily sample units could be lost entirely and another reduced from 5 to 4 pots. Over 14 fishing days 32 sample units would be lost and 14 would have their number of pots reduced by 1,with an associated increase in the sample variance.
Impacts of pot loss on the power of the test
Catch will be determined for each five pot sample unit (in fished and unfished areas alike). At eachstation, with samples from before and after the trawl fishery, a quantity will be computed representing thechange in abundance at that station. Call this quantity “D”. There will be two kinds of Ds, “D-trawled”from the treatment area, and “D-not-trawled” from the control area. The quantity, D, represents themeasure of the trawl fishing effect. The hypothesis is that, either “D-trawled equals D-not-trawled” ifthere is no trawl fishery effect, or “D-trawled is not equal D-not-trawled” if there is a trawl fishery effect. For the trawled and untrawled regions of the experiment, the distributions of the Ds will be comparedusing a randomization test.
More pots per sample unit gives us a lower sample variance since more nuisance variability is smoothedout. Fewer pots per sample unit gives us a larger population of observations upon which to base ourcomparison of the distribution of D-trawled to D-not-trawled. However, if there are too few pots in eachsample unit, all of the variability will translate into greater difficulty in discerning differences indistributions. If the number of pots per sample unit is eroded by trawling, then the difficulty of

6“School fractal dimensions” refers to the relationship between the surface area of the school and itsvolume.
42
comparing distributions increases, even if the number of sample units is not reduced or is reduced only alittle.
If our target number of pots per sample unit is reduced from 5 to 2 or fewer, we will consider the sampleto be no longer valid. If a sample loses 2 of its 5 pots we will still consider it a valid observation.
In the randomization test there are no clear rules or formulae for defining and the computing power of thetest (as compared to the familiar one- and two-sample t tests). However, the concept is valid. The goal isto avoid the mistake of concluding that there was no effect when there was indeed an effect but oursample size was too small to permit us to distinguish that effect from the background noise. This is thedanger of small sample size. The power of the randomization test that we will use will be eroded in twoways, the number of pots in a sample can decrease (causing greater sample variance, necessitating aneven larger sample size) and the sample size itself can decrease.
The potential value of the experimental results
Despite the significant restrictions on groundfish fishing in Steller critical habitat that were incorporatedinto the fishery regulations (and even more restrictive measures have been and continue to be considered)there is very little concrete information on localized depletion. This experiment is designed to help fillthe information gap. So far no experiments have been conducted to test the hypothesis of localizeddepletion in Pacific cod.
This experiment is part of a larger program of research. The Alaska Fisheries Science Center has alreadycompleted two years of a projected multi-year study of the impact of fishing activity on pollock stocks inthe GOA south of Kodiak Island. In this study, Chiniak Trough is being used as a control site in whichtrawl fishing is prohibited, while Barnabus Trough is being used as a treatment site in which trawl fishingis allowed. Echo integration-trawl (EIT) surveys are conducted in each trough before and after trawlfishing is allowed in the Barnabus Trough. Pollock patterns in the two Troughs would then be comparedto determine whether or not trawling had affected the Barnabus pollock stock. Analytical work isconducted in August. As this is written (July 2002) complete “before and after” analysis has only beencompleted for 2001. A preliminary analysis of the 2001 results says that, “Preliminary results from thesecond year, when the commercial fishery took place within ths study area, have yet to suggest asignificant link between fishing activities and changes in adult and age-1 pollock geographicaldistribution, biomass, vertical distribution, or school fractal dimensions.”6 (Wilson et al., page 14.)
The Chiniak study will provide important information about localized depletion of pollock stocks, andthis information will undoubtedly be generalizable to other contexts. However, the Chiniak study dealsonly with pollock, and pollock is only one of the three species of principal concern. Pacific cod andpollock are different species with different behaviors. Pollock results can’t be generalized to Pacific cod.
This research project will provide information on localized depletion of Pacific cod by trawl gear in animportant trawl fishing area. The test will show whether or not an index of Pacific cod abundance, basedon data collected with pot gear, shows a decline between a time immediately before trawling commences,and a time immediately after a period of intense trawling. If localized depletion is detected, subsequentyears research may also look at the speed with which in-migration of cod offsets the depletion. This

43
research project will not examine the response of the Steller populations to localized depletion of Pacificcod. While this research addresses the impact of trawling on cod depletion near Cape Sarichef,information gathered may be generalizable to other fishing areas located near haulouts and rookeries.
Better information on seasonal and spatial distributions of Pacific cod
In addition to the designed objective, this study may provide valuable information on small- tointermediate-scale spatial variability of Pacific Cod during the winter spawning season. The localizeddepletion study provides a platform for sample collection and observation of spawning cod that is notavailable from regular summer surveys. Investigations already underway in connection with the studyinclude collection of length frequencies, sex ratios, and maturity data from cod on spawning grounds;sample collection for proximate analysis and fecundity studies of cod at different ages and spawningstates; and a tagging program to collect information on both small-scale movements during spawningseason and long-range seasonal movements in models of Steller sea lion foraging. Expanded knowledgeof spawning habitat and behaviors may also improve stock assessment modeling and management of theBSAI Pacific cod.
The cost of lost pots
In addition to the increase in sample variance, pot loss rates at these levels imply fairly large costs for potloss. The research pots are more expensive than normal Pacific cod pots. The cost of fabricating, rigging,and shipping a research pot is about $1,460.
At a 20% loss rate, 4 pots are lost per day for 14 days and 56 pots will be lost. This implies a pot losscost of $81,760. At a 50% loss rate, 10 pots are lost per day for 14 days so that 140 pots will be lost. This implies a pot loss cost of $204,400. Associated costs will also be due to lost charter time required tohandle such large numbers of pots. There will be extra trips and associated loading times when it isnecessary to run to the holding grounds to collect replacement pots.
Relative benefits of Alternatives 2 and 3
Alternative 3 includes the restrictions on trawling in the treatment area, but adds a restriction on fishingfor groundfish with longline or pot gear in the treatment area. Currently there is little longline or potfishing in this area in the second half of March (although pot fishing did take a significant share of thefish from this area in the second half of March in 2001). This may be due in part to the trawling in thisarea and the potential for gear conflicts between trawl and fixed gear. There is a concern that if thetrawling is prohibited in the area, longline and pot fishermen that had not been active there before mightenter and begin fishing more intensively with these gears. Alternative 3 is designed to prevent fixed-gearvessels (primarily longliners) from making substantial removals of cod from the study area as the “after”leg of the experiment is being conducted. Large removals during this period could result in decreases inlocal abundance that would be interpreted as a trawl effect.
5.8 Costs of the alternatives
The most important cost of this proposal will be the reduced value of harvests for any vessels that wouldhave operated in the closed area during the second half of March, and for any processors that would have
44
processed these harvests. Vessels that would otherwise have fished in the control area will fish elsewhereincurring higher operating costs or reduced revenues.
Table 5.6-3 summarizes information on the estimated revenues earned by fishing vessels and by fishprocessors from stat area 655430 in the second half of March from 1998-2001. Vessel revenues (ex-vessel revenues for catcher vessels and first wholesale revenues for catcher-processors) ranged from$0.74 millions to $1.15 millions during this period. First wholesale revenues to all processors rangedfrom $1.24 to $2.67 during this period.
This estimated first wholesale value is expected to exceed the total cost of the proposed closure to thefishing and processing industry for three reasons: (1) it is a measure of gross revenues, and ignores thevariable costs of harvesting the fish; (2) the volumes and values reported here have a known upward bias,and (3) because the fishing operations involved will be able to change their fishing patterns and make upat least part of their harvests elsewhere.
First, the estimated first wholesale revenues reported in Table 5.6-3 exceed the social benefits, or thereturns to the fishermen and processors, by the variable costs of harvesting and processing these fish. These include the costs of fishing and processing labor, fuel, wear and tear on gear, utilities for theprocessing plant, and so on. Information on these costs that might have been used to estimate the netreturns from the fishing activity in this area is not available.
Second, as Figure 5.5-1 shows, the treatment area only takes up a small part of the surface area of Alaskastatistical area 655430; more importantly, as observer data in Appendix A shows, it is only part of thearea within the statistical area where harvesting takes place. During the second half of March, groundfishharvesting is concentrated in the eastern end of the statistical area. The treatment arc is located in thesouthern half of this fishing area. Thus, value of actual harvests from the treatment area will besignificantly less than the values shown for the whole statistical area in Table 5.6-3. Moreover, as notedin Section 5.6, the estimation technique used to estimate harvests from the statistical area in the secondhalf of March probably has an upward bias.
Third, the fishing operations that will not be able to fish in the treatment area during the period of theclosure will be able to fish elsewhere during that time. Thus they should be able to make up some of theharvest they would lose in the closure. A long underwater ridge extends parallel to the north side of theAleutians and Alaska Peninsula. It is fairly narrow north of Akutan and across the mouth of UnimakPass, and widens north of Cape Sarichef. Much of the trawling that will be impacted is taking place alongthis ridge. It is likely that if the fishermen compensate for the treatment area closure by fishingelsewhere, they will move to the northeast along this ridge. Alternatively, they may move to the north,and trawl in waters of similar depth on the northern side of the horseshoe. (Conners, pers. comm).
These operations would incur a cost because they had to change their fishing patterns. They have shownthat they prefer to do a certain amount of fishing in Area 655430 during this time. This may be becauseof a higher catch per unit of effort, shorter runs to the processor ports of Akutan, Unalaska, and KingCove, or for other reasons. Whatever advantages this area holds will be lost to them, even if they are ableto make up the lost fish by fishing elsewhere. Thus a movement to another location will effectivelyincrease their costs, even if their revenues remain unchanged.
Models of the fishing behavior of these vessels, that would make it possible to predict how they will altertheir behavior, are not available. It does seem possible that they will react by shifting their fishingactivity to the northeast. As the bathymetric map in Figure 1.1-2 shows, the relatively gentle slope into
45
the horseshoe on which they are fishing extends in that direction. As Appendix A shows, the treatmentarea is the southeastern end of a long “cod alley” subject to heavy fishing extending to the northeastseveral miles offshore of the north coast of Unimak Island. As Table 2.3.1 shows, Federal statisticalreporting area 509, which is to the east of Alaska statistical area 655430, is an area of heavy Pacific codfishing activity. A shift of this nature would take the catcher vessels somewhat further from the portswhere they deliver the harvest.
Alternative 3 may have somewhat higher costs than Alternative 2 since it affects two additional geartypes. These costs are likely to be small. As shown in Table 5.6-1, the numbers of longline and potvessels operating in the treatment area were small compared to the numbers of bottom trawl vessels in theperiod from 1998-2001. As shown in Table 5.6-3, other gear revenues (possibly including someunidentified bottom trawl revenues) were about $290,000 in 2000 (the highest annual level during thisperiod). This value would certainly overstate the net cost of Alternative 3 compared to Alternative 2because it does not take account of vessel variable costs, and because these vessels can fish elsewhereduring this period.
5.9 Impacts on fishing communities
National Standard 8 of the Magnuson-Stevens Act (MSA) provides that, “Conservation and managementmeasures shall, consistent with the conservation requirements of this Act (including the prevention ofoverfishing and rebuilding of overfished stocks), take into account the importance of fishery resources tofishing communities in order to (A) provide for the sustained participation of such communities, and (B)to the extent practicable, minimize adverse economic impacts on such communities.” (16 U.S.C. 1851) Afishing community is defined in the act as a community which is “substantially dependent on orsubstantially engaged in the harvest or processing of fishery resources to meet social and economic needs,and includes fishing vessel owners, operators, and crew and United States fish processors that are based insuch community.” (16 U.S.C. 1802)
As noted in Section 5.6, the groundfish harvested from the treatment area by catcher vessels in the secondhalf of March have been delivered to Akutan, Unalaska, and King Cove during the past five years (1998-2002). Because the fish are delivered to only a few processors in each community, it has not beenpossible to provide numerical estimates of the amounts of fish delivered to each community. Thesecommunities are all fisheries dependent communities, by any definition of that term. This is apparentfrom even a casual review of the Alaska Department of Community and Economic Development profilesof these communities. Akutan; “Commercial fish processing dominates Akutan’s cash-basedeconomy....” Unalaska: “Unalaska’s economy is based on commercial fishing, fish processing, and fleetservices...” King Cove: “King Cove’s economy depends almost completely on the year-roundcommercial fishing and seafood processing industries...”
The information collected in this analysis suggests that the impact of the proposed regulation will nothave a significant impact on these communities. The amounts of fish involved are modest compared tooverall harvests of groundfish and other fish resources landed in these communities. The catcher vesselsthat harvested in the area to be restricted should be able to harvest almost as much as before by shiftingtheir fishing areas by a few miles. Any shifts in fishing area are likely to move the fleet fishingoperations further from the three ports and increase the costs of deliveries to these ports, but for smallchanges in fishing location these would remain the closest ports.
46
5.10 Impacts on minority and low-income populations
Because the impacts on the communities are expected to be small, the impacts on minority and lowincome populations within those communities are also expected to be small.
5.11 Summary of the benefits and costs
The benefits and costs of the alternatives are summarized below in Table 5.11-1. These impacts werediscussed more carefully in Sections 5.7 (Benefits), 5.8 (Costs). The final section of the RIR, Section5.12, summarizes the implications for the E.O. 12866 significance analysis. These proposals are notbelieved to be significant within the meaning of E.O. 12866.
In general the information on operating behavior and costs that would make it possible to predict howfishermen and markets will react to the new regulation, and how their costs and revenues will change, isnot available. Therefore this analysis of benefits and costs must be primarily qualitative.
In addition to summarizing information on benefits and costs from Sections 5.7 and 5.8, Table 5.11-1summarizes information from Sections 5.9 and 5.10 on community, low income and minority impacts,and summarizes the information on E.O. 12866 significance that can be gleaned from this RIR. Thediscussion of program objectives is not meant to be an analysis of the pros and cons of the program. It isa simple statement of whether or not the alternative appears to meet the objectives for this action outlinedin Section 5.4. In particular, an alternative might meet those objectives and still not be desirable, forexample, because of overall costs that outweigh the benefits, or because of important distributionalconsequences. The discussion of E.O. 12866 significance is not a certification of significance or non-significance. It is not the place of the analyst to weigh the various criteria and make that decision. It doessummarize the information bearing on the significance decision contained in this RIR.

47
Table 5.11-1 Summary of the cost and benefit analysis
Alternative 1 Alternative 2 Alternative 3
No restrictions in thetreatment area
No trawling in the treatmentarea
No trawling in the treatmentarea; no longlining or pot fishingin the treatment area either
Benefits(see Section 5.7)
Baseline The experiment to test thelocalized depletion of Pacificcod by trawl gear will havemore statistical power. Resultshave a greater likelihood ofbeing useful for managementdecision making. The cost ofexperimental pot losses due totrawl-pot conflicts may belower.
This alternative has benefits similarto those for Alt 2. In addition, thisalternative may prevent an influxof pot and longline gear into thetreatment area while the trawl gearis restricted. An influx of pot, andparticularly of longline, gear maydistort the harvest rates obtainedfrom the experimental pots. Largeremovals during the period couldresult in decreases in localabundance that would beinterpreted as a trawl effect.
Costs: increased cost to industry(see Section 5.8)
Baseline Vessels are expected to shiftmost of their fishing effortelsewhere. They may haveincreased costs due to theadditional travel time requiredto fish somewhat further fromAkutan, Dutch Harbor or KingCove. Revenue losses areexpected to be minor.
This alternative has costs similar tothose for trawlers under Alt 2. Thepotential for cost and revenueimpacts is increased due to therestriction on pot and longline gear.
Community impacts Baseline Community impacts areexpected to be small
Community impacts are expectedto be small.
Impacts on minority and lowincome populations
Baseline Any impacts are expected to besmall
Any impacts are expected to besmall
Does the alternative meet theaction objectives (See Section5.4)
No. This action does notincrease the power of thetest, or reduce the costs ofthe experiment.
Yes. This alternative increasesthe power of the test.
Yes. This alternative increases thepower of the test.
Is this action significant underE.O. 12866 (see Section 5.12)
This action does not appearto trigger the E.O. 12866significance criteria.
This action does not appear totrigger the E.O. 12866significance criteria
This action does not appear totrigger the E.O. 12866 significancecriteria
Notes: Alternative 1 (status quo) is the no action alternative and provides the baseline against which the costs and benefits for actionalternatives have been estimated. The table is color-coded to separate benefit-cost analysis considerations from other issues.
5.12 Summary of the significance criteria
A “significant regulatory action” under E.O. 12866 means any action that is likely to result in a rule thatmay:
• Have an annual effect on the economy of $100 million or more or adversely affect in a material waythe economy, a sector of the economy, productivity, competition, jobs, the environment, publichealth or safety, or State, local, or tribal governments or communities;

48
• Create a serious inconsistency or otherwise interfere with an action taken or planned by anotheragency;
• Materially alter the budgetary impact of entitlements, grants, user fees, or loan programs or therights and obligations of recipients thereof; or
• Raise novel legal or policy issues arising out of legal mandates, the President’s priorities, or theprinciples set forth in the executive order.
This discussion of E.O. 12866 significance is not a certification of significance or non-significance. It isnot the place of the analyst to weigh the various criteria and make that decision. It does summarize theinformation bearing on the significance decision contained in this RIR.
The largest first wholesale gross revenues from the groundfish fishery in stat area 655430 in the secondhalf of March in any of the five years examined was $2.75 millions in 1999. This almost certainlyoverstates the gross revenues from the impacted part of stat area 655430. This proposal will not have anannual effect on the economy of $100 million or more. NMFS has not identified any factors that would:(a) “adversely affect in a material way the economy, a sector of the economy, productivity, competition,jobs, the environment, public health or safety, or State, local, or tribal governments or communities,” (b)“Create a serious inconsistency or otherwise interfere with an action taken or planned by another agency”;(c) “Materially alter the budgetary impact of entitlements, grants, user fees, or loan programs or the rightsand obligations of recipients thereof”; or (d) “Raise novel legal or policy issues arising out of legalmandates, the President’s priorities, or the principles set forth in the executive order.”
5.13 Data Sources
The data used in RIR tables 5.6-1 to 5.6-3, and 5.6-5 to 5.6-11 was prepared by the Alaska FisheriesInformation Network (AKFIN), a division of the Pacific States Marine Fisheries Commission (PSMFC).
For catcher vessels delivering on shore or to shoreside floating processors, harvest estimates are based onState of Alaska fish tickets. These data were selected with delivery dates between March 15 and April 2, or within two days of the proposed closure date to account for all deliveries. Alaska requires fishermenmaking groundfish landings to report the state statistical area of the landing on fish tickets. Errors in theassignment of catcher vessel harvest to a statistical area may be introduced at two levels: first statisticalarea fished can be a rough estimate of location of the catch made by fishermen at the time of delivery; and second fishermen who operated in multiple statistical areas must estimate the allocation of theirharvests by statistical area.
Catcher-processor and mothership catcher vessel harvests were estimated from the “blend” data. Theblend is a mixture of data from observers and from Federal Weekly Processor Reports (WPRs) used formanagement. The blend estimate of harvest retains the broad Federal management areas of the harvest butnot a vessel’s latitude and longitude of catch as found in the observer data. To aggregate catch and valueinformation from catcher processor and catcher vessels (shoreside and mothership deliveries) by area forthis analysis the management area from blend data was translated to state statistical area. This processrequired alignment of all total catch haul data from the observer program with the blend estimate of catch.
Observer program coverage provides information on the latitude and longitude at which gear wasrecovered, and thus provides a relatively reliable way of determining the location of harvest. However,only vessels over 125 feet in length are required to carry observers 100% of the time (except for vessels
49
fishing pot gear, which are only required to carry observers 30% of the time). Even on vessels with 100%observer coverage, not all hauls can be observed. Most vessels operating in the proposed closure area arebetween 60 and 125 feet, and only require 30% observer coverage. In this group of vessels the harvestlocation of a large part of the harvest must was estimated from other information.
In addition to location, data on catch composition is missing for catcher-processor harvests that areunobserved. Species catch composition was therefore also estimated from other information.
The details of the process used to estimate the species catch composition and the location of catch maybe found in the administrative record. The approach used was a form of a “nearest neighbor” approachfor lack of a better term. In essence, this approach estimates species composition and assigns a ½ by 1degree latitude and longitude quadrant to harvest from an unobserved haul by comparison to observedhaul data with similar attributes of week of harvest, location of harvest, and gear used. Vessels withunobserved hauls are assigned catch composition and harvest area from their own observed haul datafrom similar geographic area and time period when possible. If no observed haul information exists for avessel then observed haul information from similar vessels (nearest neighbors) is used to make estimatesabout the vessel’s harvest by species and area.
Vessels lacking specific catch location data recorded through observation are compared to vessels whichare most similar first, but if no other vessels are similar with respect to all the criteria used, the criteria aredropped one by one, in successive iterations, until a category is found within which the vessel can beplaced. In the first iteration, unobserved hauls are compared to a category made up of (a) the vesselitself, (b) the same weekly fishing period, (c) the same Federal statistical reporting area, and (d) the samegear type. In the second iteration, the criterion that the unobserved hauls must be from the same vessel asthe observed vessel is dropped, and the vessel is compared to other vessels from the same period,reporting area, and gear type. In subsequent iterations other restrictions are dropped, the criteria are mademore and more general, and the “neighborhood” becomes larger and larger.
Catcher vessel gross revenues are estimated using price estimates prepared by the Alaska CommercialFisheries Entry Commission in an ongoing process unrelated to this analysis. These annual priceestimates are based on data collected from the Alaska Commercial Operator’s Annual Reports (COAR)and from fish ticket information.
Catcher-processor and wholesale prices are first wholesale prices prepared at this Alaska FisheriesScience Center for this analysis. The first wholesale prices are estimated by dividing total first wholesalegross revenues for a species by the delivered round weight of that species. These prices are broken out bygear type for catcher-processors, but the available data does not make it possible to break them out bygear type for catcher-vessels. March prices for pollock and Pacific cod are calculated for the first half ofthe year, reflecting the roe content of the fish at that time. March prices for other groundfish species areannual prices. Annual prices were used because the lower volume of products for these other speciesmade it difficult to calculate seasonal prices. First wholesale prices could not be estimated for somespecies and gear types. This only affected catcher-processors, and did not affect Pacific cod landings. Thus this affects a relatively small part of the fish production from Area 655430.

50
6.0 INITIAL REGULATORY FLEXIBILITY ANALYSIS
6.1 Introduction
This Initial Regulatory Flexibility Analysis (IRFA) examines the adverse impacts on small entities ofregulatory action to close about 130 square miles of waters north of Unimak Pass to fishing forgroundfish during the last two weeks of March in 2003, 2004, 2005, and 2006. These waters are adjacentto an area already closed to trawling for Pacific cod and pollock due to the proximity of a Steller sea lionhaulout at Cape Sarichef on the western end of Unimak Island in the Aleutians.
This closure is meant to increase the scientific value of an experiment to test the hypothesis that Pacificcod trawling causes localized depletion of Pacific cod stocks. The results of this experiment may haveimportant implications for regulations that currently restrict fishing activity in order to protect Steller sealion stocks.
6.2 The purpose of an IRFA
The Regulatory Flexibility Act (RFA), first enacted in 1980, was designed to place the burden on thegovernment to review all regulations to ensure that, while accomplishing their intended purposes, they donot unduly inhibit the ability of small entities to compete. The RFA recognizes that the size of a business,unit of government, or nonprofit organization frequently has a bearing on its ability to comply with aFederal regulation. Major goals of the RFA are: (1) to increase agency awareness and understanding ofthe impact of their regulations on small business, (2) to require that agencies communicate and explaintheir findings to the public, and (3) to encourage agencies to use flexibility and to provide regulatoryrelief to small entities. The RFA emphasizes predicting impacts on small entities as a group distinct fromother entities and on the consideration of alternatives that may minimize the impacts while still achievingthe stated objective of the action.
On March 29, 1996, President Clinton signed the Small Business Regulatory Enforcement Fairness Act. Among other things, the new law amended the RFA to allow judicial review of an agency’s compliancewith the RFA. The 1996 amendments also updated the requirements for a final regulatory flexibilityanalysis, including a description of the steps an agency must take to minimize the significant economicimpact on small entities. Finally, the 1996 amendments expanded the authority of the Chief Counsel forAdvocacy of the Small Business Administration (SBA) to file amicus briefs in court proceedingsinvolving an agency’s violation of the RFA.
In determining the scope, or ‘universe’, of the entities to be considered in an IRFA, NMFS generallyincludes only those entities that can reasonably be expected to be directly regulated by the proposedaction. If the effects of the rule fall primarily on a distinct segment, or portion thereof, of the industry(e.g., user group, gear type, geographic area), that segment would be considered the universe for thepurpose of this analysis. NMFS interprets the intent of the RFA to address negative economic impacts,not beneficial impacts, and thus such a focus exists in analyses that are designed to address RFAcompliance.

51
Data on cost structure, affiliation, and operational procedures and strategies in the fishing sectors subjectto the proposed regulatory action are insufficient, at present, to permit preparation of a “factual basis”upon which to certify that the preferred alternative does not have the potential to result in “significant adverse impacts on a substantial number of small entities” (as those terms are defined under RFA). Because, based on all available information, it is not possible to ‘certify’ this outcome, should theproposed action be adopted, a formal IRFA has been prepared and is included in this package forSecretarial review.
6.3 What is required in an IRFA?
Under 5 U.S.C., Section 603(b) of the RFA, each IRFA is required to contain:
• A description of the reasons why action by the agency is being considered;• A succinct statement of the objectives of, and the legal basis for, the proposed rule;• A description of and, where feasible, an estimate of the number of small entities to which the
proposed rule will apply (including a profile of the industry divided into industry segments, ifappropriate);
• A description of the projected reporting, record keeping and other compliance requirements of theproposed rule, including an estimate of the classes of small entities that will be subject to therequirement and the type of professional skills necessary for preparation of the report or record;
• An identification, to the extent practicable, of all relevant Federal rules that may duplicate, overlapor conflict with the proposed rule;
• A description of any significant alternatives to the proposed rule that accomplish the statedobjectives of the proposed action, consistent with applicable statutes, and that would minimize anysignificant adverse economic impact of the proposed rule on small entities. Consistent with thestated objectives of applicable statutes, the analysis shall discuss significant alternatives, such as:
1. The establishment of differing compliance or reporting requirements or timetables thattake into account the resources available to small entities;
2. The clarification, consolidation, or simplification of compliance and reportingrequirements under the rule for such small entities;
3. The use of performance rather than design standards;
4. An exemption from coverage of the rule, or any part thereof, for such small entities.
6.4 What is a small entity?
The RFA recognizes and defines three kinds of small entities: (1) small businesses, (2) small non-profitorganizations, and (3) and small government jurisdictions.
Small businesses. Section 601(3) of the RFA defines a ‘small business’ as having the same meaning as‘small business concern’ which is defined under Section 3 of the Small Business Act. ‘Small business’ or‘small business concern’ includes any firm that is independently owned and operated and not dominant inits field of operation. The SBA has further defined a “small business concern” as one “organized for
52
profit, with a place of business located in the United States, and which operates primarily within theUnited States or which makes a significant contribution to the U.S. economy through payment of taxes oruse of American products, materials or labor...A small business concern may be in the legal form of anindividual proprietorship, partnership, limited liability company, corporation, joint venture, association,trust or cooperative, except that where the firm is a joint venture there can be no more than 49 percentparticipation by foreign business entities in the joint venture.”
The SBA has established size criteria for all major industry sectors in the US including fish harvestingand fish processing businesses. A business involved in fish harvesting is a small business if it isindependently owned and operated and not dominant in its field of operation (including its affiliates) andif it has combined annual receipts not in excess of $3.5 million for all its affiliated operations worldwide. A seafood processor is a small business if it is independently owned and operated, not dominant in itsfield of operation, and employs 500 or fewer persons on a full-time, part-time, temporary, or other basis,at all its affiliated operations worldwide. A business involved in both the harvesting and processing ofseafood products is a small business if it meets the $3.5 million criterion for fish harvesting operations. Finally a wholesale business servicing the fishing industry is a small business if it employs 100 or fewerpersons on a full-time, part-time, temporary, or other basis, at all its affiliated operations worldwide.
The SBA has established “principles of affiliation” to determine whether a business concern is“independently owned and operated.” In general, business concerns are affiliates of each other when oneconcern controls or has the power to control the other, or a third party controls or has the power to controlboth. The SBA considers factors such as ownership, management, previous relationships with or ties toanother concern, and contractual relationships, in determining whether affiliation exists. Individuals orfirms that have identical or substantially identical business or economic interests, such as familymembers, persons with common investments, or firms that are economically dependent throughcontractual or other relationships, are treated as one party with such interests aggregated when measuringthe size of the concern in question. The SBA counts the receipts or employees of the concern whose sizeis at issue and those of all its domestic and foreign affiliates, regardless of whether the affiliates areorganized for profit, in determining the concern’s size. However, business concerns owned andcontrolled by Indian Tribes, Alaska Regional or Village Corporations organized pursuant to the AlaskaNative Claims Settlement Act (43 U.S.C. 1601), Native Hawaiian Organizations, or CommunityDevelopment Corporations authorized by 42 U.S.C. 9805 are not considered affiliates of such entities, orwith other concerns owned by these entities solely because of their common ownership.
Affiliation may be based on stock ownership when (1) A person is an affiliate of a concern if the personowns or controls, or has the power to control 50 percent or more of its voting stock, or a block of stockwhich affords control because it is large compared to other outstanding blocks of stock, or (2) If two ormore persons each owns, controls or has the power to control less than 50 percent of the voting stock of aconcern, with minority holdings that are equal or approximately equal in size, but the aggregate of theseminority holdings is large as compared with any other stock holding, each such person is presumed to bean affiliate of the concern.
Affiliation may be based on common management or joint venture arrangements. Affiliation arises whereone or more officers, directors or general partners controls the board of directors and/or the managementof another concern. Parties to a joint venture also may be affiliates. A contractor or subcontractor istreated as a participant in a joint venture if the ostensible subcontractor will perform primary and vitalrequirements of a contract or if the prime contractor is unusually reliant upon the ostensiblesubcontractor. All requirements of the contract are considered in reviewing such relationship, includingcontract management, technical responsibilities, and the percentage of subcontracted work.

53
Small organizations. The RFA defines “small organizations” as any not-for-profit enterprise that isindependently owned and operated and is not dominant in its field.
Small governmental jurisdictions. The RFA defines small governmental jurisdictions as governments ofcities, counties, towns, townships, villages, school districts, or special districts with populations of lessthan 50,000.
6.5 What is this action?
The Council has not yet identified a preferred alternative. The three alternatives under consideration aredescribed in detail in Sections 1.2 and 5.5 of this EA/RIR/IRFA.
All three alternatives would affect a 130 square mile experimental treatment area adjacent to the CapeSarichef Pacific cod and pollock no-trawl zone for different classes of fishing operations in the last twoweeks of March in the years 2003 to 2006. The closure area is shown in the map in Figure 5.5-1. Thealternatives include: (1) the status quo and no action alternative (no closure of the treatment area), (2)closure of the treatment area to all trawl gear, and (3) closure of the treatment area to fishing with trawlgear and with longline and pot gear.
6.6 Reason for considering the proposed action
The reasons for considering this action are described in detail in Sections 1.1 and 5.4 of thisEA/RIR/IRFA. The western distinct population segment (DPS) of the Steller sea lions has declinedprecipitously over the last 20 years. Consequently, the western DPS has been listed as endangered underthe Endangered Species Act. Many believe that one cause of the decline may be localized depletion ofSteller sea lion groundfish prey by commercial fishing operations. To limit the potential for this localizeddepletion, fishing regulations that became effective in 2002 incorporate restrictions on fishing near Stellersea lion critical habitat. These restrictions are expensive to industry. Moreover, many feel that therestrictions already imposed are not strict enough. While the localized depletion hypothesis is logicallypossible, there is little actual empirical evidence to support or refute it, or to relate actual levels oflocalized depletion to impacts on Steller sea lion populations. NMFS’s Alaska Fisheries Science Center(AFSC) has obtained funding to do an experiment with pot gear to test the localized depletion hypothesisin waters off of Cape Sarichef. However, ongoing trawling operations in some of these waters maydestroy pots, interfering with the experiment, and reducing the ability of the experiment to discriminatebetween hypotheses (reducing the “power” of the statistical tests). This would reduce the value of theexperimental results for helping design a regulatory system that protects sea lions and avoids an undueburden on industry. The proposed action would reduce these conflicts and increase the power of theexperiment’s statistical tests.
6.7 Objectives of, and legal basis for, the proposed action
The objective of the proposed action is to reduce the loss of pots in this experiment, and to increase thestatistical power and usefulness of the experimental results as a test of the localized depletion hypothesis.
The National Marine Fisheries Service manages the U.S. groundfish fisheries of the Bering Sea andAleutian Islands management area in the Exclusive Economic Zone under the Fishery Management Plan
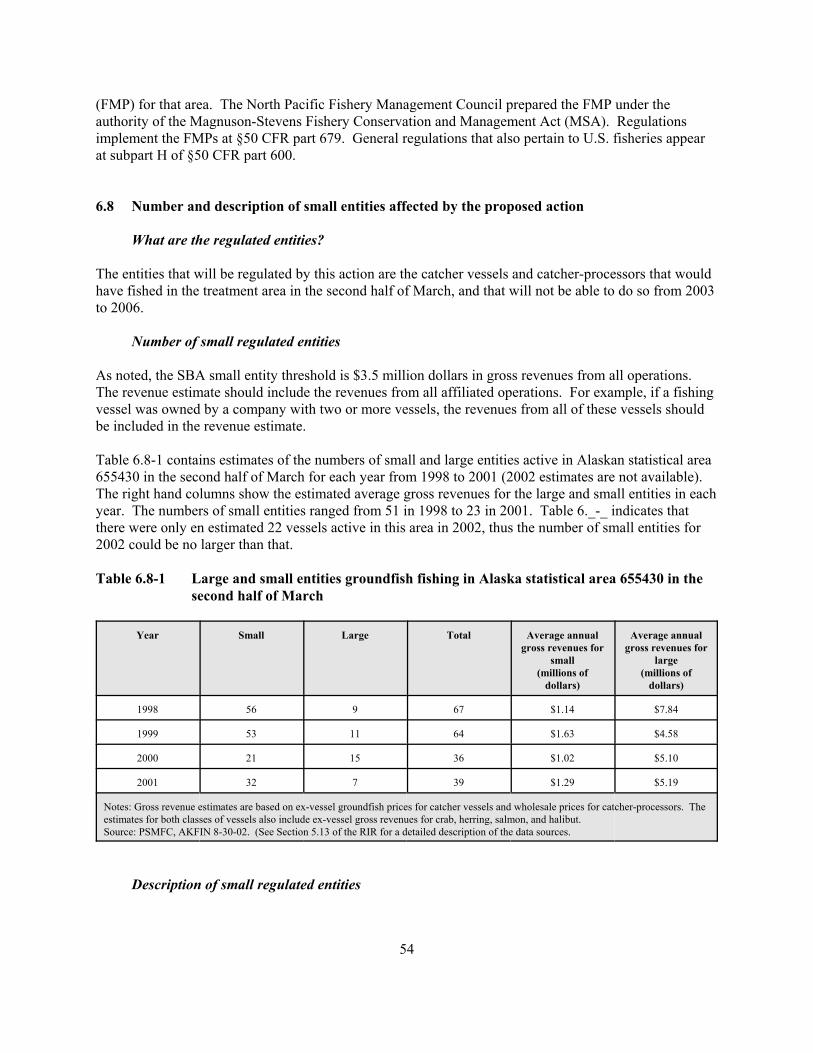
54
(FMP) for that area. The North Pacific Fishery Management Council prepared the FMP under theauthority of the Magnuson-Stevens Fishery Conservation and Management Act (MSA). Regulationsimplement the FMPs at §50 CFR part 679. General regulations that also pertain to U.S. fisheries appearat subpart H of §50 CFR part 600.
6.8 Number and description of small entities affected by the proposed action
What are the regulated entities?
The entities that will be regulated by this action are the catcher vessels and catcher-processors that wouldhave fished in the treatment area in the second half of March, and that will not be able to do so from 2003to 2006.
Number of small regulated entities
As noted, the SBA small entity threshold is $3.5 million dollars in gross revenues from all operations. The revenue estimate should include the revenues from all affiliated operations. For example, if a fishingvessel was owned by a company with two or more vessels, the revenues from all of these vessels shouldbe included in the revenue estimate.
Table 6.8-1 contains estimates of the numbers of small and large entities active in Alaskan statistical area655430 in the second half of March for each year from 1998 to 2001 (2002 estimates are not available). The right hand columns show the estimated average gross revenues for the large and small entities in eachyear. The numbers of small entities ranged from 51 in 1998 to 23 in 2001. Table 6._-_ indicates thatthere were only en estimated 22 vessels active in this area in 2002, thus the number of small entities for2002 could be no larger than that.
Table 6.8-1 Large and small entities groundfish fishing in Alaska statistical area 655430 in thesecond half of March
Year Small Large Total Average annualgross revenues for
small(millions of
dollars)
Average annualgross revenues for
large(millions of
dollars)
1998 56 9 67 $1.14 $7.84
1999 53 11 64 $1.63 $4.58
2000 21 15 36 $1.02 $5.10
2001 32 7 39 $1.29 $5.19
Notes: Gross revenue estimates are based on ex-vessel groundfish prices for catcher vessels and wholesale prices for catcher-processors. Theestimates for both classes of vessels also include ex-vessel gross revenues for crab, herring, salmon, and halibut.Source: PSMFC, AKFIN 8-30-02. (See Section 5.13 of the RIR for a detailed description of the data sources.
Description of small regulated entities
55
As noted above, there were between 21 and 56 small entities active in the area per year from 1998-2001. As noted in Table 6.8-1, the annual average annual gross revenues for the small operations rangedbetween about $1.02 and $1.63 millions in these years. These vessels obtained most of their revenuesfrom groundfish, a relatively small amount from crab, and even less from herring, salmon or halibut. Theaverage gross revenues for these small entities in Area 655430 during the last two weeks in March, wereabut $10,000 in 1998, $18,000 in 1999, $19,000 in 2000, and $17,000 in 2001. (PSMFC, AKFIN 8-30-02).
As noted in Section 5.6, medium sized (60-125 foot) bottom trawlers targeting Pacific cod and deliveringthem to shoreside processors were the most important element in the fleet fishing for groundfish in Alaskastatistical area 655430 during the second half of March from 1998 to 2001. The relative size of this fleetdecreased, however, during this period. Vessels of this description harvested 78% of the groundfish fromthe statistical area in 1998, but their share declined to 31% in 2001. As shown in Table 2.3-1 this declineis paralleled by an overall decline in harvests from this area over the period. It was, in fact, the decline inthe harvests by this class of vessel which accounted for most of the decline in overall harvest from thearea. (NMFS Alaska Region Catch by Vessel data set)
The smaller numbers of vessels in 2000 and 2001, and potential confidentiality issues, make it difficult tocharacterize the changes in the fleet. However, as harvests by the vessels described above declined,harvests by vessels with other characteristics became relatively more important. Catcher-processorsbecame more important in 2000 and 2001. Pot gear, in particular became important in 2001, alsoaccounting for a third of the harvest. Harvests from vessels targeting Pacific cod declined somewhat, butremained high. (NMFS Alaska Region Catch by Vessel data set).
6.9 Impacts on regulated small entities
Impact on cash flow or profitability
The proposed regulation will prevent trawling (or trawling and longline and pot fishing depending on thealternative chosen) in the treatment area for two weeks in the second half of March in 2003, 2004, 2005,and 2006. The expectation is, that fishing vessels that would otherwise have fished in the treatment areaduring that period, will alter their fishing patterns so as to fish elsewhere. Many may fish in waters to thenortheast of the treatment area, or to the north of it on the north side of the “horseshoe.” These alternativewaters are further from the delivery ports and support services available at Akutan, Unalaska, and KingCove.
If left unrestricted, the fishermen will operate to their best advantage. The closure proposed in thetreatment area will force them to operate in a less optimal manner, either increasing their costs due toincreased travel time, lower catch per unit of effort, or some other factor, or decreasing their revenues ifthey are unable to catch elsewhere what they would have caught in the treatment area. This would beassociated with some increased costs. Thus, the operations involved are likely to experience an adverseimpact.
The adverse impacts of the proposed action on these operations will be small. The average grossrevenues from this statistical area are obviously small compared to overall small entity average grossrevenues over the course of the year. They are also relatively small compared to their total revenues fromfishing activity in the last two weeks of March. In 1998, these small entities made about 26% of their
56
revenues from the second half of March in statistical area 655430, in 1999 they made about 32%, in 2000they made about 20%, and in 2001 they made about 16%. (PSMFC, AKFIN 8-30-02) It appears likelythat these vessels will be able to alter their operations to continue their fishing activity elsewhere in thesecond half of March, therefore actual revenue loss should be much less than the average revenue fromthe area. Thus the average gross revenues overstate the total adverse impact of the rule on the smallentities.
6.10 Recordkeeping and reporting requirements
The IRFA should include “a description of the projected reporting, record keeping and other compliancerequirements of the proposed rule, including an estimate of the classes of small entities that will besubject to the requirement and the type of professional skills necessary for preparation of the report orrecord...”
This regulation does not impose new recordkeeping or reporting requirements on the regulated smallentities.
6.11 Federal rules that may duplicate, overlap, or conflict with proposed action
An IRFA should include “An identification, to the extent practicable, of all relevant Federal rules thatmay duplicate, overlap or conflict with the proposed rule...”
This analysis did not reveal any Federal rules that duplicate, overlap or conflict with the proposed action.
6.12 Description of significant alternatives
An IRFA should include “A description of any significant alternatives to the proposed rule thataccomplish the stated objectives of the Magnuson-Stevens Act and any other applicable statutes and thatwould minimize any significant economic impact of the proposed rule on small entities.” At this point intime (August 2002) the Council has not selected a preferred alternative for this action. The fouralternatives considered in this RIR/IRFA are summarized in Table 6.12-1.

57
Table 6.12-1 Alternatives subjected to detailed study
Alternative Description Impact on directly regulated small entities Why not chosen if better for directly regulated smallentities?
Alt 1 Status quo: no closureof treatment area
No impact on regulated small entities. No preferred alternative at this time.
Alt 2 Treatment area closedto all trawling
Small trawl entities may not fish in the treatment areafrom March 15 to March 31. They are likely to be ableto make up lost revenues by fishing elsewhere duringthis period, but only at increased cost. If they continueto fish in areas near the treatment area, they will beoperating further from port facilities at Akutan,Unalaska, and King Cove. There would be no adverseimpacts on longline or pot fishermen.
No preferred alternative at this time
Alt 3 Treatment area closedto trawling,longlining, and potfishing for groundfish
Small trawl entities, longliners and pot fishermen maynot fish in the treatment area from March 15 to March31. The impacts on trawl operations would be the sameunder Alts 2 and 3. Small numbers of longliners and potfishing operations would also face the same adverseimpacts.
No preferred alternative at this time
Notes: A more detailed discussion of the impacts on small entities may be found in Section 6.9 of this EA/RIR/IRFA.

58
7.0 LIST OF PREPARERS
M. Elizabeth Conners, Peter Munro, Anne Hollowed.Alaska Fisheries Science CenterNational Marine Fisheries Service7600 Sand Point Way NE, BIN C15700Seattle, WA 98115-0070
Ben Muse National Marine Fisheries ServiceAlaska RegionP. O. Box 21668Juneau, AK 99802
8.0 LIST OF PEOPLE CONSULTED
Douglas Demaster, Richard MarascoAlaska Fisheries Science CenterNational Marine Fisheries Service7600 Sand Point Way NE, BIN C15700Seattle, WA 98115-0070
David Rugh, Brian FadleyNational Marine Mammal LaboratoryNational Marine Fisheries Service7600 Sand Point Way NE, BIN C15700Seattle, WA 98115-0070
Tamra Faris NEPA CoordinatorNational Marine Fisheries ServiceAlaska Regional OfficeP.O. Box 21668Juneau, AK 99802
Sue Salveson, David Ackley Sustainable Fisheries DivisionNational Marine Fisheries ServiceAlaska Regional OfficeP.O. Box 21668Juneau, AK 99802
Steve LewisOperations, Management and Information DivisionNational Marine Fisheries ServiceAlaska Regional OfficeP.O. Box 21668
59
Juneau, Alaska 99802
Shane CapronProtected Resources DivisionNational Marine Fisheries ServiceAlaska Regional OfficeP.O. Box 21668Juneau, AK 99802
Peggy Murphy, Camille McCrackenAlaska Fisheries Information NetworkPacific States Marine Fisheries Commission612 W Willoughby Ave. Suite BJuneau, AK 99801
Brent PaineUnited Catcher Boats4005 20th Ave. W., Suite 110Seattle, WA 98199
60
8.0 LITERATURE CITED
Angliss, R.P, D.P. DeMaster, and A.L. Lopez. 2001. Alaska marine mammal stock assessments 2001.U.S. Dept. Commerce NOAA Technical Memorandum NMFS-AFSC-124, 203 p.
Hiatt, Terry, Ron Felthoven and Joe Terry. (2001) “Stock Assessment and Fishery Evaluation Report forthe Groundfish Fisheries of the Gulf of Alaska and Bering Sea/Aleutian Island Area: EconomicStatus of the Groundfish Fisheries off Alaska, 2000.” Socioeconomic Assessments Program. Resource Ecology and Fisheries Management Division, Alaska Fisheries Science Center, NMFS. Seattle: November, 2001.
National Marine Fisheries Service (NMFS.) 2001a. Alaska Groundfish Fisheries Draft ProgrammaticSupplemental Environmental Impact Statement. DOC, NOAA, National Marine Fisheries Service,P.O. Box 21668, Juneau, Alaska 99802.
NMFS.2001b. Steller Sea Lion Protection Measures Final Supplemental Environmental ImpactStatement. November 2001. National Marine Fisheries Service, P.O. Box 21668, Juneau, Alaska99802.
NMFS 2001c. Environmental Assessment for the Interim and Final Total Allowable Catch Specificationsfor the Year 2002 Alaska Groundfish Fisheries, Dec. 2001. National Marine Fisheries Service,P.O. Box 21668, Juneau, Alaska 99802.
NMFS. 2001d. Memorandum from the Assistant Regional Administrator for the Office of HabitatConservation (Alaska Region) to the Assistant Regional Administrator for the Office of SustainableFisheries (Alaska Region) Regard Essential Fish Habitat Consultation for year 2002 TACspecifications. December 14, 2001. NMFS Alaska Region, P.O. Box 21668, Juneau, Alaska99802.
NMFS. 2001e. Memorandum from the Assistant Regional Administrator for the Office of ProtectedResources (Alaska Region) to the Assistant Regional Administrator for the Office of SustainableFisheries (Alaska Region) Regarding Endangered Species Act Section 7 Consultation forauthorization of the 2002 Groundfish Fisheries as implemented by the annual harvest specificationsunder the Fishery Management Plans for the Bering Sea and Aleutian Islands and the Gulf ofAlaska. December 11, 2001. NMFS Alaska Region, P.O. Box 21668, Juneau, Alaska 99802.
NMFS. 2002. Final Environmental Impact Statement for American Fisheries Act Amendments61/61/13/8. February 2002. DOC, NOAA, National Marine Fisheries Service, AK Region, P.O.Box 21668, Juneau, AK 99802-1668.
NPFMC. 2001a. Stock assessment and fishery evaluation report for groundfish resources of the BeringSea/ Aleutian Islands Region. North Pacific Fishery Management Council, P.O Box 103136,Anchorage, AK 99510
NPFMC. 2001b. Economic status of groundfish resources off Alaska. In Stock assessment and fisheryevaluation report for groundfish resources of the Bering Sea/ Aleutian Islands Region. NorthPacific Fishery Management Council, P.O Box 103136, Anchorage, AK 99510.
NPFMC. 2001c. Ecosystem considerations. In Stock assessment and fishery evaluation report forgroundfish resources of the Bering Sea/ Aleutian Islands Region. North Pacific FisheryManagement Council, P.O Box 103136, Anchorage, AK 99510.
National Research Council. 1996. The Bering Sea Ecosystem. (National Academy Press, Washington,DC) 307 p.
Sullivan, P. J., and Parma, A. M. 1998. Population assessments, 1997. In: International Pacific HalibutCommission Report of Assessment and Research Activities, 1997 International Pacific HalibutCommission, P.O. Box 95009, Seattle, WA 98145. pp. 81-107.
USFWS. 1999. Endangered Species Act Formal Section 7 Consultation for 1999-2000 Hook-and-LineGroundfish Fisheries of the Gulf of Alaska and Bering Sea and Aleutian Islands Area (Short-tailed

61
Albatross.) Issued March 19, 1999. U.S. Department of the Interior, Fish and Wildlife Service,1011 E. Tudor Road, Anchorage, Alaska 99503-6199. 36pp + Tables and Figures.
Wilson, Chris, Anne Hollowed, Michiyo Shima, Paul Walline, and Sarah Stienessen. “InteractionsBetween Commercial Fishing and Walleye Pollock.” Alaska Fisheries Science Center QuarterlyReport. January-February-March 2002.
Appen. A-1
APPENDIX A
STUDY TO ASSESS THE EFFECT OF COMMERCIAL TRAWLING ON LOCALABUNDANCE OF PACIFIC COD (Gadus Macrocephalus)
Principal Investigators:M. Elizabeth Conners
Peter MunroREFM Fisheries Interaction TeamAlaska Fisheries Science Center
National Marine Fisheries Service7600 Sand Point Way NESeattle, WA 98115-6349
Prepared By: M. Elizabeth ConnersLatest Revision: September 9, 2002

APPENDIX A: COD POT LOCAL ABUNDANCE STUDY Rev:10/9/02
Appen. A-2
A1. Overview of the Study
Management strategies for fisheries in the Bering Sea and in the Gulf of Alaska have beenseverely altered in recent years in response to the listing of the Steller sea lion as endangered under theEndangered Species Act. The Fisheries Interaction Team (FIT) of the AFSC has been charged withinvestigating the effectiveness of these changes in fishery management. Currently the informationavailable to evaluate alternative methods for protecting Steller sea lions and their habitat is very limited. The FIT has proposed a field experiment to improve the information available to assess furthermanagement actions to protect Steller sea lions. This study is an integral part of a NMFS comprehensiveresearch program designed to evaluate effects of fishing on the foraging behavior of Steller sea lions.
The goal of the experiment is to evaluate the effects of commercial trawl fishing on the local abundanceof Pacific cod (Gadus macrocephalus), which aggregate over spawning grounds in the Aleutian Islandsand southeastern Bering Sea during winter months. Cod have been found to be a frequent prey item inwinter scat samples from Steller sea lions in the eastern Aleutians (Sinclair and Zeppelin 2002). Thesame dense aggregations of cod which attract commercial fishing may provide an important seasonal foodresource for sea lions. Localized depletion of Pacific cod has been implicated as a possible mechanismfor adverse effects of the commercial fishery on availability of prey for Steller sea lions. Thisexperiment is designed to look at effects of the intensive winter trawl fishery on local abundance ofPacific cod in the vicinity of Unimak Pass in the eastern Bering Sea (Figure A1-1). A successfulexperiment will provide data for a quantitative statistical test of the presence or absence of a localizeddepletion effect from this fishery, which will help to define appropriate management action. Thelocalized depletion study also provides a platform for sample collection and observation of spawning codthat is not available from regular summer surveys. A cod tagging program focused on winter spawningaggregations is also being conducted to collect information on both small-scale movements and long-range seasonal migrations. Data from tagging studies will be useful to help formulate a model of codbehavior and distribution. Such a model may be able to provide specific hypotheses and predictions ofeffects of various management alternatives.
The study will use standardized pot-fishing gear to collect an index of local cod abundance. Pot gear iswell-proven for Pacific cod, and can be fished at fine spatial resolution. Most importantly, pot catch datahas statistical properties that make it much more amenable to statistical testing than trawl samples. Thelarge number of pots that can be worked within a sea day allows a larger sample size than would befeasible with a trawl study, which increases statistical precision. Feasibility studies have also shown thatpot catches of cod have a much lower variance than trawl data, which also increases the power of astatistical test.
The research proposal recognizes that many uncontrolled factors play a role in determining local codabundance, including habitat variation, seasonal and short-term fish movement, and effects of climate,circulation, and weather events. The study is designed as a comparison between sites within the areasubject to intensive seasonal trawling (the “treatment”) and “control” sites within a nearby zone wheretrawling is prohibited. Each site is to be surveyed before and immediately after the main trawling season. While there are many factors that may contribute to a change in local abundance between the two surveys,these factors are expected to have similar effects on trawled and control areas. Thus, the experiment isdesigned to look at the rate of change in local abundance between the “before” and “after” surveys, andtest whether this rate of change is the same in trawled and untrawled areas.

APPENDIX A: COD POT LOCAL ABUNDANCE STUDY Rev:10/9/02
Appen. A-3
Figure A1-1. General location of Unimak Pass study area, and NMFS statistical reporting areasin the southeast Bering Sea.
APPENDIX A: COD POT LOCAL ABUNDANCE STUDY Rev:10/9/02
Appen. A-4
Current regulations prohibit directed trawling for walleye pollock or Pacific cod within 10 nautical miles(nm) of specified Steller sea lion rookery and haulout sites, including haulouts at Billings Head on AkunIsland and at Cape Sarichef on Unimak Island. These trawl exclusion zones bracket the northeastern andnorthwestern sides, respectively, of Unimak Pass. The Cape Sarichef zone, in particular, intersects thearea that has historically been the main site of the winter cod trawl fishery. The study areas selected forthe local abundance experiment include the outer portion of the Cape Sarichef no-trawl zone and the opentrawling grounds just outside this boundary.
Gear trials and preliminary feasibility studies with research pot fishing were conducted off Kodiak Islandin June 2001 and in Unimak Pass in March-April 2002. Final gear trials are scheduled for September-October 2002 and the full experiment for winter 2003. Repetition of the experiment in future years isanticipated, contingent on funding and the results obtained in 2003.
A regulatory amendment is being requested in fall 2002 to create a short-term closure in the vicinity ofthe cod pot study. This closure is being requested due to the incompatible nature of trawling and fixed-gear fisheries. In order to conduct the “after” survey in the trawled zone, NMFS will need to set and haulexperimental pots at the trawled sites without having research gear picked up or disturbed by trawls. NMFS’s concern is not only the expense of lost gear, but the potential damage to the experimental designdue to lost survey data. The proposed regulatory amendment would prohibit trawl fishing in theexperimental area only during the “after” portion of the experiment, which will be scheduled for March15 and 31 of each year (2003 through 2006). The requested prohibition affects only a portion of thetraditional cod trawling ground, and is limited to the two-week period needed for the experiment. A fullEA/RIR/IRFA for the proposed closure has been prepared.
A2. Preliminary Studies and Need for Experiment
Section 7(a) of the Endangered Species Act requires that any Federal Agency action .....” is not likely tojeopardize the continued existence of any listed species or result in the destruction or adversemodification of critical habitat.” As the action agency for management of groundfish fisheries in theBSAI and GOA, NMFS has responsibility for ensuring that fishery regulations in these regions complywith the ESA. This study is part of an NMFS research effort to examine possible effects of the Pacificcod fishery on this species.
Sea lion diet analysis (Sinclair and Zeppelin 2002) shows that Pacific cod are a frequent component of sealion diets during the winter months. A preliminary discussion paper on the potential for interactionsbetween the BSAI and GOA cod fisheries and Steller sea lions was prepared by the Protected ResourcesDivision of NMFS and discussed at the June 2000 Council meeting. This paper concluded that spatialand temporal overlap exists between commercial cod fisheries and use of cod by Steller sea lions duringthe winter months, and that a substantial fraction of the pre-2000 commercial catch was taken within SSLcritical habitat. The spatial and temporal intensity of the cod fishery, especially the trawl fishery, wasnoted and a possibility of localized depletion of pacific cod in critical habitat was raised. The August2000 injunction closing SSL critical habitat to trawl fishing included trawling for Pacific cod. TheNovember 2000 Biological Opinion (NMFS 2000, page 233 & 260) identified three major groundfishfisheries as having the greatest potential for effecting the endangered western stock of Steller se lions:

APPENDIX A: COD POT LOCAL ABUNDANCE STUDY Rev:10/9/02
Appen. A-5
walleye pollock, Atka mackerel, and Pacific cod. The Biological opinion cited temporal concentration offishing effort for walleye pollock, Pacific cod, and Atka mackerel as resulting in high local harvest rates,which may reduce the quality of the habitat for Steller sea lions on a seasonal time scale. This possibilityof “localized depletion” effects from the trawl fishery was the basis for recommendations regardingseasonal and regional apportionment of TAC for these three species, and seasonal no-trawl zones aroundSSL rookeries and haulouts.
A statistical evaluation of NMFS observer data examined CPUE of commercial cod trawls within the SeaLion Conservation Area of the southeast Bering Sea (M. Smith, NMFS unpublished internal document,August 2000). This analysis concluded that CPUE showed statistically significant declines over time inthis region, consistent with localized depletion of Pacific cod. The analysis was, however, unable todistinguish between localized depletion and seasonal dispersion of cod from high-density spawningassemblages to a lower-density spatial pattern. Previous tagging studies with Pacific cod (Shimada andKimura 1994) indicate that these fish undergo a substantial seasonal migration, aggregating near the edgeof the southeast Bering Sea shelf in winter to spawn. Little is presently known about the spawninglocations and behavior of Pacific cod, including the timing of seasonal migration, spawning aggregation,and dispersal. A workshop on Pacific cod spawning processes was held in Anchorage in March 2002;one of the principal conclusions of this workshop was that a much better understanding is needed of codspawning habitat, spawning behavior, size and age at maturity, and fecundity.
Congressional appropriation of funding for Steller sea lion research specifically mentions testing of thelocalized depletion hypothesis as a research goal, and the AFSC Draft Framework for FY2001 Stellar SeaLion Research specifically requested : “Construct studies associated with commercial fishing thatcharacterize the prey field before, during, and after fishing”. The Fisheries Interaction Team at theAlaska Fisheries Science Center (AFSC) proposed a field experiment to examine effects of the winterPacific cod trawl fishery on local abundance of cod. This experiment was designed both as a general testof the localized depletion hypothesis and as a specific study of possible localized depletion of Pacific codwithin SSL critical habitat. The study is designed as a comparison between sites subject to intensiveseasonal trawling and nearby “control” sites where trawling is prohibited. The experiment is designed tolook at the rate of change in local abundance between the “before” and “after” surveys, and test whetherthis rate of change is the same in trawled and untrawled areas. The study will use pot catch of Pacific codas an index of local abundance. Coupled with the localized depletion experiment are a tagging study andsample collection to gather better information on cod spawning habitat, behaviors, seasonal movementrates, and maturity/fecundity.
This study has been funded through 2003 as an integral part of a NMFS comprehensive research programdesigned to evaluate effects of fishing on the foraging behavior of Steller sea lions. A study result thatclearly demonstrates localized changes in fish abundance due to commercial harvest will support thecurrent limitations on commercial catch of cod in SSL critical habitat areas. A negative result wouldsuggest that fishing at currently permitted levels does not cause substantial localized depletion. Thisproject will also provide initial feasibility work for scientific studies using pot gear, which could be usedto address questions of spatial variation for cod and other demersal species. NMFS has conducted initialfeasibility trials to develop design of the experiment and is ready to conduct the full localized depletionexperiment in winter 2002-2003. NMFS cod studies in the Unimak Pass area are being coordinated withphysical oceanographic studies by the Pacific Marine Environmental Laboratory, other NMFS fisheries interaction studies, and projects of the National Marine Mammal Laboratory.

APPENDIX A: COD POT LOCAL ABUNDANCE STUDY Rev:10/9/02
Appen. A-6
A3. Objectives of the Study
The study objectives fit broadly into three categories:
1) Test of the localized depletion hypothesis. One of the mechanisms suggested by which commercialfishing may adversely affect Steller sea lions is by localized depletion of sea lion prey. The overallharvest level for groundfish in the BSAI is regulated at a sustainable level by the FMP. What is notknown is whether intensive fishing within a small area can create a localized depletion of groundfish atspatial and temporal scales relevant to Stellar sea lions. The winter trawl fishery for Pacific cod in thesoutheastern Bering Sea is strongly localized over both space and time; a large percentage of the catch istaken in the area immediately north of Unimak Pass in February and March of each year. Localizeddepletion by this fishery has been suggested by preliminary analysis of commercial CPUE data. Theexperiment is designed to look for effects of the intensive winter trawl fishery near Unimak Pass on localabundance of Pacific cod. A successful experiment will provide data for a quantitative statistical test ofthe presence or absence of a localized depletion effect.
2) Biological information on cod spawning habitat, spawning behaviors, and seasonal movement. Arecent meeting of cod researchers identified several areas of basic biological information about codreproduction that are still unknown. The localized depletion study provides a platform for samplecollection and observation of spawning cod that is not available from regular summer surveys. Investigations already initiated in conjunction with the study include collection of length frequencies, sexratios, and maturity data from cod on spawning grounds; sample collection for proximate analysis andfecundity studies of cod at different ages and spawning stages. A winter tagging program has been set upto collect information on both small-scale movements of cod during spawning season and long-rangeseasonal migrations. These studies may also help to distinguish seasonal patterns of aggregation anddispersion among Pacific cod, which will help in the interpretation of local abundance and CPUE data.Another goal of the tagging study is to parameterize cod movements in models of Steller sea lionforaging. Expanded knowledge of seasonal movement, spawning habitat, and behaviors may alsoimprove future stock assessment modeling and management of BSAI Pacific cod.
3) Development of Experimental Pot-Fishing Gear. Current stock assessments rely primarily on datafrom trawl surveys, which allow an estimate of total biomass over a region or management unit. However, the high variability and small sample sizes associated with trawl gear limits its use forcomparative studies where statistical compariosns are desired. This experiment provides feasibilitytesting and development for experimental use of pot gear, which may be useful in future studies wherecomparison of abundance indices under different conditions or over small spatial and temporal scales isthe primary goal. Development of trigger timers and pot-mounted water-quality sensors for thisexperiment may also be useful for studies of diel and tidal movement and foraging of groundfish.
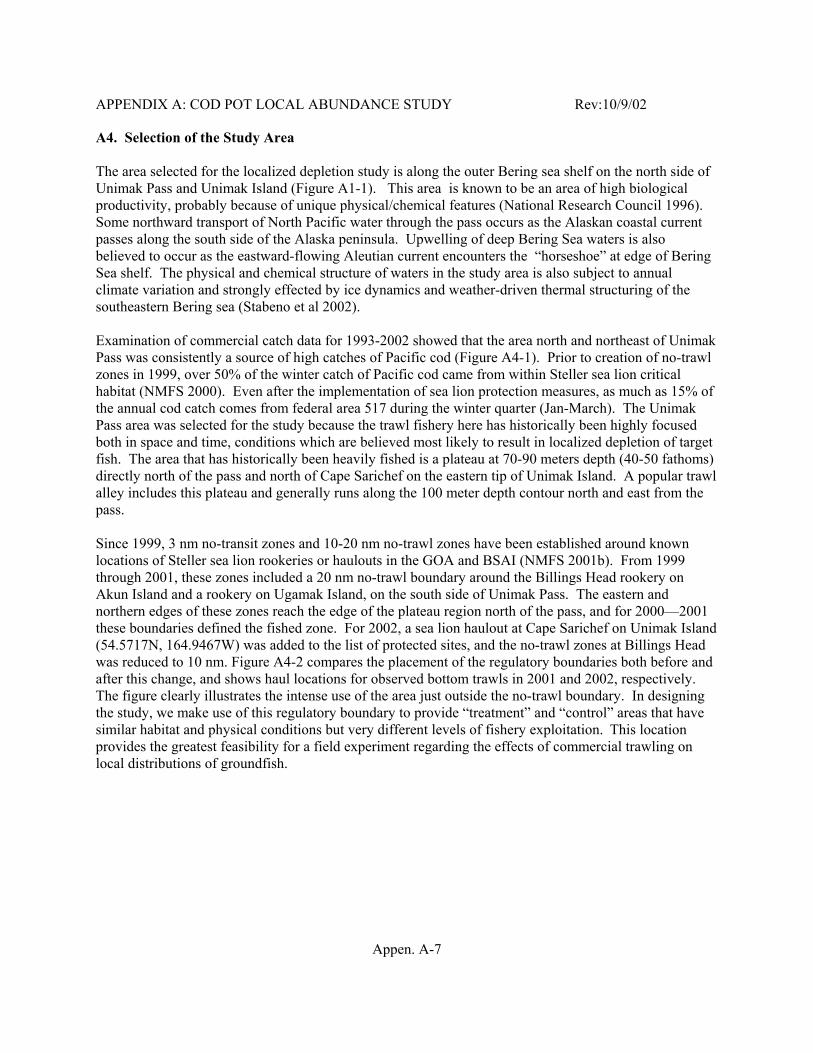
APPENDIX A: COD POT LOCAL ABUNDANCE STUDY Rev:10/9/02
Appen. A-7
A4. Selection of the Study Area
The area selected for the localized depletion study is along the outer Bering sea shelf on the north side ofUnimak Pass and Unimak Island (Figure A1-1). This area is known to be an area of high biologicalproductivity, probably because of unique physical/chemical features (National Research Council 1996). Some northward transport of North Pacific water through the pass occurs as the Alaskan coastal currentpasses along the south side of the Alaska peninsula. Upwelling of deep Bering Sea waters is alsobelieved to occur as the eastward-flowing Aleutian current encounters the “horseshoe” at edge of BeringSea shelf. The physical and chemical structure of waters in the study area is also subject to annualclimate variation and strongly effected by ice dynamics and weather-driven thermal structuring of thesoutheastern Bering sea (Stabeno et al 2002).
Examination of commercial catch data for 1993-2002 showed that the area north and northeast of UnimakPass was consistently a source of high catches of Pacific cod (Figure A4-1). Prior to creation of no-trawlzones in 1999, over 50% of the winter catch of Pacific cod came from within Steller sea lion criticalhabitat (NMFS 2000). Even after the implementation of sea lion protection measures, as much as 15% ofthe annual cod catch comes from federal area 517 during the winter quarter (Jan-March). The UnimakPass area was selected for the study because the trawl fishery here has historically been highly focusedboth in space and time, conditions which are believed most likely to result in localized depletion of targetfish. The area that has historically been heavily fished is a plateau at 70-90 meters depth (40-50 fathoms)directly north of the pass and north of Cape Sarichef on the eastern tip of Unimak Island. A popular trawlalley includes this plateau and generally runs along the 100 meter depth contour north and east from thepass.
Since 1999, 3 nm no-transit zones and 10-20 nm no-trawl zones have been established around knownlocations of Steller sea lion rookeries or haulouts in the GOA and BSAI (NMFS 2001b). From 1999through 2001, these zones included a 20 nm no-trawl boundary around the Billings Head rookery onAkun Island and a rookery on Ugamak Island, on the south side of Unimak Pass. The eastern andnorthern edges of these zones reach the edge of the plateau region north of the pass, and for 2000—2001these boundaries defined the fished zone. For 2002, a sea lion haulout at Cape Sarichef on Unimak Island(54.5717N, 164.9467W) was added to the list of protected sites, and the no-trawl zones at Billings Head was reduced to 10 nm. Figure A4-2 compares the placement of the regulatory boundaries both before andafter this change, and shows haul locations for observed bottom trawls in 2001 and 2002, respectively. The figure clearly illustrates the intense use of the area just outside the no-trawl boundary. In designingthe study, we make use of this regulatory boundary to provide “treatment” and “control” areas that havesimilar habitat and physical conditions but very different levels of fishery exploitation. This locationprovides the greatest feasibility for a field experiment regarding the effects of commercial trawling onlocal distributions of groundfish.
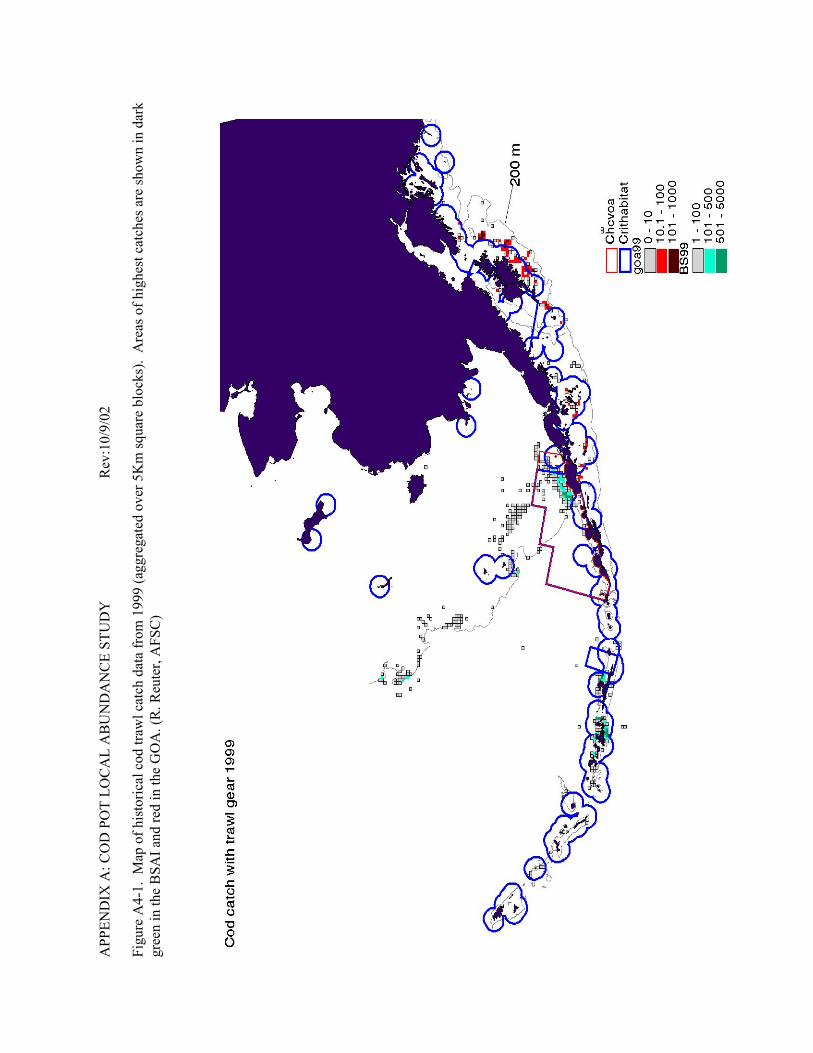
APP
END
IX A
: CO
D P
OT
LOC
AL
AB
UN
DA
NC
E ST
UD
YR
ev:1
0/9/
02
App
en. A
-8
Figu
re A
4-1.
Map
of h
isto
rical
cod
traw
l cat
ch d
ata
from
199
9 (a
ggre
gate
d ov
er 5
Km
squa
re b
lock
s).
Are
as o
f hig
hest
cat
ches
are
show
n in
dar
kgr
een
in th
e B
SAI a
nd re
d in
the
GO
A. (
R. R
eute
r, A
FSC
)
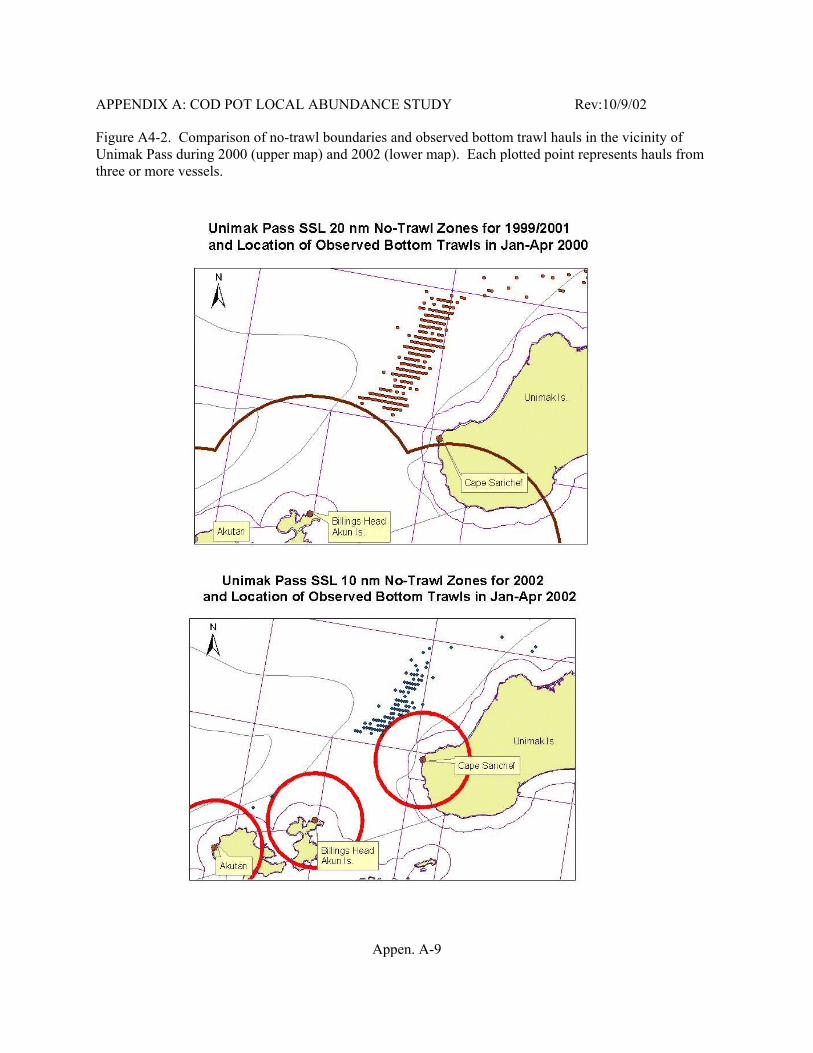
APPENDIX A: COD POT LOCAL ABUNDANCE STUDY Rev:10/9/02
Appen. A-9
Figure A4-2. Comparison of no-trawl boundaries and observed bottom trawl hauls in the vicinity ofUnimak Pass during 2000 (upper map) and 2002 (lower map). Each plotted point represents hauls fromthree or more vessels.

APPENDIX A: COD POT LOCAL ABUNDANCE STUDY Rev:10/9/02
Appen. A-10
A5. Results of Feasibility and Pilot Studies
Preliminary gear trials were conducted from 13 - 22 June 2002 out of Kodiak on the chartered F/V BigValley. This cruise was the first step in developing pots as a sampling gear for cod. The foci of thefeasibility study were methods for handling fishing gear in a research context, deployment and retrieval ofresearch instruments, data collection methods, maximizing the efficiencies of all operations, and datamanagement. As an important step to evaluating feasibility of the localized abundance experiment, thenumber of research pot lifts that could be conducted in a regular working day needed to be determined. Aless rigorous goal was to acquire hands-on experience with this gear as a research instrument.
The goals of the study were all met. Prototypes of event timers mounted on the entry triggers to the potwere tested extensively. After some experimentation, these devices were shown to work under fieldconditions and to successfully capture times when fish entered the pot. The catch timers can be deployed,retrieved, and downloaded without reducing the expected efficiency of a pot sampling operation. Thetiming of the various aspects of research fishing with pots indicated that as many as 60 pot lifts can beaccomplished in a single sea day, though 30 or 40 daily pot lifts is likely to be a more reasonable pace toexpect during an extended voyage under fair conditions. This preliminary study indicated that theexperimental pot gear works well for Pacific cod, and that field operations of the scope needed for thestudy are feasible.
A pilot pot fishing and tagging study was performed March 30-April 22, 2002, aboard the F/V FierceAlleigance. The principle goal of the pot-fishing pilot study was to fish pots according to researchprotocols and collect data on the level of variability in pot catch under these conditions. Estimates ofvariability and spatial dependence in pot catch are critical to final design and power estimation for thelocalized depletion experiment. This cruise was also used to test field feasibility and develop methodsfor cod tagging work using pots for fish collection. A total of 270 data-storage tags and 1,600 spaghettitags were released during this cruise. Mortality studies of Pacific cod held in on-deck storage tanks andship holding tanks were also conducted.
The pilot study fished more than 700 pot-sets over 3-6 hour soaks. Pots were baited with a standardcommercial bait of ground frozen herring. All fish and invertebrates captured in the pots were identifiedto species, with the number and total weight recorded by species for each pot. The catch of Pacific codwas consistently good, with most pots containing between 15 and 50 cod (Table A5-1 and Figure A5-1). Out of 555 pot sets with stadardized gear and soak times, only three had zero catches. The largest catchwas on April 4, of 103 cod. The distribution of catches was slightly right-skewed; 21 pots (3%)contained 70 or more cod. The overall average was 30.1 cod and 107.8 Kg cod per pot. Total catch forthe entire cruise was 20,261 cod at 72.7 mt (160,235 pounds). There was no consistent pattern of higheror lower catches for individual clusters of pots, but spatial analysis indicated that pots space closer than1/3nm influenced each other’s catch.
Catches of species other than Pacific cod were small. Yellow Irish Lord were commonly found in pots inboth sides of the pass. Yellowfin sole, walleye pollock, Atka mackerel, and assorted flatfish and rockfishspecies were occasionally caught. Tanner crabs (Bairdii) were fairly common at one of the study sites butwere absent at most sites. Giant Pacific octopus were caught in 13 pots and observed clinging onto theoutside of other pots as they were brought up. Miscellaneous bottom fauna (sponges, starfish, brittle stars,hair crabs, and scallops) were present in some pots. The consistency of catches in the pilot study suggeststhat good precision may be attained in the full experiment.
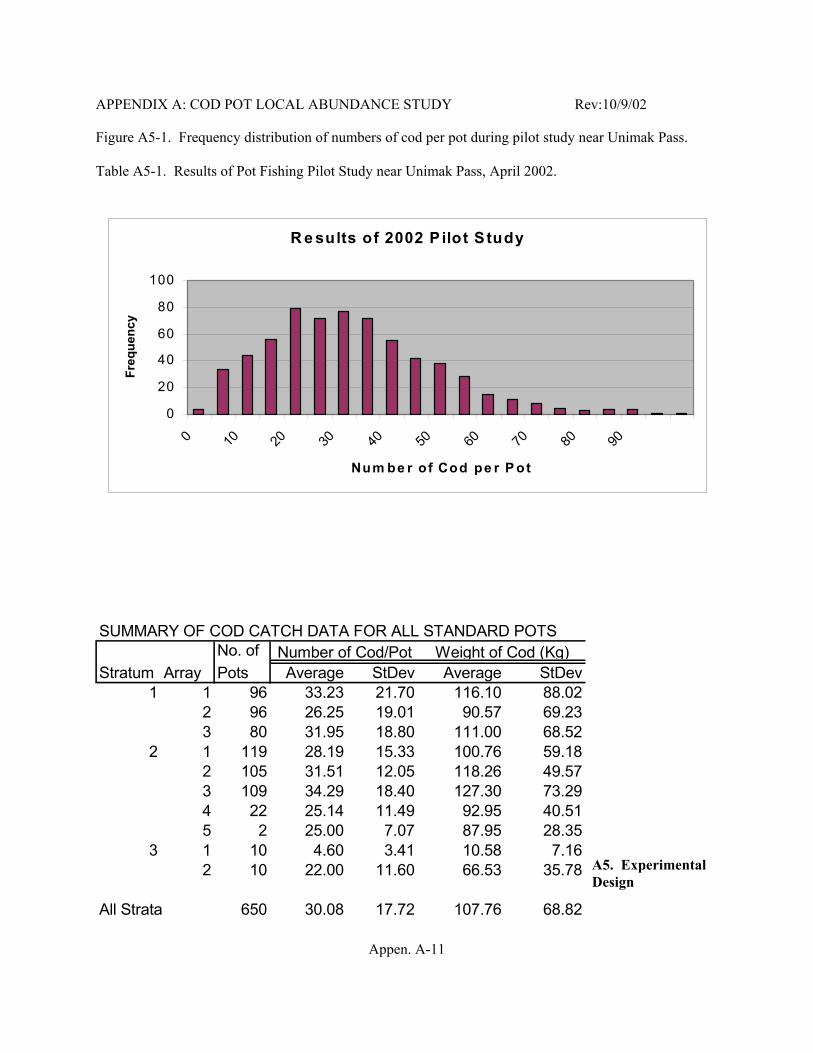
APPENDIX A: COD POT LOCAL ABUNDANCE STUDY Rev:10/9/02
Appen. A-11
R e sults of 2002 P ilot S tudy
0
20
40
60
80
100
0 10 20 30 40 50 60 70 80 90
Num be r of Cod pe r P ot
Freq
uenc
y
SUMMARY OF COD CATCH DATA FOR ALL STANDARD POTSNo. of
Stratum Array Pots Average StDev Average StDev1 1 96 33.23 21.70 116.10 88.02
2 96 26.25 19.01 90.57 69.233 80 31.95 18.80 111.00 68.52
2 1 119 28.19 15.33 100.76 59.182 105 31.51 12.05 118.26 49.573 109 34.29 18.40 127.30 73.294 22 25.14 11.49 92.95 40.515 2 25.00 7.07 87.95 28.35
3 1 10 4.60 3.41 10.58 7.162 10 22.00 11.60 66.53 35.78
All Strata 650 30.08 17.72 107.76 68.82
Number of Cod/Pot Weight of Cod (Kg)
Figure A5-1. Frequency distribution of numbers of cod per pot during pilot study near Unimak Pass.
Table A5-1. Results of Pot Fishing Pilot Study near Unimak Pass, April 2002.
A5. ExperimentalDesign

APPENDIX A: COD POT LOCAL ABUNDANCE STUDY Rev:10/9/02
Appen. A-12
A basic outline to the experimental design for the local abundance study is as follows:
• The experiment will be conducted in two legs. A “before” survey will be conducted duringJanuary, before the beginning of trawl season, and an identical “after” survey will be conducted inlate March. This schedule is designed to bracket the typically most intensive period of trawl fishingin late February and early March.
• Each survey will cover a number of sites inside the 10nm no-trawl zone (the “control”) and anequal number of sites outside the no-trawl zone in the heavily trawled region (the “treatment”). While it will not be possible to match treatment and control sites exactly with respect to depth,habitat, bottom currents, etc., each group of sites should cover a similar range of depths andhabitats, as nearly as can be determined. The final comparison will be between the population ofstudy sites in the control zone and the population of study sites in the treatment zone.
< Standardized pots with identical mesh, openings, and trigger configurations will be fished at allsites. Bait will be standardized (fixed weight of chopped frozen herring). All pots will be fished foras similar a soak time as is feasible; no less than 4 but no more than 6 hours.
< While it would be desirable to fish all pots at exactly the same time of day, this is not feasible. Instead, all pots will be fished during daylight hours, with the starting time varying over the day. Set and lift times for each pot will be recorded, along with position and depth information.
< As pots are lifted, Pacific cod in each pot will be counted and weighed. Catch of species other thanPacific cod will also be recorded. Individual length/weight and sex data will be collected on asubsample of each day’s catch. Additional data and/or specimens may also be collected for relatedstudies.
< A “site” will consist of a fixed position, fished by three to five pot-sets during each survey. Themeasured quantity for each “site” will be the ratio of the average catch (in numbers or weight ofcod) from pots fished at that position during the “before” survey to the average catch during the“after” survey. If one or more pots are lost or damaged during a survey, the catch may be averagedover the remaining pots. At least three successful fishing events are necessary to obtain a validmeasurement for a site. A site that does not have a valid catch measurement for both before andafter surveys cannot be used.
< Site locations will be selected randomly or systematically before the survey to cover all of the“treatment” area and a similar range of depths and habitats in the “control” area. The number ofsites fished and the number of pots per site will be somewhat subject to weather and sea conditionsduring the surveys. The target is to fish at least 30 sites in each zone, with at least three fishingevents during the before survey and at least three during the after survey.
< A Fisher randomization test (Manly 1991, Chapter 1) will be used to test the null hypothesis thatthe percentage change in CPUE between the before and after surveys at a site is not affected bywhether a site was in the trawled or the untrawled zone. This nonparametric test does not requireindependence or Normality of distributions in the measured variable. The distribution of the teststatistic is determined empirically by repeatedly randomly assigning the observed measures to thetreatment and control groups. The observed measure of the actual data is then compared to this

APPENDIX A: COD POT LOCAL ABUNDANCE STUDY Rev:10/9/02
Appen. A-13
distribution to get a p-value for the test. The power of the test under several alternative hypotheseswill also be computed.
The major difficulty in design of this experiment is that there are many factors that might affect the localabundance and/or the rate of pot catch of Pacific cod at any given time or place. Known factors thatmight affect catch rates include local variation in physical and chemical habitat characteristics, bottomcurrents, and orientation of pot openings in relation to bottom currents. Fish behaviors that are poorlyunderstood but might affect pot catch include diel and tidal patterns in feeding and movement, differencesin feeding rates with spawning stage, and changes in response to bait odors at different levels of satiation. Cod are known to undergo a large-scale seasonal migration pattern in the Bering Sea (Shimada andKimura 1994), but the precise timing of seasonal and short-term migration and aggregation are notknown. The experimental design addresses the uncontrollable variation in three ways. The first is to usenot the absolute catch rate, but the percentage change in catch rate at a site, as the measured variable. This allows for different sites to have differences in absolute abundance due to local habitatcharacteristics, and to show changes in abundance between the “before” and “after” portions of the studydue to seasonal migration patterns. The assumption is that, in the absence, of any fishery effect, the localabundance of cod will change at the same relative rate over all of the study sites. The second componentof the design is the use of “treatment” and “control” areas on either side of the 10nm no-trawl boundaryaround Cape Sarichef. The 10nm limit conveniently intersects the area that has historically been heavilytrawled for cod (Figure A4-2). By using catch rates within the “control” area as a baseline, we hope toaccount for such regional factors as climate and circulation events, seasonal migration and dispersionpatterns, and background feeding levels. The remaining variation (primarily short-term temporal and dielvariation, and measurement error due to variation in fishing efficiency of each pot-set) is addressed byreplication of sites within the treatment and control zones and use of multiple pot-sets to compute themeasurement at each site. In pilot studies, day-to-day variation was one of the major components ofvariance. Using an average over several pot-sets as the measure at each site provides replication over thissource of nuisance variation and reduces the likelihood of zero catches in the final data set.
During fishing for the before and after abundance surveys, pots will be handled as rapidly as possible inorder to maximize sample size. Additional data will also be collected, however, during pot fishing fortagging studies. Pots fished for tagging will use the same protocols and soak times as during theexperiment, and may increase replication of samples from particular locations. Pots whose fish are to becollected for tagging will be lifted at as slow a rate as possible with the boat’s hydraulic gear, in order tominimize damage from pressure changes. Data collected during tagging operations will provideadditional points from which to look at changing abundance over time.
A6. Tentative Schedule for Cod Pot Studies 2002-2003
The Alaska Fisheries Science Center will charter a commercial pot fishing vessel to conduct threeresearch cruises in fall of 2002 and winter of 2003. The cruises are to gather data to monitor change inthe abundance of Pacific cod (Gadus macrocephalus) on a scale local to cod trawl fisheries and to tag andrelease Pacific cod. All cruises will begin and end in Dutch Harbor, Alaska. The cruise schedule, withexplanation, is as follows:
Table 1. Cruise schedule

APPENDIX A: COD POT LOCAL ABUNDANCE STUDY Rev:10/9/02
Appen. A-14
Start Date(on or about) Duration Explanation and Comment
25 September 2002 16 days CRUISE 1: Test research cod pots, pot-mounted sensor equipment,and finalize fishing methods.
29 December 2002 12 days CRUISE 2: Provide indices of Pacific cod abundance prior to the2003 cod trawl fishery. This cruise is timed to be completed priorto the opening of the 2003 trawling season and the Opilio crabfishery in the Bering Sea.
26 February 2003 Leg I begins 2/26
Leg II begins 3/1416 days20 days
CRUISE 3: Tag and release Pacific cod and provide indices ofPacific cod abundance after the 2003 cod trawl fishery has passedits most intensive phase. This cruise will be in two legs, the firstto do the tagging, the second to collect local abundance data.
(Special note on timing: This schedule is intended to minimize conflict with commercial fishing seasons,the Opilio crab fishery in the Bering Sea in particular. If fishing seasons are not as anticipated thetiming of the second and third cruises can be altered to some degree without invalidating the research.)
The three cruises in this charter will start on or about 25 September 2002, 29 December 2002, and 26February 2003. The cruises will last 16 days, 12 day, and 36 days respectively, with the third cruisebeing broken into two legs of 16 and 20 days. These dates have been selected based on the timing of codspawning and cod trawl fisheries. However, this schedule is also intended to minimize conflicts withcommercial fishing seasons. For example, it is in hope of avoiding conflict that the cruise prior to the codtrawl fishery is scheduled to begin on or about 29 December 2002. That cruise is intended to end on 9January 2003, leaving time for the chartered vessel to prepare for crabbing by 13 January. If the timing ofthe Opilio fishery is different in 2003 than it has been in previous years, then the Government willconsider mutually agreeable schedule changes that both preserve the validity of the research and allow thevessel to meet its other commitments. The 16 day leg devoted to tagging can be moved to followimmediately on the heels of the second cruise, in effect becoming a second leg of that cruise. Alternatively, the tagging leg could also be moved to start on or about 3 April, in effect making it thesecond leg of the third cruise rather than the first.

APPENDIX A: COD POT LOCAL ABUNDANCE STUDY Rev:10/9/02
Appen. A-15
3.6 References
Manly, B.D. 19919. Randomization Techniques. Wiley Interscience, NY.National Marine Fisheries Service (NMFS.) (2000) Endangered Species Act Section 7 Consultation -
Biological Opinion and Incidental Take Statement. November 2000. NationalMarine FisheriesService, Alaska Region, P.O. Box 21668, Juneau, AK 99802. 352 pp + Appendices.
NMFS. (2001a) Alaska Groundfish Fisheries Draft Programmatic Supplemental Environmental ImpactStatement. DOC, NOAA, National Marine Fisheries Service, P.O. Box 21668, Juneau, Alaska99802.
NMFS (2001b) Steller Sea Lion Protection Measures Final Supplemental Environmental ImpactStatement. November 2001. National Marine Fisheries Service, P.O. Box 21668, Juneau, Alaska99802.
NMFS (2001c) Environmental Assessment for the Interim and Final Total Allowable CatchSpecifications for the Year 2002 Alaska Groundfish Fisheries, Dec. 2001. National MarineFisheries Service, P.O. Box 21668, Juneau, Alaska 99802.
National Research Council. (1996) The Bering Sea Ecosystem. (National Academy Press, Washington,DC) 307 p.
Shimada, A.M. & Kimura, D.K. (1994) Seasonal movements of Pacific cod, Gadus macrocephalus, inthe eastern Bering Sea and adjacent waters based on tag-recapture data. Fishery Bulletin 92:800-816.
Sinclair, E.H, & Zeppelin, T.K. (2002) Seasonal and spatial differences in diet in the western stock ofsteller sea lions. Journal of Mammology (in press).
Stabeno, P.J., Bond, N.A., Kachel, N.B., Salo, S.A., & Schumacher, J.D. (2001) On the temporalvariability of the physical environment over the south-eastern Bering sea. Fisheries Oceanography10(1), 81-98