e tra11 2013 -...
TRANSCRIPT
TRA
DER
S´
– Y
our
Pers
onal
Tra
ding
Coa
ch |
ww
w.t
rade
rson
line-
mag
.com
The Halloween The Halloween EffectEffectGood Times ahead?New Evidence P. 22
Weekly Options Weekly Options TradingTradingExploring the Covered CallWriting Strategy P. 42
TradingTrading vs.vs. TriathlonTriathlon P. 6
What You Can Learn from Professional Athletes
Interview: John Person – Journey and Discoveries of a 33 Year Veteran Trader P. 68
Your Personal Trading Coach
Nr. 11, November 2013 | www.tradersonline-mag.com
1113 YYo3
Interview
Jon Boorman
The Pro’s Process
P. 66

STRATEGIES & INDICATORS You Need for Trading Profits in 2013
70+T R A D I N GWORKSHOPS
T R A D I N G
EXPERTS
100+80+E X H I B I T O R
B O O T H S
SHOP THEI N D U S T R Y ’ S
L A R G E S TEXHIBIT HALL
Easy to REGISTER FREE at
www.LasVegasTradersExpo.comor Call Today 800/970-4355
Mention Priority Code 033024
ATTEND THE ULTIMATE EVENT FOR TRADERS
November 20–23, 2013LAS VEGAS | Caesars Palace
Gold SponsorPlatinum Sponsor Silver Sponsors
To Exhibit: Call 800/822-1134
a Production ofMedia Partner
Alexander Elder Technical Analysis
Lawrence McMillan Options
Tom SosnoffOptions
Toni Hansen Strategies Linda Raschke
Strategies
Toni TurnerStocks
Harry BoxerTechnical
Jeffrey Kennedy Futures

EDITORIAL
3
www.tradersonline-mag.com 11.2013
Record Attendance Expected
Lothar AlbertEditor-in-chief and publisher
» Our annual trading fair “World of Trading“ has established itself among traders as
a real highlight. Every year, there is a huge rush of visitors as well as exhibitors. But
as it stands now, this year’s trading fair will probably be better attended than ever
before. The booths have long been sold out, and places in some seminars were
already in short supply weeks ago.
The events on offer are not only of interest to neophytes. It’s especially advanced
and professional traders that keep coming to our fair every year, appreciating as they
do the good atmosphere, the chance to exchange views with other traders, and the
variety of products offered that they can easily learn about in direct conversations
with the companies offering them.
The Messe Frankfurt is the venue where, besides providing opportunities for
networking with traders, we will be offering our usual top-class programme: panel
discussions, lectures and seminars. And, of course, there is our highly popular live
trading event where professionals demonstrate their trading skills on stage while
explaining to the audience exactly how they operate, why they enter and exit and how
they manage their positions, as the trade is running. Though you cannot book a place
for the live trading event you- just need to be there early enough, it pays to register
soon for the seminars that are still available as long as there are any places left.
One of the stars at this year‘s World of Trading is also our interviewee in the current
issue (beginning on page 68): US professional trader John Person. When this
publication went to press, there were still some places available for his seminar.
In any event, there is one thing you should defi nitely do as a visitor to the fair: touch
base with other traders and fi nd out all about the latest trends and offers at our
exhibitors‘ stands. Stagnation means regression and in trading you should at least
know what the latest trends are, which is certainly of benefi t in this fast moving
day and age. We take this early opportunity to wish you lots of fun at the World of
Trading and hope you discover lots of new ideas. «
Good Trading

TABLE OF CONTENTS
4
www.tradersonline-mag.com 11.2013
6
TABLE OF CONTENTS
November 2013
68
NewsFind the latest notes and
announcements from around the world
of trading in our “News“ section.
30 New Products The Latest Trading Technology
32 Software Review TradeShark®
36 Book Review
“The Playbook”
by Mike Bellafi ore
38 App Review
StockTouch
TOOLS
INSIGHTS
COVERSTORY
16 TRADERS´ Talk We talk with Carol Harmer about her typical trading day and
how it is to be a female trader in a male dominated world.
18 Trading Seasonality’s Thomas Bopp presents the two most promising candidates for
“Black Friday” after Thanksgiving.
20 The Unhappy Marriage of the Market and the Government Clem Chambers takes a look at the relationship between
governments and the markets.
22 The Halloween Effect Thomas Hupp discusses some recent studies.
6 Trading vs. Triathlon Triathlon is a race of three sports that is made up of swimming,
cycling, and running. In a sense, any investment also includes
three disciplines: saving, investing, and trading. And just as in
triathlon, the third discipline is the hardest – and the one that is
key at the same time. But these are by no means all the parallels
between trading and triathlon: Both are very individual, the
principles of success are similar, and whether you make it or not
will in the end be determined by your mind set.
22
24

TABLE OF CONTENTS
5
Publisher Lothar Albert
Subscription Servicewww.traders-mag.com;
www.tradersonline-mag.com;
[email protected]; Tel: +49 (0) 931 45226-15
Address of Editorial and Advertising Department
Barbarastrasse 31a, 97074 Wuerzburg
Editor-in-ChiefLothar Albert
EditorsKatharina Boetsch, Prof. Dr. Guenther
Dahlmann-Resing, Corinne Endrich, Marko
Graenitz, Lena Hirnickel, Sandra Kahle,
Rodman Moore, Stefan Rauch, Katja Reinhardt,
Karin Seidl, Tina Wagemann, Christine
Weissenberger, Nadine Wiget
Articles Thomas Bopp, Simon Campbell, Clem Chambers,
Marko Graenitz, Thomas Hupp, Jens Klatt,
Azeez Mustapha, David Pieper, Jens Rabe,
Valentin Rossiwall
Pictureswww.fotolia.com
Price datawww.captimizer.de; www.esignal.com;
www.metaquotes.net; www.metastock.com;
www.tradesignalonline.com; www.tradestation.com
ISSN1612-9415
DisclosureThe information in TRADERS´ is intended
for educational purposes only. It is not
meant to recommend, promote or in any
way imply the effectiveness of any trading
system, strategy or approach. Traders are
advised to do their own research and testing
to determine the validity of a trading idea.
Trading and investing carry a high level of
risk. Past performance does not guarantee
future results.
© 2013 TRADERS´ media GmbH, Barbarastr. 31a,
D-97074 Wuerzburg, Germany
BASICS
STRATEGIES
56 Trading Journal Valentin Rossiwall shows two trades in the Dow Jones.
58 Risk- and Money Management – Part 2 In Part 2 Jens Klatt explains what good risk and money
management involves and what pitfalls you should avoid as a
trader.
62 Economic Data as Market Mover – Part 3 In the third part of economic data as a market mover we look
at the durable goods report.
42 Weekly Options – A New Field for Active Traders – Part 2 In the second part Jens Rabe shows a specifi c strategy that
can be implemented by using weekly options: classic covered
call writing.
48 Fibonacci Swing Strategy David Pieper describes a simple trading approach based on a
combination of retracements and projections.
52 Benefi tting from the Real Principle behind Forex Trading
Azeez Mustapha describes how to match weak currencies
against strong currencies.
66 The Pro’s Process Part 14: Jon Boorman
68 John Person – The Journey and Discoveries of a 33 Year Veteran Trader
John Person is a 33 year veteran of the Futures and
Options Trading industry. The independent trader,
broker, analyst, author, speaker, and entrepreneur talks
about his exciting way into the fi nancial world and his
successful trading strategies.
PEOPLE
COVERSTORY
6
www.tradersonline-mag.com 11.2013
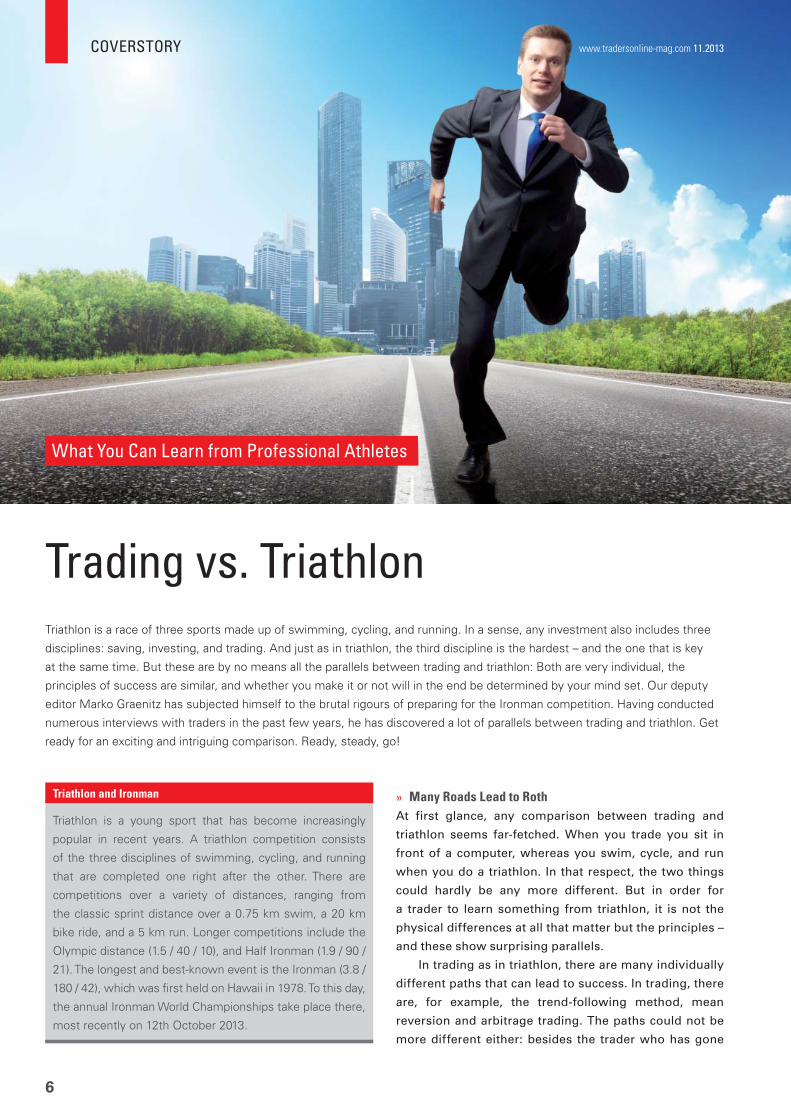
What You Can Learn from Professional Athletes
Triathlon is a race of three sports made up of swimming, cycling, and running. In a sense, any investment also includes three
disciplines: saving, investing, and trading. And just as in triathlon, the third discipline is the hardest – and the one that is key
at the same time. But these are by no means all the parallels between trading and triathlon: Both are very individual, the
principles of success are similar, and whether you make it or not will in the end be determined by your mind set. Our deputy
editor Marko Graenitz has subjected himself to the brutal rigours of preparing for the Ironman competition. Having conducted
numerous interviews with traders in the past few years, he has discovered a lot of parallels between trading and triathlon. Get
ready for an exciting and intriguing comparison. Ready, steady, go!
Trading vs. Triathlon
Triathlon is a young sport that has become increasingly
popular in recent years. A triathlon competition consists
of the three disciplines of swimming, cycling, and running
that are completed one right after the other. There are
competitions over a variety of distances, ranging from
the classic sprint distance over a 0.75 km swim, a 20 km
bike ride, and a 5 km run. Longer competitions include the
Olympic distance (1.5 / 40 / 10), and Half Ironman (1.9 / 90 /
21). The longest and best-known event is the Ironman (3.8 /
180 / 42), which was fi rst held on Hawaii in 1978. To this day,
the annual Ironman World Championships take place there,
most recently on 12th October 2013.
Triathlon and Ironman » Many Roads Lead to RothAt first glance, any comparison between trading and
triathlon seems far-fetched. When you trade you sit in
front of a computer, whereas you swim, cycle, and run
when you do a triathlon. In that respect, the two things
could hardly be any more different. But in order for
a trader to learn something from triathlon, it is not the
physical differences at all that matter but the principles –
and these show surprising parallels.
In trading as in triathlon, there are many individually
different paths that can lead to success. In trading, there
are, for example, the trend-following method, mean
reversion and arbitrage trading. The paths could not be
more different either: besides the trader who has gone
eSignal FuturesTrader allows you access to more than 40 FCMs
Seasonal Studyidentifies cyclicalpatterns in thecommodity futures markets
Advanced GET Dashboardshows you how your chosenstocks are likely to move
Alert Tickerfeatures an adjustable, all-in-one display, so you'll know when to make your trades
Volume Delta displays whichside of the market has controlat any given price level
Market Profileorganizes market activity in a distributioncurve (histogram)
QuoTrek Mobile brings you global quotes, chartsand news; go to theiTunes App Store today
Specialty Chart Types include Point &Figure, Renko, Kagi and Price Break
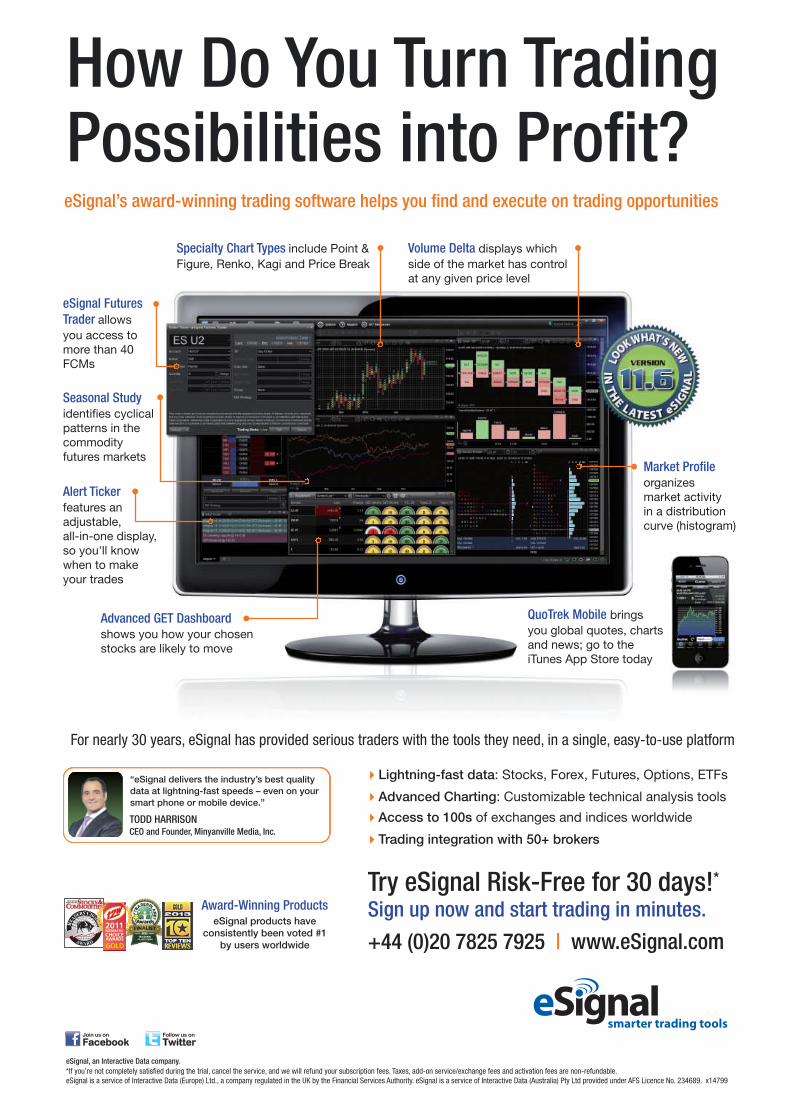
For nearly 30 years, eSignal has provided serious traders with the tools they need, in a single, easy-to-use platform
How Do You Turn TradingPossibilities into Profit?
eSignal, an Interactive Data company. *If you’re not completely satisfied during the trial, cancel the service, and we will refund your subscription fees. Taxes, add-on service/exchange fees and activation fees are non-refundable.eSignal is a service of Interactive Data (Europe) Ltd., a company regulated in the UK by the Financial Services Authority. eSignal is a service of Interactive Data (Australia) Pty Ltd provided under AFS Licence No. 234689. x14799
eSignal’s award-winning trading software helps you find and execute on trading opportunities
Try eSignal Risk-Free for 30 days!*
Sign up now and start trading in minutes.
+44 (0)20 7825 7925 | www.eSignal.com
�Lightning-fast data: Stocks, Forex, Futures, Options, ETFs
�Advanced Charting: Customizable technical analysis tools
�Access to 100s of exchanges and indices worldwide
�Trading integration with 50+ brokers
Award-Winning ProductseSignal products have
consistently been voted #1by users worldwide
TODD HARRISONCEO and Founder, Minyanville Media, Inc.
“eSignal delivers the industry’s best qualitydata at lightning-fast speeds – even on yoursmart phone or mobile device.”
COVERSTORY
8
www.tradersonline-mag.com 11.2013
the 1980s in which he showed that
virtually anyone who is reasonably
normal can be successful in the
stock market.
In triathlon, things are similar
with the genetic component playing
a certain role here. So an average
person will not be in a position to
win at the Olympics. But he may
very well achieve a high standard
of performance and win at minor
competitions, finishing lengths
ahead of someone who has perfect
talent but fails to work on that.
So if it’s possible to be successful
regardless of the genetic conditions
– how then do you manage to be
successful?
Visualisation & AutosuggestionYou first need to set a long-term goal
you want to achieve. Be not (!) realistic here, but let your
imagination run wild. Imagine, for example, what you
would have liked to achieve in ten years’ time. Ten years
is a long time. Most people overestimate what they can
achieve in one year, but dramatically underestimate what
they can achieve in ten years. Be as emotional as possible
in your vision in order for it to be more firmly rooted in
your mind. The reason for this important exercise is this:
Scientists have found that our brain cannot distinguish
between fiction and reality: If you conjure up the images
of your future success again and again, your brain will
eventually “believe” that it becomes reality. You will
then have the feeling that you know you will make it –
a factor that should not be underestimated! Using this
psychological trick of autosuggestion, you may become
convinced that you are capable of putting into practice
virtually everything (realistically feasible). This may
sound somewhat esoteric, but is exactly the path that has
made the most successful people what they are.
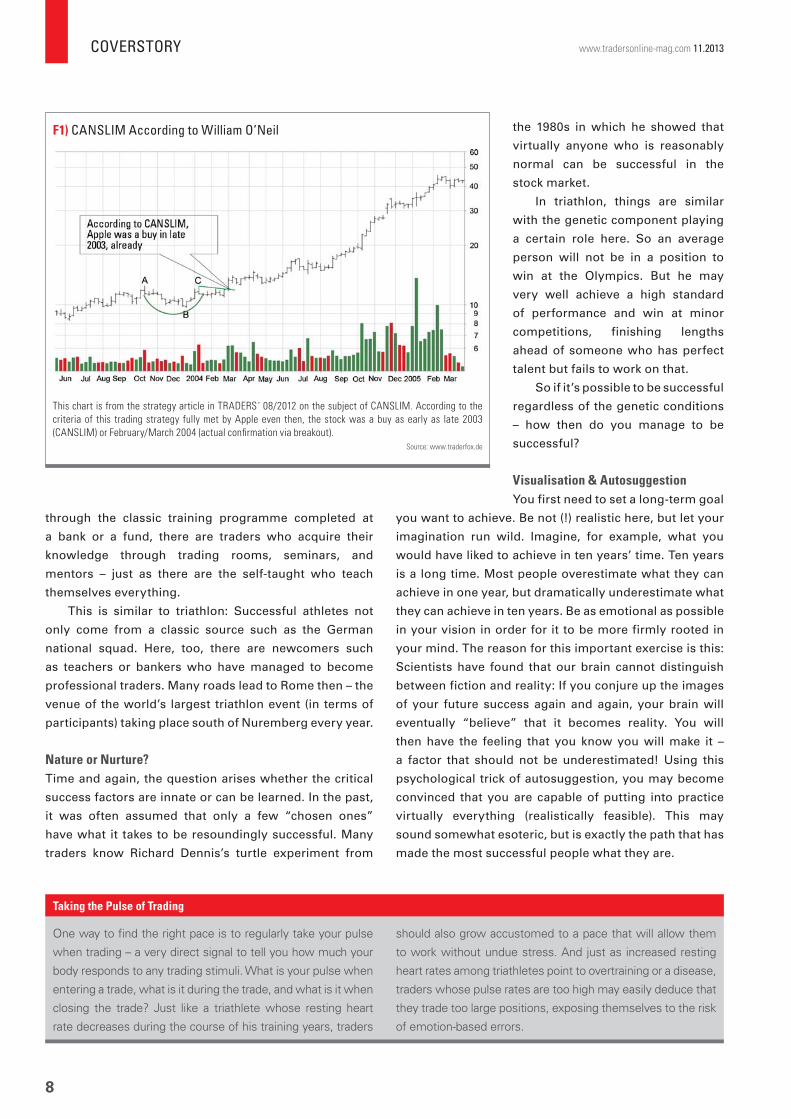
This chart is from the strategy article in TRADERS´ 08/2012 on the subject of CANSLIM. According to the
criteria of this trading strategy fully met by Apple even then, the stock was a buy as early as late 2003
(CANSLIM) or February/March 2004 (actual confi rmation via breakout).
Source: www.traderfox.de
F1) CANSLIM According to William O’Neil
One way to fi nd the right pace is to regularly take your pulse
when trading – a very direct signal to tell you how much your
body responds to any trading stimuli. What is your pulse when
entering a trade, what is it during the trade, and what is it when
closing the trade? Just like a triathlete whose resting heart
rate decreases during the course of his training years, traders
should also grow accustomed to a pace that will allow them
to work without undue stress. And just as increased resting
heart rates among triathletes point to overtraining or a disease,
traders whose pulse rates are too high may easily deduce that
they trade too large positions, exposing themselves to the risk
of emotion-based errors.
Taking the Pulse of Trading
through the classic training programme completed at
a bank or a fund, there are traders who acquire their
knowledge through trading rooms, seminars, and
mentors – just as there are the self-taught who teach
themselves everything.
This is similar to triathlon: Successful athletes not
only come from a classic source such as the German
national squad. Here, too, there are newcomers such
as teachers or bankers who have managed to become
professional traders. Many roads lead to Rome then – the
venue of the world’s largest triathlon event (in terms of
participants) taking place south of Nuremberg every year.
Nature or Nurture?Time and again, the question arises whether the critical
success factors are innate or can be learned. In the past,
it was often assumed that only a few “chosen ones”
have what it takes to be resoundingly successful. Many
traders know Richard Dennis’s turtle experiment from
COVERSTORY
9
Let’s start with triathlon: Would
you like to compete over a Half-
Ironman? Or complete a full-distance
Ironman? Or even win a minor
competition? If you are past the age
of 20, you might want to aspire to
catch a spot on the podium or win in
your age group. Age Groups usually
cover a period of five years.
And in trading? A million dollars?
Or five million? Ten? Or more
broadly, “financial independence”
and “peace and quiet”? Or are you
aiming really high, maybe wanting to
manage a billion dollar hedge fund?
Whatever it is, imagine it being as
emotional as possible. How will it
feel when you have achieved your
goal? How will you feel and live and
go about your daily business?
It’s the Process That CountsIf you have a specific goal and really (!) believe that you
are going to achieve it, that’s already half the battle. This
is because this motivation is such that it causes you,
consciously and unconsciously, to do everything in your
power to make that goal a reality. Not for nothing is there
the saying: “Whether you think you can make it or you
can’t, you will be right in either case.”
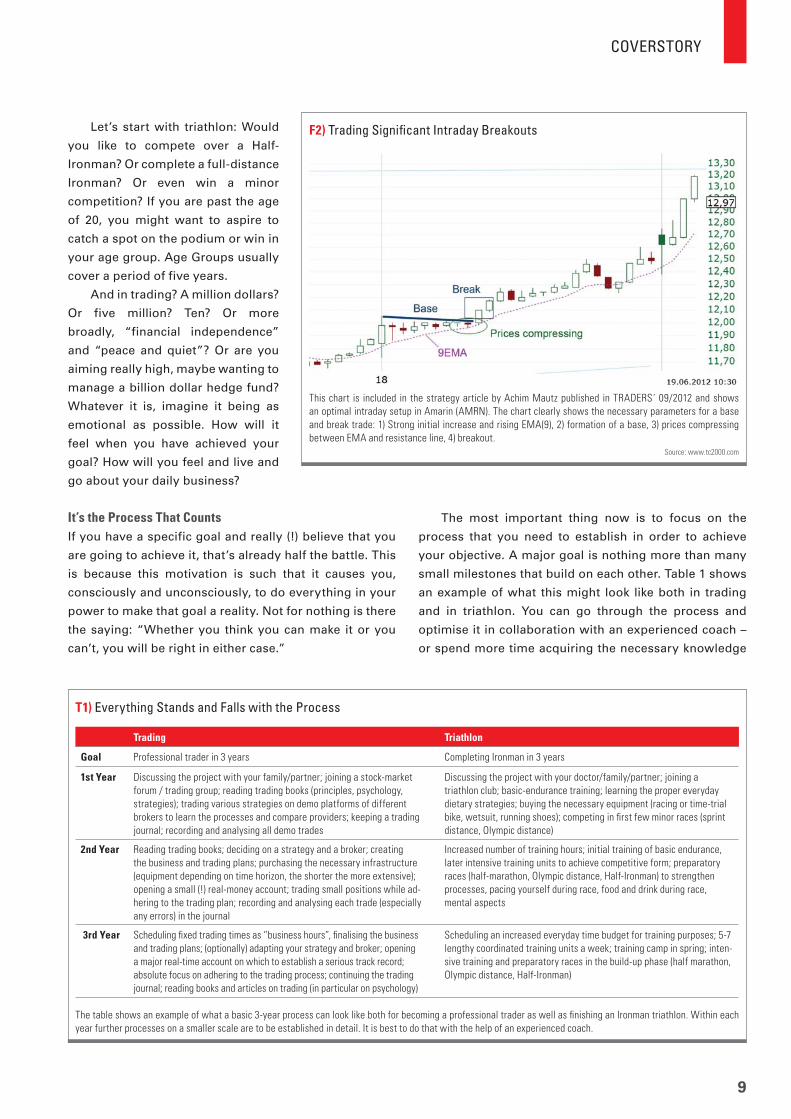
This chart is included in the strategy article by Achim Mautz published in TRADERS´ 09/2012 and shows
an optimal intraday setup in Amarin (AMRN). The chart clearly shows the necessary parameters for a base
and break trade: 1) Strong initial increase and rising EMA(9), 2) formation of a base, 3) prices compressing
between EMA and resistance line, 4) breakout.
Source: www.tc2000.com
F2) Trading Signifi cant Intraday Breakouts
The most important thing now is to focus on the
process that you need to establish in order to achieve
your objective. A major goal is nothing more than many
small milestones that build on each other. Table 1 shows
an example of what this might look like both in trading
and in triathlon. You can go through the process and
optimise it in collaboration with an experienced coach –
or spend more time acquiring the necessary knowledge
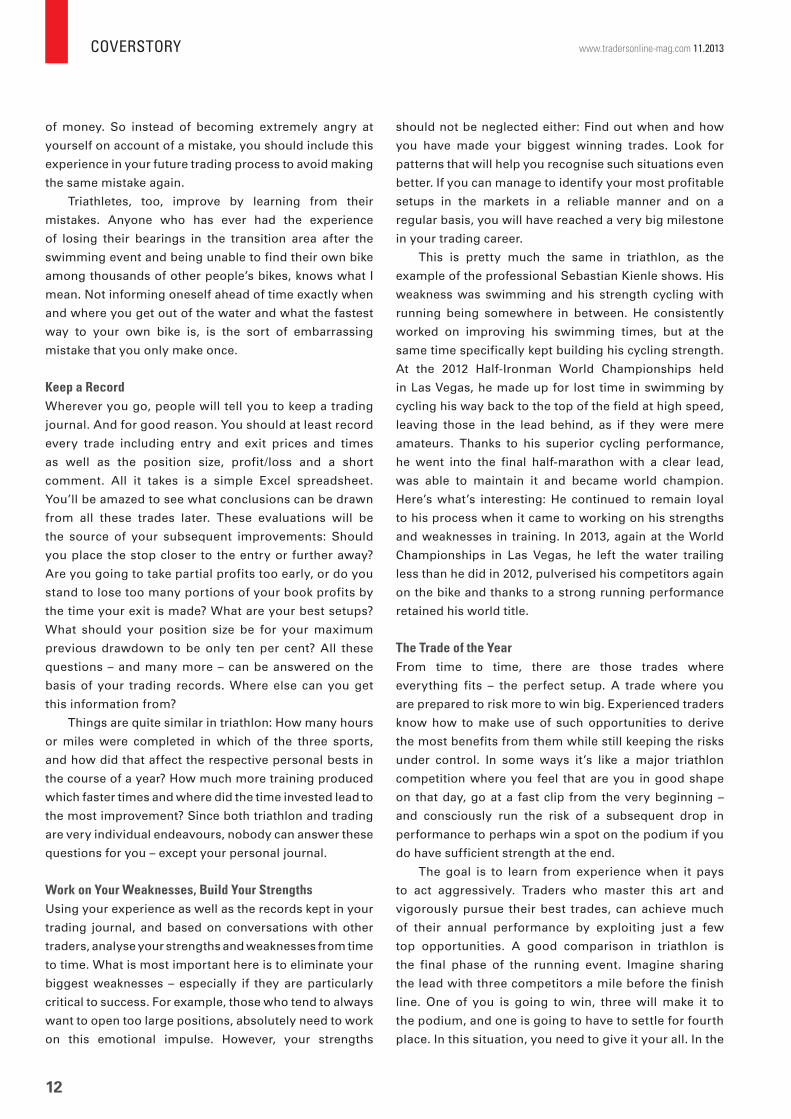
The table shows an example of what a basic 3-year process can look like both for becoming a professional trader as well as fi nishing an Ironman triathlon. Within each
year further processes on a smaller scale are to be established in detail. It is best to do that with the help of an experienced coach.
Trading Triathlon
Goal Professional trader in 3 years Completing Ironman in 3 years
1st Year Discussing the project with your family/partner; joining a stock-market
forum / trading group; reading trading books (principles, psychology,
strategies); trading various strategies on demo platforms of different
brokers to learn the processes and compare providers; keeping a trading
journal; recording and analysing all demo trades
Discussing the project with your doctor/family/partner; joining a
triathlon club; basic-endurance training; learning the proper everyday
dietary strategies; buying the necessary equipment (racing or time-trial
bike, wetsuit, running shoes); competing in fi rst few minor races (sprint
distance, Olympic distance)
2nd Year Reading trading books; deciding on a strategy and a broker; creating
the business and trading plans; purchasing the necessary infrastructure
(equipment depending on time horizon, the shorter the more extensive);
opening a small (!) real-money account; trading small positions while ad-
hering to the trading plan; recording and analysing each trade (especially
any errors) in the journal
Increased number of training hours; initial training of basic endurance,
later intensive training units to achieve competitive form; preparatory
races (half-marathon, Olympic distance, Half-Ironman) to strengthen
processes, pacing yourself during race, food and drink during race,
mental aspects
3rd Year Scheduling fi xed trading times as “business hours”, fi nalising the business
and trading plans; (optionally) adapting your strategy and broker; opening
a major real-time account on which to establish a serious track record;
absolute focus on adhering to the trading process; continuing the trading
journal; reading books and articles on trading (in particular on psychology)
Scheduling an increased everyday time budget for training purposes; 5-7
lengthy coordinated training units a week; training camp in spring; inten-
sive training and preparatory races in the build-up phase (half marathon,
Olympic distance, Half-Ironman)
T1) Everything Stands and Falls with the Process
COVERSTORY
10
www.tradersonline-mag.com 11.2013
yourself. Thereafter, any preparation must be made as
close as possible to this process with minor adjustments
perhaps being necessary in keeping with any progress.
There is no shortage of trading strategies that
work: CANSLIM according to William O’Neil (Simon
Betschinger’s strategy in TRADERS´ 08/2012), trading
at extreme market exaggerations (Larry Connors’
strategy in TRADERS´ 06/2013) or trading significant
intraday breakouts (Achim Mautz’ strategy in TRADERS´
09/2012). The more short term the trading style, the more
demanding it is. So you need to decide whether – in a
figurative sense – you “only” want to complete a Half-
Ironman (CANSLIM position trading) or win a competition
in your age group (intraday trading).
If the goal is clear, the motivation high, and the
process mature, then it’s all up to the trader or triathlete:
If he follows his plan religiously, there is a high degree of
likelihood of him being able to actually trade profitably
three years later or complete an Ironman (see Table 1).
The reason for that is that he has been working towards
that goal on a regular basis and in a structured manner so
that financial success – in the case of triathlon the peak
physical performance – will result automatically. You will
just need to stay the course long enough.
No matter how high your aspirations are, however,
if you have no clear process or fail to follow one
consistently, you will not be able to achieve even minor
trading goals or if you do, it will only be because luck
was on your side. Everything stands and falls with the
process. This is comparable to an Ironman competition
in which a would-be finisher thinks he can complete the
final marathon event with little training. This idea may
sound absurd since it is apparently “clear” in triathlon
that you cannot make it without completing a rigorous
preparatory programme. However, in trading this is
seemingly not the case but should be. After all, even
here it takes several years for most neophytes to have
sufficiently improved through clean processes for them
to be constantly profitable.
Do Not Overexaggerate “Over exaggerate” means starting off at too fast a pace
and using up your body’s reserves in such a way that
you experience a total loss of performance and may
be forced to drop out of the race. The longer the race
and the higher the aspirations, the higher the risk of
over gambling. More often than not, this affects even
experienced professionals who start off, for example,
the final marathon event of an Ironman competition
at too fast a pace and subsequently “hit the wall”,
colloquially speaking, when you suddenly lose all your
energy from one moment to the next. The right pace is
key to new personal bests.
In trading, this “pace” can be equated to the position
size. While you get ahead faster – as you do initially in the
marathon – if you trade too large positions, you will also
run a very high risk of suffering massive drawdowns later
(“hitting the wall” ) or even losing your trading account
(dropping out of the competition).
But athletes may not only over exaggerate in a race
but also in training. Those running 30 km every day,
train themselves “into a hole”, colloquially speaking.
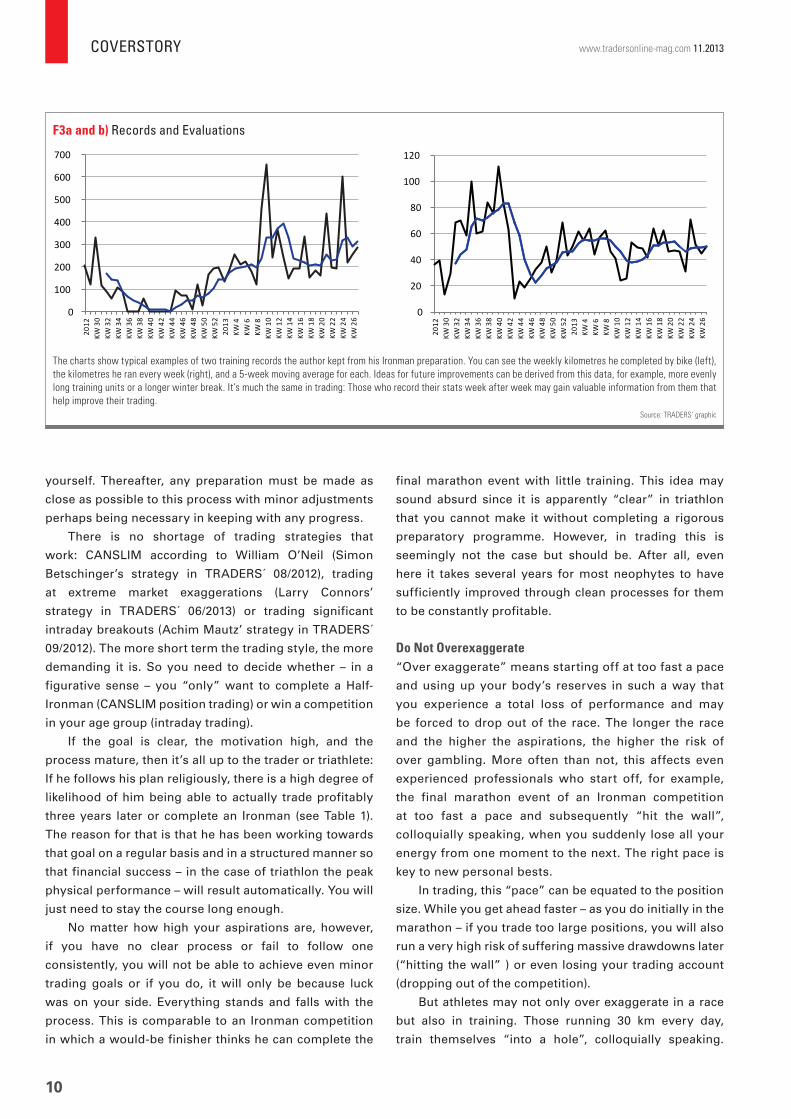
The charts show typical examples of two training records the author kept from his Ironman preparation. You can see the weekly kilometres he completed by bike (left),
the kilometres he ran every week (right), and a 5-week moving average for each. Ideas for future improvements can be derived from this data, for example, more evenly
long training units or a longer winter break. It’s much the same in trading: Those who record their stats week after week may gain valuable information from them that
help improve their trading.
Source: TRADERS‘ graphic
F3a and b) Records and Evaluations
0
100
200
300
400
500
600
700
2012
KW 3
0KW
32
KW 3
4KW
36
KW 3
8KW
40
KW 4
2KW
44
KW 4
6KW
48
KW 5
0KW
52
2013
KW 4
KW 6
KW 8
KW 1
0KW
12
KW 1
4KW
16
KW 1
8KW
20
KW 2
2KW
24
KW 2
6
0
20
40
60
80
100
120
2012
KW 3
0KW
32
KW 3
4KW
36
KW 3
8KW
40
KW 4
2KW
44
KW 4
6KW
48
KW 5
0KW
52
2013
KW 4
KW 6
KW 8
KW 1
0KW
12
KW 1
4KW
16
KW 1
8KW
20
KW 2
2KW
24
KW 2
6
COVERSTORY
11
This means that their body is not
getting enough recovery time prior
to the next training stimulus. The
result is over-training, a decline in
performance and an increased risk
of injury. Put simply, you cause your
body to “be ruined”.
Similarly, instead of sitting ten
hours straight in front of the monitor
and watching every tick, you need
time to recharge your batteries while
trading. If you fail to take any breaks,
your concentration and performance
will be similarly impaired and there
will be an increased risk of error,
causing you to suffer unnecessary
losses. However, everybody needs
to find out for themselves where the
optimum is – whether it’s trading or
triathlon. Your best bet is to start at
a low level and then increase slowly.
Sooner or later, you will find “your”
level where it feels just right.
Never Trade without a HelmetTrading is risk management. None other than the
successful trader Paul Tudor Jones said that basically, he
spent all his time minimising risks. Trading without any
risk management is like cycling down a hill in triathlon at
50 mph without applying the brakes and without wearing
a helmet. Of course, this may work out fine – but only
until it does not. And then you will be glad to still be alive
– and in trading, you will be glad to see that your account
still exists.
Trade at Your Own PaceThis leads us to the next important point: This is all about
your own trading, not other people’s. Find your own
performance level and follow your plan in consistently
trading your own trading method. In the end, this will
stand you in better stead than you can imagine. This is no
different in triathlon: Those who allow themselves to be
guided by others and keep trying not to lose touch with
the front runners are liable to overextend themselves.
Overall, you will achieve the fastest time if you constantly
swim, cycle, and run at your own pace. After all, it’s
sometimes the very “fast guys” at the initial stage that
you leave behind in the end after your own consistent
performance since they in turn have over exaggerated.
Much like traders who quickly achieve high profits with
large positions – a year later some of them may no longer
be trading.
Discipline Makes You SuccessfulIf you can only trade well after you have completed some
specific research – something that you may not feel like
doing –, then you should adhere to the process. Sooner
or later you will enjoy carrying out that research if your
brain associates that with positive trading results. It’s
similar to that in triathlon. Everyone knows that hard
interval training increases your speed by completing
short fast-paced training units followed by short breaks.
But it is also unpleasant. Sooner or later, though, new
personal bests will cause you to love even such tough
training.
Learn from Your MistakesThe good news is that you don’t have to do everything
right from the very beginning. After all, there is especially
one way that you learn on the stock market: from your
mistakes. Unfortunately, this is not a particularly popular
approach. But nothing leaves such an indelible mark in our
memory as a heavy loss. If this was caused by a missing
stop, for example, you can learn a great deal from this
mistake. That’s why mistakes basically are the best thing
that can happen to you – especially at the beginning of
a trader’s career where you trade a small account. That
way, you will quickly learn without losing large amounts
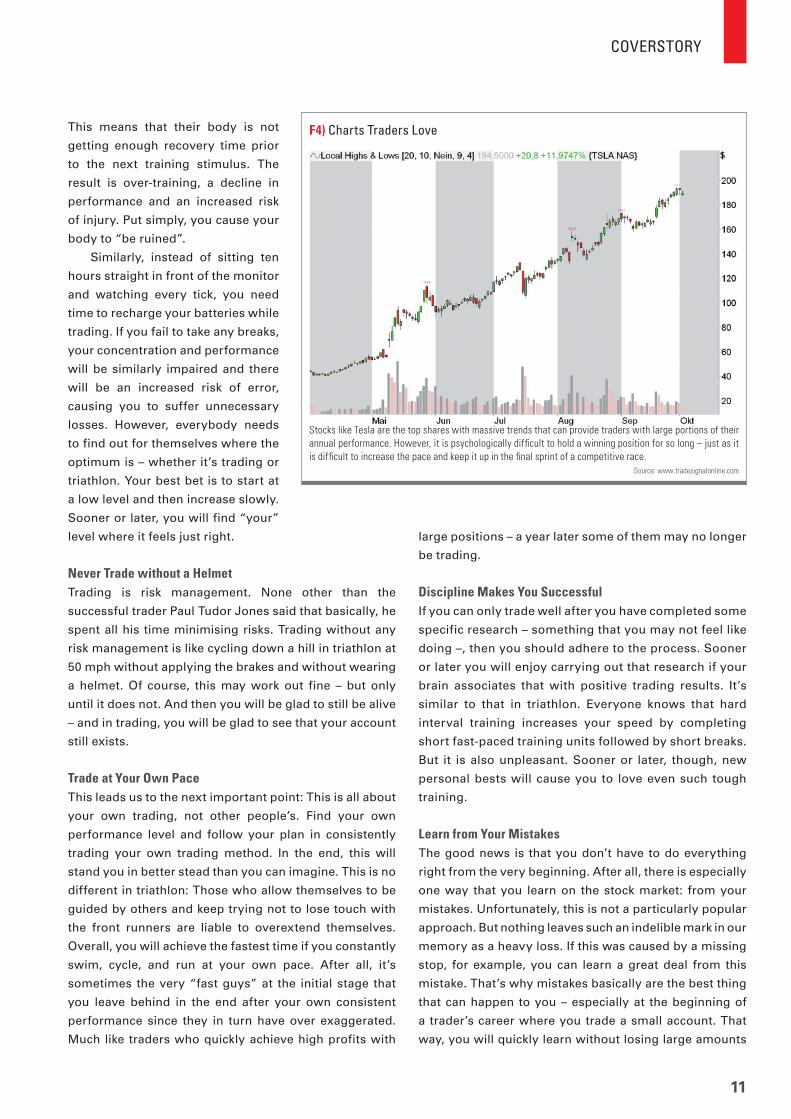
Stocks like Tesla are the top shares with massive trends that can provide traders with large portions of their
annual performance. However, it is psychologically diffi cult to hold a winning position for so long – just as it
is diffi cult to increase the pace and keep it up in the fi nal sprint of a competitive race.
Source: www.tradesignalonline.com
F4) Charts Traders Love
COVERSTORY
12
www.tradersonline-mag.com 11.2013
of money. So instead of becoming extremely angry at
yourself on account of a mistake, you should include this
experience in your future trading process to avoid making
the same mistake again.
Triathletes, too, improve by learning from their
mistakes. Anyone who has ever had the experience
of losing their bearings in the transition area after the
swimming event and being unable to find their own bike
among thousands of other people’s bikes, knows what I
mean. Not informing oneself ahead of time exactly when
and where you get out of the water and what the fastest
way to your own bike is, is the sort of embarrassing
mistake that you only make once.
Keep a RecordWherever you go, people will tell you to keep a trading
journal. And for good reason. You should at least record
every trade including entry and exit prices and times
as well as the position size, profit/loss and a short
comment. All it takes is a simple Excel spreadsheet.
You’ll be amazed to see what conclusions can be drawn
from all these trades later. These evaluations will be
the source of your subsequent improvements: Should
you place the stop closer to the entry or further away?
Are you going to take partial profits too early, or do you
stand to lose too many portions of your book profits by
the time your exit is made? What are your best setups?
What should your position size be for your maximum
previous drawdown to be only ten per cent? All these
questions – and many more – can be answered on the
basis of your trading records. Where else can you get
this information from?
Things are quite similar in triathlon: How many hours
or miles were completed in which of the three sports,
and how did that affect the respective personal bests in
the course of a year? How much more training produced
which faster times and where did the time invested lead to
the most improvement? Since both triathlon and trading
are very individual endeavours, nobody can answer these
questions for you – except your personal journal.
Work on Your Weaknesses, Build Your StrengthsUsing your experience as well as the records kept in your
trading journal, and based on conversations with other
traders, analyse your strengths and weaknesses from time
to time. What is most important here is to eliminate your
biggest weaknesses – especially if they are particularly
critical to success. For example, those who tend to always
want to open too large positions, absolutely need to work
on this emotional impulse. However, your strengths
should not be neglected either: Find out when and how
you have made your biggest winning trades. Look for
patterns that will help you recognise such situations even
better. If you can manage to identify your most profitable
setups in the markets in a reliable manner and on a
regular basis, you will have reached a very big milestone
in your trading career.
This is pretty much the same in triathlon, as the
example of the professional Sebastian Kienle shows. His
weakness was swimming and his strength cycling with
running being somewhere in between. He consistently
worked on improving his swimming times, but at the
same time specifically kept building his cycling strength.
At the 2012 Half-Ironman World Championships held
in Las Vegas, he made up for lost time in swimming by
cycling his way back to the top of the field at high speed,
leaving those in the lead behind, as if they were mere
amateurs. Thanks to his superior cycling performance,
he went into the final half-marathon with a clear lead,
was able to maintain it and became world champion.
Here’s what’s interesting: He continued to remain loyal
to his process when it came to working on his strengths
and weaknesses in training. In 2013, again at the World
Championships in Las Vegas, he left the water trailing
less than he did in 2012, pulverised his competitors again
on the bike and thanks to a strong running performance
retained his world title.
The Trade of the YearFrom time to time, there are those trades where
everything fits – the perfect setup. A trade where you
are prepared to risk more to win big. Experienced traders
know how to make use of such opportunities to derive
the most benefits from them while still keeping the risks
under control. In some ways it’s like a major triathlon
competition where you feel that are you in good shape
on that day, go at a fast clip from the very beginning –
and consciously run the risk of a subsequent drop in
performance to perhaps win a spot on the podium if you
do have sufficient strength at the end.
The goal is to learn from experience when it pays
to act aggressively. Traders who master this art and
vigorously pursue their best trades, can achieve much
of their annual performance by exploiting just a few
top opportunities. A good comparison in triathlon is
the final phase of the running event. Imagine sharing
the lead with three competitors a mile before the finish
line. One of you is going to win, three will make it to
the podium, and one is going to have to settle for fourth
place. In this situation, you need to give it your all. In the
COVERSTORY
13
worst case, you will run out of steam in the final sprint
and finish fourth. What this may look like in triathlon
you can watch in a video on Youtube by entering “Bevan
Docherty – Super-human Triathlon Sprint Finish”.
Both in trading and in triathlon, you can gain a lot
by taking a higher risk, but also lose more (drawdown
in trading, loss of performance in triathlon). If the latter
is the case, it is important in both trading and triathlon
to escape unscathed – to the extent that this is possible:
Reduce your position size once the trade is in losing
territory and completely exit the trade sooner rather
than later. By no means should you just rely on “hope”
when the position tanks – otherwise you may risk your
entire trading account. Always remember that tomorrow
is another trading day. It’s about the same in a triathlon
competition: If major pieces of “hardware” such as your
knee or your Achilles tendon cause a great deal of pain,
just recognise “the losing trade” and get out of the race.
This will allow you to enter another competition a little
later. However, those who ignore the biggest warning
signs, keep going at all costs despite clear evidence to
the contrary, and hope that their body will be able to cope
until the very end, will be risking their own health and
putting their entire triathlon season in jeopardy.
Final Sprint, the Second Time AroundThe final sprint in the sporting competition also lends
itself to another comparison to trading: It represents the
ability to really let a winning trade run and not to “be
slowing the pace” too early (Figure 4). Try to complete
the trade as a big win, to make it finish in first place – and
do not get out prematurely, ending up in fourth place. It’s
mentally tough to hang on to open profitable positions
without smoothing the trade – just as it is hard to increase
the pace and keep it up in the final sprint. But that’s
exactly what characterises the big winners. Perhaps this
comparison will help you keep the pedal to the metal
when you are profitable and let the profits run.
Gritting your TeethFor long-distance competitions like the Ironman, it will
ultimately be vital to remain strong mentally. More
often than not, the lack of carbohydrates in the second
half of the marathon makes triathletes mentally weak
causing them to be ever slower since they feel that
they will “never make it”. Objectively speaking, you
have performed at your very best throughout the
entire competition, otherwise you would never have
made it this far, but the “drawdown“ at the end comes
at the worst possible time and is so demoralising that
some drop out of the competition. I can only urge you
not to but instead stop thinking and just keep running.
It’s the same in trading. If you have a good strategy
that has worked well for a long time, then stick to it
even during a drawdown. Reduce the position size if
necessary. However, if you change or give up your
strategy at short notice, you will have even less
chance of surviving the drawdown. It may be hard
to continue trading right through a drawdown, but
you will be very glad at the next high of your equity
curve that you have stayed the course – just like the
triathlete really gritting his teeth during the Ironman
and reaching the finish line.
Even the Best Setup May FailYou can never be sure to be successful until you have
crossed the finish line. That’s what you always need to
keep in mind. No matter how much book profit the “trade
of your life” may enjoy – if any extreme news suddenly
breaks overnight, all that profit may quickly disappear
into thin air. You can prevent this from happening by
taking partial profits or securing your position with
a hedge. However, this will also reduce your upside
potential.
Things are much the same in triathlon: You may have
a perfect day on your bike and be in the lead – but have a
flat tyre and lose the race. Or – during the running event
– you may even get a severe cramp in your calf right
before the finish line forcing you to limp on and let your
competitors pass. Again, it is possible for you to do a
little bit of “hedging” here, for example, by running at a
slightly slower pace while you have a comfortable lead.
But you can never be sure of any success until you have
completed the race.
You can never be sure of being success-
ful until you have crossed the fi nish line.
COVERSTORY
14
www.tradersonline-mag.com 11.2013
A Trader’s RetirementHowever, traders have not really made it until they end
their trading career. After all, as long as you are trading
there is the risk of losing it all. A prominent example of this
is Jesse Livermore. He is considered to be one of trading’s
luminaries, but he lost 95 per cent of his fortune and took
his own life. No matter how profitable a trader you may
have been in the past, it’s only when you have finally
retired from trading and passively receive an income from
dividends, interest payments, rents et cetera (and are still
alive), that you have crossed “the finish line” for good.
Never Give Up“It’s hard to beat a man who never gives up” – This is
something that the legendary baseball player Babe Ruth
knew all about years ago. You need to stay the course
until you have reached your goal (and then set yourself a
new one). Along the way, you will encounter all sorts of
difficulties. Consider these as a “test” to see if you really
believe in your project. You need to pass these tests by
not giving up in the face all the challenges.
In triathlon, for example, you may get hurt in training.
Depending on how bad your injury is, you will need to take
a break for a shorter or longer period of time. Your process
will be interrupted, you will feel underworked and begin
to fret about your goal. But you can also see this as an
opportunity: Use the time out to look at the latest training
methods on Youtube, improve your diet, or take care of
all the things that have previously been left unattended
to for lack of time. Short time outs are sometimes helpful
for your body to regenerate by completely ridding it of all
training stimuli. If it is a long injury-related break, you will
need to push your goals back – but postponing them does
not mean abandoning them – as long as you continue to
be unwavering in your determination.
In trading, it is mainly the drawdown phases that
cause traders to have headaches. Always remember
this: There are traders that have ruined entire accounts
but still did not give up and were ultimately successful.
This, of course, requires a solid inner conviction that you
can come to hold through autosuggestion as described
earlier. You will not really have failed until you finally give
up – a decision that you do not need to make.
Join a ClubWhen you are among like-minded people, you can learn
significantly faster. As a triathlete, these are mainly
the training methods, nutrition tips and competition
processes. As a trader, you can join a group that exchanges
views on an informal basis, or even a live trading room
where you can directly watch experienced traders in
action. You will get to know other traders’ tactics and
methods and be able to develop your own system from
the things that you can use best for your own purposes.
The Real Enemy Is YourselfWhether it’s trading or triathlon, the bottom line is the
same: The real enemy is not the others nor general
conditions or the environment, but invariably you
yourself. Anyone who would like to be a successful trader
needs to conquer himself – overcome his weaknesses,
keep learning from his mistakes, and grit his teeth when
the next drawdown comes around. Defeating the thought,
“I’m at the end of my tether, why should I keep going now,
it’s hopeless” – this is the point at which you conquer
yourself. You will not regret it.
You Are Not Your SuccessesAt the end of the day, an important insight is here to
stay – both in trading and in triathlon: You are not your
successes – but not your failures either. Of course, you
will be affected by success or failure, but it is not your
identity.
Imagine, for example, having actually become rich
by trading. Nevertheless, your true identity (hopefully)
continues to be your “normal” life – your family, your
friends, your hobbies. In the event of failure this is
encouraging. It’s the same in triathlon: Imagine winning
the Ironman on Hawaii and being the big star in the scene
for years to come. But what are you going to do on the
day after the competition and the victory ceremony? You
will be going home to your family and your friends. You
are going to take a rest. And then you will continue with
your training process.
This is precisely the reason why you cannot be a
professional trader nor a professional triathlete for
the sake of money without loving the process. After
all, even if you are already successful, there is always
the question: What are going to do when you get up
tomorrow morning? «
Marko Graenitz
Marko Graenitz is a freelance author who writes about the stock market and trading. He conducts interviews with traders and writes professional articles on capital market anomalies and trading strategies.
M
Maias


INSIGHTS – TRADERS´ TALK
16
www.tradersonline-mag.com 11.2013
Carol Harmerwww.charmercharts.com
TRADERS´ TalkCarol Harmer has over 30 years’ experience of analysis and trading the world’s markets and is undoubtedly one of the most respected
technical analysts in the world today. Her career started in the early eighties, trading futures on the fl oor at LIFFE where she quickly
discovered Technical Analysis as a way to maximise profi ts. She was one of the fi rst traders on LIFFE to discover and study this form of
analysis and quickly became widely recognised as an expert in its use as well as highly profi table. This soon led to a position as Senior
Technical Analyst for Midland Bank. She was later head hunted for the role of Manager of Technical Analysis for Nomura Bank where
she was responsible for establishing a European technical department. She later became Head of Technical Trading at Credit Suisse
where she also continued to trade for the bank. Carol is also one of the fi rst TA’s from a bank to join the STA (The Society of Technical
Analysts) in the mid 80’s and has trained and worked with some of the UK’s leading technical analysts. In 1996 Carol returned to LIFFE
and launched ‘Charmer Charts’ to train independent traders in technical analysis, becoming the fi rst person to provide daily forecasts
for established traders on the trading fl oor. She became extremely well known and highly respected and enjoyed advising traders
throughout the day. She also made regular appearances on Bloomberg, CNBC and Reuters fi nancial TV and she continues to provide
her valued, expert opinion on the direction of fi nancial markets on CNBC today.
Patience Is a Virtue
» TRADERS :́ Hi Carol, thanks for taking the time to talk to us about your trading. To begin with can you tell me what your preferred products and markets for trading are?Harmer: I like S&P’s and most of the major currencies.
I think Euros and Cable (GBP/USD) are my preferred
currencies. I also like trading Gold.
TRADERS :́ Do you consider yourself a day trader, swing trader or position trader?Harmer: I’d like to say position trader. I think if you sit
back, know your levels, know what you want to do and
stay away from all the headless chicken noise you have a
better chance of success.
TRADERS :́ You started trading at LIFFE in the eighties. What was it like being a female trader in a very male dominated world? Harmer: Fantastic, as you can imagine. It was new,
exciting, and to be fair it was the fi rst step in women
actually being acknowledged and treated the same as
men. I was not a shrinking violet and I think this helped
me greatly. LIFFE traders were very much respected by
INSIGHTS – TRADERS´ TALK
17
the banks we worked for. It was hard, fast, but always
fair. And it allowed me to grow in a man’s world, and I
never had any problem at all being a women. If someone
smacked my bottom, he got it back twice as quick and
twice as hard. It was never taken seriously and this helped
me a lot. I was one of the guys, and so were the other
women who worked on the fl oor.
TRADERS :́ Is there any particular strategy or pattern that you follow?Harmer: No strategies as such. I just trawl through weekly
charts every Sunday. I write my levels out, so I have a
game plan, then I look at the daily charts, and see where
they correlate.
TRADERS :́ Can you provide an insight into your trading day? What information do you check fi rst and how does this impact on trade planning?Harmer: First thing obviously I check Asia, then as Europe
opens I let the momentum traders get out of my way. This
usually takes 15 to 20 minutes. Then I look at the pivot
points, Fibonacci levels, 60 min stochastics. If the market
then comes to a good buy/sell level, I react.
TRADERS :́ Risk management is key to a trader’s success. Can you tell how if you use stop-losses and if so how to set and manage the levels?Harmer: You always try and get a 3:1 ratio. This way you
run profi ts and limit losses. Personally I never set a stop-
loss unless I see it traded there twice. The fi rst time will be
stops taken out, nothing is worse than having that, then
the market going back in your favour, so if you do nothing
fi rst hit. Then it does it again. At least then you know you
are wrong. You have to be careful as algo systems are
planned to take stops out. Us traders have to be one step
ahead.
TRADERS :́ Do you have your own personal trading targets and time frames? For example do you set a limit for each day or let positions run over several days or weeks? Harmer: Totally depends. Because it is technical trading
it can take a day, several days, a few weeks to achieve
the target. As long as it is going in the right direction, the
trade is kept on.
TRADERS :́ Do you add to winning long positions?Harmer: Sometimes, you can average in and make
more money. But you can’t average every 20 pips or
so, that would be madness. You need to have targets.
Personally I would rather hit the target, come out of
a trade, go back in on a dip. That way you maximise
your profi ts and if Asia tanks overnight you don’t have
double the pain.
TRADERS :́ Do you favour any particular technical analysis systems to guide you – Bollinger bands, Fibonacci, Elliot Wave or anything else? Or do you have your own rules?Harmer: Elliott Wave, no way, it doesn’t work. I’ve tried
every system over the years, and I fi nd the KISS way
better: keep it stupid simple. I use Fibonacci, Pivot
points, and good old support and resistance levels.
Don’t try and over complicate a market. Strip it down
to basics and you would be surprised at what you can
achieve.
TRADERS :́ When talking to early stage traders, what is the most important advice you give for becoming a successful trader?Harmer: Patience, patience, patience. That is what lets
most traders down. They want to do as many trades as
possible. If you have made money in the fi rst hour of
trading walk away. You do not have to sit there day in day
out in front of a screen trading 20/30/40 times a day. It’s
madness, and you will lose money.
TRADERS :́ And what about currencies, do you foresee any big changes in Forex markets this last quarter?Harmer: Lets hope the run up to Christmas will see more
of a move in Currencies. I think it will, as we have been
really quiet the latter part of the year.
TRADERS :́ Thank you Carol, good luck and we hope to talk to you again soon.
For further information about Carol Harmer´s reports and
training services visit www.charmercharts.com. On Friday
22nd November, Carol will offer a full day live workshop near
her home in Marbella, Southern Spain. For details – visit
www.marbellaschooloftrading.com «
If you have made money
in the fi rst hour of trading walk away.
INSIGHTS
18
www.tradersonline-mag.com 11.2013
Trading Seasonality’s
In the US, there is an important holiday when all the family members sit around the table and feast.
That’s Thanksgiving Day. A seasonality that has been known for decades has often ensured that on the
following Friday – the so-called “Black Friday” – traders had enough money in their pockets to do their fi rst
Christmas shopping of the season. The two most promising candidates will be presented in this article.
Part 4: Thanksgiving Seasonality Good for Nasdaq 100 and Gold
» During the so-called “Thanksgiving
rally”, you would normally go long
on the Wednesday preceding this
holiday and close the corresponding
position on the Friday of the
following week. However, we have
found that it is better to enter on
the Monday between 15th and 22nd
November and smooth this position
after exactly ten days.
The Thanksgiving rally pattern
has been known for more than 30
years. Consequently, it pays to buy
a little earlier since by now very
many traders have joined this short-
term trade. This year, the buy signals
need to be implemented on 18th
November. Normally, the strategy
is to be traded without any stop-
loss orders since there are exit days
on which to close your position.
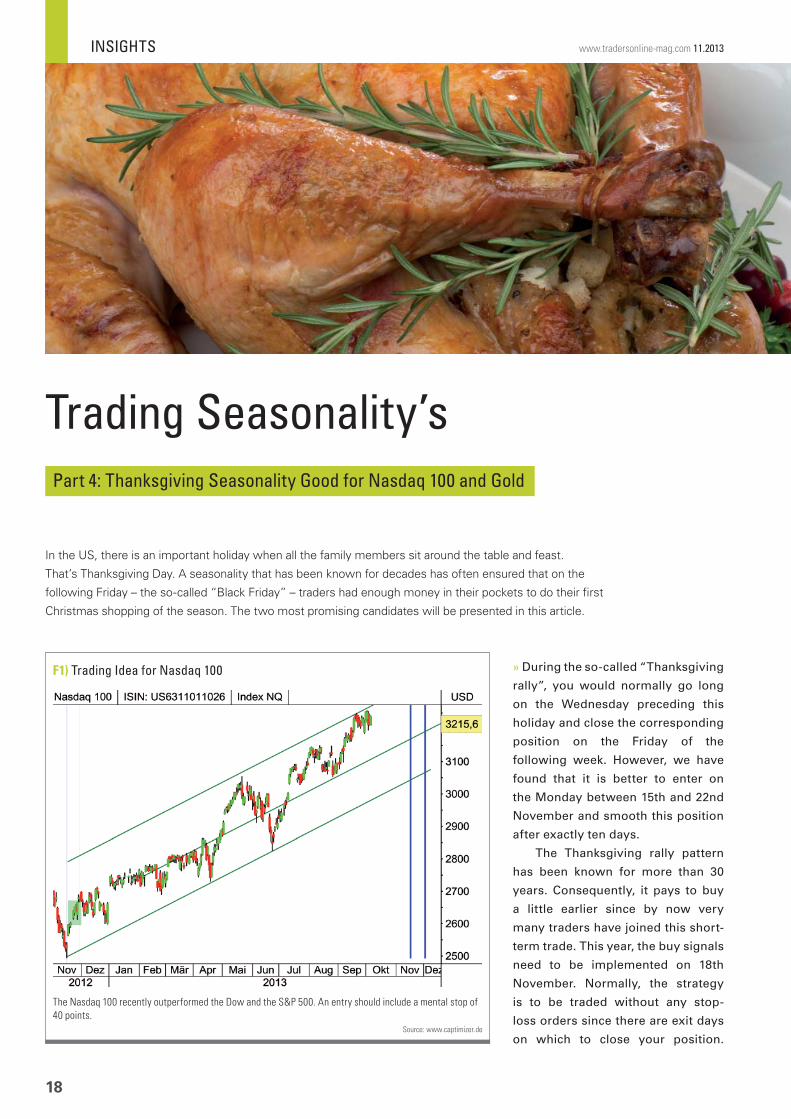
F1) Trading Idea for Nasdaq 100
The Nasdaq 100 recently outperformed the Dow and the S&P 500. An entry should include a mental stop of
40 points.
Source: www.captimizer.de
INSIGHTS
19
INSIGHTS
19
On 19th November, you will fi nd a video analysis in the
forum of the TRADERS’ website which also shows the entire
system statistics of this strategy for other important indices.
Video Update
Should the markets go into crash
mode, however, we recommend
that an overnight stop be used at the
distance of a particular point size.
Trading Idea for Nasdaq 100Wall Street has been showing signs
of weakness for a few weeks. Only
the Nasdaq 100 Index has bravely
hung on at a high level. So if you
want to make active use of the
Thanksgiving rally, the Nasdaq 100
would be a candidate for it. In the
last ten years there have only been
three losses with 2008 showing the
maximum loss at -3.08 per cent. In
the last three years it was possible to
make quite a bit of money using this
strategy. A corresponding position
should be actively monitored and
smoothed in the event of a loss of
more than 40 points below the entry
price. The average profit was 3.18
per cent, while a loss amounted to a charge of -1.18 per
cent on the account. The hit rate in the last ten years was
70 per cent with a profit factor of 6.25.
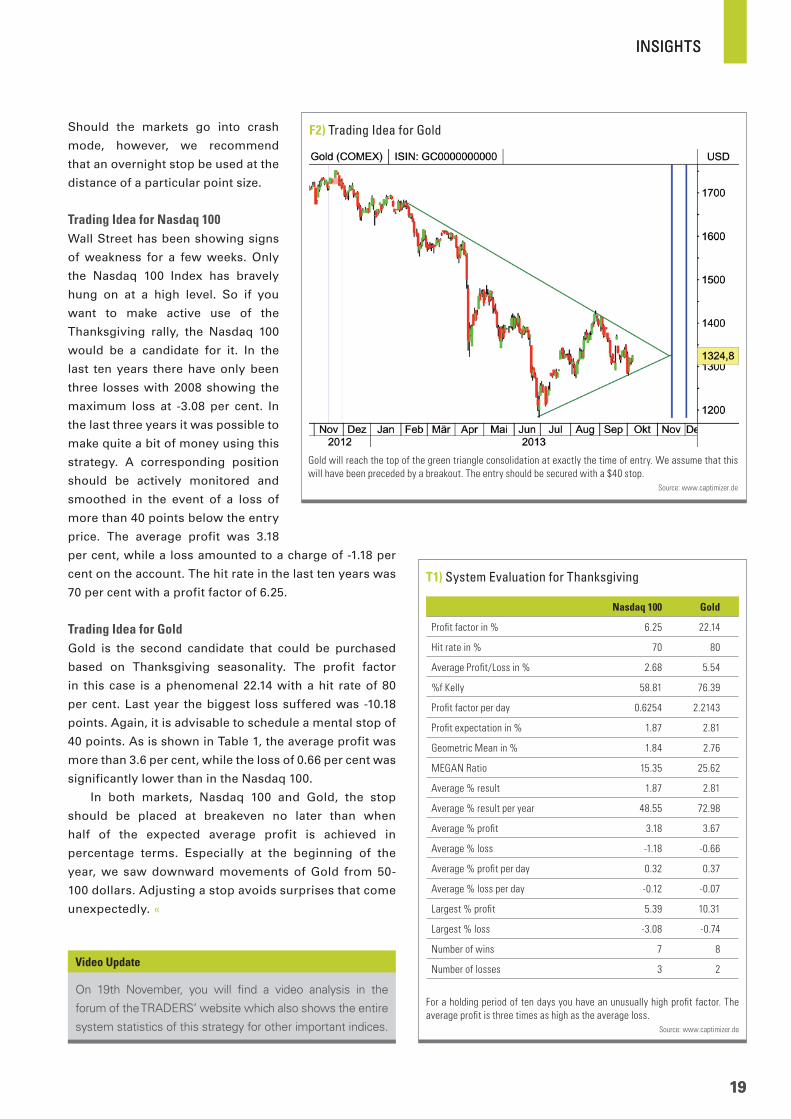
Trading Idea for GoldGold is the second candidate that could be purchased
based on Thanksgiving seasonality. The profit factor
in this case is a phenomenal 22.14 with a hit rate of 80
per cent. Last year the biggest loss suffered was -10.18
points. Again, it is advisable to schedule a mental stop of
40 points. As is shown in Table 1, the average profit was
more than 3.6 per cent, while the loss of 0.66 per cent was
significantly lower than in the Nasdaq 100.
In both markets, Nasdaq 100 and Gold, the stop
should be placed at breakeven no later than when
half of the expected average profit is achieved in
percentage terms. Especially at the beginning of the
year, we saw downward movements of Gold from 50-
100 dollars. Adjusting a stop avoids surprises that come
unexpectedly. «
F2) Trading Idea for Gold
Gold will reach the top of the green triangle consolidation at exactly the time of entry. We assume that this
will have been preceded by a breakout. The entry should be secured with a $40 stop.
Source: www.captimizer.de
For a holding period of ten days you have an unusually high profi t factor. The
average profi t is three times as high as the average loss.
Source: www.captimizer.de
Nasdaq 100 Gold
Profi t factor in % 6.25 22.14
Hit rate in % 70 80
Average Profi t/Loss in % 2.68 5.54
%f Kelly 58.81 76.39
Profi t factor per day 0.6254 2.2143
Profi t expectation in % 1.87 2.81
Geometric Mean in % 1.84 2.76
MEGAN Ratio 15.35 25.62
Average % result 1.87 2.81
Average % result per year 48.55 72.98
Average % profi t 3.18 3.67
Average % loss -1.18 -0.66
Average % profi t per day 0.32 0.37
Average % loss per day -0.12 -0.07
Largest % profi t 5.39 10.31
Largest % loss -3.08 -0.74
Number of wins 7 8
Number of losses 3 2
T1) System Evaluation for Thanksgiving

INSIGHTS
20
www.tradersonline-mag.com 11.2013
The Unhappy Marriage of the Market and the Government
The relationship between governments and the markets is tense and can wipe billions from the market. When rumours
that missiles had been fi red at Syria hit the market the FTSE-100 plunged. Private investment guru Clem Chambers, CEO of
ADVFN.com and author of “ADVFN Guide: A Beginner’s Guide to Value Investing”, takes a look at recent events and relates
them to tested market theory.
Clem Chambers
Clem Chambers is CEO of ADVFN (www.advfn.com) and author of several books such as “101 Ways to Pick Stock Market Winners” and “A Beginner‘s Guide to Value Investing“.
C
CaPt
enough you reach the desire of Western governments to
grow. Growth has to be funded – and the easy route is
via credit expansion. More credit creates an increased
tax base which can be tapped. That way, with more
credit you can tax the future and push the problem from
the present.
However, credit growth causes a cycle of boom and
bust especially when the output of the application of
credit is tapped off into the non-wealth creating public
sector. One of the problems with growing the public
sector is that as it gets bigger it gets harder to control. At
some point it gets out of control altogether.
» The depression that the West is slowly climbing out
of has a long chain of causality. If you follow it back far
How an Overactive Government Bent on War Can Wreck Your Portfolio

INSIGHTS
21
Such runaway government becomes a law unto itself
and cannot be diverted or reined in by elected politicians.
It takes on a purpose of little more than self-fulfilment.
It will likely continue to grow, barely checked and often
to the detriment of the markets. Runaway government is
what killed the Soviet bloc, and it is now one of the key
chronic problems facing the West.
Markets and government are intrinsically linked.
Business people think they are tough and smart, which
is why they are often tempted into politics. However,
they are slouches compared to politicians and often
get eaten alive in the realm of politics and government.
This is why you should never back business against
government.
Just a Coincidence?Director’s Buying At the Same Time
Government will always win. Politicians wipe out whole
industries, lock people in jail, go to war etc; business has
no real power against government when push comes to
shove. This is why you should listen to government and
trade their position. What they say ultimately goes. But
government is also slow to react so, if you can define the
political course set upon, you can trade it for a long time
and let it build.
This goes for all investments from Forex right down
to small companies. The leviathan of government sets
the agenda for a country’s economy; it is one of those big
pictures. If government is green, buy into wind farms. If it
is socialist invest in nursing homes and bridge builders. It’s
not that difficult. It is simply extremely hard to downsize
government once it has been grown. Turkey’s do not vote
for Christmas, and neither do politicians. Traders are left
out in the cold waiting for the changes needed to help the
market grow.
The United States has suffered from runaway
government more than most. It, for instance, spends
$100m a year counting and measuring trees. This
particularly stands out in its military sector where it is
said to spend more money than the next 18 countries
on defence, whilst 14 of those countries are said to be
allies. It has so much military it cannot control its own
aggression, and this has had a dramatic effect on the
United States’ economy and markets.
Will It Mean Governments Need to Shrink?Interest Rates On the Rise
The United States’ military action in the last decade has
created 1/3rd of the whole US national debt. There would
be no debt ceiling issue or sequester without the vast
drain on American resources created by fighting in two
countries whose total GDP was less than 0.3 per cent of
the USA’s GDP – just think of how the market could be
booming in this alternate reality!
The US has spent the equivalent of 100 years’ worth
of Afghan and Iraqi GDP on trying to win its Middle
East argument. This is a stand out example of runaway
government and lost wealth creating opportunity. But
just like the bubbles of credit, this kind of behaviour
caused by runaway government is not sustainable. The
end of the road is in sight as with wealth depleted, reality
sets in. Reality is a platform for growth, the dissipation of
perpetual war is not.
It is clear interest rates are going up and they will
rise and with it debt laden governments will have to
shrink whether from good housekeeping or necessity,
and this will likely free up resources for wealth creation.
The US needs to rebuild its shattered reputation and
restructure its economy and it is likely that it can and
will. If it will only do this by getting back to what it used
to do so well, which is back to business. This will be
excellent news for the world and your portfolio. Also,
if it avoids getting embroiled in a conflict it can’t afford
and can’t win, it will be a positive sign that the US can
start to rebuild itself, at a juncture where it is realistic
to imagine that it will, on its current trajectory, lose its
primacy in the world.
Perhaps some would think the prospect of the US
fighting itself into standstill and economic collapse would
be a good thing. However the world will be a safer place
if there is to be a return to economic growth in the west
rather than further degeneration as that can only lead
to more conflict. As such, the initial underwhelming
response to intervention in Syria was a good omen for
the future. The indicators that the great depression is
coming to a close and coming thick and fast, but there
have to be fundamental drivers to maintain the recovery
outside the creation of new money through central bank
intervention.
ConclusionNew money only creates wealth if there is the economic
environment to apply the capital for private sector
growth. Accordingly, the West needs to shift the balance
back towards the private sector and the United States
stepping back from its doctrine of perpetual war would
be an important and positive change. If it does step back
from the doctrine of perpetual war, the world will be a
better and a richer place and the United States’ economic
decline may be halted. «

INSIGHTS
22
www.tradersonline-mag.com 11.2013
The Halloween Effect
The Halloween effect states that stocks should be purchased at the end of October and sold at the beginning of May. For all
those who have their doubts about this market anomaly, Prof Jacobsen of Massey University has published a study proving
beyond any doubt that such an anomaly does exist. This article gives a short overview of the results as well as of further
improving approaches.
Good Times ahead? – New Evidence
Thomas Hupp
Thomas Hupp, along with Michael Uhl, is the initiator of the MSF 4D asset oscillator fund of funds and an adjunct professor of Asset Man-agement at Loerrach University of Cooperative Education in Germany. Since 1996, he has been studying investment strategies, focusing – since 2008 – on seasonal effects of ineffi cient stock markets.
www.asset-oszillator.de
T
TifaEsss
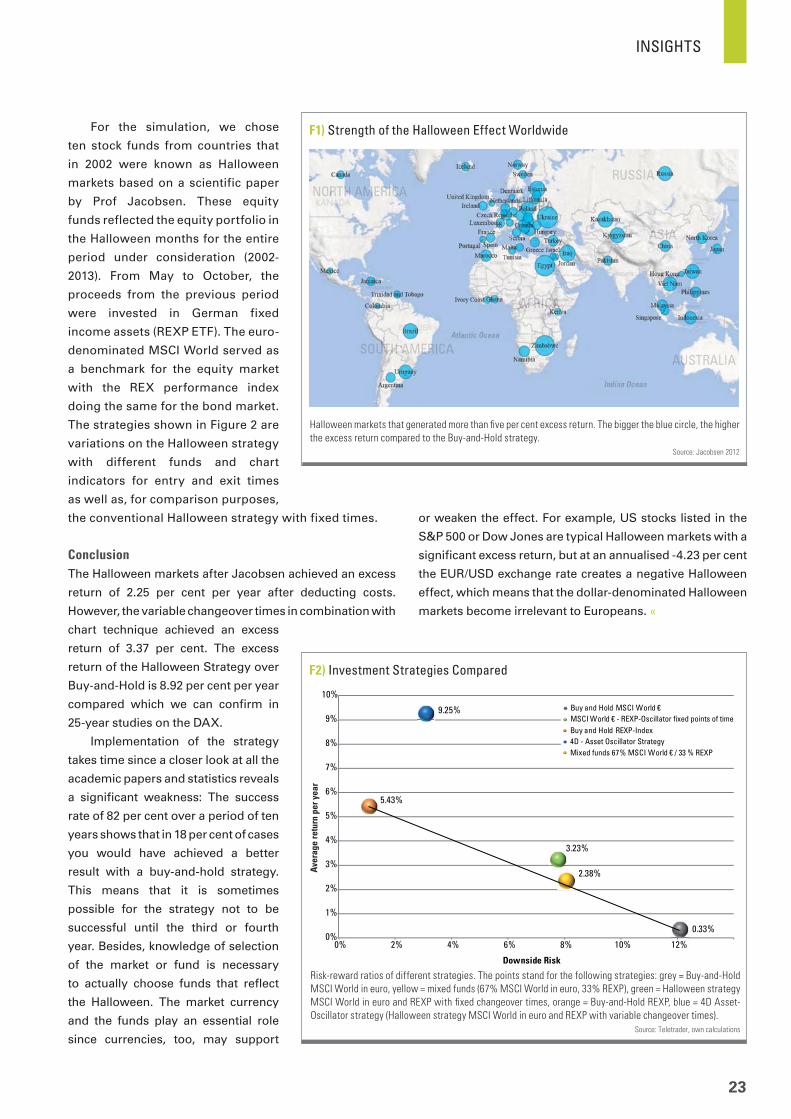
in 35 of these countries the anomaly is statistically
significant.
The scientific rigour applied to achieve such results is
outstanding and beyond any criticism. Even when the time
factor is taken into account, the Halloween effect stands
up. To prove this, Jacobsen examined both 300-and 60-
year periods as well as rolling 2.5 and 10-year periods
to find out that in 82 per cent of all cases, the Halloween
effect generated significantly higher returns than a Buy-
and-Hold strategy. These findings, in particular the insight
into which stock markets are suitable for a Halloween
strategy, are helpful for investors (see Figure 1).
Selecting markets may be simple: Just take ten to 16
significant countries from the Jacobsen study, find the
appropriate ETFs and buy these at the time of entry. The
timing may be simple, too: Buy the ETFs or certificates on
31st October and sell them on 1st May.
Regarding timing we conducted a long term study
covering a period of 40 years that suggested that the
month of July was a better time to exit (see TRADERS´
07/2013). Then, we carried out quite a few studies using
indicators to find out the best times for entry and exit.
Here the results generated by technical analysis were the
more successful ones.
To determine how fund selection and technical
analysis operate together, we have combined both results
in a simulation.
Bouman, S, & Jacobsen, B ( 2002):
The Halloween Indicator, Sell in May and go Away: Another
Puzzle
Jacobsen, B, & Zhang, C (2012 ):
The Halloween Indicator: Everywhere and All the Time
Sources
» Using all available share prices data, he analysed 108
stock markets in different places and over different
time periods. The upshot was that there is such a thing
as the Halloween effect in nearly every stock market
in the world. In 81 countries returns are higher from
November to April than during the rest of the year, and
INSIGHTS
23
For the simulation, we chose
ten stock funds from countries that
in 2002 were known as Halloween
markets based on a scientific paper
by Prof Jacobsen. These equity
funds reflected the equity portfolio in
the Halloween months for the entire
period under consideration (2002-
2013). From May to October, the
proceeds from the previous period
were invested in German fixed
income assets (REXP ETF). The euro-
denominated MSCI World served as
a benchmark for the equity market
with the REX performance index
doing the same for the bond market.
The strategies shown in Figure 2 are
variations on the Halloween strategy
with different funds and chart
indicators for entry and exit times
as well as, for comparison purposes,
the conventional Halloween strategy with fixed times.
ConclusionThe Halloween markets after Jacobsen achieved an excess
return of 2.25 per cent per year after deducting costs.
However, the variable changeover times in combination with
chart technique achieved an excess
return of 3.37 per cent. The excess
return of the Halloween Strategy over
Buy-and-Hold is 8.92 per cent per year
compared which we can confirm in
25-year studies on the DAX.
Implementation of the strategy
takes time since a closer look at all the
academic papers and statistics reveals
a significant weakness: The success
rate of 82 per cent over a period of ten
years shows that in 18 per cent of cases
you would have achieved a better
result with a buy-and-hold strategy.
This means that it is sometimes
possible for the strategy not to be
successful until the third or fourth
year. Besides, knowledge of selection
of the market or fund is necessary
to actually choose funds that reflect
the Halloween. The market currency
and the funds play an essential role
since currencies, too, may support
Halloween markets that generated more than fi ve per cent excess return. The bigger the blue circle, the higher
the excess return compared to the Buy-and-Hold strategy.
Source: Jacobsen 2012
F1) Strength of the Halloween Effect Worldwide
Risk-reward ratios of different strategies. The points stand for the following strategies: grey = Buy-and-Hold
MSCI World in euro, yellow = mixed funds (67% MSCI World in euro, 33% REXP), green = Halloween strategy
MSCI World in euro and REXP with fi xed changeover times, orange = Buy-and-Hold REXP, blue = 4D Asset-
Oscillator strategy (Halloween strategy MSCI World in euro and REXP with variable changeover times).
Source: Teletrader, own calculations
F2) Investment Strategies Compared
0.33%
5.43%
2.38%
3.23%
9.25%
0%
1%
2%
3%
4%
5%
6%
7%
8%
9%
10%
0% 2% 4% 6% 8% 10% 12%
Downside Risk
Buy and Hold MSCI World €
Buy and Hold REXP-Index
Mixed funds 6 7 % MSCI World € / 33 % REXP
MSCI World € - REXP-Oscillator fixed points of time
4D - Asset Oscillator Strategy
Aver
age
retu
rn p
er y
ear
or weaken the effect. For example, US stocks listed in the
S&P 500 or Dow Jones are typical Halloween markets with a
significant excess return, but at an annualised -4.23 per cent
the EUR/USD exchange rate creates a negative Halloween
effect, which means that the dollar-denominated Halloween
markets become irrelevant to Europeans. «

INSIGHTS – NEWS
24
www.tradersonline-mag.com 11.2013
cent), according to news and
social media sentiment analysis,
but regional differences have
widened since the second
quarter. So the institutions in
Europe/UK saw modest third-
quarter improvement in trust
sentiment from -1.5 to -1.0 per
cent, and are now on par with
the Asian institutions which have
led in trust scores for virtually
all of 2013 (at -1.0 per cent for
both quarters). At -1.6 per cent
the institutions in North America
were fl at for the quarter, but had
the lowest levels of confi dence
overall. On the other hand,
the fi nancial metrics indicate
increased confi dence in the sector, but regulatory activity
shows no sign of abating.
Source: www.thomsonreuters.com
ALPARI SPONSORS WEST HAM UNITED FC
As part of its recently announced sponsorship of West Ham United FC for the
2013/2014 season, Alpari held a charity event benefi tting “The English Theatre”
in Frankfurt. As part of a friendly match against FSV Mainz 05, the entire West
Ham team signed the new team jersey with the Alpari logo. The jersey was later
auctioned off by West Ham fans, which raised proceeds of more than 1600 euros
– including a donation by Alpari – all of which was gifted to the “English Theatre”
in Frankfurt.
Source: www.alpari.co.uk
POSSIBILITIES OF US DOWNGRADE
The latest fi scal showdown in Washington could spark
another downgrade of the U.S. credit rating even after the
recent resolution, but investors aren’t sweating it. Standard &
Poor’s made headlines and roiled world markets following the
last debt ceiling crisis, in 2011, when it cut the United States’
sterling AAA rating to AA+. The rating agency cited concerns
about the nation’s long-term debt and its dysfunctional policy
making. But two years later, that downgrade has had little
lasting impact. As in 2011, the possibility of a debt ceiling
breach remains a scary prospect, but investors say the ratings
agencies are largely an afterthought in the current crisis.
The rating agencies took hits to their reputations following
the fi nancial crisis, having failed to fl ag signs of trouble in
the housing market ahead of the crash. Five years later, the
effects of these mistakes are still lingering.
Source: money.cnn.com; by James O’Toole
TRUST IN GLOBAL FINANCIAL INSTITUTIONS REMAINS NEGATIVE
Thomson Reuters announced the results of its proprietary
Trust Index showing that trust in the Top 50 Global Financial
institutions remained negative in the third quarter (-1.5 per
INSIGHTS – NEWS
26
www.tradersonline-mag.com 11.2013
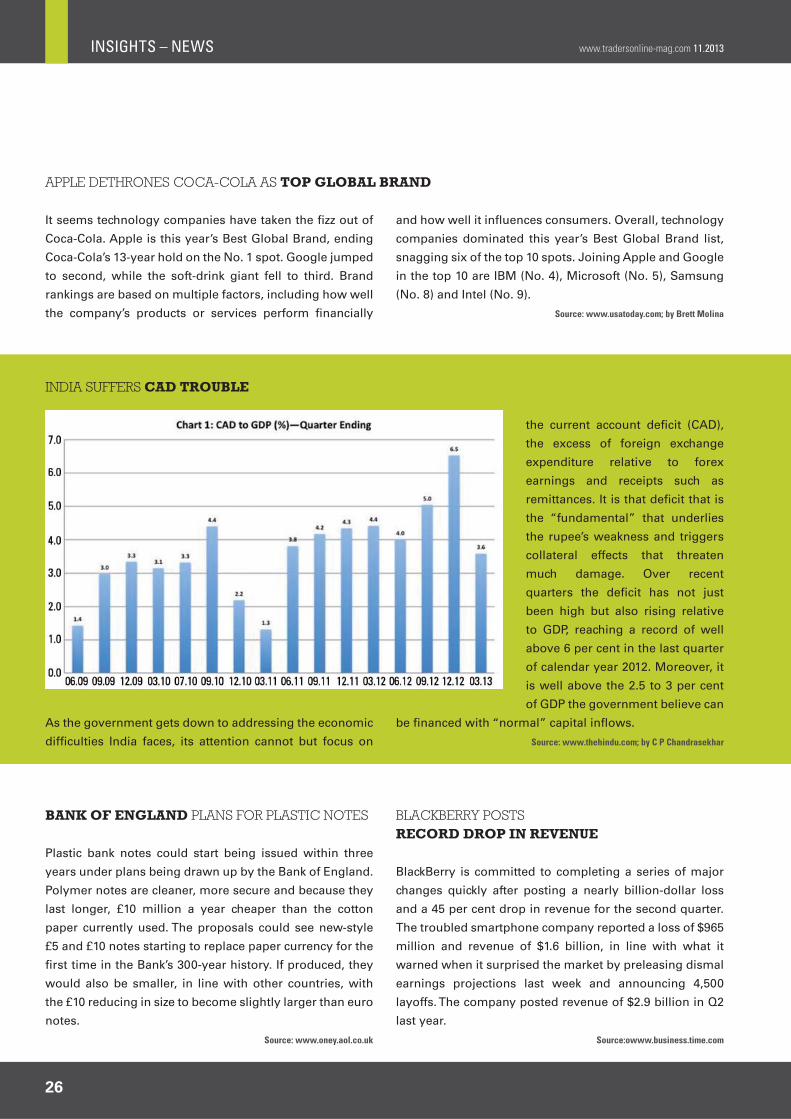
the current account defi cit (CAD),
the excess of foreign exchange
expenditure relative to forex
earnings and receipts such as
remittances. It is that defi cit that is
the “fundamental” that underlies
the rupee’s weakness and triggers
collateral effects that threaten
much damage. Over recent
quarters the defi cit has not just
been high but also rising relative
to GDP, reaching a record of well
above 6 per cent in the last quarter
of calendar year 2012. Moreover, it
is well above the 2.5 to 3 per cent
of GDP the government believe can
be fi nanced with “normal” capital infl ows.
Source: www.thehindu.com; by C P Chandrasekhar
It seems technology companies have taken the fi zz out of
Coca-Cola. Apple is this year’s Best Global Brand, ending
Coca-Cola’s 13-year hold on the No. 1 spot. Google jumped
to second, while the soft-drink giant fell to third. Brand
rankings are based on multiple factors, including how well
the company’s products or services perform fi nancially
INDIA SUFFERS CAD TROUBLE
As the government gets down to addressing the economic
diffi culties India faces, its attention cannot but focus on
BANK OF ENGLAND PLANS FOR PLASTIC NOTES
Plastic bank notes could start being issued within three
years under plans being drawn up by the Bank of England.
Polymer notes are cleaner, more secure and because they
last longer, £10 million a year cheaper than the cotton
paper currently used. The proposals could see new-style
£5 and £10 notes starting to replace paper currency for the
fi rst time in the Bank’s 300-year history. If produced, they
would also be smaller, in line with other countries, with
the £10 reducing in size to become slightly larger than euro
notes.
Source: www.oney.aol.co.uk
BLACKBERRY POSTSRECORD DROP IN REVENUE
BlackBerry is committed to completing a series of major
changes quickly after posting a nearly billion-dollar loss
and a 45 per cent drop in revenue for the second quarter.
The troubled smartphone company reported a loss of $965
million and revenue of $1.6 billion, in line with what it
warned when it surprised the market by preleasing dismal
earnings projections last week and announcing 4,500
layoffs. The company posted revenue of $2.9 billion in Q2
last year.
Source:owww.business.time.com
and how well it infl uences consumers. Overall, technology
companies dominated this year’s Best Global Brand list,
snagging six of the top 10 spots. Joining Apple and Google
in the top 10 are IBM (No. 4), Microsoft (No. 5), Samsung
(No. 8) and Intel (No. 9).
Source: www.usatoday.com; by Brett Molina
APPLE DETHRONES COCA-COLA AS TOP GLOBAL BRAND
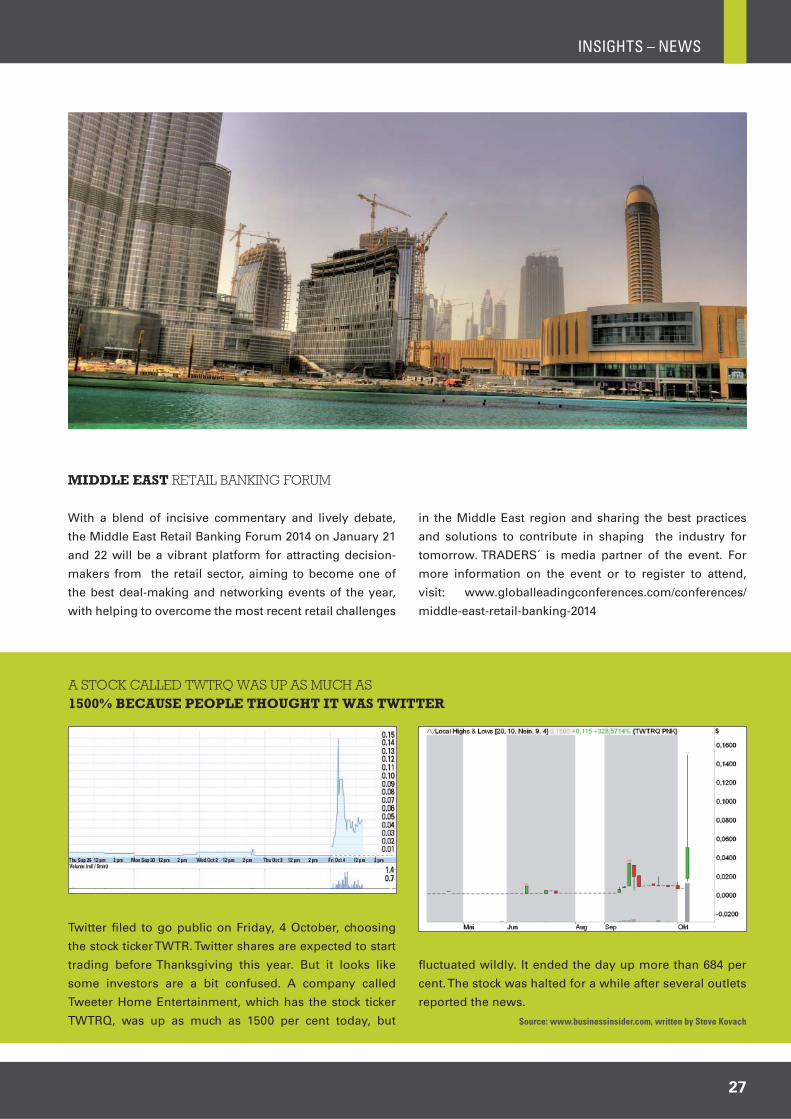
INSIGHTS – NEWS
27
A STOCK CALLED TWTRQ WAS UP AS MUCH AS1500% BECAUSE PEOPLE THOUGHT IT WAS TWITTER
Twitter fi led to go public on Friday, 4 October, choosing
the stock ticker TWTR. Twitter shares are expected to start
trading before Thanksgiving this year. But it looks like
some investors are a bit confused. A company called
Tweeter Home Entertainment, which has the stock ticker
TWTRQ, was up as much as 1500 per cent today, but
fl uctuated wildly. It ended the day up more than 684 per
cent. The stock was halted for a while after several outlets
reported the news.
Source: www.businessinsider.com, written by Steve Kovach
With a blend of incisive commentary and lively debate,
the Middle East Retail Banking Forum 2014 on January 21
and 22 will be a vibrant platform for attracting decision-
makers from the retail sector, aiming to become one of
the best deal-making and networking events of the year,
with helping to overcome the most recent retail challenges
in the Middle East region and sharing the best practices
and solutions to contribute in shaping the industry for
tomorrow. TRADERS´ is media partner of the event. For
more information on the event or to register to attend,
visit: www.globalleadingconferences.com/conferences/
middle-east-retail-banking-2014
MIDDLE EAST RETAIL BANKING FORUM

INSIGHTS – NEWS
28
www.tradersonline-mag.com 11.2013
WHY CRUDE PRICE IS FALLING
OPEC trimmed its 2014 forecast of demand for
crude produced by its 12 member countries
by 300,000 barrels per day to 29.61 million b/d
and left its estimate for this year unchanged at
29.93 million b/d. Both forecasts were below
the current level of production, which
had fallen to 30.23 million b/d in
August, a drop of 124,000 b/d
from July. On a quarterly basis,
OPEC sees the call on its own
crude averaging 30.3 million b/d in
the third quarter of 2013 and 30.72
million b/d in the fourth.
Source: www.platts.com; byMargaret McQuaile & Dan Lalor
LEADING US ECONOMIC INDICATORSROSE IN SPITE OF HIGHER BORROWING COSTS
An index of U.S. leading indicators advanced by more than
expected in August as the economy shrugged off higher
borrowing costs and the lingering impact of tax increases
and Washington budget cuts, that posed a headwind for
TWITTER DISCLOSEDFINANCIAL PRIVACY FOR IPO
Twitter has unsealed the documents for its planned initial
public offering of stock and hopes to raise up to $1 billion
in one of the year’s most eagerly awaited stock market
debuts. The documents revealed for the fi rst time how
much money the social networking company makes.
Founded in 2006, Twitter has never turned a profi t and has
an uninterrupted history of losses totalling $419 million
U.S. growth and hiring. Leading Economic Index gained
0.7 percent to 96.6 last month, compared to a 0.5 per cent
rise in July.
Source: www.dailyfi nance.com
since its inception. But its revenue is growing. Twitter
disclosed its fi led confi dential papers to start the IPO
process. The company was taking advantage of federal
legislation passed last year that allows companies with
less than $1 billion in revenue in its previous fi scal year to
avoid submitting public IPO documents.
Source: www.timesofi ndia.indiatimes.com
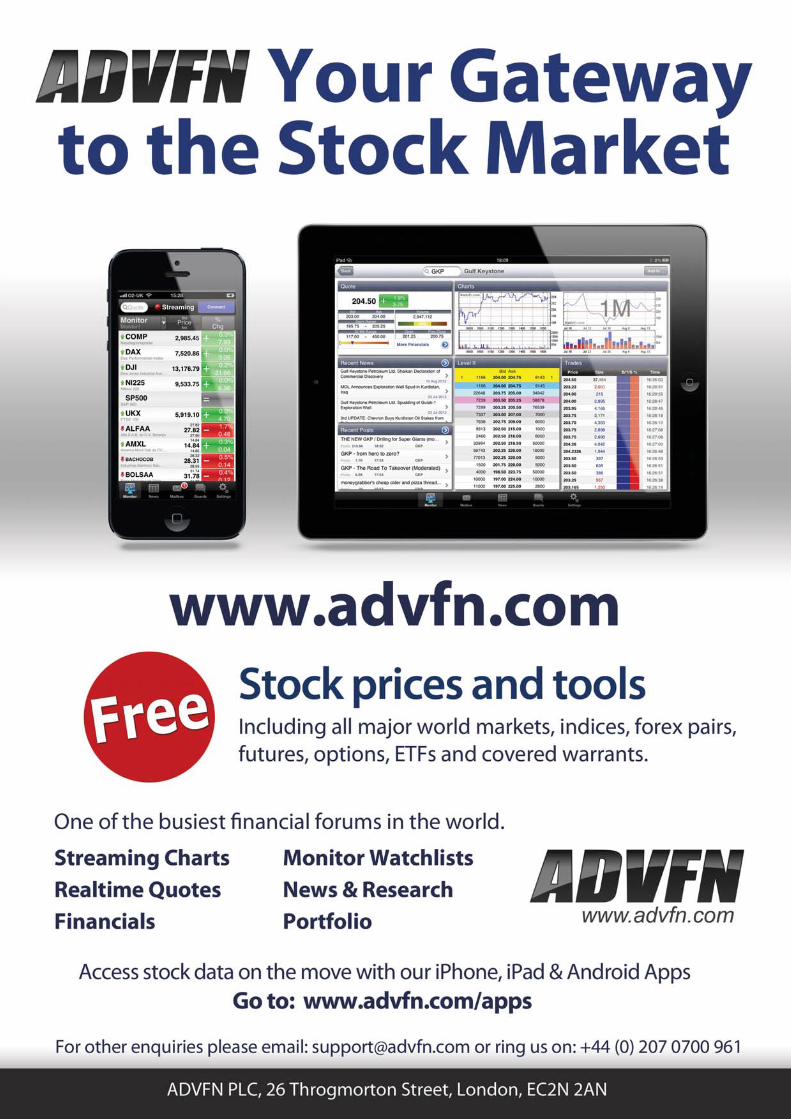
30
TOOLS www.tradersonline-mag.com 11.2013
30
News from the World of Technology
NEW PRODUCTS WEBREVIEW SOFTWAREREVIEW BOOKREVIEW APPVIEW
New Products
AbleSys´ AbleTrend
» Justine Williams-Lara, trader, educator, coach, author
of Trading Chaos, and president of Profitunity Trading
Group, has created a 90-minute DVD course on how to
count Elliott waves using simple and precise techniques
on current charts in all time frames and markets including
futures, stocks, ETFs, indexes, and forex. The DVD
includes real-time examples of counting Elliott waves. It
also teaches how to utilise Profitunity indicators such as
fractals and the Awesome Oscillator (AO) to help identify
the underlying structure of the current market. Even if a
trader already has a profitable trading system, the DVD
is designed to help improve the trader’s ability to spot
the immediate trend and fine-tune entries and exits.
Additional details can be found at www.profitunity.com
» KeyFutures has released a new app that allows the user
to look through the layers or legs of commodity spreads
on a mobile device. With its seasonal indicator, the user
can plan spread positions. It allows synchronisation
and backup of a spread’s settings and notes among all
the user’s devices through iCloud. The interface gives
the user tools for following and choosing spreads for
trading. Common technical analysis indicators can be
used, and the user can write notes and draw. A ruler tool
calculates price & time. For more information, please
visit www.key-futures.com
» AbleSys’ AbleTrend add-on for eSignal has been
released with eSignal version 11.6, built in as a part of
the new eSignal platform. AbleTrend indicators now
work seamlessly in eSignal along with other eSignal
indicators. AbleTrend provides specific buy, sell, stop,
and exit trading signals for any market – including
stocks, futures, forex, and more. A 30-day free trial
for the AbleTrend add-on for eSignal is available as
an introductory promotion. For more details, visit
www.ablesys.com
» Modulus has introduced Brainwave Trader, which
provides individualised neurofeedback training to help
traders enhance their trading performance and reduce
losses. Electroencephalography (EEG) signals are fed
from a headset into a software application, which
interprets the raw signals and correlates the trader’s
brainwave patterns with the trader’s profits & losses
in real-time, using a real-time market data connection.
The software allows the trader to trade normally while
brainwave patterns are being analysed. The results
could help the trader find the optimal state of mental
awareness that is most highly correlated with profitable
trading. The software costs $299. EEG headsets are
sold separately, starting at $79. For more details visit
www.modulusfe.com/brainwave
» Stricknet is a daily download service for stock option
data. The data contains all options for stocks and ETFs.
It offers more than ten years of historical options data.
The data includes option symbol, stock symbol, last sale,
volume, strike, bid, ask, open interest, year of expiration.
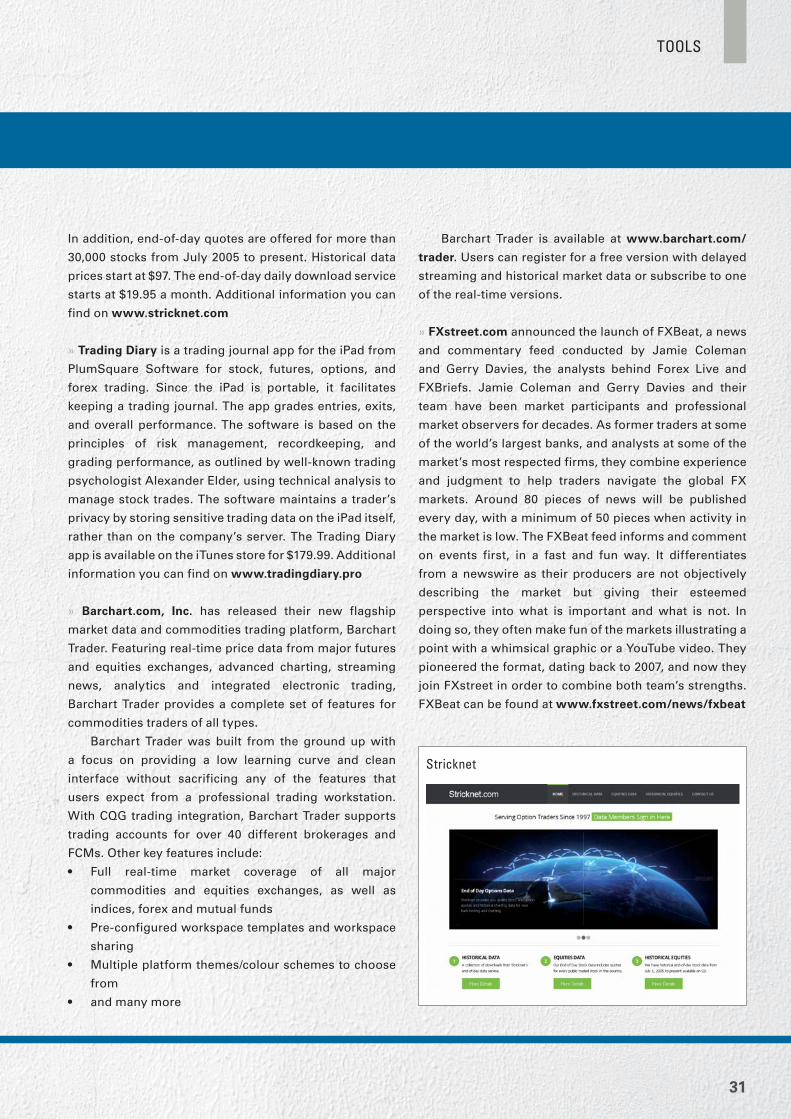
31
TOOLS
Stricknet
In addition, end-of-day quotes are offered for more than
30,000 stocks from July 2005 to present. Historical data
prices start at $97. The end-of-day daily download service
starts at $19.95 a month. Additional information you can
find on www.stricknet.com
» Trading Diary is a trading journal app for the iPad from
PlumSquare Software for stock, futures, options, and
forex trading. Since the iPad is portable, it facilitates
keeping a trading journal. The app grades entries, exits,
and overall performance. The software is based on the
principles of risk management, recordkeeping, and
grading performance, as outlined by well-known trading
psychologist Alexander Elder, using technical analysis to
manage stock trades. The software maintains a trader’s
privacy by storing sensitive trading data on the iPad itself,
rather than on the company’s server. The Trading Diary
app is available on the iTunes store for $179.99. Additional
information you can find on www.tradingdiary.pro
» Barchart.com, Inc. has released their new flagship
market data and commodities trading platform, Barchart
Trader. Featuring real-time price data from major futures
and equities exchanges, advanced charting, streaming
news, analytics and integrated electronic trading,
Barchart Trader provides a complete set of features for
commodities traders of all types.
Barchart Trader was built from the ground up with
a focus on providing a low learning curve and clean
interface without sacrificing any of the features that
users expect from a professional trading workstation.
With CQG trading integration, Barchart Trader supports
trading accounts for over 40 different brokerages and
FCMs. Other key features include:
• Full real-time market coverage of all major
commodities and equities exchanges, as well as
indices, forex and mutual funds
• Pre-configured workspace templates and workspace
sharing
• Multiple platform themes/colour schemes to choose
from
• and many more
Barchart Trader is available at www.barchart.com/
trader. Users can register for a free version with delayed
streaming and historical market data or subscribe to one
of the real-time versions.
» FXstreet.com announced the launch of FXBeat, a news
and commentary feed conducted by Jamie Coleman
and Gerry Davies, the analysts behind Forex Live and
FXBriefs. Jamie Coleman and Gerry Davies and their
team have been market participants and professional
market observers for decades. As former traders at some
of the world’s largest banks, and analysts at some of the
market’s most respected firms, they combine experience
and judgment to help traders navigate the global FX
markets. Around 80 pieces of news will be published
every day, with a minimum of 50 pieces when activity in
the market is low. The FXBeat feed informs and comment
on events first, in a fast and fun way. It differentiates
from a newswire as their producers are not objectively
describing the market but giving their esteemed
perspective into what is important and what is not. In
doing so, they often make fun of the markets illustrating a
point with a whimsical graphic or a YouTube video. They
pioneered the format, dating back to 2007, and now they
join FXstreet in order to combine both team’s strengths.
FXBeat can be found at www.fxstreet.com/news/fxbeat
TOOLS
32
www.tradersonline-mag.com 11.2013
32
Accurate Short-Term Market Forecasts Based on Global Intermarket Dynamics
NEW PRODUCTS WEBREVIEW SOFTWAREREVIEW BOOKREVIEW APPVIEW
TradeShark®
Most individual traders fi nd it diffi cult to compete with fi nancial institutions, commercials and professional traders on the
basis of fundamentals so they turn to charts and technical analysis and software to analyse the one element – price – that
incorporates everything known about a market. TradeShark goes a step further by analysing the underlying relationships
among markets and using this data to produce predictive indicators that reveal accurate short-term market forecasts without
requiring any programming or other complex steps.
» InstallationInstalling TradeShark is quick and easy (about five
minutes). Simply follow the directions that appear on
screen as you download and install. The suggested
system requirements are:
• Operating System: XP (SP3), Vista (SP1), 7, 8
• Processor: 1.4 GHz
• Memory: 1 GB (XP), 2 GB (Vista, 7)
• Screen Resolution: 1024x768
• Hard Disk: Approximately 1 GB of available hard-disk
space
Data ProviderThe TradersOnly DataCenter (TradersOnly.com) is the
preferred data provider for TradeShark. TradersOnly
provides inexpensive, top-quality market data for various
markets in the United States, Canada, India, Australia, and
the United Kingdom. The TradersOnly data is provided in
a format designed specifically for use with TradeShark to
make the data handling experience as transparent and
easy as possible.
OverviewTradeShark is unique, cutting-edge trading software
that applies the pattern recognition capabilities of
neural networks to intermarket analysis. The end result
is TradeShark’s ability to produce predictive, leading
technical indicators that make highly accurate, short-term
forecasts of price trends in forex, equities, commodities,
futures, and ETF markets around the globe.
Intuitively, traders know that today’s globally
interconnected markets have considerable influence on
each other. If understood, these multi-market connections
would give traders an unprecedented trading advantage.
This is particularly true now, as most traders continue
to focus narrowly on single-market technical indicators
that look primarily at one market at a time. While this
approach has been the mainstay of technical analysis for
decades, it fails to address these powerful intermarket
relationships that drive today’s global markets.
Yet, discovering these relationships and being able
to capitalise on them remains elusive for even those
traders aware of the intertwined nature of the global
markets, simply because there is no easy way for these
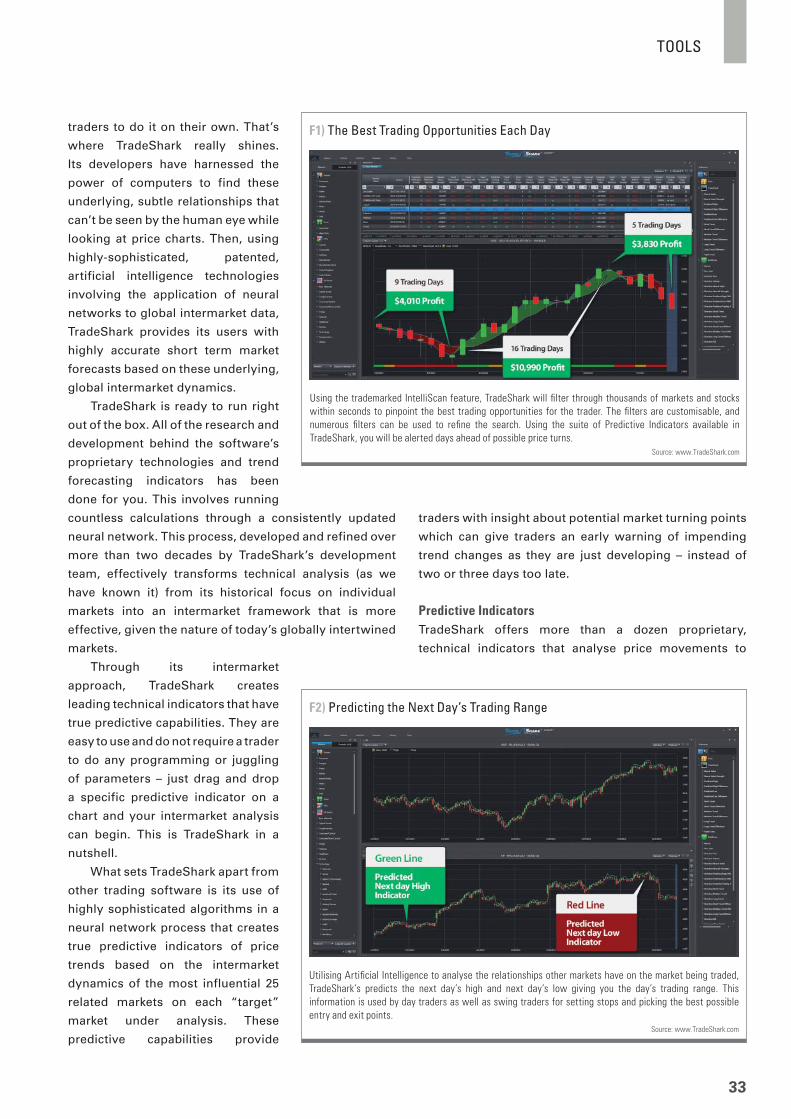
TOOLS
33
traders to do it on their own. That’s
where TradeShark really shines.
Its developers have harnessed the
power of computers to find these
underlying, subtle relationships that
can’t be seen by the human eye while
looking at price charts. Then, using
highly-sophisticated, patented,
artificial intelligence technologies
involving the application of neural
networks to global intermarket data,
TradeShark provides its users with
highly accurate short term market
forecasts based on these underlying,
global intermarket dynamics.
TradeShark is ready to run right
out of the box. All of the research and
development behind the software’s
proprietary technologies and trend
forecasting indicators has been
done for you. This involves running
countless calculations through a consistently updated
neural network. This process, developed and refined over
more than two decades by TradeShark’s development
team, effectively transforms technical analysis (as we
have known it) from its historical focus on individual
markets into an intermarket framework that is more
effective, given the nature of today’s globally intertwined
markets.
Through its intermarket
approach, TradeShark creates
leading technical indicators that have
true predictive capabilities. They are
easy to use and do not require a trader
to do any programming or juggling
of parameters – just drag and drop
a specific predictive indicator on a
chart and your intermarket analysis
can begin. This is TradeShark in a
nutshell.
What sets TradeShark apart from
other trading software is its use of
highly sophisticated algorithms in a
neural network process that creates
true predictive indicators of price
trends based on the intermarket
dynamics of the most influential 25
related markets on each “target”
market under analysis. These
predictive capabilities provide
Using the trademarked IntelliScan feature, TradeShark will fi lter through thousands of markets and stocks
within seconds to pinpoint the best trading opportunities for the trader. The fi lters are customisable, and
numerous fi lters can be used to refi ne the search. Using the suite of Predictive Indicators available in
TradeShark, you will be alerted days ahead of possible price turns.
Source: www.TradeShark.com
F1) The Best Trading Opportunities Each Day
traders with insight about potential market turning points
which can give traders an early warning of impending
trend changes as they are just developing – instead of
two or three days too late.
Predictive IndicatorsTradeShark offers more than a dozen proprietary,
technical indicators that analyse price movements to
Utilising Artifi cial Intelligence to analyse the relationships other markets have on the market being traded,
TradeShark’s predicts the next day’s high and next day’s low giving you the day’s trading range. This
information is used by day traders as well as swing traders for setting stops and picking the best possible
entry and exit points.
Source: www.TradeShark.com
F2) Predicting the Next Day’s Trading Range
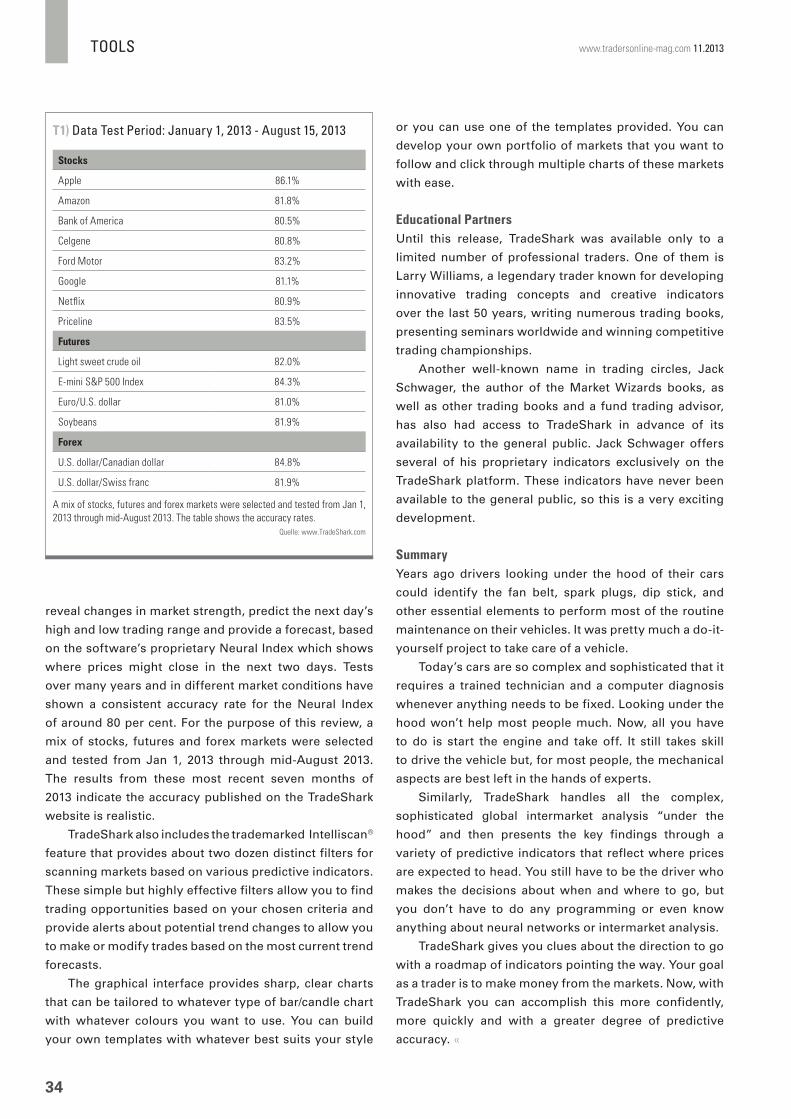
TOOLS
34
www.tradersonline-mag.com 11.2013
or you can use one of the templates provided. You can
develop your own portfolio of markets that you want to
follow and click through multiple charts of these markets
with ease.
Educational PartnersUntil this release, TradeShark was available only to a
limited number of professional traders. One of them is
Larry Williams, a legendary trader known for developing
innovative trading concepts and creative indicators
over the last 50 years, writing numerous trading books,
presenting seminars worldwide and winning competitive
trading championships.
Another well-known name in trading circles, Jack
Schwager, the author of the Market Wizards books, as
well as other trading books and a fund trading advisor,
has also had access to TradeShark in advance of its
availability to the general public. Jack Schwager offers
several of his proprietary indicators exclusively on the
TradeShark platform. These indicators have never been
available to the general public, so this is a very exciting
development.
SummaryYears ago drivers looking under the hood of their cars
could identify the fan belt, spark plugs, dip stick, and
other essential elements to perform most of the routine
maintenance on their vehicles. It was pretty much a do-it-
yourself project to take care of a vehicle.
Today’s cars are so complex and sophisticated that it
requires a trained technician and a computer diagnosis
whenever anything needs to be fixed. Looking under the
hood won’t help most people much. Now, all you have
to do is start the engine and take off. It still takes skill
to drive the vehicle but, for most people, the mechanical
aspects are best left in the hands of experts.
Similarly, TradeShark handles all the complex,
sophisticated global intermarket analysis “under the
hood” and then presents the key findings through a
variety of predictive indicators that reflect where prices
are expected to head. You still have to be the driver who
makes the decisions about when and where to go, but
you don’t have to do any programming or even know
anything about neural networks or intermarket analysis.
TradeShark gives you clues about the direction to go
with a roadmap of indicators pointing the way. Your goal
as a trader is to make money from the markets. Now, with
TradeShark you can accomplish this more confidently,
more quickly and with a greater degree of predictive
accuracy. «
A mix of stocks, futures and forex markets were selected and tested from Jan 1,
2013 through mid-August 2013. The table shows the accuracy rates.
Quelle: www.TradeShark.com
T1) Data Test Period: January 1, 2013 - August 15, 2013
Stocks
Apple 86.1%
Amazon 81.8%
Bank of America 80.5%
Celgene 80.8%
Ford Motor 83.2%
Google 81.1%
Netfl ix 80.9%
Priceline 83.5%
Futures
Light sweet crude oil 82.0%
E-mini S&P 500 Index 84.3%
Euro/U.S. dollar 81.0%
Soybeans 81.9%
Forex
U.S. dollar/Canadian dollar 84.8%
U.S. dollar/Swiss franc 81.9%
reveal changes in market strength, predict the next day’s
high and low trading range and provide a forecast, based
on the software’s proprietary Neural Index which shows
where prices might close in the next two days. Tests
over many years and in different market conditions have
shown a consistent accuracy rate for the Neural Index
of around 80 per cent. For the purpose of this review, a
mix of stocks, futures and forex markets were selected
and tested from Jan 1, 2013 through mid-August 2013.
The results from these most recent seven months of
2013 indicate the accuracy published on the TradeShark
website is realistic.
TradeShark also includes the trademarked Intelliscan®
feature that provides about two dozen distinct filters for
scanning markets based on various predictive indicators.
These simple but highly effective filters allow you to find
trading opportunities based on your chosen criteria and
provide alerts about potential trend changes to allow you
to make or modify trades based on the most current trend
forecasts.
The graphical interface provides sharp, clear charts
that can be tailored to whatever type of bar/candle chart
with whatever colours you want to use. You can build
your own templates with whatever best suits your style

LONDONQueen Elizabeth II Conference Centre8 – 1 0 N O V E M B E R 2 0 1 3
a Production of
JOH
N BU
RFORD
PETER SCHIFF
RALPH
ACA
MPO
RA
RUSS M
OU
LD
JOH
N BO
LLING
ER
SAN
DY JA
DEJA
DA
VID FU
LLER
MA
LCOLM
PRYOR
World MoneyShow Opening Ceremonies
SPECIAL KEYNOTE ADDRESS BY: JIM ROGERS
erence Centre
ERS
Easy to Register Free at www.WorldMoneyShowLondon.co.uk
or call 00 800 1414 8888 Today!Mention Priority Code 032531
To Exhibit: Call 00 800 9221 1344
Media Partner
ADVICE FROM TOP EXPERTS MAKES THE WORLD MONEYSHOW A MUST ATTEND EVENT:Attend and take home profitable ideas such as:
How to pick long-term winners:
Discover UK & European shares
Outlook for UK
How to select
NEW THIS YEAR! — 8 November FEATURES ALL-DAY TRADING EVENTS
Discover trading tips you can use today. You’ll get strategies like:
Forex
spot set-ups
Spread betting strategies
Finding trading patterns
WoWoWoWoWoWoWoWoWoWoWoWoWWW rlrlrlrlrlrlrlrlrlrlrlrlrr dddddddd d ddddd MMMMMMMMMMMMMMMononononononononononononnneyeyeyeyeyeyeyeyeyeyeyeyeyeyeyShShShShShShShShShShShShShShowowowowowowowowowowowowoww OOOOOOOOOOOOOpepepepepepepepepepepepepepep nininininininininininininn ngngngngngngngngngngngngngng CCCCCCCCCCCCCCerererererererererererererererememememememememememememememe onononononononononononononnieieieieieieieieieieieeeessssssssssssssWorld MoneyShow Opening Ceremonies

36
TOOLS www.tradersonline-mag.com 11.2013
Mike Bellafi ore is the co-founder of SMB Capital, a
proprietary trading fi rm in New York City; SMBU, their
education arm; and SMB Systems Trading, their algorithmic
trading division. He is the author of “the trading classic”
One Good Trade. His fi rm has regularly appeared on CNBC,
Bloomberg TV, CNN Money, Fox Business, the BBC, and in
the Wall Street Journal and the street.com. SMB’s trader
training program was highlighted on the TV documentary
Wall Street Warriors. An international lecturer, Mr. Bellafi ore
has built trader training programs globally for hedge funds,
prop trading desks, and retail traders, working with some
of the world’s largest traders. He lives on the Upper West
Side, with his wife and new born son.
About the Author
The Playbook An Inside Look at How to Think Like a Professional Traderby Mike Bellafi ore
NEW PRODUCTS WEBREVIEW SOFTWAREREVIEW BOOKREVIEW APPVIEW
it’s based on one of most successful trader training
programs – and it’s the closest thing to signing up for a
“trader boot camp“ yourself! You’ll learn by watching
new traders walk through actual trades, explain what
they’ve tried to do, and try to survive brutally tough
expert critiques.
One trade at a time, you’ll discover how
professional traders must think in order to succeed
“under fire,“ how they assess their own performance,
and how they work relentlessly to improve. Using
concrete, actionable setups drawn from his extensive
trading and training experience, Mike Bellafiore walks
through an extraordinary array of trades, showing
readers how to maximize profits and avoid disastrous
hidden pitfalls.
Bellafiore covers support plays, bull-and-bear flags,
opening drives, important intraday levels, bounce and
fade trades, pullbacks, scalps, technical opportunities,
consolidation, relative strength, market trades, and
more. He also presents indispensable insights on
» Want to become a truly great trader – either for
yourself or for a proprietary trading firm? This book
will help you get there. The only book of its kind,

37
TOOLS
Title: The Playbook
Subtitle: An Inside Look at How to Think Like a
Professional Trader
Author: Mike Bellafi ore
Pages: 448, Hardcover
Price: $ 47.99
ISBN: 978-0132937641
Release: July 19, 2013
Publisher: FT Press
Bibliography
psychology and trader development, based on his
work with hundreds of traders on a major commodity
exchange and an elite prop firm’s trading desk. Packed
with colour, personality, and realism, there’s never been
a more exciting guide to real-world trading – or a more
valuable one!
In this book, Mike Bellafiore will help you:
• Build a trading PlayBook that builds from your
strengths.
• Trade bigger, with a proprietary trading risk system.
• Develop a methodology to make trading decisions.
• Understand what it takes to be a pro trader by reading
about many successful pros from SMB Capital.
• Avoid “intern-level” mistakes their pro traders have
made in real-time.
• See the “Future of Trading” and what you need to do
to succeed.
• Remember to be grateful for your opportunity to
trade and invest. «
Title: The Playbook
Subtitle: An Inside Look at How to Think Like a
Professional Trader
BiBiiiblblblblioioiogrgrg apapapaphhyhyhyhy
n his
modity
acked
r been
more
your
stem.
ons.
ading

38
TOOLS www.tradersonline-mag.com 11.2013
NEW PRODUCTS WEBREVIEW SOFTWAREREVIEW BOOKREVIEW APPVIEW
Heatmaps StockTouchThe display of various market information as heatmap is gaining more and more popularity – no wonder, because traders
receive the most important market information visually. We tested the app StockTouch for our readers. The following article
shows how the tool works in practice and which functions are offered.
» Every active trader looks at the condition of the
market – in general he focuses on the development of
different sectors, ETFs as well as single stocks. The use
of watchlists as well as specific websites, that cover
the current market situation, are very common. You
get an even clearer picture with the help of so-called
“heatmaps”. The development of certain parameters
like price, volume or relative strength in relation to an
index are displayed in different colours and therefore
the trader gets all relevant information at one glance –
depending on his time frame. The app StockTouch from
Visible Market fulfils this requirements very well and the
newest version for the iPad and the iPhone is available
since June 2013.
Range of FunctionsStockTouch can be installed on the iPad directly from the
app store and can be used immediately. The first screen
clarifies the main function of this tool: heatmaps. Figure 1
shows that the standard settings display the 900 biggest
US-stocks according to their performance in various
colours. The division in nine sectors helps the user to get
a quick overview of price development. The time frame
ranges from one day to five years and therefore the app is
interesting for short term traders as well as the classical
investor.
The strength of the app in connection with a tablet
shows if you look closer at a certain stock of a sector:
With one touch on the screen you have an overview of the
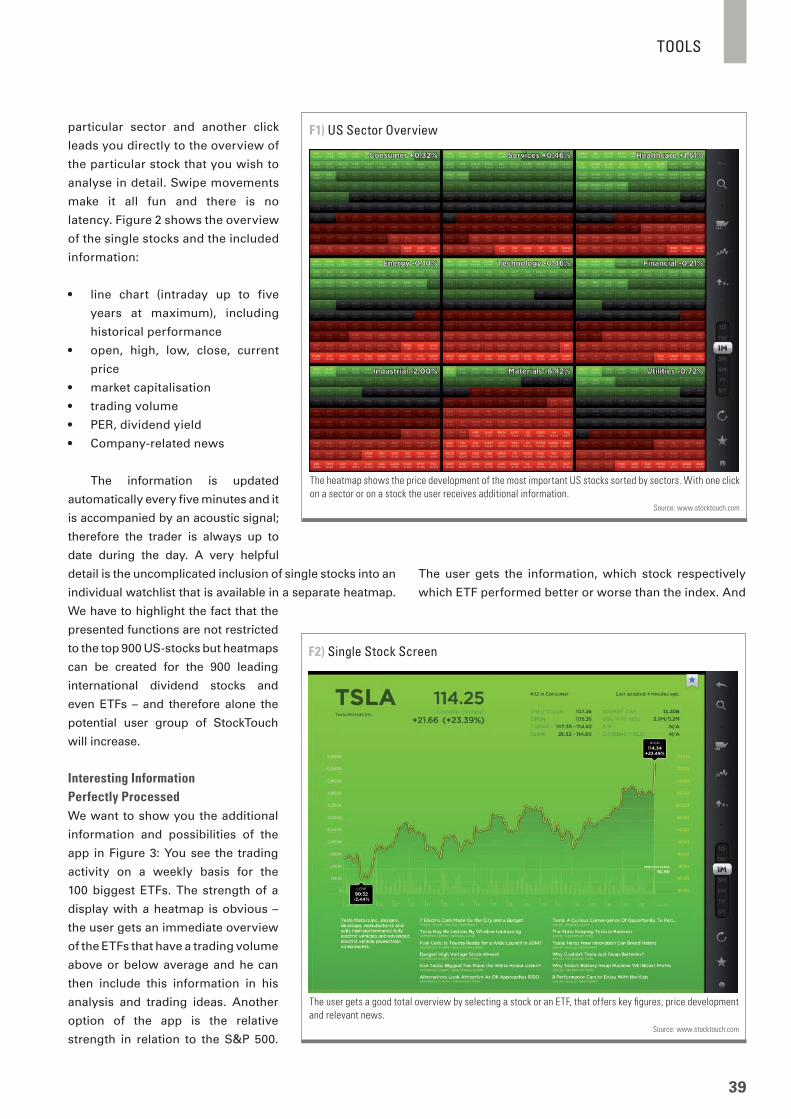
39
TOOLS
particular sector and another click
leads you directly to the overview of
the particular stock that you wish to
analyse in detail. Swipe movements
make it all fun and there is no
latency. Figure 2 shows the overview
of the single stocks and the included
information:
• line chart (intraday up to five
years at maximum), including
historical performance
• open, high, low, close, current
price
• market capitalisation
• trading volume
• PER, dividend yield
• Company-related news
The information is updated
automatically every five minutes and it
is accompanied by an acoustic signal;
therefore the trader is always up to
date during the day. A very helpful
detail is the uncomplicated inclusion of single stocks into an
individual watchlist that is available in a separate heatmap.
We have to highlight the fact that the
presented functions are not restricted
to the top 900 US-stocks but heatmaps
can be created for the 900 leading
international dividend stocks and
even ETFs – and therefore alone the
potential user group of StockTouch
will increase.
Interesting Information Perfectly ProcessedWe want to show you the additional
information and possibilities of the
app in Figure 3: You see the trading
activity on a weekly basis for the
100 biggest ETFs. The strength of a
display with a heatmap is obvious –
the user gets an immediate overview
of the ETFs that have a trading volume
above or below average and he can
then include this information in his
analysis and trading ideas. Another
option of the app is the relative
strength in relation to the S&P 500.
The heatmap shows the price development of the most important US stocks sorted by sectors. With one click
on a sector or on a stock the user receives additional information.
Source: www.stocktouch.com
F1) US Sector Overview
The user gets a good total overview by selecting a stock or an ETF, that offers key fi gures, price development
and relevant news.
Source: www.stocktouch.com
F2) Single Stock Screen
The user gets the information, which stock respectively
which ETF performed better or worse than the index. And
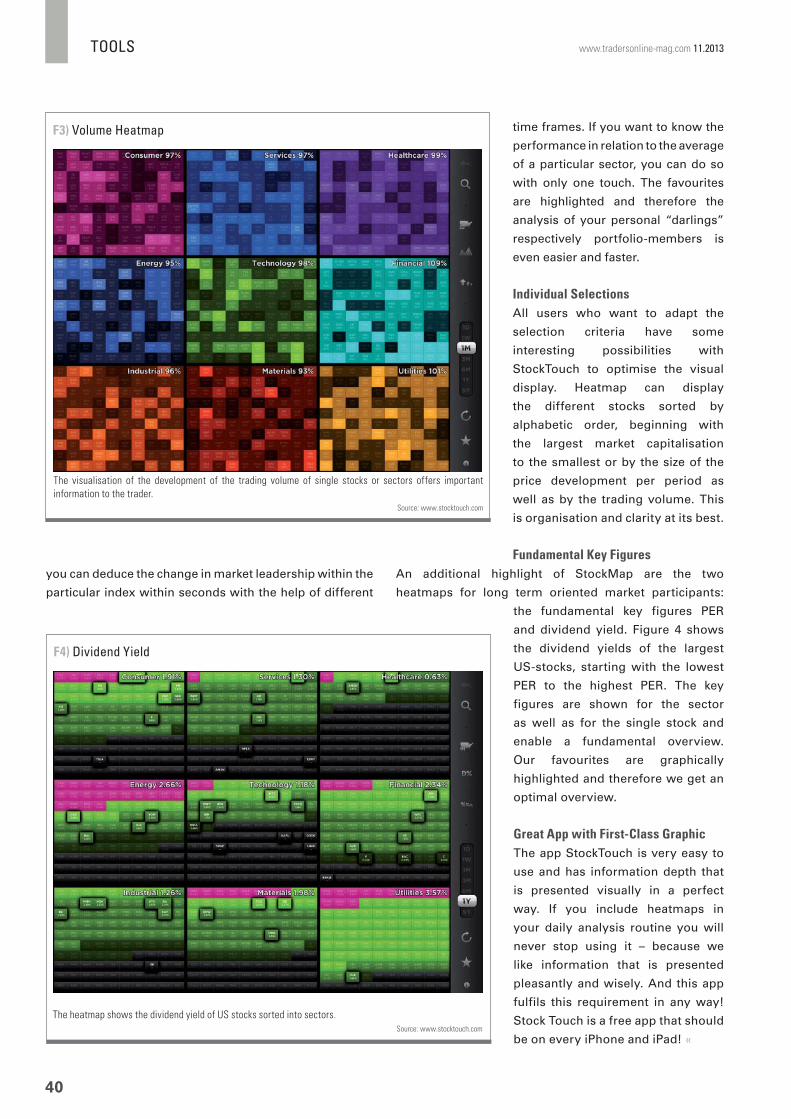
40
TOOLS www.tradersonline-mag.com 11.2013
time frames. If you want to know the
performance in relation to the average
of a particular sector, you can do so
with only one touch. The favourites
are highlighted and therefore the
analysis of your personal “darlings”
respectively portfolio-members is
even easier and faster.
Individual SelectionsAll users who want to adapt the
selection criteria have some
interesting possibilities with
StockTouch to optimise the visual
display. Heatmap can display
the different stocks sorted by
alphabetic order, beginning with
the largest market capitalisation
to the smallest or by the size of the
price development per period as
well as by the trading volume. This
is organisation and clarity at its best.
Fundamental Key FiguresAn additional highlight of StockMap are the two
heatmaps for long term oriented market participants:
the fundamental key figures PER
and dividend yield. Figure 4 shows
the dividend yields of the largest
US-stocks, starting with the lowest
PER to the highest PER. The key
figures are shown for the sector
as well as for the single stock and
enable a fundamental overview.
Our favourites are graphically
highlighted and therefore we get an
optimal overview.
Great App with First-Class GraphicThe app StockTouch is very easy to
use and has information depth that
is presented visually in a perfect
way. If you include heatmaps in
your daily analysis routine you will
never stop using it – because we
like information that is presented
pleasantly and wisely. And this app
fulfils this requirement in any way!
Stock Touch is a free app that should
be on every iPhone and iPad! «
The visualisation of the development of the trading volume of single stocks or sectors offers important
information to the trader.
Source: www.stocktouch.com
F3) Volume Heatmap
The heatmap shows the dividend yield of US stocks sorted into sectors.
Source: www.stocktouch.com
F4) Dividend Yield
you can deduce the change in market leadership within the
particular index within seconds with the help of different

STRATEGIES
42
www.tradersonline-mag.com 11.2013
Weekly Options – A New Field for Active TradersPart 2: Covered Call Writing
In the fi rst part of this two-part series of articles (TRADERS´ 10/2013), the
author had presented the main features of the increasingly popular Weekly
Options, explaining the basics as well as their pros and cons. In the second part
he will now be turning to a specifi c strategy that can be implemented by using
weekly options. It is one of the most widely used strategy implemented with
options: classic covered call writing. This is a combination of the purchase of
stocks and the simultaneous sale of call options.
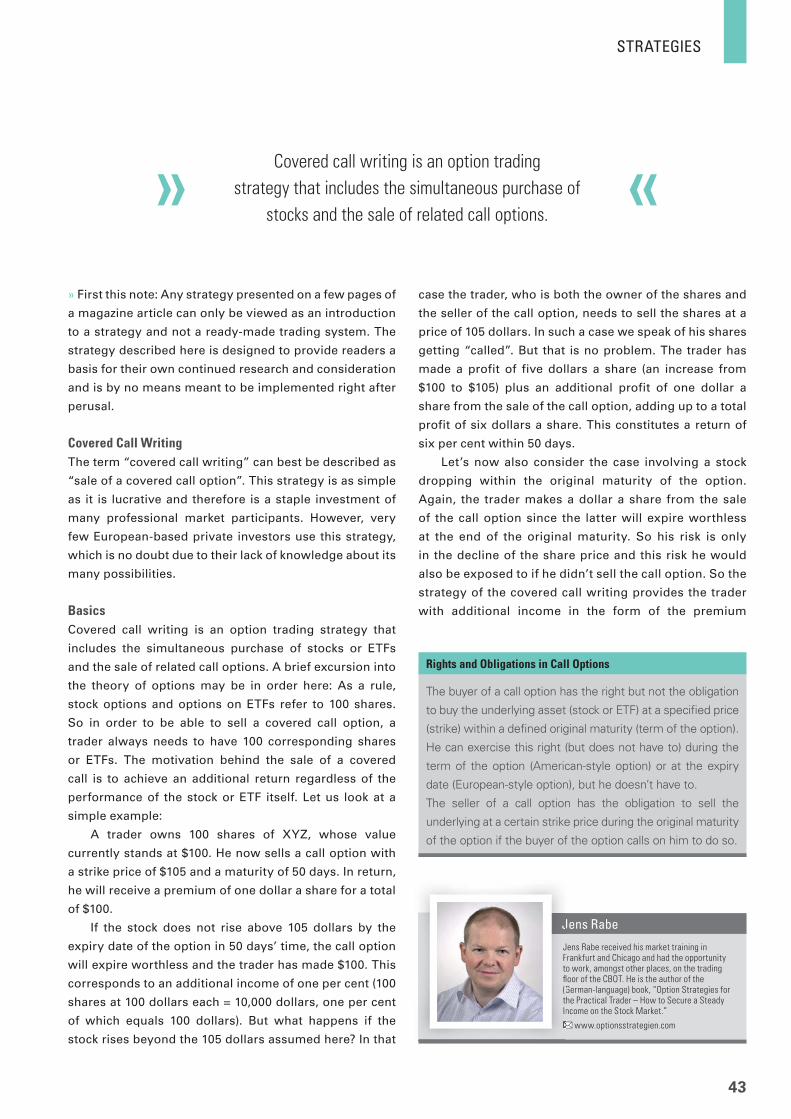
STRATEGIES
43
Jens Rabe
Jens Rabe received his market training in Frankfurt and Chicago and had the opportunity to work, amongst other places, on the trading fl oor of the CBOT. He is the author of the (German-language) book, “Option Strategies for the Practical Trader – How to Secure a Steady Income on the Stock Market.”
www.optionsstrategien.com
J
JFtfl (GtI
» First this note: Any strategy presented on a few pages of
a magazine article can only be viewed as an introduction
to a strategy and not a ready-made trading system. The
strategy described here is designed to provide readers a
basis for their own continued research and consideration
and is by no means meant to be implemented right after
perusal.
Covered Call WritingThe term “covered call writing” can best be described as
“sale of a covered call option”. This strategy is as simple
as it is lucrative and therefore is a staple investment of
many professional market participants. However, very
few European-based private investors use this strategy,
which is no doubt due to their lack of knowledge about its
many possibilities.
BasicsCovered call writing is an option trading strategy that
includes the simultaneous purchase of stocks or ETFs
and the sale of related call options. A brief excursion into
the theory of options may be in order here: As a rule,
stock options and options on ETFs refer to 100 shares.
So in order to be able to sell a covered call option, a
trader always needs to have 100 corresponding shares
or ETFs. The motivation behind the sale of a covered
call is to achieve an additional return regardless of the
performance of the stock or ETF itself. Let us look at a
simple example:
A trader owns 100 shares of XYZ, whose value
currently stands at $100. He now sells a call option with
a strike price of $105 and a maturity of 50 days. In return,
he will receive a premium of one dollar a share for a total
of $100.
If the stock does not rise above 105 dollars by the
expiry date of the option in 50 days’ time, the call option
will expire worthless and the trader has made $100. This
corresponds to an additional income of one per cent (100
shares at 100 dollars each = 10,000 dollars, one per cent
of which equals 100 dollars). But what happens if the
stock rises beyond the 105 dollars assumed here? In that
case the trader, who is both the owner of the shares and
the seller of the call option, needs to sell the shares at a
price of 105 dollars. In such a case we speak of his shares
getting “called”. But that is no problem. The trader has
made a profit of five dollars a share (an increase from
$100 to $105) plus an additional profit of one dollar a
share from the sale of the call option, adding up to a total
profit of six dollars a share. This constitutes a return of
six per cent within 50 days.
Let’s now also consider the case involving a stock
dropping within the original maturity of the option.
Again, the trader makes a dollar a share from the sale
of the call option since the latter will expire worthless
at the end of the original maturity. So his risk is only
in the decline of the share price and this risk he would
also be exposed to if he didn’t sell the call option. So the
strategy of the covered call writing provides the trader
with additional income in the form of the premium
The buyer of a call option has the right but not the obligation
to buy the underlying asset (stock or ETF) at a specifi ed price
(strike) within a defi ned original maturity (term of the option).
He can exercise this right (but does not have to) during the
term of the option (American-style option) or at the expiry
date (European-style option), but he doesn’t have to.
The seller of a call option has the obligation to sell the
underlying at a certain strike price during the original maturity
of the option if the buyer of the option calls on him to do so.
Rights and Obligations in Call Options
Covered call writing is an option trading
strategy that includes the simultaneous purchase of
stocks and the sale of related call options.
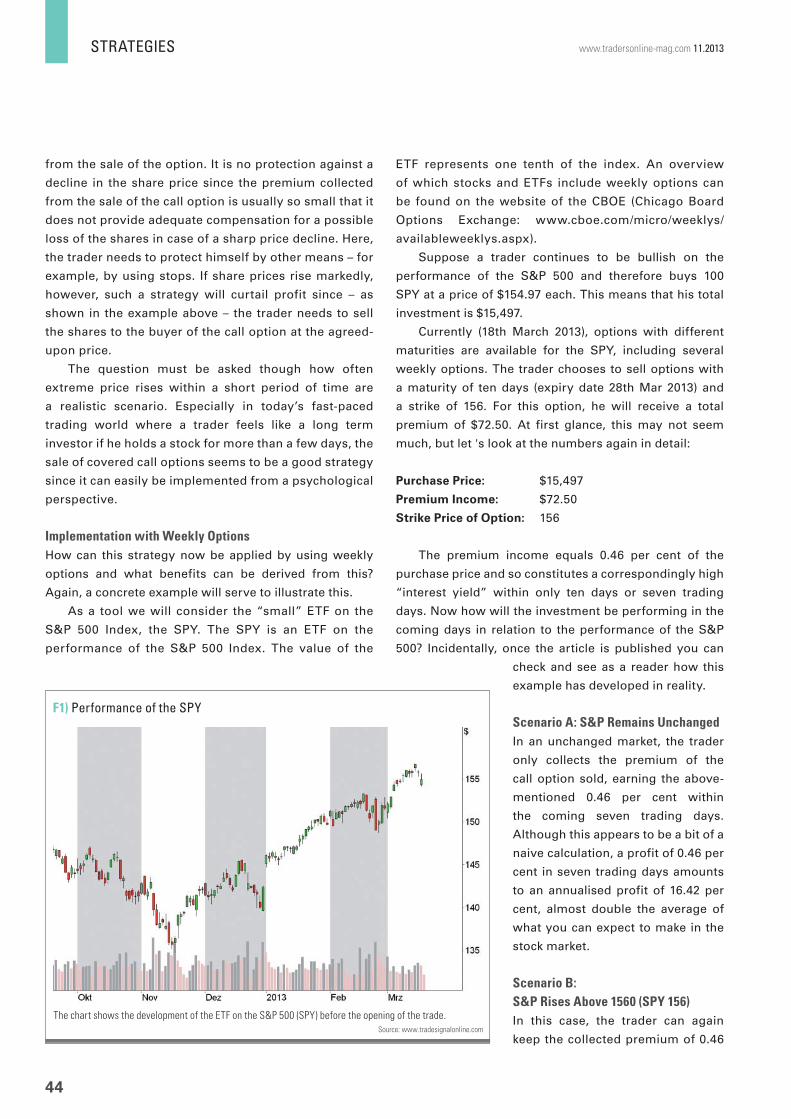
STRATEGIES
44
www.tradersonline-mag.com 11.2013
from the sale of the option. It is no protection against a
decline in the share price since the premium collected
from the sale of the call option is usually so small that it
does not provide adequate compensation for a possible
loss of the shares in case of a sharp price decline. Here,
the trader needs to protect himself by other means – for
example, by using stops. If share prices rise markedly,
however, such a strategy will curtail profit since – as
shown in the example above – the trader needs to sell
the shares to the buyer of the call option at the agreed-
upon price.
The question must be asked though how often
extreme price rises within a short period of time are
a realistic scenario. Especially in today’s fast-paced
trading world where a trader feels like a long term
investor if he holds a stock for more than a few days, the
sale of covered call options seems to be a good strategy
since it can easily be implemented from a psychological
perspective.
Implementation with Weekly OptionsHow can this strategy now be applied by using weekly
options and what benefits can be derived from this?
Again, a concrete example will serve to illustrate this.
As a tool we will consider the “small” ETF on the
S&P 500 Index, the SPY. The SPY is an ETF on the
performance of the S&P 500 Index. The value of the
ETF represents one tenth of the index. An overview
of which stocks and ETFs include weekly options can
be found on the website of the CBOE (Chicago Board
Options Exchange: www.cboe.com/micro/weeklys/
availableweeklys.aspx).
Suppose a trader continues to be bullish on the
performance of the S&P 500 and therefore buys 100
SPY at a price of $154.97 each. This means that his total
investment is $15,497.
Currently (18th March 2013), options with different
maturities are available for the SPY, including several
weekly options. The trader chooses to sell options with
a maturity of ten days (expiry date 28th Mar 2013) and
a strike of 156. For this option, he will receive a total
premium of $72.50. At first glance, this may not seem
much, but let 's look at the numbers again in detail:
Purchase Price: $15,497
Premium Income: $72.50
Strike Price of Option: 156
The premium income equals 0.46 per cent of the
purchase price and so constitutes a correspondingly high
“interest yield” within only ten days or seven trading
days. Now how will the investment be performing in the
coming days in relation to the performance of the S&P
500? Incidentally, once the article is published you can
check and see as a reader how this
example has developed in reality.
Scenario A: S&P Remains UnchangedIn an unchanged market, the trader
only collects the premium of the
call option sold, earning the above-
mentioned 0.46 per cent within
the coming seven trading days.
Although this appears to be a bit of a
naive calculation, a profit of 0.46 per
cent in seven trading days amounts
to an annualised profit of 16.42 per
cent, almost double the average of
what you can expect to make in the
stock market.
Scenario B: S&P Rises Above 1560 (SPY 156)In this case, the trader can again
keep the collected premium of 0.46
The chart shows the development of the ETF on the S&P 500 (SPY) before the opening of the trade.
Source: www.tradesignalonline.com
F1) Performance of the SPY
STRATEGIES
45
per cent. At the same time, he makes a profit of $1.03
per purchased SPY, making another $103 or 0.66 per
cent. Overall, this amounts to a profit of 1.12 per cent or
$175.50. Again, these figures may seem small, but they
constitute an annualised return in excess of 43 per cent.
And that in turn is a result that most traders can only
dream of.
Scenario C: S&P 500 FallsOf course, the trader may again keep the collected
premium and secure the profit of $72.50 since the call
option will expire worthless. As a result, he will receive
compensation of 0.72 points in the SPY for the possible
loss of value. This corresponds to nearly seven points
in the S&P 500. The trader will not suffer any loss up
to a decline of the SPY from currently 154.97 to 154.25.
However, if the decline goes any further, he will start
making a loss – regardless of whether he has sold call
options or not; after all, even without the sale of the latter
he would suffer losses with a long position in the SPY if
the price were to decline.
Summing up the results of all three scenarios, we
can say that the sale of covered call options provides the
trader with an additional return that, while appearing
to be small at first glance, is quite remarkable on closer
inspection. While the sale of covered options does not
directly act as a hedge against price slumps, it should
be noted that this is not the motivation behind such a
strategy.
Benefi ts of Weekly OptionsBut what is the special advantage of weekly options with
this strategy? In the author’s experience, two things stand
out here: First, it is the relatively high premium collected
upon the sale when compared to standard options, and
secondly, it is the high degree of flexibility resulting from
the short maturity of the options.
High Premiums on Weekly OptionsAs mentioned above, a premium income of less than
$100 as shown in the example above, seems rather low
compared to the original amount spent on the purchase
Options – The Hidden Force That Moves MarketsDid you ever wonder why sometimes, market movement seems
to defy any explanation? In that case, the options market is worth
a look as its turnover even outweighs the futures market. Close
to option expiry, option writers’ as well as delta hedgers’ need to
secure their position that might drive crazy moves. In our cover
story, we’ll explain the mechanics behind the scenes.
Preview of the next Issue
The December issue of TRADERS´ appears on 28th November 2013.
COVERSTORY
Markus Heitkoetter As founder and CEO of Rockwell Trading, Markus
Heitkoetter has shared his trading ideas with
more than 300,000 traders in over 190 countries.
In 1996, he began developing a number of trading
systems and in 2002, decided to leave his job as
a director at IBM to become a professional trader.
PEOPLE
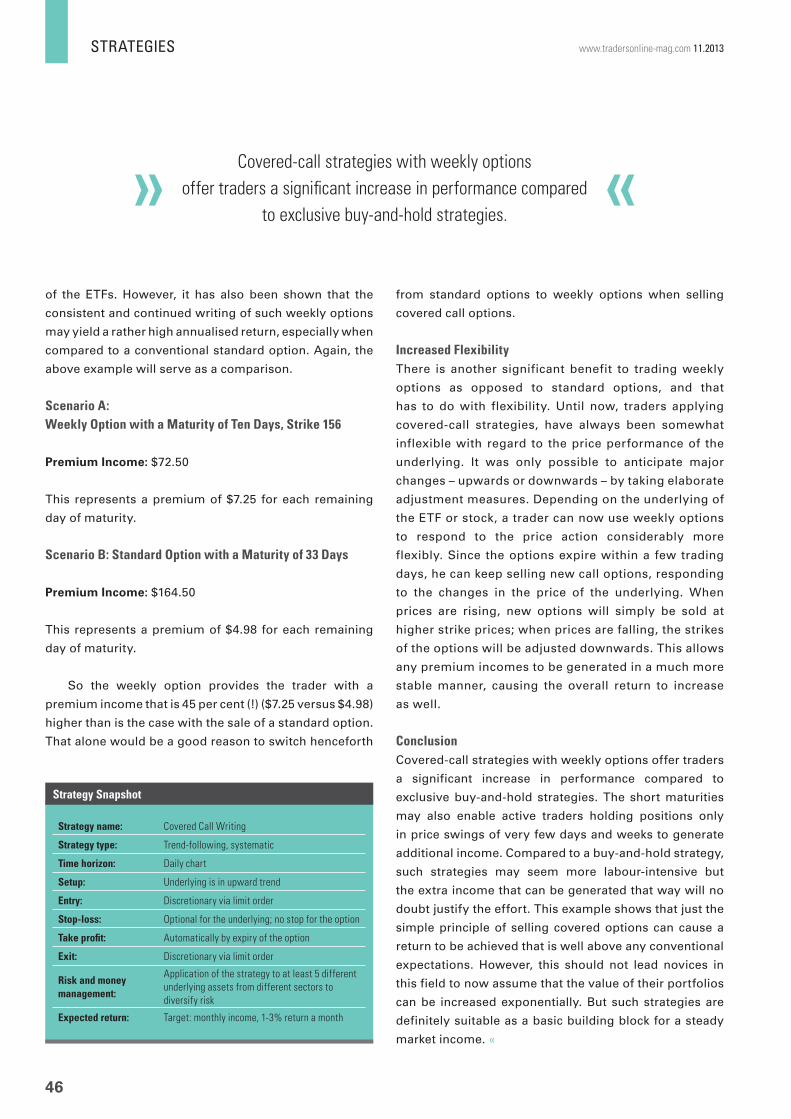
STRATEGIES
46
www.tradersonline-mag.com 11.2013
Strategy name: Covered Call Writing
Strategy type: Trend-following, systematic
Time horizon: Daily chart
Setup: Underlying is in upward trend
Entry: Discretionary via limit order
Stop-loss: Optional for the underlying; no stop for the option
Take profi t: Automatically by expiry of the option
Exit: Discretionary via limit order
Risk and money management:
Application of the strategy to at least 5 different
underlying assets from different sectors to
diversify risk
Expected return: Target: monthly income, 1-3% return a month
Strategy Snapshot
from standard options to weekly options when selling
covered call options.
Increased FlexibilityThere is another significant benefit to trading weekly
options as opposed to standard options, and that
has to do with flexibility. Until now, traders applying
covered-call strategies, have always been somewhat
inflexible with regard to the price performance of the
underlying. It was only possible to anticipate major
changes – upwards or downwards – by taking elaborate
adjustment measures. Depending on the underlying of
the ETF or stock, a trader can now use weekly options
to respond to the price action considerably more
flexibly. Since the options expire within a few trading
days, he can keep selling new call options, responding
to the changes in the price of the underlying. When
prices are rising, new options will simply be sold at
higher strike prices; when prices are falling, the strikes
of the options will be adjusted downwards. This allows
any premium incomes to be generated in a much more
stable manner, causing the overall return to increase
as well.
ConclusionCovered-call strategies with weekly options offer traders
a significant increase in performance compared to
exclusive buy-and-hold strategies. The short maturities
may also enable active traders holding positions only
in price swings of very few days and weeks to generate
additional income. Compared to a buy-and-hold strategy,
such strategies may seem more labour-intensive but
the extra income that can be generated that way will no
doubt justify the effort. This example shows that just the
simple principle of selling covered options can cause a
return to be achieved that is well above any conventional
expectations. However, this should not lead novices in
this field to now assume that the value of their portfolios
can be increased exponentially. But such strategies are
definitely suitable as a basic building block for a steady
market income. «
of the ETFs. However, it has also been shown that the
consistent and continued writing of such weekly options
may yield a rather high annualised return, especially when
compared to a conventional standard option. Again, the
above example will serve as a comparison.
Scenario A: Weekly Option with a Maturity of Ten Days, Strike 156
Premium Income: $72.50
This represents a premium of $7.25 for each remaining
day of maturity.
Scenario B: Standard Option with a Maturity of 33 Days
Premium Income: $164.50
This represents a premium of $4.98 for each remaining
day of maturity.
So the weekly option provides the trader with a
premium income that is 45 per cent (!) ($7.25 versus $4.98)
higher than is the case with the sale of a standard option.
That alone would be a good reason to switch henceforth
Covered-call strategies with weekly options
offer traders a signifi cant increase in performance compared
to exclusive buy-and-hold strategies.


STRATEGIES
48
www.tradersonline-mag.com 11.2013
Fibonacci Swing StrategyHow to Determine Realistic Price Targets
David Pieper
David Pieper is a CIIA and has been interested in stock markets since the end of the Nineties. He concentrates on trading with CFDs and is a freelance author.
D
DiHf
Everywhere in daily life, we encounter the scholarly work of the greatest mathematician of the
Middle Ages, Leonardo of Pisa – whether we are conscious of it or not. So-called “Fibonacci
Ratios” may also provide a valuable service in the technical analysis of fi nancial markets when
it comes to determining entry signals and price targets. An effective tool is a simple trading
approach based on a combination of retracements and projections.
as Fibonacci, and the ratios that can be derived from
them can also be applied to the stock market. Fibonacci
tools can be used both on the price and on the time level.
However, the method discussed here is limited to their
application on the price level.
Both retracements and Fibonacci projections are
being used here. The former describe the magnitude
of the correction that is used for entry. By contrast,
projections serve to determine important price targets
following a successful entry. Both elements are based
on the assumption that certain ratios are brought to
bear not only in nature but also on the financial markets.
Readers watching major indices like the DAX or the
S&P 500 but also other liquid markets and individual
» Retracements versus ProjectionsWhether it is just superstition or some kind of a law
of nature, the fact of the matter is that the series of
numbers introduced by Leonardo of Pisa, better known
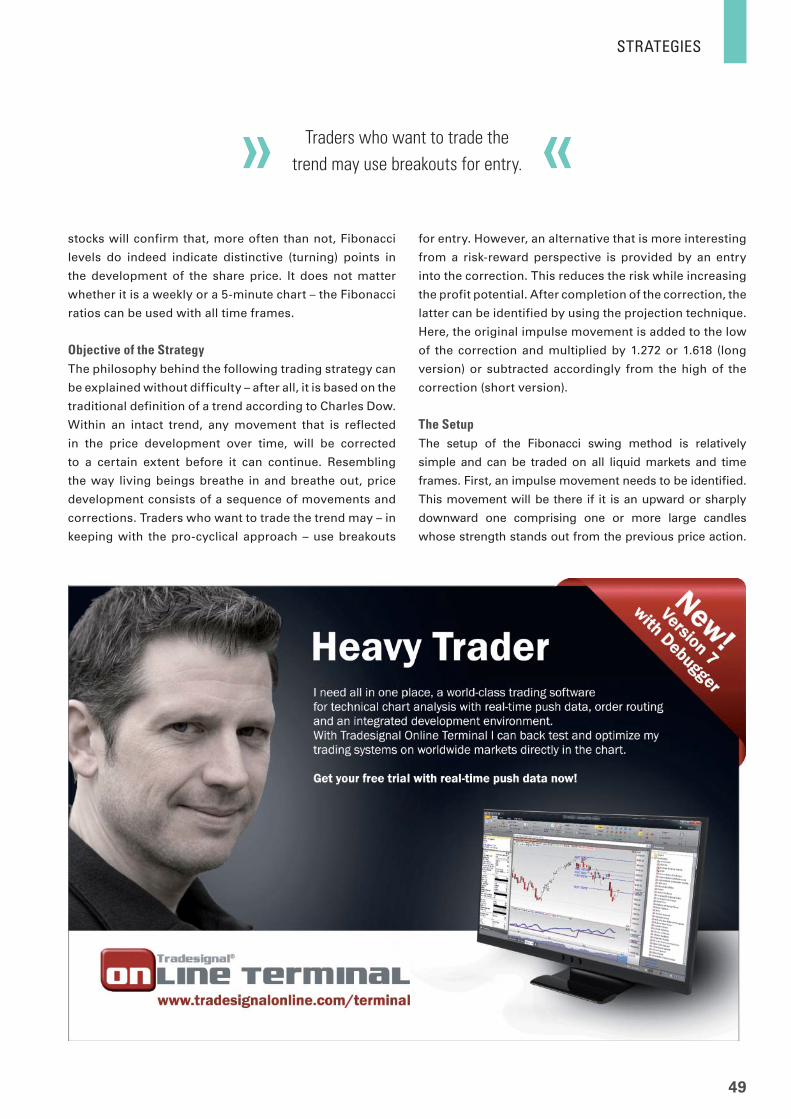
STRATEGIES
49
stocks will confirm that, more often than not, Fibonacci
levels do indeed indicate distinctive (turning) points in
the development of the share price. It does not matter
whether it is a weekly or a 5-minute chart – the Fibonacci
ratios can be used with all time frames.
Objective of the StrategyThe philosophy behind the following trading strategy can
be explained without difficulty – after all, it is based on the
traditional definition of a trend according to Charles Dow.
Within an intact trend, any movement that is reflected
in the price development over time, will be corrected
to a certain extent before it can continue. Resembling
the way living beings breathe in and breathe out, price
development consists of a sequence of movements and
corrections. Traders who want to trade the trend may – in
keeping with the pro-cyclical approach – use breakouts
for entry. However, an alternative that is more interesting
from a risk-reward perspective is provided by an entry
into the correction. This reduces the risk while increasing
the profit potential. After completion of the correction, the
latter can be identified by using the projection technique.
Here, the original impulse movement is added to the low
of the correction and multiplied by 1.272 or 1.618 (long
version) or subtracted accordingly from the high of the
correction (short version).
The SetupThe setup of the Fibonacci swing method is relatively
simple and can be traded on all liquid markets and time
frames. First, an impulse movement needs to be identified.
This movement will be there if it is an upward or sharply
downward one comprising one or more large candles
whose strength stands out from the previous price action.
Traders who want to trade the
trend may use breakouts for entry.
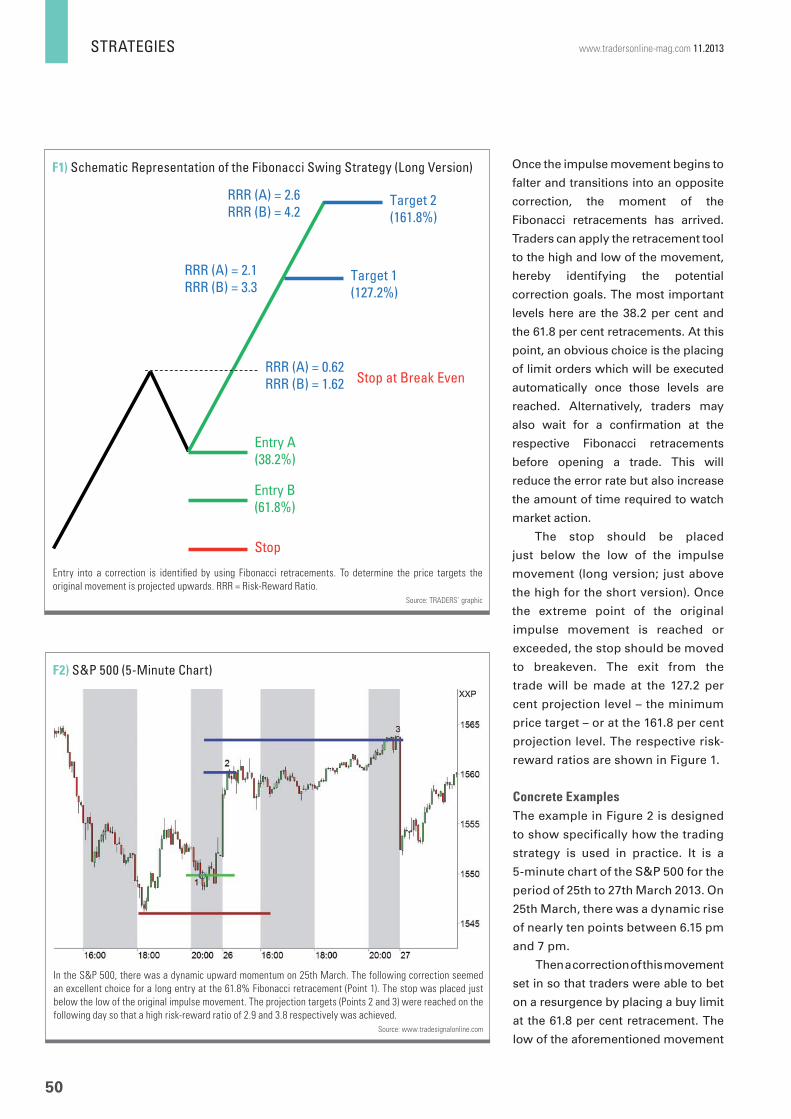
STRATEGIES
50
www.tradersonline-mag.com 11.2013
Once the impulse movement begins to
falter and transitions into an opposite
correction, the moment of the
Fibonacci retracements has arrived.
Traders can apply the retracement tool
to the high and low of the movement,
hereby identifying the potential
correction goals. The most important
levels here are the 38.2 per cent and
the 61.8 per cent retracements. At this
point, an obvious choice is the placing
of limit orders which will be executed
automatically once those levels are
reached. Alternatively, traders may
also wait for a confirmation at the
respective Fibonacci retracements
before opening a trade. This will
reduce the error rate but also increase
the amount of time required to watch
market action.
The stop should be placed
just below the low of the impulse
movement (long version; just above
the high for the short version). Once
the extreme point of the original
impulse movement is reached or
exceeded, the stop should be moved
to breakeven. The exit from the
trade will be made at the 127.2 per
cent projection level – the minimum
price target – or at the 161.8 per cent
projection level. The respective risk-
reward ratios are shown in Figure 1.
Concrete ExamplesThe example in Figure 2 is designed
to show specifically how the trading
strategy is used in practice. It is a
5-minute chart of the S&P 500 for the
period of 25th to 27th March 2013. On
25th March, there was a dynamic rise
of nearly ten points between 6.15 pm
and 7 pm.
Then a correction of this movement
set in so that traders were able to bet
on a resurgence by placing a buy limit
at the 61.8 per cent retracement. The
low of the aforementioned movement
In the S&P 500, there was a dynamic upward momentum on 25th March. The following correction seemed
an excellent choice for a long entry at the 61.8% Fibonacci retracement (Point 1). The stop was placed just
below the low of the original impulse movement. The projection targets (Points 2 and 3) were reached on the
following day so that a high risk-reward ratio of 2.9 and 3.8 respectively was achieved.
Source: www.tradesignalonline.com
F2) S&P 500 (5-Minute Chart)
Entry into a correction is identifi ed by using Fibonacci retracements. To determine the price targets the
original movement is projected upwards. RRR = Risk-Reward Ratio.
Source: TRADERS´ graphic
F1) Schematic Representation of the Fibonacci Swing Strategy (Long Version)
Entry A(38.2%)
Stop
RRR (A) = 0.62RRR (B) = 1.62
RRR (A) = 2.1RRR (B) = 3.3
RRR (A) = 2.6RRR (B) = 4.2
Target 1(127.2%)
Target 2(161.8%)
Entry B (61.8%)
Stop at Break Even
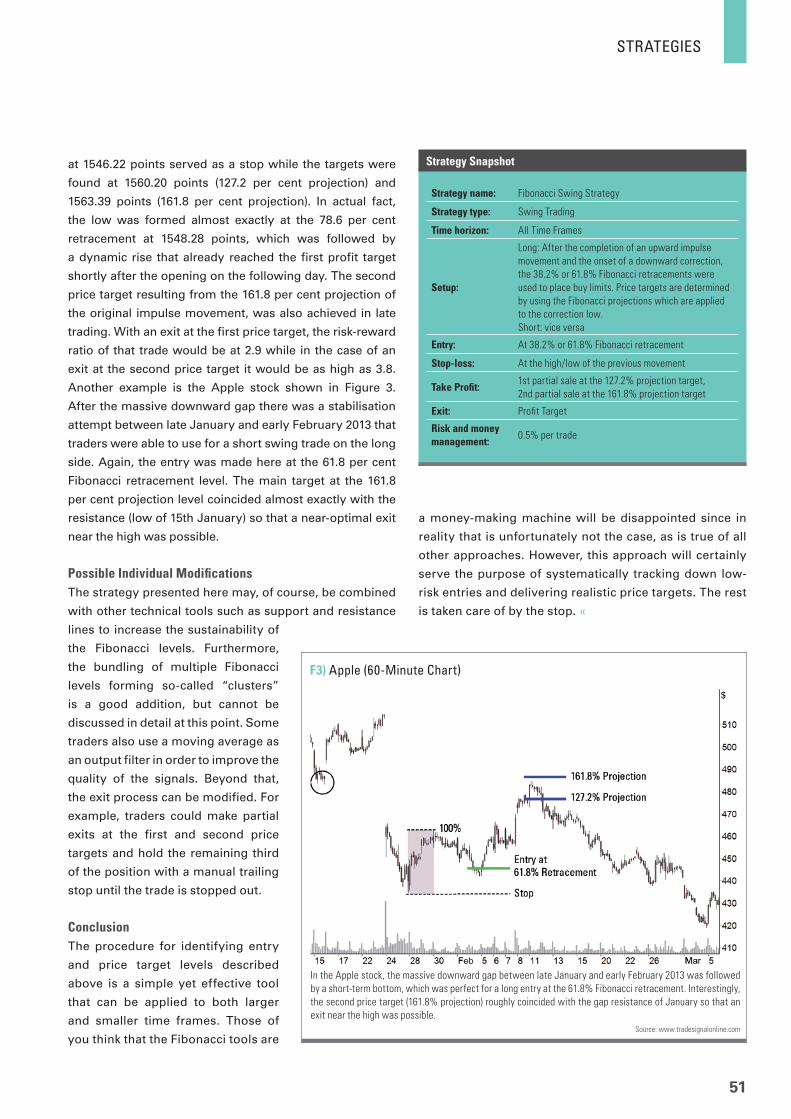
STRATEGIES
51
at 1546.22 points served as a stop while the targets were
found at 1560.20 points (127.2 per cent projection) and
1563.39 points (161.8 per cent projection). In actual fact,
the low was formed almost exactly at the 78.6 per cent
retracement at 1548.28 points, which was followed by
a dynamic rise that already reached the first profit target
shortly after the opening on the following day. The second
price target resulting from the 161.8 per cent projection of
the original impulse movement, was also achieved in late
trading. With an exit at the first price target, the risk-reward
ratio of that trade would be at 2.9 while in the case of an
exit at the second price target it would be as high as 3.8.
Another example is the Apple stock shown in Figure 3.
After the massive downward gap there was a stabilisation
attempt between late January and early February 2013 that
traders were able to use for a short swing trade on the long
side. Again, the entry was made here at the 61.8 per cent
Fibonacci retracement level. The main target at the 161.8
per cent projection level coincided almost exactly with the
resistance (low of 15th January) so that a near-optimal exit
near the high was possible.
Possible Individual Modifi cationsThe strategy presented here may, of course, be combined
with other technical tools such as support and resistance
lines to increase the sustainability of
the Fibonacci levels. Furthermore,
the bundling of multiple Fibonacci
levels forming so-called “clusters”
is a good addition, but cannot be
discussed in detail at this point. Some
traders also use a moving average as
an output filter in order to improve the
quality of the signals. Beyond that,
the exit process can be modified. For
example, traders could make partial
exits at the first and second price
targets and hold the remaining third
of the position with a manual trailing
stop until the trade is stopped out.
ConclusionThe procedure for identifying entry
and price target levels described
above is a simple yet effective tool
that can be applied to both larger
and smaller time frames. Those of
you think that the Fibonacci tools are
In the Apple stock, the massive downward gap between late January and early February 2013 was followed
by a short-term bottom, which was perfect for a long entry at the 61.8% Fibonacci retracement. Interestingly,
the second price target (161.8% projection) roughly coincided with the gap resistance of January so that an
exit near the high was possible.
Source: www.tradesignalonline.com
F3) Apple (60-Minute Chart)
Strategy name: Fibonacci Swing Strategy
Strategy type: Swing Trading
Time horizon: All Time Frames
Setup:
Long: After the completion of an upward impulse
movement and the onset of a downward correction,
the 38.2% or 61.8% Fibonacci retracements were
used to place buy limits. Price targets are determined
by using the Fibonacci projections which are applied
to the correction low.
Short: vice versa
Entry: At 38.2% or 61.8% Fibonacci retracement
Stop-loss: At the high/low of the previous movement
Take Profi t:1st partial sale at the 127.2% projection target,
2nd partial sale at the 161.8% projection target
Exit: Profi t Target
Risk and money management:
0.5% per trade
Strategy Snapshot
a money-making machine will be disappointed since in
reality that is unfortunately not the case, as is true of all
other approaches. However, this approach will certainly
serve the purpose of systematically tracking down low-
risk entries and delivering realistic price targets. The rest
is taken care of by the stop. «
STRATEGIES
52
www.tradersonline-mag.com 11.2013
Matching Weak Currencies against Strong Currencies
Benefi tting from the Real Principle behind Forex Trading
In the currency trading world, you need to speculate on one currency having more stamina than the other one – this
is what will bring nice rewards as it enables you to follow the direction of the dominant biases and primary trend
confi rmation patterns. Signifi cantly trending markets can be tumultuous at times, to the extent that speculators without
clearly-defi ned trading plans can be overwhelmed. Those with clearly-defi ned plans usually thrive without having to push
the envelope. Forex trading is all about matching weak currencies against strong currencies. Anyone who can do that
with satisfactory accuracy will enjoy occasional windfalls, while controlling risk effectively. This article describes one way
of achieving this goal with a simple trading approach.
Azeez Mustapha
Azeez Mustapha is an offi cial analyst at Instaforex Companies Group, a blogger at Advfn.com, and a freelance author for trading magazines. He is working as a trading signals provider at some websites. He is a senior analyst at Paxforex.com. His articles are also available on other websites like www.ituglobalforex.blogspot.com.
A
ACawwHw
stamina will forever hold. When a pair, say AUD/USD,
reaches a recalcitrant supply level and fails to breach it
to the upside, then it falls. This means that the Aussie
has become weaker than the Greenback at that level. On
the other hand, when the aforementioned pair reaches
a conspicuous demand level and fails to breach it to the
downside, it may start rising. This means the Aussie has
become stronger than the Greenback. In other word, a pair
skyrockets when the base currency is stronger than the
counter currency, and plummets when the base currency
is weaker than the counter currency. Anytime a pair is
strengthened, it is said that bulls dominate since they
open long positions and the price shoots up as a result
» When a Pair Becomes Strong and Vice VersaThe fact that profitable Forex traders know how to skilfully
match currencies with stamina versus currencies without
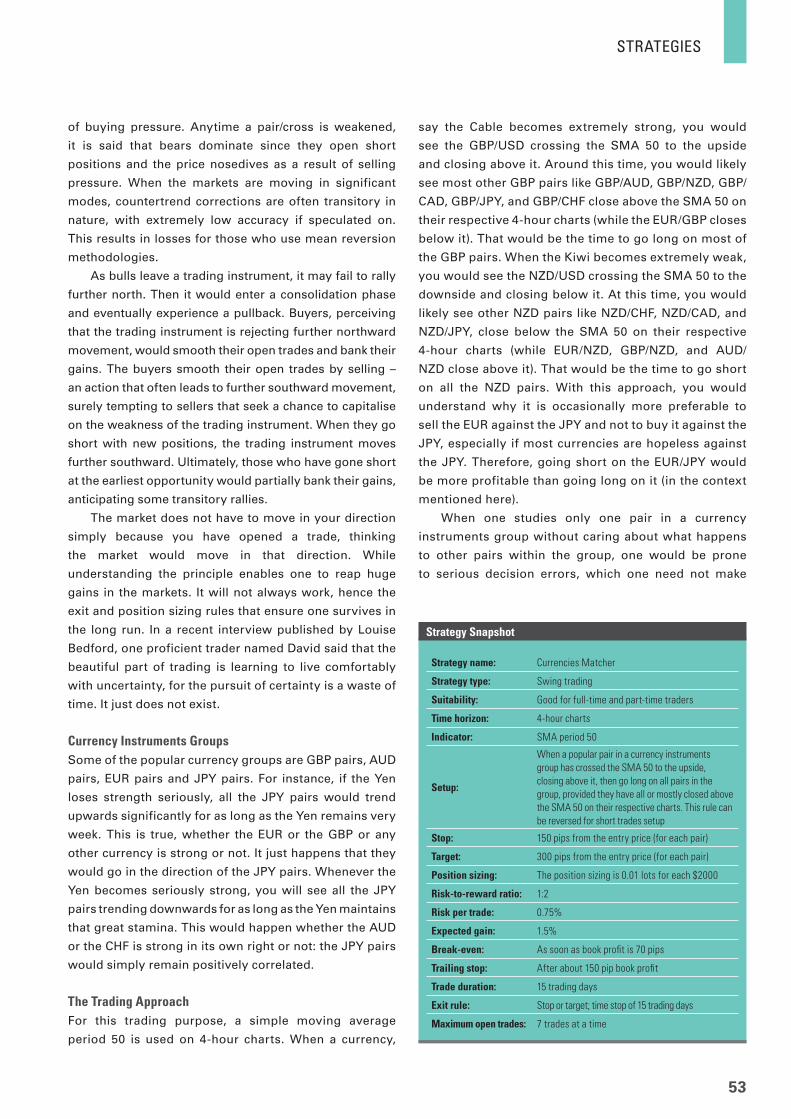
STRATEGIES
53
of buying pressure. Anytime a pair/cross is weakened,
it is said that bears dominate since they open short
positions and the price nosedives as a result of selling
pressure. When the markets are moving in significant
modes, countertrend corrections are often transitory in
nature, with extremely low accuracy if speculated on.
This results in losses for those who use mean reversion
methodologies.
As bulls leave a trading instrument, it may fail to rally
further north. Then it would enter a consolidation phase
and eventually experience a pullback. Buyers, perceiving
that the trading instrument is rejecting further northward
movement, would smooth their open trades and bank their
gains. The buyers smooth their open trades by selling –
an action that often leads to further southward movement,
surely tempting to sellers that seek a chance to capitalise
on the weakness of the trading instrument. When they go
short with new positions, the trading instrument moves
further southward. Ultimately, those who have gone short
at the earliest opportunity would partially bank their gains,
anticipating some transitory rallies.
The market does not have to move in your direction
simply because you have opened a trade, thinking
the market would move in that direction. While
understanding the principle enables one to reap huge
gains in the markets. It will not always work, hence the
exit and position sizing rules that ensure one survives in
the long run. In a recent interview published by Louise
Bedford, one proficient trader named David said that the
beautiful part of trading is learning to live comfortably
with uncertainty, for the pursuit of certainty is a waste of
time. It just does not exist.
Currency Instruments Groups Some of the popular currency groups are GBP pairs, AUD
pairs, EUR pairs and JPY pairs. For instance, if the Yen
loses strength seriously, all the JPY pairs would trend
upwards significantly for as long as the Yen remains very
week. This is true, whether the EUR or the GBP or any
other currency is strong or not. It just happens that they
would go in the direction of the JPY pairs. Whenever the
Yen becomes seriously strong, you will see all the JPY
pairs trending downwards for as long as the Yen maintains
that great stamina. This would happen whether the AUD
or the CHF is strong in its own right or not: the JPY pairs
would simply remain positively correlated.
The Trading Approach For this trading purpose, a simple moving average
period 50 is used on 4-hour charts. When a currency,
Strategy name: Currencies Matcher
Strategy type: Swing trading
Suitability: Good for full-time and part-time traders
Time horizon: 4-hour charts
Indicator: SMA period 50
Setup:
When a popular pair in a currency instruments
group has crossed the SMA 50 to the upside,
closing above it, then go long on all pairs in the
group, provided they have all or mostly closed above
the SMA 50 on their respective charts. This rule can
be reversed for short trades setup
Stop: 150 pips from the entry price (for each pair)
Target: 300 pips from the entry price (for each pair)
Position sizing: The position sizing is 0.01 lots for each $2000
Risk-to-reward ratio: 1:2
Risk per trade: 0.75%
Expected gain: 1.5%
Break-even: As soon as book profi t is 70 pips
Trailing stop: After about 150 pip book profi t
Trade duration: 15 trading days
Exit rule: Stop or target; time stop of 15 trading days
Maximum open trades: 7 trades at a time
Strategy Snapshot
say the Cable becomes extremely strong, you would
see the GBP/USD crossing the SMA 50 to the upside
and closing above it. Around this time, you would likely
see most other GBP pairs like GBP/AUD, GBP/NZD, GBP/
CAD, GBP/JPY, and GBP/CHF close above the SMA 50 on
their respective 4-hour charts (while the EUR/GBP closes
below it). That would be the time to go long on most of
the GBP pairs. When the Kiwi becomes extremely weak,
you would see the NZD/USD crossing the SMA 50 to the
downside and closing below it. At this time, you would
likely see other NZD pairs like NZD/CHF, NZD/CAD, and
NZD/JPY, close below the SMA 50 on their respective
4-hour charts (while EUR/NZD, GBP/NZD, and AUD/
NZD close above it). That would be the time to go short
on all the NZD pairs. With this approach, you would
understand why it is occasionally more preferable to
sell the EUR against the JPY and not to buy it against the
JPY, especially if most currencies are hopeless against
the JPY. Therefore, going short on the EUR/JPY would
be more profitable than going long on it (in the context
mentioned here).
When one studies only one pair in a currency
instruments group without caring about what happens
to other pairs within the group, one would be prone
to serious decision errors, which one need not make
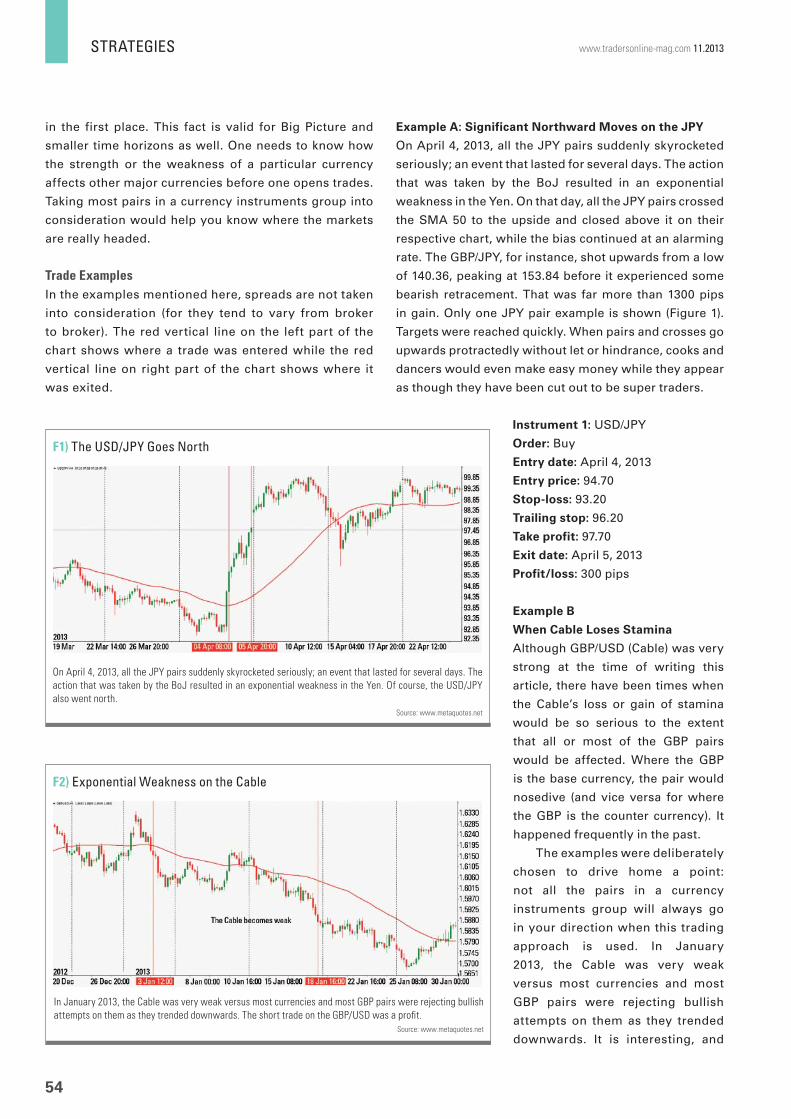
STRATEGIES
54
www.tradersonline-mag.com 11.2013
Example A: Significant Northward Moves on the JPY
On April 4, 2013, all the JPY pairs suddenly skyrocketed
seriously; an event that lasted for several days. The action
that was taken by the BoJ resulted in an exponential
weakness in the Yen. On that day, all the JPY pairs crossed
the SMA 50 to the upside and closed above it on their
respective chart, while the bias continued at an alarming
rate. The GBP/JPY, for instance, shot upwards from a low
of 140.36, peaking at 153.84 before it experienced some
bearish retracement. That was far more than 1300 pips
in gain. Only one JPY pair example is shown (Figure 1).
Targets were reached quickly. When pairs and crosses go
upwards protractedly without let or hindrance, cooks and
dancers would even make easy money while they appear
as though they have been cut out to be super traders.
Instrument 1: USD/JPY
Order: Buy
Entry date: April 4, 2013
Entry price: 94.70
Stop-loss: 93.20
Trailing stop: 96.20
Take profit: 97.70
Exit date: April 5, 2013
Profit/loss: 300 pips
Example B
When Cable Loses Stamina
Although GBP/USD (Cable) was very
strong at the time of writing this
article, there have been times when
the Cable’s loss or gain of stamina
would be so serious to the extent
that all or most of the GBP pairs
would be affected. Where the GBP
is the base currency, the pair would
nosedive (and vice versa for where
the GBP is the counter currency). It
happened frequently in the past.
The examples were deliberately
chosen to drive home a point:
not all the pairs in a currency
instruments group will always go
in your direction when this trading
approach is used. In January
2013, the Cable was very weak
versus most currencies and most
GBP pairs were rejecting bullish
attempts on them as they trended
downwards. It is interesting, and
On April 4, 2013, all the JPY pairs suddenly skyrocketed seriously; an event that lasted for several days. The
action that was taken by the BoJ resulted in an exponential weakness in the Yen. Of course, the USD/JPY
also went north.
Source: www.metaquotes.net
F1) The USD/JPY Goes North
in the first place. This fact is valid for Big Picture and
smaller time horizons as well. One needs to know how
the strength or the weakness of a particular currency
affects other major currencies before one opens trades.
Taking most pairs in a currency instruments group into
consideration would help you know where the markets
are really headed.
Trade ExamplesIn the examples mentioned here, spreads are not taken
into consideration (for they tend to vary from broker
to broker). The red vertical line on the left part of the
chart shows where a trade was entered while the red
vertical line on right part of the chart shows where it
was exited.
In January 2013, the Cable was very weak versus most currencies and most GBP pairs were rejecting bullish
attempts on them as they trended downwards. The short trade on the GBP/USD was a profi t.
Source: www.metaquotes.net
F2) Exponential Weakness on the Cable
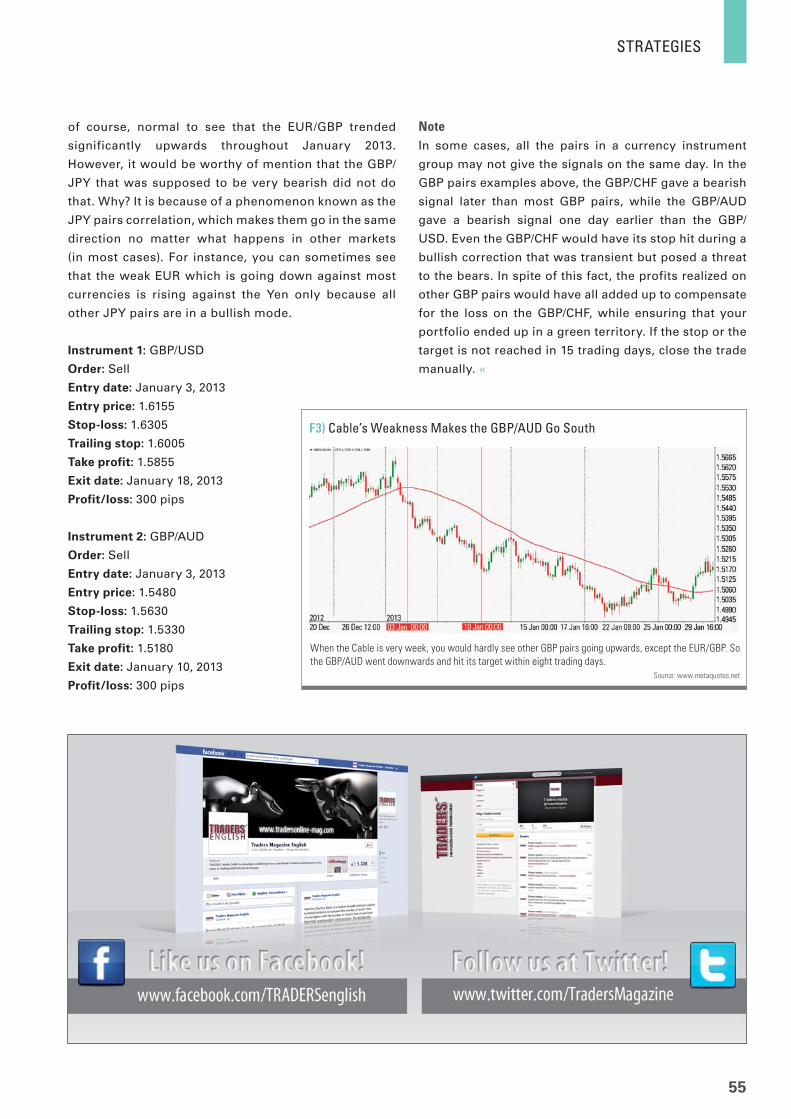
STRATEGIES
55
of course, normal to see that the EUR/GBP trended
significantly upwards throughout January 2013.
However, it would be worthy of mention that the GBP/
JPY that was supposed to be very bearish did not do
that. Why? It is because of a phenomenon known as the
JPY pairs correlation, which makes them go in the same
direction no matter what happens in other markets
(in most cases). For instance, you can sometimes see
that the weak EUR which is going down against most
currencies is rising against the Yen only because all
other JPY pairs are in a bullish mode.
Instrument 1: GBP/USD
Order: Sell
Entry date: January 3, 2013
Entry price: 1.6155
Stop-loss: 1.6305
Trailing stop: 1.6005
Take profit: 1.5855
Exit date: January 18, 2013
Profit/loss: 300 pips
Instrument 2: GBP/AUD
Order: Sell
Entry date: January 3, 2013
Entry price: 1.5480
Stop-loss: 1.5630
Trailing stop: 1.5330
Take profit: 1.5180
Exit date: January 10, 2013
Profit/loss: 300 pips
When the Cable is very week, you would hardly see other GBP pairs going upwards, except the EUR/GBP. So
the GBP/AUD went downwards and hit its target within eight trading days.
Source: www.metaquotes.net
F3) Cable’s Weakness Makes the GBP/AUD Go South
NoteIn some cases, all the pairs in a currency instrument
group may not give the signals on the same day. In the
GBP pairs examples above, the GBP/CHF gave a bearish
signal later than most GBP pairs, while the GBP/AUD
gave a bearish signal one day earlier than the GBP/
USD. Even the GBP/CHF would have its stop hit during a
bullish correction that was transient but posed a threat
to the bears. In spite of this fact, the profits realized on
other GBP pairs would have all added up to compensate
for the loss on the GBP/CHF, while ensuring that your
portfolio ended up in a green territory. If the stop or the
target is not reached in 15 trading days, close the trade
manually. «

BASICS
56
www.tradersonline-mag.com 11.2013
Trading Journal: Valentin Rossiwall
In our trading diary series, traders – beginners or professionals –
present one of their trades that taught them something special. This
time Valentin Rossiwall shows an example.
» Here I will describe my trading day and what happened
when trading short term on Friday 6th September 2013.
Every day I start with market preparation and talk to our
traders in the online-trading room. That day we started
trading with the following preparations:
1. The market is influenced strongly by news of Syria
and a possible military attack of the USA. Therefore
we have a close look at possible news that could give
strong momentum to the market.
2. The market will probably be quiet until 2:30 pm when
the unemployment figures are published in the USA.
The non-farm payrolls often cause a larger movement
in the markets.
3. Experience has taught us that the first 20 minutes
after the publication of the non-farm-payrolls often
causes unclear and false signals. Therefore our plan
is to wait at least 15 to 20 minutes after publication
before entering aggressive trades.
4. The stock market is in a medium term correction
and we are in the middle of “summer-trading” – that
means that the price movements are weak except
for those driven by important news. The markets
tend to sell breakouts. The best risk-reward ratio
can often be found at extreme reversal points with
counter trend trades.
At 2:30 pm the non-farm payrolls are published.
The market immediately rises to new highs on volume
above average. A typical “fake”, because within minutes
the market sells the break-out. I do not see any relevant
sales or buyers but even so the market returns to its
6th September 2013: Two Trades in the DowProfessional Traders Can Change Their Minds Quickly
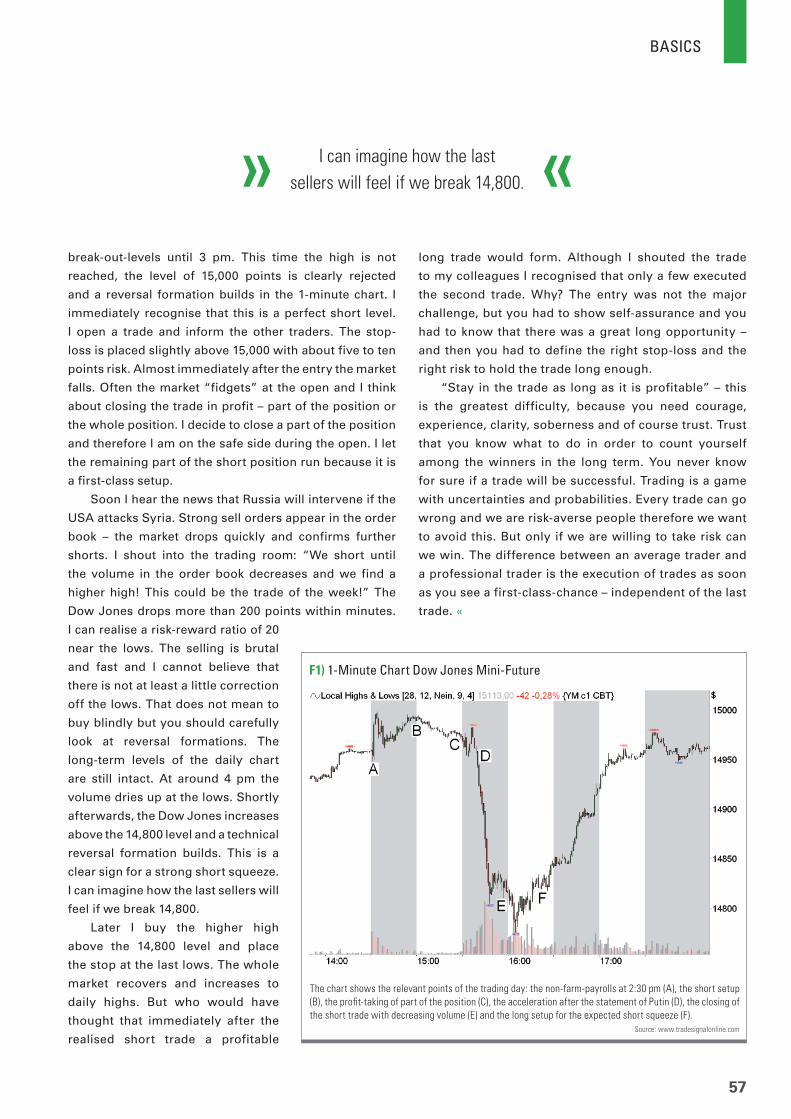
BASICS
57
break-out-levels until 3 pm. This time the high is not
reached, the level of 15,000 points is clearly rejected
and a reversal formation builds in the 1-minute chart. I
immediately recognise that this is a perfect short level.
I open a trade and inform the other traders. The stop-
loss is placed slightly above 15,000 with about five to ten
points risk. Almost immediately after the entry the market
falls. Often the market “fidgets” at the open and I think
about closing the trade in profit – part of the position or
the whole position. I decide to close a part of the position
and therefore I am on the safe side during the open. I let
the remaining part of the short position run because it is
a first-class setup.
Soon I hear the news that Russia will intervene if the
USA attacks Syria. Strong sell orders appear in the order
book – the market drops quickly and confirms further
shorts. I shout into the trading room: “We short until
the volume in the order book decreases and we find a
higher high! This could be the trade of the week!” The
Dow Jones drops more than 200 points within minutes.
I can realise a risk-reward ratio of 20
near the lows. The selling is brutal
and fast and I cannot believe that
there is not at least a little correction
off the lows. That does not mean to
buy blindly but you should carefully
look at reversal formations. The
long-term levels of the daily chart
are still intact. At around 4 pm the
volume dries up at the lows. Shortly
afterwards, the Dow Jones increases
above the 14,800 level and a technical
reversal formation builds. This is a
clear sign for a strong short squeeze.
I can imagine how the last sellers will
feel if we break 14,800.
Later I buy the higher high
above the 14,800 level and place
the stop at the last lows. The whole
market recovers and increases to
daily highs. But who would have
thought that immediately after the
realised short trade a profitable
long trade would form. Although I shouted the trade
to my colleagues I recognised that only a few executed
the second trade. Why? The entry was not the major
challenge, but you had to show self-assurance and you
had to know that there was a great long opportunity –
and then you had to define the right stop-loss and the
right risk to hold the trade long enough.
“Stay in the trade as long as it is profitable” – this
is the greatest difficulty, because you need courage,
experience, clarity, soberness and of course trust. Trust
that you know what to do in order to count yourself
among the winners in the long term. You never know
for sure if a trade will be successful. Trading is a game
with uncertainties and probabilities. Every trade can go
wrong and we are risk-averse people therefore we want
to avoid this. But only if we are willing to take risk can
we win. The difference between an average trader and
a professional trader is the execution of trades as soon
as you see a first-class-chance – independent of the last
trade. «
The chart shows the relevant points of the trading day: the non-farm-payrolls at 2:30 pm (A), the short setup
(B), the profi t-taking of part of the position (C), the acceleration after the statement of Putin (D), the closing of
the short trade with decreasing volume (E) and the long setup for the expected short squeeze (F).
Source: www.tradesignalonline.com
F1) 1-Minute Chart Dow Jones Mini-Future
I can imagine how the last
sellers will feel if we break 14,800.

BASICS
58
www.tradersonline-mag.com 11.2013
Part 2: The ABC of Risk Management
Risk- and Money Management
In this series Jens Klatt introduces a multilevel process of developing a risk- and
money-management-plan. The fi rst part (TRADERS´ 10/2013) discussed the meaning
of money-management. Now in the second part we want to show the pitfalls and
how to avoid them as well as the contents of a good risk and money management.
Jens Klatt
Jens Klatt is a market analyst at DailyFX.de and moderates the German DailyFX-forum. He has been in the fi nancial sector for over seven years. Besides technical and fundamental observation of the markets, he focuses on sentiment analysis in the forex markets and develops his trading decisions based on this analysis.
[email protected], www.dailyfx.de
J
Jmintmfb
» Many traders want to start their trading career by achieving
big profits with a small trading account. This may be one of
the main reasons that new traders turn to the forex market.
But many traders do not realise one thing: In trading they
have to deal with the real risk of losing money.
New traders can be blinded by greed. The negative
aspect here is not greed per se, but what it provokes in
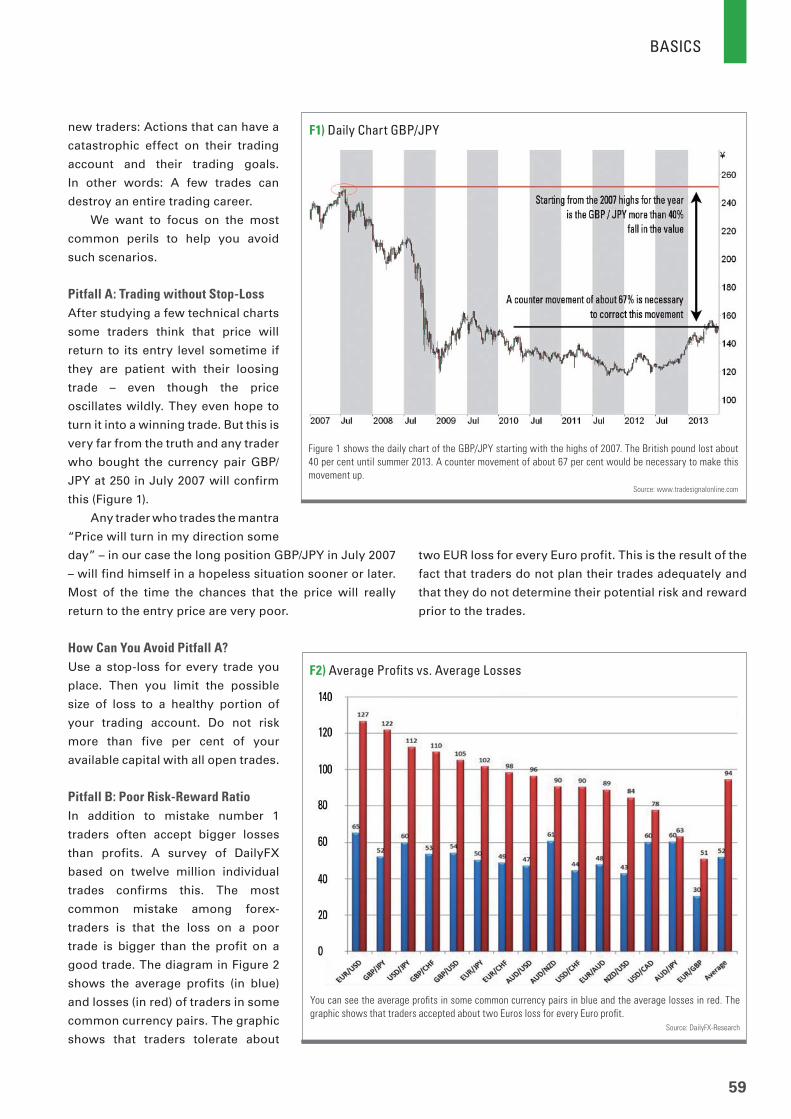
BASICS
59
new traders: Actions that can have a
catastrophic effect on their trading
account and their trading goals.
In other words: A few trades can
destroy an entire trading career.
We want to focus on the most
common perils to help you avoid
such scenarios.
Pitfall A: Trading without Stop-LossAfter studying a few technical charts
some traders think that price will
return to its entry level sometime if
they are patient with their loosing
trade – even though the price
oscillates wildly. They even hope to
turn it into a winning trade. But this is
very far from the truth and any trader
who bought the currency pair GBP/
JPY at 250 in July 2007 will confirm
this (Figure 1).
Any trader who trades the mantra
“Price will turn in my direction some
day” – in our case the long position GBP/JPY in July 2007
– will find himself in a hopeless situation sooner or later.
Most of the time the chances that the price will really
return to the entry price are very poor.
How Can You Avoid Pitfall A?Use a stop-loss for every trade you
place. Then you limit the possible
size of loss to a healthy portion of
your trading account. Do not risk
more than five per cent of your
available capital with all open trades.
Pitfall B: Poor Risk-Reward RatioIn addition to mistake number 1
traders often accept bigger losses
than profits. A survey of DailyFX
based on twelve million individual
trades confirms this. The most
common mistake among forex-
traders is that the loss on a poor
trade is bigger than the profit on a
good trade. The diagram in Figure 2
shows the average profits (in blue)
and losses (in red) of traders in some
common currency pairs. The graphic
shows that traders tolerate about
Figure 1 shows the daily chart of the GBP/JPY starting with the highs of 2007. The British pound lost about
40 per cent until summer 2013. A counter movement of about 67 per cent would be necessary to make this
movement up.
Source: www.tradesignalonline.com
F1) Daily Chart GBP/JPY
You can see the average profi ts in some common currency pairs in blue and the average losses in red. The
graphic shows that traders accepted about two Euros loss for every Euro profi t.
Source: DailyFX-Research
F2) Average Profi ts vs. Average Losses
two EUR loss for every Euro profit. This is the result of the
fact that traders do not plan their trades adequately and
that they do not determine their potential risk and reward
prior to the trades.

BASICS
60
www.tradersonline-mag.com 11.2013
It is very simple to understand this: If you trade a
position that is too large for your trading account, every
pip-movement has a correspondingly larger impact
on your account. A survey by the analysts at DailyFX
showed that the profitability in trading is dependent
on the size of the account (Figure 3). And that’s where
effective leverage comes into play. If the trader has an
account of 1000 EUR and he trades two mini-lots EUR/
USD long – which means an equivalent of 20 000 EUR/
USD with a leverage of 200:1 – then the trader effectively
works with a leverage of 20:1 (20 000 (equivalent) / 1000
(account size)). If you have an account of 10 000 EUR
the calculation is as follows: 20 000 (equivalent) / 10 000
(account size) = 2:1.
Surveys showed that the profitability of traders who
used an effective leverage of 5:1 or smaller was nearly
100 per cent higher than of those traders who used an
effective leverage of 20:1 (Figure 3).
How Can You Avoid Pitfall C?Do not over use leverage. Many professional traders try
to use a leverage below 10:1. They only trade positions
of an equivalent of 10 000 EUR or
smaller for every 1000 EUR of their
trading account: If the size of their
trading account is 2000 EUR, you
should only choose position sizes of
20 000 EUR/USD at maximum (that
equals two mini-lots of EUR/USD).
Conclusion and OutlookIf you consider and understand these
three pitfalls it should result in a real
break-through for your trading; you
should always remember these three
pitfalls, because the rules of the risk-
and money-management apply to
every new trade. The next part of this
series will discuss the topic “How to
place an effective stop”. «
60
Figure 3 shows the profi tability of traders in relation to their account size. The graphic clearly shows that
the use of effective leverage decreases in relation to a growing account size, but the profi tability increases.
Source: DailyFX-Research
F3) Profi tability
How Can You Avoid Pitfall B?You have to make sure that your profit limit is at least
the same size as your stop-loss. You should always follow
the rule to earn at least two times the risk with a winning
trade and stick to it. That means that your profit target
of your trade should be at least 100 pips if your risk is 50
pips.
Pitfall C: The Use of High LeverageAt the beginning of this article we mentioned greed as
one reason for traders’ behaviour in the forex markets.
Greed is always combined with the topic of leverage,
because you only need a small amount of money – the
margin – to trade with a multiple. But often you do not see
the other side: The minimum margin and the leveraged
chance of profit is faced with the same leveraged risk to
lose money.
You should realise that even though you can use high
leverage there is no need to exhaust it completely. Many
professional traders trade use leverage that is much
less than what may be available – with the intention of
achieving the highest possible profit.
The rules of risk- and money
management apply to every new trade.


BASICS
62
www.tradersonline-mag.com 11.2013
Part 3: Durable Goods
Economic Data as Market Mover
Every trader knows about this: the market is quiet and uneventful and there are no extreme
movements. And only moments later the markets seem to go crazy. Often the reason is
economic data – mainly from the USA. Today we want to introduce the durable-goods-report,
which is published once a month and provides data about investment activity.
» Analysts look at different macro-economic data for
economic analysis. We already introduced the non-farm
payrolls (TRADERS’ 09/2013) and the ISM-manufacturing
index (TRADERS’ 10/2013) and in this part we want to
discuss the durable goods report, which offers important
information about the macro-economic development in the
States. The reason: even though the US service sector is
much larger than manufacturing industries – the main part
of the economic fluctuation is caused by activities in the
manufacturing sector.
Analysts, investors and traders know of durable
goods report because it is one of the most important

BASICS
63
economic indicators. The report
is based on the aggregated data
on new orders received, sales and
inventories of companies with an
annual turnover of more than 500
million dollars. The calculation and
publication of the results started
in 1957 on a monthly basis and is
executed by the Census Bureau.
The whole report consists of six
parts:
• new orders
• shipments
• unfilled orders
• inventories
• capital goods
• revisions
Many companies plan their
future production based on a
combination of new orders and
inventories. The change in durable goods orders is
the most important part of the report for the financial
markets. Durable goods are those that have an expected
life span of at least three years, such as cars, computers
or furniture. The change in new orders is calculated in
relation to the prior month and the month before that
and is published in absolute figures and in percentages.
The report offers precious information to determine
the investment activity of companies and consumers
The report of durable goods offers information about the activities of the industries. The durable goods new
orders are especially important for market participants. In addition to the total key fi gure an adjusted fi gure is
published that excludes munitions and transport goods.
Source: www.census.gov/manufacturing
F1) Report of Durable Goods (April 2013)
and is the basis for the estimation of future industrial
production.
Transport Goods and Munitions Provide VolatilityThe past shows that the durable-goods-report shows
high volatility in comparison to other indicators. There
are often drastic changes from one month to the other
and that causes difficulties in the interpretation. The
reason is goods like munitions, ships and airplanes.
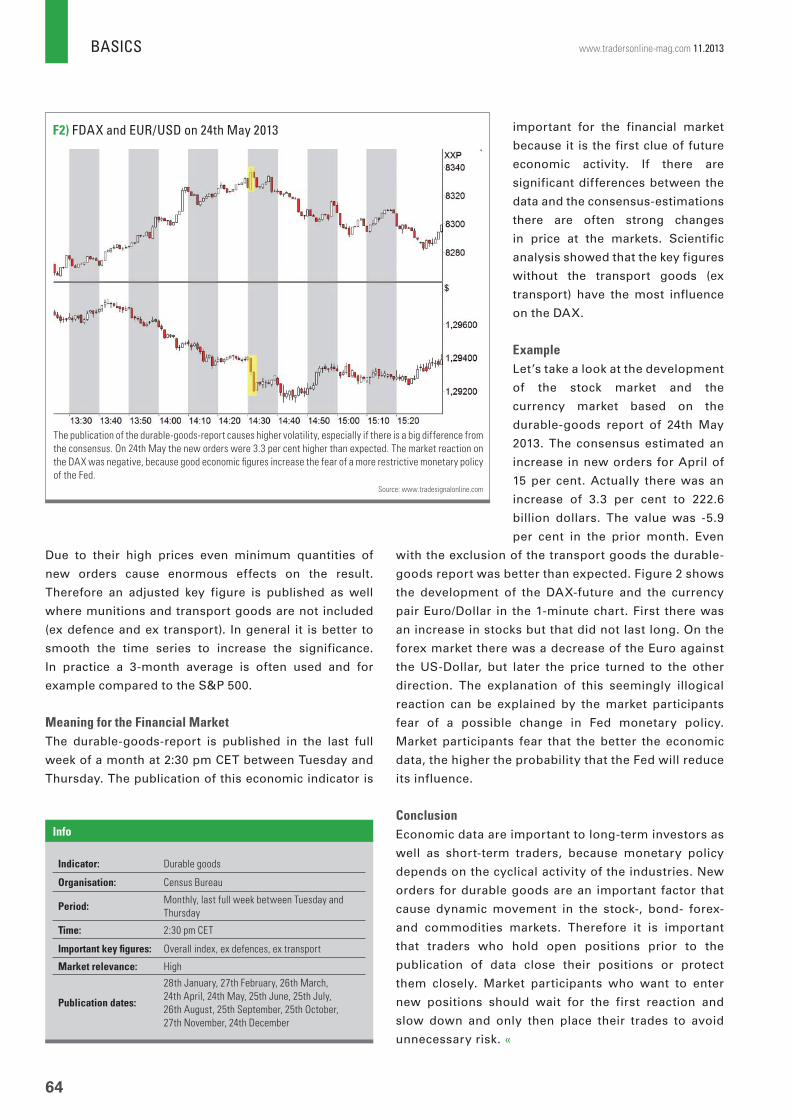
BASICS
64
www.tradersonline-mag.com 11.2013
important for the financial market
because it is the first clue of future
economic activity. If there are
significant differences between the
data and the consensus-estimations
there are often strong changes
in price at the markets. Scientific
analysis showed that the key figures
without the transport goods (ex
transport) have the most influence
on the DAX.
ExampleLet’s take a look at the development
of the stock market and the
currency market based on the
durable-goods report of 24th May
2013. The consensus estimated an
increase in new orders for April of
15 per cent. Actually there was an
increase of 3.3 per cent to 222.6
billion dollars. The value was -5.9
per cent in the prior month. Even
with the exclusion of the transport goods the durable-
goods report was better than expected. Figure 2 shows
the development of the DAX-future and the currency
pair Euro/Dollar in the 1-minute chart. First there was
an increase in stocks but that did not last long. On the
forex market there was a decrease of the Euro against
the US-Dollar, but later the price turned to the other
direction. The explanation of this seemingly illogical
reaction can be explained by the market participants
fear of a possible change in Fed monetary policy.
Market participants fear that the better the economic
data, the higher the probability that the Fed will reduce
its influence.
ConclusionEconomic data are important to long-term investors as
well as short-term traders, because monetary policy
depends on the cyclical activity of the industries. New
orders for durable goods are an important factor that
cause dynamic movement in the stock-, bond- forex-
and commodities markets. Therefore it is important
that traders who hold open positions prior to the
publication of data close their positions or protect
them closely. Market participants who want to enter
new positions should wait for the first reaction and
slow down and only then place their trades to avoid
unnecessary risk. «
The publication of the durable-goods-report causes higher volatility, especially if there is a big difference from
the consensus. On 24th May the new orders were 3.3 per cent higher than expected. The market reaction on
the DAX was negative, because good economic fi gures increase the fear of a more restrictive monetary policy
of the Fed.
Source: www.tradesignalonline.com
F2) FDAX and EUR/USD on 24th May 2013
Indicator: Durable goods
Organisation: Census Bureau
Period: Monthly, last full week between Tuesday and
Thursday
Time: 2:30 pm CET
Important key fi gures: Overall index, ex defences, ex transport
Market relevance: High
Publication dates:
28th January, 27th February, 26th March,
24th April, 24th May, 25th June, 25th July,
26th August, 25th September, 25th October,
27th November, 24th December
Info
Due to their high prices even minimum quantities of
new orders cause enormous effects on the result.
Therefore an adjusted key figure is published as well
where munitions and transport goods are not included
(ex defence and ex transport). In general it is better to
smooth the time series to increase the significance.
In practice a 3-month average is often used and for
example compared to the S&P 500.
Meaning for the Financial MarketThe durable-goods-report is published in the last full
week of a month at 2:30 pm CET between Tuesday and
Thursday. The publication of this economic indicator is

WHY LEARN TO TRADE WITH US?
“This is the best decision I ever made in my life"Pratik Thakar, Customer
Customer Survey
81% rated "Excellent"
Winner of London Investor Show Award 2012
TRADING COLLEGE LTDSandford House, Claremont Rd, Teddington, Middlesex, TW11 8DHTel: 020 3 005 4905 Email: [email protected] Company Registration: 7080671
- VAT number: GB982448189
FOREX, SPREADBETTING, COMMODITIES, STOCKS AND EQUITIES FOR BEGINNERS TO ADVANCED
Courses
DVDs
Trading Videos
Free
Indicators
Trading Room
LivePrivate
Mentorship
PEOPLE
66
www.tradersonline-mag.com 11.2013
The Pro’s Process
In this series we are asking Pro Traders about their psychological processes. Delving a little into how it feels to them when trading.
The good and the bad. How this has changed over time and what preparation they do mentally for performing as a trader. One of the
key features for us was that we wanted traders with experience who have been through the mill over the years and of course, we
appreciate those who were kind enough to talk to us so candidly. We hope this gives developing traders more to learn from. Each
interview in this series was conducted by Richard Chignell who is himself a trader. Please visit his blog at http://embracethetrend.com.
Part 14: Jon Boorman
» Hometown: Charlotte, NC
» Interests: Trading, Music
» Trading Style: Trend Following » Website: www.jonboorman.com
» Richard Chignell: How long have you been trading?Boorman: I’ve held a variety of roles within the fi nancial
industry since 1987. I started with Schroders in London
just a few weeks before my 18th birthday. My fi rst real
break came a few years later when I went from being a
fund manager’s assistant and moved up into the trading
room. They were a fantastic group of people and I learnt
so much. Even before I joined Schroders I had an avid
interest in markets and used to place trades with a broker
in between lectures at college.
Richard Chignell: What style of trading/investing do you practice?Boorman: I’m a technical trader, specifi cally a trend-
follower. It’s taken me many years to get here, to
understand what works best for me, and develop trading
systems and methods that suit my personality and trading
style. I think that’s key. I trade global index, currency and
commodity futures with systematic trend following, and
US stocks with what I call a ‘rules-based discretionary’
style.
Richard Chignell: How do you feel when a trade goes against you?Boorman: I don’t like it, but I accept it readily. As a
trend-follower you typically have more losing trades
than winning ones, but as long as you are disciplined in
executing the time honoured strategy of cutting losers
and running winners, your average win will outweigh
your average loss and make you profi table overall. So
I now look at losing trades as being part of a winning
system.
Richard Chignell: How do you feel when a trade goes for you?Boorman: It feels good as it means I don’t have to do
anything, and for some people that’s the hard bit. The
sitting, waiting, letting those winners run can be diffi cult if
you expose yourself to the noise of news and commentary
bombarding you with reasons to do something.
Richard Chignell: How have these feelings changed over your trading career?
PEOPLE
67
Jon Boorman, CMT, is a market technician and trader with
over 25 years experience in global equity, forex, and futures
markets. He has formerly held roles as a sales trader to
hedge funds and institutions, prop trader, research analyst,
and buy-side head of desk. Jon currently writes the Alpha
Capture blog at jonboorman.com, where he employs trend
following and momentum strategies to generate actionable
trade ideas, and will shortly begin managing money for
clients as President and CEO of Broadsword Capital, LLC.
Jon Boorman
Boorman: Great question. The actual feeling of not liking it
when I lose and enjoying winning hasn’t changed, but the
way I process and act upon those feelings has markedly.
From years of being a buy-side head of desk, a sales trader to
institutions, and a prop trader at an investment bank, I picked
up unhealthy habits of telling people what they want to hear,
and most fatally developed a need to be right, which was
only further fostered by that environment. Now, as a trend
follower, knowing that I will have a low strike rate has all but
removed that ‘need to be right.’ I don’t live from one trade
to the next, each one is a tiny part of an overall process. I
accept that there will be more losers than winners, and I can
never know what each trade brings, so after a while you learn
to treat them all the same with little emotion. Your only job
then is to manage risk to ensure those losses remain small
enough for the big winners to outweigh them monetarily.
Richard Chignell: Do you have any practices that you do away from the trading screen to help you mentally and emotionally handle trading?Boorman: Having young children is certainly a great leveller.
It helps cement what’s really important, and any time spent
with them is a welcome departure from markets. I try to relax
as much as possible to clear the mind, and I think diet and
physical exercise are important too. I’ll happily row for an
hour, or play tennis, anything that gets the blood pumping
and your energy levels higher can only be a good thing.
Beyond that I currently sing in a classic-rock covers band
which is a lot of fun for me, and a good outlet for the ego!
Richard Chignell: Have you always done this?Boorman: In some form or another yes, but I think I
probably thought about it less previously. Now it’s
something I feel like I have to plan or remember to do,
whereas before it was something that happened on the
fl y. Having a family is the big game-changer there in
terms of the time and commitment it demands.
Richard Chignell: How have you learnt to deal with the feelings that come up when trading?Boorman: The difference now is I know what feelings to
expect, I know why I feel that way, and I know how to
deal with it, which stems from becoming more self-aware
over the years.
Richard Chignell: Can you describe a time in your trading life which really rammed home the point that so much of trading comes down to psychological factors?Boorman: I had always believed that psychological factors
play a large part, and have seen people talk about what
percentage of trading is psychological. I’ve got to the
point now where I think it’s 100 per cent psychological.
Every single facet of trading, whether it’s developing
systems, stock picking, entries, exits, position sizing, even
selecting an algorithm and pushing that button, all starts
with human involvement and the biases and emotions we
have that shape our beliefs. What really drove that point
home for me was a lot of the self-work I did after moving
to the US in 2005 when I read some of Van Tharp’s work
and attended one of his courses.
Richard Chignell: If you could give aspiring traders one piece of advice about emotionally handling the market what would it be?Boorman: It all begins with you. Know yourself fi rst, and
then you can recognise your emotions when they reveal
themselves in your trading. It’s like the quote from The
Money Game “If you don’t know who you are, the stock
market is an expensive place to fi nd out.” I can now watch
a situation develop in the market and recognise what the
old me would have done. It doesn’t mean I don’t still feel
those emotions, but I now understand the reasons behind
them, what motivates me, the biases I have, and how to
deal with that. If you can combine self-awareness with
a systematic approach to trading you will signifi cantly
improve your chances of success.
We’d like to thank Jon Boorman for sharing the way he
tackles the market from an emotional/mental side of things
and for his willingness to allow us to post this as a free
resource in the hope that traders who have been in the market
for less time or are thinking of entering can perhaps pick up
some A-HA’s. If you are interested in fi nding more out about
Jon, you can fi nd him
» at his Website: www.jonboorman.com
» on Twitter: @jboorman «

PEOPLE
68
www.tradersonline-mag.com 11.2013
The Journey and Discoveries of a 33 Year Veteran Trader
John Person John Person is a 33 year veteran of the Futures and Options Trading industry. He started on the Floor of the Chicago Mercantile
Exchange back in 1979. He then had the privilege of working with George Lane, the innovator of the Stochastic indicator. John
has worked his way throughout the industry as an independent Trader, Broker, Analyst and Branch Manager for one of Chicago’s
largest fi rms. He is the author of several top rated trading courses and books. He was the fi rst ever to introduce traders to a
powerful combination of candlesticks and pivot point analysis. In 1998, he developed his own proprietary trading system and
began publishing ”The Bottom-Line Financial and Futures Newsletter”, a monthly publication that incorporates fundamental
developments as well as technical analysis that includes the data from his trading system, with his powerful indicator “Persons
Pivots”. John is widely quoted in the industry and a sought after speaker for many of the worlds top professional organisations.

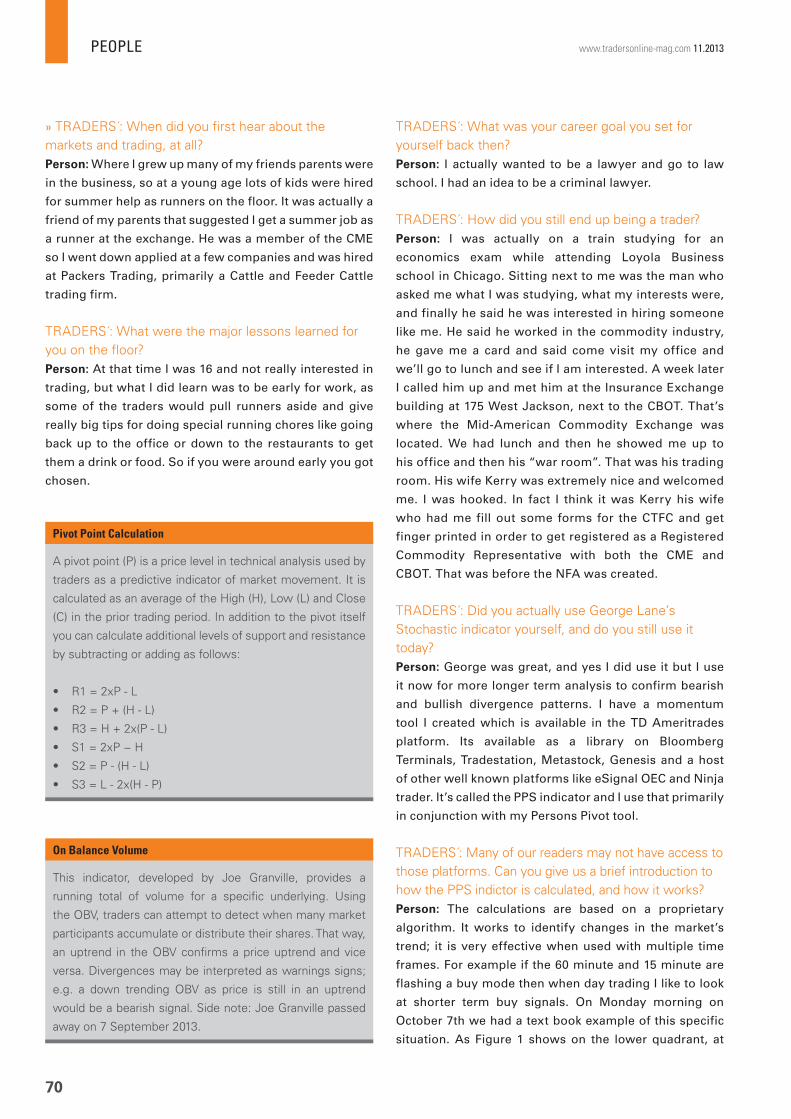
PEOPLE
70
www.tradersonline-mag.com 11.2013
» TRADERS :́ When did you fi rst hear about the markets and trading, at all?Person: Where I grew up many of my friends parents were
in the business, so at a young age lots of kids were hired
for summer help as runners on the floor. It was actually a
friend of my parents that suggested I get a summer job as
a runner at the exchange. He was a member of the CME
so I went down applied at a few companies and was hired
at Packers Trading, primarily a Cattle and Feeder Cattle
trading firm.
TRADERS :́ What were the major lessons learned for you on the fl oor?Person: At that time I was 16 and not really interested in
trading, but what I did learn was to be early for work, as
some of the traders would pull runners aside and give
really big tips for doing special running chores like going
back up to the office or down to the restaurants to get
them a drink or food. So if you were around early you got
chosen.
TRADERS :́ What was your career goal you set for yourself back then? Person: I actually wanted to be a lawyer and go to law
school. I had an idea to be a criminal lawyer.
TRADERS :́ How did you still end up being a trader?Person: I was actually on a train studying for an
economics exam while attending Loyola Business
school in Chicago. Sitting next to me was the man who
asked me what I was studying, what my interests were,
and finally he said he was interested in hiring someone
like me. He said he worked in the commodity industry,
he gave me a card and said come visit my office and
we’ll go to lunch and see if I am interested. A week later
I called him up and met him at the Insurance Exchange
building at 175 West Jackson, next to the CBOT. That’s
where the Mid-American Commodity Exchange was
located. We had lunch and then he showed me up to
his office and then his “war room”. That was his trading
room. His wife Kerry was extremely nice and welcomed
me. I was hooked. In fact I think it was Kerry his wife
who had me fill out some forms for the CTFC and get
finger printed in order to get registered as a Registered
Commodity Representative with both the CME and
CBOT. That was before the NFA was created.
TRADERS :́ Did you actually use George Lane’s Stochastic indicator yourself, and do you still use it today?Person: George was great, and yes I did use it but I use
it now for more longer term analysis to confirm bearish
and bullish divergence patterns. I have a momentum
tool I created which is available in the TD Ameritrades
platform. Its available as a library on Bloomberg
Terminals, Tradestation, Metastock, Genesis and a host
of other well known platforms like eSignal OEC and Ninja
trader. It’s called the PPS indicator and I use that primarily
in conjunction with my Persons Pivot tool.
TRADERS :́ Many of our readers may not have access to those platforms. Can you give us a brief introduction to how the PPS indictor is calculated, and how it works?Person: The calculations are based on a proprietary
algorithm. It works to identify changes in the market’s
trend; it is very effective when used with multiple time
frames. For example if the 60 minute and 15 minute are
flashing a buy mode then when day trading I like to look
at shorter term buy signals. On Monday morning on
October 7th we had a text book example of this specific
situation. As Figure 1 shows on the lower quadrant, at
A pivot point (P) is a price level in technical analysis used by
traders as a predictive indicator of market movement. It is
calculated as an average of the High (H), Low (L) and Close
(C) in the prior trading period. In addition to the pivot itself
you can calculate additional levels of support and resistance
by subtracting or adding as follows:
• R1 = 2xP - L
• R2 = P + (H - L)
• R3 = H + 2x(P - L)
• S1 = 2xP − H
• S2 = P - (H - L)
• S3 = L - 2x(H - P)
Pivot Point Calculation
This indicator, developed by Joe Granville, provides a
running total of volume for a specifi c underlying. Using
the OBV, traders can attempt to detect when many market
participants accumulate or distribute their shares. That way,
an uptrend in the OBV confi rms a price uptrend and vice
versa. Divergences may be interpreted as warnings signs;
e.g. a down trending OBV as price is still in an uptrend
would be a bearish signal. Side note: Joe Granville passed
away on 7 September 2013.
On Balance Volume
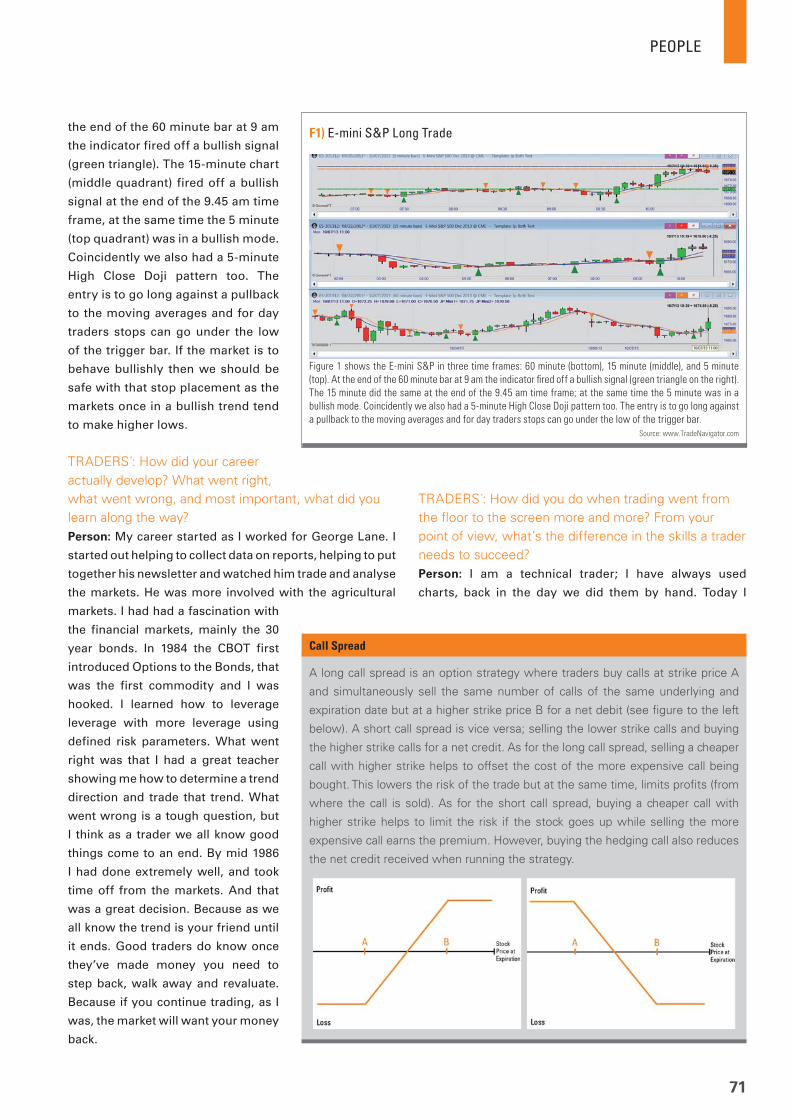
PEOPLE
71
the end of the 60 minute bar at 9 am
the indicator fired off a bullish signal
(green triangle). The 15-minute chart
(middle quadrant) fired off a bullish
signal at the end of the 9.45 am time
frame, at the same time the 5 minute
(top quadrant) was in a bullish mode.
Coincidently we also had a 5-minute
High Close Doji pattern too. The
entry is to go long against a pullback
to the moving averages and for day
traders stops can go under the low
of the trigger bar. If the market is to
behave bullishly then we should be
safe with that stop placement as the
markets once in a bullish trend tend
to make higher lows.
TRADERS :́ How did your career actually develop? What went right, what went wrong, and most important, what did you learn along the way? Person: My career started as I worked for George Lane. I
started out helping to collect data on reports, helping to put
together his newsletter and watched him trade and analyse
the markets. He was more involved with the agricultural
markets. I had had a fascination with
the financial markets, mainly the 30
year bonds. In 1984 the CBOT first
introduced Options to the Bonds, that
was the first commodity and I was
hooked. I learned how to leverage
leverage with more leverage using
defined risk parameters. What went
right was that I had a great teacher
showing me how to determine a trend
direction and trade that trend. What
went wrong is a tough question, but
I think as a trader we all know good
things come to an end. By mid 1986
I had done extremely well, and took
time off from the markets. And that
was a great decision. Because as we
all know the trend is your friend until
it ends. Good traders do know once
they’ve made money you need to
step back, walk away and revaluate.
Because if you continue trading, as I
was, the market will want your money
back.
TRADERS :́ How did you do when trading went from the fl oor to the screen more and more? From your point of view, what’s the difference in the skills a trader needs to succeed? Person: I am a technical trader; I have always used
charts, back in the day we did them by hand. Today I
Figure 1 shows the E-mini S&P in three time frames: 60 minute (bottom), 15 minute (middle), and 5 minute
(top). At the end of the 60 minute bar at 9 am the indicator fi red off a bullish signal (green triangle on the right).
The 15 minute did the same at the end of the 9.45 am time frame; at the same time the 5 minute was in a
bullish mode. Coincidently we also had a 5-minute High Close Doji pattern too. The entry is to go long against
a pullback to the moving averages and for day traders stops can go under the low of the trigger bar.
Source: www.TradeNavigator.com
F1) E-mini S&P Long Trade
A long call spread is an option strategy where traders buy calls at strike price A
and simultaneously sell the same number of calls of the same underlying and
expiration date but at a higher strike price B for a net debit (see fi gure to the left
below). A short call spread is vice versa; selling the lower strike calls and buying
the higher strike calls for a net credit. As for the long call spread, selling a cheaper
call with higher strike helps to offset the cost of the more expensive call being
bought. This lowers the risk of the trade but at the same time, limits profi ts (from
where the call is sold). As for the short call spread, buying a cheaper call with
higher strike helps to limit the risk if the stock goes up while selling the more
expensive call earns the premium. However, buying the hedging call also reduces
the net credit received when running the strategy.
Call Spread
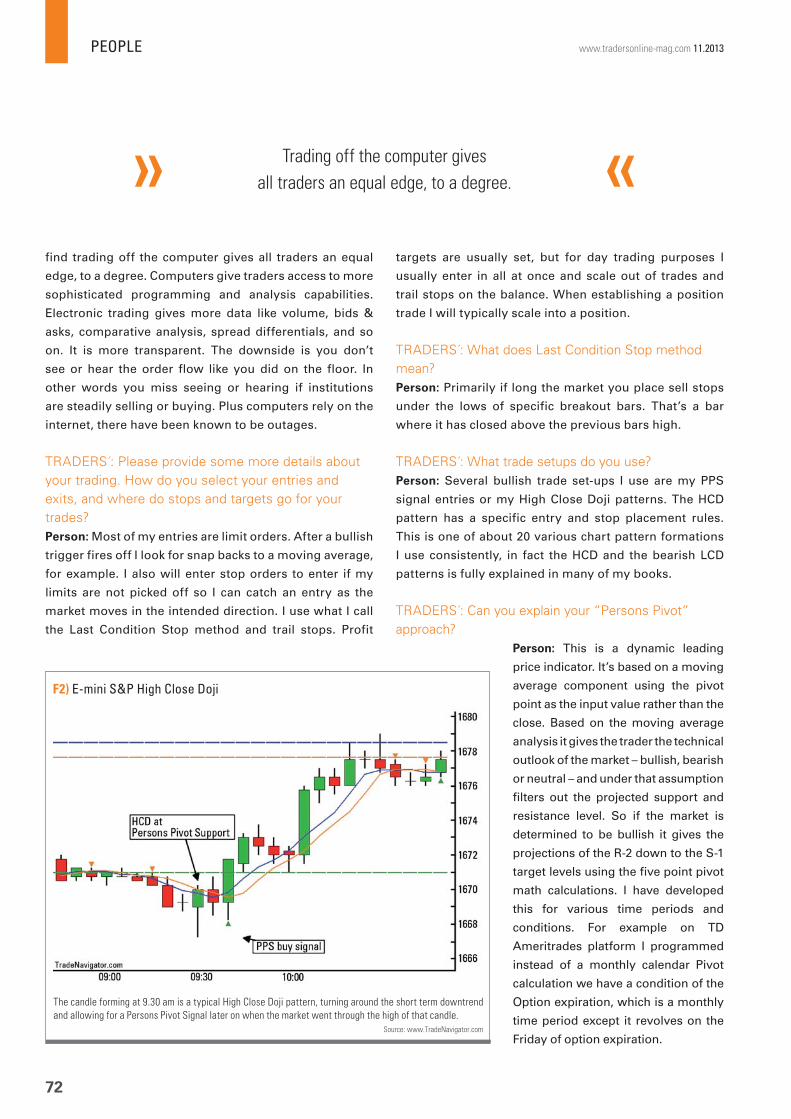
PEOPLE
72
www.tradersonline-mag.com 11.2013
targets are usually set, but for day trading purposes I
usually enter in all at once and scale out of trades and
trail stops on the balance. When establishing a position
trade I will typically scale into a position.
TRADERS :́ What does Last Condition Stop method mean?Person: Primarily if long the market you place sell stops
under the lows of specific breakout bars. That’s a bar
where it has closed above the previous bars high.
TRADERS :́ What trade setups do you use?Person: Several bullish trade set-ups I use are my PPS
signal entries or my High Close Doji patterns. The HCD
pattern has a specific entry and stop placement rules.
This is one of about 20 various chart pattern formations
I use consistently, in fact the HCD and the bearish LCD
patterns is fully explained in many of my books.
TRADERS :́ Can you explain your “Persons Pivot” approach?
Person: This is a dynamic leading
price indicator. It’s based on a moving
average component using the pivot
point as the input value rather than the
close. Based on the moving average
analysis it gives the trader the technical
outlook of the market – bullish, bearish
or neutral – and under that assumption
filters out the projected support and
resistance level. So if the market is
determined to be bullish it gives the
projections of the R-2 down to the S-1
target levels using the five point pivot
math calculations. I have developed
this for various time periods and
conditions. For example on TD
Ameritrades platform I programmed
instead of a monthly calendar Pivot
calculation we have a condition of the
Option expiration, which is a monthly
time period except it revolves on the
Friday of option expiration.
find trading off the computer gives all traders an equal
edge, to a degree. Computers give traders access to more
sophisticated programming and analysis capabilities.
Electronic trading gives more data like volume, bids &
asks, comparative analysis, spread differentials, and so
on. It is more transparent. The downside is you don’t
see or hear the order flow like you did on the floor. In
other words you miss seeing or hearing if institutions
are steadily selling or buying. Plus computers rely on the
internet, there have been known to be outages.
TRADERS :́ Please provide some more details about your trading. How do you select your entries and exits, and where do stops and targets go for your trades?Person: Most of my entries are limit orders. After a bullish
trigger fires off I look for snap backs to a moving average,
for example. I also will enter stop orders to enter if my
limits are not picked off so I can catch an entry as the
market moves in the intended direction. I use what I call
the Last Condition Stop method and trail stops. Profit
The candle forming at 9.30 am is a typical High Close Doji pattern, turning around the short term downtrend
and allowing for a Persons Pivot Signal later on when the market went through the high of that candle.
Source: www.TradeNavigator.com
F2) E-mini S&P High Close Doji
Trading off the computer gives
all traders an equal edge, to a degree.

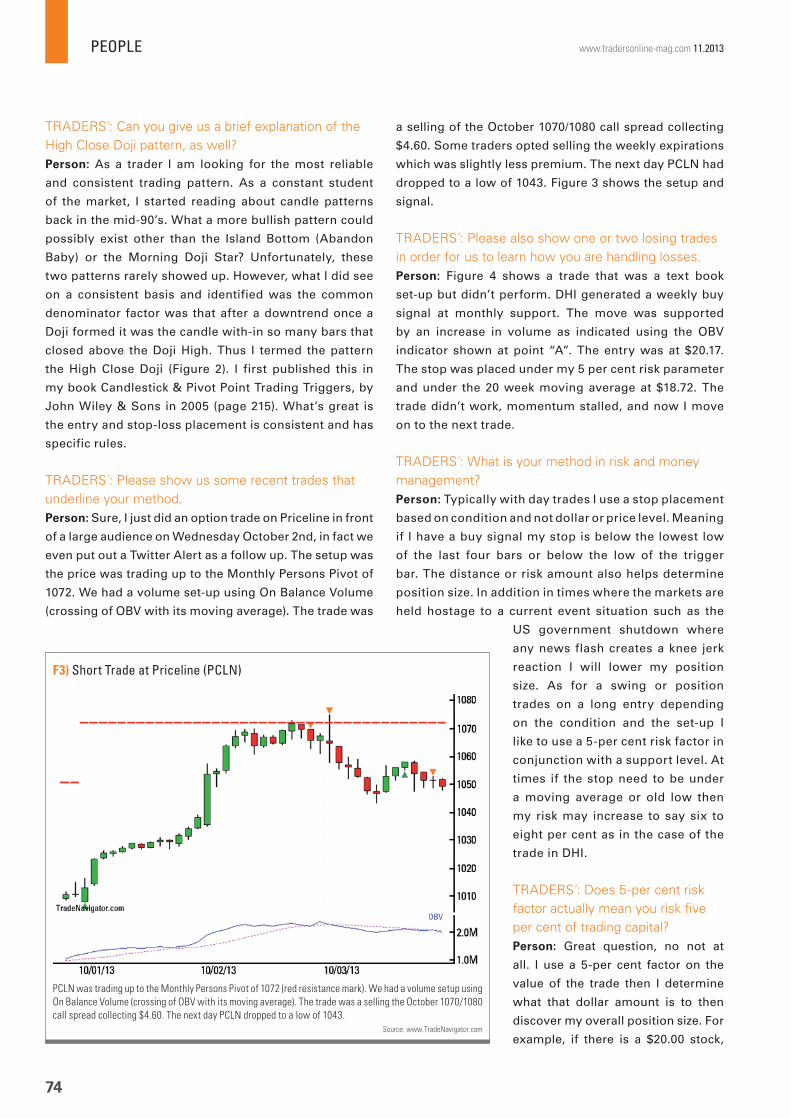
PEOPLE
74
www.tradersonline-mag.com 11.2013
a selling of the October 1070/1080 call spread collecting
$4.60. Some traders opted selling the weekly expirations
which was slightly less premium. The next day PCLN had
dropped to a low of 1043. Figure 3 shows the setup and
signal.
TRADERS :́ Please also show one or two losing trades in order for us to learn how you are handling losses.Person: Figure 4 shows a trade that was a text book
set-up but didn’t perform. DHI generated a weekly buy
signal at monthly support. The move was supported
by an increase in volume as indicated using the OBV
indicator shown at point “A”. The entry was at $20.17.
The stop was placed under my 5 per cent risk parameter
and under the 20 week moving average at $18.72. The
trade didn’t work, momentum stalled, and now I move
on to the next trade.
TRADERS :́ What is your method in risk and money management?Person: Typically with day trades I use a stop placement
based on condition and not dollar or price level. Meaning
if I have a buy signal my stop is below the lowest low
of the last four bars or below the low of the trigger
bar. The distance or risk amount also helps determine
position size. In addition in times where the markets are
held hostage to a current event situation such as the
US government shutdown where
any news flash creates a knee jerk
reaction I will lower my position
size. As for a swing or position
trades on a long entry depending
on the condition and the set-up I
like to use a 5-per cent risk factor in
conjunction with a support level. At
times if the stop need to be under
a moving average or old low then
my risk may increase to say six to
eight per cent as in the case of the
trade in DHI.
TRADERS :́ Does 5-per cent risk factor actually mean you risk fi ve per cent of trading capital? Person: Great question, no not at
all. I use a 5-per cent factor on the
value of the trade then I determine
what that dollar amount is to then
discover my overall position size. For
example, if there is a $20.00 stock,
PCLN was trading up to the Monthly Persons Pivot of 1072 (red resistance mark). We had a volume setup using
On Balance Volume (crossing of OBV with its moving average). The trade was a selling the October 1070/1080
call spread collecting $4.60. The next day PCLN dropped to a low of 1043.
Source: www.TradeNavigator.com
F3) Short Trade at Priceline (PCLN)
TRADERS :́ Can you give us a brief explanation of the High Close Doji pattern, as well?Person: As a trader I am looking for the most reliable
and consistent trading pattern. As a constant student
of the market, I started reading about candle patterns
back in the mid-90’s. What a more bullish pattern could
possibly exist other than the Island Bottom (Abandon
Baby) or the Morning Doji Star? Unfortunately, these
two patterns rarely showed up. However, what I did see
on a consistent basis and identified was the common
denominator factor was that after a downtrend once a
Doji formed it was the candle with-in so many bars that
closed above the Doji High. Thus I termed the pattern
the High Close Doji (Figure 2). I first published this in
my book Candlestick & Pivot Point Trading Triggers, by
John Wiley & Sons in 2005 (page 215). What’s great is
the entry and stop-loss placement is consistent and has
specific rules.
TRADERS :́ Please show us some recent trades that underline your method.Person: Sure, I just did an option trade on Priceline in front
of a large audience on Wednesday October 2nd, in fact we
even put out a Twitter Alert as a follow up. The setup was
the price was trading up to the Monthly Persons Pivot of
1072. We had a volume set-up using On Balance Volume
(crossing of OBV with its moving average). The trade was
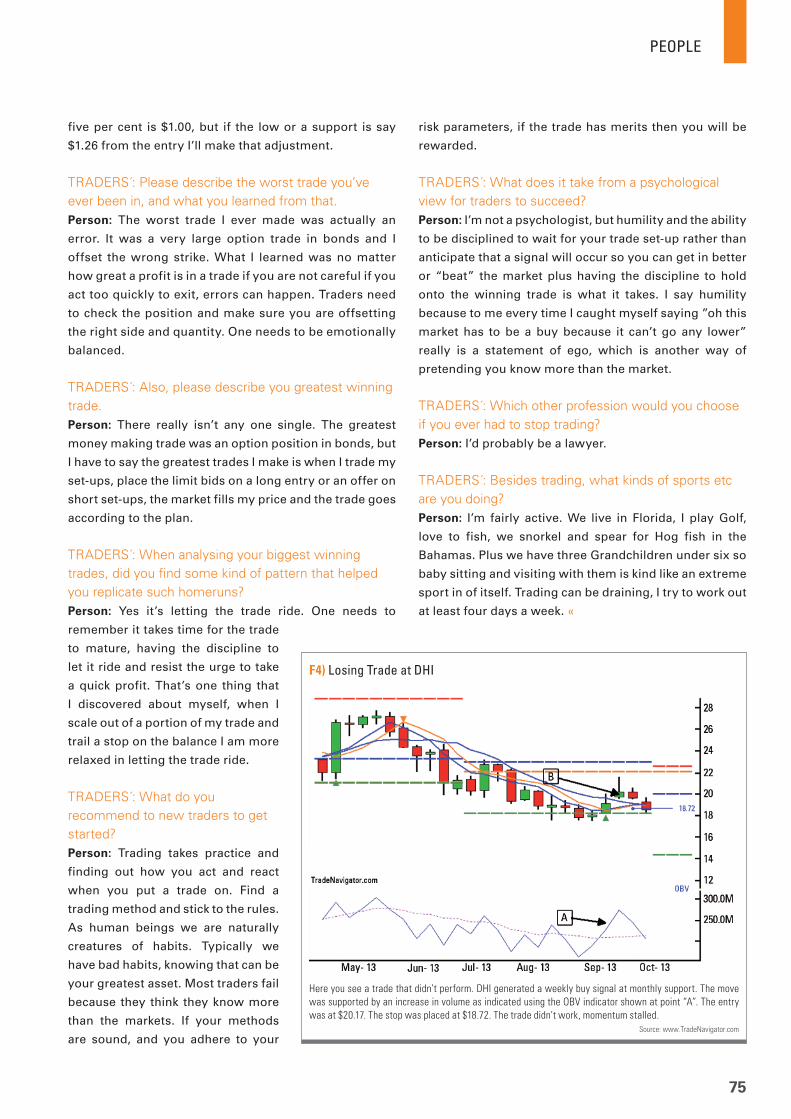
PEOPLE
75
five per cent is $1.00, but if the low or a support is say
$1.26 from the entry I’ll make that adjustment.
TRADERS :́ Please describe the worst trade you’ve ever been in, and what you learned from that.Person: The worst trade I ever made was actually an
error. It was a very large option trade in bonds and I
offset the wrong strike. What I learned was no matter
how great a profit is in a trade if you are not careful if you
act too quickly to exit, errors can happen. Traders need
to check the position and make sure you are offsetting
the right side and quantity. One needs to be emotionally
balanced.
TRADERS :́ Also, please describe you greatest winning trade.Person: There really isn’t any one single. The greatest
money making trade was an option position in bonds, but
I have to say the greatest trades I make is when I trade my
set-ups, place the limit bids on a long entry or an offer on
short set-ups, the market fills my price and the trade goes
according to the plan.
TRADERS :́ When analysing your biggest winning trades, did you fi nd some kind of pattern that helped you replicate such homeruns?Person: Yes it’s letting the trade ride. One needs to
remember it takes time for the trade
to mature, having the discipline to
let it ride and resist the urge to take
a quick profit. That’s one thing that
I discovered about myself, when I
scale out of a portion of my trade and
trail a stop on the balance I am more
relaxed in letting the trade ride.
TRADERS :́ What do you recommend to new traders to get started?Person: Trading takes practice and
finding out how you act and react
when you put a trade on. Find a
trading method and stick to the rules.
As human beings we are naturally
creatures of habits. Typically we
have bad habits, knowing that can be
your greatest asset. Most traders fail
because they think they know more
than the markets. If your methods
are sound, and you adhere to your
risk parameters, if the trade has merits then you will be
rewarded.
TRADERS :́ What does it take from a psychological view for traders to succeed?Person: I’m not a psychologist, but humility and the ability
to be disciplined to wait for your trade set-up rather than
anticipate that a signal will occur so you can get in better
or “beat” the market plus having the discipline to hold
onto the winning trade is what it takes. I say humility
because to me every time I caught myself saying ”oh this
market has to be a buy because it can’t go any lower”
really is a statement of ego, which is another way of
pretending you know more than the market.
TRADERS :́ Which other profession would you choose if you ever had to stop trading?Person: I’d probably be a lawyer.
TRADERS :́ Besides trading, what kinds of sports etc are you doing?Person: I’m fairly active. We live in Florida, I play Golf,
love to fish, we snorkel and spear for Hog fish in the
Bahamas. Plus we have three Grandchildren under six so
baby sitting and visiting with them is kind like an extreme
sport in of itself. Trading can be draining, I try to work out
at least four days a week. «
Here you see a trade that didn’t perform. DHI generated a weekly buy signal at monthly support. The move
was supported by an increase in volume as indicated using the OBV indicator shown at point “A”. The entry
was at $20.17. The stop was placed at $18.72. The trade didn’t work, momentum stalled.
Source: www.TradeNavigator.com
F4) Losing Trade at DHI

SEMINARS
76
www.tradersonline-mag.com 11.2013
Date Seminar Firm Location Website
01.11.2013 Free Forex Seminar Knowledge To Action Ltd. Canary Wharf www.knowledgetoaction.co.uk
03.11.2013 Stock Market Seminar Knowledge To Action Ltd. London, Waterloo www.knowledgetoaction.co.uk
03.11.2013 Stock Market Seminar Knowledge To Action Ltd. Wembley Stadium www.knowledgetoaction.co.uk
03.11.2013 Free Forex Seminar Knowledge To Action Ltd. London, Waterloo www.knowledgetoaction.co.uk
04.11.2013 Stock Market Seminar Knowledge To Action Ltd. Chester www.knowledgetoaction.co.uk
04.11.2013 Free Forex Seminar Knowledge To Action Ltd. Oxford Circus www.knowledgetoaction.co.uk
04.11.2013 Physical Natural Gas Trading Energy Management Institute Houston www.energyinstitution.org
05.11.2013 Free Forex Seminar Knowledge To Action Ltd. Knightsbridge www.knowledgetoaction.co.uk
06.11.2013 Free Forex Seminar Knowledge To Action Ltd.London Liverpool
Streetwww.knowledgetoaction.co.uk
06.11.2013How to Automate and Seize Opportunities in a Up or
Down Market with CFD?Phillip Securities Pte Ltd Singapore www.phillipcfd.com
06.11.2013Technical Analysis: Gaining Confi rmation and
Managing RiskFidelity Investments Denver www.fi delity.com
07.11.2013 Stock Market Seminar Knowledge To Action Ltd. Kensington www.knowledgetoaction.co.uk
07.11.2013 Free Forex Seminar Knowledge To Action Ltd. Kensington www.knowledgetoaction.co.uk
08.11.2013 Market Outlook & Individual Stock Analysis Phillip Securities Pte Ltd Singapore www.phillipcfd.com
08.11.2013 Secrets of Fibonacci & Selection of Quality Stocks Phillip Securities Pte Ltd Singapore www.phillipcfd.com
11.11.2013 Stock Market Seminar Knowledge To Action Ltd. Portsmouth www.knowledgetoaction.co.uk
11.11.2013 Free Forex Seminar Knowledge To Action Ltd. Victoria www.knowledgetoaction.co.uk
13.11.2013 Free Forex Seminar Knowledge To Action Ltd. Marble Arch www.knowledgetoaction.co.uk
13.11.2013 A to Z of Equities CFD Trading seminar Phillip Securities Pte Ltd Singapore www.phillipcfd.com
13.11.2013 Introduction to Energy Trading & Hedging Energy Management Institute New York www.energyinstitution.org
13.11.2013 Understanding Exchange-Traded Funds (ETFs) Fidelity Investments Nashville www.fi delity.com
14.11.2013 Understanding Exchange-Traded Funds (ETFs) Fidelity Investments Annapolis www.fi delity.com
15.11.2013 Technical Analysis: Identifying Chart Patterns Fidelity Investments Denver www.fi delity.com
18.11.2013 Futures, Options & Derivatives Energy Management Institute Houston www.energyinstitution.org
19.11.2013 Energy Trading Fundamentals Energy Management Institute Chicago www.energyinstitution.org
19.11.2013 Understanding Exchange-Traded Funds (ETFs) Fidelity Investments Indianapolis www.fi delity.com
20.11.2013 Introduction to Energy Trading & Hedging Energy Management Institute Houston www.energyinstitution.org
21.11.2013 Introduction to Hedging with Options London Metal Exchange Istanbul www.lme.com
26.11.2013 Introduction to the LME London Metal Exchange London www.lme.com
27.11.2013 Introduction to Hedging with Futures and LMEswaps London Metal Exchange London www.lme.com
29.11.2013 Introduction to Physical Trading & Warehousing London Metal Exchange Shanghai www.lme.com
Important Dates for Your Calendar

New York's leading conference on quantitative
investment and tradingDecember 3-4, 2013, Tribeca 360, New York, NY
Join us at Quant Invest New York, where top quant funds, traders and investors using quant approaches come to debate recent advances in portfolio optimization, modeling, technology and risk management.
Marcos Lopez de Prado
Head of Quantitative Trading & Research
Hess Energy Trading
Company
Attilio Meucci
Chief Risk OfficerKKR
David Rukshin
Senior Vice President, InfrastructureD.E. Shaw
Over 30 quant expert speakers confirmed including:
Register now to secure your most competitive rate. To register go to www.
terrapinn.com/QuantNYTradersMag or call +1 212 379 6320
Register now to secure your place.
www.terrapinn.com/QuantNYTradersMag
NEW YORK 2013
2013
spon
sors
tel the interconnection &data center company
PRISM GLOBAL TECH

COLUMN
78
www.tradersonline-mag.com 11.2013
The Key to Success Lies “Within”» There is no such thing as reality. Well-known management
trainer Vera F. Birkenbihl talked about reality and cognition
and about the fact that we often complement situations by
our experiences from our past – most of the time from our
childhood. Everything that we traders notice daily in front
of our screens has little to do with reality but is our own
cognition. Everybody who treats daytrading as a business
will analyse the market according to his business plan.
There are several possibilities that can be divided into two
main groups. One group is traders who like fundamental
analysis. These traders are often invested long term. The
second group is the technicians who trade short term.
We want to highlight “market mechanics” (this trading
method, in German “Markttechnik”, was developed by
German trader Michael Voigt) which is related to technical
analysis. The technical analyst tries to deduce future price
developments of an underlying based on the examination
of past price development; the approach of market
mechanics examines price development by considering
the behaviour of different market participants.
The trader must never forget that what he sees is
only his own selective cognition – despite all the ways
of analysing the market. We always see the world like
we think it is. The process is simple: all information that
we receive is unconsciously divided into important and
unimportant information. We only notice what we find
important. All unimportant information is ignored by
our consciousness. You have to imagine the effect if all
bits of information that affect you right now would be
noticed 100 per cent. Your mind would collapse with all
this information! In general, selective perception is an
important and precious protection mechanism. The big
question is what does a single trader find important or
unimportant.
Different factors influence our cognition and therefore
our actions. First of all there are our values. If for example
a child learns from its parents that money destroys
character, rich people are cheats and you have to work
hard for your money, then trading is inconsistent with our
values, because you cannot earn more money in a short
time anywhere other than on the international financial
markets. You have to know that it is a basic need of humans
to be loved and respected. This need can be expressed in
different ways, but there is always a feeling related to it. If
a trader learned as a child that much money equals being a
bad guy, then he internalised an unconscious program that
will get in the way of his long term success in trading. But
in general the trader is not aware of this fact and therefore
he often searches for solutions to improve his trading.
Professional traders know that the solution can be found
within oneself. So professional traders practise mental
training to be successful – just like professional athletes.
The fact that 90 per cent of all traders lose money
in the markets shows that mental training is missing in
trading. If you want to be a professional trader you have
to develop your own mental abilities. Mental training
enables the trader to recognise his subconscious values
prohibiting his success and to transform the feelings
underneath. False beliefs cannot be easily deleted
because the of underlying feelings cause our actions.
Feelings are another form of energy, and energy cannot
be deleted, but it can be transformed. «
Thilo C. Herr deals with mental blockades and their solutions. He knows from many years of experience how false values can infl uence the success of a trader. He is publisher of the mental training tool for daytraders “Der Mental Trader” in German and he works as
private coach.
Contact: [email protected]
website: www.mentaltrader.de

“I’m a day trader. What can MetaStock do for me?”
Loaded with real-time news & data, fundamentals, economic reporting, analytics, and much more, MetaStock XENITHtm is quite simply the most powerful platform available to the private trader. MetaStock XENITH is a comprehensive and flexible system with extremely powerful search capabilities and an impressive array of options tools. Couple this with the MetaStock Pro PowerTools, and you will wonder how you ever traded without it.
METASTOCK : Power to the Private Trader
Try MetaStock FREE for 30 days!metastock.com/tradersezine