e r s t e g r o u p aafbr conference bucharest, november 2010 outlook on the cee region financial...
TRANSCRIPT
E R S T E G R O U P
AAFBR ConferenceBucharest, November 2010
Outlook on the CEE Region Financial Markets & Debt
Fritz Mostböck, CEFAHead of Group Research
E R S T E G R O U P
BucharestNovember 2010
AAFBR Conference2
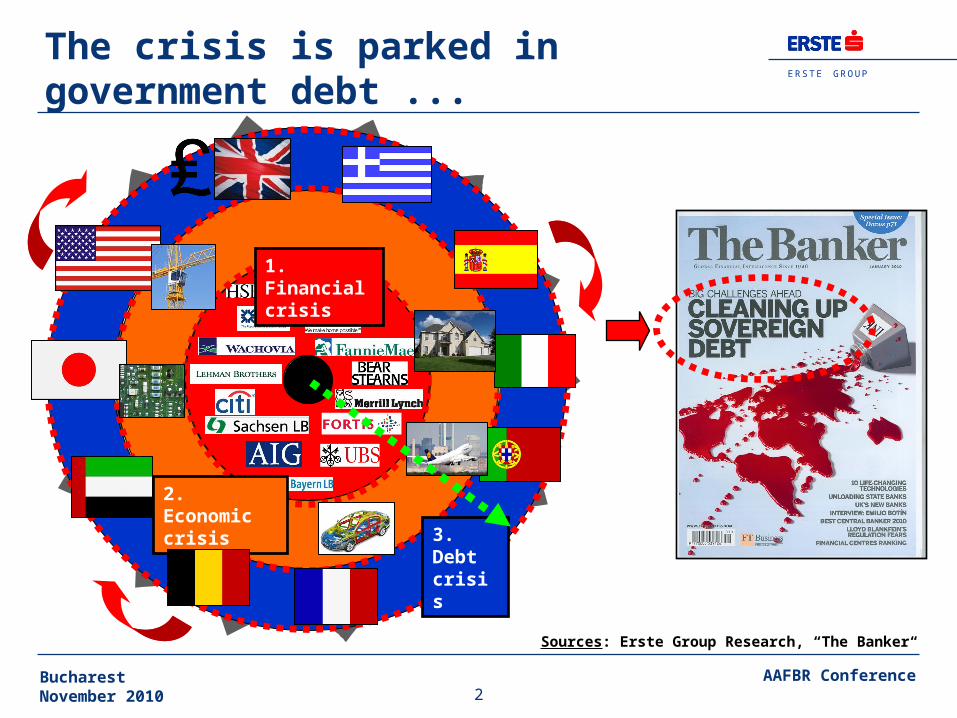
The crisis is parked in government debt ...
Sources: Erste Group Research, “The Banker“
2. Economic crisis
1. Financial crisis
3. Debt crisis
E R S T E G R O U P
BucharestNovember 2010
AAFBR Conference3
CEE: economy andgovernment debt
E R S T E G R O U P
BucharestNovember 2010
AAFBR Conference4
-18
-13
-8
-3
2
7
12
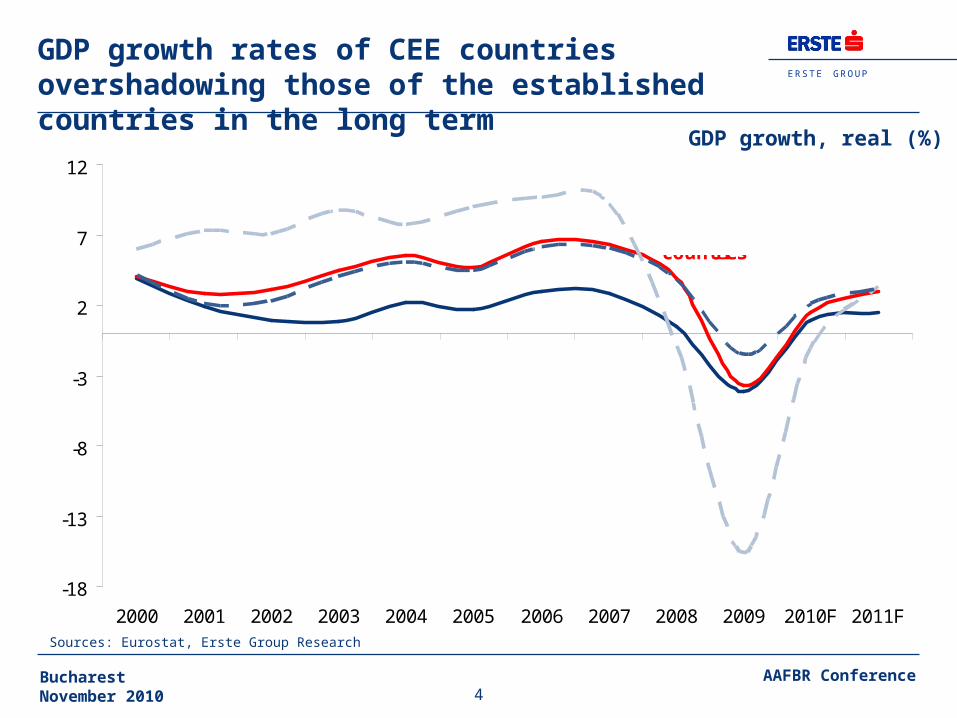
2000 2001 2002 2003 2004 2005 2006 2007 2008 2009 2010F 2011F
Euro Area
New EU membercountries
Baltics
Baltics
CEE4
Sources: Eurostat, Erste Group Research
GDP growth, real (%)
GDP growth rates of CEE countries overshadowing those of the established countries in the long term
E R S T E G R O U P
BucharestNovember 2010
AAFBR Conference5
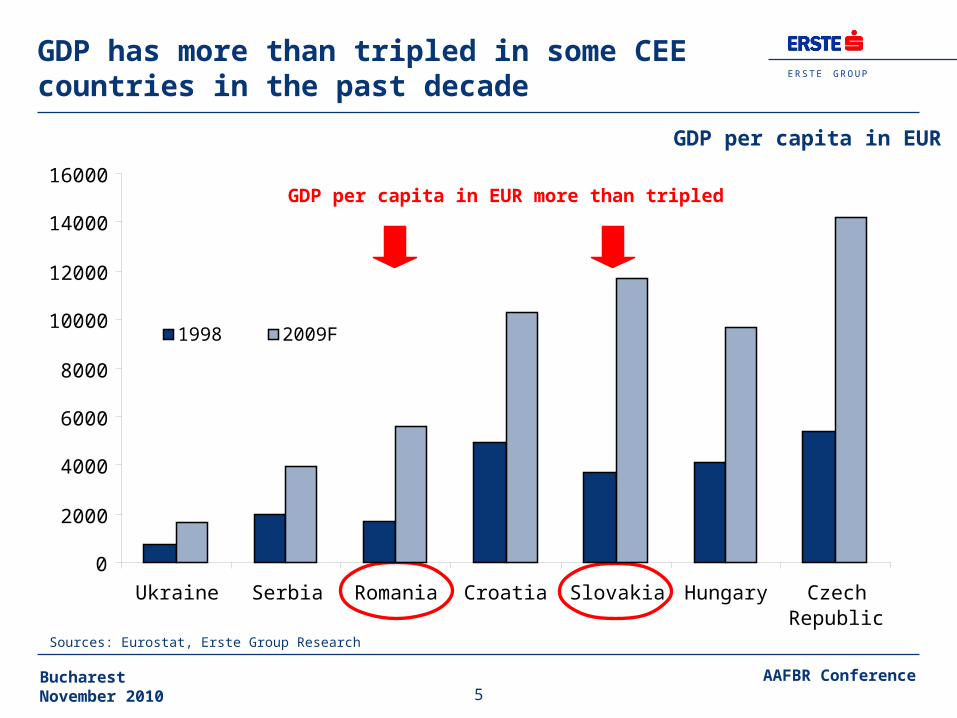
GDP has more than tripled in some CEE countries in the past decade
Sources: Eurostat, Erste Group Research
GDP per capita in EUR
0
2000
4000
6000
8000
10000
12000
14000
16000
Ukraine Serbia Romania Croatia Slovakia Hungary CzechRepublic
1998 2009F
GDP per capita in EUR more than tripled
E R S T E G R O U P
BucharestNovember 2010
AAFBR Conference6
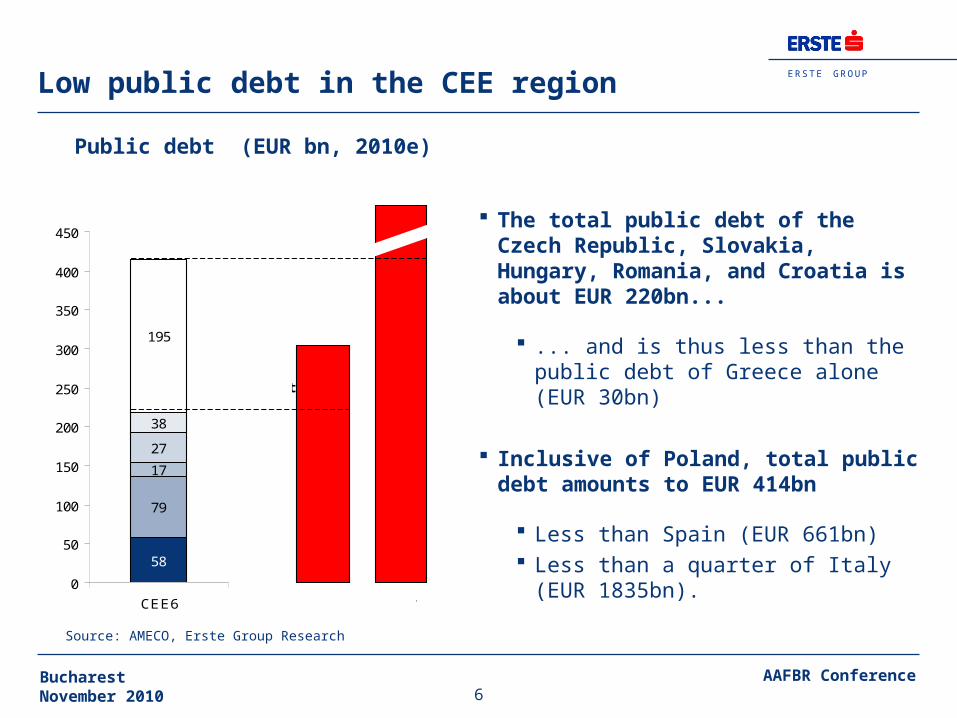
Source: AMECO, Erste Group Research
Public debt (EUR bn, 2010e)
Low public debt in the CEE region
The total public debt of the Czech Republic, Slovakia, Hungary, Romania, and Croatia is about EUR 220bn...
... and is thus less than the public debt of Greece alone (EUR 30bn)
Inclusive of Poland, total public debt amounts to EUR 414bn
Less than Spain (EUR 661bn) Less than a quarter of Italy (EUR
1835bn).
17
58
79
27
38
195
0
50
100
150
200
250
300
350
400
450
CEE6 Greece Italy
1835
300
CZ
HU
HR
SKRO
PLPublic debt excl. Poland is considerbably below the debt of Greece
CEE6 public debt is less than a quarter of Italy's

E R S T E G R O U P
BucharestNovember 2010
AAFBR Conference7
In terms of GDP, public debt is low and certainly (well) below the Eurozone average
All CEE countries except Hungary have maintained their aggregate debt below 60% of GDP
Hungarian debt is below the Eurozone average
The share of government bonds held outside the respective countries is relatively low in the CEE region
in CEE6 it accounts for about a quarter of public debt or 22-23% of GDP
In Greece the share accounts for two thirds of public debt or 90% of GDP
Public debt (in % of GDP, 2010e)
Sources: AMECO, JEDH, Erste Group Research
10
8,5
6,6
5
6,3
7,3
4
6,1
7,5
125118
9994
8685
7784
79
7979
70
6566
5551
574242
374040
3017
9.4
5.2
5
10
8.5
6.6
11.7
8
11.8
4
5
4.7
9.8
6.3
7.3
4
4.7
6.1
7.5
4.8
5.5
5.3
7.8
2.8
0 20 40 60 80 100 120 140
GreeceItaly
BelgiumUSA
Portugal
EurozoneIrland
FranceUK
HungaryGermany
Austria
SpainNetherlands
Poland
FinlandCroatia
SloveniaSlovakia
SerbiaUkraine
Czech Republic
RomaniaBulgaria
Debt Deficit
Euro Areaaverage (2010E)
Maastrichtlimit

E R S T E G R O U P
BucharestNovember 2010
AAFBR Conference8
Recovery clearly noticeable, but base level and speed are very mixed
Source: Erste Group Research
q/q GDP growth (%)
Differentiation between the various countries is therefore crucial, PL, CZ, and SK ahead, H and RO with a time lag / flatter development.
-2
-1.5
-1
-0.5
0
0.5
1
1.5
2
Hungary Romania Czech Republic Poland Slovakia
2Q09
3Q09
4Q09
1Q10
2Q10
Q310e
Q410e

E R S T E G R O U P
BucharestNovember 2010
AAFBR Conference9
Substantially lower cost of labour and solid growth of productivity
Cost of labour (inclusive of social
contributions) in CEE account for half
of those in Spain and a third of those in
Germany
This relation has even improved as a
consequence of the depreciation of
local currencies
ROE much higher in CEE because of
lower unit cost of labour
0 10 20 30 40 50
Romania
Poland
Hungary
Slovakia
CzechRepublic
Croatia
Portugal
Greece
Spain
Germany
2010
2009
2008
2007
Nominal compensation per employee (EUR ‘000)
Sourceds: AMECO, Erste Group Research

E R S T E G R O U P
BucharestNovember 2010
AAFBR Conference10
A glimpse at the growth figures
Sources: Eurostat, Erste Group Research
After the slump in GDP growth from 4% to -3.7% in 2009, we seem to be seeing a slight recovery in 2010 to +1.9% (EMU +1.6%), which should speed up to +2.9% (EMU +1.3%) in 2011.
The 2010 recovery has mainly come on the back of foreign trade
This contribution will subside in 2011, and the economic activity in the Eurozone should remain moderate
However, private consumption in the CEE region should record a clear rebound next
year
Risk factors Weaker Eurozone economy Stronger negative effects of the budget consolidation than anticipated
GDP growth (base scenario,%)
2009 2010 2011 2012
Croatia -5.8 -1.5 1.5 2.5
Czech Republic -4 2.2 2.0 2.8
Hungary -6.3 0.9 2.6 3.1
Poland 1.8 3.3 3.7 4.4
Romania -7.1 -3.0 1.2 2.3
Serbia -3 1.3 3.0 3.8
Slovakia -4.7 4.1 4.0 4.5
Ukraine -15.1 4.3 4.5 6.0
CEE8 - weighted average -3.7 1.9 2.9 3.1
Eurozone -4.1 1.6 1.3 1.6

E R S T E G R O U P
BucharestNovember 2010
AAFBR Conference11
Ytd performance equity markets
6,4%
35,3%-
8,2%
16,7%
30,6%
3,9%
0,9%-
7,3%
13,1%-
11,7%
1,8%-
9,9%-
8,0%-
9,4%-
27,0%
15,4%
11,6%
9,1%
24,4%
DOW JONES
NIKKEI 225
FTSE 100
DAX 30
CAC 40
IBEX 35
MIB INDEX
PORTUGAL
ATHEN 20
IRELAND
OMX COPENHAGEN
OMX STOCKHOLM
ATX
BUDAPEST (BUX)
WARSAW WIG
ROMANIA BET
UKRAINE PFTS
ISE ISTANBUL
PRAGUE PX
Source: Bloomberg, performances in local currencies as of 3rd, Nov 2010
International
Westeuropa
CEE
PIIGS Countries
Strong evidence for a link
between government debt and
YTD performance on the equity
markets
Investors are clearly
differentiating
The country approach is gaining
importance again relative to the
regional or sector approach
Debt will continue to burden
financial markets

E R S T E G R O U P
BucharestNovember 2010
AAFBR Conference12
CDS spreads have come back to normal levels, but Hungary and Romania are grappling with domestic (political) problems
Sources: Bloomberg, Erste Group Research
Sovereign credit default swaps (bps)
0
100
200
300
400
500
600
700
800
900
1000
Jan-
07
Mar
-07
May
-07
Jul-0
7
Sep
-07
Nov
-07
Jan-
08
Mar
-08
May
-08
Jul-0
8
Sep
-08
Nov
-08
Jan-
09
Mar
-09
May
-09
Jul-0
9
Sep
-09
Nov
-09
Jan-
10
Mar
-10
May
-10
Jul-1
0
Sep
-10
0
500
1000
1500
2000
2500
3000
3500
4000
4500
5000
Czech RepublicPolandHungaryRomaniaUkraine (rhs)Croatia

E R S T E G R O U P
AAFBR ConferenceBucharest, November 2010
Outlook on the CEE Region Financial Markets & Debt
Fritz Mostböck, CEFAHead of Group Research