e. da riva/m. gomez marzoa1 wg4 meeting - 18th july 2012 ultra-light carbon fiber structures: first...
TRANSCRIPT

E. Da Riva/M. Gomez Marzoa 1WG4 Meeting - 18th July 2012
Ultra-light carbon fiber structures: first
test campaign
Enrico DA RIVA (EN-CV-PJ)
Manuel GOMEZ MARZOA (EN-CV-PJ)
18th July 2012

E. Da Riva/M. Gomez Marzoa 2WG4 Meeting - 18th July 2012
Outline Thermal tests done over the structure already tested by the Bari team.
Pipe OD [mm] 1.5
Pipe thickness [mm] 0.035
Pipe ID [mm] 1.43
CF strip thickness tcs [mm] 0.07
CF tangential coverage β [deg] 270
Pitch p+w [mm] 7.5
Fiber width w [mm] 1.5
Separation central line fibers p [mm] 6
Angle fibers with pipe axis α [deg] 23
E. Da Riva/M. Gomez Marzoa 3WG4 Meeting - 18th July 2012
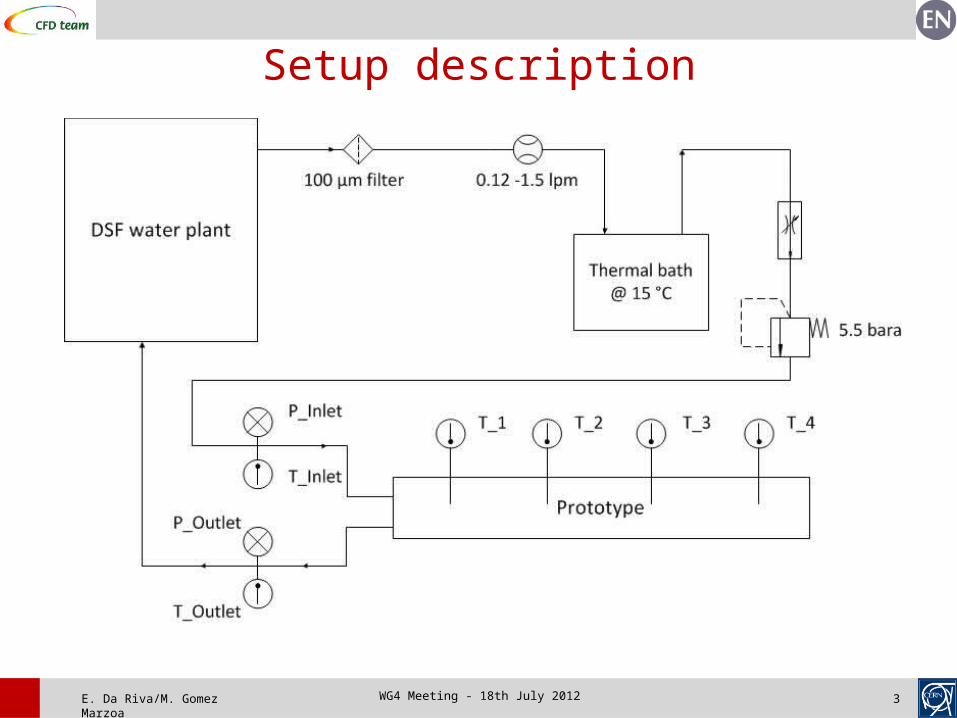
Setup description

E. Da Riva/M. Gomez Marzoa 4WG4 Meeting - 18th July 2012
Setup procedure1. Assemble the circuit
2. Connect the sensors to the Data Acquisition System through ELMB cards
Existing channel configuration used: no need to recalibrate ELMB
3. Build up the PVSS panel
4. Connect the circuit bypassing prototype: flush water
Check the reading of the sensors
5. Connect prototype and flush water
6. Start measurements
Heater emissivity:
ε=0.86 (for
thermo camera)
Insulation placed
over the PTs and
connectors

E. Da Riva/M. Gomez Marzoa 5WG4 Meeting - 18th July 2012
Results Six cases done, corresponding to the experiments done in Bari
An absolute power equal to 11.7 W applied to heater (see Bari presentation):
Rheater = 27.2 Ω
P = I2 R; I= (11.7/27.2)0.5 = 0.65 A
V = I R = 0.65*27.2 = 17.7 V
From case number 3 onwards, insulation was put over the aluminum connectors
and the PTs at the piping
Temperature of the heater remains stable even when increasing the flow rate
N m [kg h-1] P [W] Tin [oC] Tout [oC] T1 [oC] T2 [oC] T3 [oC] T4 [oC] pin [bar] pout [bar] ΔP [bar]
1 7.6 11.7 15.3 16.21 29.42 29.231 29.004 27.655 2.74 2.47 0.27
2 8.124 11.7 15.14 16 29.083 29.031 28.673 27.372 2.76 2.47 0.29
3 8.224 11.7 14.8 15.78 29.5 29 28.8 27.5 2.72 2.41 0.31
4 11.41 11.7 14.66 16.44 28.4 27.9 27.8 27.1 2.98 2.41 0.57
5 13.7 11.7 14.5 15.2 28 27.4 27.2 26.7 3.23 2.42 0.81
6 15.8 11.7 14.62 15.1 27.9 27.34 27.13 26.7 3.47 2.4 1.07

E. Da Riva/M. Gomez Marzoa 6WG4 Meeting - 18th July 2012
Results – Thermal picturesInlet/outletHotspot outside
the stave cooling area
7.60 lpm
8.12 lpm
8.22 lpm
11.41 lpm
13.70 lpm
15.8 lpm
Silicon

E. Da Riva/M. Gomez Marzoa 7WG4 Meeting - 18th July 2012
Results – Thermal pictures (Bari)
E. Da Riva/M. Gomez Marzoa 8WG4 Meeting - 18th July 2012
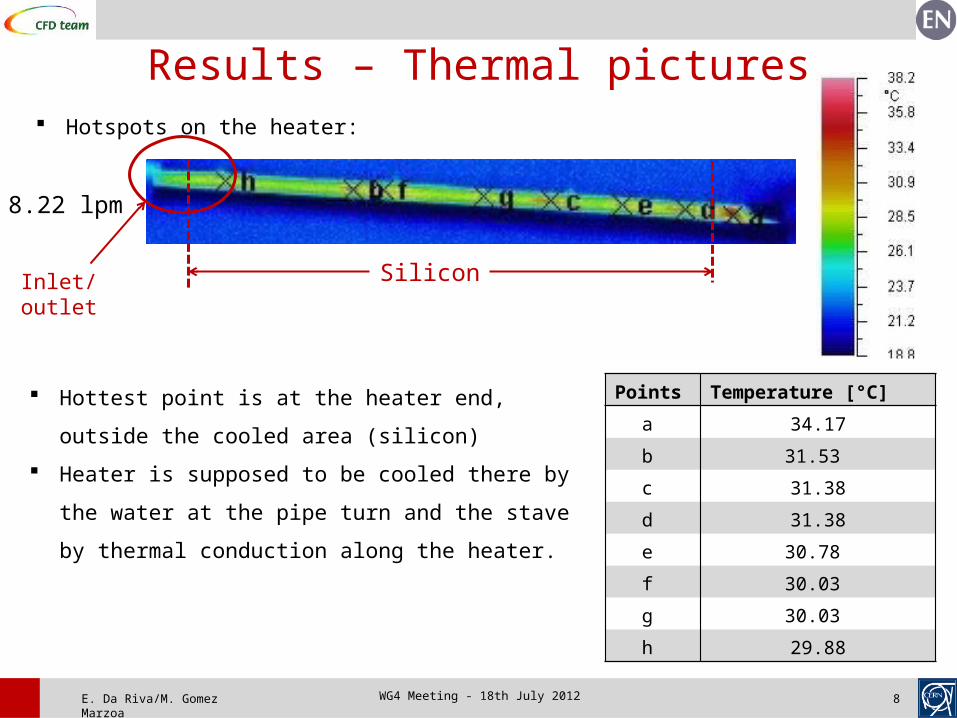
Results – Thermal pictures
8.22 lpm
Silicon
Hotspots on the heater:
Points Temperature [°C]
a 34.17
b 31.53
c 31.38
d 31.38
e 30.78
f 30.03
g 30.03
h 29.88
Hottest point is at the heater end, outside the
cooled area (silicon)
Heater is supposed to be cooled there by the
water at the pipe turn and the stave by thermal
conduction along the heater.
Inlet/outlet
E. Da Riva/M. Gomez Marzoa 9WG4 Meeting - 18th July 2012
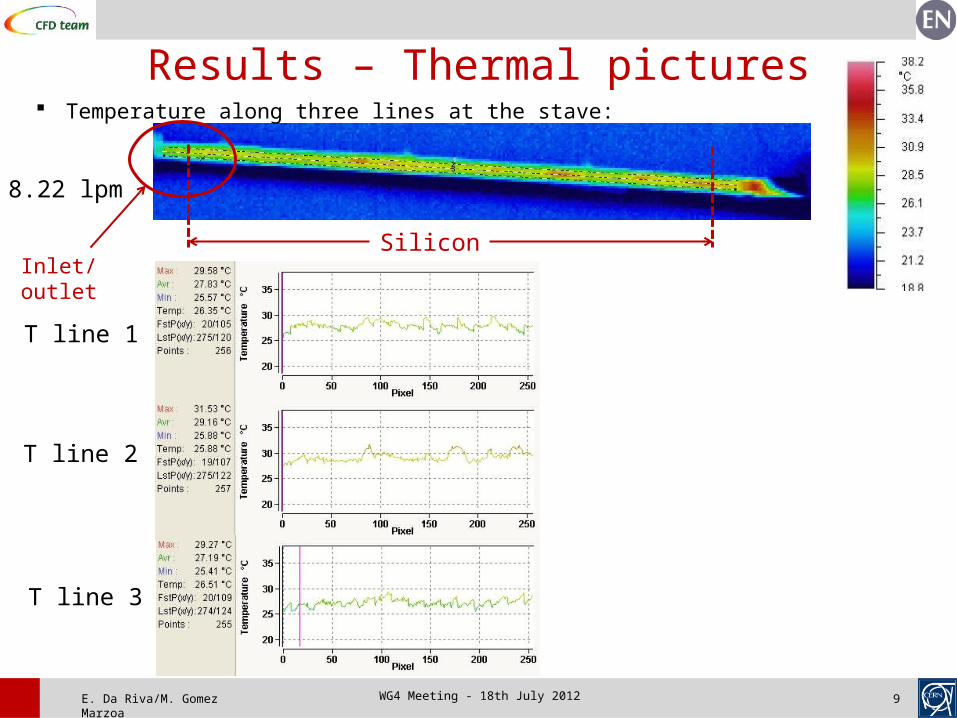
Results – Thermal pictures
8.22 lpm
Silicon
Temperature along three lines at the stave:
Inlet/outlet
T line 1
T line 2
T line 3
E. Da Riva/M. Gomez Marzoa 10WG4 Meeting - 18th July 2012
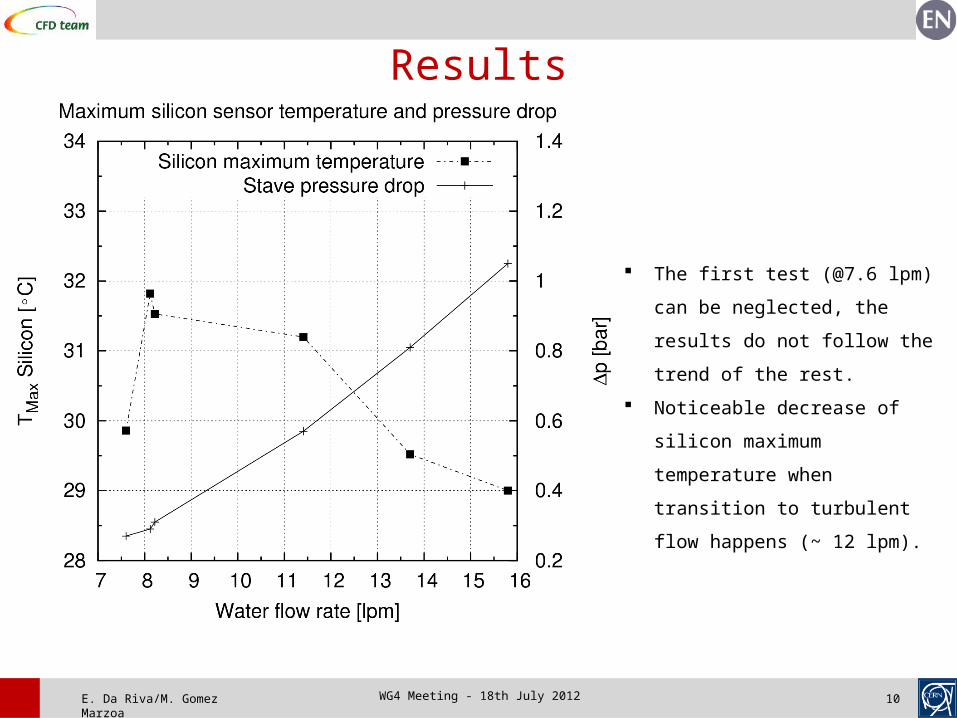
Results
The first test (@7.6 lpm) can be
neglected, the results do not
follow the trend of the rest.
Noticeable decrease of silicon
maximum temperature when
transition to turbulent flow
happens (~ 12 lpm).

E. Da Riva/M. Gomez Marzoa 11WG4 Meeting - 18th July 2012
ResultsΔT wall-water
m [l/h] V [m/s] ReΔp exp [bar]
Δp duct [bar]
HTC (lam)
HTC (Gniel) LAM TURB
7.60 1.31 1649 0.27 0.12 1646 3596 3.2 1.458.12 1.40 1762 0.29 0.12 1646 4162 3.2 1.258.22 1.42 1784 0.31 0.13 1646 4268 3.2 1.22
11.41 1.97 2475 0.57 0.17 1646 7465 3.2 0.7013.70 2.36 2972 0.81 0.45 1646 9594 3.2 0.5415.80 2.73 3427 1.05 0.56 1646 11462 3.2 0.45
Difference in pressure drop with the expected theoretical values is due to the
connectors, piping, etc. These losses can be considered as k*1/2*ρ*v2, where k is
a constant dependent on the setting and can be calculated.
ΔT wall-water: establishes the margin of improvement by using a better
cooling system for this setup:
HTC wall-fluid [W m-2 K-1] Tmax Silicon [oC]
1646 43.02
5000 39.25
10000 38.22

E. Da Riva/M. Gomez Marzoa 12WG4 Meeting - 18th July 2012
Outcome1. Experiences can be run fast and reliably.
2. Uncertainty: big
Sensors (PTs, NTCs, p sensors, flow meter).
Thermo camera: -/+4 oC below 100 oC
Systematic: depends on the setup (assembly of sensors, NTCs over heater).
Thermo camera shooting point: not fixed this time (reflections can appear).
Results qualitatively significant
3. Standardized setup necessary:
Stave support for quick replacement.
Tripod for thermo camera.
NTCs glued to the heater to enhance local contact.
4. Evaporative cooling system little improves thermal performance, but could ensure
better T distribution.
5. Water tests can be repeated using the same absolute power as in the Bari
experiences (13.7 W corresponding to 0.71 A current)
E. Da Riva/M. Gomez Marzoa 13WG4 Meeting - 18th July 2012
Ultra-light carbon fiber structures: first
test campaign
Enrico DA RIVA (EN-CV-PJ)
Manuel GOMEZ MARZOA (EN-CV-PJ)
18th July 2012