e creep k cr e
TRANSCRIPT

E CREEPK CR E"
H
u
TE5092.M8A3no.67-3

v'CREEP RECOVERY AND
CREEP OF PRESHRUNK CONCRETE
Prepared for
MISSOURI STATE HIGHWAY DEPARTMENT
by
DONALD R. BUEITNER
and
RONALD l. HOLLRAH
DEPARTMENT OF CIVIL ENGINEERING
UNIVERSITY OF MISSOURI
COLUMBIA, MISSOURI
in cooperation with
U. S. DEPARTMENT OF TRANSPORTATION
BUREAU OF PUBLIC ROADS
The opinions, find ings, and conclusionsexpressed in this publicotion are not necessarily
those of the Bureau of Public Roads.
.,~., ;' ,'.flh.... ·., •
-'.,

TABLE OF CONTENTS
CHAPTER
ACKNOWLEDGEMENTS
SYNOPSIS
I. INTRODUCTION
General ..
Background . . . . . . . . .
Creep Recovery . . . . . . . . . . . . . . .
Creep of Preshrunk Prisms . . . . . . . . . .
Objectives . . . . .
II. EXPERI~ENTAL PROGRAM
General ....
Specimens . .
Test Environment
Hydraulic Loading System
Test Procedure
III. EXPERIMENTAL RESULTS
General . . . . .
Creep Recovery . . . . . . . . . . .
Unloading and Immediate Reloading .
Creep of Preshrunk Prisms . .
Elastic Modulus and Strength
IV. SUMMARY .
BIBLIOGRAPHY
PAGE
i
ii
1
1
2
3
6
10
11
11
11
16
16
17
21
21
21
28
30
35
41
43

LIST OF FIGURES
FIGURE
1. Typical creep strain behavior obtained from
unloading and reloading plain concrete
2. Composition of creep as proposed by Ali and
Kesler . . . . . . . . . . . .
3. Ali and Kesler model for basic creep of concrete
4. Observed creep recovery behavior .
5. Unloading stress-strain curve, Specimen 4.12
6. Postulated recovery behavior
7. Typical reloading behavior ....
8. Basic creep and creep of preshrunk concrete ..
9. Loading stress-strain curve, Specimen 4.22
PAGE
5
7
9
22
26
29
31
34
36

TABLE
I.
II.
III.
IV.
LIST OF TABLES
Prism Mix and Variable Description .
Creep Recovery Data . . . . . . .
Unloading and Immediate Reloading Data . . . .
Elastic Modulus and Strength Data
PAGE
12
23
32
38
i
ACKNOWLEDGEMENTS
The study described in this report is a continuation study of
a cooperative research program, "Study of the Effect of Creep and
Shrinkage on the Deflection of Reinforced Concrete Bridges", under
taken by the Engineering Experiment Station of the University of
Missouri in 1959 under the sponsorship of the Missouri State Highway
Commission and the U.S. Bureau of Public Roads and under the admin
istrative direction of Dean Joseph C. Hogan and Dean William M.
Sangster. The program was inaugurated through the initiative of
Mr. John A. Williams, former Bridge Engineer, Missouri State High
way Commission. The advice and assistance of Mr. D. B. Jenkins,
Bridge Engineer and Mr. Roy Cox, Assistant Bridge Engineer, and
Mr. Billy Drewell, Senior Preliminary Structural Designer, all of
the Missouri State Highway Commission, Mr. R. C. Gibson, Regional
Bridge Engineer and Mr. Mitchell Smith, District Bridge Engineer,
both of the U.S. Bureau of Public Roads, is hereby gratefully ack
knowledged. This phase of the program was conducted by Mr. Ronald
L. Hollrah, a National Science Foundation Trainee in the Department
of Civil Engineering. Dr. Donald R. Buettner was Project Engineer
at the time this study was completed. The study was directed by
Dr. Adrian Pauw, Professor and Chairman of the Department of Civil
Engineering.
ii
SYNOPSIS
While there is extensive literature on the behavior of concrete
under a sustained load, only limited test data is available on creep
recovery behavior upon unloading. Inasmuch as over one hundred
specimens were available from an earlier study in the program, an
unusual opportunity was available to study creep behavior of speci
mens which had been under load for a period of over two years.
The creep recovery behavior for the specimens in this study
was considerably different from that previously reported for speci
mens loaded for a shorter period of time. Similarly it was found
that the basic, or viscous, creep appears to be a function of the
age at the time of loading. Finally it was found that for the size
of the specimen used in this study and for the environmental condi
tions of 70 0 F and 50% relative humidity, both the elastic modulus
and the ultimate compressive strength of the concrete generally
decreases with time from the values obtained 28 days after casting.
These results indicate the desirability of continued studies of
these phenomena to determine the reasons for this unexpected behav
ior.

CHAPTER I
INTRODUCTION
General
An extensive research program to study the effects of creep
and shrinkage on the deflection of reinforced concrete bridges was
begun on September 1, 1959. The program was conducted under the
supervision of the Engineering Experiment Station at the Univer
sity of Missouri in cooperation with the Missouri State Highway
Commission and the United States Bureau of Public Roads. The
objective of this research program was to develop design criteria
which will enable the engineer to predict long-time deflections
of reinforced concrete beams resulting from creep and shrinkage of
the concrete. A broad program of field and laboratory testing was
prepared to accomplish this objective.
The field test program consisted of a study of the effects
of creep and shrinkage on the deflection of reinforced concrete
bridges. Deflection and column strain readings were taken over a
period of approximately two years. The results of this study
were reported by Brautigam (1)*.
In conjunction with the field study, the theoretical time
dependent deflections for these bridges were obtamed using an
analysis based on a method developed by Pauw and Meyers (2). The
*Numbers in parentheses refer to entries in the bibliography.

2
results of this analysis will be reported in a thesis under prep
aration by Cronister (3).
The laboratory test program consisted of two phases; a study
of the effect of creep and shrinkage on the deflection of reinforced
concrete beams, and a study of the effects of constituents, envi
ronment, and stress on the creep and shrinkage of plain concrete
prisms.
In the beam study, six rectangular beams and two T-beams were
constructed and subjected to sustained loads. Deflection and
strain measurements were taken over a period of eighteen months.
The results of this study are reported by Jones (4).
The second phase of the laboratory test program consisted of
an extensive analysis of the effect of constituent, environment,
and stress variables on the creep and shrinkage of plain concrete.
This program was conducted to support previous conclusions as well
as to investigate the effects of some of the variables that have
not been considered in previous studies. The program was conducted
over a period of eighteen months following over a year of work
developing a suitable instrumentation system, selecting materials,
and designing the concrete mixes to be used in the tests. The
entire program consisted of testing over two hundred specimens
comprising twenty-five separate studies. The results of this
study will be presented in a report by Buettner (5).
Background
At the completion of the creep study conducted at the Univer-

3
sity of Missouri (5), there were approximately 100 prisms which
had been under load for 2 to 3 years, and 50 prisms which had been
used for shrinkage measurements and were not under load. In order
to derive the maximum amount of information from these prisms, it
was decided to investigate two major aspects of creep. These
aspects consist of a study of creep recovery and a study of the
creep of preshrunk prisms. The background information for each
of these studies will be presented separately.
Creep Recovery
An examination of the literature which has been published on
the subject of creep revealed that only a limited number of inves
tigations have been conducted concerning the subject of creep
recovery. The test program which was adopted for the study re
ported in this paper was set up to allow the collection of data
which will yield conclusions of a qualitative nature, regarding
the time-rate of creep recovery, the time required for creep re
covery to become complete, and the amount of creep recovery which
can be expected.
It was also noted that there is only a limited amount of
information available regarding the effect of constituents,
environment, or previous stress level on the characteristics of
creep recovery. This investigation included a study of the
effects of a number of variables on the creep recovery behavior
of approximately thirty-five plain concrete prisms.
Most of the previous research concerning the subject of creep

4
strain behavior of concrete specimens which were unloaded and
reloaded, considered only the case when a period of several days
or weeks had elapsed between the time of unloading and reloading
(6), (7). These investigations indicated that upon reloading
the specimen, there was an initially rapid rate of creep, but
that the total creep strain did not reach the value which it
would have attained, if the specimen had remained under load.
Figure 1 illustrates this behavior. There was no previous infor
mation available on the creep strain behavior of plain concrete
prisms which have been unloaded and immediately reloaded. This
problem is currently being further investigated at the University
of Missouri.
During the process of loading and unloading the prisms, the
load-deflection readings obtained could be used to give an indi
cation of the modulus of elasticity of the concrete. Load-deflec
tion readings were also taken at the outset of the prism study at
the University of Missouri (5), thus allowing a comparison of the
modulus of the aged specimen to the modulus at the time the prisms
were initially loaded. A companion prism was also tested to
determine the ultimate compressive strength at the time the
prisms were initially loaded. Ultimate strength tests were con
ducted at the completion of the experimental portion of this
study.. This permitted a comparison of the strength of the prism
when it was initially loaded to the strength which existed at the
completion of this study.

,.,..........,..-
......
ElasticT~
."'-
,/ ..,...,..- ..,..:;,..- f
Variable Distance/
Elastic
lUiOUt
Creep Recovery
c.-oI--V)
0..(I)(I)I-
U
Time
Figure 1. Typical creep strain behavior obtained from unloading
and reloading plain concrete
V1
6
Creep of Preshrunk Prisms
In current concrete theory, creep strain is defined as the
total strain minus the sum of the shrinkage strain and the elastic
strain, or
E:c
::::E: - E: -E:t s e (1)
However, as a result of an investigation conducted by Ali
and Kesler (8) it was determined that creep and shrinkage are not
independent. It was proposed by Ali and Kesler that the total
creep strain is equal to the sum of the basic creep strain and
the drying creep strain. These quantities are represented graph-
ically in Figure 2.
Basic creep is defined as the creep occurring under condi-
tions of no moisture exchange with the environment. Drying creep
is defined as the creep in excess of the basic creep, resulting
from concurrent loss of moisture.
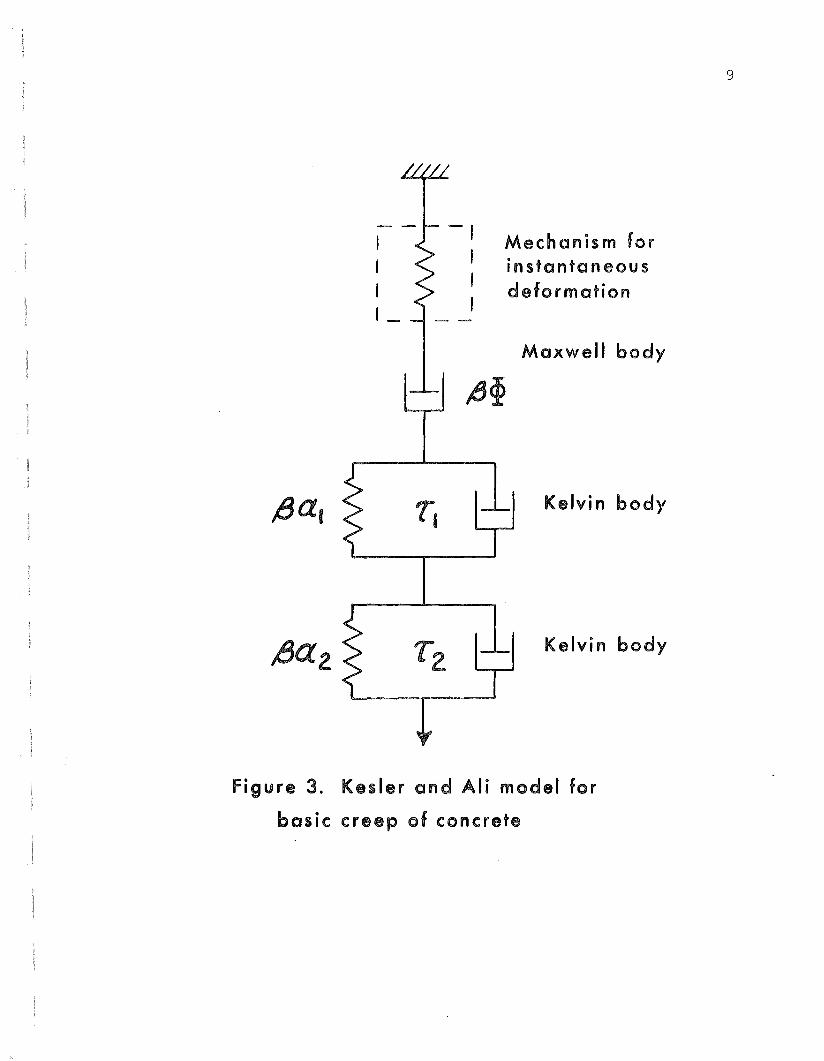
Through a study of the mechanism of creep and shrinkage of
plain concrete, it was proposed that basic creep could be repre-
sented by the rheological model shown in Figure 3. This model
corresponds to the following mathematical equation which may be
used to predict the basic creep strain:-t/ l -t/ l
E:bc
::::f3 o {C'l.l(l-e 1)+ C'l.
2(1-e 2)+ <jlt}
where:
(2)
E: bc :::: creep strain occurring under conditions of no moisture
exchange with the environment (basic creep strain).
f3 :::: gel compliance factor.

L
-n core
epS
trai
nc ""1
1(1
)
~ . ()
0 3 "C 0 IfI) .. -. 0 :::::» 0 - n ""11 CD CD "C 0
-tIf
I)
"C3
""11
CD0 "C 0 If
I) CD Cl.
CI::'ll
0 ""11
c-o
'<'<
IfI)
_. ::I
nco
nn
""11
""11
0(1
)CI
:::::»
(1)
(II
Cl.
"C"C
(1)
IfI) (1)
""11

8
o = stress level.
al
, ~ = compliances of the Kelvin springs.
Tl
' T2 = retardation times of the Kelvin elements.
~ = effective fluidity of the free dash pot in the Maxwell
body.
t = creep time.
The gel compliance factor S, represents the ratio of the
deformation of the gel component of the concrete, to the deforma-
tion of a hypothetical specimen of pure gel, subjected to the
same stress as the cqncrete. At full hydration,2
S = (l-Va )2.20Vc
where:
v = volume concentration of aggregate.a
V = original volume concentration of cement.c
In the tests of Ali and Kesler, the values of the coefficients
corresponding to a temperature of about 70 0 F and a relative humid-
ity range of 50 to 100 percent, expressed in inch-pound-day units,
were found to be,
-9al
= 225 x 10
-9a2 = 115 x 10
-9~ = 0.3 x 10
These values were
T = 351
T = 22
proposed to be the same for all concretes
in environments which are within the temperature and humidity
restrictions stated above.
In the prism study at the University of Missouri, there were
1
II1-
-IIII
Mechanism forinstantaneousdeformation
Maxwell body
9
~~
IJa,
IJaz
7,
TZ
Kelvin body
Kelvin body
Figure 3. Kesler and Ali model for
basic creep of concrete

10
approximately 50 unloaded shrinkage specimens stored at 50 percent
relative humidity, and at a temperature of 720 r for approximately
two years. Measurement of the shrinkage strains had indicated
that the prisms were undergoing very little or negligible shrink
age at the time the study presented in this report was conducted.
It was assumed that since the prisms were essentially preshrunk,
no moisture would be exchanged with the environment. The creep
exhibited upon loading the prismssmuld therefore be the basic or
viscous creep as defined by Ali and Kesler.
Objectives
The objectives of the test program described in this paper
were as follows:
1. Obtain qualitative data on the rate and amount of creep
recovery of plain concrete.
2. Observe the effect of constituents, environment, age
at loading, and previous stress level on creep recov
ery.
3. Observe the creep strain behavior of plain concrete
specimens which had been under load for several years
and were then unloaded and immediately reloaded.
4. Compare the creep of preshrunk specimens to the basic
creep or viscous creep as predicted by Ali and Kesler (8).
5. Examine the effects of time, stress, constituents, and
environment on the elastic modulus and the strength of
plain concrete prisms.

CHAPTER II
EXPERIMENTAL PROGRAM
General
Information pertaining to the apparatus and instrumentation
which were used in this study may be found in a report written by
Meyers and Pauw (9). A detailed description of the test equipment
is therefore not presented.
Specimens
The prism specimens used in this study were of two sizes.
All of the prisms were 16 in. in length and 4 in. wide, and had
depths of either 3 in. or 4 in. The size of each prism and the
variable studied for that prism are listed in Table I. The prisms
were cast horizontally in a casting bed. This system produced
prisms which were initially square, thus eliminating the necessity
of capping before loading. The flat surfaces also simplified the
problem of applying the instrumentation. Mix quantities were
weighed carefully to obtain batches of uniform quality. The
specimens were cured under controlled laboratory conditions. The
moist room into which the prisms were placed for curing was main
tained at 70 0 F and 100 percent relative humidity. Except when
otherwise noted in Table I, all prisms were moist cured for 28
days.
Many of the specimens used in previous creep and shrinkage
studies were of the standard 6 11 x12 11 cylinder size. Prior to the
selection of the rectangular prisms for this study, nine sets of

TABLE IPrism Mix and Variable Descriptions
Details of Mix Proportions Water Cement f ,Variable for 1 Cubic Yard Cement Paste c
Series In.xIn. Studied Agg. Sand Cement Water* Slump Ratio Content PSI
2.1 3x4 Slump - 1 inch 1726 1661 496 307 1" .608 .192 4560
2.2 3x4 Slump - 5 inches 1642 1576 559 347 5" .611 .220 4460
2.3 3x4 Slump - 7 inches 1670 1603 397 380 7" .944 .192 4690
3.1 3x4 Gradation-No. 1** 1559 1501 487 303 3" .612 .205 4790
3/4" = 100%1/2" = 84%3/8" = 60%#4 = 44%#8 = 8%
3.2 3x4 Gradation-No. 2 1559 1501 487 303 3" .612 .205 5500
3/4" = 100%1/2" = 72%3/8" = 40%#4 = 22%#8 = 4%
3.3 3x4 Gradation-No. 3 1559 1501 487 303 3" .612 .205 5380
3/4" = 100%1/2" = 84%3/8" = 50%#4 = 29%#8 = 2%
4.1 3x4 Type Aggregate-Missouri Limestone 1702 1639 530 331 3" .581 .205 5560
I-'1'0

Details of Mix Proportions Water Cement f I
Variable for 1 Cubic Yard Cement Paste cSeries In.xIn. Studied Agg. sand Cement Water Slump Ratio Content PSI
4.2 3x4 Type Aggregate-,
~lssourl Llmestone 1702 1639 530 331 3" .581 .205 5630
4.3 3x4 Standard Specimen-Wisconsin Trap Rock 1685 1619 525 328 3" .614 .205 5170
5.1 3x4 Curing Time-14 Days 1685 1619 525 328 2!;q:" .614 .205 5380
5.2 3x4 Curing Time-21 Days 1685 1619 525 328 2 1" .614 .205 5920'4
5.3 3x4 Curing Time-28 Days 1685 1619 525 328 2!;q:" .614 .205 5460
6.1 3x4 Type Aggregate-Missouri Limestone 1703 1636 531 331 2" .581 .205 5230
6.2 3x4 Type Aggregate-Missouri Limestone 1703 1636 531 331 2" .581 .205 5540
6.3 3x4 Type Aggregate-Missouri Limestone 1703 1636 531 331 2!;q:" .581 .205 8420
7.1 3x4 Age at loading-3 days 1685 1619 525 328 2!;q:" .614 .205 3890
7.2 3x4 Age at loading-7 days 1685 1619 525 328 2-3/4" .614 .205 2790
8.1 3x4 Age at loading-2 days 1685 1619 525 328 3" .614 .205 2154
8.2 3x4 Age at loading-7 days 1685 1619 525 328 3" .614 .205 2390
8.3 3x4 Age at loading-7 days 1685 1619 525 328 3" .614 .205 2154
9.1 3x4 Water Cement Ratio 1718 1406 738 327 3" .436 .254 8880
9.2 3x4 Water Cement Ratio 1616 1751 438 328 3" . 737 .185 3430
9.3 3x4 Age at Loading-14 days 1685 1619 525 328 3" .614 .205 3460
12.1 3x4 Admixture-Placewel1,2-3/4 oz./sack 1685 1619 525 328 3~" .614 .205 5420
f-'LN

Details ofVariable
Series IIn.xIn. IStudied
Mix Proportionsfor 1 Cubic Yard
Agg. ISandlCement Iwater Slump
WaterCementRatio
CementPaste
Content
f I
cPSI
12.2
12.3
3x4
3x4
Admixture-Retardwell,3 fl. oz./sack
Curing ConditionsPreshrunk
168511619 I 525
1685 11619 I 525
328
328
2-3/4" I .614
3" I .614
.205
.205
4580
x
13.1
13.2
13.3
15.1
3x4
3x4
3x4
4x4
Admixture-Sicacrete1~ gallon/cubic yard I 1685 11619 I 525
Admixture-Calcium Chlor-ide, 1.88 Ib/sack 1168511619 1525
Admixture-Pozzolith,4 oz ./sack I 1685 11619 I 525
Type Aggregate-Haydite #1 F= 785 I I 470
M= 410C= 541
328
328
328
358
3"
3"
3"
3"
.614
.614
.614
. 762
.205
.205
.205
.322
4410
5380
4640
4734
15.2
15.3
4x4
4x4
Type AggregateHaydite #2
Type AggregateHaydite #3
F=1090M= 450
F=1090M= 450
705
705
625
541
2-3/4" I .887
3~" I. 768
.464
.447
4198
4854
19.1
20.1
4x4
4x4
Preshrunk with 6%Air-Readymix 11967111111 545
Preshrunk with 6% Air-Readymix, Haydite.Coarse aggregate grad-ation in accordance withMo. Hwy. Comm. specs.for Class A concrete 11740 I I 658
213
x
3"
3"
.391
x
.198
x
6000
5290
J--'-P>

Details of Mix Proportions Water Cement f I
Variable for 1 Cubic Yard Cement Paste cSeries In.xIn. Studied Agg. sand Cement Water Slump Ratio Content PSI
21.1 4x4 Air Content-2.6%Add Air-~ oz./sack 1847 1478 470 299 3" .611 .188 3250
21.2 4x4 Air Content-5.2%Add Air 3/4 oz./sack 1891 1397 453 283 3" .611 .183 2667
21.3 4x4 Air Content-7.4%Add Air 1~ oz./sack 1936 1328 431 269 3" .610 .177 2292
22.1 4x4 Type Aggregate-MissouriLimestone, High StressLevel (2500 psi.) 1703 1636 531 331 3" .581 .205 4208
22.2 4x4 Type Aggregate-MissouriLimestone, High StressLevel (2500 psi.) 1703 1636 531 331 3" .581 .205 3718
22.3 4x4 Type Aggregate-MissouriLimestone, High StressLevel (2500 psi.) 1703 1636 531 331 3" .581 .205 4198
23.1 4x4 High Stress Level(2500 psi.) 1684 1622 525 328 3" .614 .205 4235
23.2 4x4 High Stress Level(2500 psi.) 1684 1622 525 328 3" .614 .205 3300
* Measured additional absorption for saturated surface dry condition: Wisconsin Trap Rock0.32%, Missouri Limestone 1.36%. Light weight aggregates were soaked before mixing andsaturated surface dry conditions were assumed.
** % Passing.
f-JlJl
16
prisms and companion standard 6 1lx12 1l cylinders were cast to deter
mine the reliability of the elastic modulus and strength tests as
measured from the prisms. It was found that the results were in
good agreement with results from cylinders (10).
Test Environment
The creep and shrinkage laboratory is equipped to maintain a
temperature of 720 F, and a relative humidity of 50 percent. Temp
erature and humidity were recorded continuously during the test
period so that any failure of the test environment control system
could be noted and corrected.
Hydraulic Loading System (9)
The hydraulic loading system permits a large number of speci
ments to be loaded quickly. The basic system consists of a motor,
an oil-injection pump, an accumulator, a pressure control system,
pressure cells and associated plumbing, and loading frames.
A loading rack can accomodate a stack of three 16-in. long
specimens. The load is applied at the lower end of the rack by
the floating circular plate of the pressure cell. Castings
machined to finished dimensions are used for the body of the
pressure cells. Oil is pumped under pressure through flexible
hosing to each pressure cell and the loading pressure is trans
mitted to the floating plate through a rubber piston cup. The
reaction is provided by high strength steel tension rods and cold
rolled flat steel plates.

17
A fuel-injection pump, driven intermittently by a small th.p. gear-head motor is used to pump oil under pressure to the
pressure cells. A 2~-gal. hydraulic accumulator is used to main
tain constant pressure between pumping cycles. The pumping system
is regulated to increase the pressure when leakage causes a lO-psi
drop in the static pressure of 514-psi.
Two sizes of pistons were used; 6-in. diameter, and lO-in.
diameter. This provided four possible stress levels, three of
which were used in this study. They were as follows:
1. 6-in. diameter piston
a) 3x4 in. prism, = 1200-psi (1176-psi minimum)
b) 4x4 in. prism, = 900-psi (882-psi minimum)
2. lO-in. diameter piston
a) 4x4 in. prism, = 2500-psi (2450-psi minimum)
The stress level to which any given specimen was subjected
can be deduced from Table I by assuming case 1 above unless !rHigh
Stress Level (2500-psi)!r is stated as the variable studied.
Test Procedure
In Chapter I, it was stated that there were two basic topics
to be studied, i.e., creep recovery and creep of preshrunk prisms.
Al.though these two studies were independent of each other, there
were certain laboratory procedures which were common to both.
Broadly speaking, these procedures may be broken down into load
ing and unloading.
1. Loading. Using the hydraulic loading system described

18
above, it was possible to collect data to determine the
elastic properties of the concrete while the prism was
being loaded.
In the loading procedure, three prisms were stacked
vertically inside the creep rack. These prisms were cen
tered by means of scribe lines on the top and bottom plates
of the creep rack. An initial strain reading was then tak
en for each prism. Strain readings were taken using a
portable 6 in. longitudinal extensometer (9) which was ref
erenced to a standard-length gage bar before and after tak
ing the reading for for each prism. This allowed correc
tions to be incorporated into the reduced data for drift in
the strain indicator or for effects of environment on the
test equipment. Load was applied in 50 psi increments using
a dead-weight gage tester to measure the pressure in the
hydraulic line. This 50 psi pressure increment corresponded
to an increment in load of 1414 pounds in the creep racks
with 6 in. diameter hydraulic pistons, and 3928 pounds in
racks with 10 in. diameter pistons.
After the addition of each load increment, strain
readings were taken again for each prism in the same
manner as described above. Gage points had been placed
6 in. apart in the center of each of the four sides of
the prisms. The location of gage points on all four
sides of the prisms allowed for the averaging of the
effects of any eccentricities which may have been induced
by positioning the prisms slightly off center in the

19
creep rack.
In order to determine if the elastic properties
obtained from loading in the creep racks were comparable
to the values obtained using a hydraulic testing machine,
the moduli of elasticity of 12 prisms were measured using
both methods. The prisms were first taken into the mat
erials testing laboratory and subjected to an elastic
modulus test using a universal hydraulic testing machine
and a mechanical compressometer (9). Each prism was
cycled three times, with the upper load limit producing
approximately the same stress as the stress to which the
prism would be subjected in the creep rack. The prisms
were then returned to the creep laboratory and reloaded
using the dead-weight gage tester, and the portable
longitudinal extensometer. The values of elastic mod
ulus obtained from the two tests were within ~ 7.3 per
cent.
2. Unloading. The procedure used to unload the prisms was
basically the reverse of the loading procedure. In the
loading procedure, pressure increments of 50 psi were
used, and in the unloading procedure, the pressure
decrement was 100 psi. An examination of the unloading
stress-strain relationships of the first several prisms
revealed that the relationship was not linear and that
the concrete was exhibiting a hysteresis effect. It

20
was decided that since a plot of these relationships
would not yield any significant information regarding
the elastic properties of the concrete, readings would
be taken in 100 psi hydraulic gage pressure increments
in order to save time.

CHAPTER III
EXPERIMENTAL RESULTS
General
The results of this study will be presented and discussed
in the order of the objectives listed in Chapter I.
Creep Recovery
The first two objectives of this study concerned the rate,
amount, and effect of constituents, environment, age at loading,
and previous stress level on creep recovery of plain concrete.
The creep recovery curves obtained in this investigation
were not similar to the recovery curves which had been obtained
in previous investigations (6, 11). The general shape of the
creep recovery curves obtained in this study is illustrated in
Figure 4. The band shown represents the upper and lower bounds
of all recovery curves obtained. Specific values for each prism
tested are shown in Table II.
Note that in Figure 4, the creep-time curve is shown as a
horizontal line immediately preceding the time the prism was
unloaded. An examination of the last several recorded creep
strains prior to unloading anyone prism indicated that this
constant strain condition actually existed.
The general creep recovery pattern consisted of first a
shortening or decrease in length. This was followed by a period
of recovery (swelling) to a maximum value, and then a second

Creep curve
Range of creep recovery
Elastic
recovery-0.5 I I Ii"''' i • • •
w1+::: I~~~~;~h.-
~-o..-xc.-
...........c
Average recovery curve - - -
o 20 40 60 80 100
Time, t (days after load removed)
figure 4. Observed creep recovery behavior
I'VI'V

TABLE ITCreep Recovery Data
Maximum Time of Recovery Final Recorded . Time ofSpecimen Recovery Max. Rec. at t=50 days RecoverY4 Final Read.
(in/inxl0- 4) (days) (in/inxlo-4) (in/inxl0 ) (days)
2.13 0.50 38 0.467 0.033 128
2.23 0.25 55 0.25 -0.033 128
2.33 0.417 57 0.40 -0.017 128
3.13 0.35 37 0.167 0.00 95
3.23 0.45 3-7 0.25 -0.04 95
3.33 0.317 37 0.15 -0.082 95
6.13 0.467 43 0.43 0.082 74
6.23 0.267 18 0.00 -0.13 74
6.33 0.217 17 -0.10 -0.117 74
7.13 0.33 22 0.05 -0.013 77
8.12 0.00 30 -0.05 -0.10 74
9.12 0.00 45 0.00 -0.083 73
12.13 0.367 50 0.367 0.183 74
12.23 0.25 45 0.24 0.013 74
12.33 0.45 45 0.44 , 0.167 74
21.12 0.30 30 0.133 -0.30 128
21.13 0.35 35 0.267 -0.05 128
21. 22 0.45 35 0.233 -0.283 128
21.23 0.40 33 0.317 -0.283 128
21. 32 0.267 28 0.10 -0.300 128
21.33 0.45 30 0.35 -0.10 128
NW
24
period of shortening. This second period of shortening appeared
gradually to decrease until it eventually stopped.
Nine prisms in this study had creep strain recovery readings
taken at four, nine, and fifteen days after the load had been
removed. In all cases, the prisms exhibited decreases in length
for approximately the first 15 days. For all the other prisms in
the study, readings were not taken until 15 days after the load
had been removed. Although no creep strain recovery information
is available on the remainder of the prisms for the first 15 days
after the load was removed, it is reasonable to assume that these
prisms exhibited similar behavior.
It is important to note that there was no change in either
temperature or humidity during the recovery period from conditions
which had existed during the loaded period. One possible source
of error in creep recovery readings could relate to variations
in either temperature or humidity in different parts of the creep
laboratory. An examination of the spatial variation of environ
mental conditions in the creep laboratory indicated that the var
iation could be considered negligible.
Several comments can be made regarding the observed creep
strain behavior:
1. As a result of the limitations of the instrumentation
and the test procedure, from 1 to 15 minutes elapsed
between the time the load was removed, and the time
the readings were taken. As indicated by Davies (12),

25
the elastic recovery which was recorded would actually
include a certain amount of creep recovery due to the
time lapse.
An attempt was made to find the exact amount of
elastic recovery by using the elastic modulus obtained
when the prisms were unloaded. However, the effect of
hysteresis produced non-linear stress-strain curves
which eliminated the possibility of determining an
acceptable elastic modulus. A typical unloading
stress-strain curve is shown in Figure 5.
2. It also appears that in previous investigations of creep
recovery, the time between loading and unloading was
much shorter than the 2- or 3-year time interval in this
study (6,11). It is possible that the cement in the
specimens in the previous investigations was not com
pletely hydrated at the time the specimens were unloaded.
However, in this study it is reasonable to assume that a
2-year period would be sufficient for the hydration
process to stabilize. As the cement hydrated, and the
concrete subsequently hardened while the specimen was
under load, the structure of the material itself may have
developed a residual stress. After the load was removed,
it is possible that a certain amount of time would be
required for the structure of the material to readjust
and relieve this residual stress. This could account
for the initially slow rate of creep recovery.

26
1000 I i -----.-
200 I 1:/ I I I!I
800 I I I I / I I
..II)
II) I I'~ 400 I I I / I ,-V')
.-
o0.0 0.5 1.0 1.5 2.0
Strain, € (in./in. x10 )4
Figure 5. Unloading stress-strain curve
Sped men 4.12
III) IE: 600 I
b

27
3. The application of stress before the concrete was com
pletely dry may have inhibited free moisture movement.
It is believed that the application of load to a con
crete specimen will squeeze water out of the pores and
force it to the surface. It is possible, however, that
this application of load may have prevented free moisture
movement by restricting capillary action, reducing pore
sizes, and creating negative pore pressures.
After the removal of the load and the gradual
relief of the residual stresses, moisture movement
would become less restricted, and additional shrinkage
could occur.
By superimposing the strains which would occur from the phe
nomena discussed in comments 2 and 3 above, the creep strain
recovery behavior observed in this study would result. (See Fig
ure 6.)
The results of previous investigations indicate that at the
end of a 2- to 3-week period, the creep strain recovery is
essentially complete (12, 13). The results of this study at
least partially support this finding in that the process of creep
recovery was observed to occur at a much faster rate than creep.
Complete recovery appeared to have occurred within from 3 to 8
weeks after the load was removed. The average time required to
reach the maximum recovery was 5 weeks.
If measurements taken by earlier investigators were discon-

28
tinued at the time when the specimens had apparently completed
recovery (see Figure 6), the subsequent decrease in creep strain
recovery would not have been observed.
In addition to a qualitative study of creep strain recovery
behavior, this study was also designed to provide information re-
garding the effects of constituents, environment, age at loading,
and previous stress level on the creep strain recovery behavior.
It was found, however, that the accuracy of the instrumentation
was insufficient to allow the formulation of definite conclusions.
The maximum amount of creep recovery recorded was 0.5
in. The average for the 23 prisms tested was 0.326 x
-4x 10 in.1
10 - 4 " I"In. In.
It can be seen that the creep recovery strains for all prisms
tested, regardless of the constituents or environment, were much
smaller than the total creep strains which generally ranged from
5 to 10 x 10-4 in. lin.
Unloading and Immediate Reloading
The third objective of this study was to observe the behavior
of specimens which had been under load for several years and were
then unloaded and immediately reloaded. As mentioned in Chapter
I, there appears to have been no previous research on creep
strain behavior under such conditions. The results of this inves-
tigation indicate that this loading cycle produces additional creep
strain above the value which would have occurred if the specimen
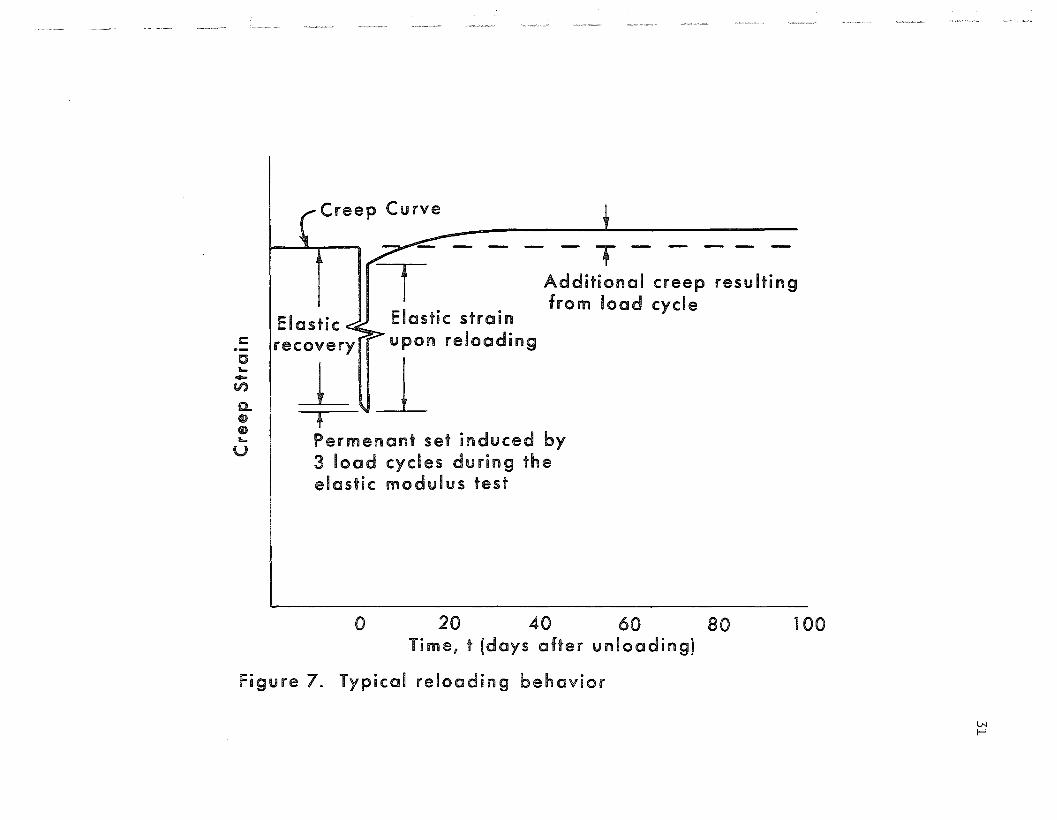
had remained under load. A typical strain-time curve resulting
from this test procedure is shown in Figure 7. Actual values

>-.....cu>oucu
c:s::::.-c....-V)
Q.cucu....
U
Additional shrinkage
Observed behavior
----------
Relief of residual stress
I (creep recovery)
Time (after unloading)
figure 6. Postulated recovery behavior
I'VlD

30
for all specimens are presented in Table III.
As the Figure indicates, the elastic recovery is greater
than the elastic strain recorded upon the reapplication of the
load. It should be noted that the elastic recovery in this case
would also contain some creep recovery for the same reason stated
in comment 1 of the previous section.
The creep strains reached at approximately 80 days after the
load cycle were from 0.017 x 10⁻⁴ in. lin. to 0.983 x 10- 4 in. lin.
greater than the creep strain of the prism prior to the load
cycle. The average additional creep strain increment was 0.306
10 - 4 , I'x In. In. This would tend to indicate that a prism subjected
to a fatigue condition would exhibit larger creep strains than an
identical prism subjected to a sustained load.
It is of interest to note that the 4 in. by 4 in,prisms were,
in general, more affected by the load cycle than were the 3 in.
by 4 in. prisms. The average additional creep strain increment
exhibited by the 3 in. by 4 in. prisms was 0.22 x 10- 4 in./in.,
while the average increment exhibited by the 4 in. by 4 in. prisms
was 0.733 x 10- 4 in./in. A study of this observation failed to
reveal any apparent explanation.
Creep of Preshrunk Specimens
The fourth objective of this study was to compare the creep
of preshrunk specimens to the basic or viscous creep as predicted
by Ali and Kesler (8). Basic creep, as defined in Chapter I, is
the creep occurring under conditions of no moisture exchange with
Creep Cu rve
--T-----Additional creep resultingfrom load cycle
Elastic Elastic strainrecovery upon reloading
~~+Permenant set induced byJ load cycles during theelastic modulus test
c.-o...-enQ.CDCD...
U
o 20 40 60 80Time, t (days after unloading)
Figure 7. Typical reloading behavior
100
LNI--'

TABLE IIIUnloading and Immediate Reloading Data
32
-4 -4 StrainSpec- (in x 10 ) (in x 10 ) !::. in. Increment 4imen e beL U.L. e aft. U.L. x 10 4 (in/in x 10 )
4.12 36.5 40.3 + 3.8 o.63
4.22 36.3 36.4 + 0.1 0.02
4.32 54.1 55.4 + 1. 3 0.22
5.12 41. 5 43.3 + 1. 8 0.30
5.13 41.5 44.9 + 3.4 0.57
5.22 43.4 44.3 + 0.9 0.15
5.23 41.4 41.8 + 0.4 0.07
5.32 48.5 50.3 + 1. 8 0.30
5.33 44.9 45.0 + 0.1 0.02
6.12 41.2 42.0 + 0.8 0.14
6.22 30.7 31. 8 + 1.1 0.18
6.32 19.4 19.8 + 0.4 0.07
9.13 20.5 21. 4 + 0.9 0.15
9.23 59.1 60.8 + 1. 7 0.28
9.33 ' 64.4 67.2 + 2.8 0.47
12.12 50.2 52.4 + 2.2 0.37
12.22 44.8 45.9 + 1.1 0.18
12.32 26.4 27.0 + 0.6 0.10
13.12 38.2 39.4 + 1. 2 0.20
13.22 42.4 42.6 + 0.1 0.02
19.12 13.9 17.8 + 3.9 0.65
19.13 11. 9 14.4 + 2.5 0.41
20.12 44.5 50.4 + 5.9 0.98
20.13 44.3 49.6 + 5.3 0.88

33
the environment. The results of this study indicate conclusively
that the creep obtained by loading preshrunk prisms is only one
half to one-third of the basic creep as predicted by Ali and
Kesler. A typical comparison of the observed creep and the pro
posed basic creep is shown in Figure 8.
In the experimental investigations of Ali and Kesler, the
rheological model constants were obtained by fitting their proposed
basic creep equation to creep curves obtained by loading a number
of specimens which were approximately 100 days old. All of the
preshrunk specimens tested and reported in this paper were at
least 1100 days old when they were loaded. Previous investigations
have shown that as age at loading increases, creep decreases (7).
Therefore, if two identical specimens were loaded at the age of
100 days and 1100 days respectively, the 100-day old specimen
would be expected to exhibit larger creep strains than the 1100
day old specimen.
The results of this study indicate that basic creep, just as
total creep, is a function of the age of the specimen at loading.
It appears that the basic creep concept cannot be universally
applied until some method of incorporating the age at loading is
introduced. In other words, it appears that basic creep may not
be simply defined as the creep occurring under conditions of no
moisture exchange with the environment, but should also include
some reference to the age of the specimen at loading.
It is also possible that the method of computing the gel
compliance factor is not completely accurate. A reduction of

Figure 8. Basic creep and
804.0 60Time, t (days)
creep of preshrunk concrete
20
I I I
I/!> =0.525cr =1200 psi .
1l.----.-.-----
~...----
~V
AV
V K ~Basic creep (Ali and Kesler theory)
/I
/ II I i-~I y ~K~Creep of preshrunk concrete
V I I I I I I I0.0o
..c
~ 1.0-V)
a.Cl)Cl)a-
U 0.5
~ 2.0-o-xc.-
........c: 1.5-(,)
W
2.5
lJ..J.p,

35
the gel c8mpliance fact8r w8uld have the effect 8f reducing the
magnitude of the predicted basic creep strain. The results of
this study indicate that this reduction of magnitude in itself
would not be sufficient to correlate the observed results to the
predicted creep, since the observed creep curves did n8t exhibit
the rapid initial creep rate predicted by the basic creep strain
equation.
Elastic M8dulus and Strength
The fifth objective of this study was to examine the effect
of time, constituents, and environment on the elastic modulus
and strength of plain concrete prisms. All values of strength
and elastic modulus were determined from the same specimens used
in the examination of the other objectives of the report. As a
result of the test procedure which was adopted, it was possible
to obtain measurements, during the loading operation, to determine
the elastic properties of a number of the prisms. The modulus of
elasticity as defined in this paper is the value obtained by approx
imating the stress-strain curve with a straight line. Figure 9
shows a typical stress-strain curve and the straight line appr8x
imation.
It was standard pr8cedure in the test pr)gram t8 18ad four
creep racks (12 prisms) simultaneously. This procedure required
approximately three hours to complete. As a result 8f the slow
rate of loading and measurement, the stress strain relationship
as shown in Figure 9 is nearly linear. The same loading pr8cedure

36
2.50.5 l.0 1.5 2.0
Strain, € (in./in. x10)4-
.......\.J
/'
/v
7/
/ E=4.75xl06 psi
/V 1 I
II
/- 0 . Test Data.
?I T
- ~ Straight lineI IiPprOXimL:j
o0.0
200
400
1000
1400
1200
~ 800
..II)
~ 600...-V)
.-
b
Fig u re 9. loa din 9 s t res s -s t ra incu rv e
Specimen 4.22
and elastic modulus definition was used in the previous study (5).
This allowed a comparison of the original modulus of elasticity
and the modulus which was found to exist at the time of this
study.
In order to simplify the presentation of the experimental
results of this study, the following terms will be introduced and
defined for future reference:
Original modulus - modulus of elasticity existing at the
time the prism was originally loaded;
Final loaded modulus - modulus of elasticity of a prism
which had been under sustained load (creep prism);
Final unloaded modulus - modulus of elasticity of a prism
which had not previously been subjected to any load
ing (shrinkage prism).
The experimental results which were obtained in this part
of the study are presented in Table IV. It can be seen that the
elastic modulus generally decreases with time, except in the
case of those prisms which were loaded at early ages. It should
be noted also that specimens which had been under load generally
had a higher modulus than specimens which were unloaded for the
same time period. This result is to be expected since the load
would have the effect of increasing the density of the concrete.
The increased density would yield a more rigid body.
The results of the ultimate compressive strength tests are
also shown in Table IV. The original ultimate strength as listed
37

TABLE IVElastic Modulus and Strength Data
38
Modulus of Elasticity Ultimate Strength
Final FinalOrig 6 Ldd 6 Unld~ IJ. Ldd IJ. Unldd Orig Final 6,
Spec psixl0 psixl0 psixl0 % Orig % Orig psi psi % Orig
2.1 6.67 5.23 4.90 -21. 6 -26.5 4560 4280 -6.12.2 6.03 5.00 4.65 -17.1 -23.0 4460 4365 -2.12. 3 6.50 5.02 4.55 -22.8 -30.0 4690 4075 -13.13.1 4. 85 - 4.65 - -4.1 4790 3780 -21.13.2 4.89 - 4.30 - -12.1 5500 4065 -26.13.3 5.63 - 4.80 - -14.8 5380 4075 -24.24.1 5.88 4.76 4.95 -19.0 -15.9 5560 4305 -22.64.2 5.41 4.86 4.75 -10.2 -12.2 5630 4550 -19.24.3 6.50 5.15 5.15 -20.8 -20.8 5170 4285 -17.15.1 6.58 6.75 5.10 2.6 -17.5 5380 4390 -18.45.2 6.36 6.50 5.13 2.2 -19.3 5920 4610 -22.15. 3 6. 76 6.09 5.00 -9.9 -26.0 5460 4730 -13.46.1 6.81 5.32 4.70 -21. 9 -31. 0 5230 4680 -10.56 .2 6.25 5.55 5.05 -11. 3 -19.2 5540 4940 -10.96.3 6.47 - 4.95 - -23.5 8420 7580 -10.07.1 5.79 - 6.28 - 11.8 3890 4760 22.47.2 4.63 - 5.20 - 12.3 2790 2920 4.78. 1 4.50 - 4.65 - 3.3 2150 3740 74.08.2 4.37 - 5.65 - 29.2 2390 3435 47.68.3 5.67 - 5.40 - -4.8 2150 3635 69.09.1 7.11 6.65 4.97 -6.5 -30.1 8880 6980 -21. 49.2 5.63 4.78 4.41 -15.1 -21.7 3430 3080 -10.29.3 5.23 6.17 5.35 18.0 2.3 3460 3650 5.5
12.1 6.03 6.00 5.12 -0.5 -15.1 5420 4170 -23.012.2 5.17 5.88 5.40 11. 8 4.5 4580 3730 -18.612. 3 5.19 4.02 - -22.6 - - 3205 -13.1 6.18 5.90 5.93 -4.5 -4.1 4410 5200 17.913.2 6.18 6.59 5.92 6.6 -4.2 4640 3860 -17.513.3 6.23 - 5.86 - - 4640 4660 0.415.1 2.49 - - - - 4730 5090 7.115.2 2.03 - - - - 4200 4610 9.815.3 - - - - - 4850 6030 24.319.1 6.02 5.84 4.46 -3.0 -25.9 6000 5790 -3.520.1 2.43 2.93 2.25 21.4 -7.4 5290 5620 6.221.1 5.19 - 5.11 - -1.5 3250 3210 -1.221.2 4.59 - 5.11 - 11. 3 2760 2650 -4.021.3 4.29 - 4.51 - 5.1 2290 2440 6.522.1 4.71 - - - - 4210 3920 -6.922.2 4.55 - - - - 3720 3870 4.022.3 5.57 - - - - 4200 4440 5.723.1 - - - - - 4235 3960 -6.523.2 - - - - - 3300 3270 -0.9

39
in the table is based on the result of testing one unloaded
companion prism. In most cases, the final ultimate strength was
found by averaging the results of testing two prisms which had
been under load (creep prism), and one prism which had not been
under load (shrinkage prism).
The strengths of the loaded prisms and the unloaded prisms
were examined individually before they were averaged. It was
found that the absence or presence of the 900 psi, 1200 psi, or
2500 psi stress had essentially no effect on the ultimate strength
of the concrete. In 30 percent of the prisms tested, the strength
of the shrinkage prism was greater than the strength of the creep
prisms, and in the remaining 70 percent, the strength of the
creep prisms were greater than the strength of the shrinkage prism.
This would imply that the effect of sustained load on the compres
sive strength is comparatively small.
This study did reveal, however, that time has a significant
effect on the strength of the concrete. Several comments can
now be presented, which point out observed general trends.
1. Prisms which were loaded before they had reached their
28-day strength showed an increase in strength over the
strength which existed at the time the prisms were
loaded. The amount of the increase in strength was a
function of the age of the prism at loading. Those
prisms loaded at 2 days showed a greater increase in
strength than those loaded at ages greater than 2 days.
2. Normal weight prisms which were loaded after the prisms
40
had reached the 28-day strength generally showed de
creases in the ultimate compressive strength. The
amount of this decrease was as large as 25 percent in
some cases. The average amount of the decrease, with
out regard to the other variables involved, was about
13 percent.
3. In general, the lightweight concrete prisms showed
increases in strength over the recorded 28-day strength,
regardless of their age at loading. This result is to
be expected because in general lightweight concrete
does not reach full strength until about age 90 days.
This is caused by continued hydration of cement from
water absorbed by the lightweight aggregate.

CHAPTER IV
SUMMARY
The conclusions and possible explanations for the observed
phenomenon were presented in the previous chapter. These may be
summarized as follows:
1. The creep strain recovery which occurs in plain concrete
which has been under load for several years does not
behave in the same manner which was observed to occur
in specimens which were under load for a shorter period
of time, i.e., for less than six months.
2. The magnitude of the creep recovery is generally only
about five percent of the total creep. The comparatively
small magnitudes which were observed yielded no conclu
sions on the effect of constituents or environment on
the creep strain recovery behavior.
3. The procedure of unloading and immediately reloading
plain concrete prisms produces additional creep strain
above the value which would have existed if the specimen
had remained under load. The magnitude of this addi
tional creep strain increment was generally only approx
imately five percent of the total previous creep strain.
This observation would tend to indicate that concrete
subjected to a fatigue condition would exhibit larger
creep strains than concrete under sustained load.
42
4. The basic creep or viscous creep as predicted by Ali
and Kesler is from two to three times the creep strain
obtained by loading preshrunk concrete prisms. It appears
that age at loading is an important function of the basic
creep phenomenon.
5. The elastic modulus of concrete which had been loaded
after the concrete had reached its 28-day strength gen
erally decreased with time. The amount of this decrease
in elastic modulus was found to be as much as 30 percent
of the original value in some cases.
It was also found that prisms which were under a
sustained load generally maintained higher elastic moduli
than prisms which were not under load.
6. The ultimate compressive strength of the concrete gen
erally decreased with time from the value of the 28-day
strength. Some of the prisms showed as much as a 25
percent decrease in strength.
It was observed, however, that the absence or pres
ence of load had essentially no effect on the strength
of the concrete.
It should be noted in items 5 and 6 above that the
environment in which the specimens were studied (70oF
and 50% relative humidity) is essentially a drying con
dition. Concrete in normal service will receive more
moisture than was available in the test laboratory.

BIBLIOGRAPHY
1. Brautigam, P. A., tlDeflection and Strains in ReinforcedConcrete Bridges. II Unpublished Master1s Thesis, TheUniversity of Missouri, Columbia, Mo., June, 1965.
2. Pauw, Adrian and Meyers, B. L., tlEffect of Creep and Shrinkage on the Behavior of Reinforced Concrete Members,1ISymposium on Creep of Concrete, Publication SP-9, American Concrete Institute, Detroit, 1964.
3. Cronister, H. L., tlEffect of Creep, Shrinkage, and Temperature on the Deflection of Reinforced Concrete Bridges,tIa Master1s thesis under preparation at The Universityof Missouri, Columbia, Mo., 1965.
4. Jones, J. L., tlDeflection of Concrete Beams Due to SustainedLoad,1I Unpublished Master1s Thesis, The University ofMissouri, Columbia, Mo., August, 1965.
5. Buettner, D. R., tlCreep and Shrinkage of Plain Concrete,tIa report to the Missouri State Highway Commission ofthe Engineering Experiment Station of The Universityof Missouri, Columbia, Mo., 1965.
6. Freudenthal, A. M. and Roll, Frederic, tlCreep and CreepRecovery of Concrete Under High Compressive Stress,1IAmerican Concrete Institute Journal, Proc. v. 54,Detroit, 1958.
7. Neville, A. M., Properties of Concrete, New York: JohnWiley and Sons, 1963.
8. Ali, Igbal and Kesler, C. E., tlMechanism of Creep of Concrete,tISymposium on Creep of Concrete, Publication SP-9, American Concrete Institute, Detroit, 1964.
9. Meyers, B. L. and Pauw, Adrian, IIApparatus and Instrumentation for Creep and Shrinkage Studies,ll Proc. HighwayResearch .Board, Washington, 1963.
10. Meyers, B. L., IICylinder-Prism Strength and Elastic ModulusCorrelation," a report to the Missouri State HighwayCommission of the Engineering Experiment Station, University of Missouri, Columbia, Mo., 1962.

11. Roll, Frederic, "Long-Time Creep-Recovery ·of Highly StressedConcrete," Symposium on Creep of Concrete, PublicationSP-9, American Concrete Institute, Detroit, 1964.
12. Davies, R. D., "Discussion of a paper by A. M. Neville:Creep Recovery of Mortars Made with Different Cements,"American Concrete Institute Journal, Proc. v. 56,Detroit, 1959.
13. Neville, A. M., "Creep Recovery of Mortars Made with DifferentCements," American Concrete Institute Journal, Proc. v.56, Detroit, 1959.

· ._-- .........
IBlI"ODOjil'IInR 16245