e-commerce trends and impacts across europe
TRANSCRIPT

No. 220March 2015
E-COMMERCE TRENDS AND IMPACTS ACROSS EUROPE


E-CommErCE TrEnds and ImpaCTs aCross EuropE
Martin Falk and Eva Hagsten
No. 220March 2015
Acknowledgement: Initially, this study served as a background report to the UNCTAD Information Economy Report 2015 entitled “Unlocking the Potential of E-Commerce for Developing Countries”. The authors are grateful to two anonymous referees for helpful comments on an earlier draft.
UNCTAD/OSG/DP/2015/2

ii
The opinions expressed in this paper are those of the authors and are not to be taken as the official views of the UNCTAD secretariat or its member States. The designations and terminology employed are also those of the authors.
UNCTAD Discussion Papers are read anonymously by at least one referee, whose comments are taken into account before publication.
Comments on this paper are invited and may be addressed to the authors, c/o the Publications Assistant, Macroeconomic and Development Policies Branch, Division on Globalization and Development Strategies, United Nations Conference on Trade and Development, Palais des Nations, CH-1211 Geneva 10, Switzerland; e-mail: [email protected].
UNCTAD Discussion Papers are available on the UNCTAD website at http://unctad.org.
JEL classification: D24, O33, O57

iii
Contents
Page
Abstract ....................................................................................................................................................... 1
I. InTroduCTIon ............................................................................................................................... 1
II. EmpIrICal approaCh ................................................................................................................. 3
III. daTasET ............................................................................................................................................. 5
IV. E-CommErCE and ICT usagE paTTErns In EuropE ..................................................... 6
V. EsTImaTIon rEsulTs and dIsCussIon .............................................................................. 10
VI. ConClusIons ................................................................................................................................ 15
annEx a .................................................................................................................................................... 17
annEx B .................................................................................................................................................... 19
rEfErEnCEs ........................................................................................................................................... 21
List of charts
1 ICT usage and labour productivity in European firms ........................................................................... 7 2 Labour productivity by ICT intensity level of firms in 2010 ................................................................. 7 3 Employee broadband connectivity ......................................................................................................... 8 4 Websites and e-commerce in firms across Europe in 2010 .................................................................... 9 5 E-commerce by size and age of firms in 2010 ....................................................................................... 9 6 Internationally experienced firms and e-commerce in 2010 ................................................................ 10 7 Development of e-sales in firms in relation to total sales .................................................................... 10 8 Labour productivity growth and change in e-sales by industry ........................................................... 11 A1 Correlation between change in e-sales and change in broadband employees .................................... 18 A2 E-sales by industry in 2010 .................................................................................................................. 18
List of tables
1 Impact of change in e-sales activities on labour productivity growth ................................................. 12 2 Impact of change in e-sales activities on labour productivity ............................................................. 13 3 Impact of change in e-sales activities on labour productivity by size class ........................................ 14 A1 Average proportion of e-sales in firms ................................................................................................. 17 A2 Impact of change in proportion of e-sales activities on labour productivity ...................................... 17 A3 EUKLEMS industry definitions (NACE 1.1) ...................................................................................... 19 A4 EUKLEMS ALT industry definitions .................................................................................................. 20


E-CommErCE TrEnds and ImpaCTs aCross EuropE
Martin FalkAustrian Institute of Economic Research
Eva HagstenStockholm University
Abstract
This study investigates the patterns and trends of e-commerce activities as well as their impact on labour productivity growth in a group of European countries. At hand for the exercise is a unique panel of micro-aggregated firm-level data for 14 European countries spanning over the years 2002 to 2010. The empirical approach is twofold: A static specification and a dynamic panel data model. The former is a difference specification estimated by OLS and the latter uses system GMM to account for endogeneity of e-commerce activities. For the impact analysis e-commerce is narrowed down to e-sales, measured as the percentage of firms receiving orders online (EDI or websites) or as the share of total sales in firms. Descriptive statistics reveal that the proportion of firms engaging in e-sales activities is slowly growing over time starting from a low level. The OLS estimates, controlling for industry, time and country effects, show that the change in e-sales activities and labour productivity growth are significantly positively related. Specifically, an increase in e-sales raises the rate of labour productivity by 0.3 percentage points over a two-year period for the total sample. Services industries experience a larger impact than manufacturing. In addition, dynamic panel data estimates demonstrate that smaller firms gain the most from increases in e-sales. Overall, for the total business sector, these estimates reveal that the increase in e-sales activities during the period studied accounts for 17 per cent of the total growth in labour productivity.
I. InTroduCTIon
Uncertainties about both measurement and impacts of information and communication technology (ICT) – as earlier expressed by Solow (1987), for instance – have been replaced by strong empirical evidence that ICT is indeed an important factor of economic growth and firm performance (Van Reenen et al., 2010; Cardona et al., 2013). However its features and the channels through which it transforms into firm performance seem to change over time from the sole investment in computers to a multi-dimensional palette of advanced ICT systems including facilities for e-commerce activities and interactions with skills and changes in the organizational structure of the firm. These findings are partly made possible by improvements in measurement over time, where aggregate ICT capital is no longer the sole source. Detailed information on ICT usage in firms is available thanks to pioneering statistical and analytical work by the OECD, the European Commission (Eurostat and EUKLEMS) and extended to developing economies by UNCTAD. This development also made the three different Eurostat ICT Impacts projects possible, where nationally linked firm-level and micro-aggregated cross-country datasets (the Micro Moments Database) allow statistics on ICT usage of firms to appear in several novel dimensions.1
1 ESSNet on Linking of Microdata to analyse ICT Impact (ESSLait), ESSnet on Linking of Microdata on ICT Usage (ESSLimit) and ICT Impacts. See www-cros-portal.eu.
2
In this study our main purpose is to go beyond the already extensively researched field of investments in ICT hardware and broadband and instead concentrate on another kind of adoption: e-commerce activities in firms. Indeed, simple systems for e-commerce were available long before the Internet, especially for business to business exchanges. However, e-commerce of today most likely requires advanced infrastructure to work. We aim to empirically investigate the patterns and trends of e-commerce activities and their impact on firm performance, measured as labour productivity growth in a group of European countries.
The empirical approach is twofold: a static specification and a dynamic panel data model. The former is estimated by OLS in two-year differences and the latter by the system GMM estimator, which makes it possible to account for endogeneity of the e-commerce activities. A number of previous studies have applied dynamic panel data methods to study the impact of ICT investments using multi-country industry level datasets (O’Mahony and Vecchi, 2005; Venturini, 2009; Dahl et al., 2010). To the best of our knowledge no such study is available for e-commerce activities. Nor have we encountered any earlier studies with this broad country coverage or with data in dimensions as novel as in the Micro Moments Database (MMD).
For the impact analyses e-commerce is narrowed down to e-sales. These activities are measured either as the percentage of firms with sales activities or the proportion of sales through computer networks (websites or EDI). This focus is mainly motivated by data limitations (consistent question comparability). A firm is considered to be engaged in e-sales when it receives orders via a website, EDI-type systems or other means of electronic data transfer, in accordance with the EU-harmonized survey on ICT usage in enterprises.2
We use micro-aggregated rather than firm level data to study the productivity effects of e-sales activities.3 There are two motivations for this: Firstly, firm-level data is confidential and difficult to stack in one international dataset. Secondly, even with access to linked firm-level data, the high attrition rates caused by the rotating nature of the ICT/e-commerce surveys mean that the use of panel data methods would offer few additional insights.
The literature on ICT as an enabler of growth is vast, going from the aggregates (Jorgenson and Stiroh, 1999; Chou et al. 2014) and investments in hardware to more disaggregated studies on selected groups of firms (Black and Lynch, 2001; Brynjolfsson and Hitt, 2003; Bartelsman, 2010; Van Reenen et al., 2010). ICT is considered to potentially improve the quality of the production factors. The more productive these factors are the greater the return to investments. The empirical studies often consider ICT and firm performance in conjunction with other important factors such as skills and organizational structure. However, Cardona et al. (2013) conclude that there is a caveat: ICT needs to be well embedded to render positive effects. In the different phases of the ICT impacts projects (Eurostat 2008, 2012 and 2013) broadband internet-enabled employees were found to be the kind of usage most clearly related to productivity, at the firm as well as at the industry level (see also Grimes et al., 2012).
The adoption of e-commerce activities are investigated in several studies where factors such as quality of the underlying ICT infrastructure, ICT skills, adjustment costs, uncertainties surrounding e-commerce and perceived strategic value for the firm are considered important determinants, factors that also to a certain degree make firms reluctant to engage in these activities (Grandon and Pearson, 2004; Hollenstein and Woerter, 2008; Oliveira and Martin, 2010; Ben Aoun-Peltier and Vicente Cuervo, 2012). Eriksson et al. (2008) show that Swedish SMEs, despite having access to high-level infrastructure, do not manage utilization of advanced ICT systems.
2 For further discussion, see http://epp.eurostat.ec.europa.eu/cache/ITY_SDDS/EN/isoc_bde15d_esms.htm.3 Micro-aggregated means that information has been sourced at the level of the firm, but due to disclosure issues the firms have then been grouped by industry or other firm characteristics.

3
A growing field of literature emphasizes ICT as a facilitator of international trade. By using websites for promotion and sales channels, firms may be able to sell to markets otherwise not reachable due to distance or political systems, for instance. Fraumeni (2001) reasons that the digital economy and e-commerce activities will expand the global economy, while Morgan-Thomas (2009) finds that several different kinds of online capabilities are important for the internationalization of firms. According to Terzi (2011), the Internet will lead to increased amounts of international e-commerce following its capacity to reduce trade barriers. In the short run the gains from this will appear in the developed countries, but a shift to developing countries is expected in the long run. Martens (2013) shows that ICT and e-commerce are efficient reducers of distance-related trade costs.
Another branch of the literature deals with e-commerce effects on firm performance. Zhu and Kraemer (2005) conclude that both front-end (product information) and back-end capabilities (web applications, ICT infrastructure) increase the value of e-commerce in the retail industry across a group of countries. In developed countries, the back-end capabilities render a stronger influence while in developing countries the opposite effect is found. In contrast to e-sales processes, Quirós Romero and Rodríguez Rodríguez (2010) find that e-purchases have a positive effect on Spanish firm efficiency.
Positive links to productivity have been found by Xia and Zhang (2010) and Liu et al. (2013) although spillover effects within the specific industry are also important. The former study is based on a small sample of retailing firms in the United States for the years 1996–2008 and the latter relates to manufacturers in Taiwan Province of China in 1999 to 2002. Large ICT intensive firms in Belgium (Konings and Roodhooft, 2002), and firms with advanced ICT systems in Italy (Colombo et al., 2013) exhibit similar patterns of positive associations between e-commerce and firm performance. The “dot.com era” is captured by Subramami and Walden (2001) who present a study where the pure signalling of e-commerce intentions increases the market value of the firm.
The study is organized as follows: First, we describe the empirical approach and the dataset at hand. This is followed by a section on e-commerce and ICT usage patterns across Europe. Then we present and discuss the results of the impact analyses. Finally, we conclude and suggest possible lines of future work.
II. EmpIrICal approaCh
The theoretical rationale underlying the impact analysis relates to the efficiency in the sales activities rather than to the production process itself. E-commerce activities represent additional channels for firms to do business and enter new markets. When distance becomes less crucial (Lohrke et al., 2006) and e-commerce offers diminished adjustment and transaction costs, consolidation of supply and demand and decreased need of intermediaries or physical presence (see for instance; Garicano and Kaplan, 2001; Lucking-Reiley and Spulber, 2001) there is scope for the firms to streamline their sales activities.
In order to study the impact of e-sales on labour productivity, micro-aggregated data are employed. Two different datasets are used: The first one consists of 2-digit industries and the second one uses data by both size class and broad industry groups. By means of the multi-country panel dataset, the level of labour productivity (in constant prices) in a given industry can be modelled as a function of the e-sales activities in the firm, with control variables:
(1)
where i,...,25 denote industry, t,..,8 time and c,..,14 country. VACP reflects the production value (value added) in constant prices and L employment. The variable %esales measures the percentage of firms that sell goods and services over the Internet or computer networks. Alternatively the share of sales through computer networks is used. X contains control variables such as the capital stock, λt encompasses the time effects and αic denotes the fixed effects (country/industry pairs). The error term εict is assumed to
ictticticticictict cXesalesLVACP ελβα ++++= %)/ln(

4
be independently and identically distributed (iid). The labour productivity equation may be estimated by a two-way fixed effects model although a difference specification estimated by OLS is an attractive alternative. It is well known that a long difference specification reduces the problem of measurement error (Griliches and Hausman, 1986). This problem is more likely to arise within the annual variation instead of when changes over two or five years are studied. Taking two year differences and adding sets of country DOC and industry DSEC dummy variables gives the following labour productivity growth equation:
(2)
where ∆ refers to the change of the variables over a two-year interval. Labour productivity is calculated as the growth rate:
and the change in e-sales is measured in percentage points
.
The new error term is defined as vic ≡ εict – εict–2 and is assumed to be normally distributed with zero mean and with a constant variance-covariance matrix.
The labour productivity growth equation can be estimated by OLS with heteroscedasticity consistent standard errors, allowing the error term to deviate from the assumption of zero variance. Since OLS estimates based on cross-sectional data are likely to be sensitive to influential observations, the labour productivity equation is also estimated by the robust regression method. This regression technique is a weighted least-squares procedure that puts less weight on outliers and is achieved by using Cook’s distance and then performing Huber iterations. Furthermore, the labour productivity equation is estimated separately for broad industry groups in order to allow for differences in the relationships.
In general, it is assumed that the direction of causality goes from e-sales practices to labour productivity growth. However, e-sales activities are most likely endogenous due to output changes, as well as unobservable factors affecting both output and e-sales activities. Examples of this are business cycle fluctuations or demand shocks to the economy. The system GMM panel data estimator (Blundell and Bond, 1998) can be used to account for the correlation of e-sales activities with the error term. This estimator is particularly useful for panel data with a relatively large number of cross section units and a small time dimension – as is the case here – with an unbalanced multi-country industry panel consisting of 345 country-industry pairs and eight years. Given that the level of labour productivity shows a high degree of persistence we assume a dynamic adjustment process. Here the observed shift in labour productivity is a fraction of the required change to reach the optimal level of labour productivity which is ln(VACPict / Lict)*. The parameter ω measures the speed of the adjustment process:
By incorporating the partial adjustment mechanism into the static equation, the labour productivity equation in dynamic form is obtained:
(3)
where μic denotes fixed effects (country-industry pairs) and λt time effects. The adjustment parameters can be calculated as ω = (α1 – 1). The long-run effect of e-sales activities on labour productivity is obtained by β^ / (1 – α̂1). Alternatively, the size class/industry pairs panel data set can be used to investigate the impact of e-commerce. This makes it possible to explore whether the impact of e-sales activities βs vary across firm size:
icticicicic DSECDCOcXesalesLVACP νλβα +++++∆+=∆ ~%~~)/ln( 0
)/ln()/ln()/ln( 22 −−−=∆ icticticticticic LVACPLVACPLVACP
2%%(% −∆−∆=∆ ictictic esalesesalesesales (
[ ])/ln()/ln()/ln()/ln( 11*
11 −−−− −=− ictictictictictictictict LVACPLVACPLVACPLVACP ω
ictticictictictictict uesalesLVACPLVACP ++++= −− λµβα %)/ln()/ln( 111

5
icsttiscicsticstsicsticsticsticst ucXesalesLVACPLVACP +++++= −− λµβα %)/ln()/ln( 111
(4)
where i denotes sector, c country and s = 1,..,4 size classes (10–19, 20–49, 50–250 and 250+ employees) and represents the fixed effects (country by industry by size class). The labour productivity equation is estimated for three size classes separately (10–19, 20–49, 50–249 and 250+ employees).
The system GMM estimator builds on two equations: the one is based on the first difference specification and the other on the equation in levels. In the first equation lagged levels are used as instruments. Variables in the equation in levels are instrumented with lags of their own first differences. The two-step estimator is used to estimate the labour productivity equation with the finite sample correction developed by Windmeijer (2005). The e-sales variable is treated as endogenous (predetermined). The instruments consist of lagged variables from the first to the fifth lag in level and difference equations. As a rule-of-thumb the number of instruments should not exceed the number of groups in the regression (Roodman, 2009).
III. daTasET
Data for this analysis originate from the ESSLait Micro Moments Database (MMD).4 This database holds linked and micro-aggregated information on firms sourced from the national statistical offices in 14 European countries. Information is available from registers on business, trade and education as well as from surveys on production, ICT usage and innovation activities for the years 2001–2010. The data is available at the two-digit industry level as well as for the EUKLEMS alternative hierarchy and in several other dimensions such as size class, age class, ICT intensity, innovation activity, ownership, affiliation and international experience.5 An overview of the industry classification is presented in annex B. In this empirical application the 2-digit industry country panel data set and data aggregated by both size class and broad industry groups are employed. Available variables may vary somewhat across countries, partly following the feasibility to link datasets (legal as well as practical), partly depending on the model design of sample surveys, where certain questions are mandatory and others are not.
The Distributed Microdata Approach (Bartelsman, 2004) has been employed to build the MMD. This approach relies heavily on initial and careful metadata analysis including strict harmonization of firm-level variables. With a set of harmonized variables the process of organizing the national firm-level datasets in an identical infrastructure can start and a generic code can be developed. This Common Code is then run by each participating provider of statistics and the output generated consists of a set of summary tables with descriptive statistics and moments in different dimensions, at a level of aggregation where disclosure becomes less of a problem. Finally, each national output is pooled into a cross-country dataset: the MMD. By securing that data work and code running is dealt with in the described identical fashion, cross-country comparability can be guaranteed.
Value added is defined as gross output minus intermediate purchases of services and goods. The ICT variables give the percentage of firms in an industry using the tool in question, unless something else is explained. Size of firm is represented by the number of employees. Nominal prices have been deflated by EUKLEMS or WIOD two-digit price indexes.6
4 See www.cros-portal.eu. The Micro Moments Database includes micro-aggregated firm-level information for Austria, Denmark, Finland, France, Germany, Ireland, Italy, Luxembourg, the Netherlands, Norway, Poland, Slovenia, Sweden and the United Kingdom.5 More recent information about ICT usage in firms can be retrieved from the Eurostat databases. However those data have not been linked at the level of the firm and then aggregated, meaning that several dimensions of interest for impact analyses are not available.6 See www.euklems.net and www.wiod.org.
6
It is important to note that the descriptive statistics presented here may deviate somewhat from official statistics. This has two causes: The one follows from the fact that results from single sample surveys normally are aggregated, while micro-data linking has to be conducted on unweighted values. The implication of this is that the descriptive statistics display information about firms on average. If, for instance, an emphasis on firm size is needed, an ex-post re-weighting schedule can be used. The other cause is the existence of breaks in time series, which as far as possible have been over-bridged in the MMD.
IV. E-CommErCE and ICT usagE paTTErns In EuropE
ICT usage (or ICT tools) across Europe displays several patterns, from rapidly growing to almost no change at all. This is illustrated in chart 1, where the development for 13 European countries is reported.7 The lower or moderate growth of e-commerce might indicate that an underlying ICT-infrastructure is an important condition but not enough for engagement, as suggested by Bharadwaj and Soni (2007).
Websites (WEB) were in frequent use even before the times of fixed broadband connections (BROAD). These connections have gained vastly in popularity since the early 2000s, although now closer to saturation a more modest growth can be identified. Mobile connections (MOB) in firms are an ICT tool that initially showed slow progress but more recently has surged. This pattern resembles that of broadband connections in earlier years. Despite the strong development of mobile connections in firms, fixed broadband usage has not experienced a corresponding decline, indicating that mobile connections are not (yet) substitutes but rather complements to fixed broadband connections.
The development of e-commerce activities (ECOM, e-selling and/or buying) or pure e-sales (AESELL) deviates from the other ICT tools by exhibiting both a lower level of intensity and slower growth.8 Approximately one out of four firms is active with e-sales and somewhat more than half of the firms engage in at least one of these two online activities. The temporary dip in both e-sales and e-commerce in 2007 should not be over-interpreted since it follows from slight definitional changes in the Eurostat EU-harmonized questionnaire for ICT usage in enterprises.
In comparison with the other ICT tools, the development of e-commerce and e-sales appears puzzling. Eurostat (2008, 2012 and 2013) suggests that there could be a threshold as well as a ceiling regarding the prospect of benefiting from ICT usage in firms. This is exemplified by the relationship between broadband Internet enabled employees and firm performance. When the intensity of usage comes close to saturation, the link to firm performance might weaken, although it remains stronger for firms at a lower level of intensity. This pattern is represented by the Nordic countries, already high in ICT usage, gaining less in productivity than countries from Eastern Europe, still low in usage. A minimal level of usage equally lacks the strength to impact firm performance. Bertschek et al. (2013) illustrates this in a study of the early years of broadband adoption in German firms, where no links to labour productivity could be found. Grandon and Pearson (2004) suggest that the adoption of e-commerce is related to the perceived strategic value for the firm of such an adoption. A lack of belief in online commerce could thus be an underlying explanation to the sparse development. Ben Aoun-Peltier and Vicente Cuervo (2012) argue
7 Usage and access to PCs in firms are now so common that these phenomena are no longer accounted for in official statistics, and data on pure ICT investments are only available in a smaller group of European countries. Thus inclusion of time series on this is not possible here.8 More recent information on ICT usage and e-commerce than analysed here is available online from Eurostat. However, those data are not linked and cannot be presented in the same dimensions as needed for this study. Nevertheless, these data confirm that the development of e-sales is still idling. Online purchases, on the other hand, which are included in the ECOM variable might even have deteriorated somewhat although comparable evidence of this is lacking. From 2011 onwards information on online purchases became voluntary for statistical offices and several countries now refrain from including questions about this in their questionnaires. See http://epp.eurostat.ec.europa.eu/portal/page/portal/statistics/search_database.

7
that the many uncertainties surrounding e-commerce are barriers to its diffusion. Hollenstein and Woerter (2008) agree on this and also add adjustment costs as important drivers of diffusion.
While the development of different ICT tools to a certain degree might be affected by the business cycle, no clear evidence of such effects or of the financial crisis can be seen in the descriptive statistics. Indeed, this might follow from the level of the analysis. Highly aggregated data might to a certain extent cancel out firm-level reactions to the crisis. For instance, Eurostat (2012, 2013) finds that firms high in ICT usage are more volatile than other firms, although the causality is unclear. The development of labour productivity (LPV), which first grows, contracts and then flattens out as it approaches the end of the decade (right hand Y-axis of chart 1) indicates cyclical behaviour. After a downturn the typical pattern in early phases of recovery is a pick-up, when existing capacities are highly utilized.
Labour productivity can also be reported for different groups of firms by their ICT intensity (chart 2). Results for 2010 reveal a clear pattern: Firms with a wider usage of ICT, in this case illustrated by the proportion of broadband Internet enabled employees (BROADpct), are operating at a higher level of labour productivity. The largest group includes those firms with less than 40 per cent of connected employees, and the next largest group is the upper percentile users.
Although fast broadband connections in firms and staff that manage to operate them may not have initially been conditions for setting up a website or taking part in electronic sales activities, such capacities certainly are more important now, at least if the website is expected to have some kind of interactive functions, such as online ordering. Despite this, the magnitude of the significant correlation between the change in the percentage of Internet-enabled employees (BROADpct) and in the percentage of firms with e-sales activities is at best moderate with a correlation coefficient of 0.18 (see chart I in Annex A). This emphasizes that access to internet and e-skills may not be the only aspects of importance for a firm when considering selling online.
A closer look at the broadband connections (mobile and fixed) in chart 3A and B shows that the proportion of employees with these tools available (BROADpct
Chart 1ICT usage and labour productivity in
European firms
Source: ESSLait Micro Moments Database.Note: Average for 13 European countries: Austria, Den
mark, Finland, Germany, Ireland, Italy, Luxembourg, the Netherlands, Norway, Poland, Slovenia, Sweden and the United Kingdom. France is excluded because of gap in the time series. The Netherlands is excluded from MOB and WEB also due to gaps. LPV is value added based labour productivity, pppadjusted, reported on the righthand axis. The ICT variables are expressed as the proportion of firms with fixed broadband connections (BROAD), mobile connections (MOB), websites (WEB), online sales (AESELL) or online sales and/or purchases (ECOM).
40
45
50
55
60
65
70
75
80
85
90
0
10
20
30
40
50
60
70
80
90
100
2003 2004 2005 2006 2007 2008 2009 2010
Eur
o, th
ousa
nds
Per
cen
t
broad
aesell
mob
ecom
web
LPV (right axis)
Chart 2Labour productivity by ICT intensity
level of firms in 2010(Measured as a proportion of broadband Internet-
enabled employees (BROADpct); Euro, thousands)
Source: ESSLait Micro Moments Database.Note: Average for 12 countries: Denmark, Finland,
Germany, Ireland, Italy, Luxembourg, the Netherlands, Norway, Poland, Slovenia, Sweden and the United Kingdom.
0
20
40
60
80
100
120
mean <40% 40-89% >90%
BROADcat

8
and MOBpct) is increasing over time, although less near saturation level than the proportion of firms (as illustrated in chart 1). The span between types of broadband is also diminishing over time, where the mobile connections in firms seem to be catching up rapidly. Notable is that the spread between the country with the lowest connectivity among employees and the highest, is less wide for mobile connections.
Beyond the European average there is a spread in the intensity of websites and e-commerce in firms. Northern Europe and small countries seem to be more inclined to use websites than larger countries in the south. Finland and Sweden are close to saturation at levels above 90 per cent while in Italy only every second firm has a website (chart 4).
The general pattern also holds true for the development of e-commerce and e-sales, although it appears that being the country with the highest use of websites in firms does not automatically indicate a similarly high proportion of firms with engagement in e-commerce or pure e-sales activities. Norwegian firms are most intensively engaged, with Irish and Swedish firms not far behind. Austrian firms, with widespread usage of websites, are keen on e-commerce in general, but less so in regard to online sales. It is important to remember that these variations partly reflect differences in the industry structures across countries.
Not only varying structures across countries, but also domestic factors such as industry, size and age might affect the degree or possibility of firm engagement in online sales. In chart 5, e-sales activities are illustrated by four combinations of size and age classes, where a young firm is less than five years old and where a large firm has at least 50 employees.
Besides a certain variation among industries, with the ICT producing sector (Elecom) being the most active in e-commerce and where the services firms (Mserv) among small firms have more functions for online ordering, it is clear that size is more discriminating for e-commerce than age. This holds true also for the manufacturing firms exclusive of ICT (MexElec).
A more detailed picture of the spread in e-sales activity across industries is presented in chart A2 in annex A. This reveals that firms producing consumer goods, personal services, distribution and ICT, are most frequently active in e-sales.
Chart 3Employee broadband connectivity
(Per cent)
Source: ESSLait Micro Moments Database.Note: Average for 9 countries: Ireland, Finland, Denmark, Germany, Norway, Poland, Slovenia, Sweden and the United Kingdom.
Country with lowest and highest values varies over time.
0
10
20
30
40
50
60
70
2003 2004 2005 2006 2007 2008 2009 2010
B. Fixed connections (BROADpct)
broadpct broad_min broad_max
0
10
20
30
40
50
60
70
2003 2004 2005 2006 2007 2008 2009 2010
A. Mobile connections (MOBpct)
mobpct mob_min mob_max

9
International experience and distance to markets are additional factors that might affect the degree of e-commerce in firms. From chart 6 we can draw the conclusion that exporting firms are indeed more active with online transactions and the differences among industries are also less pronounced than on the domestic market.
Chart 4Websites and e-commerce in firms across Europe in 2010
(Per cent)
Source: ESSLait Micro Moments Database.Note: WEB means the proportion of firms with websites, ECOM proportion of firms that engages in either e-sales or e-purchases
and AESELL proportion of firms with e-sales activities. Italian data refer to the year 2009. All values are weighted with respect to sample size.
Chart 5E-commerce by size and age of firms in 2010
(Per cent)
Source: ESSLait Micro Moments Database.Note: Averages for 10 countries: Denmark, Finland, France, Ireland, Italy, the Netherlands, Norway, Poland, Slovenia and
Sweden. Small indicates fewer than 50 employees and young means less than five years old. Elecom is the ICT sector (NACE rev. 1.1, industries 30–33 and 64), while MexElec and MServ are manufacturing and services industries, exclusive of ICT. AESELL illustrates online sales and ECOM online sales and/or purchases.
0
10
20
30
40
50
60
70
80
90
100
FI SE AT UK SI DE NL NO IE PL DK FR LU IT NO AT DK UK DE FI SE IE LU FR SI NL IT PL NO IE SE UK SI FI DK DE FR NL AT LU PL ITWEB ECOM AESELL
0
10
20
30
40
50
60
70
80
old_large young_large old_small young_small old_large young_large old_small young_small
aesell ecom
Elecom MexElec Mserv

10
The degree of e-sales activity in a firm can also be measured as this channel’s share in total sales (AESVALPCT). Between 2003 and 2009 the proportion doubled, although the extent is still low. On average, almost one seventh of sales is conducted through digital systems. In 2010 it was voluntary for statistical offices to include in the EU-harmonized questionnaire a question on the proportion of e-sales. This led to inconsistent coverage across countries and is why 2010 is left out in chart 7. Information for a smaller sub-group of countries, with Sweden, Italy and Luxembourg excluded, indicates a downturn in 2010. Detailed data by country is available in table A1 in annex A.
V. EsTImaTIon rEsulTs and dIsCussIon
In order to obtain an initial idea of the pattern of association between labour productivity growth and e-sales activities, two scatter plots are presented. Chart 8 illustrates the change in labour productivity against the change in the percentage of firms with e-sales for both manufacturing and services industries in the group of 14 European countries. The time period is restricted to the pre-financial and economic crisis of 2003–2008. For manufacturing industries we find a significant and positive correlation between labour productivity growth and change in e-sales activities. However, the correlation is only significant at the 10 per cent level and the magnitude is rather low (of about 0.22). The low significance level might be due to influential observations and outliers. Note also that differencing (using growth rates) may increase the measurement error in the data.
Services industries exhibit a positive and highly significant relationship (1 per cent level) between labour productivity growth and change in e-sales activities. The correlation coefficient is fairly high at 0.49. This indicates that the relation between e-sales activities and labour productivity growth differs across industry groups. The correlations should be interpreted with caution because they suffer from omitted
Chart 6Internationally experienced firms and
e-commerce in 2010(Per cent)
Source: ESSLait Micro Moments Database.Note: Average for 10 countries: Austria, Denmark, France,
Ireland, the Netherlands, Norway, Poland, Slovenia, Sweden and the United Kingdom. Elecom is defined as the ICT sector (NACE rev. 1.1, industries 30–33 and 64), while MexElec and MServ are manufacturing and services industries, respectively, exclusive of ICT. AESELL illustrates online sales and ECOM online sales and/or purchases.
Chart 7Development of e-sales in firms
in relation to total sales(Per cent)
Source: ESSLait Micro Moments Database.Note: Average for 12 countries: Austria, Denmark,
Finland, Germany, Ireland, Italy, Luxembourg, the Netherlands, Norway, Slovenia, Sweden and the United Kingdom. France and Poland are excluded due to gaps in time series. In 2010 the question relating to variable AESVALPCT measuring esales as a proportion of total sales became voluntary to include in the EU-harmonized questionnaire.
0.0
0.1
0.2
0.3
0.4
0.5
0.6
0.7
0.8
Elecom Mserv MexElec Elecom MServ MexElecExporter Non-exporter
ecom aesell
5
7
9
11
13
15
17
2003 2004 2005 2006 2007 2008 2009
AESVALPCT

11
variable bias and do not reflect causal effects. Nevertheless they could provide an initial indication of a possible positive relationship.
The next step is to analyse the relationship between labour productivity growth and change in e-sales activities by using regression analyses. Table 1 shows the OLS estimates of the impact of the change in e-sales activities on labour productivity growth. Separate results are provided for manufacturing and services industries.
Because of the demand shock to the world economy in the late 2000s, three different periods are estimated: (i) total time period 2002–2010, (ii) pre-crisis period 2002–2008 and (iii) the crisis period 2008–2010. Additionally, table 1 also includes results obtained from the robust regression method which reduces the impact of extreme outliers or influential observations that may follow from measurement errors in e-sales or labour productivity variables. For each of the 14 European countries we use data from approximately 25 industries and up to four two-year time periods, resulting in a total of about 1,200 observations.
The main result is a positive and significant relationship between the change in labour productivity and change in the percentage of firms with e-sales when controlling for industry, country and time effects. This indicates that industries with an increase in the proportion of firms selling through computer networks experienced a higher growth rate of labour productivity. These findings are consistent with the previous literature. Liu et al. (2013) use a similar approach on a sample of firms from Taiwan Province of China and find that e-commerce has a positive impact on productivity, although the effect is stronger in combination with R&D. Xia and Zhang (2010) shows that online sales channels increases sales volumes for about 100 publicly traded United States retailers during the period 1996–2008. By using firm level data for Belgium, Konings and Roodhooft (2002) reveal a productivity impact from e-businesses in large ICT-intensive firms.
Chart 8Labour productivity growth and change in e-sales by industry
Source: ESSLait Micro Moments Database.Note: The sample is based on industry level data for 13 EU countries (AT, DE, DK, FI, IE, IT, LU, the NL, NO, PL, SE, SI and
the UK). FR is excluded due to a break in time series. The following industries are included: NACE rev 1.1 15a6, 17t9, 20, 21, 22, 23a4, 25, 26, 27, 28, 29, 30a3, 31, 32, 34, 35, 36a7, 50, 51, 52, 60t3, 64, 71a4, 72, 73. Labelled points indicate countries and industries with highest correlation.
-2
-1
0
1
2
Cha
nge
in la
bour
pro
duct
ivity
200
3–20
08, p
er c
ent
-.2 0 .2 .4 .6
Manufacturing, r: 0.22, p: 0.10
-1
-.5
0
.5
-.1 0 .1 .2Change in % of firms with e-sales 2003–2008
Services, r: 0.49, p: 0.00
UK 15a16
DE 34a35
NL 51
DK 51
NL 52NO 52
NO 50
Cha
nge
in la
bour
pro
duct
ivity
200
3–20
08, p
er c
ent
Change in % of firms with e-sales 2003–2008

12
The magnitude of the relationship differs across time periods and between manufacturing and services industries. In general, robust regression methods produce smaller coefficients with higher significance levels, indicating the presence of outliers. Based on the robust regression method for the total sample 2002–2010 the coefficient of e-sales arrives at 0.12. This indicates that an increase in the share of firms with e-sales activities of one percentage point leads to an increase in the rate of labour productivity growth by 0.1 percentage points over the two-year period (as compared with the OLS-estimate of 0.28 percentage points). If the most turbulent years of the financial crisis are excluded (2008–2010), the estimates are both larger (0.22 and 0.46 respectively) and exhibit a higher significance level. Given the moderate growth rate of labour productivity in most European countries these effects are not negligible. When distinguishing
Table 1Impact of change in e-sales activities on labour productivity growth
(OLS and robust regression method)
Total Manufacturing Services
Industry coef. t coef. t coef. t
OLS estimates 2002–2010
Change in % of firms with e-sales activities 0.28** 2.15 0.28* 1.76 0.41 1.61Constant -0.15 -1.55 0.03 0.28 -0.16 -0.60# of observations 1167 756 363R-squared 0.12 0.14 0.16
Robust regression method 2002–2010
Change in % of firms with e-sales activities 0.12** 2.09 0.11 1.63 0.30** 2.38Constant -0.13*** -2.92 0.15*** 2.96 -0.06 -0.92# of observations 1167 756 363
OLS estimates 2002–2008
Change in % of firms with e-sales activities 0.46*** 2.93 0.43** 2.21 0.66** 2.40Constant -0.10 -0.81 -0.05 -0.48 0.07 0.60# of observations 874 567 271R-squared 0.14 0.18 0.17
Robust regression method 2002–2008
Change in % of firms with e-sales activities 0.22*** 3.44 0.22*** 2.98 0.40*** 3.06Constant 0.00 0.06 -0.01 -0.22 0.12 1.58# of observations 874 567 271
OLS estimates 2008–2010
Change in % of firms with e-sales activities 0.14 0.63 0.07 0.29 0.22 0.44Constant 0.15 1.21 0.22 1.34 -0.08 -0.63# of observations 293 189 92R-squared 0.27 0.28 0.43
Robust regression method 2008–2010
Change in % of firms with e-sales activities 0.02 0.14 -0.04 -0.23 0.39 1.19Constant 0.08 1.00 -0.01 -0.12 -0.10 -0.95# of observations 293 189 92
Source: ESSLait Micro Moments Database and own calculations.Note: The dependent variable is the change in log labour productivity in constant prices over two-year periods (i.e. 2002–2004,
2004–2006, 2006–2008 and 2008–2010). OLS estimates are based on heteroscedasticity consistent standard errors. All regressions include country, industry and time dummy variables which are not reported. ***, ** and * denote significance at the 1, 5 and 10 per cent levels. The industry groups include NACE rev 1.1: 15a6, 17t9, 20, 21, 22, 23a4, 25, 26, 27, 28, 29, 30a3, 31, 32, 34, 35, 36a7, 50, 51, 52, 60t3, 64, 71a4, 72, 73. Data for industry NACE 55, 65t67, and 90 are excluded because of erratic country and time coverage. The country group includes AT, DE, DK, FI, FR, IE, IT, LU, the NL, NO, PL, SE, SI and the UK.
13
between manufacturing and service industries, robust regression estimates show that the coefficient of the change in e-sales activities amount to 0.22 and 0.40 for the pre-crisis period. This reveals that the relationship is larger for services than for manufacturing firms. The result for the crisis period (2008–2010) suggests that industries characterized by a higher share of firms with e-sales activities were affected by the downturn similarly to those with a low level of e-sales activities.
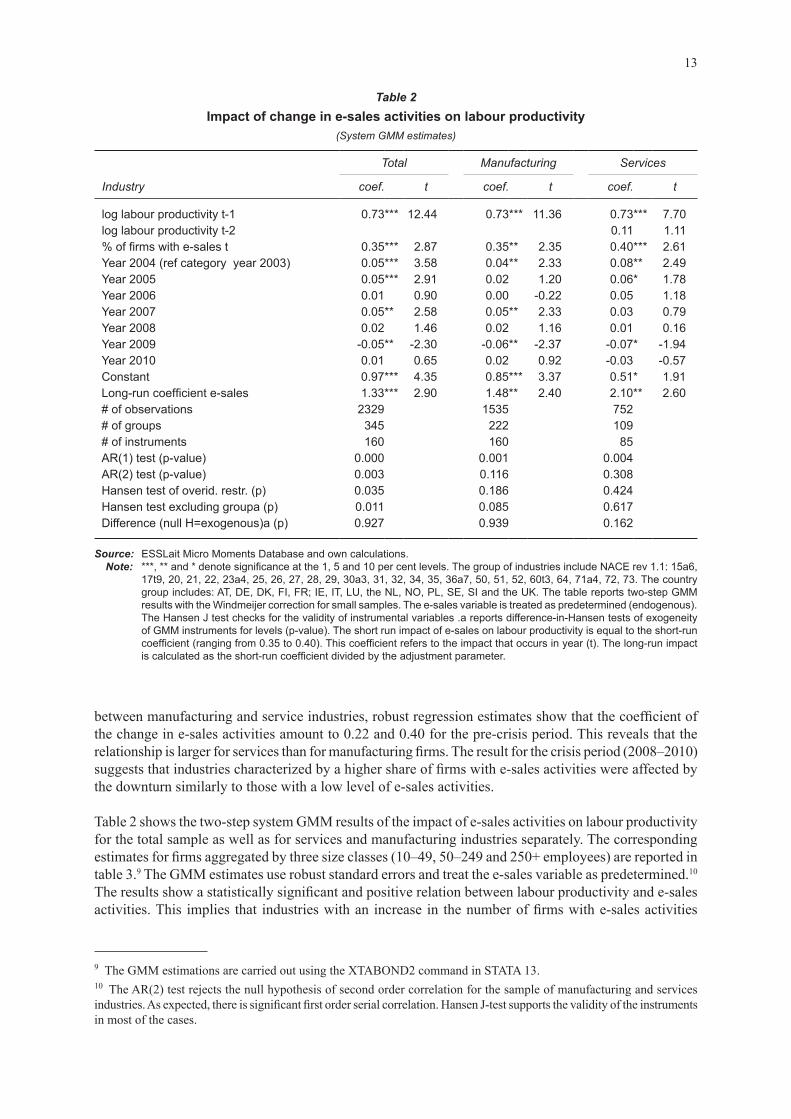
Table 2 shows the two-step system GMM results of the impact of e-sales activities on labour productivity for the total sample as well as for services and manufacturing industries separately. The corresponding estimates for firms aggregated by three size classes (10–49, 50–249 and 250+ employees) are reported in table 3.9 The GMM estimates use robust standard errors and treat the e-sales variable as predetermined.10
The results show a statistically significant and positive relation between labour productivity and e-sales activities. This implies that industries with an increase in the number of firms with e-sales activities
9 The GMM estimations are carried out using the XTABOND2 command in STATA 13. 10 The AR(2) test rejects the null hypothesis of second order correlation for the sample of manufacturing and services industries. As expected, there is significant first order serial correlation. Hansen J-test supports the validity of the instruments in most of the cases.
Table 2Impact of change in e-sales activities on labour productivity
(System GMM estimates)
Total Manufacturing Services
Industry coef. t coef. t coef. t
log labour productivity t1 0.73*** 12.44 0.73*** 11.36 0.73*** 7.70log labour productivity t2 0.11 1.11% of firms with e-sales t 0.35*** 2.87 0.35** 2.35 0.40*** 2.61Year 2004 (ref category year 2003) 0.05*** 3.58 0.04** 2.33 0.08** 2.49Year 2005 0.05*** 2.91 0.02 1.20 0.06* 1.78Year 2006 0.01 0.90 0.00 -0.22 0.05 1.18Year 2007 0.05** 2.58 0.05** 2.33 0.03 0.79Year 2008 0.02 1.46 0.02 1.16 0.01 0.16Year 2009 -0.05** -2.30 -0.06** -2.37 -0.07* -1.94Year 2010 0.01 0.65 0.02 0.92 -0.03 -0.57Constant 0.97*** 4.35 0.85*** 3.37 0.51* 1.91Long-run coefficient e-sales 1.33*** 2.90 1.48** 2.40 2.10** 2.60# of observations 2329 1535 752# of groups 345 222 109# of instruments 160 160 85AR(1) test (p-value) 0.000 0.001 0.004AR(2) test (p-value) 0.003 0.116 0.308Hansen test of overid. restr. (p) 0.035 0.186 0.424Hansen test excluding groupa (p) 0.011 0.085 0.617Difference (null H=exogenous)a (p) 0.927 0.939 0.162
Source: ESSLait Micro Moments Database and own calculations.Note: ***, ** and * denote significance at the 1, 5 and 10 per cent levels. The group of industries include NACE rev 1.1: 15a6,
17t9, 20, 21, 22, 23a4, 25, 26, 27, 28, 29, 30a3, 31, 32, 34, 35, 36a7, 50, 51, 52, 60t3, 64, 71a4, 72, 73. The country group includes: AT, DE, DK, FI, FR; IE, IT, LU, the NL, NO, PL, SE, SI and the UK. The table reports two-step GMM results with the Windmeijer correction for small samples. The e-sales variable is treated as predetermined (endogenous). The Hansen J test checks for the validity of instrumental variables .a reports differenceinHansen tests of exogeneity of GMM instruments for levels (p-value). The short run impact of e-sales on labour productivity is equal to the short-run coefficient (ranging from 0.35 to 0.40). This coefficient refers to the impact that occurs in year (t). The long-run impact is calculated as the short-run coefficient divided by the adjustment parameter.

14
exhibit higher labour productivity growth. These results hold true for both the total sample and for the manufacturing and service industries, unconnectedly.
The short-run coefficients indicate that an increase in the percentage of firms with e-sales activities by one percentage point will raise labour productivity by between 0.35 and 0.40 per cent.11 The adjustment parameters for services and manufacturing are 0.16 and 0.27, respectively. Corresponding average time lags are 5.3 and 2.7 years (calculated as (1 – ω) / ω). This implies that it takes between three and five years for half of the change in e-sales to be visible in labour productivity. The long-run impact of e-sales exceeds one and occurs by the earliest after six years. Given that the adjustment speed is rather low, the interpretation here focuses on the short-run coefficients. When estimated separately for different firm size classes we again find a significant impact of e-sales activities, except in the large firms (table 3). This insignificance might be partly explained by small sample size. The impact is more substantial for small firms with a coefficient of 0.36 than for medium-sized firms with a coefficient of 0.29. Interestingly though, the capital stock is not significant. However, this could be due to the fact that the structure of capital rather than its growth drives labour productivity.
11 Carefully note that the interpretation of regression estimates differs between OLS and GMM. While a one percentage point change in an independent OLS variable affects the dependent variable with equal units, the GMM estimates renders a change in per cent.
Table 3Impact of change in e-sales activities on labour productivity by size class
(System GMM estimates)
10–49 employees 50–249 employees >250 employees
Size class coef. t coef. t coef. t
log labour productivity t-1 0.81*** 6.91 0.84*** 14.42 0.77*** 10.43% firms with e-sales t 0.36*** 2.78 0.29*** 2.75 0.09 0.79log real capital stock 0.00 -0.17 0.02 1.44 0.00 0.33Year 2004 (ref category year 2003) 0.02 0.90 0.04* 1.76 0.04 1.25Year 2005 0.04** 2.20 0.01 0.45 0.01 0.21Year 2006 0.03 1.35 0.03 1.36 0.04 1.07Year 2007 0.03 1.25 0.02 0.99 0.03 1.04Year 2008 0.02 0.73 0.02 1.14 0.05* 1.69Year 2009 -0.07*** -2.71 -0.07** -2.46 -0.06* -1.69Year 2010 -0.04 -0.97 -0.03 0.00 -0.06Constant 0.70 1.11 0.36 1.63 0.88*** 2.61Long-run coefficient e-sales 1.91** 1.79** 0.40# of observations 931 960 480# of groups 124 128 64# of instruments 103 103 80AR (1) test (p-value) 0.00 0.00 0.01AR (2) test (p-value) 0.89 0.41 0.06Hansen test of overid. restr. (p) 0.359 0.276 0.948
Source: ESSLait Micro Moments Database and own calculations.Note: ***, ** and * denote significance at the 1, 5 and 10 per cent levels. The groups of industries include the (i) ICT producers,
(ii) consumer manufacturing, (iii) intermediate manufacturing, (iv) investment goods, (v) distribution and (vi) finance and business except real estate. The country group includes: AT, DE, DK, FI, IT, the NL, NO, PL, SE and the UK. The table reports two-step GMM results with the Windmeijer correction for small samples. The e-sales variable is treated as predetermined (endogenous).

15
In order to provide an indication of the magnitude of the results, it is possible to calculate the contribution of the change in e-sales activities to labour productivity growth. Given the short-run coefficient of 0.35 for the total sample and the increase in the share of firms with e-sales activities of about 6.3 percentage points between 2003–2010 (or 0.9 percentage points per year on average), the total effect on labour productivity growth amounts to 2.1 per cent over the sample period (or 0.3 per cent per year). Expressed in relative terms e-sales activities account for 17 per cent of the total growth of labour productivity for the same period (which in turn was equal to 13 per cent). Overall, this indicates that e-sales activities account for a sizable increase in labour productivity of the business enterprise sector for the sample of EU countries. However, the contribution of e-sales activities is lower than that of ICT capital based on the macro productivity literature (Cardona et al. 2013; Spiezia, 2013).
A number of robustness checks are conducted. First, we re-estimate the labour productivity equation with the percentage of firms with e-sales activities lagged one-year instead of the contemporaneous value. Unreported results show that the impact of e-sales remains significant although the magnitude of the coefficients is lower. Second, we use the alternative measure of e-sales activities: the proportion of sales through websites or EDI. Table A2 in annex A shows the results of the GMM estimator for the labour productivity equation estimated for manufacturing and service industries. Here the share of sales through websites or EDI is lagged one-year since the contemporaneous value is not significant. The results show that the positive estimates of this variable are slightly smaller than for the proportion of firms engaging in e-sales and the significance level is lower (10 per cent). This holds for both manufacturing and service industries. However, the proportion of e-sales in total sales is less significant when compared to the percentage of firms taking part in these activities. This could partly be explained by more volatile and erratic features of the variable itself.
Third, it is possible that the effect of e-sales depends on complementary factors such as skills and organizational change. Combinations of different types of ICT and e-commerce may also render a larger impact on labour productivity growth. However unreported results show that interaction terms between these indicators and the e-sales variable are not significant. Another concern is the omitted variables bias. To account for this we include a number of other variables that may affect labour productivity in addition to the capital stock such as skills and innovation activities. Unreported results show that the effects of e-sales activities remain robust. Fourth, we investigate whether the link between e-sales activities and labour productivity remains stable during and after the economic and financial crisis. To do so the dynamic specification is augmented by an interaction term between the e-sales variable and the period 2009 to 2010. Unreported results show that the interaction is not significant at conventional levels. This holds true for the industry sample as well as for the size class/industry sample.
VI. ConClusIons
This study adds to the literature by presenting patterns of and first insights into the productivity effects of e-commerce activities. To the best of our knowledge this has not earlier been explored in these dimensions for a large group of countries. E-sales is the main variable in focus, either in the shape of the activity or as a proportion of total sales. Engaging in e-sales is still not broadly spread, although more frequently used by large firms, high productivity firms and firms with international experience. The proportion of e-sales is growing over time, but ascending from a low level. Despite variations in the intensity, there is a consistency across countries in how the different phases of ICT appear, including the not yet strongly developed e-sales.
We estimated the relationship between the change in labour productivity and firms engaging in e-sales activities based on a sample of industries in 14 European countries for the period 2002–2010. A key feature of the empirical analysis is the use of micro-aggregated panel data on e-commerce activities. The empirical results controlling for industry, time and country effects show that the change in e-sales activities and labour productivity growth are significantly positively related. All results are robust across

16
different specifications of the model and estimation methods. OLS estimates based on the difference specification show that the increase in e-sales raises the rate of labour productivity by 0.3 percentage points over a two year period, with a larger impact on service industries. Dynamic panel data estimates reveal that the increase in e-sales activities have accounted for 17 per cent of the labour productivity growth during the period 2003–2010.
Interestingly the effects of e-sales are more substantial for small firms than for medium-sized or large firms. Small firms are also the ones least active in e-sales. Further, our analysis indicates that the relationship between e-sales activities and productivity growth might have changed during the economic crisis, since the significant and positive estimates disappear for this period. Whether this is temporary or permanent is too early to conclude. Given the threshold reasoning, that certain ICT tools need to reach a critical level before they transforms into productivity gains, the modest level of e-sales might hold a potential for larger benefits in the future, especially for small firms, given an acceptable level of security and not too high costs. The overall stronger effect on services productivity might relate to the opportunity for some of these firms to deliver online.
One main shortcoming of the analyses is that only the impact of e-sales, not of e-purchases, has been possible to investigate. Although less directly connected to output, an efficient purchase organization may also affect labour productivity. Unfortunately, data limitations prohibit this.
There are several directions for future research in this field. One possible extension is to investigate the employment impacts of e-commerce activities. Positive labour productivity effects of e-commerce activities do not necessarily mean that new jobs are created. Instead the expansion of e-commerce activities could as well destroy jobs. In particular, medium skilled or unskilled workers are likely to be more affected by e-commerce activities than high skilled workers (Michaels et al., 2014).
Another interesting direction of future work would be to investigate whether complementary factors other than skills and organizational change affect the strength of the relationship between e-commerce activities and labour productivity growth. For instance, e-commerce data could be used for marketing purposes and market research (Ramanathan et al., 2012). The impact of e-commerce might be higher when combined with intangible assets (Corrado et al. 2014). A third alternative would be to study e-sales patterns and impacts based on data for countries outside Europe (or developing countries). Hypothetically, there is an opportunity to gain from e-sales even if the different stages of ICT deviate from what has been known for firms and industries in Europe.

17
Annex A
Table A1Average proportion of e-sales in firms
(Per cent)
AT DE DK FI FR IE IT LU NL NO PL SE SI UK
2003 4.2 1.6 2.9 5.2 n.a 2.5 2.1 17.3 2.5 23.2 n.a 19.5 4.8 1.72004 3.8 2.1 3.5 5.9 n.a 2.3 13.4 13.0 2.3 23.1 2.0 22.2 4.7 3.02005 5.0 2.9 3.9 6.6 n.a 4.7 15.6 21.9 3.3 24.0 4.2 23.4 5.1 4.62006 5.7 3.5 9.9 6.8 8.5 5.0 15.7 32.5 5.1 22.5 3.3 25.8 4.2 5.02007 7.0 7.5 7.1 7.5 10.6 6.5 15.8 27.9 6.4 28.8 4.2 28.6 4.2 5.62008 6.3 8.1 7.1 8.2 9.1 4.2 15.1 30.8 4.2 28.1 3.9 29.1 4.8 7.02009 8.2 9.7 6.5 8.9 8.1 7.0 19.0 29.5 12.4 30.3 5.9 30.4 5.3 10.12010 7.7 8.6 3.1 9.4 8.6 7.6 n.a. n.a. 5.7 23.6 5.7 n.a. 6.0 10.5
Source: ESSLait Micro Moments Database.Note: In 2010 the question relating to variable AESVALPCT measuring e-sales as a proportion of total sales became voluntary
to include in the EU-harmonized questionnaire.
Table A2Impact of change in proportion of e-sales activities on labour productivity
(System GMM estimates)
Manufacturing Services
Industry coef. t coef. t
log labour productivity t-1 0.83*** 12.64 0.81*** 7.77Share of e-sales t-1 0.25* 1.97 0.33* 1.66Year dummies yes yesConstant 0.67*** 2.71 0.72* 1.74Long-run coefficient 1.40* 1.92 1.74 1.62# of observations 1497 779# of groups 207 108# of instruments 160 85AR (1) test 0.00 0.00AR (2) test 0.10 0.02Hansen test of overid. restrictions 0.233 0.598Hansen test excluding group a 0.258 0.433Difference (null H = exogenous) a 0.318 0.798
Source: ESSLait Micro Moments Database and own calculations.Note: ***, ** and * denotes significance at the 1, 5 and 10 per cent levels. The group of industries include NACE rev 1.1: 15a6,
17t9, 20, 21, 22, 23a4, 25, 26, 27, 28, 29, 30a3, 31, 32, 34, 35, 36a7, 50, 51, 52, 60t3, 64, 71a4, 72, 73. The country group includes: AT, DE, DK, FI, FR, IE, IT, LU, the NL, NO, PL, SE, SI and the UK. The table reports two-step GMM results with the Windmeijer correction for small samples. The e-sales variable is treated as predetermined (endogenous). The Hansen J test checks for the validity of instrumental variables.
a Reports difference-in-Hansen tests of exogeneity of GMM instruments for levels.

18
Chart A1Correlation between change in e-sales and change in broadband employees
Note: The sample is based on industry level data for 13 EU countries (AT, DE, DK, FI, IE, IT, LU, the NL, NO, PL, SE, SI and the UK). FR is excluded due to break in time series. The following industries are included: NACE rev 1.1 15a6, 17t9, 20, 21, 22, 23a4, 25, 26, 27, 28, 29, 30a3, 31, 32, 34, 35, 36a7, 50, 51, 52, 60t3, 64, 71a4, 72, 73.
Chart A2E-sales by industry in 2010
Source: ESSLait Micro Moments Database.Note: Average for 14 countries: AT, DE, DK, FI, FR, IE, IT, LU, the NL, NO, PL, SE, SI and the UK. Elecom represents ICT
producing industries while ConsG, IntmdG and InvesG are manufacturers producing goods for consumers, intermediate use and for investments, respectively. The services sector includes Distribution, Personal services and Financial business services (Distr, Pers and FinBu).
.-4
.-2
0
.2
.4
Ch.
in p
ropo
rtion
of e
mpl
oyee
bro
ad b
and
inte
rnet
200
3–20
08 in
p. p
oint
s
.-4 .-2 0 .2 .4 .6
Change in % of firms with e-sales 2003–2008
Broadband internet-enabled employees and e-sales, r: 0.18, p: 0.00
0
5
10
15
20
25
30
35
40
ConsG IntmdG InvesG Distr Pers FinBu
Elecom Manufacturing exclusive of ICT Services exclusive of ICT Mean

19
annEx BIndustry classifications
Table A3EUKLEMS industry definitions (NACE 1.1)
TOT Total economy
15t37 Manufacturing15a6 Food, beverages and tobacco17t9 Clothing20 Wood and of wood and cork21a2 Pulp, paper, publishing21 Pulp, paper and paper22 Publishing and printing23t25 Refining, chemicals, and rubber23a4 Refining and chemicals25 Rubber and plastics26 Other nonmetallic mineral27a8 Metals and machinery27 Basic metals28 Fabricated metal29t33 Machinery and equipment29 Machinery, nec30t3 Equipment30a3 Office, accounting and computing machinery; sc. eqpt.31 Electrical equipment32 Electronic equipment34a5 Motor vehicles and transport equipment34 Motor vehicles, trailers and semitrailers35 Transport equipment36a7 Misc manufacturing40a1 Electricity, gas and water supply45 Construction50t74 Market services50t5 Trade, hotels, restaurants50t2 Trade, hotels, restaurants50 Sale, maintenance and repair of motor vehicles and motorcycles; retail sale of fuel51 Wholesale trade and commission trade, except of motor vehicles and motorcycles52 Retail trade, except of motor vehicles and motorcycles; repair of household goods55 Hotels and restaurants60t4 Transport and communications60t3 Transport64 Post and telecommunications65t7 Banking70t4 Real estate and bus services70 Real estate activities71t4 Business services71a4 Renting of machinery and equipment; oth. bus. svc.72 Computer and related activities73 Research and development75t99 Social services75 Public admin and defence; compulsory social security80 Education85 Health and social work90t3 Personal services90t3x Personal services excl. media921t2 Media activities

20
Table A4EUKLEMS ALT industry definitions
ALT Description
Elecom Electrical machinery, post and communication servicesMexElec Total manufacturing, excluding electricalConsG Consumer manufacturingIntmdG Intermediate manufacturingInvesG Investment goods, excluding hightechOtherG Other productionMServ Market services, excluding post and telecommunicationsDistr DistributionFinBu Finance and business, except real estatePers Personal servicesNonMar Non-market services

21
rEfErEnCEs
Bartelsman EJ (2004). The analysis of microdata from an international perspective. STD/CSTAT (2004)12, OECD. Bartelsman EJ (2010). Searching for the sources of productivity from macro to micro and back. Industrial and
Corporate Change, 19(6): 1891–1917.Bartelsman EJ (2013). ICT, reallocation and productivity. European Economy-Economic Papers, No. 486. European
Commission, Brussels.Bharadwaj PN and Soni RG (2007). E-commerce usage and perception of e-commerce issues among smaller firms:
results and implications from an empirical study. Journal of Small Business Management, 45(4): 501–521.Ben Aoun-Peltier L and Vicente Cuervo MR.(2012). E-commerce diffusion: exploring the determinants of the
adoption and the extent of usage at firm-level. Working paper No. 57, STATEC, Luxembourg.Bertschek I, Cerquera D and Klein GJ (2013). More bits - more bucks? Measuring the impact of broadband internet
on firm performance. Information Economics and Policy, 25(3): 190–203. Black SE and Lynch LM (2001). How to compete: The impact of workplace practices and information technology
on productivity. Review of Economics and Statistics, 83(3): 434–445. Blundell R and Bond S (1998). Initial conditions and moment restrictions in dynamic panel data models. Journal
of Econometrics, 87(1): 115–143.Brynjolfsson E and Hitt LM (2003). Computing productivity: Firm-level evidence. Review of Economics and
Statistics, 85(4): 793–808.Cardona M, Kretschmer T and Strobel T (2013). ICT and productivity: Conclusions from the empirical literature.
Information Economics and Policy 25(3): 109–125.Chou YC, Hao-Chun Chuang H and Shao BBM (2014). The Impacts of information technology on total factor
productivity: A look at externalities and innovations. International Journal of Production Economics, 158: 290–299.
Colombo MG, Croce A and Grilli L (2013). ICT services and small businesses’ productivity gains: An analysis of the adoption of broadband Internet technology. Information Economics and Policy, 25(3): 171–189.
Corrado CA, Haskel J and Jona Lasinio C (2014). Knowledge spillovers, ICT and productivity growth. Discussion Paper No. 10057.Centre for Economic Policy Research, London.
Dahl CM, Kongsted HC and Sørensen A (2011). ICT and productivity growth in the 1990s: Panel data evidence on Europe. Empirical Economics, 40(1): 141–164.
Eriksson LT, Hultman J and Naldi L (2008). Small business e-commerce development in Sweden - an empirical study. Journal of Small business and Enterprise Development, 15(3): 555–570.
Eurostat (2008). Information Society: ICT impacts assessment by linking data from different sources. Available at: http://ec.europa.eu/eurostat/documents/341889/725524/2006-2008-ICT-IMPACTS-FINAL-REPORT-V2.pdf/72f0967d-a164-46ad-a6d0-246be5a6d418.
Eurostat (2012). ESSNet on linking of microdata on ICT usage. Available at: http://ec.europa.eu/eurostat/documents/341889/725524/2010-2012-ICT-IMPACT-2012-Final-report.pdf/90cf5094-334a-4ff1-8f60-047c2d650c60.
Eurostat (2013). The multifaceted nature of ICT: Final report of the ESSNet on linking microdata to analyse ICT impact. Available at: http://ec.europa.eu/eurostat/documents/341889/725524/2013-esslait-final-report-final.pdf/37a40b46-a95f-4d4f-b8bc-f5456b81b2e6.
Fraumeni BM (2001). E-commerce: Measurement and measurement issues. American Economic Review, 91(2), 318–322.
Garicano L and Kaplan SN (2001). The effects of business-to-business e-commerce on transaction costs. The Journal of Industrial Economics 49(4), 463–485.
Grandon EE and Pearson JM (2004). Electronic commerce adoption: An empirical study of small and medium US businesses. Information and Management, 42(1): 197–216.
Griliches Z and Hausman JA (1986). Errors in variables in panel data. Journal of Econometrics, 31(1), 93–118.

22
Grimes A, Ren C and Stevens P (2012). The need for speed: Impacts of internet connectivity on firm productivity. Journal of Productivity Analysis, 37(2), 187–201.
Hollenstein H and Woerter M (2008). Inter- and intra-firm diffusion of technology: The example of e-commerce, an analysis based on Swiss firm-level data. Research Policy, 37(3): 545–564.
Jorgenson DW and Stiroh KJ (1999). Information technology and growth. The American Economic Review, 89(2): 109–115.
Konings J and Roodhooft F (2002). The effect of e-business on corporate performance: Firm level evidence for Belgium. De Economist, 150(5): 569–581.
Liu TK, Chen JR, Huang CCJ and Yang CH (2013). E-commerce, R&D and productivity: Firm-level evidence from Taiwan. Information Economics and Policy, 25(4): 272–283.
Lohrke FT, Franklin GM and Frownfelter-Lohrke C (2006). The internet as an information conduit: A transaction cost analysis model of US SME internet use. International Small Business Journal, 24(2):159–178.
Lucking-Reiley D and Spulber DF (2001). Business-to-business electronic commerce. Journal of Economic Perspectives, 15(1): 55–68.
Martens B (2013). What does economic research tell us about cross-border e-commerce in the EU Digital Single Market? A summary of recent research. Digital Economy Working Paper No. 2013-05. Joint Research Centre of the European Commission-Institute for Prospective Technological Studies, Sevilla.
Michaels G, Natraj A and Van Reenen J (2014). Has ICT polarized skill demand? Evidence from eleven countries over twenty-five years. Review of Economics and Statistics, 96(1): 60–77.
Morgan-Thomas A (2009). Online activities and export performance of the smaller firm: A capability perspective. European Journal of International Management, 3(3): 266–285.
Oliveira, T. and Martins, M. F. (2010). Understanding e-business adoption across industries in European countries. Industrial Management & Data Systems, 110(9): 1337–1354.
O’Mahony M and Vecchi M (2005). Quantifying the impact of ICT capital on output growth: A heterogeneous dynamic panel approach. Economica 72(288): 615–633.
Quirós Romero C and Rodríguez Rodríguez D (2010). E-commerce and efficiency at the firm level. International Journal of Production Economics. 126(2), 299–305.
Ramanathan R, Ramanathan U and Hsiao HL (2012). The impact of e-commerce on Taiwanese SMEs: Marketing and operations effects. International Journal of Production Economics, 140(2): 934–943.
Roodman D (2009). How to do xtabond2: An introduction to difference and system GMM in Stata. Stata Journal: 9(1), 86–136.
Spiezia V (2013). ICT investments and productivity: Measuring the contribution of ICTS to growth. OECD Journal: Economic Studies, 2012(1): 199–211.
Subramani M, and Walden E (2001). The impact of e-commerce announcements on the market value of firms. Information Systems Research, 12(2): 135–154.
Terzi N (2011). The impact of e-commerce on international trade and employment. Procedia-Social and Behavioral Sciences, 24: 745–753.
Van Reenen J, Bloom N, Draca M, Kretschmer T and Sadun R (2010). The economic impact of ICT SMART No. 2007/0020. London, London School of Economics, Centre for Economic Performance. Available at: http://ec.europa.eu/digital-agenda/sites/digital-agenda/files/econ_impact_of_ict.pdf.
Venturini F (2009). The long-run impact of ICT. Empirical Economics, 37(3): 497–515.Windmeijer F (2005). A finite sample correction for the variance of linear efficient two-step GMM estimators.
Journal of Econometrics, 126(1): 25–51.Xia Y and Zhang GP (2010). The impact of the online channel on retailer’s performances: An empirical evaluation.
Decision Sciences, 41(3): 517–546.Zhu K and Kraemer KL (2005). Post-adoption variations in usage and value of e-business by organizations: Cross-
country evidence from the retail industry. Information Systems Research, 16(1): 61–84.

23
No. Date Author(s) Title
219 March 2015 Piergiuseppe Fortunato, Carlos Razo and Kasper Vrolijk
Operationalizing the product space: A road map to export diversification
218 December 2014 Daniel Poon China’s development trajectory: A strategic opening for industrial policy in the South
217 November 2014 Yılmaz Akyüz Internationalization of finance and changing vulnerabilities in emerging and developing economies
216 April 2014 Andrew Cornford Macroprudential regulation: Potential implications for rules for cross-border banking
215 March 2014 Stephany Griffith-Jones A BRICS development bank: A dream coming true?214 December 2013 Jörg Mayer Towards more balanced growth strategies in developing
countries: Issues related to market size, trade balances and purchasing power
213 November 2013 Shigehisa Kasahara The Asian developmental State and the Flying Geese paradigm
212 November 2013 Vladimir Filimonov, David Bicchetti, Nicolas Maystre and Didier Sornette
Quantification of the high level of endogeneity and of structural regime shifts in commodity markets
211 October 2013 André Nassif, Carmem Feijó and Eliane Araújo
Structural change and economic development: Is Brazil catching up or falling behind?
210 December 2012 Giovanni Andrea Cornia and Bruno Martorano
Development policies and income inequality in selected developing regions, 1980–2010
209 November 2012 Alessandro Missale and Emanuele Bacchiocchi
Multilateral indexed loans and debt sustainability
208 October 2012 David Bicchetti and Nicolas Maystre
The synchronized and long-lasting structural change on commodity markets: Evidence from high frequency data
207 July 2012 Amelia U. Santos-Paulino
Trade, income distribution and poverty in developing countries: A survey
206 December 2011 André Nassif, Carmem Feijóand Eliane Araújo
The long-term “optimal” real exchange rate and the currency overvaluation trend in open emerging economies: The case of Brazil
205 December 2011 Ulrich Hoffmann Some reflections on climate change, green growth illusions and development space
204 October 2011 Peter Bofinger The scope for foreign exchange market interventions203 September 2011 Javier Lindenboim,
Damián Kennedy and Juan M. Graña
Share of labour compensation and aggregate demand discussions towards a growth strategy
202 June 2011 Pilar Fajarnes An overview of major sources of data and analyses relating to physical fundamentals in international commodity markets
201 February 2011 Ulrich Hoffmann Assuring food security in developing countries under the challenges of climate change: Key trade and development issues of a fundamental transformation of agriculture
200 September 2010 Jörg Mayer Global rebalancing: Effects on trade flows and employment199 June 2010 Ugo Panizza,
Federico Sturzeneggerand Jeromin Zettelmeyer
International government debt
unCTad Discussion PaPers

24
No. Date Author(s) Title
198 April 2010 Lee C. Buchheit andG. Mitu Gulati
Responsible sovereign lending and borrowing
197 March 2010 Christopher L. Gilbert Speculative influences on commodity futures prices 2006–2008
196 November 2009 Michael Herrmann Food security and agricultural development in times of high commodity prices
195 October 2009 Jörg Mayer The growing interdependence between financial and commodity markets
194 June 2009 Andrew Cornford Statistics for international trade in banking services: Requirements, availability and prospects
193 January 2009 Sebastian Dullien Central banking, financial institutions and credit creation in developing countries
192 November 2008 Enrique Cosio-Pascal The emerging of a multilateral forum for debt restructuring: The Paris Club
191 October 2008 Jörg Mayer Policy space: What, for what, and where?190 October 2008 Martin Knoll Budget support: A reformed approach or old wine in new
skins?189 September 2008 Martina Metzger Regional cooperation and integration in sub-Saharan Africa188 March 2008 Ugo Panizza Domestic and external public debt in developing
countries187 February 2008 Michael Geiger Instruments of monetary policy in China and their
effectiveness: 1994–2006186 January 2008 Marwan Elkhoury Credit rating agencies and their potential impact on
developing countries185 July 2007 Robert Howse The concept of odious debt in public international law184 May 2007 André Nassif National innovation system and macroeconomic policies:
Brazil and India in comparative perspective183 April 2007 Irfan ul Haque Rethinking industrial policy182 October 2006 Robert Rowthorn The renaissance of China and India: implications for the
advanced economies181 October 2005 Michael Sakbani A re-examination of the architecture of the international
economic system in a global setting: Issues and proposals180 October 2005 Jörg Mayer and
Pilar FajarnesTripling Africa’s Primary Exports: What? How? Where?
179 April 2005 S.M. Shafaeddin Trade liberalization and economic reform in developing countries: structural change or de-industrialization?
178 April 2005 Andrew Cornford Basel II: The revised framework of June 2004177 April 2005 Benu Schneider Do global standards and codes prevent financial crises?
Some proposals on modifying the standards-based approach 176 December 2004 Jörg Mayer Not totally naked: Textiles and clothing trade in a quota
free environment175 August 2004 S.M. Shafaeddin Who is the master? Who is the servant? Market or
Government?174 August 2004 Jörg Mayer Industrialization in developing countries: Some evidence
from a new economic geography perspective173 June 2004 Irfan ul Haque Globalization, neoliberalism and labour172 June 2004 Andrew J. Cornford The WTO negotiations on financial services: Current
issues and future directions171 May 2004 Andrew J. Cornford Variable geometry for the WTO: Concepts and precedents

25
No. Date Author(s) Title
170 May 2004 Robert Rowthorn and Ken Coutts
De-industrialization and the balance of payments in advanced economies
169 April 2004 Shigehisa Kasahara The flying geese paradigm: A critical study of its application to East Asian regional development
168 February 2004 Alberto Gabriele Policy alternatives in reforming power utilities in developing countries: A critical survey
167 January 2004 Richard Kozul-Wright and Paul Rayment
Globalization reloaded: An UNCTAD Perspective
166 February 2003 Jörg Mayer The fallacy of composition: A review of the literature165 November 2002 Yuefen Li China’s accession to WTO: Exaggerated fears?164 November 2002 Lucas Assuncao and
ZhongXiang Zhang Domestic climate change policies and the WTO
163 November 2002 A.S. Bhalla and S. Qiu China’s WTO accession. Its impact on Chinese employment
162 July 2002 Peter Nolan and Jin Zhang
The challenge of globalization for large Chinese firms
161 June 2002 Zheng Zhihai and Zhao Yumin
China’s terms of trade in manufactures, 1993–2000
160 June 2002 S.M. Shafaeddin The impact of China’s accession to WTO on exports of developing countries
159 May 2002 Jörg Mayer, Arunas Butkevicius and Ali Kadri
Dynamic products in world exports
158 April 2002 Yılmaz Akyüz and Korkut Boratav
The making of the Turkish financial crisis
157 September 2001 Heiner Flassbeck The exchange rate: Economic policy tool or market price?156 August 2001 Andrew J. Cornford The Basel Committee’s proposals for revised capital
standards: Mark 2 and the state of play155 August 2001 Alberto Gabriele Science and technology policies, industrial reform and
technical progress in China: Can socialist property rights be compatible with technological catching up?
154 June 2001 Jörg Mayer Technology diffusion, human capital and economic growth in developing countries
153 December 2000 Mehdi Shafaeddin Free trade or fair trade? Fallacies surrounding the theories of trade liberalization and protection and contradictions in international trade rules
152 December 2000 Dilip K. Das Asian crisis: Distilling critical lessons151 October 2000 Bernard Shull Financial modernization legislation in the United States –
Background and implications150 August 2000 Jörg Mayer Globalization, technology transfer and skill accumulation
in low-income countries149 July 2000 Mehdi Shafaeddin What did Frederick List actually say? Some clarifications
on the infant industry argument148 April 2000 Yılmaz Akyüz The debate on the international financial architecture:
Reforming the reformers147 April 2000 Martin Khor Globalization and the South: Some critical issues
UNCTAD Discussion Papers are available on the UNCTAD website at http://unctad.org.
