e-commerce adoption by smes in developing countries ... · pdf fileoriginal paper e-commerce...
TRANSCRIPT
ORIGINAL PAPER
E-commerce adoption by SMEs in developingcountries: evidence from Indonesia
Rita Rahayu1,2 • John Day1
Received: 31 July 2015 / Revised: 1 December 2015 / Accepted: 17 January 2016 /
Published online: 24 March 2016
� The Author(s) 2016. This article is published with open access at Springerlink.com
Abstract This study aims to provide an overview of e-commerce adoption by
SMEs in developing countries and, in particular, the extent of the adoption of
e-commerce by Indonesian SMEs. It identifies the e-commerce benefits realized by
these SMEs and investigates the relationship between the levels of e-commerce
adoption and the benefits thus realized. The study was motivated by the limited
studies related to e-commerce adoption by SMEs, especially in developing coun-
tries. In addition, it seems that most e-commerce studies are focused more on
upstream issues: to see the factors that facilitate, or barriers faced regarding
e-commerce adoption, rather than downstream issues: to see post-adoption benefits.
This certainly limits our understanding about e-commerce adoption by SMEs in
developing countries, as well as the post-adoption benefits of e-commerce.
Indonesia was chosen as the place in which to conduct the study. A survey of 292
SMEs shows that the majority of them are still at an early stage in their adoption of
e-commerce. Their use of e-commerce is dominated by marketing and purchasing
and procurement activities. ‘‘Extending market reach’’, ‘‘increased sales’’, ‘‘im-
proved external communication’’, ‘‘improved company image’’, ‘‘improved speed of
processing’’, and ‘‘increased employee productivity’’ are reported as the top six
e-commerce benefits perceived by these SMEs. This study also shows that SMEs at
the higher level of e-commerce adoption experience greater e-commerce benefits
than those at other levels of adoption.
Keywords E-commerce � SMEs � Benefits
& Rita Rahayu
[email protected]; [email protected]
1 University of Huddersfield, Queensgate, Huddersfield HD1 3DH, UK
2 Andalas University, Padang, Indonesia
123
Eurasian Bus Rev (2017) 7:25–41
DOI 10.1007/s40821-016-0044-6

1 Introduction
It is widely recognized that e-commerce technology offers many potential
advantages for businesses. The key advantages revealed by the extant e-commerce
literature are reduced cost, increased sales, increased productivity, reduced time
processing, extended market reach and increased customer loyalty (see, Turban
2010). The advantages offered by e-commerce are believed to be one of the factors
that have made e-commerce popular for businesses and this can be seen from the
significant growth of e-commerce users year to year. According to the IDC report
(2011), in 2009, 624 million internet users had made online purchases with revenue
nearly $8 trillion in total; and that number was predicted to have increased by year-
end 2013 to more than $16 trillion of transactions. Such significant growth is also
seen in Asia. Based on data reported by The Internet World Statistics (2015), the
number of internet users increased dramatically from 2000 to 2015. In June 2015,
there were 1.56 billion people in Asia using the internet, whilst in 2000 the number
of internet users was only 114 million.
However, the increase of e-commerce use by businesses is mostly being driven
by large companies. In comparison with larger companies, the adoption of
e-commerce by SMEs relatively lags behind (Govindaraju et al. 2015; Alam et al.
2011; Chiliya et al. 2011).
Researchers have identified many inhibiting factors for the adoption of
e-commerce by SMEs, particularly in developing countries. The lack of human
resources; internal resistance; unready customers; lack of support; security issues;
unready business partners; internal constraints; a lack of IT resources and lack of
support were identified by Dubelaar et al. (2005) as major impediments factors of
B2C e-business adoption by small businesses. Kotelnikov (2007) also revealed that
poor communication infrastructure; lack of ICT knowledge; lack of IT resources;
the lack of financial resources and a poor legal infrastructure are some factors that
lead to the low adoption of ICT by SMEs in developing countries. A recent study by
Jahanshahi and Zhang (2013) also found that security and privacy issues; lack of
knowledge and understanding of e-commerce; and high maintenance cost were the
main barriers faced by SMEs in three developing countries (Iran, Malaysia and
India) in adopting e-commerce. This condition requires attention from many parties,
including researchers, given the important role SMEs play in the economic
development of a country. They contribute not only in terms of their numbers but
also to job creation and poverty reduction (Wit and Kok 2014; Ayyagari et al. 2011;
Neumark et al. 2011; Kotelnikov 2007). Therefore, the development of SMEs in a
country would have a positive impact on the economic growth of the country, and
vice versa.
It is undeniable that there have been many studies conducted regarding
e-commerce adoption. However the majority were conducted in developed countries
(Kurnia et al. 2015; Williams et al. 2009; Parker and Castleman 2007), and only a
few focused on SMEs and in developing countries. This certainly limits the
understanding of e-commerce adoption by SMEs, especially in developing
countries. In addition, the majority of these previous studies focused predominantly
26 Eurasian Bus Rev (2017) 7:25–41
123
on upstream issues where studies tend to report the factors that facilitate (or the
barriers faced in regard to e-commerce adoption), rather than downstream, that is
those studies that focus on post adoption benefits (Molla and Heeks 2007). Knowing
the factors that encourage or inhibit adoption, particularly for SMEs, is important,
but understanding how such adoption is beneficial for business performance is also
equally important. Salwani et al. (2009) offered three main reasons why SMEs were
still reluctant to adopt e-commerce technology, these being the lack of success
stories, not having knowledge in e-commerce and lack of information about the
potential impact of e-commerce implementation on business performance. Simi-
larly, Kartiwi and MacGregor (2008) reported that one of barriers mentioned by
Indonesian SMEs in regard to e-commerce adoption was that ‘‘e-commerce does not
offer any advantages to our organization’’. These reasons make many SMEs,
especially in developing countries, fearful to invest their resources in this
technology.
Therefore, in order to fill this gap, this study aims to provide a better
understanding about the adoption of e-commerce by SMEs in developing countries,
identifies the e-commerce benefits realized by these SMEs and investigates the
relationship between the levels of e-commerce adoption and the benefits realized.
Indonesia was chosen as the country in which to conduct the study. There are four
reasons for this choice. Firstly, Indonesia is one of the developing countries in Asia
and has a large population being the fourth largest population in the world and the
largest in Southeast Asia, so therefore, Indonesia might reflect other developing
countries in Asia, particularly in Southeast Asia. Secondly, Indonesia is also
recognized as the biggest archipelago country in the world, consisting of more than
13 million islands. The huge population and the vast and fragmented geography
offer a good reason for businesses in Indonesia, especially SMEs, to adopt
e-commerce. Yet, and as commonly found in most developing countries, the
adoption of e-commerce by Indonesian SMEs is still lagging behind counterparts in
developed countries (Kartiwi and MacGregor 2008). Thirdly, Indonesia is at the
heart of Southeast Asia, neighbouring alongside Malaysia, Singapore, China, Japan,
and Australia. Finally, Indonesia has recently been identified as one of countries that
will become one of the economic powers in this century, together with Mexico,
Nigeria and Turkey, popularly known as ‘‘MINT’’ countries (Mexico, Indonesia,
Nigeria, and Turkey). MINT was initially popularized by Jim O’Neil in 2013 as a
companion to his BRIC countries (Brazil, Russia, India and China). As a country
that has been recognized as an important player in the economic world, it is
particularly interesting to study e-commerce adoption in this country.
2 Literature review
There is no single definition of e-commerce with various definitions being offered
by several authors. Turban (2010) defined e-commerce as ‘‘the process of buying,
selling, transferring, or exchanging products, services, and/or information via
computer networks, mostly Internet and intranets’’. While, Tagliavini et al. (2001)
argued that any economic activity conducted via the internet can be called
Eurasian Bus Rev (2017) 7:25–41 27
123
e-commerce. In more detail, Clarke (2005) elaborated the detailed elements of
e-commerce as: ‘‘support services for trading… encompass(ing) inter-organizational
email, directories, trading support systems for commodities, products, customized
goods and services, management information, and statistical reporting systems’’.
Even though the definitions vary in exact detail, it can be seen from the definitions
above that the use of ICT, particularly internet technology, is a main component of
e-commerce. Hence in this study the definition of e-commerce refers to the use of
networked information and communication technologies (ICT), especially Internet
technology, in any business activities.
According to Turban (2010), the transition of traditional commerce to electronic
commerce depends on the level of digitisation of the products/services sold, the
process, and the delivery methods. If the digital element is found in any one of those
then it can be said that the e-commerce exists, but only partial e-commerce. Whilst
if all of these elements are digital, then it is considered as pure e-commerce. Buying
a mobile phone from http://www.apple.com is one example of partial e-commerce,
because there are physical dimensions to this transaction which are product and the
delivery method. However, buying software from http://www.amazon.com is the
example of pure e-commerce, because all of dimensions are digital (product, pro-
cess and delivery method).
It cannot be denied that the e-commerce technology was originally developed to
meet the needs of large enterprises in developed countries. However, the application
of e-commerce is still suitable for SMEs in developing countries. E-mail, websites,
internet, intranet, extranet, Electronic Data Interchange (EDI), Electronic Fund
Transfer (EFT) and barcode are some of basic e-commerce technologies that are
most likely relevant for the SME (Kurnia et al. 2015; Morteza et al. 2011; Mustaffa
and Beaumont 2004; Abell and Lim 1996).
The use of these technologies by SMEs is variable. Abell and Lim (1996) found
that SMEs in New Zealand used the internet in order to communicate with internal
and external parties, get information from suppliers, provide information, conduct
R&D activities, to be seen at the forefront of technology, to do market and product
research, place orders to suppliers, and take orders from customers. Drew (2003)
found also that e-mail and intranet applications were used by SMEs for internal
communication; whilst web sites were used to advertise, promote, recruit, and for
procurement. In addition, Daniel and Wilson (2002) mentioned that e-commerce
technologies assist SMEs in a wide range of activities, which are: providing
information about the company, providing information about goods and services
offered, taking and placing orders, receiving payment, delivering goods and
services, after sales service or contact, identifying suppliers, purchasing inventory
and non-inventory, communicating with internal and external parties, exchanging
document and design with customers or suppliers, searching the information,
advertising and recruitment activities. The breadth of e-commerce use in business
activities reflects the level of e-commerce adoption where the wider the use of
e-commerce the higher level of e-commerce adoption. The wider the scope of
e-commerce use in businesses, the more likely the realization of even greater
commerce benefits (Zhu and Kraemer 2005).
28 Eurasian Bus Rev (2017) 7:25–41
123

In order to explain the level of e-commerce adoption, the concept of ‘‘stage of
growth’’ or growth models are often used in previous studies. This concept
recognized that information system(s), including e-commerce, in an organization
are not fixed but experience several levels of development. Information System
literature recorded several growth models developed by previous researchers. The
first growth model was developed by Richard L. Nolan during the 1970s, which is
well known as ‘‘Nolan’s stages of growth model’’. In this model, there are six stages
faced by the firm in respect of information system usage, namely: initiation,
contagion, control, integration, data administration and maturity. Each stage has
different features, and all of them will exist together.
Then, Rao et al. (2003) proposed four stages—presence, portal, transaction
integration, and enterprises integration, to illustrate the evolution of e-commerce in
an organization. Each stage has different characteristics and different problems, and
Fig. 1 shows the detail of this model.
In this model, the subsequent stage is better than previous stage. Even though the
evolution is described sequentially, there is no necessity for a business to start from
the beginning stage (presence stage). Business can start from any stage.
In line with this, Prananto et al. (2003) also proposed six stages of e-commerce
development (see Fig. 2), which are no presence, static online, interactive online,
e-commerce, internal integration, and external integration. This model links the
level of e-commerce adoption with the investment required and its potential
benefit.
Consistent with Rao et al. (2003) and Prananto et al. (2003) also mentioned
that the characteristics of each stage are different and business can start the
adoption in any level of the stages. Figure 2 above shows that a higher level of
e-commerce adoption will require greater investment and that more benefits will
be gathered.
Fig. 1 Stages model. Source Rao et al. (2003)
Eurasian Bus Rev (2017) 7:25–41 29
123

As mentioned previously, there are many potential benefits offered by
e-commerce. Based on a review of previous studies, fifteen benefits of e-commerce
are identified in this study. They are presented in Table 1.
3 Methodology
In this study, an online questionnaire survey method was applied. The online
questionnaire was chosen because this method is considered to have several
advantages, which are that it is cheaper, better (in term of response rate), faster and
easier than conventional methods (Fricker and Schonlau 2002). The questionnaire
for this study consisted of three main parts. The first part relates to the current
Investment requirement
Low High
No Presence
Static website presence
Interactive online
Electronic commerce
Internal integration
External integration
Fig. 2 E-business stages of growth model. Source Prananto et al. (2003: 11)
Table 1 E-commerce benefitsNo. E-commerce benefits
1 Increased revenue
2 Reduced operation cost
3 Reduced cost of purchasing and procurement
4 Reduced marketing costs
5 Increased customer loyalty and retention
6 Reduced complain from client
7 Improved supplier relationship
8 Improved competitive position
9 Extending market reach
10 Improved speed of processing
11 Improved external communication
12 Improved company image
13 Improved internal communication
14 Increased employee’s satisfaction
15 Increased employee’s productivity
30 Eurasian Bus Rev (2017) 7:25–41
123

condition of e-commerce adoption by the SMEs: their level of adoption, length of
adoption, number of IT staff and scope of e-commerce use. Regarding the level of
e-commerce adoption, in this study six levels of e-commerce adoption were
proposed, which are: no internet/no email (stage zero), e-mail but no websites (stage
1), static website (stage 2), interactive websites but no transaction (stage 3),
websites which allow business transaction (stage 4), and integrated websites (stage
5). The second part is about the benefits of e-commerce adoption realized by the
SMEs following adoption. In this part, the respondents were asked about their
perception of the fifteen e-commerce benefits (shown in Table 1) by responding to a
five-point Likert-scale, ranging from 1 (strongly agree) to 5 (strongly disagree).
However, for consistency of measurement, in the further analysis, the score of
respondents’ perceptions was re-coded, in with a score of 1 for strongly disagree to
5 for strongly agree. Then, the last part of questionnaire is about demographic
factors, such as age, education, type of industry and firm size.
3.1 Sampling method
In this study, SMEs are defined as businesses which have less than 100 employees,
assets less than IDR 10 billion, and total sales per year below IDR 50 billion. There
is no centralized SME database available in Indonesia. Most of the data related to
SMEs is collected and stored by parties who are interested in the SME. For example,
the Indonesian government via the Indonesian Ministry of Cooperative and
Empowerment of Small Medium Enterprises (Kementrian Koperasi dan Usaha
Kecil Menengah Republik Indonesia) provides some SME data in specific areas. The
data provided by this ministry can be accessed through several websites: http://
www.depkop.go.id, http://www.jakarta.go.id, and http://promoukm.com. Besides
government, other parties such as research institutes and private organization also
provide SME data, such as http://www.smartbisnis.co.id, http://bisnisukm.com,
http://www.indotrading.com, http://www.indonetwork.co.id. In this study, a com-
bination of government sources and the private organization sources was used to
determine the sample frame. In order to ensure there were no overlapping SMEs on
the sample frame, the list of SMEs was sorted alphabetically by company name.
Only the firms which had complete information were considered as part of the
sample. By complete information, we mean that the information about the company
name, company address, e-mail address and contact number, type of industry,
owners, and number of employees were available. After identifying and cleaning the
database, 3267 SMEs were chosen as the sampling frame. All SMEs on the database
were at least 5 years old.
The respondents in this study are the SME owner or manager. There were
3267 questionnaires sent to respondents through e-mail. Two hundred and
ninety-two fully completed, and hence, usable questionnaires were analysed. The
profiles of the SMEs and respondents who participated in this study are
presented in Table 2.
Eurasian Bus Rev (2017) 7:25–41 31
123

4 Results
4.1 The adoption of e-commerce by SMEs in Indonesia
The questionnaire results show that among the 292 SMEs who participated in this
study, 21 of them (7.2 %) have not connected to the internet and they do not have an
e-mail; while the others (271 SMEs or 92.8 %) have. The former, in this study, are
Table 2 Profile of the SMEs
and respondentsFrequency %
Industry type
Agriculture 6 2.1
Manufacture 71 24.3
Electronic, gas and water supply 1 0.3
Construction 5 1.7
Trade, hotel and restaurant 152 52.1
Transport and communication 2 0.7
Finance, rent and service 53 18.2
Others 2 0.7
Total 292 100.0
Firm size
Micro 100 34.2
Small 144 49.3
Medium 48 16.4
Total 292 100.0
Respondent’s gender
Male 211 72.3
Female 81 27.7
Total 292 100.0
Respondent’s age
Under 25 years old 32 11.0
25–34 years old 115 39.4
35–44 years old 111 38.0
45–55 years old 31 10.6
Above 55 years old 3 1.0
Total 292 100.0
Respondent’s education
Junior high school 6 2.1
Senior high school 52 17.8
Diploma 52 17.8
Undergraduate 162 55.5
Master 18 6.2
Doctoral 2 0.7
Total 292 100.0
32 Eurasian Bus Rev (2017) 7:25–41
123

classified as non e-commerce adopters, whilst the latter are classified as e-commerce
adopters. For the e-commerce adopters, 64 of them (21.9 %) are in stage 1; 95
SMEs (32.5 %) are in stage 2; 73 SMEs (25 %) are in stage 3; 38 SMEs (13 %) are
in stage 4 and only 1 SME is in stage 5. For more details, Table 3 presents the
current stage of e-commerce adoption by these SMEs in more detail.
The length of e-commerce adoption by Indonesian SMEs varies. Table 4 presents
the length of e-commerce adoption by these Indonesian SMEs.
It can be seen that the adoption of e-commerce by Indonesian SMEs is relatively
new. Most of them have adopted this technology for less than 3 years, and only a
few of them have adopted e-commerce for more than 5 years.
Table 3 The level of
e-commerce adoption:
Indonesian SMEs
Frequency %
Non adopters 21 7.2
E-mail 64 21.9
Static website 95 32.5
Interactive website 73 25.0
E-commerce 38 13.0
Internal integration 1 0.3
Total 292 100.0
Table 4 The length of e-commerce adoption by SMEs in Indonesia
Time Total
Less than 1 year 2 or 3 years 4 or 5 years More than 5
E-mail 13 27 11 13 64
Static website 12 54 18 11 95
Interactive website 25 35 9 4 73
E-commerce 9 20 6 3 38
Internal integration 1 0 0 0 1
Total 60 136 44 31 271
Table 5 Number of IT staff
IT staff Total
None 1–2 people 3–5 people More than 5 people
E-mail 23 29 10 2 64
Static website 31 49 10 5 95
Interactive website 17 43 10 3 73
E-commerce 4 26 7 1 38
Internal integration 0 1 0 0 1
Total 75 148 37 11 271
Eurasian Bus Rev (2017) 7:25–41 33
123
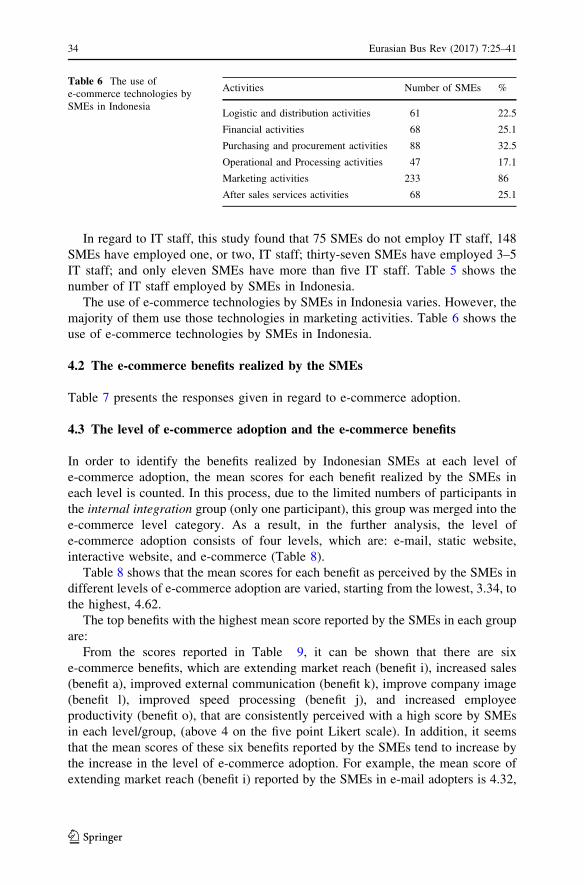
In regard to IT staff, this study found that 75 SMEs do not employ IT staff, 148
SMEs have employed one, or two, IT staff; thirty-seven SMEs have employed 3–5
IT staff; and only eleven SMEs have more than five IT staff. Table 5 shows the
number of IT staff employed by SMEs in Indonesia.
The use of e-commerce technologies by SMEs in Indonesia varies. However, the
majority of them use those technologies in marketing activities. Table 6 shows the
use of e-commerce technologies by SMEs in Indonesia.
4.2 The e-commerce benefits realized by the SMEs
Table 7 presents the responses given in regard to e-commerce adoption.
4.3 The level of e-commerce adoption and the e-commerce benefits
In order to identify the benefits realized by Indonesian SMEs at each level of
e-commerce adoption, the mean scores for each benefit realized by the SMEs in
each level is counted. In this process, due to the limited numbers of participants in
the internal integration group (only one participant), this group was merged into the
e-commerce level category. As a result, in the further analysis, the level of
e-commerce adoption consists of four levels, which are: e-mail, static website,
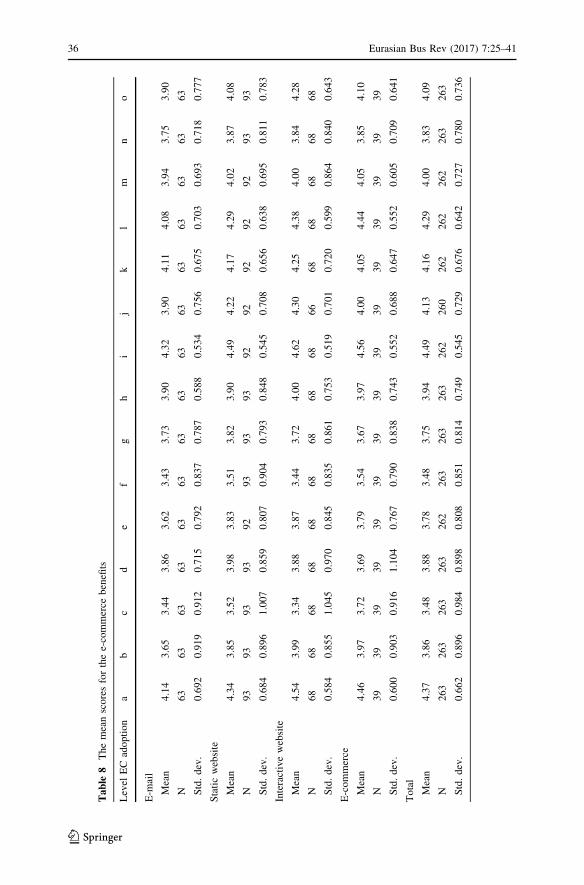
interactive website, and e-commerce (Table 8).
Table 8 shows that the mean scores for each benefit as perceived by the SMEs in
different levels of e-commerce adoption are varied, starting from the lowest, 3.34, to
the highest, 4.62.
The top benefits with the highest mean score reported by the SMEs in each group
are:
From the scores reported in Table 9, it can be shown that there are six
e-commerce benefits, which are extending market reach (benefit i), increased sales
(benefit a), improved external communication (benefit k), improve company image
(benefit l), improved speed processing (benefit j), and increased employee
productivity (benefit o), that are consistently perceived with a high score by SMEs
in each level/group, (above 4 on the five point Likert scale). In addition, it seems
that the mean scores of these six benefits reported by the SMEs tend to increase by
the increase in the level of e-commerce adoption. For example, the mean score of
extending market reach (benefit i) reported by the SMEs in e-mail adopters is 4.32,
Table 6 The use of
e-commerce technologies by
SMEs in Indonesia
Activities Number of SMEs %
Logistic and distribution activities 61 22.5
Financial activities 68 25.1
Purchasing and procurement activities 88 32.5
Operational and Processing activities 47 17.1
Marketing activities 233 86
After sales services activities 68 25.1
34 Eurasian Bus Rev (2017) 7:25–41
123

while the mean scores reported by static adopters and interactive adopters are 4.54
and 4.62. A similar pattern is also found for benefits: a, l, k, j and o.
Even though the mean scores for these benefits tend to increase by the increase in
the level of e-commerce adoption, this does not mean that the increase is
statistically significant. To determine whether these scores are statistically
significant or not, an ANOVA test was conducted.
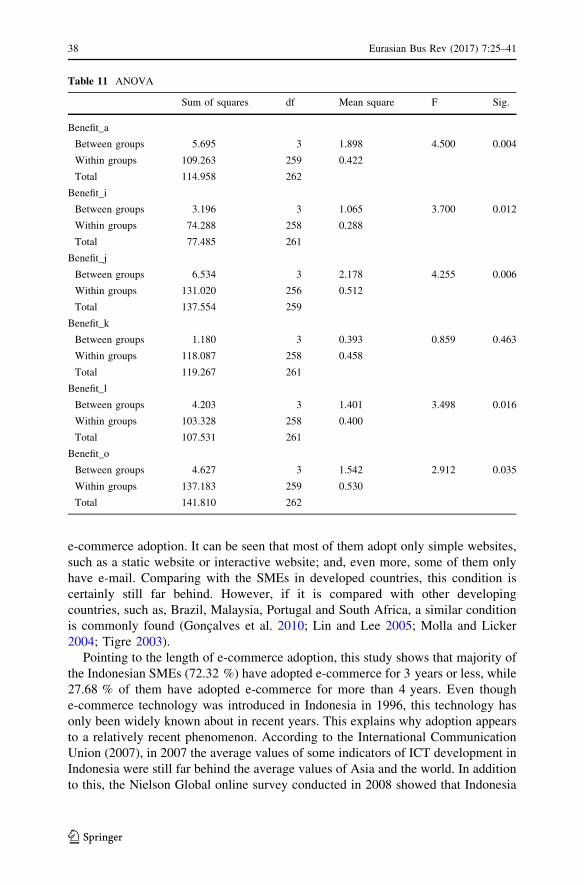
The results of ANOVA test for the six benefits are shown in Tables 10 and 11.
Information provided in Table 10 is used to identify whether a variant on scores
of each of the four groups are equal or not. In this case, it is desired that the variance
of scores are equal because one of basic assumptions to conduct a One Way
ANOVA is homogeneity of variance. According to Pallant (2013), if the
significance value is greater than 0.05, it means there is a homogeneity of variance,
however if the significance value is less than 0.05, it means that there are differences
between variances in population. Based on Table 10, it can be seen that the
significance value of homogeneity test for all benefits are greater than 0.05. These
values show that the assumption of homogeneity of variance is met.
In order to determine whether the mean scores given by each groups are different
statistically and significantly, the significant value provided in Table 11 can be used.
If the significance value is less than 0.05, it means that the differences on mean
scores of dependent variables are statistically significant, however, in contrast if the
significance value is greater than 0.05, it means that the differences on mean scores
are not statistically significant. Table 11 shows that the significance values of all
benefits are less than 0.05, except for benefit k with a significance value of 0.463.
This means that there are significant differences between the mean scores of all
Table 7 Responses on the benefits of e-commerce
Strongly
agree
and agree
Neutral Disagree and
strongly
disagree
Mean Standard
deviation
Increased sales (a) 251 24 2 4.37 0.662
Reduced operation cost (b) 193 59 25 3.86 0.898
Reduced cost of purchasing and
procurement (c)
139 96 42 3.48 0.985
Reduced marketing costs (d) 206 48 23 3.88 0.898
Increased customer loyalty and retention (e) 178 83 15 3.78 0.810
Reduced complain from client (f) 136 109 32 3.48 0.852
Improved supplier relationship (g) 176 83 18 3.75 0.815
Improved competitive position (h) 211 54 12 3.94 0.751
Extending market reach (i) 264 11 1 4.49 0.545
Improved speed of processing (j) 221 46 7 4.13 0.730
Improved external communication (k) 238 32 6 4.16 0.677
Improved company image (l) 245 29 2 4.29 0.643
Improved internal communication (m) 208 62 6 4 0.729
Increased employee’s satisfaction (n) 175 95 7 3.83 0.780
Increased employee’s productivity (o) 228 42 7 4.09 0.734
Eurasian Bus Rev (2017) 7:25–41 35
123
Table
8Themeanscoresforthee-commerce
benefits
Level
EC
adoption
ab
cd
ef
gh
ij
kl
mn
o
E-m
ail
Mean
4.14
3.65
3.44
3.86
3.62
3.43
3.73
3.90
4.32
3.90
4.11
4.08
3.94
3.75
3.90
N63
63
63
63
63
63
63
63
63
63
63
63
63
63
63
Std.dev.
0.692
0.919
0.912
0.715
0.792
0.837
0.787
0.588
0.534
0.756
0.675
0.703
0.693
0.718
0.777
Staticwebsite
Mean
4.34
3.85
3.52
3.98
3.83
3.51
3.82
3.90
4.49
4.22
4.17
4.29
4.02
3.87
4.08
N93
93
93
93
92
93
93
93
92
92
92
92
92
93
93
Std.dev.
0.684
0.896
1.007
0.859
0.807
0.904
0.793
0.848
0.545
0.708
0.656
0.638
0.695
0.811
0.783
Interactivewebsite
Mean
4.54
3.99
3.34
3.88
3.87
3.44
3.72
4.00
4.62
4.30
4.25
4.38
4.00
3.84
4.28
N68
68
68
68
68
68
68
68
68
66
68
68
68
68
68
Std.dev.
0.584
0.855
1.045
0.970
0.845
0.835
0.861
0.753
0.519
0.701
0.720
0.599
0.864
0.840
0.643
E-commerce
Mean
4.46
3.97
3.72
3.69
3.79
3.54
3.67
3.97
4.56
4.00
4.05
4.44
4.05
3.85
4.10
N39
39
39
39
39
39
39
39
39
39
39
39
39
39
39
Std.dev.
0.600
0.903
0.916
1.104
0.767
0.790
0.838
0.743
0.552
0.688
0.647
0.552
0.605
0.709
0.641
Total
Mean
4.37
3.86
3.48
3.88
3.78
3.48
3.75
3.94
4.49
4.13
4.16
4.29
4.00
3.83
4.09
N263
263
263
263
262
263
263
263
262
260
262
262
262
263
263
Std.dev.
0.662
0.896
0.984
0.898
0.808
0.851
0.814
0.749
0.545
0.729
0.676
0.642
0.727
0.780
0.736
36 Eurasian Bus Rev (2017) 7:25–41
123

benefits except for benefit k. This implies that the benefits perceived by SMEs tend
to increase along with the increasing of the level of e-commerce adoption.
5 Analysis and discussion
This study has provided an overview of the adoption of e-commerce by SMEs in
developing countries. By using Indonesian SMEs as a sample, the results of this
study show that the majority of SMEs in Indonesia are still at the lower level of
Table 9 Top benefits reported
by SMEs in each groupA. E-mail group adopter
Benefit i: extending market reach 4.32
Benefit a: increased sales 4.14
Benefit k: improved external communication 4.11
Benefit l: improve company image 4.08
B. Static website
Benefit i: extending market reach 4.49
Benefit a: increased sales 4.34
Benefit l: improve company image 4.29
Benefit j: Improved speed processing 4.22
Benefit k: improved external communication 4.17
C. Interactive website
Benefit i: extending market reach 4.62
Benefit a: increased sales 4.54
Benefit l: improve company image 4.38
Benefit j: Improved speed processing 4.30
Benefit o: increased employee’s productivity 4.28
D. Transactive/e-commerce group
Benefit i: extending market reach 4.56
Benefit a: increased sales 4.46
Benefit l: improve company image 4.44
Benefit o: increased employee’s productivity 4.10
Benefit k: improved external communication 4.05
Table 10 Test of homogeneity
of variancesLevene statistic df1 df2 Sig.
Benefit_a 0.747 3 259 0.525
Benefit_i 1.036 3 258 0.377
Benefit_j 1.873 3 256 0.135
Benefit_k 1.943 3 258 0.123
Benefit_l 0.400 3 258 0.753
Benefit_o 0.396 3 259 0.756
Eurasian Bus Rev (2017) 7:25–41 37
123
e-commerce adoption. It can be seen that most of them adopt only simple websites,
such as a static website or interactive website; and, even more, some of them only
have e-mail. Comparing with the SMEs in developed countries, this condition is
certainly still far behind. However, if it is compared with other developing
countries, such as, Brazil, Malaysia, Portugal and South Africa, a similar condition
is commonly found (Goncalves et al. 2010; Lin and Lee 2005; Molla and Licker
2004; Tigre 2003).
Pointing to the length of e-commerce adoption, this study shows that majority of
the Indonesian SMEs (72.32 %) have adopted e-commerce for 3 years or less, while
27.68 % of them have adopted e-commerce for more than 4 years. Even though
e-commerce technology was introduced in Indonesia in 1996, this technology has
only been widely known about in recent years. This explains why adoption appears
to a relatively recent phenomenon. According to the International Communication
Union (2007), in 2007 the average values of some indicators of ICT development in
Indonesia were still far behind the average values of Asia and the world. In addition
to this, the Nielson Global online survey conducted in 2008 showed that Indonesia
Table 11 ANOVA
Sum of squares df Mean square F Sig.
Benefit_a
Between groups 5.695 3 1.898 4.500 0.004
Within groups 109.263 259 0.422
Total 114.958 262
Benefit_i
Between groups 3.196 3 1.065 3.700 0.012
Within groups 74.288 258 0.288
Total 77.485 261
Benefit_j
Between groups 6.534 3 2.178 4.255 0.006
Within groups 131.020 256 0.512
Total 137.554 259
Benefit_k
Between groups 1.180 3 0.393 0.859 0.463
Within groups 118.087 258 0.458
Total 119.267 261
Benefit_l
Between groups 4.203 3 1.401 3.498 0.016
Within groups 103.328 258 0.400
Total 107.531 261
Benefit_o
Between groups 4.627 3 1.542 2.912 0.035
Within groups 137.183 259 0.530
Total 141.810 262
38 Eurasian Bus Rev (2017) 7:25–41
123
was on the bottom position in Asia Pacific in terms of on-line transaction 3 (13th
from 14 countries). However, this position has changed significantly since 2010. At
that time, the Indonesian government through the Ministry of Communication and
Information Technology (Kementrian Komunikasi dan Informatika) issued a policy
regarding the provision of affordable internet access for rural communities by
relying on satellite connections (Donny 2014).
Due to the low level of e-commerce adoption by SMEs in Indonesia, it is not
surprising to see that 54.6 % of SMEs just have one or two IT specialists. This
might be for several reasons. Firstly, it because the scope of business of Indonesian
SMEs is not too broad, and the business activities are not too complex, they do not
require a lot of IT specialists. Secondly, it might also be that many SMEs cannot
afford their own IT specialists so they outsource, or hire temporary IT staff, or
purchase IT solutions. Thirdly, it might also be that many IT solutions are relatively
user friendly and intuitive to learn and so that non IT specialists are able to deliver
them. Also 27.6 % of SMEs reported that they do not have an IT employee. A lack
of financial resources is likely to be a reason for this and so those owners who have
enough IT knowledge usually acted as their own IT staff.
In regard to the use of e-commerce technologies by SMEs in Indonesia, the result
of this study shows that majority of SMEs use e-commerce technology for
marketing purposes or in marketing activities. This is reasonable because most of
the SMEs who participated in this study are website adopters (static or interactive).
The top six e-commerce benefits reported by SMEs in Indonesia are: extending
market reach, increased sales, improved external communication, improved
company image, improved speed processing and increased employee’s productivity.
The mean scores of these six benefits reported by the SMEs tend to increase along
with the increase of the level of e-commerce adoption. Based on the ANOVA test, it
was found that the significance value of all of the top six benefits, except improved
external communication, is below 0.05, which means that the SMEs in each level of
e-commerce adoption perceived these benefits differently. In this regard, the higher
the level of e-commerce adoption, the more benefits realized by the SMEs. This
finding is consistent with the stages of growth model proposed by Prananto et al.
(2003). In this model, the benefits of e-commerce gathered by businesses depend on
the level of e-commerce adoption where the higher the level of e-commerce
adoption the more sophisticated the technology infrastructure required, and the
greater the benefits that will be gathered. This finding also supports the [Kraemer
et al. (2002)] study.
6 Conclusion
This study provides an understanding about the adoption of e-commerce by SMEs
in developing countries, especially in Indonesia. This study shows that the adoption
of e-commerce by SMEs in a developing country, especially in Indonesia, is still at
a low level. Most of them are e-mail and website adopters (both static and
interactive website). Comparing to SMEs in developed countries, the level of
e-commerce adoption by the Indonesian SMEs lags far behind. This condition
Eurasian Bus Rev (2017) 7:25–41 39
123
certainly has implications for the government to further increase their efforts
through promoting effective programmes and initiatives to encourage the level of
e-commerce adoption by Indonesian SMEs.
This study also provides empirical support that the e-commerce provides many
benefits for SMEs. The top six benefits reported by Indonesian SMEs are extending
their market reach, increased sales, improvements external communication,
company image, speed of data processing, and employee productivity. This result
could enrich the understanding of SME owners about the potential benefits of
e-commerce. A greater understanding about this will increase their probability to
allocate some resources towards adopting e-commerce.
In addition, this study also shows that the benefits realized by SMEs tend to be
increased by the increase in the level of e-commerce adoption. This condition
certainly can be a consideration for SME owners in adopting e-commerce and this
also will be useful for SME owner in deciding whether to move forward to the next
stage or not.
Open Access This article is distributed under the terms of the Creative Commons Attribution 4.0
International License (http://creativecommons.org/licenses/by/4.0/), which permits unrestricted use, dis-
tribution, and reproduction in any medium, provided you give appropriate credit to the original
author(s) and the source, provide a link to the Creative Commons license, and indicate if changes were
made.
References
Abell, W., & Lim, L. (1996). Business use of the Internet in New Zealand: an exploratory study (Vol.
September 1996). New Zealand: Linconln University.
Alam, S. S., Ali, M. Y., & Jani, M. F. M. (2011). An empirical study of factors affecting electronic
commerce adoption among SMEs in Malaysia. Journal of Business Economics and Management,
12(2), 375–399.
Ayyagari, M., Demirguc-Kunt, A., & Maksimovic, V. (2011). Small vs. Young Firms across the World,
contribution to employment, job creation and growth (F. a. P. S. D. Team, Trans.) (pp. 41): The
World Bank Development Research Group.
Chiliya, N., Chikandiwa, C., Afolabi, B. (2011). Factors Affecting Small Micro Medium Enter-
prises’(SMMEs) Adoption of E-Commerce in the Eastern Cape Province of South Africa.
International Journal of Business and Management, 6(10), 28-36.
Clarke R. (2005). The Past, Present and Future of B2C eCommerce. Statement for a Panel Session,
Sydney. http://www.rogerclarke.com/EC/B2C-0509.html
Daniel, E., & Wilson, H. (2002). Adoption intentions and benefits realised: a study of e-commerce in UK
SME. Journal of Small Business and Enterprise Development, 9(4), 331–348. doi:10.1108/
14626000210450522.
Donny, B.U. (2014). Catatan Ringkas Tata Kelola & Praktik Internet Indonesia. Indonesia: ICT watch
Indonesia.
Drew, S. (2003). Strategic uses of e-commerce by SMEs in the east of England. European Management
Journal, 21(1), 79–88.
Dubelaar, C., Sohal, A., & Savic, V. (2005). Benefits, impediments and critical success factors in B2C
E-business adoption. Technovation, 25(11), 1251–1262.
Fricker, R. D., & Schonlau, M. (2002). Advantages and disadvantages of Internet research surveys:
evidence from the literature. Field Methods, 14(4), 347–367.
Goncalves, R., Santos, S. S., & Morais, E. P. (2010). E-Business maturity and information technology in
Portuguese SMEs. Communications of the IBIMA, 2010, 8.
40 Eurasian Bus Rev (2017) 7:25–41
123

Govindaraju, R., Wiratmadja, I. I., & Rivana, R. (2015). Analysis of drivers for e-commerce adoption by
SMEs in Indonesia. Paper presented at the Interdisciplinary Behavior and Social Sciences:
Proceedings of the International Congress on Interdisciplinary Behaviour and Social Sciences 2014.
Jahanshahi, A. A., & Zhang, S. X. (2013). E-commerce for SMEs: empirical insights from three
countries. Journal of Small Business and Enterprise Development, 20(4), 849–865. doi:10.1108/
JSBED-03-2012-0039.
Kartiwi, M., & MacGregor, R. C. (2008). Electronic Commerce adoption barriers in small to medium-
sized enterprises (SMEs) in developed and developing countries: a cross-Country comparison.
Journal of Electronic Commerce in Organization, 5(3), 35–51.
Kotelnikov, V. (2007). Small and medium Enterprises and ICT: Asia-Pacific Development Information
Programme, e-Primers for the Information Economy, Society and Polity, (APCICT) 2007
Kraemer, K. L., Dedrick, J., Dunkle, D. (2002). E-commerce: a mile wide and an inch deep. Center for
Research on Information Technology and Organizations. Irvine: University of California
Kurnia, S., Choudrie, J., Mahbubur, R. M., Alzougool, B. (2015). E-commerce technology adoption: a
Malaysian grocery SME retail sector study. Journal of Business Research, 68(9), 1906–1918.
Lin, H.-F., & Lee, G.-G. (2005). Impact of organizational learning and knowledge management factors on
e-business adoption. Management Decision, 43(2), 171–188.
Molla, A., & Heeks, R. (2007). Exploring E-Commerce benefits for businesses in a developing Country.
The Information Society, 23(2), 95–108. doi:10.1080/01972240701224028.
Molla, A., & Licker, P. S. (2004). Maturation stage of e-commerce in developing countries: a survey of
South African companies. Information Technologies & International Development, 2(1), 89–98.
Morteza, G., Daniel, A.-A., & Jose, B.-A. (2011). Adoption of e-commerce applications in SMEs.
Industrial Management & Data Systems, 111(8), 1238–1269. doi:10.1108/02635571111170785.
Mustaffa, S., & Beaumont, N. (2004). The effect of electronic commerce on small Australian enterprises.
Technovation, 24(2), 85–95.
Neumark, D., Wall, B., & Zhang, J. (2011). Do small businesses create more jobs?: new evidence for the
United States from the national establishment time series. The Review of Economics and Statistics,
93(1), 16–29. doi:10.1162/REST_a_00060.
Pallant, J. (2013). SPSS survival manual: a step by step guide to data analysis using IBM SPSS.
Maidenhead: McGraw-Hill.
Parker, C., & Castleman, T. (2007). New directions for research on SME-eBusiness: insights from an
analysis of journal articles from 2003–2006. Journal of Information Systems and Small Business,
1(1), 21–40.
Prananto, A., McKay, J., & Marshall, P. (2003). A study of the progression of e-business maturity in
Australian SMEs: Some evidence of the applicability of the stages of growth for e-business model.
Proceedings of the PACIS, Adelaide, pp. 68–80.
Rao, S. S., Metts, G., & Monge, C. A. M. (2003). Electronic commerce development in small and
medium sized enterprises: a stage model and its implications. Business Process Management
Journal, 9(1), 11–32.
Salwani, M. I., Marthandan, G., Norzaidi, M. D., & Chong, S. C. (2009). E-commerce usage and business
performance in the Malaysian tourism sector: empirical analysis. Information Management &
Computer Security, 17(2), 166–185.
Tagliavini, M., Ravarini, A., & Antonelli, A. (2001). An evaluation model for electronic commerce
activities within SMEs. Information Technology and Management, 2(2), 211–230. doi:10.1023/a:
1011417703063.
Tigre, P. B. (2003). Brazil in the age of electronic commerce. The Information Society, 19(1), 33–43.
Turban, E. (2010). Electronic commerce 2010: a managerial perspective. Upper Saddle River: Pearson
Education.
Williams, M. D., Dwivedi, Y. K., Lal, B., & Schwarz, A. (2009). Contemporary trends and issues in IT
adoption and diffusion research. Journal of Information Technology, 24(1), 1–10.
Wit, G., & Kok, J. (2014). Do small businesses create more jobs? New evidence for Europe. Small
Business Economics, 42(2), 283–295. doi:10.1007/s11187-013-9480-1.
Zhu, K., & Kraemer, K. L. (2005). Post-adoption variations in usage and value of e-business by
organizations: cross-country evidence from the retail industry. Information Systems Research, 16(1),
61–84.
Eurasian Bus Rev (2017) 7:25–41 41
123