e-commerce 2016 in belgium
TRANSCRIPT

E-commerceBelgium 201�

Comeos - E-commerce - Belgium 2016 | 3
IntroductionHow to increase the number of e-consumers?Our 6th e-commerce study reveals that customers buy more frequently and spend 30% more online than last year. They started with few and low budget purchases, gained confidence over the years, and now go for bigger and more expensive products.
But there is a big challenge for retailers: the number of e-consumers stabilises at only 64% of the Belgian population. How to increase this number? In addition, only 21% of these online buyers have tried using a mobile device for their purchases, 42% would not do it again.
Clearly, there is room for improvement. We hope to see the results of our efforts in the next e-commerce study.
Dominique Michel,Ceo Comeos
Table of content
Objectives & methodology 4
E-commerce experience 8
Current online shopping behaviour 16
Online purchases 30
Sector focus 48
E-commerce trust & experience 62
Mobile purchases 68
Internet problems 76
E-commerce trends 82
Colophon
Editing: Marieke Huion
Responsible editor: Dominique Michel
Graphic design: skinn branding agency · skinn.be
Comeos vzw · E. Van Nieuwenhuyselaan 8 · 1160 Brussel T 02 788 05 00 · F 02 788 05 01 · www.comeos.be
Prepared by: Pieter De Vuyst, Senior Research Manager, InSites Consulting Jolien Vanbiervliet, Research Consultant, InSites Consulting Lien Van Rampelberg, Research Consultant, InSites Consulting
Download the full survey on www.comeos.be

Comeos - E-commerce - Belgium 2016 | 5
Objectives & methodology
BackgroundComeos represents Belgian commerce & services. Its members are active in 18 sectors and sell to companies or straight to the end-user. Together they represent 11,2% of gdp and employ 400.000 people, which makes them the biggest employer in the private sector. Comeos provides tailor-made services to its members and seeks to serve as a knowledge- and networking-platform to stimulate trade dynamics
Marketing objectivesTo get more insights in Belgium's e-commerce market and to generate PR-input
Research questions• What is the online buyer’s profile?• Which products are bought online?• Which sectors have the highest potential?

Comeos - E-commerce - Belgium 2016 | 7
MethodOnline questionnaire via Talktochange research communityFieldwork: March 20th 2016 - April 6nd 2016Scope: Belgium
Sample
N = 1509
Sample screening
Age: 18-70Online purchases experience in last 12 months
Sample quota
Region: 60% Dutch , 40% FrenchGender: 50% Men, 50% WomenAge: Representative for Belgian population
Used symbols Sig. Higher compared to other group (95%)
Sig. Higher/lower than the average score of all sectors (95%)
Error margins
n=100 10%n=400 5%n=600 4%n=800 3%n=1000 3%n=1500 1%
Comparisons with Comeos ‘E-commerce in Belgium 2011, 2012, 2013, 2014 & 2015’Same period of field (April) and sample composition to optimize comparability.

Comeos - E-commerce - Belgium 2016 | 9
E-commerce experience
76%
of online population makes online purchases
online buying population stabilises

Comeos - E-commerce - Belgium 2016 | 11
E-Commerce Experience E-Commerce Experience
PenetrationQ: Did you buy new products or services via the Internet for personal purposes in the past 12 months? We refer to ordering new
not second-hand products or services via an e-commerce website of a company (not via e-mail)?Q: Did you buy products or services on the Internet on a mobile device (e.g. smartphone or tablet) in the past 12 months?
20152016 2014 2013
… of the Belgian population has made an online purchase in the last year, on the internet or via a mobile device through an app or a website.
2012 2011
64%64%
45%46%
57%60%
PURCHASED ONLINE LAST YEAR VIA A WEBSITE OR A MOBILE DEVICE (THROUGH AN APP OR A WEBSITE)
2016 2015 2014 2013 2012 2011
ONLINE POPULATION 76% 76% 74% 70% 59% 58%
BELGIAN POPULATION* 64% 64% 60% 57% 46% 45%
* Extrapolated to the Belgian population regarding the current internet-population (85% in 2016)
LAST YEAR LAST YEAR
N=2933 / Filter: Bruto fileN=2933 / Filter: Bruto file

Comeos - E-commerce - Belgium 2016 | 13
PenetrationQ: Have you ever bought new products or services via the Internet for personal purposes? We refer to ordering new not second-
hand products or services via an e-commerce website of a company (not via e-mail)?Q: Did you buy new products or services via the Internet for personal purposes in the past 12 months? We refer to ordering new
not second-hand products or services via an e-commerce website of a company (not via e-mail)?Q: Did you buy products or services on the Internet on a mobile device (e.g. smartphone or tablet) in the past 12 months?
... Of the Belgian population has ever made an online purchase, on the internet or via a mobile device through an app or a website. * Extrapolated to the Belgian population regarding the current internet-population (85% in 2016)
EVER PURCHASED ONLINE VIA A WEBSITE OR A MOBILE APPLICATION
PURCHASED ONLINE LAST YEAR VIA A WEBSITE OR A MOBILE DEVICE
2016 2015 2014 2013 2012 2011 2016 2015 2014 2013 2012 2011
ONLINE POPULATION
77% 77% 75% 75% 67% 66% 76% 76% 74% 70% 59% 58%
BELGIAN POPULATION*
65% 65% 61% 59% 52% 52% 64% 64% 60% 57% 46% 45%
E-Commerce Experience E-Commerce ExperienceEVER EVER
20152016 2014 2013 2012 2011
65%65%
52%52%
59%61%
N= 2933 / Filter: Bruto sample

Comeos - E-commerce - Belgium 2016 | 15
Penetration (profile)Q: Have you ever bought new products or services via the Internet for personal purposes?
We refer to ordering new not second-hand products or services via an e-commerce website of a company not via e-mail.)?
BarriersQ: What are the 3 main reasons why you did not purchase products or services online?
Sign. Different from at least one other target group (95% confidence level)
E-Commerce Experience E-Commerce Experience
2016 2015 2014 2013 2012 2011
Gender Male 72% 68% 65% 62% 55% 56%
Female 65% 61% 57% 56% 50% 48%
Language Dutch 72% 68% 64% 61% 56% 53%
French 63% 59% 56% 55% 48% 46%
Age 18-27 77% 70% 67% 60% 57% 59%
28-43 75% 70% 66% 62% 59% 58%
44-59 65% 61% 55% 56% 49% 45%
60+ 54% 55% 53% 55% 42% 43%
Income Less than € 2500 65% 60% 57% 58% 50% 48%
€ 2500 - 3500 73% 72% 67% 66% 57% 57%
More than € 3500 79% 75% 70% 72% 60% 73%
2016 2015 2014 2013 2012 2011
I want to see it/try it before deciding to buy and that is not possible with e-commerce 36% 38% 31% 37% 41% 37%
I have access to all the products/services I need in physical shops 26% 26% 19% 17% 23% 23%
I don't like to give my personal data on the Internet 24% 24% 25% 22% 32% 31%
I have serious doubts concerning the security level of online purchases/orders 22% 24% 25% 31% 30% 36%
I want to talk to a shop assistant/dealer when I want more information on a product or service 22% 25% 19% 20% 23% 22%
I want to see whether items are in stock in a physical shop 21% 22% 17% 19% 15% 15%
I don't have or don't want to use a credit card 18% 20% 24% 24% 29% 27%
I have to be home when the products are delivered 14% 13% 14% 19% 16% 16%
I have a wider selection of products/services in the real world 14% 12% 11% 10% 9% 7%
I don't have sufficient Internet experience yet 8% 10% 11% 11% 11% 8%
there is more product information available in the real world 8% 8% 6% 6% 9% 7%
prices aren't lower on the Internet 7% 6% 10% 8% 7% 7%
I have experienced too many failed attempts to order/purchase something online 3% 3% 5% 5% 3% 5%
purchasing/ordering online is something I prefer to do at home and I don't have a computer at home 1% 1% 2% 2% 0% 2%
Other reason 3% 5% 5% 3% 3% 4%
Profile online buyer: male, young, wealthy
N = 585 / F = Bruto sample; if never purchased online beforeN = 2933 / F = Bruto sample
See/touch product remains decisive factor

Comeos - E-commerce - Belgium 2016 | 17
Current online shopping behaviour
+2%€199
53%
monthly purchases
the average amount we spend online per month. That’s €46
more than last year.
spend more than €100 a month online
More frequent buyers:

Comeos - E-commerce - Belgium 2016 | 19
E-Commerce ExperienceE-Commerce Experience
20152016 2014 2013
... of the Belgian population has made an online purchase in the last year, on the internet or via a mobile device through an app or a website.
2012 2011
17%16%
24%28%
2% more monthly purchases
33%35%
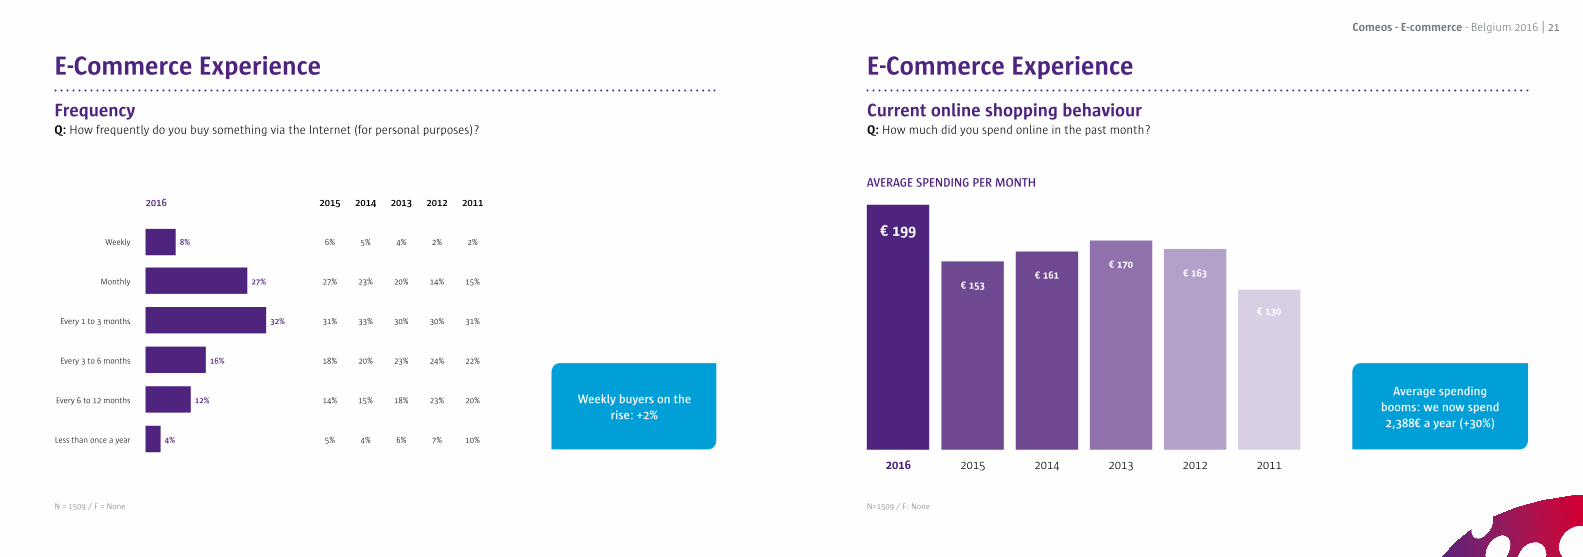
FrequencyQ: How frequently do you buy something via the Internet (for personal purposes)?
ExperienceQ: When did you first buy something via the Internet (for personal purposes)?
N = 1509 / F = None N = 1509 / F = None
2016 2015 2014 2013 2012 2011
In the past 12 months 22% 22% 21% 26% 21% 26%
1 to 2 years ago 12% 11% 11% 13% 13% 14%
3 to 4 years ago 22% 23% 23% 23% 22% 24%
5 to 6 years ago 16% 18% 19% 16% 18% 19%
7 to 10 years ago 11% 12% 13% 10% 11% 8%
More than 10 years ago 9% 8% 7% 5% 6% 4%
I do not remember 8% 7% 6% 7% 9% 6%
AT LEAST MONTHLY PURCHASES
Comeos - E-commerce - Belgium 2016 | 21
E-Commerce Experience
2016 2015 2014 2013 2012 2011
Weekly 8% 6% 5% 4% 2% 2%
Monthly 27% 27% 23% 20% 14% 15%
Every 1 to 3 months 32% 31% 33% 30% 30% 31%
Every 3 to 6 months 16% 18% 20% 23% 24% 22%
Every 6 to 12 months 12% 14% 15% 18% 23% 20%
Less than once a year 4% 5% 4% 6% 7% 10%
FrequencyQ: How frequently do you buy something via the Internet (for personal purposes)?
N = 1509 / F = None
E-Commerce Experience
20152016 2014 2013 2012 2011
€ 130
€ 163€ 170
€ 161
Average spending booms: we now spend 2,388€ a year (+30%)
€ 153
€ 199
Current online shopping behaviourQ: How much did you spend online in the past month?
AVERAGE SPENDING PER MONTH
N=1509 / F: None
Weekly buyers on the rise: +2%

Comeos - E-commerce - Belgium 2016 | 23
E-Commerce Experience
Number of ‘big spenders’
increases
Current online shopping behaviourQ: How much did you spend online in the past month?
20152016 2014 2013 2012 2011
43%45%
47%50%49%
53%
E-Commerce Experience
2016 2015 2014 2013 2012 2011
Less than €20 12% 14% 13% 16% 26% 19%
Between €20 & €49 16% 14% 16% 17% 10% 16%
Between €50 & €99 19% 23% 21% 20% 19% 22%
Between €100 & €149 15% 18% 17% 12% 13% 13%
More than €150 39% 31% 33% 35% 32% 30%
AVERAGE€ 199 / month
€ 2.388 / year
€ 153 / month
€ 1.837 / year
€ 161 / month
€ 1.932 / year
€ 170 / month
€ 2.040 / year
€ 163 / month
€ 1.944 / year
€ 130 / month
€ 1.560 / year
Current online shopping behaviourQ: How much did you spend online in the past month?
N = 1509 / F = None // data cleaning applied by removing extreme outliers N=1509 / F: None
MORE THAN € 100 IN THE PAST MONTH
Online purchases: popular for bigger amounts

Comeos - E-commerce - Belgium 2016 | 25
E-Commerce Experience
A lot more 6%
37%More 31%
Equally much 46%
Less 11%
13%A lot less 2%
No idea 4%
Evolution budgetQ: Do you spend less or more now than you did 1 year ago?
E-Commerce Experience
20152016 2014 2013 2012 2011
29%29%
36%38%39%
37%
Evolution budgetQ: Do you spend less or more now than you did 1 year ago?
37% spent more than last year
SPENDING BEHAVIOUR COMPARED TO LAST YEAR
SPENDING MORE THAN LAST YEAR
Online buyers tend to spend equally or
more than previously
N=1509 / F: NoneN=1509 / F: None

Comeos - E-commerce - Belgium 2016 | 27
E-Commerce Experience
2016 2015 2014 2013 2012 2011
A lot more 6% 5% 5% 4% 2% 3%
More 31% 34% 33% 32% 27% 26%
Equally much 46% 45% 44% 45% 49% 48%
Less 11% 11% 12% 11% 13% 13%
A lot less 2% 2% 2% 3% 3% 2%
No idea 4% 3% 3% 5% 7% 8%
Evolution budgetQ: Do you spend less or more now than you did 1 year ago?
N = 1509 / F = None
E-Commerce Experience
20152016 2014 2013 2012 2011
27%29%
32%33%33%30%
Substitution offline purchasesQ: To what extent do these purchases via the Internet replace offline purchases?
EQUALLY NEW AS REPLACEMENT
Sign. difference (95%)
N = 1509 / F = None
3 out of 10 online purchases are as often
new /extra purchases as replacement of previous
offline purchases

Comeos - E-commerce - Belgium 2016 | 29
E-Commerce Experience
2016 2015 2014 2013 2012 2011
Not at all, these are new / extra purchases 15% 14% 12% 16% 15% 20%
Not really, these are mainly new / extra purchases 22% 23% 23% 21% 21% 22%
These are as often new / extra purchases as replacement of previous offline purchases 30% 33% 33% 32% 29% 27%
Rather, these are mainly replacements of previous offline purchases 25% 24% 25% 25% 26% 23%
Totally, these are replacements of previous offline purchases 8% 7% 7% 6% 9% 8%
Substitution offline purchasesQ: To what extent do these purchases via the Internet replace offline purchases?
37% of purchases are
extra purchases; 33% are
replacements of offline purchases
N = 1509 / F = None

Comeos - E-commerce - Belgium 2016 | 31
Onlinepurchases
85% +5%of customers will buy again
Interior, DIY & Garden on the rise
-1% Fashion in decline

Comeos - E-commerce - Belgium 2016 | 33
Online purchases Online purchases
Current purchase new productsQ: Which new products or services did you buy via the Internet (for personal purposes) in the past 12 months?
Current purchase new products • EvolutionsQ: Which new products or services did you buy via the Internet (for personal purposes) in the past 12 months?
Clothing 48%Hotel / overnight stay 36%
Shoes 33%Books 32%
Event tickets 28%Boat, plane or train tickets 26%
Personal care products 24%Computer, hardware and software 21%
Toys 21%CD / DVD / Blu-ray / Games 20%
Electronic appliances 20%Household appliances 19 %
Pharmaceutical products 15%Bank products 14%Fun fair tickets 13%
Sports products 13%Telecom 13%
Home decoration 12%DIY 10%
Digital music 9%Food 9%
Garden products 8%Travel assistance or cancelling insurance 7%
Films or TV series in digital format 7%Furniture 7%
Prepared food 6%Other insurances 3%
Cars, motorbiks, bicycles, ... 3%Other 10%
2016 Evolution 2016-2015
Evolution 2016-2011
Clothing / shoes 56% -1% +18%
Hotel / overnight stay 36% -3% +1%
Books 32% -1% +2%
Event tickets 28% -3% -6%
Boat, plane or train tickets 26% -6% -5%
Personal care products 24% +2% +8%
Computer, hardware and software 21% -2% -3%
Toys 21% +3% +9%
CD / DVD / Blu-ray / Games 20% -1% -3%
Electronic appliances 20% +1% +2%
Household appliances 19% +1% +7%
Furniture and home decoration 16% +2% +9%
DIY and garden products 15% +3% +9%
Pharmaceutical products 15% +3% +9%
Bank products 14% -4% N/A
Fun fair tickets 13% +2% +3%
Sports products 13% +3% +6%
Telecom 13% -2% -3%
Digital music 9% 0% -4%
Food 9% 0% +2%
Travel assistance or cancellation insurance 7% 0% N/A
Films or TV series in digital format 7% +1% +1%
Prepared food 6% +3% +4%
Other insurances 3% +1% N/A
Cars, motorbikes, bicycles 3% 0% +1%
Other 10% -2% -6%
Fashion
Books
Electronic appliances
Entertainment
Telecom
Health & Beauty
Interior
Food
Prepared food
Sports
DIY
Toys
Other
Fashion = 56%
Interior = 16%
DIY = 15%
Clothing, accommodation and shoes = top 3 volume drivers
Travel tickets (boat, plane,
train) decreasing
N = 1509 / F = NoneN = 1509 / F = None
Comeos - E-commerce - Belgium 2016 | 35
Online purchases
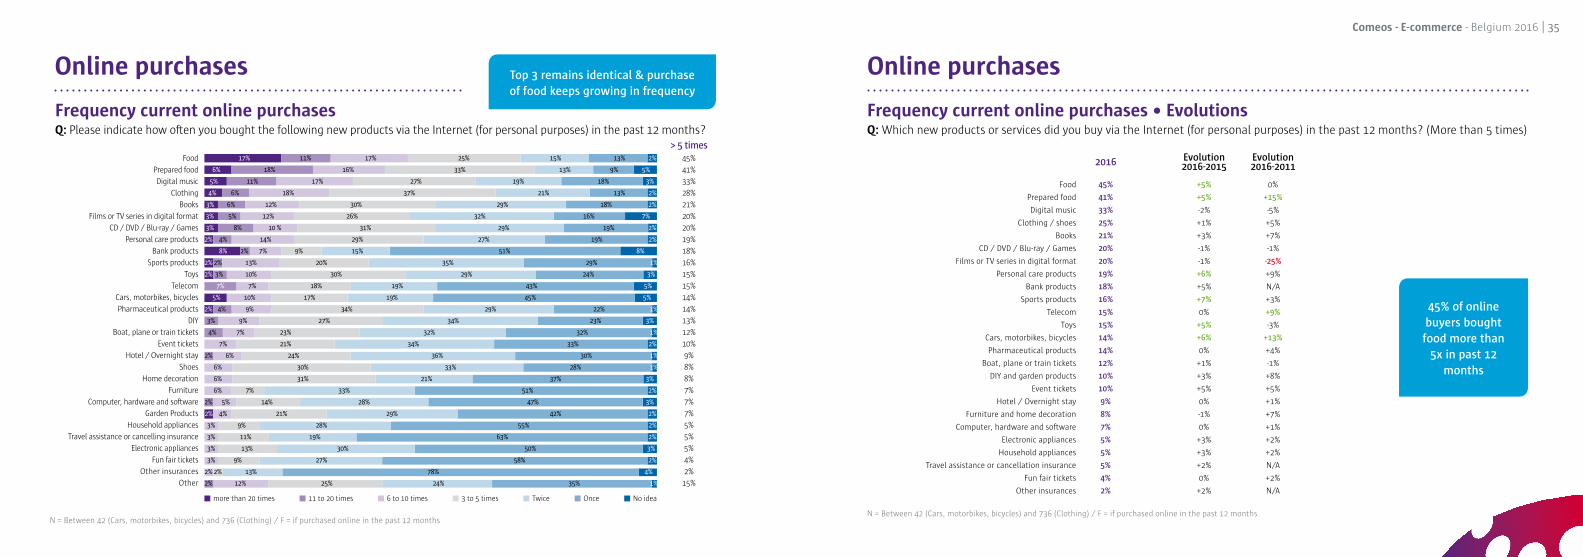
Frequency current online purchasesQ: Please indicate how often you bought the following new products via the Internet (for personal purposes) in the past 12 months?
Top 3 remains identical & purchase of food keeps growing in frequency
Food
Prepared food
Digital music
Clothing
Books
Films or TV series in digital format
CD / DVD / Blu-ray / Games
Personal care products
Bank products
Sports products
Toys
Telecom
Cars, motorbikes, bicycles
Pharmaceutical products
DIY
Boat, plane or train tickets
Event tickets
Hotel / Overnight stay
Shoes
Home decoration
Furniture
Computer, hardware and software
Garden Products
Household appliances
Travel assistance or cancelling insurance
Electronic appliances
Fun fair tickets
Other insurances
Other
45%
41%
33%
28%
21%
20%
20%
19%
18%
16%
15%
15%
14%
14%
13%
12%
10%
9%
8%
8%
7%
7%
7%
5%
5%
5%
4%
2%
15%
> 5 times
more than 20 times 11 to 20 times 6 to 10 times 3 to 5 times Twice Once No idea
17% 11% 17% 25% 15% 13% 2%
6% 18% 16% 33% 13% 9% 5%
5% 11% 17% 27% 19% 18% 3%
4% 6% 18% 37% 21% 13% 2%
3% 6% 12% 30% 29% 18% 2%
3% 5% 12% 26% 32% 16% 7%
3% 8% 10 % 31% 29% 19% 2%
2% 4% 14% 29% 27% 19% 2%
8% 2% 7% 9% 15% 51% 8%
2% 2% 13% 20% 35% 29% 1%
2% 3% 10% 30% 29% 24% 3%
7% 7% 18% 19% 43% 5%
5% 10% 17% 19% 45% 5%
2% 4% 9% 34% 29% 22% 1%
3% 9% 27% 34% 23% 3%
4% 7% 23% 32% 32% 1%
7% 21% 34% 33% 2%
2% 6% 24% 36% 30% 1%
6% 30% 33% 28% 1%
6% 31% 21% 37% 3%
6% 7% 33% 51% 2%
2% 5% 14% 28% 47% 3%
2% 4% 21% 29% 42% 2%
3% 9% 28% 55% 2%
3% 11% 19% 63% 2%
3% 13% 30% 50% 3%
3% 9% 27% 58% 2%
2% 2% 13% 78% 4%
2% 12% 25% 24% 35% 1%
Online purchases
Frequency current online purchases • EvolutionsQ: Which new products or services did you buy via the Internet (for personal purposes) in the past 12 months? (More than 5 times)
2016 Evolution 2016-2015
Evolution 2016-2011
Food 45% +5% 0%
Prepared food 41% +5% +15%
Digital music 33% -2% -5%
Clothing / shoes 25% +1% +5%
Books 21% +3% +7%
CD / DVD / Blu-ray / Games 20% -1% -1%
Films or TV series in digital format 20% -1% -25%
Personal care products 19% +6% +9%
Bank products 18% +5% N/A
Sports products 16% +7% +3%
Telecom 15% 0% +9%
Toys 15% +5% -3%
Cars, motorbikes, bicycles 14% +6% +13%
Pharmaceutical products 14% 0% +4%
Boat, plane or train tickets 12% +1% -1%
DIY and garden products 10% +3% +8%
Event tickets 10% +5% +5%
Hotel / Overnight stay 9% 0% +1%
Furniture and home decoration 8% -1% +7%
Computer, hardware and software 7% 0% +1%
Electronic appliances 5% +3% +2%
Household appliances 5% +3% +2%
Travel assistance or cancellation insurance 5% +2% N/A
Fun fair tickets 4% 0% +2%
Other insurances 2% +2% N/A
N = Between 42 (Cars, motorbikes, bicycles) and 736 (Clothing) / F = if purchased online in the past 12 monthsN = Between 42 (Cars, motorbikes, bicycles) and 736 (Clothing) / F = if purchased online in the past 12 months
45% of online buyers bought food more than
5x in past 12 months

Comeos - E-commerce - Belgium 2016 | 37
Online purchases
Buying frequency
% P
urch
ased
last
12
mon
ths
% bought more than 5 times last year
No volume
Volume generatorSpecials
Bought by many people, on an non-frequent base
Low current volume
Although not many people buy these products, those who do buy
them, do so a lot, this makes these products real niche-products
Bought by many people, on a frequent base. This combination
generates a high volume
Niche
Online purchases
QuadrantQ: Which new products or services did you buy via the Internet (for personal purposes)
in the past 12 months?Q: Please indicate how often you bought the following new products via the Internet
(for personal purposes) in the past 12 months (financial services included)
Buying frequency
% P
urch
ased
last
12
mon
ths
Average frequency
Aver
age
pene
trat
ion
Boat, plane or train tickets
Computer hardware and software
Electronic appliances
Fun fair ticketsFurniture
Sports productsHome decoration
DIY
Garden products
Cars, motorcycles, bicyclesOther insurances
Travel assistance or cancellation insurance
Household appliances
Toys
Books
Digital music
Food
Prepared food
CD / DVD / Blu-ray / Games
Clothing
Bank products
Personal care products
Telecom
Pharmaceutical products
Films or TV series in digital format
Event tickets
Hotel / Overnight stay
Shoes
Specials Volume generator
No volume Niche
N = Between 42 (Cars, motorbikes, bicycles) and 736 (Clothing)F = if purchased online in the past 12 months
Few people buy food online, but they do it
often. Many people buy accomodation services
online, but not on a regular base

Comeos - E-commerce - Belgium 2016 | 39
Online purchases
Quadrant 2016 • evolution since 2011Q: Which new products or services did you buy via the Internet (for personal purposes) in the past 12 months?Q: Please indicate how often you bought the following new products via the Internet (for personal purposes) in the past 12
months (financial services included)
Online purchases
Future intention to buyQ: Do you expect to buy the following products more or less in the future?
Total
Pharmaceutical products
Books
Food (supermarket)
Fun fair tickets
Furniture
Digital music (MP3, albums,..)
Boat, plane or train tickets
Household appliances
Toys
Prepared food (resto / catering)
DIY
Computer, hard- & software
Event tickets (e.g. concerts; no fun fairs)
Clothing
Personal care products
Sports products
Garden products
CD/DVD/Blu-ray/Games
Electronic appliancies (e.g. digital camera, iPod…)
Hotel/Overnight stay
Home decoration
Shoes
Telecom (Internet connection,...)
Travel assistance or cancelling insurance
Bank products (current account,...)
Films of TV series in digital format (no DVD)
Other insurances
Cars, motorbikes, bicycles,..
22%
31%
28%
28%
27%
27%
26%
26%
25%
25%
24%
24%
23%
23%
23%
22%
22%
20%
19%
19%
19%
19%
18%
16%
16%
15%
14%
13%
10%
top 2 score
A lot more More Equally often Less Much Less No idea
4% 18% 58% 9%% 3% 8%
9% 22% 60% 6% 3%
6% 22% 58% 8% 2% 5%
11% 17% 53% 7% 4% 9%
4% 23% 55% 5% 13%
2% 25% 47% 17% 2% 7%
5% 21% 60% 10% 3%
2% 24% 65% 5% 4%
4% 21% 55% 6% 2% 12%
3% 22% 59% 10% 1% 6%
4% 20% 72% 5%
4% 20% 58% 6% 4% 7%
7% 16% 61% 9% 1% 6%
4% 19% 63% 8% 1% 5%
3% 20% 62% 9% 3%
3% 19% 61% 10% 6%
4% 18% 55% 12% 4% 8%
6% 14% 56% 12% 5% 7%
2% 17% 62% 13% 6%
4% 15% 65% 6% 3% 8%
2% 17% 74% 3% 4%
19% 60% 10% 5% 6%
2% 16% 64% 11% 5%
5% 11% 63% 8% 2% 11%
4% 12% 60% 10% 13%
15% 48% 13% 8% 15%
14% 59% 18% 4% 5%
13% 25% 23% 27% 11%
10% 47% 9% 35%
N = Between 42 (Cars, motorbikes, bicycles) and 736 (Clothing) F = if purchased online in the past 12 months
Buying frequency
% P
urch
ased
last
12
mon
ths
Average frequency
Aver
age
pene
trat
ion
Boat, plane or train tickets
Computer hardware and software
Electronic appliances
Fun fair ticketsFurniture
Sports productsHome decoration
DIY
Garden products
Cars, motorcycles, bicycles
Household appliances
Toys
Books
Digital music
Food
Prepared food
CD / DVD / Blu-ray / Games
Clothing
Bank products
Personal care products
Telecom
Pharmaceutical products
Films or TV series in digital format
Event tickets
Hotel / Overnight stay
Shoes
Specials Volume generator
No volume Niche
N = Between 42 (Cars, motorbikes, bicycles) and 736 (Clothing)F = if purchased online in the past 12 months
3 out of 10 online buyers intend to buy more pharmaceutical products, food & books

Comeos - E-commerce - Belgium 2016 | 41
Online purchases
Intention to buy
Top2 (buy more in the future) – Bottom2 scores (buy less in the future)
Intention to buy
% B
ough
t la
st 1
2 m
onth
s
% B
ough
t la
st 1
2 m
onth
s
Top2 – bottom2 scores Top2 – bottom2 scores
Latent
BoomingStabilising
A lot of consumers buy these products, but growth is low
Few consumers buy these products, and plan to do so less often in the future
Few consumers buy these products, but they intend to do so more often in the future
A lot of consumers buy these products already, and plan to do so more often in the future
Potentials
QuadrantQ: Which new products or services did you buy via the Internet (for personal purposes)
in the past 12 months?Q: Do you expect to buy the following products more or less in the future?
(financial services included)
Average frequency
Aver
age
pene
trat
ion
Online purchases
N = Between 42 (Cars, motorbikes, bicycles) and 736 (Clothing)F = if purchased online in the past 12 months
Latent
BoomingStabilising
Potentials
Average frequency
Food
Fun fair tickets
Other insurances
Digital music
Sports productsTravel assistance or cancellation insurance
Event tickets
Toys
Personal care products
Household appliancesElectronic appliances
Books
Films or tv series in digital format
Home decorationDIY
FurnitureGarden products
Pharmaceutical products
Shoes
Boat, plane or train tickets
CD / DVD / Blu-ray / Games Computer, hardware and software
Bank products
Telecom
Prepared food
Cars, motorbikes,bicycles
Clothing
Hotel / Overnight stay
Aver
age
pene
trat
ion
Highest potential for food, pharmaceutical
products, leisure activities
Sign. difference (95%)

Comeos - E-commerce - Belgium 2016 | 43
2016 2015 2014 2013 2012 2011
Certainly 41% 40% 37% 38% 41% 31%
Probably 44% 47% 48% 51% 48% 53%
Neutral 12% 11% 13% 9% 9% 13%
Probably not 2% 2% 1% 2% 2% 2%
Certainly not 1% 0% 1% 0% 0% 0%
Online purchases Online purchases
Future intention to buyQ: How likely are you to purchase other new products or services
on the internet in the future?
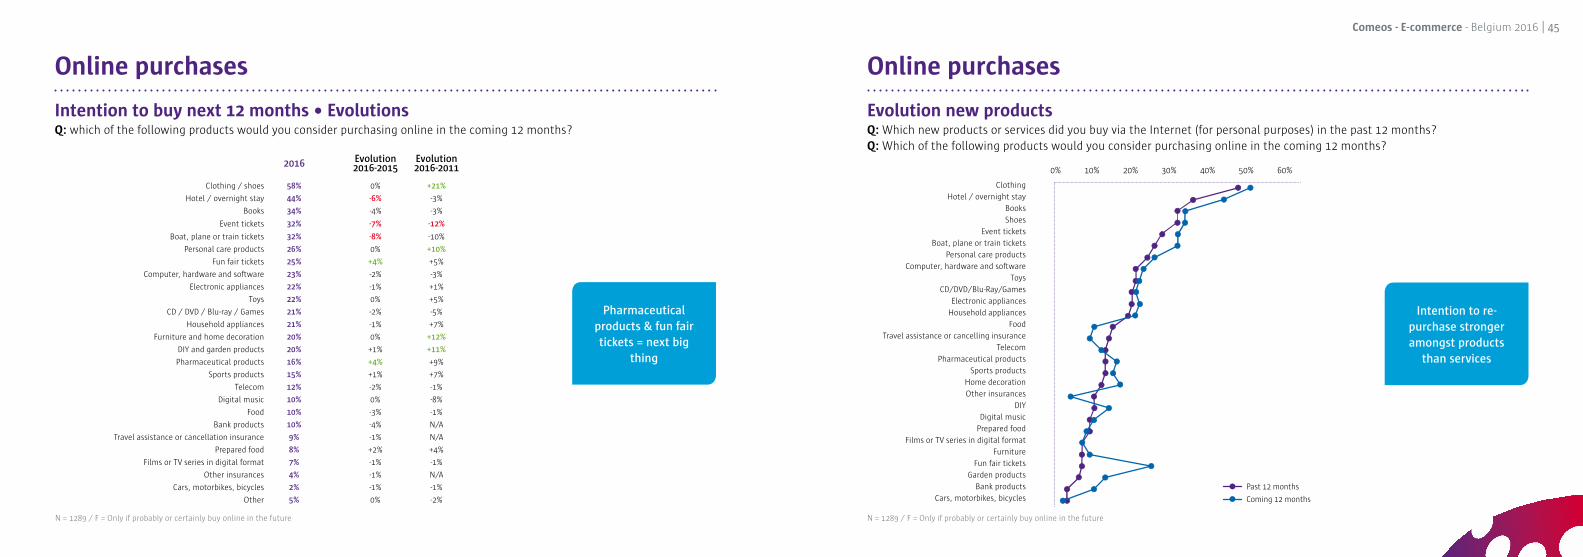
Intention to buy next 12 monthsQ: Which of the following products would you consider purchasing online in the coming 12 months?
85% 85%87% 89% 89% 84%
Clothing 51%Hotel / overnight stay 44%
Books 34%Shoes 34%
Event tickets 32%Boat, plane or train tickets 32%
Personal care products 26%Fun fair tickets 25%
Computer, hardware and software 23%Electronic appliances 22%
Toys 22%CD/DVD/Blu-Ray/Games 21%
Household appliances 21%Home decoration 17%
Pharmaceutical products 16%Sports products 15%
DIY 14%Garden products 13%
Telecom 12%Digital music 10%
Bank products 10%Food 10%
Travel assistance or cancelling insurance 9%Furniture 9%
Prepared food 8%Films or TV series in digital format 7%
Other insurances 4%Cars, motorbikes, bicycles 2%
Other 5%
Fashion
Books
Electronic appliances
Entertainment
Telecom
Health & Beauty
Interior
Food
Prepared food
Sports
DIY
Toys
Other
Fashion = 58%
Interior = 20%
DIY = 20%
N = 1509 / F = None N = 1289 / F = Only if probably or certainly buy online in the future
51% of online buyers intend to purchase
clothing next year
Slightly less satisfied customers
Comeos - E-commerce - Belgium 2016 | 45
Online purchases Online purchases
Intention to buy next 12 months • EvolutionsQ: which of the following products would you consider purchasing online in the coming 12 months?
Evolution new productsQ: Which new products or services did you buy via the Internet (for personal purposes) in the past 12 months?Q: Which of the following products would you consider purchasing online in the coming 12 months?
2016 Evolution 2016-2015
Evolution 2016-2011
Clothing / shoes 58% 0% +21%
Hotel / overnight stay 44% -6% -3%
Books 34% -4% -3%
Event tickets 32% -7% -12%
Boat, plane or train tickets 32% -8% -10%
Personal care products 26% 0% +10%
Fun fair tickets 25% +4% +5%
Computer, hardware and software 23% -2% -3%
Electronic appliances 22% -1% +1%
Toys 22% 0% +5%
CD / DVD / Blu-ray / Games 21% -2% -5%
Household appliances 21% -1% +7%
Furniture and home decoration 20% 0% +12%
DIY and garden products 20% +1% +11%
Pharmaceutical products 16% +4% +9%
Sports products 15% +1% +7%
Telecom 12% -2% -1%
Digital music 10% 0% -8%
Food 10% -3% -1%
Bank products 10% -4% N/A
Travel assistance or cancellation insurance 9% -1% N/A
Prepared food 8% +2% +4%
Films or TV series in digital format 7% -1% -1%
Other insurances 4% -1% N/A
Cars, motorbikes, bicycles 2% -1% -1%
Other 5% 0% -2%
Clothing
Hotel / overnight stay
Books
Shoes
Event tickets
Boat, plane or train tickets
Personal care products
Computer, hardware and software
Toys
CD/DVD/Blu-Ray/Games
Electronic appliances
Household appliances
Food
Travel assistance or cancelling insurance
Telecom
Pharmaceutical products
Sports products
Home decoration
Other insurances
DIY
Digital music
Prepared food
Films or TV series in digital format
Furniture
Fun fair tickets
Garden products
Bank products
Cars, motorbikes, bicycles Past 12 months
Coming 12 months
0% 10% 20% 30% 40% 50% 60%
Pharmaceutical products & fun fair tickets = next big
thing
N = 1289 / F = Only if probably or certainly buy online in the future N = 1289 / F = Only if probably or certainly buy online in the future
Intention to re-purchase stronger amongst products
than services

Comeos - E-commerce - Belgium 2016 | 47
Online purchases
Information searchQ: To what extent have you looked for information before buying the following products online?
Hotel / overnight stay
Electronic appliances
Household appliances
Other insurances (e.g. fire insurance)
Boat, plane or train tickets
Computer, hardware and software
Cars, motorbikes, bicycles
Travel assistance or cancellation insurance
Furniture and home decoration
Telecom
Sports products
DIY and garden products
Pharmaceutical products
Bank products (e.g. current account, savings,...)
Fun fair tickets
Toys
Event tickets
Films or TV series in digital format
CD / DVD / Blu-ay / Games
Clothing / shoes
Books
Digital music
Prepared food
Personal care products
Food
Other
87%
87%
85%
84%
83%
83%
80%
77%
74%
73%
72%
71%
71%
70%
70%
66%
66%
66%
65%
64%
64%
61%
60%
58%
55%
67%
+2%
0%
+5%
+2%
+2%
+1%
+10%
-5%
+6%
0%
+4%
0%
0%
-10%
+1%
-9%
-7%
-4%
-1%
+1%
+3%
-2%
-1%
-1%
-3%
+4%
+24%
+9%
+16%
N/A
-4%
+13%
-12%
N/A
+6%
+17%
+2%
+1%
+6%
N/A
-11%
-5%
+9%
-4%
-2%
-22%
-20%
-31%
-18%
+3%
-20%
-12%
2016Evolution 2016-2015
Evolution 2016-2011
Offline search
Online search
No search
0% 20% 40% 60% 80% 100%
Online information = ‘must’ across all sectors
ONLINE SEARCH
N = 1509 / F = None
Comeos - E-commerce - Belgium 2016 | 49
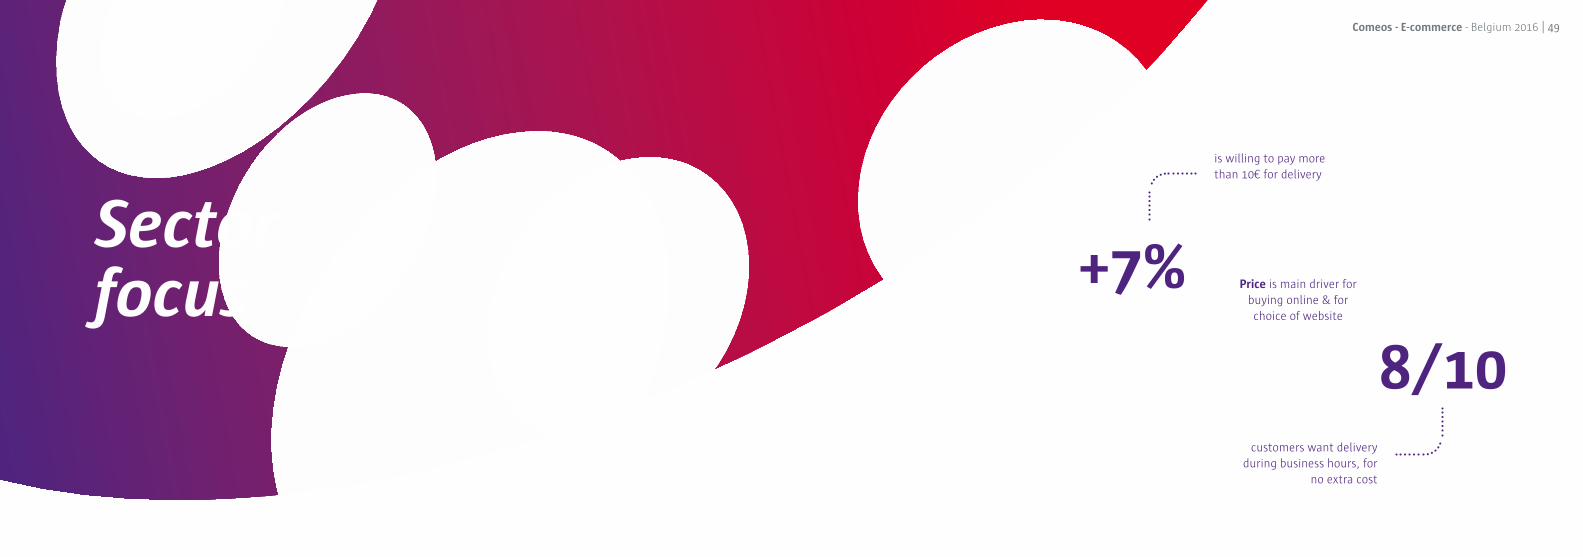
Sectorfocus +7%
8/10
is willing to pay more than 10€ for delivery
customers want delivery during business hours, for
no extra cost
Price is main driver for buying online & for choice of website

Comeos - E-commerce - Belgium 2016 | 51
Sector Focus Sector Focus
Drivers for E-commerce • EvolutionsQ: What are the 3 main reasons why you bought this product online?
Drivers for E-commerce (details 1/2)Q: What are the 3 main reasons why you bought this product online?
2016Evolution 2016-2015
Evolution 2016-2011
Because I can find products and services at lower prices 41% +2% +4%
Because it saves time 40% -2% -5%
Because it gets delivered to my door 39% +1% 5%
Because I’m able to shop 24 hours a day 35% 0% -2%
Because I get access to special discounts, promotions... 32% 0% +3%
Because I have a wider selection of products / services online 27% -4% +4%
Because I can compare and review different products / services 22% -1% +1%
Because I avoid crowds 17% +1% +1%
Because there is more product information online 15% +1% 0%
Because I can see whether items are in stock 15% 0% 0%
Because I get access to products/services that aren’t available in my country… 15% +2% 0%
Other reason 4% 0% 0%
% CONSUMERS WHO INDICATE THIS AS A TOP 3 DRIVER TO BUY ONLINE % CONSUMERS WHO INDICATE THIS AS A TOP 3 DRIVERPERCEIVED AS IMPORTANT
Time & convenience Money Purchase management
0% 10% 20% 30% 40% 50% 60% 70%
41%
40%
39%
35%
32%
27%
22%
17%
15%
15%
15%
4%
Total
Telecom
Electro
DIY & Garden
Fashion
Entertainment
Health & Beauty
Because I can find products and services at lower prices
Because it saves time
Because it gets delivered to my door
Because I’m able to shop 24 hours a day
Because I get access to special discounts, promotions...
Because I have a wider selection of products / services online
Because I can compare and review different products / services
Because I avoid crowds
Because there is more product information online
Because I can see whether items are in stock
Because I get access to products/services that aren’t available in my country…
Other reason
Price, time & home delivery = top 3 drivers
Ranking drivers varies from sector to sector
N = 3535 / F = if purchased online in the past 12 months N = Between 75 (Financial) and 669 (Fashion) / F = if purchased online in the past 12 monthsNote: Significant differences between sectors can be found in the sector reports

Comeos - E-commerce - Belgium 2016 | 53
Sector Focus Sector Focus
Drivers for E-commerce (details 2/2)Q: What are the 3 main reasons why you bought this product online?
Purchase amountQ: How much money did you spend at your most recent online purchase?
% CONSUMERS WHO INDICATE THIS AS A TOP 3 DRIVERPERCEIVED AS IMPORTANT
0% 10% 20% 30% 40% 50% 60% 70%
42%
39%
38%
35%
31%
31%
23%
16%
14%
14%
13%
4%
Total
Food
Interior
Books
Sports
Toys
Financial
Other
Because I can find products and services at lower prices
Because it saves time
Because it gets delivered to my door
Because I’m able to shop 24 hours a day
Because I get access to special discounts, promotions...
Because I have a wider selection of products / services online
Because I can compare and review different products / services
Because I avoid crowds
Because there is more product information online
Because I can see whether items are in stock
Because I get access to products/services that aren’t available in my country…
Other reason
Slight decrease in average online spending on most recent purchase
Electro 328
Other 279
Interior 246
DIY & Garden 167
Food 109
Sports 94
Fashion 78
Toys 69
Telecom 61
Health & Beauty 60
Entertainment 39
Books 33
N = Between 75 (Financial) and 669 (Fashion) / F = if purchased online in the past 12 monthsNote: Significant differences between sectors can be found in the sector reports
N = Between 78 (Food) and 638 (Fashion) / F = if purchased online in the past 12 months Sig. Higher compared to other group (95%)
AVERAGE AMOUNT MOST RECENT ONLINE PURCHASE € 130 (PREVIOUS WAVE = € 133)

Comeos - E-commerce - Belgium 2016 | 55
Sector Focus Sector Focus
Website satisfactionQ: How satisfied were you with using the e-commerce website after
your most recent online purchase?
Website RecommendationQ: How likely are you to recommend ‘website’ to a friend, on a scale from 0 to 10?
Total
Sports
Health & Beauty
Food
Electro
Books
Toys
Fashion
Entertainment
Telecom
DIY & Garden
Interior
Total
Health & Beauty
Books
Electro
Toys
Entertainment
Food
Sports
Fashion
DIY & Garden
Interior
Telecom
85 %
89%
89%
88%
88%
88%
88%
86%
84%
81%
80%
75%
84%
85%
87%
87%
84%
87%
88%
84%
81%
81%
76%
76%
86%
88%
92%
86%
87%
90%
87%
87%
84%
83%
80%
79%
81%
83%
80%
71%
80%
84%
93%
79%
82%
79%
65%
85%
85%
91%
83%
87%
84%
88%
91%
87%
87%
71%
82%
80%
82%
72
83%
84%
83%
88%
N/A
83%
81%
72%
73%
78%
30
44
37
36
35
34
33
32
27
24
18
7
27
33
33
29
28
31
35
23
24
12
15
13
27
26
34
26
28
27
37
32
31
7
2
13
22
12
34
18
30
26
42
25
18
0
10
11
34
39
39
37
40
42
40
52
25
41
5
9
21
37
24
25
N/A
24
41
2
18
9
6
3
2016 2015 2014 2013 2012 2011 2016 2015 2014 2013 2012 2011
TOP 2 NPS
Very satisfied 10 - Completely recommended 9 8 7 6 5 1234Rather satisfied Neutral Rather dissatisfied Very dissatisfied 0 - Not recommended at all
58% 27% 9% 3% 3%
61% 29% 8% 2% 2%
65% 24% 5% 3% 3%
62% 27% 9% 1%
63% 25% 6% 2% 4%
62% 25% 9% 1% 5%
66% 22% 9% 1% 2%
58% 28% 9% 3% 3%
59% 25% 12% 2% 2%
44% 37% 13% 4% 3%
48% 32% 13% 4% 4%
47% 29% 12% 6% 5%
19% 23% 29% 17% 6% 4%
28% 23% 30% 13% 4% 2%
20% 23% 35% 16% 2% 3%
19% 27% 30% 16% 4% 4%
22% 22% 28% 19% 5% 3%
21% 25% 27% 14% 5% 5%
24% 21% 26% 18% 9%
19% 25% 29% 16% 4% 6% 2%
17% 23% 31% 16% 7% 3%
14% 26% 30% 14% 6% 5% 2% 2%
15% 21% 27% 20% 8% 4% 2%
14% 15% 29% 19% 12% 8% 8%
Winners in website satisfaction: sports,
electro, DIY & Garden
Most likely to be recommended: health &
beauty, books and electro
N = Between 78 (Food) and 638 (Fashion) / F = if purchased online in the past 12 months N = Between 78 (Food) and 638 (Fashion) / F = if purchased online in the past 12 months

Comeos - E-commerce - Belgium 2016 | 57
2016Evolution 2016-2015
Evolution 2016-2011
Price 25% -1% -6%
Satisfaction with previous experiences 10% -1% -2%
Product selection and availability 8% 0 % -5%
Quick delivery 8% +1% -2%
Trust and safety 5% 0% -3%
User-friendliness of the website 4% 0% -2%
Low shipment costs 4% 0% +1%
Accidental - just where I found it 4% 0% -2%
Recommended by a friend 2% 0% -1%
Return guaranty policy 2% 0% -1%
Completeness of the product information 1% -1% -1%
Other reason 2% 0% -2%
2016Evolution 2016-2015
Evolution 2016-2011
Online - Credit card 32% -5% -11%
Online - Debit card 30% +2% +15%
Online - PayPal 12% +2% +5%
Offline - Bank transfer 8% -1% -11%
Mobile app - PayPal 3% +1% N/A
Mobile app - My bank’s app 3% +2% N/A
Offline - By card at the door 2% -1% -3%
Mobile app - Credit card 2% 0% N/A
Offline - Cash at the point of sale 2% +1% -1%
Online - Other 2% 0% -2%
Offline - Cash at the door 1% 0% -1%
Offline - By card at the door 1% 0% 0%
Offline - other 1% 0% 0%
Offline - SMS payment 0% 0% 0%
Offline - Cheque 0% 0% 0%
Mobile app - Other 0% 0% N/A
Total online payments 84% +1% +15%
Sector Focus Sector Focus
Drivers website • EvolutionsQ: Why did you use ‘website’ for your online purchase? Please indicate which 3 factors were the most important.
Payment method • EvolutionsQ: How did you pay for it?
% CONSUMERS WHO INDICATE THIS AS MOST IMPORTANT DRIVER TO USE THE WEBSITE
Use of debit cards & credit cards close to
equal
N = 3535 / F = if purchased online in the past 12 monthsN = 3535 / F = if purchased online in the past 12 months

Comeos - E-commerce - Belgium 2016 | 59
Sector Focus
Payment method • EvolutionsQ: How did you pay for it?
8% of online purchases are paid through
mobile or tablet
N = 3535 / F = if purchased online in the past 12 months
2016Evolution 2016-2015
Evolution 2016-2011
Home delivery 71% +2% +5%
Pick-up at a pick-up point 13% -1% -2%
Pick-up at the shop 7% -1% -1%
Delivery at work 5% 0% -1%
Pick-up in a locker (sealed container to be opened with a code) 1% 0% +1%
Other 1% 0% -1%
Does not matter to me 2% 0% -1%
Sector Focus
Delivery preference • EvolutionsQ: How do you prefer your online purchases ‘product sector’ to be delivered?
Home delivery is the only growing delivery method
N = 2811 / F = if purchased online in the past 12 months
TRANSACTION MOBILE PAYMENT METHOD
2016Evolution 2016-2015
Evolution 2016-2011
Mobile app - Paypal 3% 1% N/A
Mobile app - My bank's app 3% 2% N/A
Mobile app - Credit card 2% 0% N/A
Mobile app - Other 0% 0% N/A
Total Mobile payments 8% +2% N/A
DELIVER PLACE

Comeos - E-commerce - Belgium 2016 | 61
2016Evolution 2016-2015
Evolution 2016-2011
Between 9.00 and 18.00 will do, if I don’t have to pay anything extra
78% -1% +2%
It should be possible between 8.00 and 20.00, even if I have to pay something extra
16% +1% +1%
It should be possible 24h/7, even if I have to pay extra
6% -1% -3%
2016Evolution 2016-2015
Evolution 2016-2011
During the week is sufficient, if I don’t have to pay anything extra
82% -4% -1%
Also during the weekend, even if I have to pay something extra
11% +2% -3%
Also on Sunday, even if I have to pay something extra
7% +3% +4%
Sector Focus
Delivery time • EvolutionsQ: How do you prefer your online purchases ‘product sector’ to be delivered?
18% of customers willing to pay extra
for weekend deliveries
People 44 or older & Dutch speaking
respondents are less willing to pay for delivery
People under 44, French speaking respondents and
those who prefer home delivery are more willing to
pay for delivery
HOUR
DAYS OF THE WEEK
N = 2722 / F = if purchased online in the past 12 months
2016Evolution 2016-2015
Evolution 2016-2011
Free 34% +5% +16%
Less than €4,00 18% +1% -5%
€4,00 till €7,50 28% -4% -3%
€7,50 till €10,00 1% -9% -13%
More than €10,00 19% +7% +5%
Sector Focus
Delivery price • EvolutionsQ: How much are you willing to pay for the delivery of the ‘product’ you buy online?
COST OF DELIVERY
N = 2048 / F = if purchased online in the past 12 months
Breakdown

Comeos - E-commerce - Belgium 2016 | 63
E-commerce trust& experience
7/10
43%
customers only go for reliable & familiar sites
prefer Belgian webshops

Comeos - E-commerce - Belgium 2016 | 65
2016 2015 2014 2013 2012 2011
I would only purchase products and/or services on familiar and reliable sites
69% 69% 66% 69% 77% 74%
I find it important for an e-commerce website to be certified by an independent body
64% 63% 63% 68% 74% 69%
I have faith in e-commerce 58% 60% 60% 60% 66% 59%
I find a transfer a reliable method of payment for an online purchase
54% 58% 57% 63% 68% 62%
I find it safe to pay for an online purchase with a credit card (VISA, MasterCard)
52% 50% 50% 49% 57% 48%
I am open to purchasing a broad range of products and/or services online
52% 51% 49% 45% 52% 46%
I prefer an online purchase via a Belgian website to one via a foreign website
43% 45% 43% 50% 47% 46%
I prefer online payments to offline payments 36% 36% 39% 35% 38% 34%
I have no inhibitions when it comes to buying online products and/or services online
34% 33% 34% 34% 37% 31%
I have faith in making purchases on mobile devices (smartphone, tablet...)
29% 27% N/A N/A N/A N/A
E-commerce trust & experience
E-commerce trustQ: To what extent do you agree with the following statements? (Top 2 scores)
Customers gain confidence in making
purchases via smartphone or
tablet (+2%)
30% still reluctant to buying on mobile device
E-commerce trust
E-commerce trust (detail)Q: To what extent do you agree with the following statements? (Top 2 scores)
I would only purchase products and/or services on familiar and reliable sites
I find it important for an e-commerce website to be certified by an independent body
I have faith in e-commerce
I find a transfer a reliable method of payment for an online purchase
I find it safe to pay for an online purchase with a credit card (VISA, MasterCard...)
I prefer an online purchase via a Belgian website to one via a foreign website
I prefer online payments to offline payments
I have no inhibitions when it comes to buying products and/or services online
I have faith in making purchases on mobile devices (smartphone, tablet...)
I am open to purchasing a broad range of products and/or services online
69%
64%
58%
54%
52%
52%
43%
36%
34%
29%
69%
63%
60%
58%
50%
51%
45%
36%
33%
27%
—
+2%
-2%
-4%
+2%
+1%
-2%
—
+1%
+2%
2016 2015 EVOLUTION
Totally agree Rather agree Neutral Rather disagree Totally disagree
23% 45% 26% 4%
22% 42% 30% 5%
14% 44% 36% 5%
16% 38% 36% 8%
12% 40% 32% 12% 4%
12% 41% 33% 10% 4%
11% 32% 38% 13% 5%
10% 26% 45% 13% 6%
6% 28% 37% 19% 10%
5% 24% 41% 19% 11%
N = 1509 / F = None N = 1509 / F = None

Comeos - E-commerce - Belgium 2016 | 67
2016 2015 2014 2013 2012 2011
I prefer an online purchase via a Belgian website to one via a foreign website
43% 45% 43% 50% 47% 46%
I prefer online payments to offline payments 36% 36% 39% 35% 38% 34%
I think a purely online website without offlinecounterpart is less reliable
21% 22% 20% 26% 22% 21%
I prefer an online purchase with a purely online website without offline counterpart
16% 15% 14% 14% 11% 13%
E-commerce trust
E-commerce attitudeQ: To what extent do you agree with the following statements? (Top 2 scores)
16% has more confidence in pure
players
E-commerce trust
E-commerce attitude (detail)Q: To what extent do you agree with the following statements? (Top 2 scores)
I prefer an online purchase via a Belgian website to one via a foreign website
I prefer online payments to offline payments
I think a purely online website without offlinecounterpart is less reliable
I prefer an online purchase with a purely online website without offline counterpart
43%
36%
21%
16%
45%
36%
22%
15%
-2%
0%
-1%
+1%
2016 2015 EVOLUTION
Totally agree Rather agree Neutral Rather disagree Totally disagree
11% 32% 38% 13% 5%
10% 26% 45% 13% 6%
3% 18% 52% 19% 8%
2% 13% 59% 18% 8%
N = 1509 / F = None N = 1509 / F = None

Comeos - E-commerce - Belgium 2016 | 69
Mobilepurchases
21%2,5%
42%
almost 1 out of 4 online buyers does mobile purchases
or 233.750 customers buy exclusively on
tablet or smartphone
would not do it again

Comeos - E-commerce - Belgium 2016 | 71
Mobile purchases in the past 12
months
Mobile purchases exclusively**
ONLINE BUYING
POPULATION21% 2,5%
ONLINE POPULATION
15% 2%
BELGIAN POPULATION*
13% 1,6%
Mobile purchases
Current mobile purchasesQ: Did you buy products or services on the Internet on a mobile device
(e.g. smartphone or tablet) in the past 12 months?
* Extrapolated to the Belgian population regarding the current internet-population (85% in 2016)** Respondents who indicated not having bought online in the past 12 months but did indicate later on having bought on a mobile device
21%
76%-1%
3% +1%
Yes
No
No ideaEvolution 2016 - 2015
CURRENT MOBILE PURCHASE BEHAVIOUR
Mobile purchases
Current mobile purchasesQ: Did you buy products or services on the Internet on a mobile device (e.g. smartphone or tablet) in the past 12 months?
Profile mobile buyer: male, young, high
income
Sign. Different from at least one other target group (95% confidence level)
2016 2015 Evolution 2016-2015
Gender Male 26% 22% +4%
Female 16% 20% -4%
Language Dutch 20% 19% +1%
French 23% 23% 0%
Age 18-27 31% 27% +4%
28-43 28% 27% +1%
44-59 16% 15% +1%
60+ 8% 12% -4%
Income Less than € 2500 21% 19% +2%
€ 2500 - 3500 24% 25% -1%
More than € 3500 28% 27% +1%
N = 1509 / F = None N = 1509 / F = None
Level of mobile buyers remains stable
(21% or 1,9 million)

Comeos - E-commerce - Belgium 2016 | 73
Mobile purchases
Future mobile purchasesQ: In future, will you buy new products/services on the Internet on a mobile device
(e.g. smartphone or tablet)?
FUTURE INTENTION TO BUY NEW PRODUCTS/SERVICES
ON A MOBILE DEVICE
Online buying population
Online mobile buying population
TOP 2 TOP 2
2015 20152016 2016
28% 87%
77%
31% 85%
83%
IN GENERAL
agree agree
agree
Neutral Neutral
Neutral
disagree disagree
disagree
Gap: 54%
Gap: 2%
Strongest increases in future intention to buy: personal care, DIY,
garden, pharmaceutical products
31% 27% 42% 85% 12% 3%
83% 12% 6%
Mobile purchases
Intended purchase of new products via mobileQ: Which of the following products/services would you consider purchasing on
a mobile device (e.g. smartphone, tablet) in the coming 12 months?
Books 67% +9%Prepared food 67% +10%
Clothing 65% +2%Shoes 63% +10%
Boat, plane, or train tickets 62% -3%Fun fair tickets 61% +4%
Event tickets 59% -2%Hotel/Overnight stay 59% -1%
Food 58% +3%Personal care products 57% +14%
DIY 56% +19%Digital music 56% +1%
Garden products 55% +14%Pharmaceutical products 55% +21%
Toys 55% -3%CD/DVD/Blu-ray/Games 54% -1%
Films or TV series in digital format 49% +12%Sports products 48% +9%
Computer, hardware and software 46% +6%Telecom 45% 0%
Home decoration 44% +4%Electronic appliances 43% +8%
Other insurances 42% +21%Travel assistance or canceling insurance 39% +2%
Furniture 39% +7%Household appliances 38% +2%
Bank products 38% -1%Cars, motorbikes, bicycles 33% 0%
Other 4% -2%
Fashion
Books
Electronic appliances
Entertainment
Telecom
Health & Beauty
Interior
Food
Prepared food
Sports
DIY
Toys
Other
Fashion = +5%
Interior = +7%
DIY & Garden = +15%
N = 1509 / F = None N = 449 / F = If considering buying via mobile in the future
2016Evolution 2016-2015

Comeos - E-commerce - Belgium 2016 | 75
Mobile purchases
Future intention to buyQ: Which of the following products would you consider purchasing online in the coming 12 months?Q: Which of the following products/services would you consider purchasing on a mobile device (e.g.
smartphone, tablet) in the coming 12 months?
Prepared foodFood
Digital music Garden products
DIY Films or TV series in digital format
Pharmaceutical productsOther insurances
Fun fair tickets Telecom
CD/DVD/Blu-ray/Games Books
Sports productsToys
Cars, motorbikes, bicycles Personal care products
Travel assistance or cancelling insurance Furniture
Boat, plane, train ticketsShoes
Bank products Home decoration
Event tickets Computer, hardware and software
Electronic appliances Household appliances Hotel / Overnight stay
ClothingOther
General
Mobile
0% 20% 40% 60% 80%
Potential growth: stronger amongst
mobile buyers
Mobile purchases
Barriers for making mobile purchasesQ: To what extent do you agree with the following statements? (Top 2 scores)
Payment & connection problems slide back
My mobile device's screen is too small
I do not trust making purchases on mobile devices (smartphone, tablet)
Making online payments is difficult on my mobile device
Making purchases on my mobile device takes too much data
E-commerce websites are often not compatible with my mobile device
The battery is drained too much when making purchases on my mobile device
My mobile device's Internet connection is not powerful enough
+3%
+1%
-2%
+3%
+2%
+3%
-3%
51%
41%
37%
32%
28%
27%
26%
2016
Definitely Rather Neutral Not really Not at all
17% 34% 33% 9% 7%
16% 26% 41% 11% 6%
10% 27% 43% 12% 7%
8% 24% 47% 13% 9%
8% 20% 52% 12% 8%
8% 19% 46% 15% 12%
8% 18% 43% 18% 13%
N= 1509 / F= If considering buying on the internet N = 1136 / F = If not considering buying via mobile in the future
2016 Evolution 2016-2015 2016 Evolution
2016-2015
8% +2% 67% +11%10% -3% 58% +4%10% 0% 56% 0%13% +2% 55% +14%14% +1% 56% +19%7% -1% 49% +12%
16% +4% 55% +21%4% -1% 42% +21%
25% +4% 61% +4%12% -2% 45% +1%21% -2% 54% -1%34% -4% 67% +10%15% +1% 48% +9%22% 0% 55% -3%2% -1% 33% -1%
26% 0% 57% +14%9% -1% 39% +2%9% 0% 39% +7%
32% -8% 62% -4%34% +1% 63% +10%10% -4% 38% -1%17% +1% 44% +4%32% -7% 59% -3%23% -2% 46% +6%22% -1% 43% +8%21% -1% 38% +3%44% -6% 59% -1%51% -1% 65% +2%5% 0% 4% -2%
GENERAL MOBILEEvolution 2016-2015

Comeos - E-commerce - Belgium 2016 | 77
Internet problems 13%
-6%
report problem related to online purchase
unsolved problems

Comeos - E-commerce - Belgium 2016 | 79
Yes, several times
Yes, once
No
5%
8%
87%
Internet problems
ExposureQ: Have you been confronted with Internet problems related with your purchase of
new products or services on the Internet in the past 12 months?
2016 EVOLUTION
14%
12%
10%
8%
6%
4%
2%
0%
2011 2012 2013 2014 2015 2016
Internet problems
Type of problemsQ: What is the best description for this Internet problem?
2016 2015 2014 2013 2012 2011
Payment problems (e.g. hacked payment website)
32% 29% 39% 34% 49% 40%
Conscious faulty information on the website 30% 28% 26% 25% 17% 35%
Wrong / damaged / incomplete / missing delivery
26% 27% 21% 20% 25% 28%
Issue concerning return shipment 16% 15% 9% 20% 7% 11%
Other 12% 13% 16% 15% 24% 12%
32% of problems linked to payment
N = 1509 / F = None N = 196 / F = Confronted with internet problem in past 12 months
13% of online buyers confronted with problems in
past 12 months

Comeos - E-commerce - Belgium 2016 | 81
2016 2015 2014 2013 2012 2011
The bank 36% 28% 31% 26% 38% 17%
The supplier 27% 19% 20% 15% 11% 22%
The Internet problem has not been solved 18% 24% 26% 26% 29% 32%
The company 17% 17% 20% 17% 18% 22%
Other, i.e.: 8% 17% 4% 17% 13% 19%
Internet problems
Issue handlingQ: Who solved this Internet problem?
N = 196 / F = Confronted with internet problem in past 12 months
Unresolved problems: -6%

Comeos - E-commerce - Belgium 2016 | 83
E-commerce trends & attitude 24%
45%
goes showrooming, then buys online
searches online, buys offline

Comeos - E-commerce - Belgium 2016 | 85
2016 2015 2014 2013 2012 2011
41% 42% 46% 47% 42% 38%
31% 29% 32% 33% 28% 27%
24% 23% 26% 24% 20% 21%
23% 22% 22% 17% 15% 15%
E-commerce trends & attitude
Q: To what extent are you willing to use the following new technologies in the coming 12 months?
Using group discount websites (e.g. Groupon), which offer a unique
daily deal via a website
Using social media (e.g. Facebook) and word of mouth advertising to get a
price reduction for my online purchases
Using location-based services (e.g. offers of shops in the vicinity of
your mobile phone / smartphone)
Using a mobile site or application on the smartphone for mobile
purchases whilst on the road
Totally willing to Rather willing to Neutral Rather not willing to Not at all willing to
12% 29% 33% 15% 11%
6% 24% 33% 17% 19%
4% 20% 39% 21% 17%
5% 18% 35% 24% 19%
TOP 2
E-commerce trends & attitude
Q: To what extent do you agree with each of the following statements?
Before going to the shop to buy a product, it should be possible to consult online whether the product is available
I dislike it when I buy several objects on the same website and at the exact same time, and then they arrive in different packs, possibly not even on the same day
When I shop online, I mainly do so by targeting specific purchases because I am looking for something, not for fun
When I go shopping (e.g. in the city, in a shopping centre) I am mainly doing so by targeting specific purchases because I am looking for something, not for fun
Before I go shopping, I often search for inspiration online so I know exactly what I want to buy in the shop
I like it when a shop also has a kiosk where I can search for more information on the products in the shop and maybe even check out the offer that is not available in-store
Belgian fashion shops / chains are less advanced in Internet applications (e.g. online purchases) than our neighbouring countries
The offer of the online webshop and the offline shop of the same chain are well adapted to each other
The service given by an online webshop and an offline shop of the same chain are well adapted to each other
The experience I have with online web shops and the offline shop of the same chain is identical
I often go shopping, simply to get inspired and see ideas; I later buy online what I thought was interesting in the shop
When I order a product online or have a repair done online, I would like to follow its status on the Internet
73% want to follow order status
73%
64%
51%
49%
45%
45%
40%
39%
37%
35%
28%
24%
72%
62%
49%
51%
45%
45%
40%
40%
35%
36%
27%
23%
77%
67%
53%
N/A
50%
N/A
36%
N/A
40%
38%
31%
N/A
2016 2015 2014
TOP 2
Totally agree Rather agree Neutral Rather disagree Completely disagree
28% 46% 23% 3% 1%
21% 43% 30% 5% 1%
14% 37% 32% 13% 4%
17% 32% 35% 13% 4%
13% 32% 32% 18% 4%
9% 36% 34% 15% 6%
10% 30% 48% 10% 2%
6% 33% 46% 11% 4%
5% 32% 50% 12% 2%
4% 31% 48% 14% 3%
4% 24% 48% 19% 5%
5% 20% 36% 25% 14%
N = 1509 / F = None N = 196 / F = Confronted with internet problem in past 12 months

Comeos - E-commerce - Belgium 2016 | 87
42% 40%
39% 38%
37% 35%
31% 30%
29% 30%
E-commerce trends & attitude
Q: To what extent have your expectations been lower / higher compared to the offline store, compared to 5 years ago?
The staff's expertise
The general shopping experience
The quality of the offer
The product price
The width of the range
Much higher Higher The same as before Lower Much lower
7% 35% 47% 9% 2%
6% 33% 49% 10% 2%
5% 32% 56% 7% 1%
3% 28% 60% 7% 2%
4% 25% 60% 9% 2%
2016
TOP 2
2015
Width of range more important online
than in store
N = 1509 / F = None
