e -470 public highway authority e-470... · the following is management’s discussion and analysis...
TRANSCRIPT


E-470 Public Highway Authority Table of Contents
Page(s)
Management’s Discussion and Analysis (Unaudited) 2–19
Independent Auditors’ Report 20–21
Basic Financial Statements:
Statements of Net Position 22–23
Statements of Revenue, Expenses, and Changes in Net Position 24
Statements of Cash Flows 25–26
Notes to Basic Financial Statements 27–63
Supplementary Information – Revenue Covenant (Unaudited) 64–66

E-470 PUBLIC HIGHWAY AUTHORITY
Management’s Discussion and Analysis
December 31, 2015 and 2014
(Unaudited)
2 | P a g e
The following is management’s discussion and analysis of the financial performance and activity of the E-470 Public Highway Authority (the Authority or E-470), and is designed to provide an introduction and overview that may be used to interpret the basic financial statements as of and for the years ended December 31, 2015 and 2014. This discussion has been prepared by management covering complete data for a three-year period, and should be read in conjunction with the basic financial statements and notes thereto, which immediately follow this section.
Authority Overview
E-470 is a toll road that forms a semicircular beltway along the eastern perimeter of the Denver metropolitan area. The 75 mile-per-hour toll road extends 47 miles from State Highway C-470 at I-25, to I-25 at Northwest Parkway, a toll road managed by a separate highway authority. The toll road travels through three counties and five municipalities and provides easy access to Denver International Airport.
The toll road has been financed, constructed, operated, and governed by the Authority, which is a body corporate and political subdivision of the State of Colorado, established in January 1988 with all the powers, duties, and privileges permitted by the Public Highway Authority Law of the State, part 5 of article 4 of title 43, Colorado Revised Statutes, as amended (Public Highway Act). Under the Public Highway Act, the Authority has the power without voter approval, unless limited by the contract creating such authority, to construct, finance, operate, or maintain beltways and other transportation improvements; take private property by condemnation; establish, and collect tolls on any highway provided by the Authority; establish, and collect a highway expansion fee from persons developing property within the boundaries of the Authority; issue bonds, and pledge its revenues to payment of bonds; along with other powers as specified within the Public Highway Act.
The toll road was constructed and opened in segments from 1991 to 2003. Segment I of the toll road, I-25 South to Parker Road, was opened to traffic in June 1991. The northern portion of Segment II, 56th Avenue to 120th Avenue, and the southern portion of Segment III, Parker Road to Smoky Hill Road, opened to traffic in July 1998. In May 1999, the remaining portions of Segments II and III, Smoky Hill Road to 56th Avenue, were opened to link the already operational north and south sections of the E-470 toll road. Segment IV, the final segment of the E-470 toll road, was opened in two sections. The first, from 120th Avenue to U.S. Highway 85, opened in August 2002; the second, from U.S. Highway 85 to I-25 North, opened in January 2003. The four-lane toll road (with five miles consisting of six lanes) has been designed to accommodate future widening up to eight lanes and to allow for the addition of continuous recreation paths and future median mass transit.
The Authority consists of eight member jurisdictions, each of which has an elected official representative that sits on the Authority’s board of directors as voting members (the board): Adams, Arapahoe, and Douglas counties, and the municipalities of Aurora, Brighton, Commerce City, Parker, and Thornton. The Authority also has nine nonvoting members including the cities of Arvada, Lone Tree and Greeley, City and County of Broomfield, Weld County, Denver Regional Council of Governments (DRCOG), Regional Transportation District (RTD), Regional Air Quality Council (RAQC), and the Colorado Department of Transportation (CDOT). Appointments to the board are made annually for both voting and nonvoting members, and are made by the individual jurisdictions.

E-470 PUBLIC HIGHWAY AUTHORITY
Management’s Discussion and Analysis
December 31, 2015 and 2014
(Unaudited)
3 | P a g e
The Authority provides two options for toll payments – ExpressToll and License Plate Toll (LPT).
ExpressToll is a state-of-the-art electronic system that allows drivers to pass through mainline tolling points and ramps on any Colorado toll facility without stopping or slowing below the prevailing speed limit. ExpressToll customers pay 20% less in tolls on E-470 compared to License Plate Toll customers due to a toll differential. ExpressToll currently operates with either the older Title 21 hard-case transponder, the windshield 6c sticker tag, or the newer switchable HOV transponder that allows tolls to be automatically deducted from a customer’s prepaid account as the customer uses a toll facility.
LPT customers are all customers that do not have an ExpressToll account. LPT customers are generally billed on a monthly basis for all accumulated toll transactions through any tolling points (mainline and ramps) on any Colorado toll facility. Cameras photograph the front and rear license plates of all vehicles and, if the vehicle does not have an ExpressToll account, a statement (bill) is sent to the registered owner of the vehicle. No advance registration is required. LPT customers may also set up a managed account online to prepay tolls, leave a credit card on file, receive statements via e-mail, or pay for tolls prior to a statement being generated.
2015 Financial Highlights
• Transactions on the toll road experienced growth of 12% from 66.4 million transactions in 2014 to 74.6 million transactions in 2015. This was the highest annual traffic on record, and is the sixth straight year of traffic growth for the Authority. Traffic grew 14% from 58.4 million transactions in 2013 to 66.4 million transactions in 2014.
• Operating revenues increased 16% from 2014 to 2015 improving from $156.9 million to $181.9 million, the highest annual revenue on record. Operating revenues grew from $133.7 million to $156.9 million, or 17% from 2013 to 2014, respectively.
• Operating expenses, before depreciation, increased 16% from 2014 to 2015 from $35.7 million to $41.4 million. Operating expenses, before depreciation, increased 9% from 2013 to 2014 from $32.9 million to $35.7 million.
• Debt service coverage, a critical measurement of the Authority’s annual operations, for fiscal 2015 was 1.78 versus an original budgeted ratio of 1.63. Debt service coverage for fiscal 2014 was 1.71 versus a budgeted 1.48, and was 1.48 versus a budgeted 1.39 in 2013.

E-470 PUBLIC HIGHWAY AUTHORITY
Management’s Discussion and Analysis
December 31, 2015 and 2014
(Unaudited)
4 | P a g e
• In June 2015, the Authority successfully closed the 2015 bond transaction, which included a cash contribution to partially pay off callable debt and refund the remaining portion. The Authority had a call opportunity for a portion (at par value) of the Subseries 2007A-1 to 2007D-1 Bonds totaling approximately $122.8 million in term bonds with original maturities between 2019 and 2024. The Authority, as part of its debt management plan, contributed approximately $78 million in cash from the unrestricted Senior Bonds Defeasance Fund of the General Surplus account to cash defease a significant portion of the callable debt, and refunded the remaining portion with new maturities between 2016 and 2020. As part of the transaction, the Authority also terminated portions of related interest rate swaps netting approximately $3.8 million in termination payments from the unrestricted Senior Bonds Defeasance Fund. The transaction partially alleviated the increasing debt service over the next several years and set up the Authority with opportunities in the next five years to achieve level annual debt service, a significant goal of the debt management plan.
• Throughout 2015, the Authority continued its significant efforts to accommodate CDOT’s new toll facilities in the State of Colorado, which included toll commencement in 2015 on three roadways (US-36 managed lanes, reconfiguration of the I-25 Central managed lanes, and the I-70 Mountain Express Lane (MEXL)). The Authority provided several services to the High Performance Transportation Enterprise (HPTE), a division of CDOT, and its concessionaire on US-36 and I-25 Central, Plenary Roads Denver, LLC (Plenary) including, but not limited to, integrating and installing toll equipment, toll collection system enhancements and modifications, system testing and go live support, and back office toll collection services. The Authority has been providing back office services to CDOT since 2006 and to the Northwest Parkway (NWP) since 2004. E-470’s tolling back office process allows customers to have only one account to manage and ensures a seamless customer experience regardless of which Colorado tolled facility they use. Toll collection or system costs originally incurred by the Authority for services provided to other entities are charged to the applicable entity (CDOT, HPTE, Plenary, or NWP). Tolling services revenues in 2015 and 2014 totaled approximately $2.3 million and $1.2 million, respectively.
• In 2015, the Authority remodeled and renovated the headquarters building to accommodate growth of E-470 and the other Colorado tolled facilities, mainly within the toll system back office including the customer service center and image review center. The Authority back office provides toll collection and administration to all toll facilities in Colorado. The $2.8 million dollar capital project was substantially completed at December 31, 2015 and under budget.
• The Authority’s board of directors approved two changes in November 2010 to the toll rate schedule. The first was a change from the previous policy of a $0.25 increase every three years to annual increases in smaller increments that would equate to the total $0.25 increase every third year. The second change was an increase in the differential between ExpressToll and LPT toll rates from 10% to a 25% premium. Both policies were effective on January 1, 2011. Further, in November 2014, in accordance with the previous year’s toll rate changes, the board of directors voted to increase the 2015 ExpressToll rates by $0.05 at all mainline tolling points and $0.05 at all ramp tolling points. The LPT rates were recalculated at 25% more than the new 2015 ExpressToll rates, and both were effective January 1, 2015. These annual incremental toll increases support the Authority’s escalating debt service due in 2015 and beyond.
The 2015 ExpressToll rate for a two-axle vehicle was $2.50 at mainline toll plaza A and $2.75 at mainline toll plazas B, C, D, and E. ExpressToll rates increase incrementally at the mainline toll plazas if the vehicle has more than two axles. All ramp tolling points charged a rate of $1.15 (regardless of axle count) for

E-470 PUBLIC HIGHWAY AUTHORITY
Management’s Discussion and Analysis
December 31, 2015 and 2014
(Unaudited)
5 | P a g e
ExpressToll accounts. The 2015 LPT toll rate for a two-axle vehicle was $3.15 at mainline toll plaza A and $3.45 at mainline toll plazas B, C, D, and E. LPT toll rates also increase incrementally at the mainline toll plazas if the vehicle has more than two axles. All ramp tolling points charged a rate of $1.45 (regardless of axles) for LPT accounts.
Summary of Operations
The Authority’s operating revenues, which include toll revenues, other toll-related fees, and tolling services revenues, for 2015 were $181.9 million, a 16% increase over the $156.9 million in 2014. Toll revenues, net of related bad debts, were $173.0 million and $150.4 million of total operating revenues in 2015 and 2014, respectively. This increase is primarily due to increased overall toll transactions of 12% from 2014 and an incremental toll increase beginning on January 1, 2015 for all tolling points. These components of operating revenues for fiscal year 2015 were $7.2 million above the $165.8 million 2015 operating revenue budget. Traffic on E-470 during 2015 combined for 74.6 million transactions, with approximately 71% of the corresponding toll revenues coming from ExpressToll accounts. Operating revenues for 2014 were $156.9 million, a 17% increase over the $133.7 million in 2013. This increase is primarily due to increased overall toll transactions of 14% from 2013 and an incremental toll increase beginning on January 1, 2014 for all tolling points. Operating revenues for 2013 were $133.7 million, an 11% increase over 2012, which was also due to increased overall toll transactions and an incremental toll increase beginning on January 1, 2013.
Total operating expenses, before depreciation, for 2015 were $41.4 million, a 16% increase over the $35.7 million in 2014. The increase is primarily due to higher toll collection costs from the 12% increase in E-470 toll transaction volume in 2015, coupled with more transactions incurred on other Colorado toll facilities. Costs such as call center labor, image processing, printing and postage on bills, registered vehicle owner information retrieval, and credit card fees accounted for $2.8 million of the overall $5.7 million increase from prior year. There were no other individually significant fluctuations. Total operating expenses, before depreciation, for 2014 were $35.7 million, a 9% increase over the $32.9 million in 2013. The increase is primarily due to higher toll collection costs from the 14% increase in toll transaction volume in 2014. Costs such as call center labor, image processing, printing and postage on bills, address retrieval, and credit card fees accounted for $1.5 million of the overall $2.8 million increase from prior year. There were no other individually significant fluctuations within the remaining $1.3 million in operating expense change.
Senior Revenue Bond principal and interest payments from the senior debt service fund during 2015 and 2014 were $91.1 million and $83.6 million, respectively, on the Series 1997, 2004, 2006, 2007, 2010, and 2014 bonds, and includes the interest rate swap differentials. In 2015 and 2014, approximately $2.5 million in principal and interest was due and separately paid on the Series 2009 Vehicle Registration Fee (VRF) bonds. Debt service coverage for 2015 was 1.78, compared to 1.71 in 2014 and 1.48 in 2013. The Master and Supplemental Bond Resolutions (Bond Resolutions) require producing net revenues of at least 1.30 times the aggregate senior debt service due for the year.
Overview of Basic Financial Statements
The Authority only engages in business-type activities. These activities are intended to recover all related costs through user fee charges (tolls) to external customers for services provided. The Authority reports its business-type activities in a single enterprise fund, meaning that its activities are operated and reported like a private-sector

E-470 PUBLIC HIGHWAY AUTHORITY
Management’s Discussion and Analysis
December 31, 2015 and 2014
(Unaudited)
6 | P a g e
business. The Authority’s basic financial statements include comparative statements of net position, statements of revenues, expenses, and changes in net position, and the statements of cash flows. Also included are the notes to the basic financial statements that provide more detailed information. These basic financial statements are prepared in accordance with accounting principles generally accepted in the United States of America as promulgated by the Governmental Accounting Standards Board (GASB).
The Authority’s net position is comprised of the following components:
• Net investment in capital assets – Consists of the Authority’s investment in capital assets (e.g., land, buildings, equipment, and infrastructure), net of accumulated depreciation, and deferred outflows of resources, reduced by the outstanding balances of bonds that are attributable to the acquisition, construction, or improvement of those assets. The Authority uses these capital assets to provide services to the public; consequently, these assets are not available for future spending.
• Restricted for debt service – Represents resources that are subject to external restrictions on how they may be used, and consists of restricted assets reduced by restricted liabilities whereby these restricted liabilities will generally be liquidated with the restricted assets reported.
• Unrestricted – Represents resources that may be used to meet the Authority’s ongoing obligations to the public and creditors, and are not included in the determination of net investment in capital assets or restricted for debt service components of net position.

E-470 PUBLIC HIGHWAY AUTHORITY
Management’s Discussion and Analysis
December 31, 2015 and 2014
(Unaudited)
7 | P a g e
Financial Results and Analysis Summary of Net Position
2015 2014 2013
Current assets:Current unrestricted assets $ 161,615,456 187,953,107 91,794,174 Current restricted assets 57,498,869 55,925,506 43,092,725
Total current assets 219,114,325 243,878,613 134,886,899
Noncurrent assets:Capital assets, net of accumulated depreciation 591,458,677 617,894,782 639,916,297 Other noncurrent assets 169,902,709 187,814,590 248,426,010
Total noncurrent assets 761,361,386 805,709,372 888,342,307
Total assets 980,475,711 1,049,587,985 1,023,229,206
Deferred outflows of resources 98,594,860 107,600,113 115,386,000 Total assets and
deferred outflows of resources $ 1,079,070,571 1,157,188,098 1,138,615,206
Current liabilities:Current liabilities payable from unrestricted assets $ 26,346,644 20,901,840 21,451,893 Current liabilities payable from restricted assets 85,568,458 75,669,135 66,723,668
Total current liabilities 111,915,102 96,570,975 88,175,561
Noncurrent liabilities 1,503,046,870 1,613,239,891 1,592,179,687
Total liabilities 1,614,961,972 1,709,810,866 1,680,355,248
Total net position (535,891,401) (552,622,768) (541,740,042)
Total liabilities and net position $ 1,079,070,571 1,157,188,098 1,138,615,206
The largest portion of the Authority’s assets is noncurrent. Approximately 60% and 59% of the total assets are capital assets (e.g., infrastructure, buildings, equipment, and other), net of accumulated depreciation as of December 31, 2015 and 2014, respectively. The Authority uses these capital assets to provide services, and consequently, these assets are not available to liquidate liabilities or for other future spending. The acquisition of capital assets was primarily financed from revenue bond proceeds, with more recent capitalized assets financed with unrestricted funds. Noncurrent bonds payable was approximately 96% and 95% of total noncurrent liabilities in 2015 and 2014, respectively. Total current liabilities were $111.9 million and $96.6 million at the end of 2015 and 2014, respectively. Of the total current liabilities, $85.8 million (77%) and $75.9 million (79%) for 2015 and 2014, respectively, were current bonds payable, current notes payable, and related accrued interest payable. These liabilities are to be paid from current assets and the subsequent year’s operating and nonoperating revenue as allowed under the Bond Resolutions.

E-470 PUBLIC HIGHWAY AUTHORITY
Management’s Discussion and Analysis
December 31, 2015 and 2014
(Unaudited)
8 | P a g e
Summary of Revenue, Expenses, and Changes in Net Position2015 2014 2013
Operating revenues $ 181,909,495 156,871,823 133,739,697 Operating expenses before depreciation (41,386,029) (35,693,280) (32,858,448) Depreciation (35,426,200) (34,106,187) (33,683,646)
Operating income 105,097,266 87,072,356 67,197,603 Nonoperating revenues (expenses):
Vehicle registration fees 10,095,783 9,732,693 9,367,238 Interest expenses (99,060,982) (99,674,362) (100,078,345) Investment revenues (expenses) 1,303,805 (10,712,005) 18,815,030 Other income (loss) (704,505) 2,698,592 2,209,400
Total nonoperating expenses (88,365,899) (97,955,082) (69,686,677)
Loss before intergovernmental expense 16,731,367 (10,882,726) (2,489,074)
Intergovernmental expense — — (3,207,700)
Change in net position 16,731,367 (10,882,726) (5,696,774) Net position, beginning of year (552,622,768) (541,740,042) (536,043,268)
Net position, end of year $ (535,891,401) (552,622,768) (541,740,042)
Operating revenues (which include tolls, other toll-related fees, and tolling services revenues) in 2015 and 2014 were $181.9 million and $156.9 million, respectively, an increase of 16% over 2014. Operating expenses before depreciation increased by $5.7 million to $41.4 million in 2015. Depreciation expense remained consistent with prior year. Overall, operating income increased by $18.0 million from 2014 to $105.1 million. Total net nonoperating expenses decreased by $9.6 million to $88.4 million in 2015, which was attributed to changes in interest rates and the corresponding effect on the change in fair value of derivative instruments and investments of $11.9 million. The overall increase in net position was $16.7 million in 2015, which is $27.6 million more than the decrease in net position of $10.9 million in 2014.
Operating revenues in 2014 and 2013 were $156.9 million and $133.7 million, respectively, for an increase of 17% over 2013. Operating expenses before depreciation increased by $2.8 million to $35.7 million in 2014. Depreciation expense in 2014 remained consistent with 2013. Overall, operating income increased by $19.9 million from 2013 to $87.1 million. Total net nonoperating expenses increased by $28.3 million to $98.0 million in 2014, which was attributed to changes in interest rates and the corresponding effect on the change in fair value of derivative instruments and investments of $29.5 million. The overall decrease in net position was $10.9 million in 2014, which was $5.2 million more than the decrease in net position of $5.7 million in 2013.

E-470 PUBLIC HIGHWAY AUTHORITY
Management’s Discussion and Analysis
December 31, 2015 and 2014
(Unaudited)
9 | P a g e
Operating and nonoperating revenues included in the chart above for 2015, 2014, and 2013 were $197.0 million, $174.9 million, and $150.9 million, respectively.
$0
$20,000,000
$40,000,000
$60,000,000
$80,000,000
$100,000,000
$120,000,000
$140,000,000
$160,000,000
$180,000,000
$200,000,000
2013 2014 2015
Total Operating and Nonoperating Revenues
Other Income
InvestmentInterest Earnings
VehicleRegistration Fees
Tolling ServicesRevenue
Other FeesRevenue
Toll Revenue

E-470 PUBLIC HIGHWAY AUTHORITY
Management’s Discussion and Analysis
December 31, 2015 and 2014
(Unaudited)
10 | P a g e
Total operating expenses, before depreciation and including nonoperating interest expense on bonds and interest rate swaps for 2015 and 2014, were $63.9 million and $61.5 million, respectively. Toll road operations expenses increased by $5.6 million to $32.0 million in 2015 versus $26.4 million in 2014. The increase is primarily due to higher toll collection costs from the 12% increase in E-470 toll transaction volume in 2015, coupled with more toll transactions incurred on other Colorado toll facilities. These increased costs include call center labor, image processing, printing and postage, registered vehicle owner information retrieval, and credit card fees. Nonoperating interest expenses on bonds and swaps decreased from $25.8 million in 2014 to $22.5 million in 2015 due to the 2015 bond transaction, which included a cash contribution to partially pay off callable debt and refund the remaining portion at a lower interest rate.
Total operating expenses, before depreciation and including nonoperating interest expense on bonds and interest rate swaps for 2014 and 2013, were $61.5 million and $60.6 million, respectively. Toll road operations expenses increased by $1.5 million to $26.4 million in 2014 versus $24.9 million in 2013. The increase is primarily due to higher toll collection costs from the 14% increase in toll transaction volume in 2014. These increased costs include call center labor, image processing, printing and postage, registered vehicle owner information retrieval, and credit card fees. Nonoperating interest expenses on bonds and swaps decreased from $27.8 million in 2013 to $25.8 million in 2014 due to improved interest rates on the debt refunded during 2014.
$0
$10,000,000
$20,000,000
$30,000,000
$40,000,000
$50,000,000
$60,000,000
$70,000,000
2013 2014 2015
Total Operating and Interest on Bonds & Swaps Expenses
InterestExpense onBonds &SwapsGeneral &Administrative
Salaries andBenefits
Toll RoadOperations

E-470 PUBLIC HIGHWAY AUTHORITY
Management’s Discussion and Analysis
December 31, 2015 and 2014
(Unaudited)
11 | P a g e
Capital Assets and Debt Service
Total capital assets (gross) including construction in progress increased slightly from $1,090 million in 2014 to $1,098 million in 2015. Accumulated depreciation reduced the year-end capital asset balances to $591.5 million in 2015 and $617.9 million in 2014. During 2015, the Authority expended approximately $9.0 million on capital projects, and successfully completed capital projects totaling $11.4 million, which were closed from construction in progress to their respective capital asset accounts. The major projects completed include the headquarters facility buildout, new data storage hardware, and various enhancements to the Authority’s toll collection system. During 2014, the Authority expended approximately $12.3 million on capital projects, and successfully completed capital projects totaling $9.1 million, which were closed from construction in progress to their respective capital asset accounts. The major projects completed include the Quebec Street interchange and various enhancements to the Authority’s toll collection system. During 2013, the Authority expended approximately $4.3 million on capital projects, and successfully completed capital projects totaling $5.6 million, which were closed from construction in progress to their respective capital asset accounts. The major projects include the completion of the deer fence along a five-mile stretch of the toll road and various enhancements to the Authority’s toll collection system.
In 2015, principal and interest paid on Senior Bond debt from restricted debt service totaling $91.1 million consisted of $39.8 million in Series 1997 bonds, $1.1 million in Series 2004 bonds, $6.0 million in Series 2006 bonds, $34.0 million in Series 2007 bonds, $4.4 million in Series 2010 bonds, $0.9 million in Series 2014 bonds, and $4.9 million on the three remaining interest rate swaps settlement differential. The Authority also paid approximately $2.5 million on the Series 2009 VRF bonds from the restricted VRF account.
In 2014, principal and interest paid on Senior Bond debt from restricted debt service totaling $83.6 million consisted of $55.3 million in Series 1997 bonds, $1.1 million in Series 2004 bonds, $3.8 million in Series 2006 bonds, $12.4 million in Series 2007 bonds, $4.4 million in Series 2010 bonds, $0.5 million in Series 2011 bonds, $0.7 million in Series 2014 bonds, and $5.4 million on the three remaining interest rate swaps settlement differential. The Authority also paid approximately $2.5 million on the Series 2009 VRF bonds from the restricted VRF account.
In 2013, principal and interest paid on Senior Bond debt from restricted debt service totaling $81.7 million consisted of $54.4 million in Series 1997 bonds, $1.1 million in Series 2004 bonds, $1.2 million in Series 2006 bonds, $14.8 million in Series 2007 bonds, $4.4 million in Series 2010 bonds, $2.1 million in Series 2011 bonds, and $3.7 million on the four interest rate swaps settlement differential. The Authority also paid approximately $2.5 million on the Series 2009 VRF bonds from the restricted VRF account.

E-470 PUBLIC HIGHWAY AUTHORITY
Management’s Discussion and Analysis
December 31, 2015 and 2014
(Unaudited)
12 | P a g e
Debt Administration
Bonds payable includes current interest bonds (CIB), capital appreciation bonds (CAB), VRF bonds, and SIFMA index bonds, consisting of both new issue and refunded bonds of the Authority.
E-470 Revenue Bonds Outstanding Principal
2015 2014 2013
Series 1997 A Current Interest $ — — 14,700,000 Series 1997 B Capital Appreciation 367,623,398 386,659,765 404,735,907 Series 2000 B Capital Appreciation 405,140,665 380,852,358 358,018,844 Series 2004 A Capital Appreciation 137,630,339 130,489,355 123,718,818 Series 2004 B Capital Appreciation 131,162,301 124,014,539 117,256,341 Series 2004 C Converted Current Interest 22,065,000 22,065,000 22,065,000 Series 2006 A Current Interest 16,470,000 21,445,000 24,105,000 Series 2006 B Capital Appreciation 90,621,462 86,193,890 81,982,664 Series 2007 A-1 Current Interest 12,850,000 49,150,000 49,300,000 Series 2007 B-1 Current Interest 12,850,000 49,150,000 49,300,000 Series 2007 C-1 Current Interest 12,850,000 49,150,000 49,300,000 Series 2007 D-1 Current Interest 12,855,000 49,110,000 49,300,000 Series 2007 CD-2 SIFMA Index 66,075,000 66,075,000 66,075,000 Vehicle Registration Fee 2009 Current Interest 5,930,000 8,090,000 10,175,000 Series 2010 A Capital Appreciation 31,372,956 29,254,057 27,278,365 Series 2010 C Current Interest 81,655,000 81,655,000 81,655,000 Series 2011 A SIFMA Index — — 72,565,000 Series 2014 A SIFMA Index 72,565,000 72,565,000 — Series 2015 A Current Interest 41,550,000 — — Premiums, net of discounts 4,755,487 2,240,327 2,834,750
Total $ 1,526,021,608 1,608,159,291 1,604,365,689
The Authority actively manages its debt based on the current debt profile and market opportunities as they relate to the overall operating condition of the Authority. Below is a summary of the more significant debt management activities during the past three years:
• In June 2015, the Authority successfully closed the 2015 bond transaction, which included a cash contribution to partially pay off callable debt and refund the remaining portion. The Authority had a call opportunity for a portion (at par value) of the Subseries 2007A-1 bonds ($30.7 million), 2007B-1 bonds ($30.7 million), 2007C-1 bonds ($30.7 million), and 2007D-1 bonds ($30.7 million) totaling approximately $122.8 million in term bonds with original maturities between 2019 and 2024. The Authority, as part of its debt management plan, contributed approximately $78 million in cash from the unrestricted Senior Bonds Defeasance Fund of the General Surplus account to cash defease a significant portion of the callable debt, and refunded the remaining portion at a par amount of $41.5 million (not including the bond premium) with new maturities between 2016 and 2020. The transaction partially alleviated the increasing debt service over the next several years and set up the Authority with opportunities in the next five years to achieve level annual debt service, a significant goal in the debt management plan. The 2007 term bonds were callable on

E-470 PUBLIC HIGHWAY AUTHORITY
Management’s Discussion and Analysis
December 31, 2015 and 2014
(Unaudited)
13 | P a g e
September 1, 2015, but the Authority used the opportunity to price and close the refunded bonds in June due to favorable market conditions with an escrow account to make the necessary payments on September 1, 2015. Also, as the callable bonds were linked to the Authority’s outstanding interest rate swaps, the Authority fully terminated the Morgan Stanley 2008 SIFMA interest rate swap (MS-3) and partially terminated the 2007 London Interbank Offered Rate (LIBOR) interest rate swaps with Morgan Stanley (MS-1) and JP Morgan (JP-1) for a net termination payment of $3.8 million from the unrestricted Senior Bonds Defeasance Fund. These terminations unwound the swap notional amounts originally related to the callable bonds.
• In March 2014, the Authority successfully refunded the Series 2011A SIFMA Index Term Rate bonds totaling $72.6 million with the Series 2014A SIFMA Index Term Rate bonds. The Series 2014A bonds are subject to optional redemption on or after March 1, 2017 with a mandatory tender and remarketing date of September 1, 2017. The Authority pays interest on the bonds each month based on the previous month’s final SIFMA market pricing plus 118 basis points (1.18%). Portions of the Authority’s two 2007 pay-fixed interest rate swaps, which are based on 67% of the LIBOR, have outstanding notional amounts from 2026 to 2039 related to the outstanding Series 2014A bond maturities during the same period; thus, the Authority takes on basis risk between SIFMA and LIBOR as long as the Series 2014A bonds are outstanding. However, the swap relationship did not meet the requirements of a hedging derivative instrument and continued to be recorded as an investment derivative as of December 31, 2015 and 2014.
• In September 2013, the Authority successfully remarketed the remaining portions of the Series 2007C-2 and 2007D-2 fixed-rate term bonds totaling $66.1 million as the Series 2007CD-2 SIFMA Index term rate bonds. For accounting purposes, the transaction was treated as a bond refunding in 2013. The Series 2007CD-2 bonds are subject to optional redemption on or after March 1, 2017 with a mandatory tender and remarketing date of September 1, 2017. The Authority pays interest on the bonds each month based on the previous month’s final SIFMA market pricing plus 175 basis points (1.75%). Portions of the Authority’s two 2007 pay-fixed interest rate swaps, which are based on 67% of LIBOR, have outstanding notional amounts from 2026 to 2039 related to the outstanding Series 2007CD-2 bond maturities during the same period; thus, the Authority takes on basis risk between SIFMA and LIBOR as long as the Series 2007CD-2 bonds are outstanding. However, the swap relationship did not meet the requirements of a hedging derivative instrument and continued to be recorded as an investment derivative as of December 31, 2015 and 2014.
• The provisions of GASB Statement No. 53, Accounting and Financial Reporting for Derivative Instruments, are applicable to the Authority due to the two remaining 2007 pay-fixed interest rate swaps. The Authority fully terminated the 2008 offsetting receive-fixed interest rate swap and partially terminated the two 2007 pay-fixed interest rate swaps in June 2015. The notional amounts on the remaining 2007 swaps in total correspond with specific maturities of the Series 2007, 2010, and 2014 bonds. The swaps were determined to be investment derivatives as of December 31, 2015 and 2014 with a net liability fair value of $51.7 million and $53.8 million, respectively, and derivative instruments investment loss of $1.7 million in 2015 (when including the net swap termination payment) and loss of $20.0 million in 2014.

E-470 PUBLIC HIGHWAY AUTHORITY
Management’s Discussion and Analysis
December 31, 2015 and 2014
(Unaudited)
14 | P a g e
As of December 31, 2015, and related to the refunding transaction in June 2015, the underlying senior bond ratings were upgraded by all three major credit rating agencies from 2014 due to continued financial strength, positive traffic and revenue trends, liquidity, and taking a significant step in the debt management plan toward leveling the annual debt service. All three rating agencies upgraded the Authority one notch within their respective rating scales, and all affirmed a stable outlook for the Authority.
Ratings and outlook as of December 31, 2015:
Rating Outlook
Rating agency:Moody’s Baa1 StableStandard and Poor’s BBB+ StableFitch BBB Stable
Notes Payable
The Authority entered into an intergovernmental agreement with Douglas County in 2003 to receive contributed funds for costs of the Jamaica Road interchange ramp construction. Based on this agreement, the remaining contributed funds as of 2008 of $2.4 million are to be repaid in 10 equal payments (noninterest-bearing) beginning in 2011. The annual payment of $0.24 million is made from unrestricted funds.
2015 2014 2013
Local member jurisdiction (Douglas County) $ 1,203,846 1,444,616 1,685,385

E-470 PUBLIC HIGHWAY AUTHORITY
Management’s Discussion and Analysis
December 31, 2015 and 2014
(Unaudited)
15 | P a g e
Economic Factors
Estimates by the Authority’s traffic and revenue consultant are shown against actual toll revenue, net of uncollectible amounts for the fiscal years ended 2015, 2014, and 2013 in the following tables. The Authority has engaged a traffic and revenue consultant to conduct investment-grade traffic and revenue studies and updated reviews over the years based on current economic conditions of surrounding areas and bond refunding transactions. In 2014, the Authority completed a full investment grade traffic and revenue study. The previous full traffic and revenue study was completed in 2008. The 2014 study contains refined future forecasts by considering historical growth, current economic conditions, future transportation forecasts, and development plans for the Authority, local jurisdictions, and the State in the surrounding area. The toll forecasts may differ from the Authority’s budget, and only includes the toll revenue, net of estimated bad debts, and excludes the Authority’s other toll-related fees that are included in operating revenues during the period. The 2013 traffic and toll revenue forecast was obtained from the updated letter dated July 2013. The 2014 and 2015 forecasts are from the 2014 study.
Transactions (Annual Total) Total Percentage
Year ExpressToll LPT Traffic Forecast Variance variance2015 50,301,725 24,307,322 74,609,047 70,787,000 3,822,047 5.402014 45,112,841 21,252,197 66,365,038 65,520,000 845,038 1.292013 41,108,598 17,294,134 58,402,732 56,791,000 1,611,732 2.84
Toll Revenues, Net (Annual Total) Total Percentage
Year ExpressToll LPT Toll Revenue Forecast Variance variance2015 123,109,780$ 49,929,732 173,039,512 165,751,000 7,288,512 4.402014 107,474,418 42,930,094 150,404,512 150,433,000 (28,488) (0.02)2013 93,203,452 35,978,466 129,181,918 127,125,000 2,056,918 1.62

E-470 PUBLIC HIGHWAY AUTHORITY
Management’s Discussion and Analysis
December 31, 2015 and 2014
(Unaudited)
16 | P a g e
Budget Results
The Authority is required under state law and board resolutions to prepare an annual budget of operating and capital outlays as well as debt service due in the upcoming year. The annual budget is approved by the Authority’s board of directors before the budget (calendar) year begins. Appropriations generally do not carry over to future periods, and overall net outlay overages, or budget amendments, require additional approval by the board. The original approved budget by the board is generally considered the final budget. The budget is recorded on the Authority’s budget basis and conforms to the Bond Resolutions Revenue Covenant calculation. Refer to the Supplementary Information – Revenue Covenant section for reconciliation to the basic financial statements for operating balances and senior debt service due. Further, toll revenue amounts budgeted by management may differ from the traffic and revenue consultant’s forecasts.
010,000,00020,000,00030,000,00040,000,00050,000,00060,000,00070,000,00080,000,00090,000,000
100,000,000110,000,000120,000,000130,000,000140,000,000150,000,000160,000,000170,000,000180,000,000
Budget Forecast Actual
Operating Revenues - Tolls
2013
2014
2015

E-470 PUBLIC HIGHWAY AUTHORITY
Management’s Discussion and Analysis
December 31, 2015 and 2014
(Unaudited)
17 | P a g e
The following is a summary of the Authority’s 2015 operating budget compared to the actual results, as well as the capital budget compared to the actual results as of and for the year ended December 31, 2015:
2015 Budget 2015 Results VariancePercentage
variance
Total operating revenues $ 189,767,100 200,036,176 10,269,076 5.4%Total operating expenses (41,296,800) (37,925,250) 3,371,550 -8.2%
Net operating income 148,470,300 162,110,926 13,640,626 9.2%
Senior debt service due 91,309,100 91,119,525 (189,575) -0.2%
Debt service coverage ratio 1.63 1.78 0.15 9.2%
Capital & renewal and replacement costs $ (28,557,700) (14,162,982) 14,394,718 -50.4%
During 2015, the original budget was the final approved budget and total budgeted operating revenues ended $10.3 million, or 5% over budget. This is primarily due to net toll revenues and toll fees ending over budget by $7.3 million and $1.8 million, respectively, from the higher than budgeted traffic during the year. Total operating expenses ended $3.4 million, or 8% under budget, which is mainly attributable to certain operating costs originally budgeted for 2015 being moved to 2016 to accompany the ongoing efforts of system development for CDOT’s new tolled facilities. Senior debt service due was on budget and does not include VRF debt service as the annual Series 2009 bonds debt service was paid from the restricted VRF account and is excluded from the debt service coverage ratio. These final budget results led to a debt service coverage ratio of 1.78, which is over the original budgeted ratio of 1.63 for 2015.
Capital and renewal and replacement costs, which are excluded from the debt service coverage ratio as specified in the Bond Resolutions and fully paid from unrestricted funds, were $14.4 million, or 50% under budget. This is due to overall capital projects coming in under budget for items such as roadway and facility maintenance, technology upgrades and enhancements, and construction projects such as the Sandy Acres lake infill, which was delayed due to wet conditions during the spring of 2015 and will be completed in late spring 2016. In addition, $4.0 million was originally budgeted in 2015 for a contribution toward the 6th Parkway expansion with the City of Aurora, but this amount was not expended due to Aurora timing and funding needs.

E-470 PUBLIC HIGHWAY AUTHORITY
Management’s Discussion and Analysis
December 31, 2015 and 2014
(Unaudited)
18 | P a g e
The following is a summary of the Authority’s 2014 operating budget compared to the actual results, as well as the capital budget compared to the actual results as of and for the year ended December 31, 2014:
2014 Budget 2014 Results VariancePercentage
variance
Total operating revenues $ 160,477,000 175,569,001 15,092,001 9.4%Total operating expenses (34,329,100) (32,976,647) 1,352,453 -3.9%
Net operating income 126,147,900 142,592,354 16,444,454 13.0%
Senior debt service due 85,019,100 83,630,014 (1,389,086) -1.6%
Debt service coverage ratio 1.48 1.71 0.23 15.5%
Capital & renewal and replacement costs $ (26,148,100) (17,757,713) 8,390,387 -32.1%
During 2014, the original budget was the final approved budget and total budgeted operating revenues ended $15.1 million, or 9% over budget. This is primarily due to net toll revenues and toll fees ending over budget by $11.6 million and $1.3 million, respectively, from the higher than budgeted traffic during the year. Total operating expenses ended $1.4 million, or 4% under budget, which is mainly attributable to certain information technology noncritical projects originally budgeted for 2014 being moved to 2015 to accompany the ongoing efforts of system development for CDOT’s new tolled facilities. Senior debt service due was under budget by $1.4 million due to savings on the 2014 bond refunding transaction, and does not include VRF debt service as the annual Series 2009 bonds debt service was paid from the restricted VRF account and is excluded from the debt service coverage ratio. These final budget results led to a debt service coverage ratio of 1.71, which is over the original budgeted ratio of 1.48 for 2014.
Capital and renewal and replacement costs, which are excluded from the debt service coverage ratio as specified in the Bond Resolutions and fully paid from unrestricted funds, were $8.4 million, or 32% under budget. This is due to overall capital projects coming in under budget for items such as roadway and facility maintenance, technology upgrades and enhancements, and construction projects such as the Quebec interchange, which was completed in 2014 and under budget by $1.9 million.
Reserves Management
Pursuant to the Bond Resolutions, the Authority is required to maintain reserve accounts including the Senior Bonds Debt Service Reserve Fund and an Operating Reserve Fund. In addition, a General Surplus account is maintained in accordance with the Bond Resolutions. The General Surplus account is unrestricted and is currently divided into three subaccount funds for administrative purposes: the Senior Bonds Defeasance Fund, the Capital Improvements Fund, and the Rainy Day Fund. At December 31, 2015 and 2014, all required and restricted reserves were fully funded as specified by the Bond Resolutions.

E-470 PUBLIC HIGHWAY AUTHORITY
Management’s Discussion and Analysis
December 31, 2015 and 2014
(Unaudited)
19 | P a g e
Tolling Services Agreements
The Authority has entered into a tolling services agreement with HPTE, a tolling services agreement with HPTE and its concessionaire Plenary for tolled facilities on US-36 and I-25 Central, as well as agreements with NWP and its underlying public highway authority to provide certain electronic toll collection back office services. Back office services occur after toll commencement on each toll facility and include major items such as maintenance of the toll system and website, toll billing and collections, license plate image review, and the customer service center. These agreements provide economies of scale for toll collection costs and seamless interoperability for customers on Colorado toll facilities, allowing them to maintain and manage one toll account. As part of the agreements, the Authority collects electronic tolls for the other tolling facilities and transfers the funds daily to NWP (ExpressToll only) and to HPTE/Plenary (ExpressToll and LPT) for transactions that occurred and were collected on their toll facilities. The tolls collected and remitted on behalf of other entities are not included in the basic financial statements of the Authority. Costs incurred are recovered by tolling services revenues charged to NWP, HPTE, and Plenary for their share of toll collection costs that are included in operating expenses on the statement of revenues, expenses, and changes in net position. These revenues totaled $2.3 million and $1.2 million in 2015 and 2014, respectively.
Future Management Plans
During 2016, the Authority will begin construction on the significant multi-year roadway widening project from Parker Road to Quincy Avenue to expand E-470 from two lanes to three lanes in each direction. The Authority budgeted $44.9 million in 2016 and $42.4 million in 2017, and estimate that the total $87.3 million project will be completed by the end of 2017 along the eight miles of roadway. The Capital Improvements Fund of the General Surplus account will be used to fund this project, and is included in the Authority’s five-year capital budget program. Regarding debt management, on September 1, 2016 the Authority has the ability to call approximately $11.2 million of the remaining and outstanding 2006A Bonds. The Authority plans to cash defease the entire $11.2 million from the unrestricted Senior Bonds Defeasance Fund of the General Surplus account on the date of the call to further help the Authority achieve its debt management goal of level annual debt service within the next five years. Further, the Authority will continue to provide back office services on other tolled facilities in the State of Colorado by NWP, HPTE (I-70 MEXL), and Plenary (US36 and I-25 Central). Other future toll facilities scheduled to become operational in 2016 include phase two of US36 by Plenary and I-25 North Segment 2 by HPTE extending the current managed lane from US36 to 120th Avenue. The Authority will continue to provide services to these new facilities including integration and installation of toll equipment, toll collection system enhancements and modifications, system testing, analysis and go live support, and begin back office toll collection services when tolling commences.
Contacting E-470’s Financial Management
This financial report is designed to provide overview information to the Authority’s bondholders, customers, and other interested parties. Should you have any questions about this report, contact the E-470 Public Highway Authority’s Director of Finance at 22470 E. 6th Parkway, Suite 100, Aurora, Colorado 80018.

20 | P a g e
Independent Auditors’ Report
The Board of Directors E-470 Public Highway Authority:
We have audited the accompanying financial statements of the business-type activities of the E-470 Public Highway Authority (the Authority) as of and for the years ended December 31, 2015 and 2014, and the related notes to the financial statements, which collectively comprise the Authority’s basic financial statements as listed in the table of contents.
Management’s Responsibility for the Financial Statements
Management is responsible for the preparation and fair presentation of these financial statements in accordance with U.S. generally accepted accounting principles; this includes the design, implementation, and maintenance of internal control relevant to the preparation and fair presentation of financial statements that are free from material misstatement, whether due to fraud or error.
Auditors’ Responsibility
Our responsibility is to express an opinion on these financial statements based on our audits. We conducted our audits in accordance with auditing standards generally accepted in the United States of America. Those standards require that we plan and perform the audits to obtain reasonable assurance about whether the financial statements are free from material misstatement.
An audit involves performing procedures to obtain audit evidence about the amounts and disclosures in the financial statements. The procedures selected depend on the auditors’ judgment, including the assessment of the risks of material misstatement of the financial statements, whether due to fraud or error. In making those risk assessments, the auditor considers internal control relevant to the entity’s preparation and fair presentation of the financial statements in order to design audit procedures that are appropriate in the circumstances, but not for the purpose of expressing an opinion on the effectiveness of the entity’s internal control. Accordingly, we express no such opinion. An audit also includes evaluating the appropriateness of accounting policies used and the reasonableness of significant accounting estimates made by management, as well as evaluating the overall presentation of the financial statements.
We believe that the audit evidence we have obtained is sufficient and appropriate to provide a basis for our audit opinion.
Opinion
In our opinion, the financial statements referred to above present fairly, in all material respects, the financial position of the business-type activities of the E-470 Public Highway Authority as of December 31, 2015 and 2014, and the changes in financial position, and cash flows thereof for the years then ended, in accordance with U.S. generally accepted accounting principles.
KPMG LLP Suite 800 1225 17th Street Denver, CO 80202-5598
KPMG LLP is a Delaware limited liability partnership, the U.S. member firm of KPMG International Cooperative (“KPMG International”), a Swiss entity.

♣
21 | P a g e
Other Matters
Required Supplementary Information
U.S. generally accepted accounting principles require that the management’s discussion and analysis on pages 2 through 19 be presented to supplement the basic financial statements. Such information, although not a part of the basic financial statements, is required by the Governmental Accounting Standards Board who considers it to be an essential part of financial reporting for placing the basic financial statements in an appropriate operational, economic, or historical context. We have applied certain limited procedures to the required supplementary information in accordance with auditing standards generally accepted in the United States of America, which consisted of inquiries of management about the methods of preparing the information and comparing the information for consistency with management’s responses to our inquiries, the basic financial statements, and other knowledge we obtained during our audit of the basic financial statements. We do not express an opinion or provide any assurance on the information because the limited procedures do not provide us with sufficient evidence to express an opinion or provide any assurance.
Supplementary and Other Information
Our audit was conducted for the purpose of forming an opinion on the financial statements that collectively comprise the Authority’s basic financial statements. The accompanying supplementary information relating to the revenue covenant is presented for purposes of additional analysis and is not a required part of the basic financial statements. The accompanying supplementary information relating to the revenue covenant has not been subjected to the auditing procedures applied in the audit of the basic financial statements, and accordingly, we do not express an opinion or provide any assurance on it.
Denver, Colorado April 13, 2016

E-470 PUBLIC HIGHWAY AUTHORITY
Basic Financial Statements as of December 31, 2015 and 2014

22 | P a g e
E-470 PUBLIC HIGHWAY AUTHORITYStatements of Net Position
December 31, 2015 and 2014
2015 2014
ASSETS
Current unrestricted assets:Cash and cash equivalents $ 60,343,087 32,387,010 Investments 75,470,163 131,141,717 Cash and cash equivalents limited for construction 3,207,700 3,207,700 Accrued interest receivable 1,645,566 2,029,409 Accounts receivable, net of allowance for uncollectibles 20,698,507 18,890,152 Derivative instruments – interest rate swaps — 295,119 Prepaid expenses and other current assets 250,433 2,000
Total current unrestricted assets 161,615,456 187,953,107
Current restricted assets:Cash and cash equivalents for debt service 38,020,161 35,945,427 Investments for debt service 19,105,006 19,661,804 Accrued interest receivable 73,587 18,178 Cash and cash equivalents for construction 300,115 300,097
Total current restricted assets 57,498,869 55,925,506
Total current assets 219,114,325 243,878,613
Noncurrent assets:Unrestricted investments 49,243,389 48,358,747 Restricted investments for debt service 104,050,946 106,436,824 Prepaid bond costs and other noncurrent assets 16,608,374 19,022,389 Derivative instruments – interest rate swaps — 13,996,630 Capital assets, net of accumulated depreciation 591,458,677 617,894,782
Total noncurrent assets 761,361,386 805,709,372
Total assets 980,475,711 1,049,587,985
DEFERRED OUTFLOWS OF RESOURCESLoss on refundings of debt 98,594,860 107,600,113
Total assets and deferred outflows of resources $ 1,079,070,571 1,157,188,098
See accompanying notes to basic financial statements.

23| P a g e
E-470 PUBLIC HIGHWAY AUTHORITYStatements of Net Position
December 31, 2015 and 2014
2015 2014
LIABILITIES
Current liabilities payable from unrestricted assets:Accounts payable and accrued expenses $ 5,548,555 4,181,285 Unearned toll revenue 20,164,139 15,733,853 Notes payable 240,769 240,769 Derivative instruments – interest rate swaps 393,181 745,933
Total current liabilities payable from unrestricted assets 26,346,644 20,901,840
Current liabilities payable from restricted assets:Bonds payable (including accumulated accretion on capital appreciation
bonds of $28,621,824 in 2015 and $24,553,515 in 2014) 80,960,000 69,235,000 Accrued interest payable 4,608,458 6,434,135
Total current liabilities payable from restricted assets 85,568,458 75,669,135
Total current liabilities 111,915,102 96,570,975
Noncurrent liabilities:Bonds payable (including accumulated accretion on capital appreciation
bonds of $618,783,372 in 2015 and $581,523,039 in 2014) 1,445,061,608 1,538,924,291 Notes payable 963,077 1,203,847 Other restricted noncurrent liabilities 2,544,858 2,548,308 Intergovernmental liability 3,207,700 3,207,700 Derivative instruments – interest rate swaps 51,269,627 67,355,745
Total noncurrent liabilities 1,503,046,870 1,613,239,891
Total liabilities 1,614,961,972 1,709,810,866
NET POSITIONNet investment in capital assets (70,707,875) (153,985,603) Restricted for debt service 23,007,951 23,563,112 Unrestricted deficit (488,191,477) (422,200,277)
Total net position (535,891,401) (552,622,768) Commitments and contingencies (notes 7, 8, 11, 12, 13, and 14)
Total liabilities and net position $ 1,079,070,571 1,157,188,098
See accompanying notes to basic financial statements.

24 | P a g e
E-470 PUBLIC HIGHWAY AUTHORITYStatements of Revenues, Expenses, and Changes in Net Position
Years ended December 31, 2015 and 2014
2015 2014
Operating revenues:Tolls $ 173,039,512 150,404,512 Other fees 6,528,828 5,300,362 Tolling services 2,341,155 1,166,949
Total operating revenues 181,909,495 156,871,823
Operating expenses:Toll road operations 32,005,157 26,363,580 Salaries and benefits 7,041,501 6,213,971 General and administrative 2,339,371 3,115,729
Total operating expenses before depreciation 41,386,029 35,693,280
Depreciation 35,426,200 34,106,187
Total operating expenses 76,812,229 69,799,467
Operating income 105,097,266 87,072,356
Nonoperating revenue (expenses):Vehicle registration fees 10,095,783 9,732,693 Interest expenses:
Interest on bonds and interest rate swaps (22,546,247) (25,825,858) Accretion on capital appreciation bonds (65,882,157) (64,268,026) Other bond amortization expenses (10,632,578) (9,580,478)
Investment revenues (expenses):Interest earned on investments 5,720,817 5,566,417 Net change in the fair value of investments (2,731,384) 3,756,207 Net change in the fair value of derivative instruments (1,685,628) (20,034,629)
Other income (loss) (704,505) 2,698,592
Total nonoperating expenses (88,365,899) (97,955,082)
Change in net position 16,731,367 (10,882,726)
Net position, beginning of year (552,622,768) (541,740,042)
Net position, end of year $ (535,891,401) (552,622,768)
See accompanying notes to basic financial statements.

25 | P a g e
E-470 PUBLIC HIGHWAY AUTHORITY
Statements of Cash Flows
Years ended December 31, 2015 and 2014
2015 2014
Cash flows from operating activities:Receipts of Authority vehicle tolls and toll fees $ 181,771,849 155,206,525 Receipts from third parties for tolling services 2,003,120 1,015,784 Payments to employees (6,960,983) (6,122,719) Payments to suppliers (33,334,549) (29,067,326)
Net cash provided by operating activities 143,479,437 121,032,264
Cash flows from capital and related financing activities:Change in other restricted noncurrent liabilities — (179,653) Payment of notes payable (240,770) (240,769) Purchase and construction of capital assets (8,994,457) (12,346,589) Receipts from third parties for capital assets 1,479,372 104,411 Proceeds from sale of capital assets 30,825 30,235 Interest paid (24,371,924) (26,235,391) Principal payments on bonds (69,235,000) (59,880,000) Payment of cash from bond proceeds to refund related bond series (44,850,000) (72,565,000) Proceeds from refunded bond series 45,631,237 72,565,000 Payment of unrestricted cash to defease related callable bond series (78,000,000) — Payment of bond issuance costs for related bond series (779,387) (846,553) Payment to terminate portion of interest rate swap agreements (3,832,749) —
Net cash used in capital and related financing activities (183,162,853) (99,594,309)
Cash flows from noncapital financing activities:Receipts of vehicle registration fees 10,094,405 9,666,003 Receipts of non-Authority third party vehicle tolls and toll fees 18,519,151 13,567,593 Remittance to third parties for non-Authority vehicle tolls and toll fees (18,384,645) (13,567,593) Purchases of equipment for third parties (1,313,240) (1,563,578) Receipts from third parties for equipment 1,261,086 1,548,743 Other receipts and disbursements (1,302,423) 2,335,680
Net cash provided by noncapital financing activities 8,874,334 11,986,848
Cash flows from investing activities:Proceeds from sales of investments 204,277,453 110,979,562 Purchases of investments (149,505,327) (161,375,871) Interest received 6,067,785 5,406,567
Net cash provided by (used in) investing activities 60,839,911 (44,989,742)
Net increase (decrease) in cash and cash equivalents 30,030,829 (11,564,939)
Cash and cash equivalents, beginning of year 71,840,234 83,405,173
Cash and cash equivalents, end of year $ 101,871,063 71,840,234
Reconciliation of cash and cash equivalents to the statements of net position:Cash and cash equivalents – current – unrestricted $ 63,550,787 35,594,710 Cash and cash equivalents – current – restricted for debt service 38,020,161 35,945,427 Cash and cash equivalents – current – restricted for construction 300,115 300,097
Cash and cash equivalents, end of year $ 101,871,063 71,840,234
See accompanying notes to basic financial statements.
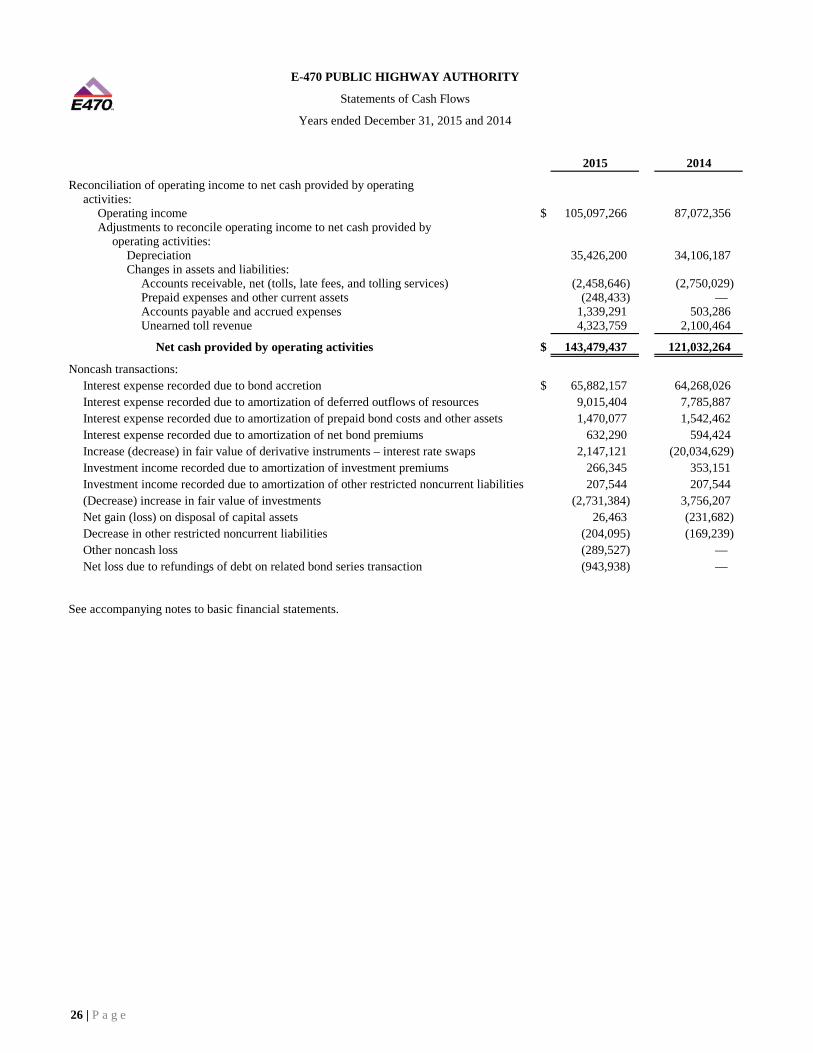
26 | P a g e
E-470 PUBLIC HIGHWAY AUTHORITY
Statements of Cash Flows
Years ended December 31, 2015 and 2014
2015 2014
Reconciliation of operating income to net cash provided by operatingactivities:
Operating income $ 105,097,266 87,072,356 Adjustments to reconcile operating income to net cash provided by
operating activities:Depreciation 35,426,200 34,106,187 Changes in assets and liabilities:
Accounts receivable, net (tolls, late fees, and tolling services) (2,458,646) (2,750,029) Prepaid expenses and other current assets (248,433) — Accounts payable and accrued expenses 1,339,291 503,286 Unearned toll revenue 4,323,759 2,100,464
Net cash provided by operating activities $ 143,479,437 121,032,264
Noncash transactions:Interest expense recorded due to bond accretion $ 65,882,157 64,268,026 Interest expense recorded due to amortization of deferred outflows of resources 9,015,404 7,785,887 Interest expense recorded due to amortization of prepaid bond costs and other assets 1,470,077 1,542,462 Interest expense recorded due to amortization of net bond premiums 632,290 594,424 Increase (decrease) in fair value of derivative instruments – interest rate swaps 2,147,121 (20,034,629) Investment income recorded due to amortization of investment premiums 266,345 353,151 Investment income recorded due to amortization of other restricted noncurrent liabilities 207,544 207,544 (Decrease) increase in fair value of investments (2,731,384) 3,756,207 Net gain (loss) on disposal of capital assets 26,463 (231,682) Decrease in other restricted noncurrent liabilities (204,095) (169,239) Other noncash loss (289,527) — Net loss due to refundings of debt on related bond series transaction (943,938) —
See accompanying notes to basic financial statements.

E-470 PUBLIC HIGHWAY AUTHORITY
Notes to Basic Financial Statements
December 31, 2015 and 2014
27 | P a g e
(1) Financial Reporting Entity
The E-470 Authority (the First Authority) is a separate legal entity, created in February 1985, by an intergovernmental agreement among Adams County, Arapahoe County, Douglas County, and the City of Aurora. The purpose of the agreement was to plan, design, and construct the E-470 Highway (the Project). The First Authority did not have the power to incur debt; therefore, Arapahoe County (the County) issued bonds to finance the Project.
In January 1988, the E-470 Public Highway Authority (the Authority) was created by the original members of the First Authority pursuant to Colorado Revised Statutes Title 43, Article 4, Part 5. The Town of Parker, City of Thornton, City of Brighton, and City of Commerce City became participants in the Authority in 1989, 1990, 1991, and 1995, respectively. In February 1989, all rights, privileges, obligations, and liabilities of the First Authority were assigned to the Authority. In the event the Authority is ever dissolved, all rights, privileges, obligations, and liabilities will transfer back to the First Authority. As required by accounting principles generally accepted in the United States of America, the accompanying basic financial statements present the Authority and its component unit, an entity for which the Authority is considered to be financially accountable, as discussed below. The blended component unit, although a legally separate entity, is, in substance, part of the Authority’s operations, and therefore, data from this component unit are combined with data of the primary government.
The First Authority is a blended component unit of the Authority; however, it currently has no assets, liabilities, or operations.
In an opinion dated May 15, 1995, the Colorado Supreme Court held that the County had relinquished any control it had over the 1986 Bonds and the alignment of the Project in February 1989 when it executed the Delegation and Substitution Agreement and amendments to the Establishing Contract to that effect. Therefore, the Authority is not a component unit of the County.
Intergovernmental Agreements with Arapahoe County, Colorado
Since its creation, the First Authority was not legally empowered to issue debt; therefore, the County authorized issuance of $722,010,000 of Capital Improvement Trust Fund Highway Revenue Bonds Series 1986A-M. The ultimate objective of this issuance was to remit the proceeds to the Authority for the construction of the Project. In the contract establishing the Authority, the County assigned to the Authority all of the County’s rights and privileges with respect to the bonds, and the Authority assumed all of the County’s obligations with respect to the bonds. The proceeds of the bond issue were invested and held in trust for the benefit of the owners of the bonds (until the releases as described below). The bonds were generally remarketed every six months.
In February 1989, the Authority released from escrow the Series D bonds in the amount of $63,260,000 to complete construction on the first phase of the toll road (Segment I). In consideration of the obligations assumed by the Authority and to assist the Project, the County granted to the Authority all the County’s rights to the excess investment earnings for all bond series. In addition, the Authority agreed to pay all bond administration costs with no financial obligation to the County.
E-470 PUBLIC HIGHWAY AUTHORITY
Notes to Basic Financial Statements
December 31, 2015 and 2014
28 | P a g e
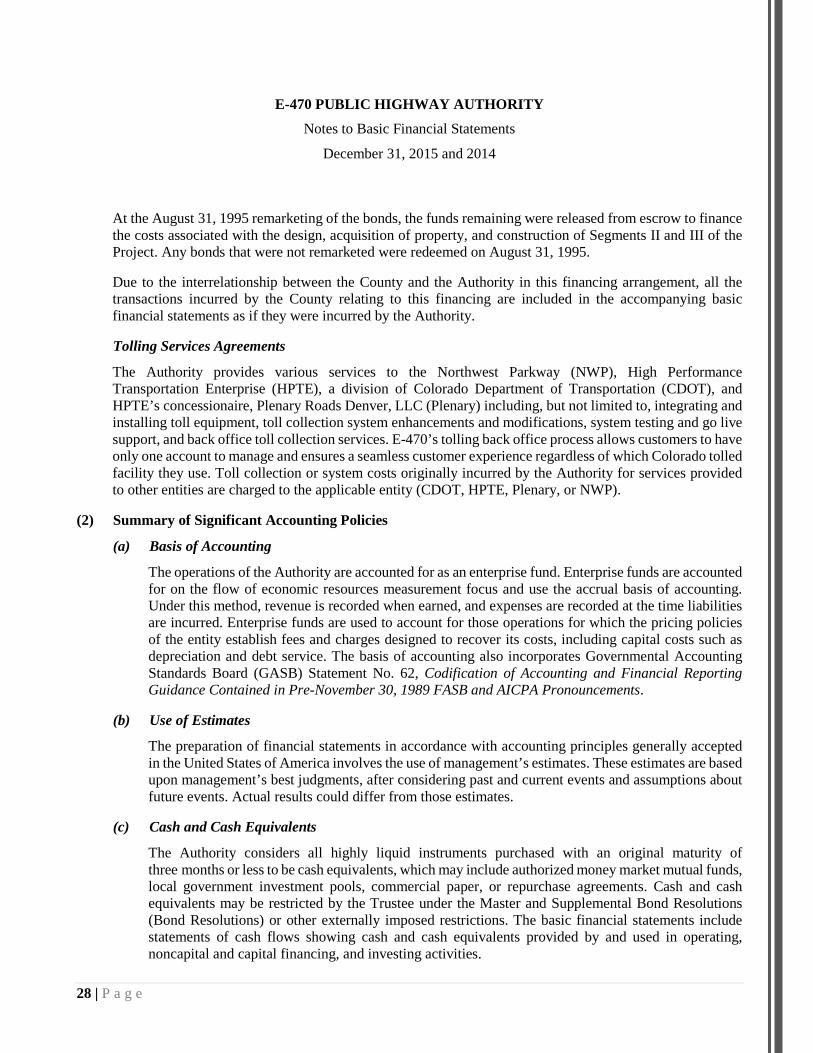
At the August 31, 1995 remarketing of the bonds, the funds remaining were released from escrow to finance the costs associated with the design, acquisition of property, and construction of Segments II and III of the Project. Any bonds that were not remarketed were redeemed on August 31, 1995.
Due to the interrelationship between the County and the Authority in this financing arrangement, all the transactions incurred by the County relating to this financing are included in the accompanying basic financial statements as if they were incurred by the Authority.
Tolling Services Agreements
The Authority provides various services to the Northwest Parkway (NWP), High Performance Transportation Enterprise (HPTE), a division of Colorado Department of Transportation (CDOT), and HPTE’s concessionaire, Plenary Roads Denver, LLC (Plenary) including, but not limited to, integrating and installing toll equipment, toll collection system enhancements and modifications, system testing and go live support, and back office toll collection services. E-470’s tolling back office process allows customers to have only one account to manage and ensures a seamless customer experience regardless of which Colorado tolled facility they use. Toll collection or system costs originally incurred by the Authority for services provided to other entities are charged to the applicable entity (CDOT, HPTE, Plenary, or NWP).
(2) Summary of Significant Accounting Policies
(a) Basis of Accounting
The operations of the Authority are accounted for as an enterprise fund. Enterprise funds are accounted for on the flow of economic resources measurement focus and use the accrual basis of accounting. Under this method, revenue is recorded when earned, and expenses are recorded at the time liabilities are incurred. Enterprise funds are used to account for those operations for which the pricing policies of the entity establish fees and charges designed to recover its costs, including capital costs such as depreciation and debt service. The basis of accounting also incorporates Governmental Accounting Standards Board (GASB) Statement No. 62, Codification of Accounting and Financial Reporting Guidance Contained in Pre-November 30, 1989 FASB and AICPA Pronouncements.
(b) Use of Estimates
The preparation of financial statements in accordance with accounting principles generally accepted in the United States of America involves the use of management’s estimates. These estimates are based upon management’s best judgments, after considering past and current events and assumptions about future events. Actual results could differ from those estimates.
(c) Cash and Cash Equivalents
The Authority considers all highly liquid instruments purchased with an original maturity of three months or less to be cash equivalents, which may include authorized money market mutual funds, local government investment pools, commercial paper, or repurchase agreements. Cash and cash equivalents may be restricted by the Trustee under the Master and Supplemental Bond Resolutions (Bond Resolutions) or other externally imposed restrictions. The basic financial statements include statements of cash flows showing cash and cash equivalents provided by and used in operating, noncapital and capital financing, and investing activities.

E-470 PUBLIC HIGHWAY AUTHORITY
Notes to Basic Financial Statements
December 31, 2015 and 2014
29 | P a g e
(d) Investments
The Authority invests its funds in accordance with the Authority’s Bond Resolutions and Colorado statutes (CRS 24-75-601). The Authority’s authorized investments may consist of U.S. government agency securities, U.S. Treasury securities, commercial paper, municipal bonds, and an investment agreement. The Authority accounts for the U.S. government agency securities, U.S. Treasury securities, municipal bonds, and commercial paper at fair value. Fair value is determined from quotable market prices available at year-end. The investment agreement cannot be traded and, therefore, is reported using a cost-based measurement. Investments may be restricted by the Trustee under the Bond Resolutions.
(e) Accounts Receivable
Accounts receivable represents amounts due for customer tolls (License Plate Toll (LPT) and ExpressToll) and any assessed late fees, net of the estimated uncollectible toll and fee receivables, vehicle registration fees (VRF) collected by specific counties and not yet remitted to the Authority, and other miscellaneous receivables from third parties. The Authority accrues the related revenue when earned. An allowance for estimated uncollectible toll receivables is recognized to reduce the gross amount of receivables to its net realizable value. The allowance for customer tolls is estimated based on historical collection information by revenue type. No allowance is recorded for VRF receivables as the amounts are fully collectible and timely remitted.
(f) Capital Assets
Capital assets have an estimated useful life in excess of one year and an initial cost greater than $5,000 for software, fixtures, and equipment; $50,000 for land improvements; $100,000 for buildings; and $500,000 for infrastructure (roadway, bridges, and ramps).
Capital assets are recorded at historical cost. Costs include not only purchase price or construction cost, but also ancillary charges necessary to place the asset in its intended location and condition for use. Ancillary charges include, but are not limited to, costs such as freight and transportation charges, site preparation expenditures, professional fees, and legal expenses directly attributable to asset acquisition. Donations of capital assets represent facilities, or cash payments for facilities, received from property owners, governmental agencies, and customers. Donated capital assets are recorded at estimated fair value at the date of transfer.
Capital assets are depreciated using the straight-line method over their estimated useful lives. Those capital assets subject to depreciation have the following useful lives:
Assets Years
Software 3 Fixtures and equipment 5–10Land and building improvements 20 Buildings 40 Infrastructure 30

E-470 PUBLIC HIGHWAY AUTHORITY
Notes to Basic Financial Statements
December 31, 2015 and 2014
30 | P a g e
Ongoing construction costs associated with the Authority’s toll road are capitalized as construction in progress (CIP). As construction is not yet complete, depreciation is not recorded on these CIP costs. The Authority capitalizes interest on these assets under construction for interest costs on the tax-exempt debt used to finance the assets (if applicable), reduced by interest earned from investments acquired with the tax-exempt debt proceeds.
(g) Prepaid Bond Costs and Premiums and Discounts
Prepaid bond costs and other noncurrent assets as well as bond premiums and discounts are deferred and amortized as a component of interest expense – other bond amortization expenses using the effective-interest method over the life of the related bonds.
(h) Deferred Outflows of Resources
Deferred outflows of resources represent a consumption of net assets that applies to a future period and will not be recognized as an outflow of resources (expense) until that time. The deferral balances are from losses on refundings of debt that are amortized as a component of interest expense – other bond amortization expenses using the straight-line method over the remaining life of the old (refunded) debt or the life of the new debt, whichever is shorter.
(i) Revenue and Expenses
The Authority’s statements of revenue, expenses, and changes in net position distinguish between operating and nonoperating revenue and expenses. Operating revenues consist of vehicle tolls and other toll-related fees assessed (late fees, civil penalties, or other fines and fees) associated with the operation of the Authority’s toll road, net of estimated bad debts. The Authority recognizes toll operating revenues when earned. Advance payments received for toll operating revenues are deferred as unearned toll revenue on the statements of net position and are recognized as revenue as the customers use the Authority’s toll road. Advance payments used as customers drive on non-Authority facilities in Colorado are remitted to the appropriate agency and are not recognized as revenue on the Authority’s statements of revenues, expenses, and changes in net position. Operating revenues also include revenues for providing tolling services to other entities, and is recognized as an exchange transaction. Any amounts collected and remitted to external entities for tolls incurred on other tolled facilities are not included in the basic financial statements of the Authority. Operating expenses include costs incurred to provide for maintenance and administration of the toll road.
Nonoperating revenue and expenses consist of vehicle registration fees, interest expense, investment revenues, including interest earned on investments and change in derivative instruments, and other miscellaneous revenues and expenses. Vehicle registration fees are assessed by specified local counties and remitted to the Authority on a monthly basis net of related administrative costs.
(j) Net Position Amounts
Net position amounts reported in the Authority’s statements of net position consist of three categories: net investment in capital assets; restricted for debt service; and unrestricted. The Authority’s board of directors, along with any state statutes, has official authorization to assign funds for a specific purpose. Net investment in capital assets consists of the Authority’s investment in capital assets (e.g., land, buildings, equipment, and infrastructure) net of accumulated depreciation, and deferred outflows of

E-470 PUBLIC HIGHWAY AUTHORITY
Notes to Basic Financial Statements
December 31, 2015 and 2014
31 | P a g e
resources, reduced by the outstanding balances of bonds that are attributable to the acquisition, construction, or improvement of those assets. Restricted for debt service represents resources that are subject to external restrictions on how they may be used, and consists of restricted assets reduced by restricted liabilities where the restricted liability will generally be liquidated with the restricted assets reported. Unrestricted net position represents resources that may be used to meet the Authority’s ongoing obligations to the public and creditors, and are not included in the determination of net investment in capital assets or restricted for debt service components of net position. This balance includes any noncurrent accreted portions of revenue bonds payable. These net position amounts are available to fund any obligation of the Authority. When an expense is incurred for purposes for which both restricted and unrestricted net position is available, the Authority generally uses unrestricted funds first, then restricted as needed.
As of December 31, 2015 and 2014, the Authority had a total net deficit of approximately $535.9 million and $552.6 million, respectively. The Authority primarily plans to fund this net deficit with increased annual growth in toll operations revenues and other nonoperating revenues.
(k) Income Taxes
The income derived by the Authority is exempt from federal income tax under the provisions of Internal Revenue Code Section 115. Accordingly, no provision for the payment or refund of income taxes has been made in the accompanying basic financial statements.
(l) Impact of Recently Issued Accounting Standards
GASB Statement 72, Fair Value Measurement and Application. This Statement addresses accounting and financial reporting issues related to fair value measurements. The definition of fair value is the price that would be received to sell an asset or paid to transfer a liability in an orderly transaction between market participants at the measurement date. It provides guidance for determining a fair value measurement for financial reporting purposes and for applying fair value to certain investments and disclosures related to all fair value measurements. This Statement also requires disclosures to be made about fair value measurements, the level of fair value hierarchy, and valuation techniques. The requirements of this Statement will enhance comparability of financial statements among governments by requiring measurement of certain assets and liabilities at fair value using a consistent and more detailed definition of fair value and accepted valuation techniques. GASB Statement 72 is effective for periods beginning after June 15, 2015, and earlier application is encouraged. The Authority is currently evaluating the impact GASB Statement 72 will have on its financial statements.
(m) Reclassifications
Certain prior year balances have been reclassified to conform to the current year presentation.
(3) Cash, Cash Equivalents, and Investments
The Colorado Public Deposit Protection Act (PDPA) requires that all units of local government deposit cash in eligible public depositories. Eligibility is determined by state regulators. Amounts on deposit in excess of federal insurance levels (currently, $250,000 by the Federal Deposit Insurance Corporation (FDIC)) must be collateralized. The eligible collateral is specified by the PDPA. The PDPA allows the institution to create a single collateral pool for all public funds and the pool is to be maintained by another institution or held in

E-470 PUBLIC HIGHWAY AUTHORITY
Notes to Basic Financial Statements
December 31, 2015 and 2014
32 | P a g e
trust for all the uninsured public deposits as a group. The State Regulatory Commission for banks and savings and loan associations is required by statute to monitor the naming of eligible depositories and reporting of the uninsured deposits and assets maintained in the collateral pools. At December 31, 2015 and 2014, the Authority’s cash deposits had a book balance of $24.8 million and $23.2 million, respectively, and a corresponding bank balance of $25.0 million and $23.5 million, respectively. The difference between the book and bank balances is due to outstanding checks and deposits not yet processed by the banks.
As of December 31, 2015 and 2014, the Authority’s book balances are classified as follows:
Cashequivalents
andDeposits investments Total
Restricted cash and cash equivalents bytrustee under the bond resolutions $ — 38,020,161 38,020,161
Restricted cash and cash equivalentsfor construction — 300,115 300,115
Unrestricted cash and cashequivalents – undesignated 24,795,207 38,755,580 63,550,787
Restricted investments by trustee underthe bond resolutions — 123,155,952 123,155,952
Unrestricted investments – undesignated — 124,713,552 124,713,552 $ 24,795,207 324,945,360 349,740,567
2015
Cashequivalents
andDeposits investments Total
Restricted cash and cash equivalents bytrustee under the bond resolutions $ 2,292,913 33,652,514 35,945,427
Restricted cash and cash equivalents for construction — 300,097 300,097
Unrestricted cash and cashequivalents – undesignated 20,907,219 14,687,491 35,594,710
Restricted investments by trustee underthe bond resolutions — 126,098,628 126,098,628
Unrestricted investments – undesignated — 179,500,464 179,500,464 $ 23,200,132 354,239,194 377,439,326
2014

E-470 PUBLIC HIGHWAY AUTHORITY
Notes to Basic Financial Statements
December 31, 2015 and 2014
33 | P a g e
The following is a summary of the Authority’s cash equivalents and investments by type at December 31, 2015 and 2014, at fair value, including the investment agreement using a cost-based measurement:
2015 2014
U.S. government agency $ 168,301,602 187,512,920 Money market mutual funds 76,850,893 48,640,102 U.S. Treasury securities 61,984,408 81,834,809 Commercial paper 8,836,794 27,279,640 Investment agreement 8,471,273 8,471,273 Municipal bonds 500,390 500,450
$ 324,945,360 354,239,194
(a) Credit Risk
Credit risk is the risk that an issuer or other counterparty to an investment will not fulfill its obligations. The Authority’s policies regarding credit risk comply with Colorado statutes (CRS 24-75-601, as amended) and the Bond Resolutions. Colorado statutes specify the following investment instruments that meet defined rating and risk criteria in which local government entities may invest:
• Obligations of the United States and certain U.S. government agency securities
• Bonds of certain government entities
• Bankers’ acceptances of certain banks
• Commercial paper with a certain rating
• Repurchase agreements
• Certain money market mutual funds
• Local government investment pools
• Certain investment agreements
The Authority may invest or deposit any funds in the manner provided by law for political subdivisions of the state. In addition, the Authority may direct a corporate trustee, which holds funds of the Authority, to invest or deposit such funds in investments or deposits other than those specified by law for political subdivisions of the state if the board of directors determines, by resolution, that (1) such investment or deposit meets the standard established in the Colorado revised statutes, (2) the income is at least comparable to income available on investments or deposits specified by law for political subdivisions of the state, and (3) such investments will assist the Authority in the financing, construction, maintenance, or operation of public highways.
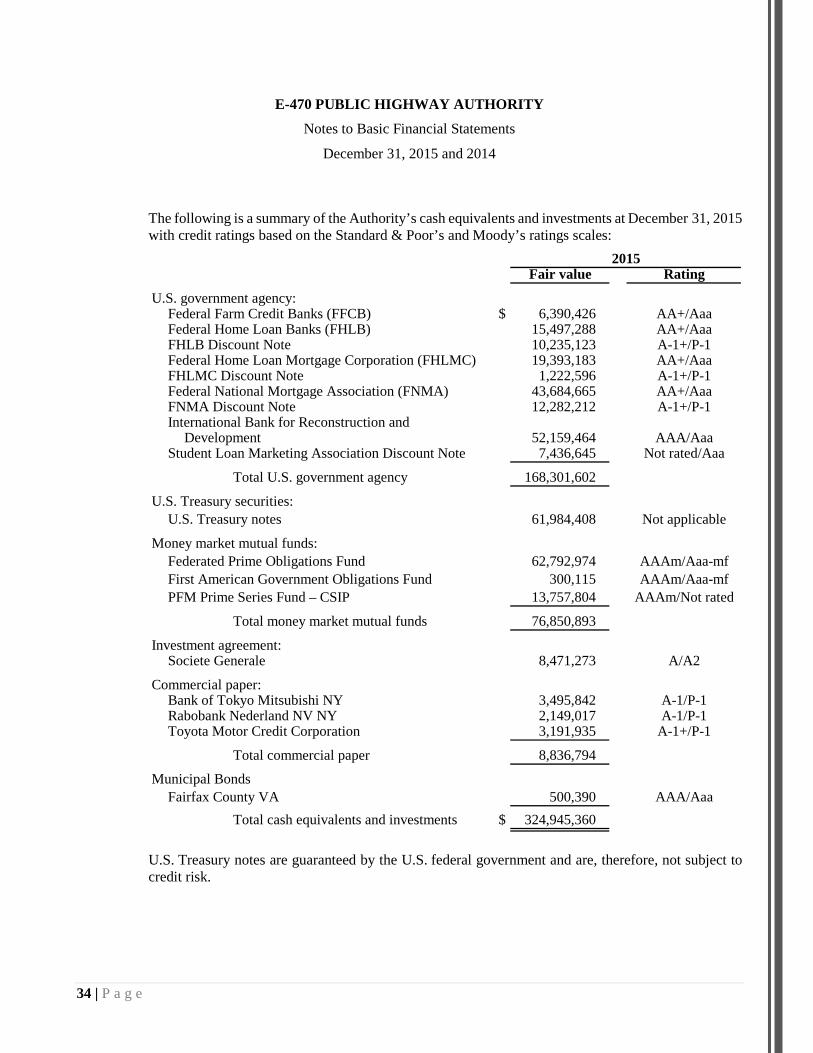
E-470 PUBLIC HIGHWAY AUTHORITY
Notes to Basic Financial Statements
December 31, 2015 and 2014
34 | P a g e
The following is a summary of the Authority’s cash equivalents and investments at December 31, 2015 with credit ratings based on the Standard & Poor’s and Moody’s ratings scales:
2015Fair value Rating
U.S. government agency:Federal Farm Credit Banks (FFCB) $ 6,390,426 AA+/AaaFederal Home Loan Banks (FHLB) 15,497,288 AA+/AaaFHLB Discount Note 10,235,123 A-1+/P-1Federal Home Loan Mortgage Corporation (FHLMC) 19,393,183 AA+/AaaFHLMC Discount Note 1,222,596 A-1+/P-1Federal National Mortgage Association (FNMA) 43,684,665 AA+/AaaFNMA Discount Note 12,282,212 A-1+/P-1International Bank for Reconstruction and
Development 52,159,464 AAA/AaaStudent Loan Marketing Association Discount Note 7,436,645 Not rated/Aaa
Total U.S. government agency 168,301,602
U.S. Treasury securities:U.S. Treasury notes 61,984,408 Not applicable
Money market mutual funds:Federated Prime Obligations Fund 62,792,974 AAAm/Aaa-mfFirst American Government Obligations Fund 300,115 AAAm/Aaa-mfPFM Prime Series Fund – CSIP 13,757,804 AAAm/Not rated
Total money market mutual funds 76,850,893
Investment agreement:Societe Generale 8,471,273 A/A2
Commercial paper:Bank of Tokyo Mitsubishi NY 3,495,842 A-1/P-1Rabobank Nederland NV NY 2,149,017 A-1/P-1Toyota Motor Credit Corporation 3,191,935 A-1+/P-1
Total commercial paper 8,836,794
Municipal BondsFairfax County VA 500,390 AAA/Aaa
Total cash equivalents and investments $ 324,945,360
U.S. Treasury notes are guaranteed by the U.S. federal government and are, therefore, not subject to credit risk.

E-470 PUBLIC HIGHWAY AUTHORITY
Notes to Basic Financial Statements
December 31, 2015 and 2014
35 | P a g e
The following is a summary of the Authority’s cash equivalents and investments at December 31, 2014 with credit ratings based on the Standard & Poor’s and Moody’s ratings scales:
2014Fair value Rating
U.S. government agency:Federal Farm Credit Banks (FFCB) $ 19,502,838 AA+/AaaFederal Home Loan Banks (FHLB) 20,482,015 AA+/AaaFederal Home Loan Mortgage Corporation (FHLMC) 42,469,257 AA+/AaaFederal National Mortgage Association (FNMA) 43,520,876 AA+/AaaInternational Bank for Reconstruction and
Development 54,320,803 AAA/AaaStudent Loan Marketing Association Discount Note 7,217,131 Not rated/Aaa
Total U.S. government agency 187,512,920
U.S. Treasury securities:U.S. Treasury notes 81,834,809 Not applicable
Money market mutual funds:Federated Prime Obligations Fund 39,777,907 AAAm/Aaa-mfFirst American Government Obligations Fund 300,097 AAAm/Aaa-mfPFM Prime Series Fund – CSIP 8,562,098 AAAm/Not rated
Total money market mutual funds 48,640,102
Investment agreement:Societe Generale 8,471,273 A/A2
Commercial paper:Bank of Tokyo Mitsubishi NY 4,748,545 A-1/P-1General Electric Capital Corporation 5,555,046 A-1+/P-1UBS Finance 1,124,412 A-1/P-1Toyota Motor Credit Corporation 4,745,467 A-1+/P-1Societe Generale 1,764,953 A-1/P-1HSBC Bank USA 3,749,175 A-1/P-1PNC Bank 5,592,042 A-1/P-1
Total commercial paper 27,279,640
Municipal BondsFairfax County VA 500,450 AAA/Aaa
Total cash equivalents and investments $ 354,239,194
U.S. Treasury notes are guaranteed by the U.S. federal government and are, therefore, not subject to credit risk.

E-470 PUBLIC HIGHWAY AUTHORITY
Notes to Basic Financial Statements
December 31, 2015 and 2014
36 | P a g e
(b) Interest Rate Risk
Interest rate risk is the risk that an investment’s value will change due to change in the level of interest rates. The Authority currently employs one professional investment management firm to manage its investments. The funds are all “laddered” so that investments do not mature all at once, and are in compliance with the Colorado statutes and Bond Resolutions. Additionally, 74% and 75% of the cash equivalents and investments have maturities of three years or less at December 31, 2015 and 2014, respectively.
As of December 31, 2015, the Authority held the following cash equivalents and investments:
Between twoLess than Between one and three Greater than
Fair value one year and two years years three years
U.S. government agency $ 168,301,602 50,894,278 18,662,233 23,202,392 75,542,699 U.S. Treasury securities 61,984,408 34,568,670 21,326,262 4,818,759 1,270,717 Money market mutual funds 76,850,893 76,850,893 — — — Investment agreement 8,471,273 — — — 8,471,273 Commercial paper 8,836,794 8,836,794 — — — Municipal bonds 500,390 500,390 — — —
Total cash equivalents and investments $ 324,945,360 171,651,025 39,988,495 28,021,151 85,284,689
Because the money market mutual funds have a weighted average maturity less than three months as of December 31, 2015, the funds are presented as cash equivalents with maturities of less than one year.
As of December 31, 2014, the Authority held the following cash equivalents and investments:
Between twoLess than Between one and three Greater than
Fair value one year and two years years three years
U.S. government agency $ 187,512,920 59,579,866 24,704,612 21,969,267 81,259,175 U.S. Treasury securities 81,834,809 63,944,016 6,846,002 10,526,510 518,281 Money market mutual funds 48,640,102 48,640,102 — — — Investment agreement 8,471,273 — — — 8,471,273 Commercial paper 27,279,640 27,279,640 — — — Municipal bonds 500,450 — 500,450 — —
Total cash equivalents and investments $ 354,239,194 199,443,624 32,051,064 32,495,777 90,248,729
Because the money market mutual funds have a weighted average maturity less than three months as of December 31, 2014, the funds are presented as cash equivalents with maturities of less than one year.

E-470 PUBLIC HIGHWAY AUTHORITY
Notes to Basic Financial Statements
December 31, 2015 and 2014
37 | P a g e
(c) Custodial Credit Risk
For an investment, custodial credit risk is the risk that, in the event of the failure of the counterparty, the Authority will not be able to recover the value of its investment or collateral securities that are in the possession of an outside party. The Authority has no custodial credit risk as all securities are registered in the name of the Authority and held by a third-party safekeeping agent. Investments in money market mutual funds are not exposed to custodial credit risk because their existence is not evidenced by securities that exist in physical or book entry form.
(d) Concentration of Credit Risk
The Authority does not have a limit on the amount that may be invested in any one issuer. As of December 31, 2015 and 2014, approximately 52% and 53%, respectively, of the Authority’s cash equivalents and investments are in U.S. government agency investments that are not fully backed by the full faith and credit of the federal government. The investments include FFCB, FHLB, FHLMC, FNMA, International Bank for Reconstruction and Development, and Student Loan Marketing Association investments.
(e) Restricted Funds
The Authority maintains restricted accounts and funds as required per the Bond Resolutions or other externally imposed restrictions. Cash and cash equivalents and investments as of December 31, 2015 and 2014 are restricted as follows:
2015 2014Senior Bonds Debt Service Reserve Fund $ 102,466,609 104,963,163 Senior Bonds Debt Service Account 31,097,676 29,449,458 Trust Revenue Fund 15,399,485 14,280,593 Operating Reserve Fund 8,325,973 6,997,544 VRF Restricted Account 3,055,386 5,522,908 VRF Bonds Debt Service Account 830,984 830,389 Other restricted accounts 300,115 300,097
$ 161,476,228 162,344,152
The restricted funds and accounts have been established in accordance with the Bond Resolutions or other externally imposed restrictions. The Authority maintains other restricted accounts that do not have any funding requirements and thus have a zero balance as of December 31, 2015 and 2014 and are not shown above. The Bond Resolutions provide, among other provisions, that certain accounting procedures be followed and certain funds and accounts be established to provide bondholders a degree of security against certain contingencies. Brief descriptions of these funds and accounts are as follows:

E-470 PUBLIC HIGHWAY AUTHORITY
Notes to Basic Financial Statements
December 31, 2015 and 2014
38 | P a g e
Senior Bonds Debt Service Reserve Fund – Pursuant to the Bond Resolutions, a Senior Bonds Debt Service Reserve Fund was established solely for the benefit of the holders of the Senior Bonds in the event amounts on deposit in the Senior Bonds Debt Service Account are insufficient to make required payments. As of December 31, 2015 and 2014, the Senior Bonds Debt Service Reserve Fund requirement was $118.0 million, and the account was fully funded at December 31, 2015 and 2014 with balances of $127.5 million and $130.0 million, respectively. The change in year-end balances is due to fair value fluctuations. These balances include cash and cash equivalents and investments of $102.5 million and $105.0 million at December 31, 2015 and 2014, respectively, combined with the $25 million available under a reserve fund surety bond provided by MBIA (note 7(e)). Within the fund, the Authority holds numerous long-term investment securities, one of which is an investment agreement with Societe Generale. Under the agreement, among other provisions, Societe Generale pays the Authority 6.61% of the investment principal amount on a semiannual basis, and must post collateral at a specified amount if their long-term unsecured credit rating is reduced below AA– by Standard and Poor’s (S&P) or Aa3 by Moody’s. Societe Generale was rated A by S&P and A2 by Moody’s at December 31, 2015 and 2014, respectively, and thus has posted collateral in accordance with the agreement. The Authority may terminate the agreement at any time; however, Societe Generale may not terminate the agreement until final maturity in 2026.
Senior Bonds Debt Service Account – Pursuant to the Bond Resolutions, the Senior Bonds Debt Service account is funded from current year revenues in an amount equal to the aggregate senior bond debt service payable during the current fiscal year including the monthly cash settlements paid on the Authority’s interest rate swaps and SIFMA Index Term Rate bonds. Other senior bond series’ interest due is paid semiannually by the Trustee on March 1 and September 1, with outstanding senior bonds payable principal (including any accretion) due on September 1 for the applicable bond series.
Trust Revenue Fund – Except as otherwise provided in the Bond Resolutions, all revenues will be delivered to the Trustee immediately upon receipt by the Authority and will be deposited by the Trustee in the Trust Revenue Fund to be used by the Authority for the purposes of funding any other restricted accounts (including the Senior Bond Debt Service Account) and current year operating expenses. In November 2014, the Authority amended the flow of funds provisions within the Master Bond Resolutions to allow the Authority to move surplus funds from the Trust Revenue Fund to the General Surplus account (or subaccounts therein) on a monthly basis, but also must maintain a retained balance within the Trust Revenue Fund at month-end equal to one-half of the aggregate amount required to be transferred to the Senior Bonds Debt Service Account during such month. The required retained balance was $4.1 million as of December 31, 2015 and $3.9 million as of December 31, 2014, and was fully funded.
VRF Restricted Accounts – In 2011, the Authority transferred $13.5 million from the General Surplus account to a separate, Authority-controlled account, which is restricted per the bond resolutions and has been approved by the board of directors. The Authority intends to pay all future debt service on the VRF bonds over the next several years by funding the VRF Debt Service account from this new account. Payments on the VRF bonds debt service are paid semiannually by the Trustee on March 1 and September 1 from the VRF Debt Service account.

E-470 PUBLIC HIGHWAY AUTHORITY
Notes to Basic Financial Statements
December 31, 2015 and 2014
39 | P a g e
Operating Reserve Fund – Under the provisions of the Bond Resolutions, the Operating Reserve Fund is required to be maintained in an amount equal to 1/6th of annual budgeted operating expenses, as determined by the Authority. As of December 31, 2015 and 2014, $8.3 million and $7.0 million, respectively, were on deposit in the Operating Reserve Fund, which exceeded the required balance of $6.9 million and $5.7 million, respectively, during these periods.
Rebate Fund – Moneys will be deposited into the Rebate Fund pursuant to the Resolutions and used solely for the purpose of paying amounts due to the United States of America pursuant to the Internal Revenue Code and arbitrage rebate regulations issued by the Internal Revenue Service. Funds within the Rebate Fund are only required when an arbitrage rebate liability is due. If the amount in the Rebate Fund is in excess of the amount required to be deposited based on the assessed arbitrage rebate liability, such excess will be transferred to the Authority.
(f) Unrestricted Funds
The General Surplus account is unrestricted and is currently divided into three subaccounts for administrative purposes: the Senior Bond Defeasance Fund, the Capital Improvements Fund, and the Rainy Day Fund. These unrestricted funds are available to fund any obligations of the Authority; however, the Bond Resolutions include a requirement that the General Surplus account not be reduced below $20.0 million unless the Authority’s bond issuer, MBIA, provides written consent to such a distribution below this level. As of December 31, 2015 and 2014, the Authority held $188.3 million and $215.1 million, respectively, in total unrestricted funds including cash and cash equivalents and investments. Approximately $160.3 million and $191.0 million were within the General Surplus accounts as of December 31, 2015 and 2014, respectively, which have specific purposes such as fully funding the Authority’s future capital budget and bond defeasances.
(g) Investment Income
Investment income’s interest earned on investments consists of restricted and unrestricted investment earnings, any associated premium or discounts, and any realized gains or losses on the investments. Also, included in total investment income is the change in the fair value of investments as of the end of the reporting period. The Authority recognized total investment gain of $3.0 million in 2015 and total investment gain of $9.3 million in 2014, excluding the net change in fair value of derivative instruments. Restricted interest earned on investments was $0.1 million in 2015 and 2014 and is restricted by the Bond Resolutions or by other externally imposed restrictions. Unrestricted investment income may be earned within restricted investment accounts as long as those accounts are fully funded by year-end as required by the Bond Resolutions.

E-470 PUBLIC HIGHWAY AUTHORITY
Notes to Basic Financial Statements
December 31, 2015 and 2014
40 | P a g e
(4) Accounts Receivable
The following is a summary of accounts and tolls receivable balances and related allowance as of December 31, 2015 and 2014:
2015 2014Tolls receivable (billed) $ 16,700,652 13,678,447 Unbilled toll revenue 3,054,557 1,792,367 Accrued toll revenue – transactions still processing 1,938,148 4,010,951 Late fee receivable 1,358,624 1,010,249 Vehicle registration fees receivable 835,953 834,575 Accounts receivable 948,024 960,847
Total accounts receivable 24,835,958 22,287,436
Allowance for uncollectible tolls receivable (3,703,370) (3,095,220) Allowance for uncollectible late fee receivable (434,081) (302,064)
Total accounts receivable, net of allowance for uncollectibles $ 20,698,507 18,890,152
With LPT tolls receivable, there are three stages accrued within the basic financial statements: accrued toll revenue (transactions in process for billing); unbilled toll revenue (transactions assigned to a customer account and are waiting to be billed); and tolls receivable (transactions that have been billed to a customer and are awaiting payment). Customers are generally billed each month for all toll activity incurred during the previous month and have 30 days to pay. If the first bill is unpaid, customers will be sent a second and third bill with a $5 late fee assessed on the second bill only and have an additional 60 days to pay the outstanding tolls and fee. If still unpaid, the tolls may be remitted to a collection law firm where additional collection fees including civil penalties and adjudication fees may be assessed with a possible hold being placed on the customer’s vehicle registration. ExpressToll customers with unpaid tolls may also be remitted to the collection law firm for collections where fees are assessed. Further, tolls charged to customers for LPT versus ExpressToll vary based on the approved two-tiered toll rates, which were effective beginning January 1, 2009 and continuing through 2015. Based on the outstanding tolls and related late fees in fiscal years 2015 and 2014, the Authority has approximately $4.1 million and $3.4 million, respectively, in outstanding tolls and late fee receivables at year-end that are not expected to be collected within the next fiscal year.
Vehicle registration fees are collected by Adams, Arapahoe, and Douglas counties on behalf of the Authority based on enabling legislation. Each county collects $10 when each citizen’s car within specific address boundaries is registered annually, and withholds 5% ($0.50) per transaction as an administrative fee with the net amount remitted to the Authority. The amount accrued as accounts receivable and included within the basic financial statements equals what has been collected by the counties for the previous month but not yet remitted to the Authority.

E-470 PUBLIC HIGHWAY AUTHORITY
Notes to Basic Financial Statements
December 31, 2015 and 2014
41 | P a g e
(5) Capital Assets
A summary of changes in capital assets for the year ended December 31, 2015 is as follows:
Balance at Balance atJanuary 1, December 31,
2015 Increases Decreases Transfers 2015
Capital assets not beingdepreciated:
Land $ 110,858,164 — (4,361) — 110,853,803 Construction in progress 4,115,519 9,044,519 (50,062) (11,427,348) 1,682,628
Total capital assetsnot beingdepreciated 114,973,683 9,044,519 (54,423) (11,427,348) 112,536,431
Depreciable capital assets:Infrastructure 909,463,889 134,849 — — 909,598,738 Buildings 19,431,049 3,190,251 — — 22,621,300 Equipment 27,515,532 4,251,318 (387,095) — 31,379,755 Software, fixtures,
improvements, and otherassets 18,370,223 3,850,929 — — 22,221,152
Total depreciablecapital assets 974,780,693 11,427,347 (387,095) — 985,820,945
Less accumulated depreciation for:Infrastructure (429,294,556) (30,233,638) — — (459,528,194) Buildings (8,194,267) (589,590) — — (8,783,857) Equipment (20,124,542) (2,479,889) 387,095 — (22,217,336) Software, fixtures,
improvements, and otherassets (14,246,229) (2,123,083) — — (16,369,312)
Total accumulateddepreciation (471,859,594) (35,426,200) 387,095 — (506,898,699)
Depreciable capitalassets, net 502,921,099 (23,998,853) — — 478,922,246
Total capitalassets, net $ 617,894,782 (14,954,334) (54,423) (11,427,348) 591,458,677

E-470 PUBLIC HIGHWAY AUTHORITY
Notes to Basic Financial Statements
December 31, 2015 and 2014
42 | P a g e
A summary of changes in capital assets for the year ended December 31, 2014 is as follows:
Balance at Balance atJanuary 1, December 31,
2014 Increases Decreases Transfers 2014
Capital assets not beingdepreciated:
Land $ 110,858,164 — — — 110,858,164 Construction in progress 841,137 12,346,589 — (9,072,207) 4,115,519
Total capital assetsnot beingdepreciated 111,699,301 12,346,589 — (9,072,207) 114,973,683
Depreciable capital assets:Infrastructure 903,877,344 5,586,545 — — 909,463,889 Buildings 18,835,085 595,964 — — 19,431,049 Equipment 27,217,603 1,269,103 (971,174) — 27,515,532 Software, fixtures,
improvements, and otherassets 16,751,813 1,620,595 (2,185) — 18,370,223
Total depreciablecapital assets 966,681,845 9,072,207 (973,359) — 974,780,693
Less accumulated depreciation for:Infrastructure (399,219,668) (30,074,888) — — (429,294,556) Buildings (7,638,070) (556,197) — — (8,194,267) Equipment (18,751,975) (2,081,824) 709,257 — (20,124,542) Software, fixtures,
improvements, and otherassets (12,855,136) (1,393,278) 2,185 — (14,246,229)
Total accumulateddepreciation (438,464,849) (34,106,187) 711,442 — (471,859,594)
Depreciable capitalassets, net 528,216,996 (25,033,980) (261,917) — 502,921,099
Total capitalassets, net $ 639,916,297 (12,687,391) (261,917) (9,072,207) 617,894,782

E-470 PUBLIC HIGHWAY AUTHORITY
Notes to Basic Financial Statements
December 31, 2015 and 2014
43 | P a g e
(6) Deferred Outflows of Resources
The deferred outflows of resources represent the remaining unamortized deferral balances from losses on refundings of debt. The balances of $98.6 million and $107.6 million as of December 31, 2015 and 2014, respectively, are included within the net investment in capital assets component of net position.
A summary of deferred outflows of resources as of December 31, 2015 and 2014 is as follows:
2015 2014Deferred refunding 1997 $ 21,316,940 23,317,925 Deferred refunding 2004 22,001,559 23,092,546 Deferred refunding 2006 6,333,208 6,655,235 Deferred refunding 2007 9,553,689 21,671,791 Deferred refunding 2008 13,067,573 13,945,119 Deferred refunding 2010 11,733,321 12,834,707 Deferred refunding 2014 5,558,022 6,082,790 Deferred refunding 2015 9,030,548 —
$ 98,594,860 107,600,113
(7) Bonds Payable
Bonds payable include current interest bonds (CIB), capital appreciation bonds (CAB), VRF bonds, and SIFMA index bonds, consisting of both new issue and refunded bonds of the Authority. The Authority is committed to repay the bonds and related interest from its revenues and restricted investments. Interest rates on outstanding current interest bonds (including the VRF bonds) at December 31, 2015 ranged from 2.00% to 5.375%. The average outstanding coupon (interest) rate on all outstanding current interest bonds was 4.25% and 4.98% for the years ended December 31, 2015 and 2014, respectively. Yields on outstanding capital appreciation bonds at December 31, 2015 and 2014 ranged from 5.06% to 7.13%. The average outstanding yield rate on all outstanding capital appreciation bonds was 5.85% for the years ended December 31, 2015 and 2014, respectively. Most bond series’ interest due is paid semiannually on March 1 and September 1, with outstanding principal due on September 1 for the applicable bond series. Only the Series 2007CD-2 and 2014A SIFMA index bonds accrue and pay interest monthly based on the variable SIFMA index plus 175 basis points (bps), or 1.75%, and 118 basis points, or 1.18%, respectively.
The Bond Resolutions require that the Authority maintain a Revenue Covenant (also referred to as the debt service coverage ratio) of at least 1.30 times the aggregate debt service due for the year. For the years ended December 31, 2015 and 2014, the Authority exceeded the required debt service coverage ratio of 1.30. Refer to the Supplementary Information – Revenue Covenant section for the 2015 debt service coverage calculation and reconciliation to the basic financial statements for operating balances and senior debt service due.

E-470 PUBLIC HIGHWAY AUTHORITY
Notes to Basic Financial Statements
December 31, 2015 and 2014
44 | P a g e
The following is a summary of the bonds payable by bond series and type as of December 31, 2015:
Original Current Current interestprincipal Refunded series maturity rate/yield Annual principal
Bonds outstanding amount (if applicable) dates (1) ranges maturity due ranges
Series 1997 B CAB $ 342,217,730 1986 Bonds 2015–2026 5.40%–5.52% $ 39,795,000–44,800,000Series 2000 B CAB 252,848,750 — 2018–2033 6.14%–6.35% 31,100,000–104,200,000Series 2004 A CAB 76,484,624 2000 B CAB * 2027–2036 5.33%–5.46% 78,425,000–78,500,000Series 2004 B CAB 70,705,810 2000 B CAB * 2027–2036 5.60%–5.72% 23,300,000–49,075,000Series 2004 C Converted CIB (2) 16,680,798 2000 B CAB * 2016–2017 5.00% 7,065,000–15,000,000Series 2006 A CIB 53,755,000 2000 A CIB 2015–2018 5.00% 4,975,000–5,760,000Series 2006 B CAB 56,932,723 2000 A CIB 2035–2039 5.06%–5.08% 60,000,000–70,720,000Series 2007 A-1 CIB 53,325,000 1997 A CIB * 2015–2018 5.25% 3,025,000–5,575,000Series 2007 B-1 CIB 53,325,000 1997 A CIB * 2015–2018 4.50%–5.25% 3,025,000–5,575,000Series 2007 C-1 CIB 53,325,000 1997 A CIB * 2015–2018 5.25% 3,025,000–5,575,000Series 2007 D-1 CIB 53,370,000 1997 A CIB * 2015–2018 5.25% 3,060,000–5,580,000Series 2007 CD-2 SIFMA 66,075,000 2007 C-2–D-2 2026–2039 SIFMA + 175bps 5,115,000–22,210,000VRF 2009 CIB 19,365,000 2001 VRF Bonds 2015–2018 3.00%–5.00% 1,395,000–2,300,000Series 2010 A CAB 21,834,746 1997B CAB * 2035–2041 7.08%–7.13% 7,860,000–52,385,000Series 2010 C CIB 81,655,000 2007A2–D2 * 2025–2026 5.25%–5.375% 24,180,000–57,475,000Series 2014 A SIFMA 72,565,000 2011 A 2026–2039 SIFMA + 118bps 13,515,000–22,250,000Series 2015 A CIB 41,550,000 2007 A1–D1 * 2016–2020 2.00%–5.00% 200,000–20,590,000
(1) The current maturity dates includes a range, but does not indicate that there are maturities every year within the range.(2) The Series 2004C bonds were converted from CAB to CIB on September 1, 2011 with $22.1 million in outstanding principal.* The refunded bonds were partially refunded by the new Series bonds.

E-470 PUBLIC HIGHWAY AUTHORITY
Notes to Basic Financial Statements
December 31, 2015 and 2014
45 | P a g e
The following is an analysis of changes in bonds payable and associated bond premiums and discounts for the year ended December 31, 2015:
Balance at Balance atJanuary 1, December 31, Due within
2015 Additions Reductions 2015 one year
Series 1997B CAB (Principal) $ 151,405,211 — 15,241,485 136,163,726 16,178,176 Series 1997B CAB (Accretion) 235,254,554 20,758,633 24,553,515 231,459,672 28,621,824 Series 2000B CAB (Principal) 154,024,296 — — 154,024,296 — Series 2000B CAB (Accretion) 226,828,062 24,288,307 — 251,116,369 — Series 2004A CAB (Principal) 76,484,624 — — 76,484,624 — Series 2004A CAB (Accretion) 54,004,731 7,140,984 — 61,145,715 — Series 2004B CAB (Principal) 70,705,810 — — 70,705,810 — Series 2004B CAB (Accretion) 53,308,729 7,147,762 — 60,456,491 — Series 2004C Converted CIB * 22,065,000 — — 22,065,000 7,065,000 Premium Series 2004 483,227 — 21,107 462,120 — Series 2006A CIB 21,445,000 — 4,975,000 16,470,000 5,225,000 Premium 2006A CIB 253,284 — 124,618 128,666 — Series 2006B CAB (Principal) 56,932,723 — — 56,932,723 — Series 2006B CAB (Accretion) 29,261,167 4,427,572 — 33,688,739 — Series 2007 A-1 CIB 49,150,000 — 36,300,000 12,850,000 5,000,000 Series 2007 B-1 CIB 49,150,000 — 36,300,000 12,850,000 5,000,000 Series 2007 C-1 CIB 49,150,000 — 36,300,000 12,850,000 5,000,000 Series 2007 D-1 CIB 49,110,000 — 36,255,000 12,855,000 5,000,000 Series 2007 CD-2 SIFMA Notes 66,075,000 — — 66,075,000 — Premium 2007 A1-D1 CIB 1,698,505 — 1,434,091 264,414 — Discount 2007 A1-D1 CIB (48,073) 40,589 — (7,484) — Series VRF 2009 CIB 8,090,000 — 2,160,000 5,930,000 2,235,000 Premium VRF 2009 CIB 91,184 — 49,067 42,117 — Series 2010A CAB (Principal) 21,834,746 — — 21,834,746 — Series 2010A CAB (Accretion) 7,419,311 2,118,899 — 9,538,210 — Series 2010C CIB 81,655,000 — — 81,655,000 — Discount 2010C CIB (237,800) 22,217 — (215,583) — Series 2014A SIFMA Notes 72,565,000 — — 72,565,000 — Series 2015A CIB — 41,550,000 — 41,550,000 1,635,000 Premium 2015A CIB — 4,081,237 — 4,081,237 —
Total $ 1,608,159,291 111,576,200 193,713,883 1,526,021,608 80,960,000
* The 2004C CAB bonds were converted to CIB bonds on September 1, 2011.

E-470 PUBLIC HIGHWAY AUTHORITY
Notes to Basic Financial Statements
December 31, 2015 and 2014
46 | P a g e
The following is an analysis of changes in bonds payable and associated bond premiums and discounts for the year ended December 31, 2014:
Balance at Balance atJanuary 1, December 31, Due within
2014 Additions Reductions 2014 one year
Series 1997A CIB $ 14,700,000 — 14,700,000 — — Series 1997B CAB (Principal) 167,614,511 — 16,209,300 151,405,211 15,241,485 Series 1997B CAB (Accretion) 237,121,396 21,718,858 23,585,700 235,254,554 24,553,515 Series 2000B CAB (Principal) 154,024,296 — — 154,024,296 — Series 2000B CAB (Accretion) 203,994,548 22,833,514 — 226,828,062 — Series 2004A CAB (Principal) 76,484,624 — — 76,484,624 — Series 2004A CAB (Accretion) 47,234,194 6,770,537 — 54,004,731 — Series 2004B CAB (Principal) 70,705,810 — — 70,705,810 — Series 2004B CAB (Accretion) 46,550,531 6,758,198 — 53,308,729 — Series 2004C Converted CIB * 22,065,000 — — 22,065,000 — Premium Series 2004 503,297 — 20,070 483,227 — Series 2006A CIB 24,105,000 — 2,660,000 21,445,000 4,975,000 Premium 2006A CIB 415,543 — 162,259 253,284 — Series 2006B CAB (Principal) 56,932,723 — — 56,932,723 — Series 2006B CAB (Accretion) 25,049,941 4,211,226 — 29,261,167 — Series 2007 A-1 CIB 49,300,000 — 150,000 49,150,000 5,575,000 Series 2007 B-1 CIB 49,300,000 — 150,000 49,150,000 5,575,000 Series 2007 C-1 CIB 49,300,000 — 150,000 49,150,000 5,575,000 Series 2007 D-1 CIB 49,300,000 — 190,000 49,110,000 5,580,000 Series 2007 CD-2 SIFMA Notes 66,075,000 — — 66,075,000 — Premium 2007 A1-D1 CIB 2,076,577 — 378,072 1,698,505 — Discount 2007 A1-D1 CIB (58,774) 10,701 — (48,073) — Series VRF 2009 CIB 10,175,000 — 2,085,000 8,090,000 2,160,000 Premium VRF 2009 CIB 158,124 — 66,940 91,184 — Series 2010A CAB (Principal) 21,834,746 — — 21,834,746 — Series 2010A CAB (Accretion) 5,443,619 1,975,692 — 7,419,311 — Series 2010C CIB 81,655,000 — — 81,655,000 — Discount 2010C CIB (260,017) 22,217 — (237,800) — Series 2011A SIFMA Notes 72,565,000 — 72,565,000 — — Series 2014A SIFMA Notes — 72,565,000 — 72,565,000 —
Total $ 1,604,365,689 136,865,943 133,072,341 1,608,159,291 69,235,000
* The 2004C CAB bonds were converted to CIB bonds on September 1, 2011.

E-470 PUBLIC HIGHWAY AUTHORITY
Notes to Basic Financial Statements
December 31, 2015 and 2014
47 | P a g e
At December 31, 2015, scheduled payments for bonds payable over the next five years, and thereafter, are as follows:
Principal Interest Total
Year(s) ending December 31:2016 $ 80,960,000 18,804,720 99,764,720 2017 87,580,000 17,332,258 104,912,258 2018 95,390,000 17,543,821 112,933,821 2019 96,295,000 16,544,983 112,839,983 2020 101,590,000 15,691,096 117,281,096 2021–2025 453,965,000 73,783,657 527,748,657 2026–2030 632,840,000 48,523,866 681,363,866 2031–2035 596,190,000 44,278,125 640,468,125 2036–2040 542,290,000 25,821,652 568,111,652 2041 52,385,000 - 52,385,000
2,739,485,000 278,324,178 3,017,809,178
Add premiums, net of discounts 4,755,487 — 4,755,487
Total scheduled payments 2,744,240,487 278,324,178 3,022,564,665
Less future years’ accretion (1,218,218,879) — (1,218,218,879)
Total bonds payable $ 1,526,021,608 278,324,178 1,804,345,786
Included in the above principal payment schedule is $1.2 billion of expected future year interest accretion on the Senior CAB 1997B bond series, Senior CAB 2000B bond series, Senior CAB 2004A and 2004B bonds series, Senior 2006B bond series, and the Senior 2010A bond series.
Further detail of the Authority’s bonds payable is as follows:
(a) Series 1997 Bonds
The 1997 Series bonds were issued to refund the Authority’s 1986 Series bonds, which were originally issued to finance the construction of the Authority’s first three segments of the road. The senior current interest bonds Series 1997A were originally serial bonds ($113.2 million) and term bonds ($328.4 million) totaling $441.6 million. This bond series was partially refunded in 2007 with the original 2007 auction-rate Series Bonds (as described in note 7(f)). The senior capital appreciation bonds Series 1997B were originally issued at a par value of $342.2 million. This bond series was partially refunded in 2010 for a portion of the maturity values totaling $20.1 million between 2011 and 2015 with the Series 2010A capital appreciation bonds and 2010C current interest bonds (as described in note 7(j)). The senior current interest bonds Series 1997C were originally issued at a par value of $38.5 million. In 2008, the Authority called (redeemed) the outstanding balance of the 1997C senior current interest bonds along with a one percent call premium and accrued interest as of the date of redemption of $27.0 million, using funds from an authorized restricted account and the unrestricted Senior Bonds Defeasance Fund of the General Surplus account.

E-470 PUBLIC HIGHWAY AUTHORITY
Notes to Basic Financial Statements
December 31, 2015 and 2014
48 | P a g e
(b) Series 2000 Bonds
The 2000 Series bonds were issued to finance the construction of the Authority’s final segment (Segment IV) to complete the ultimate build out plans of the toll road. The senior current interest bonds Series 2000A were originally issued at a par value of $105.2 million. This bond series was fully refunded in 2006 with the Series 2006A current interest bonds and the 2006B capital appreciation bonds (as described in note 7(e)). The senior capital appreciation bonds Series 2000B were originally issued at a par value of $252.8 million to finance construction of Segment IV of the toll road. This bond series was partially refunded in 2004 with the 2004 Series Bonds (as described in note 7(d)).
(c) Series 2001 Bonds
The 2001 Vehicle Registration Fee Bonds (2001 VRF bonds) were originally issued at a par value of $46.2 million to advance refund approximately $45.0 million of the 1995 pledged VRF bonds. The related liability on the 1995 pledged VRF bonds that were refunded was removed from the Authority’s statements of net position as the bonds were no longer outstanding. The 2001 VRF bonds were issued as variable-rate bonds with final maturity in September 2018 with an associated interest rate swap. In May 2009, the Authority redeemed $17.7 million of the total outstanding VRF variable-rate bonds of $37.1 million and reissued the remaining balance of $19.4 million as fixed-rate bonds (2009 Series Bonds – see note 7(i)). The related interest rate swap was fully terminated in conjunction with the reissuance of the 2009 bonds.
(d) Series 2004 Bonds
In December 2004, the Authority issued $76.5 million of noncallable capital appreciation bonds (Series 2004A), $70.7 million callable capital appreciation bonds (Series 2004B), and $16.7 million noncallable convertible appreciation bonds (Series 2004C) to advance refund certain portions of the outstanding Series 2000B bonds totaling $133.0 million, which included accreted interest. As a result, the refunded 2000B bonds were legally defeased, and the liability for those bonds has been removed from the Authority’s statements of net position. The 2004C convertible capital appreciation bonds were converted to current interest bonds on September 1, 2011 with outstanding original principal of $16.7 million and accumulated accretion of $5.4 million for a total outstanding principal balance of $22.1 million.
(e) Series 2006 Bonds
In September 2006, the Authority issued $53.8 million of callable current interest bonds (Series 2006A) and $56.9 million of callable capital appreciation bonds (Series 2006B) to advance refund the entire outstanding Series 2000A bonds totaling $105.2 million. As a result, the refunded 2000A bonds were considered to be legally defeased, and the liability for these bonds was removed from the Authority’s statements of net position. The escrow account for the legally defeased debt paid the final maturity in September 2010. The Authority completed the advance refunding as the first of a two-step process to level off future debt service payments, with step two occurring in 2007 (note 7(f)).
In November 2008, the Authority cash defeased a portion of the 2006A bonds totaling $22.6 million with original bond maturities between 2009 and 2014. Approximately $24.9 million was transferred from the Senior Bonds Debt Service Reserve account to fund an escrow that will continue to pay principal and interest on these bonds as they become due. As the portion of these bonds was considered

E-470 PUBLIC HIGHWAY AUTHORITY
Notes to Basic Financial Statements
December 31, 2015 and 2014
49 | P a g e
defeased (note 7(n)), the liability was removed from the Authority’s statements of net position. Cash became available to fund this transaction when the Authority purchased a $25.0 million surety policy from MBIA to replace these funds within the Senior Bonds Debt Service Reserve account and to meet the fund requirements as specified by the Bond Resolutions (note 3(e)).
(f) Series 2007 Bonds
In June 2007, the Authority issued multiple series of auction-rate bonds including $105.8 million of Series 2007A bonds, $105.8 million of Series 2007B bonds, $105.8 million of Series 2007C bonds, and $105.9 million of Series 2007D bonds to current refund a significant portion of the Series 1997A current interest bonds totaling $409.1 million. As a result, the related liability for the refunded portion of the 1997A bonds was removed from the Authority’s statements of net position. This was the second refunding in a two-step process to level off future debt payments. As a means to hedge its borrowing costs, when compared against fixed-rate bonds at the time of issuance of the 2007 auction-rate bonds, the Authority originally entered into three separate interest rate swap agreements with three different counterparties – George K. Baum & Company (GK Baum), JP Morgan Chase Bank, NA (JP Morgan – JP-1), and Morgan Stanley Capital Services, Inc. (Morgan Stanley – MS-1), two of which remain in effect as of December 31, 2015 and 2014 (note 8). The original 2007 auction-rate Series Bonds were subsequently remarketed in 2008 to fixed-rate and term-rate bonds (as described in note 7(g)).
(g) Remarketing of the Series 2007 Bonds
In May 2008, the Authority remarketed the outstanding 2007 Series auction-rate bonds as fixed-rate and term-rate bonds. The transaction changed the interest mode of the 2007 Series bonds and did not change the annual principal maturities or maturity dates of the original 2007 Series bonds. The Authority remarketed the original Series 2007A auction-rate bonds into $53.3 million of fixed-rate bonds (Subseries 2007A-1) and $52.2 million of term-rate bonds (Subseries 2007A-2); Series 2007B auction-rate bonds into $53.3 million of fixed-rate bonds (Subseries 2007B-1) and $52.2 million of term-rate bonds (Subseries 2007B-2); Series 2007C auction-rate bonds into $53.3 million of fixed-rate bonds (Subseries 2007C-1) and $52.2 million of term-rate bonds (Subseries 2007C-2); and the Series 2007D auction-rate bonds into $53.4 million of fixed-rate bonds (Subseries 2007D-1) and $52.2 million of term-rate bonds (Subseries 2007D-2). The Subseries 2007A-2 and Subseries 2007B-2 term-rate bonds had a redemption date of September 2, 2011 (note 7(k)), and the Subseries 2007C-2 and Subseries 2007D-2 term-rate bonds had a redemption date of September 2, 2013 (note 7(h)).
As a result of converting the Series 2007 auction-rate bonds into fixed and term-rate bonds, the Authority terminated the pay-fixed interest rate swap agreement with GK Baum. Further, the Authority entered into two additional reversing receive-fixed interest rate swaps with Morgan Stanley (2008 LIBOR swap (MS-2) and 2008 SIFMA swap (MS-3)) at the time of the remarketing to partially offset the effect of the two remaining 2007 pay-fixed interest rate swaps, but both reversing swaps have since been fully terminated (note 8).
From June 2007 to May 2008, the two 2007 pay-fixed interest rate swaps with JP Morgan and Morgan Stanley were effectively hedging interest rate risk on the 2007 auction-rate bonds. At the date of remarketing, the negative fair value of the 2007 pay-fixed interest rate swaps was $20.0 million. The Authority is amortizing the effective values deferred from June 2007 to May 2008 as a component of deferred outflows of resources (2008 deferred refunding – note 6)) and interest expense on a
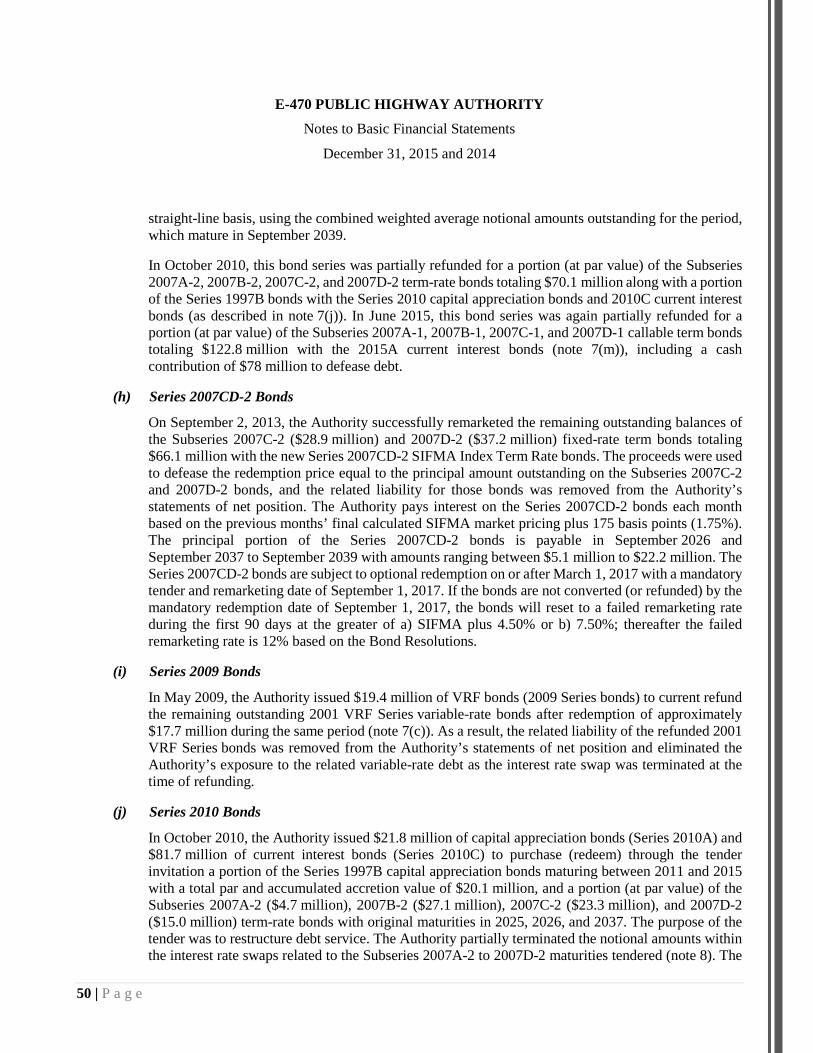
E-470 PUBLIC HIGHWAY AUTHORITY
Notes to Basic Financial Statements
December 31, 2015 and 2014
50 | P a g e
straight-line basis, using the combined weighted average notional amounts outstanding for the period, which mature in September 2039.
In October 2010, this bond series was partially refunded for a portion (at par value) of the Subseries 2007A-2, 2007B-2, 2007C-2, and 2007D-2 term-rate bonds totaling $70.1 million along with a portion of the Series 1997B bonds with the Series 2010 capital appreciation bonds and 2010C current interest bonds (as described in note 7(j)). In June 2015, this bond series was again partially refunded for a portion (at par value) of the Subseries 2007A-1, 2007B-1, 2007C-1, and 2007D-1 callable term bonds totaling $122.8 million with the 2015A current interest bonds (note 7(m)), including a cash contribution of $78 million to defease debt.
(h) Series 2007CD-2 Bonds
On September 2, 2013, the Authority successfully remarketed the remaining outstanding balances of the Subseries 2007C-2 ($28.9 million) and 2007D-2 ($37.2 million) fixed-rate term bonds totaling $66.1 million with the new Series 2007CD-2 SIFMA Index Term Rate bonds. The proceeds were used to defease the redemption price equal to the principal amount outstanding on the Subseries 2007C-2 and 2007D-2 bonds, and the related liability for those bonds was removed from the Authority’s statements of net position. The Authority pays interest on the Series 2007CD-2 bonds each month based on the previous months’ final calculated SIFMA market pricing plus 175 basis points (1.75%). The principal portion of the Series 2007CD-2 bonds is payable in September 2026 and September 2037 to September 2039 with amounts ranging between $5.1 million to $22.2 million. The Series 2007CD-2 bonds are subject to optional redemption on or after March 1, 2017 with a mandatory tender and remarketing date of September 1, 2017. If the bonds are not converted (or refunded) by the mandatory redemption date of September 1, 2017, the bonds will reset to a failed remarketing rate during the first 90 days at the greater of a) SIFMA plus 4.50% or b) 7.50%; thereafter the failed remarketing rate is 12% based on the Bond Resolutions.
(i) Series 2009 Bonds
In May 2009, the Authority issued $19.4 million of VRF bonds (2009 Series bonds) to current refund the remaining outstanding 2001 VRF Series variable-rate bonds after redemption of approximately $17.7 million during the same period (note 7(c)). As a result, the related liability of the refunded 2001 VRF Series bonds was removed from the Authority’s statements of net position and eliminated the Authority’s exposure to the related variable-rate debt as the interest rate swap was terminated at the time of refunding.
(j) Series 2010 Bonds
In October 2010, the Authority issued $21.8 million of capital appreciation bonds (Series 2010A) and $81.7 million of current interest bonds (Series 2010C) to purchase (redeem) through the tender invitation a portion of the Series 1997B capital appreciation bonds maturing between 2011 and 2015 with a total par and accumulated accretion value of $20.1 million, and a portion (at par value) of the Subseries 2007A-2 ($4.7 million), 2007B-2 ($27.1 million), 2007C-2 ($23.3 million), and 2007D-2 ($15.0 million) term-rate bonds with original maturities in 2025, 2026, and 2037. The purpose of the tender was to restructure debt service. The Authority partially terminated the notional amounts within the interest rate swaps related to the Subseries 2007A-2 to 2007D-2 maturities tendered (note 8). The

E-470 PUBLIC HIGHWAY AUTHORITY
Notes to Basic Financial Statements
December 31, 2015 and 2014
51 | P a g e
net proceeds were used to purchase portions of the 1997B capital appreciation bonds and Subseries 2007A-2 to 2007D-2 term-rate bonds and pay the 1% redemption premium and any accrued interest related to the tendered bonds with the new 2010A and 2010C bonds for debt service. As a result, the related liabilities of the tendered portions of the Series 1997B and Subseries 2007A-2 to 2007D-2 bonds were removed from the Authority’s statements of net position.
(k) Series 2011 Bonds
In September 2011, the Authority refunded the remaining outstanding balances of the Subseries 2007A-2 ($47.5 million) and 2007B-2 ($25.1 million) fixed-rate term bonds totaling $72.6 million with the Series 2011A SIFMA Index Term Rate bonds. The proceeds of $72.6 million were used to defease the outstanding Subseries 2007A-2 and 2007B-2 bonds, and the related liability for those bonds was removed from the Authority’s statements of net position. The Authority paid interest on the Series 2011A bonds each month based on the previous months’ final calculated SIFMA market pricing plus 272 basis points (2.72%) up through February 2014, as the bonds were fully refunded on March 3, 2014 (as described in note 7(l)).
(l) Series 2014 Bonds
On March 3, 2014, the Authority refunded the Series 2011A SIFMA Index Term Rate bonds with the Series 2014A SIFMA Index Term Rate bonds totaling approximately $72.6 million at par. The Series 2011A bonds were subject to optional early redemption on or after March 1, 2014 with a mandatory tender and remarketing date of September 1, 2014. The Authority exercised the early redemption option to take advantage of low interest rates and debt service savings. The Series 2011A bonds paid interest each month based on the previous months’ final calculated SIFMA market pricing plus 272 basis points (2.72%), which were refunded with the new Series 2014A SIFMA Index bonds plus 118 basis points (1.18%), saving the Authority over 1.54% in monthly interest costs. The proceeds of $72.6 million were used to defease the outstanding Series 2011A bonds, and the related liability for those bonds were removed from the Authority’s statements of net position. The Authority used funds from the General Surplus account (Senior Bond Defeasance Fund) to pay all related underwriting fees and other issuance costs totaling approximately $0.8 million.
The principal portions of the Series 2014A bonds are payable in September 2026 and September 2037 to September 2039 with amounts ranging between $13.5 million and $22.3 million. These principal amounts due did not change from the refunded Series 2011A bonds principal debt service requirements. The Series 2014A SIFMA Index Term Rate bonds are subject to optional early redemption on or after March 1, 2017 with a mandatory tender and remarketing date of September 1, 2017. If the bonds are not converted (or refunded) by the mandatory redemption date of September 1, 2017, the bonds will reset to a failed remarketing rate during the first 90 days at the greater of a) SIFMA plus 4.50% or b) 7.50%; thereafter, the failed remarketing rate is 10%.
The refunding resulted in a difference between the reacquisition price and the net carrying amount of the old debt of $6.1 million in the prior year. This difference, reported in the accompanying basic financial statements as a component of deferred outflows of resources within the 2014 deferred refunding balance, is being amortized as a component of interest expense over the shorter life of the old (including previous refunded debt) and the new debt, which is 2026. The refunding resulted in a net present value economic gain of $45.4 million, which is based on comparing the refunded bonds
E-470 PUBLIC HIGHWAY AUTHORITY
Notes to Basic Financial Statements
December 31, 2015 and 2014
52 | P a g e
debt service at the failed remarketing rate of 10% from September 1, 2017 until final maturity in 2039, versus an estimated interest rate of 7.5% on the Series 2014A bonds from the refunding date of September 1, 2017 to final maturity in 2039. Using these same assumptions, the refunding reduces debt service payments in the years 2014 to and including 2039 by $75.6 million.
(m) Series 2015 Bonds
On June 24, 2015, the Authority successfully closed the 2015 bond transaction, which included a cash contribution to partially pay off callable debt and refund the remaining portion. The Authority had a call opportunity for a portion (at par value) of the Subseries 2007A-1 bonds ($30.7 million), 2007B-1 bonds ($30.7 million), 2007C-1 bonds ($30.7 million), and 2007D-1 bonds ($30.7 million) totaling approximately $122.8 million in term bonds with original maturities between 2019 and 2024. The Authority, as part of its debt management plan, contributed approximately $78 million in cash from the unrestricted Senior Bonds Defeasance Fund of the General Surplus account to cash defease a significant portion of the callable debt, pay for all related underwriting fees and other issuance costs totaling approximately $0.8 million, and refunded the remaining portion at a par amount of $41.5 million (not including the 2015A bond premium of $4.1 million). Also, as the 2007 callable bonds were linked to the Authority’s outstanding interest rate swaps, the Authority fully terminated the Morgan Stanley 2008 SIFMA interest rate swap (MS-3) and partially terminated the 2007 LIBOR interest rate swaps with Morgan Stanley (MS-1) and JP Morgan (JP-1) for a net termination payment of $3.8 million from the unrestricted Senior Bonds Defeasance Fund (note 8).
The interest rates on the new maturities range between 2.00% and 5.00%, and new principal amounts due between September 1, 2016 and September 1, 2020 have a range between $0.2 million and $20.6 million. The 2007 term bonds were callable on September 1, 2015, but the Authority used the opportunity to price and close the refunded bonds in June due to favorable market conditions with an escrow to make the necessary payments on September 1, 2015. The related liabilities for the applicable portions of the 2007 refunded bonds were removed from the Authority’s statements of net position. The transaction partially alleviated the increasing debt service over the next several years and set up the Authority with opportunities in the next five years to get to level annual debt service, a significant goal in the debt management plan.
The refunding resulted in a difference between the reacquisition price and the net carrying amount of the old debt of $9.0 million in the prior year. This difference, reported in the accompanying basic financial statements as a component of deferred outflows of resources within the 2015 deferred refunding balance, is being amortized as a component of interest expense over the shorter life of the old (including previous refunded debt) and the new debt, which is 2020. The refunding resulted in a net present value economic gain of $18.5 million, which factors in the unrestricted cash contribution of $81.8 million from the Authority to cash defease debt early and terminate the applicable interest rate swaps. The refunding, including the cash contribution, reduces debt service payments in the years 2016 to and including 2020 by $116.1 million.
E-470 PUBLIC HIGHWAY AUTHORITY
Notes to Basic Financial Statements
December 31, 2015 and 2014
53 | P a g e
(n) Legal Defeasance of Senior Revenue Bonds
Various bonds previously issued by the Authority have been legally defeased and, thus, are not reflected as bonds payable in the Authority’s statements of net position. The Authority has entered into advance refunding transactions in the past whereby bonds were issued to facilitate the defeasance of the Authority’s obligations with respect to certain refunded bonds. In these advanced refunding transactions, an escrow agreement was entered into, and a portion of the proceeds was deposited in an escrow account. The deposited amounts, along with planned interest earnings, are used by the Trustee to pay principal and interest due until redemption. At December 31, 2015 and 2014, the Authority does not have any outstanding principal balances due from an advanced refunding escrow account.
(8) Derivative Instruments
The Authority has multiple interest rate swap agreements that are considered investment derivatives under GASB Statement No. 53, Accounting and Financial Reporting for Derivative Instruments, as of December 31, 2015 and 2014.
As a means to hedge its borrowing costs, when compared against fixed-rate bonds at the time of issuance of the Series 2007 auction-rate bonds in June 2007, the Authority originally entered into separate pay-fixed, receive-floating LIBOR interest rate swap agreements with Morgan Stanley (MS-1) and JP Morgan (JP-1) (formerly known as Bear Stearns). The intention of these two pay-fixed swaps was to effectively change the Authority’s variable interest rate on the Series 2007 auction-rate bonds to a synthetic fixed rate of 3.832% until final maturity of the bonds in September 2039. As a result of remarketing the Series 2007 auction-rate bonds into fixed and term-rate bonds in May 2008 combined with the negative fair value of the two pay-fixed 2007 LIBOR interest rate swaps with JP Morgan and Morgan Stanley, the Authority entered into two additional “reversing” receive-fixed, pay-floating interest rate swaps at the time of remarketing with Morgan Stanley (2008 LIBOR swap (MS-2) and 2008 SIFMA swap (MS-3)) to partially offset the negative fair value and swap cash flows. The MS-2 interest rate swap matured as it was associated with the remaining Subseries 2007C-2 and 2007D-2 term-rate bonds refunded in September 2013, while the MS-3 interest rate swap was associated with the Subseries 2007A-1, B-1, C-1, and D-1 callable fixed-rate bonds. In October 2010, the Authority issued the Series 2010 bonds and partially terminated the notional amounts within the interest rate swaps related to the Subseries 2007A-2 to 2007D-2 maturities tendered. The reduction (unwind) of the swap notional amounts on the date of the swap terminations of the MS-1, MS-2, and JP-1 swaps was $35.1 million, $70.1 million, and $35.1 million, respectively.
In August 2011, the Authority refunded the remaining outstanding balances of the Subseries 2007A-2 ($47.5 million) and 2007B-2 ($25.1 million) fixed-rate term bonds with the Series 2011A SIFMA Index Term Rate bonds totaling $72.6 million. The Subseries 2007A-2 and 2007B-2 bonds originally corresponded with the offsetting 2008 swap (MS-2), which had approximately $72.6 million of notional amounts that matured on September 1, 2011 leading to an overall reduction in notional amount. Additionally, the swap agreements were amended for the portions of the Authority’s two 2007 pay-fixed LIBOR interest rate swaps (MS-1 and JP-1), which also have outstanding notional amounts from 2026 to 2039 related to the new outstanding Series 2011A bond maturities. However, the relationship between the Series 2011A bonds and the two 2007 swaps did not meet the requirements of a hedging derivative instrument; therefore, the related swap fair values were recorded as investment derivatives as of December 31, 2013. The Authority refunded the 2011A bonds in March of 2014.

E-470 PUBLIC HIGHWAY AUTHORITY
Notes to Basic Financial Statements
December 31, 2015 and 2014
54 | P a g e
In June 2012, Moody’s downgraded Morgan Stanley’s long-term debt ratings from “A2” to “Baa1,” which triggered an additional termination event per the original swap agreement where the swap counterparty was required to maintain a rating of at least “Aa3” from Moody’s. In December 2012, the Authority amended the terms of the original swap agreement to allow Morgan Stanley to remain as the swap counterparty by reducing the ratings requirements to “Baa2” from Moody’s, “BBB” from Standard and Poor’s, and “BBB” from Fitch. In reducing the ratings requirements, Morgan Stanley provided the Authority consideration, which was split into two separate periods to reduce the swap settlement payments by $0.5 million in both fiscal years 2013 and 2015 on the MS-1 pay-fixed interest rate swap. The original fixed rate on the MS-1 swap of 3.832% will remain for all fiscal periods except for 2013 and 2015 where the rate will be reduced to 3.412%. If triggered again, the Authority may terminate or require the swap to be reassigned to a counterparty that meets the ratings requirements.
In September 2013, the Authority refunded the remaining outstanding balances of the Subseries 2007C-2 ($28.9 million) and 2007D-2 ($37.2 million) fixed-rate term bonds with the Series 2007CD-2 SIFMA Index Term Rate bonds totaling $66.1 million (note 7(h)). The Subseries 2007C-2 and 2007D-2 bonds originally corresponded with the offsetting 2008 swap (MS-2), which had approximately $66.1 million of notional amounts that matured on September 1, 2013 leading to an overall reduction in notional amount. Additionally, the 2007 MS-1 and JP-1 swaps also have outstanding notional amounts from 2026 to 2039 related to the new outstanding Series 2007CD-2 bond maturities. The Authority pays variable interest on the Series 2007CD-2 bonds each month based on the previous months’ final SIFMA market pricing plus 175 basis points (1.75%). This spread plus the MS-1 and JP-1 pay-fixed interest rate of 3.832% leads to an effective interest rate of 5.582% on the outstanding Series 2007CD-2 bonds during the term-rate period, where the Authority takes on the basis risk between LIBOR (swaps) and SIFMA (bonds). However, the relationship between the Series 2007CD-2 bonds and the two 2007 swaps did not meet the requirements of a hedging derivative instrument; therefore, the related swap fair values were recorded as investment derivatives as of December 31, 2015.
In March 2014, the Authority refunded the 2011A SIFMA Index Term Rate bonds with the Series 2014A SIFMA Index Term Rate bonds totaling $72.6 million (note 7(l)). The 2007 MS-1 and JP-1 swaps have outstanding notional amounts from 2026 to 2039 related to the new outstanding Series 2014A bond maturities. The Authority pays variable interest on the Series 2014A bonds each month based on the previous months’ final SIFMA market pricing plus 118 basis points (1.18%). This spread plus the MS-1 and JP-1 pay-fixed interest rate of 3.832% leads to an effective interest rate of 5.012% on the outstanding Series 2014A bonds during the term-rate period, where the Authority takes on the basis risk between LIBOR (swaps) and SIFMA (bonds). However, the relationship between the Series 2014A bonds and the two 2007 swaps did not meet the requirements of a hedging derivative instrument; therefore, the related swap fair values were recorded as investment derivatives as of December 31, 2015.
In June 2015, the Authority issued the Series 2015 bonds, which included a cash contribution from unrestricted funds to defease callable debt early and refunded the remaining amount as the new 2015A bonds (note 7(m)). Since the original 2007A-1 to 2007D-1 callable maturities were linked to all three outstanding interest rate swaps, the Authority fully terminated the Morgan Stanley 2008 SIFMA interest rate swap (MS-3) at a positive value of $13.1 million and partially terminated the 2007 LIBOR interest rate swaps with Morgan Stanley (MS-1) at a negative value of $8.6 million and JP Morgan (JP-1) at a negative value of $8.3 million for a net termination payment of $3.8 million from the unrestricted Senior Bonds Defeasance Fund. The net swap termination is reflected within investment revenues – net change in the fair value of derivative instruments on the statement of revenues, expenses, and changes in net position for the year ended

E-470 PUBLIC HIGHWAY AUTHORITY
Notes to Basic Financial Statements
December 31, 2015 and 2014
55 | P a g e
December 31, 2015. The partial reduction (unwind) of the swap notional amounts related to the callable bonds on the date of the swap terminations of both the MS-1 and JP-1 swaps was $50.9 million each. The full termination of the MS-3 swap reduced the entire reversing swap notional amount by $101.7 million.
During 2015, the Authority recognized, on the accrual basis, swap settlements on the 2007 pay-fixed swaps (MS-1 and JP-1) of $6.3 million and received swap settlements on the 2008 receive-fixed swap (MS-3) of $1.5 million up to June 2015, for a net swap settlement differential of $4.8 million during the year. During 2014, the Authority recognized swap settlements on the 2007 pay-fixed swaps (MS-1 and JP-1) of $8.9 million and received swap settlements on the 2008 receive-fixed swap (MS-2 and MS-3) of $3.5 million, for a net swap settlement differential of $5.4 million during the year.
The following table provides a summary of the Authority’s investment derivative interest rate swaps as of December 31, 2015 and 2014:
Original 2015 2014Effective Maturity notional notional notional
Swap Counterparty date date Terms amount amount amount
JP-1 JP Morgan June 14, 2007 September 1, 2039 Pay 3.832%; receive $ 155,252,500 69,320,000 120,190,000 67% one-month LIBOR
MS-1 Morgan June 14, 2007 September 1, 2039 Pay 3.832%; receive 155,252,500 69,320,000 120,190,000 Stanley 67% one-month LIBOR*
Total notional amountsfor pay-fixed swaps $ 310,505,000 138,640,000 240,380,000
MS-3 Morgan May 30, 2008 September 1, 2024** Receive 3.518%; $ 101,740,000 — 101,740,000 Stanley pay SIFMA index
Total notional amountsfor receive-fixed swaps $ 101,740,000 — 101,740,000
* The MS-1 swap was amended in 2012 to reduce the fixed-rate to 3.412% in fiscal years 2013 and 2015 only.** The MS-3 swap was terminated on June 10, 2015 as part of the 2015A bond transaction. The fair values of the interest rate swap derivatives are provided to the Authority from the swap counterparties using valuation dates consistent with the Authority’s reporting period. The Authority values the interest rate swap derivatives based on the swaps’ monthly quoted market prices from its counterparties, and has subscribed to an independent monitoring service to assist in the review of the monthly cash flows and fair market valuations received. The fair values are based on the notional amounts outstanding and swap reference rate, and are estimated based on the present value of their estimated future cash flows.
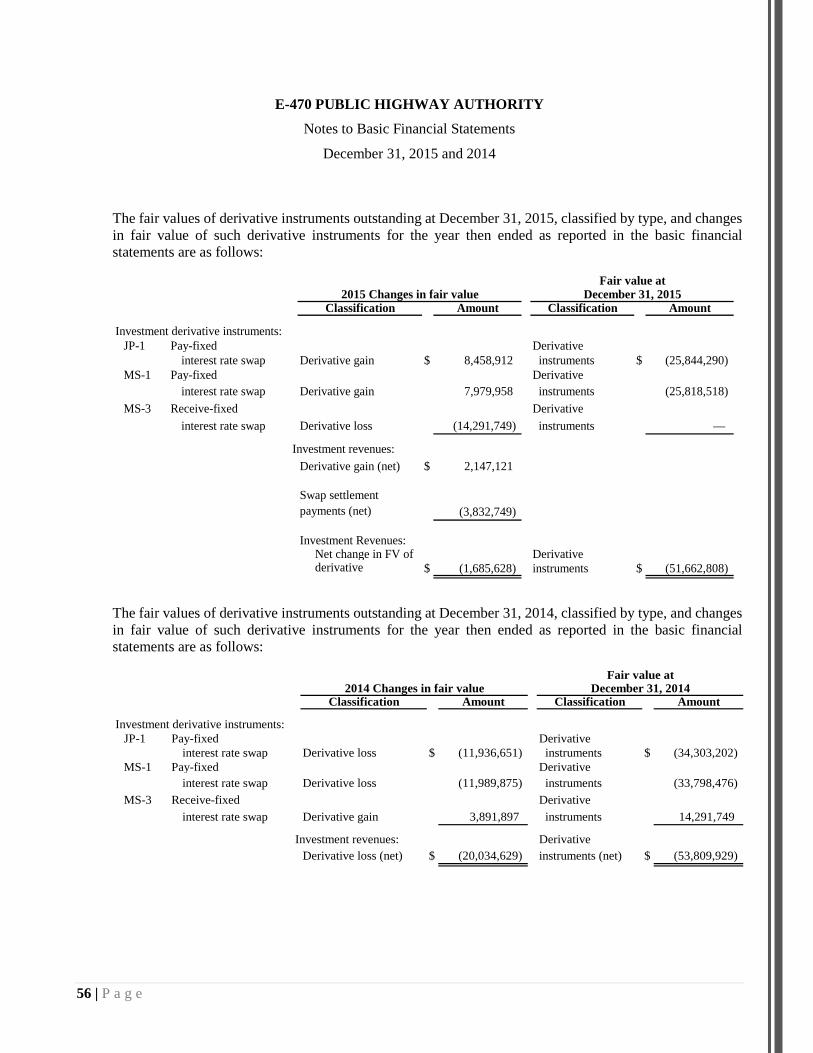
E-470 PUBLIC HIGHWAY AUTHORITY
Notes to Basic Financial Statements
December 31, 2015 and 2014
56 | P a g e
The fair values of derivative instruments outstanding at December 31, 2015, classified by type, and changes in fair value of such derivative instruments for the year then ended as reported in the basic financial statements are as follows:
Fair value at2015 Changes in fair value December 31, 2015
Classification Amount Classification Amount
Investment derivative instruments:JP-1 Pay-fixed Derivative
interest rate swap Derivative gain $ 8,458,912 instruments $ (25,844,290) MS-1 Pay-fixed Derivative
interest rate swap Derivative gain 7,979,958 instruments (25,818,518) MS-3 Receive-fixed Derivative
interest rate swap Derivative loss (14,291,749) instruments —
Investment revenues:Derivative gain (net) $ 2,147,121
Swap settlement payments (net) (3,832,749)
Investment Revenues: Net change in FV of Derivative derivative $ (1,685,628) instruments $ (51,662,808)
The fair values of derivative instruments outstanding at December 31, 2014, classified by type, and changes in fair value of such derivative instruments for the year then ended as reported in the basic financial statements are as follows:
Fair value at2014 Changes in fair value December 31, 2014
Classification Amount Classification Amount
Investment derivative instruments:JP-1 Pay-fixed Derivative
interest rate swap Derivative loss $ (11,936,651) instruments $ (34,303,202) MS-1 Pay-fixed Derivative
interest rate swap Derivative loss (11,989,875) instruments (33,798,476) MS-3 Receive-fixed Derivative
interest rate swap Derivative gain 3,891,897 instruments 14,291,749
Investment revenues: DerivativeDerivative loss (net) $ (20,034,629) instruments (net) $ (53,809,929)

E-470 PUBLIC HIGHWAY AUTHORITY
Notes to Basic Financial Statements
December 31, 2015 and 2014
57 | P a g e
(a) Credit Risk
Credit risk can be measured by actual market value exposure or theoretical exposure. When the fair value of any swap has a positive fair market value, the Authority is exposed to the actual risk that the counterparty will not fulfill its obligations. As of December 31, 2014, the Authority had credit risk at fair value on the offsetting 2008 swap (MS-3), which was fully terminated in June of 2015:
2015 2014MS-3 Receive-fixed interest rate swap $ — 14,291,749
Under the current swap agreements, JP Morgan Chase Bank, N.A. is required to maintain credit quality ratings of “Aa3” by Moody’s or “AA–” by S&P, while Morgan Stanley Capital Services Inc. is required to maintain credit quality ratings of at least two of the following ratings, which is a “Baa2” from Moody’s, “BBB” from Standard and Poor’s, and “BBB” from Fitch. As of December 31, 2015, the swap counterparties had the following ratings from Moody’s, S&P, and Fitch:
Standard &Counterparty Moody’s Poor's Fitch
JP Morgan Aa3 A+ AA-Morgan Stanley A3 BBB+ A
Due to ratings adjustments with both swap counterparties over the past few years, the Authority entered into a separate credit support annex agreement with Morgan Stanley in 2010 during the time of the 2010 tender transaction, and entered into a credit support annex agreement with JP Morgan in April 2013 due to their S&P rating downgrade to A+ in 2011. Under these agreements, the Authority can require the counterparty to post collateral at any time when the aggregate fair market value of the Morgan Stanley swaps or the separate JP Morgan swap is an asset to the Authority; however, these counterparty rating downgrades did not trigger a termination event. The Authority monitors its fair market value and the ratings on its counterparties regularly to determine if credit risk is a concern. The Authority has not calculated theoretical credit exposure on its swaps. There is no master netting agreement between the Authority and either counterparty.
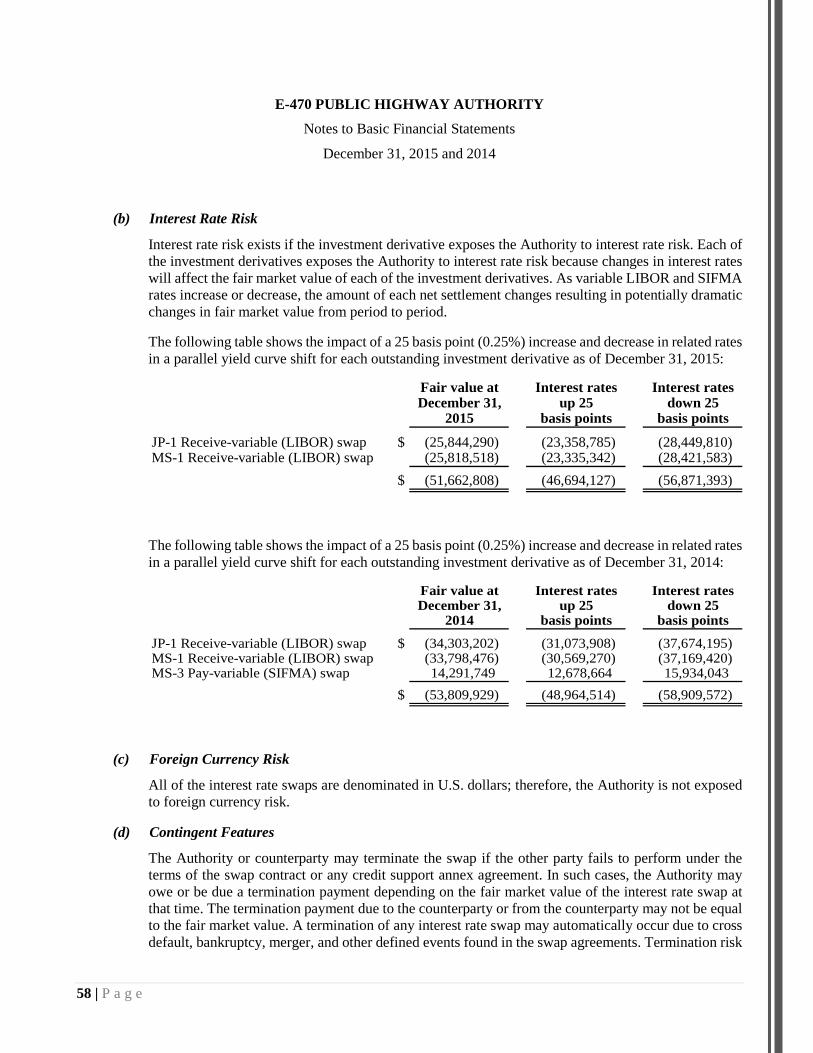
E-470 PUBLIC HIGHWAY AUTHORITY
Notes to Basic Financial Statements
December 31, 2015 and 2014
58 | P a g e
(b) Interest Rate Risk
Interest rate risk exists if the investment derivative exposes the Authority to interest rate risk. Each of the investment derivatives exposes the Authority to interest rate risk because changes in interest rates will affect the fair market value of each of the investment derivatives. As variable LIBOR and SIFMA rates increase or decrease, the amount of each net settlement changes resulting in potentially dramatic changes in fair market value from period to period.
The following table shows the impact of a 25 basis point (0.25%) increase and decrease in related rates in a parallel yield curve shift for each outstanding investment derivative as of December 31, 2015:
Fair value at Interest rates Interest ratesDecember 31, up 25 down 25
2015 basis points basis points
JP-1 Receive-variable (LIBOR) swap $ (25,844,290) (23,358,785) (28,449,810) MS-1 Receive-variable (LIBOR) swap (25,818,518) (23,335,342) (28,421,583)
$ (51,662,808) (46,694,127) (56,871,393)
The following table shows the impact of a 25 basis point (0.25%) increase and decrease in related rates in a parallel yield curve shift for each outstanding investment derivative as of December 31, 2014:
Fair value at Interest rates Interest ratesDecember 31, up 25 down 25
2014 basis points basis points
JP-1 Receive-variable (LIBOR) swap $ (34,303,202) (31,073,908) (37,674,195) MS-1 Receive-variable (LIBOR) swap (33,798,476) (30,569,270) (37,169,420) MS-3 Pay-variable (SIFMA) swap 14,291,749 12,678,664 15,934,043
$ (53,809,929) (48,964,514) (58,909,572)
(c) Foreign Currency Risk
All of the interest rate swaps are denominated in U.S. dollars; therefore, the Authority is not exposed to foreign currency risk.
(d) Contingent Features
The Authority or counterparty may terminate the swap if the other party fails to perform under the terms of the swap contract or any credit support annex agreement. In such cases, the Authority may owe or be due a termination payment depending on the fair market value of the interest rate swap at that time. The termination payment due to the counterparty or from the counterparty may not be equal to the fair market value. A termination of any interest rate swap may automatically occur due to cross default, bankruptcy, merger, and other defined events found in the swap agreements. Termination risk

E-470 PUBLIC HIGHWAY AUTHORITY
Notes to Basic Financial Statements
December 31, 2015 and 2014
59 | P a g e
is a contingent feature of the investment derivatives and is described below. The Authority is not required to post collateral under its swap agreements.
Termination Risk: The 2007 LIBOR interest rate swap agreements (JP-1 and MS-1) expire on September 1, 2039, while the 2008 SIFMA swap agreement with Morgan Stanley (MS-3) had a termination date of September 1, 2024, but was fully terminated in June of 2015. All swap agreements are subject to early termination by the parties in certain specified events. These events include events of default; a failure by the swap insurer (MBIA – administered by National Public Finance Guarantee (NPFG)), to maintain specified financial strength, claims paying ability, or equivalent ratings; and other ratings of the Authority and swap counterparty falling below the specified ratings in the swap agreements. Besides the substitution event with Morgan Stanley amended in December of 2012, no additional early automatic termination events were triggered as of December 31, 2015 and 2014. NPFG’s financial strength and claims paying ability ratings has remained consistent at “A-” from S&P; however, their rating does not cause automatic termination and settlement of the swaps alone. The Authority’s underlying senior bond rating would have to go below BBB– by S&P or Baa3 by Moody’s to cause a termination event. As of December 31, 2015 and 2014, the Authority’s underlying senior bond rating was BBB+ and BBB, respectively, by S&P and Baa1 and Baa2, respectively, by Moody’s. If the swap agreements had an unscheduled ending, any associated termination payments would not impact the Authority’s asset/liability strategy as the Authority holds approximately $188.3 million and $215.1 million in total unrestricted funds at December 31, 2015 and 2014, respectively. In addition, the Authority has the ability to exercise, at its sole discretion, early termination of the swap agreements at a mutually agreed-upon price for any reason.
Further, in August 2011, in conjunction with the issuance of the Series 2011A bonds and continuing with the new 2014A bonds, the Authority and the swap insurer, NPFG, entered into an amendment to the original swap insurance agreements to insert a provision stating that if, at any time during the remaining term of the 2007 pay-fixed swaps, the estimated settlement amount based on the swap fair value report is equal to or less than a liability balance of $2.0 million, the Authority may be notified by NPFG to terminate the swap or may seek to cancel swap insurance coverage under the original 2007 and 2008 swap policies. As of December 31, 2015 and 2014, the negative fair value (liability balance) of the specific swap notional amounts related to the Series 2014A bonds was $26.3 million and $25.7 million, respectively, and did not trigger a possible termination event during either period.

E-470 PUBLIC HIGHWAY AUTHORITY
Notes to Basic Financial Statements
December 31, 2015 and 2014
60 | P a g e
(9) Notes Payable
The following is an analysis of changes in notes payable for the years ended December 31, 2015 and 2014:
Balance at Balance at DueJanuary 1, December 31, within one
2015 Additions Reductions 2015 year
Other intergovernmentalagreements $ 1,444,616 — 240,770 1,203,846 240,769
Balance at Balance at DueJanuary 1, December 31, within one
2014 Additions Reductions 2014 year
Other intergovernmentalagreements $ 1,685,385 — 240,769 1,444,616 240,769
The Authority entered into an intergovernmental agreement with Douglas County in 2003 to receive contributed funds for costs of the Jamaica Road interchange ramp construction. Based on this agreement, the remaining contributed funds of $2.4 million as of 2008 are to be repaid in 10 equal payments (noninterest-bearing) beginning in 2011. The annual payment of $0.2 million is made from unrestricted funds.
(10) Other Restricted Noncurrent Liabilities
Other restricted noncurrent liabilities includes the remaining unamortized balance of the 1997 forward delivery agreement and any arbitrage rebate liability to the Authority, if applicable. The following is an analysis of changes in the unamortized balance of the 1997 forward delivery agreement for the years ended December 31, 2015 and 2014:
Balance at Balance atJanuary 1, December 31,
2015 Additions Reductions 2015
$ 2,416,160 — 207,544 2,208,616
Balance at Balance atJanuary 1, December 31,
2014 Additions Reductions 2014
$ 2,623,704 — 207,544 2,416,160
Under the Bond Resolutions, the Authority is required to make scheduled payments with respect to 1997 Senior Bonds by depositing certain moneys into the Senior Bonds Debt Service Account held by the Trustee. The Authority has deemed the reinvestment of these funds for a period prior to the required payment date to be desirable. To facilitate the reinvestment, the Authority entered into a Debt Service Forward Delivery Agreement in December 1997 with U.S. Bank National Association and Lehman Brothers Special Financing Inc. (LBSF). Under the terms of the original agreement in 1997, LBSF agreed to pay a facility fee of

E-470 PUBLIC HIGHWAY AUTHORITY
Notes to Basic Financial Statements
December 31, 2015 and 2014
61 | P a g e
$11.3 million for the opportunity to use the funds to invest in qualified securities. The agreement provides for the appropriate amounts to be available as needed for scheduled debt service payments.
During 2007, 2008, and 2010, the Authority refunded, tendered, and redeemed a portion of the Series 1997A, 1997B, and 1997C bonds, respectively. By entering into these transactions on the Series 1997 bonds, the Authority no longer had a requirement to deposit interest and principal into the Senior Bonds Debt Service Account in the amount that was originally agreed upon when entering into the Debt Service Forward Delivery Agreement with LBSF. Partial termination payments were made to LBSF in 2007 ($6.5 million), 2008 ($0.3 million), and 2010 ($0.2 million). Due to bankruptcy of LBSF, the Authority entered into a novation agreement on June 3, 2013 to transfer the forward delivery agreement from LBSF to Deutsche Bank. No terms of the original agreement were changed, and the Authority did not incur any expenses from the novation. The remaining balance of the 1997 forward delivery agreement is being amortized over the life of the outstanding 1997 bonds, which reach final maturity in September 2026.
The Internal Revenue Code and arbitrage rebate regulations issued by the Internal Revenue Service require rebate to the federal government of excess investment earnings on tax-exempt debt proceeds if the yield on those earnings exceeds the effective yield on the related tax-exempt debt issued. Excess earnings must be rebated every five years or upon maturity of the debt, whichever is earlier. The Authority has an assessed arbitrage rebate liability of $0.3 million as of December 31, 2015 and $0.1 million as of December 31, 2014. Due to the refunding of the 2011A bonds in March 2014, the Authority assessed an arbitrage rebate liability of $0.1 million as of that date, and paid this amount to the Internal Revenue Service during 2014. There were no amounts due in 2015.
(11) Commitments and Contingencies
(a) Tax, Spending, and Debt Limitations
In November 1992, the voters of Colorado approved Amendment 1, referred to as the Taxpayers Bill of Rights (TABOR), which added a new Section 20 to Article X of the Colorado Constitution. TABOR contains tax, spending, revenue, and debt limitations that apply to the State of Colorado and all local governments. Enterprises, defined as government-owned businesses authorized to issue revenue bonds and receiving less than 10% of annual revenue in grants from all state and local governments combined, are excluded from the provisions of TABOR. The Authority’s operations qualify for this exclusion.
(b) Risk Management
The Authority is exposed to various risks of loss related to torts; theft of, damage to, and destruction of assets; errors or omissions; injuries to employees; and natural disasters. The Authority maintains commercial insurance for most risks of loss. Claims, expenses, and liabilities are reported when it is probable that a loss has occurred and the amount of that loss can be reasonably estimated. At December 31, 2015 and 2014, no amounts have been recorded for pending or future claims. Further, claims have not exceeded insurance limits for each of the past three years.
(c) Solar Equipment
The Authority entered into a solar power purchase agreement in July 2011 with Renewable Social Benefit Funds (RSBF), L3C, which provided RSBF the right to install solar power generating facilities

E-470 PUBLIC HIGHWAY AUTHORITY
Notes to Basic Financial Statements
December 31, 2015 and 2014
62 | P a g e
within the Authority’s 16-mile Xcel Energy corridor. Generating facilities were installed at all 18 ramp locations and 4 building locations within this corridor (Authority headquarters, toll plazas B and C, and the central maintenance facility) for an estimated generating capacity of 707 kilowatts. RSBF is responsible for all installation, operation and maintenance, and other associated costs of the entire generating system for a 20-year period. However, the Authority has the right and option, but not the obligation, to purchase the generating system in its entirety on the anniversary of the sixth year of full operation at a mutually agreed-upon fair market value of the solar equipment. If the option is exercised by the Authority, the generating assets will be transferred to the Authority and all responsibilities and aspects of the solar power purchase agreement will be terminated. The estimated buyout price at the exercise date is approximately $2.0 million. The solar generating facilities were fully operational in early 2012.
(d) Intergovernmental Agreement with City of Aurora for 6th Avenue Parkway Extension
The Authority entered into an intergovernmental agreement in 2015 with the City of Aurora regarding the extension of 6th Avenue from its present terminus in an eastward direction from Buckley Air Force Base to East 6th Parkway and E-470. This extension will establish a more direct route of travel, thereby filling a gap in the regional roadway network. In addition, E-470 had a traffic and revenue study performed by CDM Smith in 2012, which indicated that the 6th Avenue Parkway extension would provide future revenue increases for the Authority. In consideration of the potential future revenue impacts, the Authority agreed to contribute $4 million toward the cost of construction in the form of a $2 million contribution and a $2 million loan, which will have a ten year term beginning on the date of disbursement and will bear interest at a rate of 2.5% per annum. Both components of the Authority’s contribution are conditioned upon all other funds being appropriated by the City or otherwise irrevocably committed to the City by third parties. Pursuant to the IGA, these funds will be appropriated by the Authority within the 2017 budget but may be accelerated to 2016 if all conditions are met and with approval of the Authority’s Board of Directors. As the conditional provisions of the IGA have not yet been satisfied by the City of Aurora, no accrual has been made in the financial statements as of December 31, 2015.

E-470 PUBLIC HIGHWAY AUTHORITY
Notes to Basic Financial Statements
December 31, 2015 and 2014
63 | P a g e
(12) Intergovernmental Liability – Ramp Financing
The Authority entered into an intergovernmental agreement in 1995 with the City of Commerce City regarding coordination of road improvements and operations. At that time, the Authority was seeking funding for design and construction of Segments II and III and entered into numerous agreements with local jurisdictions. The agreement with Commerce City included a provision for the Authority to fully finance and construct the west ramps of the Tower Road/Pena Boulevard interchange based on a mutually agreed-upon design if the west ramps had not been constructed by January 1, 2012. As of this date, only the southwest ramp has been designed or constructed, and all other provisions in the agreement have been satisfied. In April 2014, the Authority’s board and Commerce City approved a new intergovernmental agreement regarding funding of the Tower Road/Pena Boulevard Interchange, and the board of directors approved the 2014 capital budget including the outlay of $3.2 million to relieve the Authority of this infrequent obligation. As the capital outlay is probable, the Authority accrued the liability as of December 31, 2013 as an intergovernmental liability for the ramp financing. Commerce City is currently procuring construction services, and as the timing and amount of payments for construction to Commerce City are still unknown, the Authority presents the $3.2 million liability as noncurrent on the statements of net position as of December 31, 2015 and 2014, which corresponds with the cash and cash equivalent limited for construction.
(13) Litigation
The Authority is from time to time involved in various legal proceedings characterized as normally incidental to the business of the Authority. Management does not believe that the outcome of any legal proceedings will have a materially adverse impact on the financial position or results of operations of the Authority.
(14) Retirement Plans
In lieu of Social Security, the Authority contributes 6.2% of all compensation for regular employees to a retirement plan, up to the maximum Federal Insurance Contributions Act (FICA) base level of $118,500 in 2015 and $117,000 in 2014, for a maximum contribution of $7,347 and $7,254 for 2015 and 2014, respectively. Plan members are also required to contribute 6.2% of their annual covered salary. The plan is a defined-contribution plan administered by International City/County Management Association (ICMA) Retirement Corporation. Plan provisions and contribution requirements are established by and can be amended by the Authority’s board of directors. The Authority and its employees each contributed $0.3 million to this plan in 2015 and 2014. Employees are immediately vested.
In addition, the Authority contributes to a 401(a) Retirement Plan covering 10% of all compensation for regular employees. Employees are not allowed to make contributions to the plan. The plan is a defined-contribution plan administered by ICMA Retirement Corporation. Plan provisions and contribution requirements are established by and can be amended by the Authority’s board of directors. Employees are 50% vested at the date of hire and 100% vested after one year of service. The Authority contributed $0.5 million to this plan in 2015 and $0.4 million to this plan in 2014.
(15) Subsequent Events
The Authority has evaluated subsequent events through April 13, 2016, the date the financial statements were available to be issued. This evaluation determined there are no subsequent events that necessitated disclosures or adjustments to the financial statement amounts presented therein.

E-470 PUBLIC HIGHWAY AUTHORITY
Supplementary Information – Revenue Covenant
Year ended December 31, 2015
(Unaudited)
64 | P a g e
Section 7.18 of the Master and Supplemental Bond Resolutions (Bond Resolutions), titled “Revenue Covenant,” requires that there shall be sufficient revenues (as defined) collected, after the provision for the payment of operating expenses (as defined), to produce net income at least 1.30 times the aggregate senior debt service due for the year. For purposes of this provision, revenues, and aggregate senior debt service in a fiscal year were to be reduced by the aggregate debt service due and paid from the VRF Debt Service Fund in such fiscal year on the 2009 VRF Series Bonds, unless paid for from the General Surplus account. The year ended December 31, 2002 was the first fiscal year the revenue covenant was applicable, and such covenant is applicable to all subsequent years through the payment of the Senior Bonds.
For the year ended December 31, 2015, the Authority exceeded the required debt service coverage ratio reporting an actual ratio of 1.78. Below is the calculation for the year ended December 31, 2015:
Revenue:Operating revenues $ 181,909,495 Vehicle registration fees 10,095,783 Unrestricted investment income 5,898,264 Other income 2,132,634
Total revenue 200,036,176
Less operating expenses before depreciation, net of renewal andreplacement expenses (37,925,250)
Net revenue 162,110,926 Less vehicle registration fee bonds aggregate debt service due —
Net income available for senior debt service $ 162,110,926
Aggregate senior debt service due during the year $ 91,119,525
Senior debt service coverage ratio 1.78
The following is a summary description of key terminology of terms identified in the Bond Resolutions. Please refer to the Bond Resolutions for a complete description and additional clarification of the below terms.
Revenue: As defined by the Bond Resolutions, revenue comprises amounts received by the Authority from fees, tolls, rates, and charges for the privilege of traveling on the E-470 toll road. Revenues also include all other amounts derived from or in respect of the ownership or operation of the toll road, which constitute revenues in accordance with generally accepted accounting principles, including accrued toll revenues. Revenues also include vehicle registration fees and other amounts derived from the E-470 toll road, as defined in the Bond Resolutions. Revenues do not include investment income that is externally restricted by credit agreements for purposes other than senior debt service. Revenues also do not include investment income that is noncash in nature, such as unrealized gains (losses), premiums, and discounts.

E-470 PUBLIC HIGHWAY AUTHORITY
Supplementary Information – Revenue Covenant
Year ended December 31, 2015
(Unaudited)
65 | P a g e
The following is a reconciliation of investment income reported in the audited basic financial statements of the Authority for the year ended December 31, 2015 to unrestricted investment income available for senior debt service:
Interest earned on investments per the basic financial statements $ 5,720,817 Less:
Gain on investments (40,267) Restricted investment income (48,385)
Add: Unamortized investment premium 266,099 Unrestricted investment income $ 5,898,264
The following is a reconciliation of other income reported in the audited basic financial statements of the Authority for the year ended December 31, 2015 to other income available for senior debt service:
Other loss per the basic financial statements $ (704,505) Less: Gain on disposal of capital assets (26,463) Add:
Increase in arbitrage rebate 204,095 Other nonoperating expenses 2,659,507
Other income $ 2,132,634
Operating Expense: As defined by the Bond Resolutions, operating expenses are amounts expended for the operation, maintenance, repair, and any other current expenses or obligations required to be paid by the Authority directly attributable to the operation of the E-470 toll road. Operating expenses do not include depreciation expense, interest for debt service, or expenses associated with the renewal and replacement accounts established under the Bond Resolutions. Per the Bond Resolutions, renewal and replacement expenses are to be funded after senior debt service.
The following is a reconciliation of operating expenses before depreciation expense reported in the audited basic financial statements of the Authority for the year ended December 31, 2015 to operating expenses before depreciation expense, net of nonoperating fund expenses, included in the revenue covenant calculation:
Operating expenses before depreciation and interest per the auditedbasic financial statements $ 41,386,029
Less renewal and replacement expenses (3,460,779) Operating expenses before depreciation expense, net of
nonoperating fund expenses $ 37,925,250

E-470 PUBLIC HIGHWAY AUTHORITY
Supplementary Information – Revenue Covenant
Year ended December 31, 2015
(Unaudited)
66 | P a g e
VRF Bonds Aggregate Debt Service: VRF bonds aggregate debt service is the aggregate debt service due and paid from the VRF Debt Service Fund for the year ended December 31, 2015 on the 2009 VRF Series Bonds. VRF bonds aggregate debt service excludes the entire principal and interest amount due in 2015 of $2.5 million as these amounts were paid from the VRF restricted account as specified in the Bond Resolutions.
Aggregate Senior Debt Service Due: For the year ended December 31, 2015, aggregate senior debt service due is all principal and interest paid on outstanding senior bonds (cash basis), which includes Senior Bond Series 1997B, 2004C, 2006A, 2007A-1, 2007B-1, 2007C-1, 2007D-1, 2007CD-2, 2010C, and 2014A, as well as the paid settlement differential on the Authority’s interest rate swaps during the year.
Senior Debt Service Coverage Ratio: Senior debt service coverage ratio is the ratio of net income available for senior debt service to aggregate debt service due during the fiscal year.