e 3- · after t1am injection into c57bl/6 wild-type mice and djungarian hamsters body temperature...
TRANSCRIPT
University of Pisa
Clinical Pathology Specialization School
EFFECTS OF IN VIVO 3-IODOTHYRONAMINE
ADMINISTRATION ON GENE EXPRESSION IN ADIPOSE
TISSUE.
Candidate Supervisor
Dr.Veronica Mariotti Prof. Riccardo Zucchi

1
INDEX
ABSTRACT............................................................................................................................... 2
INTRODUCTION...................................................................................................................... 3
1. T1AM .................................................................................................................................... 3
1.1. T1AM biosynthesis .............................................................................................................. 3
1.2. T1AM metabolism ............................................................................................................... 4
1.3. T1AM receptors ................................................................................................................... 4
1.4. T1AM intracellular transport ................................................................................................ 5
1.5. T1AM effects ....................................................................................................................... 5
2. Gene expression Microarray ................................................................................................... 8
3. Aim of the study................................................................................................................... 10
MATERIALS AND METHODS.............................................................................................. 11
Animals and T1AM treatment................................................................................................... 11
Isolation, amplification and labelling of RNA........................................................................... 11
Microarray hybridization .......................................................................................................... 12
Microarray experimental design ............................................................................................... 12
Microarray data acquisition and analysis .................................................................................. 13
Microarray data validation by RT-qPCR................................................................................... 13
RESULTS ................................................................................................................................ 15
Microarray results .................................................................................................................... 15
RT-qPCR results ...................................................................................................................... 17
DISCUSSION .......................................................................................................................... 19
T1AM up-regulates genes related to lipoprotein function .......................................................... 19
T1AM regulates genes related to lipolysis and beta-oxidation ................................................... 22
T1AM regulates the expression of genes related to adipogenesis ............................................... 23
CONCLUSIONS...................................................................................................................... 25
REFERENCES......................................................................................................................... 26

2
ABSTRACT
Thyroid hormones (THs) control the adipose tissue development and metabolism. They regulate
both adipocyte proliferation and differentiation and, as they cause weight loss by increasing the
metabolic rate, may be useful for obesity treatment. However, due to their cardiotoxic effects,
like tachycardia and arrhythmia, their use is limited to hypothyroid obese patients. Some TH
metabolites have been recently shown to possess the same beneficial metabolic effects as THs
without the same negative effects. A biogenic amine named 3-Iodothyronamine (T1AM), i.e., is
an endogenous compound derived by thyroxine (T4) deiodination and decarboxylation that
affects carbohydrate and lipid metabolism without undesirable side effects. T1AM exhibits
cardiac effects opposite to those associated with thyroid hormones, like bradycardia in mice, and
in isolated working rat heart, it produces a rapid, reversible, dose-dependent decrease in cardiac
output, aortic pressure and coronary flow. These findings suggest that T1AM produces a negative
inotropic and chronotropic effect.
Intraperitoneal injections of T1AM also induce reduction of RQ from 0.9 to 0.7, both in mice and
Djungarian hamsters. This indicates that carbohydrate utilisation is reduced in response to T1AM
and energy requirements are covered by lipid utilisation. Interestingly, the complete RQ shift is
reached 4.5 h after the T1AM injection and persists at least for 24 hours. Ketone bodies in the
urine and the significant loss of body fat mass confirm that lipids are predominantly used to
cover the energy requirements in response to T1AM administration.
The molecular mechanisms by which T1AM favours lipid than glucose catabolism are not
known, but changes in gene expression can be hypothesized, given the delayed and long lasting
phenotypical effects of T1AM.
To verify this hypothesis we analyzed by microarrays the gene expression profiles in
subcutaneous adipose tissues of eight rats chronically treated with T1AM as compared with eight
untreated rats.
Many genes linked to lipid metabolism, adipogenesis and angiogenesis appeared affected by
chronic administration of T1AM, thus explaining, at least in part, the T1AM phenotypic effects
observed in rodents. Furthermore, T1AM influenced the expression of several genes relating to
lipoprotein metabolism that provide new insights on T1AM mechanism of action, like, i.e., the
regulation of cholesterol homeostasis.

3
INTRODUCTION
Thyroid hormones (THs) control the adipose tissue development and metabolism (Viguerie et al.
2002). They regulate adipocyte proliferation and differentiation (Hauner et al. 1989, Darimont et
al. 1993) and, as they cause weight reduction loss by increasing the metabolic rate, may be
indicated for obesity treatment (Krotkiewski 2002). Their use, however, is limited because they
produce thyrotoxic effects including cardiotoxic effects like tachycardia and arrhythmia
(Krotkiewski 2002). The identification of TH analogs that retain anti-obesity efficacy with a few
undesirable side effects is therefore an important research goal. Some TH metabolites have been
recently shown to possess the same beneficial metabolic effects as THs without the same
negative effects. The biogenic amine 3-Iodothyronamine (T1AM) for example, affects
carbohydrate and lipid metabolism without undesirable side effects (Chiellini et al. 2007,
Braulke et al. 2008). Scanlan and collaborators by using synthetic T1AM as a standard in liquid
chromatography/tandem mass spectrometry (LC-MS/MS) assay, demonstrated that T1AM is an
endogenous component of biogenic amine (Scanlan et al. 2004). It has been detected in rat serum
and tissues as well in human and Djungarian hamster blood (Braulke et al. 2008, Saba et al.
2010). The quantitative analysis of its physiological concentration has indicated that T1AM
content is higher in organs than in blood suggesting that some tissues are able to accumulate it
(Saba et al. 2010).
1. T1AM
1.1. T1AM BIOSYNTHESIS
The pathway of endogenous T1AM biosynthesis is still unknown. It has been suggested that
T1AM derives from THs through decarboxylation and deiodination (Scanlan et al. 2004).
Although the iodothyronine-decarboxylating enzyme has not been still identified (Wu et al.
2005). T1AM might be formed by decarboxylation of T4 and rT3, to T4AM and rT3AM
respectively. T4AM is a good substrate for Dio3 and is deiodinated to rT3AM. The sequential
deiodination of rT3AM by Dio1 and Dio2 produces T1AM (Piehl et al. 2008) (figure 1). However,
no direct evidence of T4 or T3 conversion to T1AM is known at present.

4
Figure 1. Pathways suggested for T1AM biosynthesis. Diagonal arrows, deiodination reactions catalyzed by
deiodinases . Horizontal arrows, putative decarboxylation reactions that might represent the first step of T1AM
biosynthesis.
1.2. T1AM METABOLISM
T1AM is substrate for sulfotransferases (SULTs) and SULT1A2, SULT1A3 and SULT1E1 show the
highest activity toward T1AM. It has been hypothesized that SULT action reduces and regulates
the T1AM effects (Pietsch, Scanlan and Anderson 2007). In 2009, Wood and colleagues
demonstrated that T1AM is susceptible to oxidative deamination of the ethylamine side chain by
an amine oxidase that converts it in thyroacetic acid (TA1) whose biological activity is unknown
(Wood et al. 2009).
1.3. T1AM RECEPTORS
The G protein-coupled trace amine-associated receptor 1 (TAAR1) is the first molecular target
suggested to mediate the T1AM effects. T1AM induces the synthesis of cAMP in HEK-293 cells
stably transfected with rat TAAR1 (Scanlan TS et al., 2004). However, T1AM also inhibits the
cAMP synthesis through the interaction with the α2A adrenergic receptor (Adra2A), a Gαi coupled
receptor expressed in many cell types (Regard et al. 2007). Both these receptors interact with
T1AM and the final effect depends on TAAR1/ Adra2A ratio.
T1AM, moreover, inhibits vesicular monoamine transporter (VMAT2), an intracellular
transporter that packages monoamine into synaptic vesicles. This observation is suggestive of a
neuromodulatory role for T1AM (Snead et al. 2007).

5
1.4. T1AM INTRACELLULAR TRANSPORT
T1AM has been recently found to be largely bound to the apoB-100-containing lipoproteins in
human serum. It reversibly binds the apoB-100-containing lipoprotein with an equilibrium
dissociation constant of 17 nM and T1AM /apoB-100 stoichiometry of 1:1. This binding is highly
selective for T1AM and increases its intracellular uptake significantly (Roy, Placzek and Scanlan
2012).
A 2009 study demonstrated that the intracellular transfer of T1AM occurs in multiple cell lines
and involves a specific mechanism of transport that can be saturated and inhibited. T1AM
transport is independent from sodium and chloride and is driven by an outwardly directed proton
gradient. By using a library of siRNA against the entire solute carrier (SLC) superfamily of 403
transporter genes, eight putative T1AM transporters were identified. These transporters
collectively participate in the regulation of T1AM intracellular levels (Ianculescu, Giacomini
and Scanlan 2009).
T1AM uptake is also mediated by non-SLC transporters or by receptor-mediated endocytosis
(Lin and Scanlan 2005).
1.5. T1AM EFFECTS
Intraperitoneal (ip) injections of T1AM in C57BL/6 wild-type mice or Djungarian hamsters
induce numerous effects like bradycardia, hypothermia, hyperglycemia, decrease of metabolic
rate (VO2), reduction of respiratory quotient (RQ), ketonuria and loss of fat mass (Scanlan et al.
2004, Braulke et al. 2008, Regard et al. 2007) (table 1). In Djungarian hamsters, the injection of
50mg T1AM/kg leads to a 10-fold increase of T1AM blood concentration, from 6 nM to 56 nM,
(Braulke et al. 2008) whose origin is unclear whether is pharmacological or physiological.
Most of T1AM effects are detected within minutes after the injection. The bradycardia,
hyperglycemia, hypothermic and hypometabolic state reach a maximum in 1-2 h, while the
complete RQ shift is reached 4.5 h after the T1AM injection. Afterwards, heart activity,
metabolic rate, body temperature and blood glucose levels return to baseline values within 6-8 h,
while the reduced RQ persists for at least 24 h. Ketonuria and the loss of fat mass appear and
revert much later (Scanlan et al. 2004, Braulke et al. 2008, Regard et al. 2007).

6
Table 1. Summary of the T1AM effects. ↑, Increase; ↓, Reduction.
1.5.1 Hypothermic and hypometabolic state
After T1AM injection into C57BL/6 wild-type mice and Djungarian hamsters body temperature
and metabolic rate decrease within minutes. The body temperature falls from 37 to 31°C within
30 min and 90 min later it drops to 29.5°C. The metabolic rate, measured as decrease in VO2,
declines from 2.5 to 1.8 ml/gh within 5 min. Both these effects are reversible: the animals
recover from hypothermia and hypometabolism 6-8 h after the T1AM administration (Braulke et
al. 2008, Scanlan et al. 2004). Noteworthy, the hypothermia is preceded by the decrease in
metabolic rate and the hypothermic effect is interpreted as a result of the reduced metabolic rate
(Braulke et al. 2008).
1.5.2 Negative chronotropy and inotropy
The administration of T1AM to C57BL/6 wild-type mice induces reversible bradycardia: the
heart rate drops from 600 to 350 beats per minute and reverts to normal 6-8 h after the injection
(Scanlan et al. 2004). In isolated working rat hearts perfused with increasing T1AM
concentrations, the heart rate decreases within minutes to an IC50 of 37 µM. It also causes the
fall of cardiac output to an IC50 of 29 µM. Both these effects persist for the whole duration of the
perfusion and revert to normal by removing T1AM (Chiellini et al. 2007).
These findings suggest that T1AM produces a negative inotropic and chronotropic effect.
T1AM also inhibits other cardiac parameters including the aortic pressure and the coronary flow
(Chiellini et al. 2007).

7
1.5.3 Hyperglycemia
In 2007 Regard and colleagues observed that T1AM acts as a regulator of insulin secretion
(Regard et al. 2007). The ip administration of 50mg/kg of T1AM, in fact, increases blood glucose
levels in C57BL/6 wild-type mice. This effect is detectable within minutes after the injection,
reaches a maximum of 250% of the basal value 2h after the treatment and reverts 8 h later. It is
accompanied by a decrease in blood insulin levels and an increase in blood glucagon levels. The
administration of insulin normalizes the blood glucose levels, indicating that peripheral tissues
remain sensitive to insulin during the T1AM treatment (Regard et al. 2007). According to these
findings T1AM has been observed to inhibit the release of insulin from primary murine and
human pancreatic ß-cells in vitro (Regard et al. 2007).
More recently it has been reported that intracerebroventricular (icv) infusion of a 100-fold lower
dose of T1AM (0.5mg/kg) produces even more pronounced effects on peripheral glucose
metabolism in male Wistar rats (Klieverik et al. 2009).
1.5.4 Reduction of the respiratory quotient, ketonuria and loss of fat mass
In both C57BL/6 wild-type mice and Djungarian hamsters, an ip injection of T1AM induces a
reduction of RQ from 0.9 to 0.7 (Braulke et al. 2008). This indicates that the utilisation of
carbohydrates is suppressed in response to T1AM and that the energy requirements are covered
by lipid consumption (Braulke et al. 2008). Interestingly, the complete RQ shift is reached 4.5 h
after the injection and persists for at least 24 h (Braulke et al. 2008). The presence of ketone
bodies in the urine and the significant loss of body fat mass confirm the assumption that lipids
are predominantly used to cover the energy requirements in response to T1AM treatment
(Braulke et al. 2008).
1.5.5 Other effects
Dhillo and colleagues demonstrated that T1AM affects the food intake (Dhillo et al. 2009).
Several hypothalamic nuclei like the paraventricular nucleus and arcuate nucleus are important
regulators of food intake and energy balance. Given that T1AM is present in the brain and
TAAR1 is expressed in the hypothalamic nuclei these authors hypothesized that T1AM plays a
role in regulating the energy homeostasis. They observed that ip or iv injections of low doses of
T1AM (4 and 1.2 µmol/kg, respectively) induced food intake without affecting the metabolic rate
and the locomotor activity in rats and mice (Dhillo et al. 2009). However, at higher doses of
T1AM (50mg/kg) the authors confirmed the previously reported reduction of oxygen

8
consumption and locomotor activity (Braulke et al. 2008). In addition, T1AM injected directly
into the arcuate nucleus of rodents caused a 3-fold increase in food intake, suggesting that T1AM
is an orexigenic compound that acts through the arcuate nucleus to increase the food intake
(Dhillo et al. 2009).
In hypothyroid rats T1AM produces relevant effects on O2 consumption and ROS production by
liver mitochondria. In particular, T1AM reduces oxygen consumption in mitochondria and
increases H2O2 release. This suggests that the electron flow rate along the respiratory chain
decreases in presence of T1AM (Venditti et al. 2011).
2. GENE EXPRESSION MICROARRAY
The microarray technology, introduced in 1995 by a research group of Standford University
(Schena et al. 1995), is a highthroughput technology which provides a global view of gene
expression patterns in biological samples. By the simultaneous evaluation of the expression
levels of thousands of genes, the microarrays allow users to compare two biological samples
(normal VS pathological or treated VS control sample) in order to obtain information on the
molecular mechanisms responsible for their phenotype.
On a solid surface thousands of single strand oligonucleotide sequences (probes) are
immobilized, ready to hybridize to complementary sequences (targets) extracted from the
biological samples of interest. Each gene is represented by thousands of identical probes within a
feature (spot) and a single microarray contains up to tens of thousands of spots (Figure 2).
Figure 2. Schematic representation of a microarray slide. A microarray consists of multiple features (spots). Each
spot is representative of a gene and contains thousand of identical probes (yellow helices).

9
In a typical dual-color microarray experiment total RNA is extracted from the two samples to be
compared. The RNA is converted in cDNA by reverse transcription polymerase chain reaction.
The cDNA of each sample is then labelled with a different fluorescent dye, for example one with
Cy3 (green) and the other with Cy5 (red). The two labelled cDNAs are mixed in the same
quantity and deposited on the microarray slide. After an overnight incubation the sequences of
labelled cDNAs (targets) hybridize to complementary sequences attached on the array (figure 3).
Figure 3. Schematic representation of a dual-color microarray experiment.
The scanning of the microarray surface with a double laser scanner enables to highlight the
fluorescent spots and produces two images. In the first image the Cy3 fluorescence is displayed
as green and in the second the Cy5 fluorescence is displayed as red (figure 4). The overlapping of
the two images produces a single image that is processed to subtract the background
fluorescence and to normalize the obtained data.
The measured red and green fluorescence intensities for each spot are proportional to the amount
of mRNA, corresponding to a specific transcript, expressed by the two compared samples.
For each spot the two fluorescence intensities are translated into numerical values whose ratio
indicates the difference in the expression of each gene between the two samples. A statistical
analysis is then performed to identify those genes whose differential expression is statistically
significant between the two samples of interest.

10
Figure 4. Image acquisition of dual-color microarray. The double laser scanner performs a double scanning and
produces two distinct images for each fluorescent dye. The two images are overlapped to obtain a single image.
3. AIM OF THE STUDY
T1AM slows down the metabolism by blocking carbohydrates utilisation and promoting lipid
consumption. The molecular mechanisms by which T1AM favours the lipid catabolism over
glucose catabolism is not known. As the T1AM effects on fatty acid metabolism outlast all the
other effects (bradycardia, hyperglycemia, hypothermia and hypometbolism) it is reasonable to
expect that the regulation of energy utilization by T1AM derives from changes in gene
expression. To verify this hypothesis we used the microarray technology and analyzed gene
expression profiles in the adipose tissue of rats chronically treated with T1AM as compared to
untreated rats.

11
MATERIALS AND METHODS
ANIMALS AND T1AM TREATMENT
The animals used in this study were male Wistar rats. Prior to any experimental manipulation the
rats were acclimatized for one week in the animal house facility at the Human and
Environmental Science Departement of Pisa University.
The project was approved by the Animal Care and Use committee of the University of Pisa.
Eight rats of about 100–125 g body weight were treated with T1AM by intraperitoneal injection
of 10 mg /Kg twice a day for five days. Eight control rats were treated with T1AM free-
intraperitoneal injection under parallel housing conditions. The rats were sacrificed by guillotine
and the subcutaneous adipose tissue was immediately removed. The tissue samples were flash-
frozen and stored at -80°C until their use.
ISOLATION, AMPLIFICATION AND LABELLING OF RNA
Total RNA was isolated from adipose tissues by the RNeasy Lipid Tissue Mini kit (Qiagen,
Valencia, CA, USA).
Residual DNA was eliminated by on-column DNase digestion using the RNase-Free DNAase
Set (Qiagen, Valencia, CA, USA).
The quantity and purity of total RNA were measured by 260 nm UV absorption and by 260/280
ratio, respectively, using a NanoDrop ND-1000 Spectrophotometer (NanoDrop Technologies,
Wilmington, DE, USA). All RNAs displayed a 260/280 optical density ratio ≥1.9.
The RNA integrity was checked with the Agilent 2100 Bioanalyzer (Agilent Technologies, Palo
Alto, CA, USA) using the Agilent RNA 6000 Nano kit (Agilent Technologies, Palo Alto, CA,
USA). All RNAs displayed a RNA Integrity Number (RIN) ≥8.
One microgram of total RNA from treated and control animals was amplified and labelled with
Cyanine 5 (Cy5) and Cyanine 3 (Cy3) dyes (Agilent Technologies, PaloAlto, CA, USA),
respectively, by the Quick-Amp Labeling kit (Agilent Technologies, Palo Alto, CA, USA). In
order to monitor the experiment, from sample amplification and labelling to microarray
hybridization, a RNA Spike-In (Agilent Technologies, PaloAlto, CA, USA) was added to each
RNA sample.

12
The Cy3 and Cy5 dye incorporation rates were measured by UV absorption at 555 nm and 647
nm, respectively.
Both fluorophores showed a comparable incorporation efficiency ranging between 11 and 15
pmol of dye per µg of amplified RNA.
MICROARRAY HYBRIDIZATION
The hybridization mixture containing 825 ng of Cy3-labelled amplified RNA (corresponding to
9-10 pmol of Cy3 dye), 825 ng of Cy5-labelled amplified RNA (corresponding to 11-12 pmol of
Cy5 dye), 11µl of 10X Blocking Agent, 2.2 µl of 25X fragmentation buffer and 55 µl of 2X GE
hybridization buffer (the last three from the Gene Expression hybridisation kit plus, Agilent
Technologies, Palo Alto, CA, USA) was hybridized to Whole Rat Genome Oligo Microarrays
4x44K (Agilent Technologies, Palo Alto, CA, USA). Each slide contains 4 arrays with 44,000
60-mer oligonucleotide probes representing 41,012 unique probes.
The array hybridisation was performed at 65°C in the Agilent oven (Agilent Technologies, Palo
Alto, CA, USA) for 17 h under constant rotation. After hybridisation, the arrays were washed
following the Quick Amp Labeling protocol (Agilent Technologies, Palo Alto, CA, USA). To
prevent the ozone-mediated fluorescent signal degradation, the arrays were immersed in
Acetonitrile solution (Sigma-Aldrich, St.Louis, MO, USA) for 10 sec and successively in
Stabilization and Drying solution (Agilent Technologies, Palo Alto, CA, USA) for 30 sec. These
last two washes were performed at room temperature.
MICROARRAY EXPERIMENTAL DESIGN
A balanced block design was applied: on each array, two differently labelled samples from the
treated and the control groups were hybridized, for a total of eight arrays (figure 5).
Figure 5. Balanced Block experimental design.

13
MICROARRAY DATA ACQUISITION AND ANALYSIS
Microarray images were acquired by the Agilent scanner G2565BA (Agilent Technologies, Palo
Alto, CA, USA) at 5µm resolution and intensity raw data were extracted by the software Feature
Extraction V10.5 (Agilent Technologies, Palo Alto, CA, USA).
Data preprocessing and statistical analysis were performed by LIMMA (LInear Model of
Microarray Analysis) package (Smyth 2005). The intensity raw data were background subtracted
by the normexp method and normalized within-arrays with the LOESS and between-arrays with
the scale methods, respectively.
For the statistical analysis, the bayesian moderated t-statistic (Smyth 2004) was used and only
genes with Benjamini and Hochberg (Benjamini and Hochberg 1995) adjusted-p-value < 0.01
were considered as differentially expressed.
Pathway-Express was used to map the differentially expressed genes in KEGG pathways
(http://vortex.cs.wayne.edu/projects.htm#Pathway-Express) (Draghici et al. 2007). GeneCards®
(http://www.genecards.org) (Safran et al. 2003), Onto-Express
(http://vortex.cs.wayne.edu/ontoexpress/) (Draghici et al. 2003, Khatri et al. 2002), PubGene
(http://www.pubgene.org/) (Jenssen et al. 2001) and Coremine
(http://www.coremine.com/medical/ ) were used to perform an accurate screening of the
scientific literature concerning the differentially expressed genes.
MICROARRAY DATA VALIDATION BY RT-QPCR
The same RNA samples used in the microarray experiment were used to perform the RT-qPCR
experiments. Total RNAs were reverse transcribed with random and oligo-dT primers by the
QuantiTect Reverse Transcription kit (Qiagen, Valencia, CA, USA). PCR primers were designed
by the Beacon Designer 4.0 software (Premier Biosoft International, Palo Alto, CA, USA) and
synthesized by Sigma-Aldrich (Sigma-Aldrich, St.Louis, MO, USA ). The primer sequences are
listed in table 2.
RT-qPCR was performed by the iCycler iQ instrument (Biorad, Hercules, CA, USA) using the
iQ SYBR Green Supermix (Biorad, Hercules, CA, USA). The amplification protocol was: 3 min
at 95°C (DNA polymerase activation), then 40 cycles at 95°C per 30s (denaturation step), 58–
62°C (depending on primer Tm) per 60s (annealing step) and 72°C per 30s (extension step).
Afterwards, a gradual increase in temperature from 55°C to 95°C at 0.5°C/10s was utilized to

14
build a melting curve. For each primer pair, the amplification efficiency was tested using five
serial dilutions of cDNA carried out in duplicate. To reduce the effects of the biological variation
on the amplification efficiency, a cDNA sample obtained by pooling the RNAs from all the eight
control samples was used. For all the primer pairs the amplification efficiency was between 90
and 110% and the square regression coefficient (r2) was >0.99. The stability of six housekeeping
genes (Mapk6, Kdm2b, Psmd4, Cypa, B2mg, Bact) was evaluated by using geNorm software
(Vandesompele et al. 2002). geNorm identified three housekeeping genes (Psmd4, Cypa and
B2mg) as stable (M<1.5 and V3/4<0.114), which were used to normalize the expression values of
the target genes.
Each sample was run in triplicate to calculate the standard deviation (SD) for the three
experimental replicates. Only the experiments with SD < 0.4 for each group of replicates were
considered The relative expression levels for the target genes in T1AM treated respect to T1AM
untreated tissues were calculated by geNorm method and reported as fold increase or decrease.
One- and two-tailed Wilcoxon signed rank tests were applied to evaluate the statistical
significance of RT-qPCR results by using a threshold p-value ≤ 0.05.
Table 2. Housekeeping genes, target genes and RT-qPCR primers.
Housekeeping genes
Gene
Symbol RefSeq mRNA Forward Primer Reverse Primer Ta
Mapk6 NM_031622.2 5’- GCCACACAAACCGCTGAC -3’ 5’- CCGTTGGGAAAGAGTAGATGC -3’ 58°C
Kdm2b NM_001100679 5’- GCAAGCAAGTCACCAAGG -3’ 5’- TCGTTTCAGATTCCAAAGGG -3’ 58°C Psmd4 NM_031331 5’- AGATGATGCCCTACTGAAGATGAC -3’ 5’- GACGCTCTGAAGGAACTCTGG -3’ 58°C Cypa NM_017101 5’- CAAGACTGAGTGGCTGGATGG -3’ 5’- GCTACAGAAGGAATGGTTTGATGG -3’ 58°C B2mg NM_012512 5’- TCAAGTGTACTCTCGCCATCC -3’ 5’- GCAAGCATATACATCGGTCTCG-3’ 58°C Bact NM_31144 5’- CCACACCCGCCACCAGTTC-3’ 5’- GACCCATACCCACCATCACACC -3’ 60°C
Target genes
Gene
Symbol RefSeq mRNA Forward Primer Reverse Primer Ta
Scarb1 NM_031541 5’- GCAGTGATGATGGAGGACAAGCC -3’ 5’- GAAGACGGTGAAGACGCCAGAAC -3’ 62°C
Hdlpb NM_172039.2 5’- CCATTGCGGTAGAGGTGAAG -3’ 5’- ACGGTGAAGCCAGGAAGG -3’ 58°C
Igfbp2 NM_013122 5’- CCTCTGGAACATCTCTACTC -3’ 5’- ACTGGCTGTGGTTTACTG -3’ 58°C
Ascl5 NM_053607 5’- TGGGATGCTGGGTGTTTG -3’ 5’- TACTTCCTGTGTCTTCTCTGG -3’ 58°C
Apod NM_012777 5’- AGTTGAGGGTGAAGCCAAACAGAG -3’ 5’- GCAGGAATACACGAGGGCATAGC -3’ 62°C
Cebpb NM_024125 5’-ATCGACTTCAGCCCCTACCT-3’ 5’-GGCTCACGTAACCGTAGTCG-3’ 60°C

15
RESULTS
MICROARRAY RESULTS
T1AM chronic administration altered the gene expression in rat subcutaneous adipose tissue.
Specifically, 378 genes were differentially expressed, 268 up-regulated and 110 down-regulated.
Due to the limited information on pathways and gene functional annotations currently retrievable
from databases, only a small group of genes was mapped by Pathway Express. Specifically,
Pathway Express placed 60 differentially expressed genes in 70 pathways (table 3).
To identify other genes that might have an important role in T1AM molecular mechanism of
action, the list of differentially expressed genes was further investigated by an accurate screening
of the scientific literature. By using the information included in OntoExpress, GeneCards,
PubGene and Coremine bioinformatics tools other 20 genes implicated in relevant mechanisms
were identified (table 4).
16
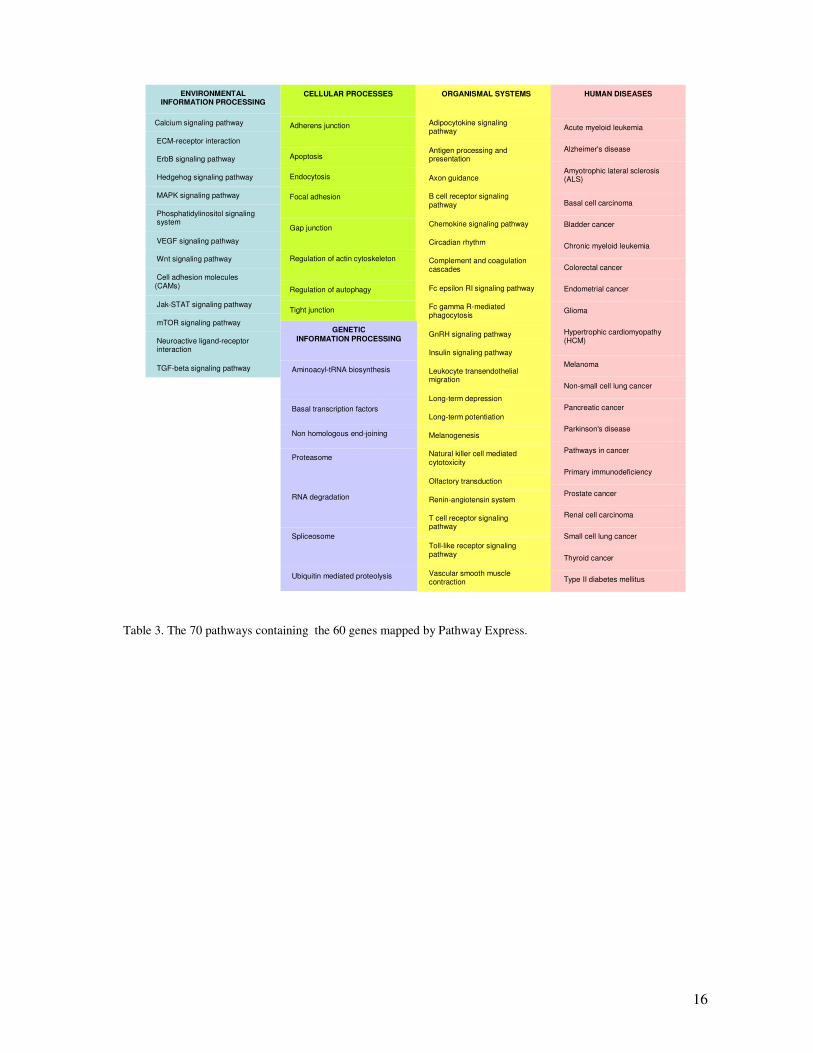
Table 3. The 70 pathways containing the 60 genes mapped by Pathway Express.
TGF-beta signaling pathway
Neuroactive ligand-receptor interaction
mTOR signaling pathway
Jak-STAT signaling pathway
Cell adhesion molecules (CAMs)
Wnt signaling pathway
VEGF signaling pathway
Phosphatidylinositol signaling system
MAPK signaling pathway
Hedgehog signaling pathway
ErbB signaling pathway
ECM-receptor interaction
Calcium signaling pathway
ENVIRONMENTAL INFORMATION PROCESSING
Vascular smooth muscle contraction
Toll-like receptor signaling pathway
T cell receptor signaling pathway
Renin-angiotensin system
Olfactory transduction
Natural killer cell mediated cytotoxicity
Melanogenesis
Long-term potentiation
Long-term depression
Leukocyte transendothelial migration
Insulin signaling pathway
GnRH signaling pathway
Fc gamma R-mediated phagocytosis
Fc epsilon RI signaling pathway
Complement and coagulation cascades
Circadian rhythm
Chemokine signaling pathway
B cell receptor signaling pathway
Axon guidance
Antigen processing and presentation
Adipocytokine signaling pathway
ORGANISMAL SYSTEMS
Type II diabetes mellitus
Thyroid cancer
Small cell lung cancer
Renal cell carcinoma
Prostate cancer
Primary immunodeficiency
Pathways in cancer
Parkinson's disease
Pancreatic cancer
Non-small cell lung cancer
Melanoma
Hypertrophic cardiomyopathy (HCM)
Glioma
Endometrial cancer
Colorectal cancer
Chronic myeloid leukemia
Bladder cancer
Basal cell carcinoma
Amyotrophic lateral sclerosis (ALS)
Alzheimer's disease
Acute myeloid leukemia
HUMAN DISEASES
Tight junction
Regulation of autophagy
Regulation of actin cytoskeleton
Gap junction
Focal adhesion
Endocytosis
Apoptosis
Adherens junction
CELLULAR PROCESSES
Ubiquitin mediated proteolysis
Spliceosome
RNA degradation
Proteasome
Non homologous end-joining
Basal transcription factors
Aminoacyl-tRNA biosynthesis
GENETIC
INFORMATION PROCESSING

17
Table 4. Genes identified using the information contained in OntoExpress, GeneCards, PubGene and Coremine
bioinformatics tools.
RT-QPCR RESULTS
In order to validate the microarray results, six genes differentially expressed between T1AM
treated and untreated rats were selected for the RT-qPCR analysis: Scarb1, Acsl5, Hdlbp, Apod,
Igfbp2, and Cebpb. All these genes were chosen both for their p-value and biological relevance.
The differential expression was confirmed for Igfbp2, Acsl5, Scarb1 and Apod genes. Cebpb
showed the same trend of differential expression evidenced by microarrays but without reaching
any statistical significance. The differential expression of Hdlbp was opposite to that observed
by microarrays and not statistically significant (figure 6).
Genes Fold-Change
direction
Ldlrap1 (LDL receptor adaptor protein 1) ↑
Lrp10 (low-density lipoprotein receptor-related protein10) ↑
Apod (Apolipoprotein D) ↑
Scarb1 (scavenger receptor class B, member 1) ↑
Sirt6 (sirtuin 6) ↑
Lipoprotein functions
Osbpl5 (oxysterol binding protein-like 5) ↑
Adra2c (adrenergic, alpha-2C-, receptor) ↓
G0s2 (G(0)/G(1) switch gene 2) ↓
Acsl5 (acyl-CoA synthetase long-chain family member 5) ↑
Lipolysis and
Beta-oxidation Pex5 (peroxisomal biogenesis factor 5 ) ↑
Stat5b (signal transducer and activator of transcription 5B) ↑
Cebpb (CCAAT/enhancer binding protein (C/EBP), beta) ↓
Pmp22 (peripheral myelin protein 22) ↑
Sirt2 (sirtuin 2) ↑
Nolc1 (nucleolar and coiled-body phosphoprotein 1) ↓
Igfbp2 (insulin-like growth factor binding protein 2) ↓
Dmpk (dystrophia myotonica-protein kinase) ↑
Apln (apelin), ↓
Paqr3 (progestin and adipoQ receptor family member III ) ↑
Adipogenesis
Pla2g2a (phospholipase A2, group IIA (platelets, synovial fluid)
↓

18
Figure 6. The differential expression of six genes, observed by microarrays, was checked by RT-qPCR. Changes in
gene expression were confirmed for four of these genes: Igfbp2, Acsl5, Scarb1 and Apod. The trend of differential
expression evidenced by microarrays was confirmed for Cebpb but not for Hdlbp gene.
19
DISCUSSION
T1AM slows down the metabolism by blocking carbohydrate utilisation and promoting lipid
consumption (Braulke et al. 2008). The molecular mechanism by which T1AM favours lipid over
glucose catabolism is not known. However considering the lasting effects of T1AM on fatty acid
metabolism (Braulke et al. 2008), it is reasonable to expect that the observed shift in energy
utilization arises from changes in gene expression.
In order to investigate the molecular mechanisms underlying the metabolic effects of T1AM,
gene expression profiles were analyzed in the subcutaneous adipose tissue of eight rats
chronically treated with T1AM as compared with eight untreated rats..
Three hundreds and 78 genes resulted differentially expressed. Sixty of them were mapped in 70
pathways by Pathway Express. This limited number of mapped genes depends on the fact that
the information currently present in KEGG (Kyoto Encyclopedia of Genes and Genomes), the
genomic bank on which Pathway Express relies, is still incomplete.
Of the 70 retrieved pathways, as metabolic pathways are not included in Pathway Express, only
three, contribute to explain the T1AM effect on metabolism: the adipocytokine signalling
pathway, the insulin signalling pathway and the phosphatidylinositol signalling pathway. In
addition, many of these pathways were identified by just one mapped gene, which makes their
actual regulation by T1AM difficult to prove..
As a result the pathway analysis was integrated with data obtained by OntoExpress, GeneCards,
PubGene and Coremine bioinformatics tools. This made it possible to identify other 20 genes
implicated in molecular mechanisms relevant to the T1AM metabolic effect.
T1AM UP-REGULATES GENES RELATED TO LIPOPROTEIN FUNCTION
Lipoproteins are delegated to transport lipids, which are insoluble in blood, in the circulatory
system. They are spherical particles with a core composed of cholesterol esters (CE) and
triacylglicerols. Their surface is composed of amphiphilic proteins and lipids whose outward-
facing surfaces are water-soluble and inward-facing surfaces are lipid-soluble. Most of the
adipocyte cholesterol originates from circulating lipoproteins (Yu, Zhao and Hu 2010). De novo
synthesis of cholesterol is, in fact, low in the adipose tissue, as observed in early studies which
reported that the rate of cholesterol synthesis in fat cells is only 4% of that of liver (Kovanen,
Nikkilä and Miettinen 1975).

20
Some genes regulated by T1AM are related to lipoprotein function and five of them are of
particular interest: Ldlrap1 (LDL receptor adaptor protein 1), Lrp10 (low-density lipoprotein
receptor-related protein10), Apod (Apolipoprotein D), Scarb1 (scavenger receptor class B,
member 1), Sirt6 (sirtuin [silent mating type information regulation 2 homolog] 6).
The Ldlrap1 product is an adaptor protein required for efficient endocytosis of low density
lipoprotein receptor (LDLR), which plays a crucial role for the removal of circulating LDLs
(Low Density Lipoproteins) (Michaely et al. 2004). LDLs are the main cholesterol-transporting
lipoproteins in plasma (Mahley et al. 1984). The protein encoded by this gene stabilizes the
association between LDLR and LDL and promotes the internalization of the LDL-LDLR
complex (Michaely et al. 2004).
Alterations in the bond between LDL and LDLR impede the endocytosis of the complex and
lead to an accumulation of LDL in plasma. Elevated plasma levels of LDL are a key risk factor
for the onset of coronary artery disease (Ross 1986).
Lrp10 belongs to the LDLR family and its product mediates the cellular uptake of VLDLs (Very
Low Density Lipoproteins) remnants in vitro (Sugiyama et al. 2000). VLDLs are lipoproteins
produced by the liver, rich in triglycerides and relatively poor in cholesterol. Nascent VLDLs are
released from the liver into the bloodstream and the triglycerides are hydrolysed by lipoprotein
lipase (LPL). The released fatty acids are used by the adipose and muscle tissues for storage or
energy production. The VLDLs, depleted of triglycerides and enriched with cholesterol, are
called VLDL remnants and are degraded by the liver. Sugiyama and colleagues demonstrated
that LRP10, through the interaction with apoE which is abundant in the VLDL remnants, is
involved in their blood clearance (Sugiyama et al. 2000). Lrp10 is also a molecular target of
Ginko Biloba that is known to have cholesterol-lowering effect (Xie et al. 2009).
Apod is an apolipoprotein structurally similar to the lipocalin family proteins that is responsible
for lipid transport. A reduced Apod expression alters the lipid metabolism (Perdomo and Henry
Dong 2009). Plasma Apod is a component of HDLs (High Density Lipoproteins) involved in the
“reverse cholesterol transport” by which the cholesterol is transferred from peripheral tissues to
the liver for biliary excretion (Mahley et al. 1984). Apod modulates the activity of
lecithin:cholesterol acyltransferase (LCAT), an HDL-bound enzyme that catalyzes the
conversion of free cholesterol to CE that is then recruited into the HDL core. An increase in the
cholesterol esterification by LCAT is observed in presence of Apod and the formation of Apod-
LCAT complex has a stabilizing effect on LCAT (Steyrer and Kostner 1988). By enhancing the
cholesterol esterification through LCAT, Apod indirectly promotes the reverse cholesterol
21
transport (Rassart et al. 2000). Moreover, a covalent cross-link between Apod and Apoa-II, a
structural component of HDL, has been identified (Blanco-Vaca et al. 1992).
In the adipocytes, Apod is a target for liver X receptor (LXR) that recognizes cellular cholesterol
in excess (Hummasti et al. 2004, Lehmann et al. 1997). In particular, LXR protects the cells from
cholesterol accumulation, by the activation of the reverse cholesterol transport (Crestani et al.
2004).
The Scarb1 gene codifies an HDL transmembrane receptor that mediates CE transfer from
plasma HDL to tissues without HDL particle degradation (CE selective up-take) (Acton et al.
1996). The protein has horseshoe-like membrane topologies with a large extracellular loop
anchored to the plasma membrane at both the N- and C- extremities (Krieger 2001).
HDL-Scarb1 interaction induces the formation of an hydrophobic channel by which the HDL
unloades the CE. The cholesterol-depleted HDL comes off the receptor and re-enters in circle to
capture other molecules of peripheral cholesterol (Trigatti, Rigotti and Krieger 2000).
Given that Scarb1 regulates the cholesterol levels into plasma HDL, its decrease has been
associated with increased susceptibility to atherosclerosis: Scarb1 KO mice show elevated HDL
cholesterol plasma levels and reduced selective HDL cholesterol clearance(Rigotti et al. 1997,
Out et al. 2004). In addition, the distruption of Scarb1 gene in atherosclerotic mice (APOE -/-)
accelerates the onset of atherosclerosis (Trigatti et al. 1999). These studies suggest a protective
effect of Scarb1 toward atherosclerosis.
Sirt6 codifies a member of sirtuin family that has NAD-dependent deacetylase and ADP-
ribosyltransferase activities (Blander and Guarente 2004, Haigis and Guarente 2006, Liszt et al.
2005). It has been recently observed that transgenic mice overexpressing Sirt6 and fed with high
fat diet accumulate significantly less LDL-cholesterol compared with their wild–type littermates
(Kanfi et al. 2010).
To summarize, T1AM, by modulating the expression of genes related to lipoprotein function,
seems to affect the cholesterol homeostasis. This hypothesis is corroborated by the upregulation
of another gene, Osbpl5 (oxysterol binding protein-like 5) which codifies a member of the
oxysterol-binding protein (OSBP) family that controls the oxysterol activity (Beh et al. 2001).
The oxysterols, oxygenated derivatives of cholesterol, are particularly potent inhibitors of
cholesterol biosynthesis (Gill, Chow and Brown 2008).

22
T1AM REGULATES GENES RELATED TO LIPOLYSIS AND BETA-OXIDATION
Lipolysis hydrolyzes triglycerides and releases glycerol and free fatty acids. It is a catabolic
process that provides energy to the adipose tissue when needed. Some genes related to lipolysis,
like Adra2c (adrenergic, alpha-2C-, receptor) and G0s2 ((G(0)/G(1) switch gene 2)) are down-
regulated by T1AM.
Adra2c is a target of catecholamines that are important regulators of fat cell lipolysis (Langin
2006). Sustained lipid mobilization and an increase in energy expenditure were observed during
administration of an alpha2-adrenoceptor antagonist in dogs and humans (Lafontan and Berlan
1995, Berlan, Montastruc and Lafontan 1992).
The G0s2 protein negatively regulates the activity of the adipose triglyceride lipase (ATGL),
which catalyzes the first step in the hydrolysis of triglycerides. G0s2 protein binds directly to
ATGL and reduces ATGL-mediated lipolysis by inhibiting its hydrolase activity (Yang et al.
2010). In Hela cells, the G0S2 over-expression prevents the ATGL-mediated lipid droplet
degradation as well as basal and stimulated lipolysis in cultured adipocytes, whereas the down-
regulation of endogenous G0S2 enhances adipocyte lipolysis (Yang et al. 2010).
In addition, T1AM up-regulates the expression of genes linked to beta-oxidation, like Acsl5
(acyl-CoA synthetase long-chain family member 5) and Pex5 (peroxisomal biogenesis factor 5).
In the cytoplasm, the free fatty acids coming from lipolysis are converted to acyl-CoA thioesters
by the acyl-CoA synthetases (ACSs). Then, they are directed toward the de novo lipid synthesis
to store energy or toward beta-oxidation both in mitochondria and in peroxisomes to produce
ATP (Achouri et al. 2005). ACSs are classified based on their preference for short, medium,
long and very long chain fatty acids (Coleman et al. 2002b). Long-chain ACSs (ACSLs) modify
fatty acids long 12-22 carbons (Li 2006). The Acsl5 is the only ACSL isoform known to be
located on the mitochondrial outer membrane and has a probable role in the beta-oxidation of
fatty acids (Coleman et al. 2002a). In support of this hypothesis an increase of Acsl5 protein and
mRNA after food deprivation has been observed (Lewin et al. 2001). Moreover, Acsl1 and Acsl4
but not Acsl5 are inhibited by Triascin C (Kim, Lewin and Coleman 2001) that blocks the de
novo triglyceride synthesis (Igal, Wang and Coleman 1997). This suggests that Acsl5 is not
linked to the triglyceride synthesis.
The Pex5 gene codes a protein involved in the biogenesis of peroxisomes, which are organelles
where the initial steps of beta-oxidation of very long chain fatty acids occur (Varanasi et al.
1996, Mannaerts, Van Veldhoven and Casteels 2000). These data suggest that T1AM promotes
both triglyceride lipolysis and beta-oxidation, according to an increased lipid utilisation.

23
T1AM REGULATES THE EXPRESSION OF GENES RELATED TO ADIPOGENESIS
The amount of body fat depends on several factors that affect both the size and the number of
adipocytes. Besides mature adipocytes, the adipose tissue contains multipotent mesenchymal
cells and pre-adipocytes able to proliferate after specific stimuli (Bon 2008). If the food intake
exceeds the energy consumption, the mature adipocytes go towards hypertrophy (increase in
size) and hyperplasia (increase in number) (Bon 2008). The hypertrophy arises from triglyceride
accumulation in existing adipocytes. The hyperplasia, also known as adipogenesis, comes from
recruitment, proliferation and differentiation of pre-adipocytes (Hausman et al. 2001).
Several transcription factors, including members of the C/EBP family, are induced during the
adipocyte differentiation and play an important role in the regulation of adipocyte gene
expression (Rosen et al. 2002). Cebpb, for example, down-regulated by T1AM, is the first player
in adipogenesis, being responsible of C/EBPalfa and PPARgamma activation (Miyaoka et al.
2006, Rosen et al. 2002).
The adipocyte gene expression is also affected by Signal Transducers and Activators of
Transcription (STATs) (White and Stephens 2010). Stat5b, up-regulated by T1AM, is activated
in the early phase of the differentiation process and is a positive regulator of proliferation
(Nanbu-Wakao et al. 2002). However, a continuous and excessive activation of Statb becomes
inhibitory for the adipogenesis (Miyaoka et al. 2006).
Many other genes regulated by T1AM, including Pmp22 (peripheral myelin protein 22), Sirt2
(sirtuin [silent mating type information regulation 2 homolog] 2), Nolc1 (nucleolar and coiled-
body phosphoprotein 1) and Igfbp2 (insulin-like growth factor binding protein 2, 36kDa) are
implicated in the adipogenesis.
Pmp22, up-regulated by T1AM, belongs to the Growth Arrest Specific (GAS) gene family. The
genes of this family regulate the cellular growth by blocking the mitotic division in response to
extracellular signals (Schneider, King and Philipson 1988). In mice 3T3-L1, during the pre-
adipocyte maturation, the GAS genes are upregulated and the Pmp22 gene exerts an inhibitory
effect on adipogenesis (Shugart et al. 1995).
Sirt2, up-regulated by T1AM, codifies a member of the sirtuin family. In mouse 3T3-L1 pre-
adipocytes, the Sirt2 overexpression inhibits the adipocyte differentiation (Jing, Gesta and Kahn
2007). Conversely, Sirt2 downexpression promotes the adipogenesis (Jing et al. 2007). Sirt2
suppresses the adipogenesis by deacetylating FOXO1, which ties PPARgamma and represses its
transcriptional activity (Jing et al. 2007).

24
Nolc1, down-regulated by T1AM, codifies a member of the retinoblastoma family. These
proteins are phosphorilated by cyclins to promote cell proliferation in a variety of cells (Claudio,
Tonini and Giordano 2002). In the adipose tissue, the cell proliferation is stimulated by FGF10
through the activation of the Ras/Map pathway followed by the cyclin D2-dependent NOLC1-
phosphorylation (Konishi et al. 2006).
Igfbp2, down-regulated by T1AM, codifies a member of the IGF binding protein family that
sequesters the IGFs in the extracellular environment and limits their access to the signalling
receptors (Baxter and Twigg 2009). In particular, Igfbp2 inhibits the IGF1-IGF1R interaction by
sequestering IGF1 (Baxter and Twigg 2009) that is an inducer of pre-adipocyte differentiation
(MacDougald and Lane 1995). Whether Igfbp2 exerts an inhibitory effect on pre-adipocyte
differentiation by sequestering IGF1 is unknown (Baxter and Twigg 2009), but it has been
recently observed that mice overexpressing Igfbp2 have an increase in fat mass compared to
their nontransgenic littermates (Rehfeldt et al. 2010). These data raise the hypothesis that T1AM
controls the adipose tissue expansion by inhibiting adipogenesis.
The up-regulation of Dmpk (dystrophia myotonica-protein kinase) gene, instead, might
contribute to control the adipose tissue increment by reducing the adipocyte hypertrophy. This
gene encodes a serine/threonine protein kinase, whose deficiency appears to be a risk factor for
adiposity. Dmpk KO mice fed with high-fat diet, in fact, exhibit increased body weight and fat
mass compared to wild type mice. This increase in adipose tissue mass correlates with the
adipocyte hypertrophy (Llagostera et al. 2009).
Finally, given that the adipose tissue expansion requires the formation of new vessels,
(Christiaens and Lijnen 2010, Rupnick et al. 2002, Hausman and Richardson 2004) the
regulation of angiogenesis-related genes, like Apln (apelin), Paqr3 (progestin and adipoQ
receptor family member III) and Pla2g2a (phospholipase A2, group IIA platelets, synovial fluid)
might represent a molecular mechanism by which T1AM inhibits the adipogenesis.
Apln gene, down-regulated by T1AM, encodes a peptide binding the APJ receptor (Tatemoto et
al. 1998) and promotes angiogenesis in several tissues (Cox et al. 2006, Brooks, Clark and
Cheresh 1994, Sorli et al. 2007). Kunduzova and colleagues demonstrated that the apelin/APJ
signalling pathway promotes the angiogenesis also in the adipose tissue (Kunduzova et al. 2008).
It has been proposed that the block of apelin signalling decreases angiogenesis and adiposity
(Rayalam et al. 2008).

25
Paqr3 gene, up-regulated by T1AM, codifies an adiponectin receptor (Garitaonandia et al. 2009)
that has been reported to inhibit the angiogenesis by suppressing the VEGF signalling both in
vitro and in vivo (Zhang et al. 2010).
Pla2g2a gene, down-regulated by T1AM, codifies a phospholipase that catalyzes the sn-2 acyl-
hydrolysis of phospholipids, thus causing the liberation of arachidonic acid that can be used to
produce eicosanoids (Dennis 1997, Mayer and Marshall 1993). The Pla2g2a inhibition has been
shown to reduce the formation of capillary-like tubes(Chen et al. 2004).
CONCLUSIONS
The results of this study suggest that T1AM controls the adipose tissue expansion by regulating
genes linked to lipid metabolism, adipogenesis and angiogenesis. The observed changes in gene
expression also contribute to explain the long lasting effects of T1AM on energy production,
caused by a shift from carbohydrates to lipid metabolism. These findings furthermore suggest
that T1AM represents a good candidate for obesity treatment. In fact, not only it does not show
the same negative side effects of thyroid hormones, but also influences the expression of genes
able to control the blood cholesterol level. This provides new insights for the T1AM action, like
i.e. a protective role against atherosclerosis and coronary disease. These hypotheses are worthy
to be further investigated by functional studies in vitro and in vivo..

26
REFERENCES
Achouri, Y., B. D. Hegarty, D. Allanic, D. Bécard, I. Hainault, P. Ferré & F. Foufelle (2005)
Long chain fatty acyl-CoA synthetase 5 expression is induced by insulin and glucose:
involvement of sterol regulatory element-binding protein-1c. Biochimie, 87, 1149-55.
Acton, S., A. Rigotti, K. T. Landschulz, S. Xu, H. H. Hobbs & M. Krieger (1996) Identification
of scavenger receptor SR-BI as a high density lipoprotein receptor. Science, 271, 518-20.
Baxter, R. C. & S. M. Twigg (2009) Actions of IGF binding proteins and related proteins in
adipose tissue. Trends Endocrinol Metab, 20, 499-505.
Beh, C. T., L. Cool, J. Phillips & J. Rine (2001) Overlapping functions of the yeast oxysterol-
binding protein homologues. Genetics, 157, 1117-40.
Benjamini, Y. & Y. Hochberg (1995) Controlling the false discovery rate: a practical and
powerful approach to multiple testing. J Roy Stat Soc Ser B (Meth), 57, 289-300.
Berlan, M., J. L. Montastruc & M. Lafontan (1992) Pharmacological prospects for alpha 2-
adrenoceptor antagonist therapy. Trends Pharmacol Sci, 13, 277-82.
Blanco-Vaca, F., D. P. Via, C. Y. Yang, J. B. Massey & H. J. Pownall (1992) Characterization of
disulfide-linked heterodimers containing apolipoprotein D in human plasma lipoproteins.
J Lipid Res, 33, 1785-96.
Blander, G. & L. Guarente (2004) The Sir2 family of protein deacetylases. Annu Rev Biochem,
73, 417-35.
Bon, G. B. (2008) [Adipose tissue: a multifunctional organ]. G Ital Cardiol (Rome), 9, 23S-28S.
Braulke, L. J., M. Klingenspor, A. DeBarber, S. C. Tobias, D. K. Grandy, T. S. Scanlan & G.
Heldmaier (2008) 3-Iodothyronamine: a novel hormone controlling the balance between
glucose and lipid utilisation. J Comp Physiol B, 178, 167-77.
Brooks, P. C., R. A. Clark & D. A. Cheresh (1994) Requirement of vascular integrin alpha v beta
3 for angiogenesis. Science, 264, 569-71.
Chen, W., L. Li, J. Zhu, J. Liu, J. Soria, C. Soria & S. Yedgar (2004) Control of angiogenesis by
inhibitor of phospholipase A2. Chin Med Sci J, 19, 6-12.
Chiellini, G., S. Frascarelli, S. Ghelardoni, V. Carnicelli, S. C. Tobias, A. DeBarber, S. Brogioni,
S. Ronca-Testoni, E. Cerbai, D. K. Grandy, T. S. Scanlan & R. Zucchi (2007) Cardiac
effects of 3-iodothyronamine: a new aminergic system modulating cardiac function.
FASEB J, 21, 1597-608.
Christiaens, V. & H. R. Lijnen (2010) Angiogenesis and development of adipose tissue. Mol Cell
Endocrinol, 318, 2-9.
Claudio, P. P., T. Tonini & A. Giordano (2002) The retinoblastoma family: twins or distant
cousins? Genome Biol, 3, reviews3012.
Coleman, R. A., T. M. Lewin, C. G. Van Horn & M. R. Gonzalez-Baró (2002a) Do long-chain
acyl-CoA synthetases regulate fatty acid entry into synthetic versus degradative
pathways? J Nutr, 132, 2123-6.
Coleman, R. A., C. G. Van Horn, M. R. Gonzalez-Baro & T. M. Lewin (2002b) Long-chain
acyl-CoA synthetase isoforms and their functions. Research Signpost, 37, 1-15.
Cox, C. M., S. L. D'Agostino, M. K. Miller, R. L. Heimark & P. A. Krieg (2006) Apelin, the
ligand for the endothelial G-protein-coupled receptor, APJ, is a potent angiogenic factor
required for normal vascular development of the frog embryo. Dev Biol, 296, 177-89.
Crestani, M., E. De Fabiani, D. Caruso, N. Mitro, F. Gilardi, A. B. Vigil Chacon, R. Patelli, C.
Godio & G. Galli (2004) LXR (liver X receptor) and HNF-4 (hepatocyte nuclear factor-
4): key regulators in reverse cholesterol transport. Biochem Soc Trans, 32, 92-6.

27
Darimont, C., D. Gaillard, G. Ailhaud & R. Negrel (1993) Terminal differentiation of mouse
preadipocyte cells: adipogenic and antimitogenic role of triiodothyronine. Mol Cell
Endocrinol, 98, 67-73.
Dennis, E. A. (1997) The growing phospholipase A2 superfamily of signal transduction
enzymes. Trends Biochem Sci, 22, 1-2.
Dhillo, W. S., G. A. Bewick, N. E. White, J. V. Gardiner, E. L. Thompson, A. Bataveljic, K. G.
Murphy, D. Roy, N. A. Patel, J. N. Scutt, A. Armstrong, M. A. Ghatei & S. R. Bloom
(2009) The thyroid hormone derivative 3-iodothyronamine increases food intake in
rodents. Diabetes Obes Metab, 11, 251-60.
Draghici, S., P. Khatri, P. Bhavsar, A. Shah, S. A. Krawetz & M. A. Tainsky (2003) Onto-Tools,
the toolkit of the modern biologist: Onto-Express, Onto-Compare, Onto-Design and
Onto-Translate. Nucleic Acids Res, 31, 3775-81.
Draghici, S., P. Khatri, A. L. Tarca, K. Amin, A. Done, C. Voichita, C. Georgescu & R. Romero
(2007) A systems biology approach for pathway level analysis. Genome Res, 17, 1537-
45.
Garitaonandia, I., J. L. Smith, B. R. Kupchak & T. J. Lyons (2009) Adiponectin identified as an
agonist for PAQR3/RKTG using a yeast-based assay system. J Recept Signal Transduct
Res, 29, 67-73.
Gill, S., R. Chow & A. J. Brown (2008) Sterol regulators of cholesterol homeostasis and beyond:
the oxysterol hypothesis revisited and revised. Prog Lipid Res, 47, 391-404.
Haigis, M. C. & L. P. Guarente (2006) Mammalian sirtuins--emerging roles in physiology,
aging, and calorie restriction. Genes Dev, 20, 2913-21.
Hauner, H., G. Entenmann, M. Wabitsch, D. Gaillard, G. Ailhaud, R. Negrel & E. F. Pfeiffer
(1989) Promoting effect of glucocorticoids on the differentiation of human adipocyte
precursor cells cultured in a chemically defined medium. J Clin Invest, 84, 1663-70.
Hausman, D. B., M. DiGirolamo, T. J. Bartness, G. J. Hausman & R. J. Martin (2001) The
biology of white adipocyte proliferation. Obes Rev, 2, 239-54.
Hausman, G. J. & R. L. Richardson (2004) Adipose tissue angiogenesis. J Anim Sci, 82, 925-34.
Hummasti, S., B. A. Laffitte, M. A. Watson, C. Galardi, L. C. Chao, L. Ramamurthy, J. T.
Moore & P. Tontonoz (2004) Liver X receptors are regulators of adipocyte gene
expression but not differentiation: identification of apoD as a direct target. J Lipid Res,
45, 616-25.
Ianculescu, A. G., K. M. Giacomini & T. S. Scanlan (2009) Identification and characterization of
3-iodothyronamine intracellular transport. Endocrinology, 150, 1991-9.
Igal, R. A., P. Wang & R. A. Coleman (1997) Triacsin C blocks de novo synthesis of
glycerolipids and cholesterol esters but not recycling of fatty acid into phospholipid:
evidence for functionally separate pools of acyl-CoA. Biochem J, 324 ( Pt 2), 529-34.
Jenssen, T. K., A. Laegreid, J. Komorowski & E. Hovig (2001) A literature network of human
genes for high-throughput analysis of gene expression. Nat Genet, 28, 21-8.
Jing, E., S. Gesta & C. R. Kahn (2007) SIRT2 regulates adipocyte differentiation through FoxO1
acetylation/deacetylation. Cell Metab, 6, 105-14.
Kanfi, Y., V. Peshti, R. Gil, S. Naiman, L. Nahum, E. Levin, N. Kronfeld-Schor & H. Y. Cohen
(2010) SIRT6 protects against pathological damage caused by diet-induced obesity.
Aging Cell, 9, 162-73.
Khatri, P., S. Draghici, G. C. Ostermeier & S. A. Krawetz (2002) Profiling gene expression
using onto-express. Genomics, 79, 266-70.
Kim, J. H., T. M. Lewin & R. A. Coleman (2001) Expression and characterization of
recombinant rat Acyl-CoA synthetases 1, 4, and 5. Selective inhibition by triacsin C and
thiazolidinediones. J Biol Chem, 276, 24667-73.

28
Klieverik, L. P., E. Foppen, M. T. Ackermans, M. J. Serlie, H. P. Sauerwein, T. S. Scanlan, D.
K. Grandy, E. Fliers & A. Kalsbeek (2009) Central effects of thyronamines on glucose
metabolism in rats. J Endocrinol, 201, 377-86.
Konishi, M., T. Asaki, N. Koike, H. Miwa, A. Miyake & N. Itoh (2006) Role of Fgf10 in cell
proliferation in white adipose tissue. Mol Cell Endocrinol, 249, 71-7.
Kovanen, P. T., E. A. Nikkilä & T. A. Miettinen (1975) Regulation of cholesterol synthesis and
storage in fat cells. J Lipid Res, 16, 211-23.
Krieger, M. (2001) Scavenger receptor class B type I is a multiligand HDL receptor that
influences diverse physiologic systems. J Clin Invest, 108, 793-7.
Krotkiewski, M. (2002) Thyroid hormones in the pathogenesis and treatment of obesity. Eur J
Pharmacol, 440, 85-98.
Kunduzova, O., N. Alet, N. Delesque-Touchard, L. Millet, I. Castan-Laurell, C. Muller, C. Dray,
P. Schaeffer, J. P. Herault, P. Savi, F. Bono & P. Valet (2008) Apelin/APJ signaling
system: a potential link between adipose tissue and endothelial angiogenic processes.
FASEB J, 22, 4146-53.
Lafontan, M. & M. Berlan (1995) Fat cell alpha 2-adrenoceptors: the regulation of fat cell
function and lipolysis. Endocr Rev, 16, 716-38.
Langin, D. (2006) Adipose tissue lipolysis as a metabolic pathway to define pharmacological
strategies against obesity and the metabolic syndrome. Pharmacol Res, 53, 482-91.
Lehmann, J. M., S. A. Kliewer, L. B. Moore, T. A. Smith-Oliver, B. B. Oliver, J. L. Su, S. S.
Sundseth, D. A. Winegar, D. E. Blanchard, T. A. Spencer & T. M. Willson (1997)
Activation of the nuclear receptor LXR by oxysterols defines a new hormone response
pathway. J Biol Chem, 272, 3137-40.
Lewin, T. M., J. H. Kim, D. A. Granger, J. E. Vance & R. A. Coleman (2001) Acyl-CoA
synthetase isoforms 1, 4, and 5 are present in different subcellular membranes in rat liver
and can be inhibited independently. J Biol Chem, 276, 24674-9.
Li, L. 2006. Functions of Rat Acyl-CoA Synthetases in bacteria and mammalian cells. In
Department of Nutrition, School of Public Health. University of North Carolina.
Lin, B. C. & T. S. Scanlan (2005) Few things in life are "free": cellular uptake of steroid
hormones by an active transport mechanism. Mol Interv, 5, 338-40.
Liszt, G., E. Ford, M. Kurtev & L. Guarente (2005) Mouse Sir2 homolog SIRT6 is a nuclear
ADP-ribosyltransferase. J Biol Chem, 280, 21313-20.
Llagostera, E., M. C. Carmona, M. Vicente, R. M. Escorihuela & P. Kaliman (2009) High-fat
diet induced adiposity and insulin resistance in mice lacking the myotonic dystrophy
protein kinase. FEBS Lett, 583, 2121-5.
MacDougald, O. A. & M. D. Lane (1995) Transcriptional regulation of gene expression during
adipocyte differentiation. Annu Rev Biochem, 64, 345-73.
Mahley, R. W., T. L. Innerarity, S. C. Rall & K. H. Weisgraber (1984) Plasma lipoproteins:
apolipoprotein structure and function. J Lipid Res, 25, 1277-94.
Mannaerts, G. P., P. P. Van Veldhoven & M. Casteels (2000) Peroxisomal lipid degradation via
beta- and alpha-oxidation in mammals. Cell Biochem Biophys, 32 Spring, 73-87.
Mayer, R. J. & L. A. Marshall (1993) New insights on mammalian phospholipase A2(s);
comparison of arachidonoyl-selective and -nonselective enzymes. FASEB J, 7, 339-48.
Michaely, P., W. Li, R. Anderson, J. Cohen & H. Hobbs (2004) The modular adaptor protein
ARH is required for low density lipoprotein (LDL) binding and internalization but not for
LDL receptor clustering in coated pits. J Biol Chem, 279, 34023-31.
Miyaoka, Y., M. Tanaka, T. Naiki & A. Miyajima (2006) Oncostatin M inhibits adipogenesis
through the RAS/ERK and STAT5 signaling pathways. J Biol Chem, 281, 37913-20.

29
Nanbu-Wakao, R., Y. Morikawa, I. Matsumura, Y. Masuho, M. A. Muramatsu, E. Senba & H.
Wakao (2002) Stimulation of 3T3-L1 adipogenesis by signal transducer and activator of
transcription 5. Mol Endocrinol, 16, 1565-76.
Out, R., M. Hoekstra, J. A. Spijkers, J. K. Kruijt, M. van Eck, I. S. Bos, J. Twisk & T. J. Van
Berkel (2004) Scavenger receptor class B type I is solely responsible for the selective
uptake of cholesteryl esters from HDL by the liver and the adrenals in mice. J Lipid Res,
45, 2088-95.
Perdomo, G. & H. Henry Dong (2009) Apolipoprotein D in lipid metabolism and its functional
implication in atherosclerosis and aging. Aging (Albany NY), 1, 17-27.
Piehl, S., T. Heberer, G. Balizs, T. S. Scanlan, R. Smits, B. Koksch & J. Köhrle (2008)
Thyronamines are isozyme-specific substrates of deiodinases. Endocrinology, 149, 3037-
45.
Pietsch, C. A., T. S. Scanlan & R. J. Anderson (2007) Thyronamines are substrates for human
liver sulfotransferases. Endocrinology, 148, 1921-7.
Rassart, E., A. Bedirian, S. Do Carmo, O. Guinard, J. Sirois, L. Terrisse & R. Milne (2000)
Apolipoprotein D. Biochim Biophys Acta, 1482, 185-98.
Rayalam, S., M. A. Della-Fera, P. A. Krieg, C. M. Cox, A. Robins & C. A. Baile (2008) A
putative role for apelin in the etiology of obesity. Biochem Biophys Res Commun, 368,
815-9.
Regard, J. B., H. Kataoka, D. A. Cano, E. Camerer, L. Yin, Y. W. Zheng, T. S. Scanlan, M.
Hebrok & S. R. Coughlin (2007) Probing cell type-specific functions of Gi in vivo
identifies GPCR regulators of insulin secretion. J Clin Invest, 117, 4034-43.
Rehfeldt, C., U. Renne, M. Sawitzky, G. Binder & A. Hoeflich (2010) Increased fat mass,
decreased myofiber size, and a shift to glycolytic muscle metabolism in adolescent male
transgenic mice overexpressing IGFBP-2. Am J Physiol Endocrinol Metab, 299, E287-
98.
Rigotti, A., B. L. Trigatti, M. Penman, H. Rayburn, J. Herz & M. Krieger (1997) A targeted
mutation in the murine gene encoding the high density lipoprotein (HDL) receptor
scavenger receptor class B type I reveals its key role in HDL metabolism. Proc Natl Acad
Sci U S A, 94, 12610-5.
Rosen, E. D., C. H. Hsu, X. Wang, S. Sakai, M. W. Freeman, F. J. Gonzalez & B. M.
Spiegelman (2002) C/EBPalpha induces adipogenesis through PPARgamma: a unified
pathway. Genes Dev, 16, 22-6.
Ross, R. (1986) The pathogenesis of atherosclerosis-an update. N Engl J Med, 314, 488-500.
Roy, G., E. Placzek & T. S. Scanlan (2012) ApoB-100-containing lipoproteins are major carriers
of 3-iodothyronamine in circulation. J Biol Chem, 287, 1790-800.
Rupnick, M. A., D. Panigrahy, C. Y. Zhang, S. M. Dallabrida, B. B. Lowell, R. Langer & M. J.
Folkman (2002) Adipose tissue mass can be regulated through the vasculature. Proc Natl
Acad Sci U S A, 99, 10730-5.
Saba, A., G. Chiellini, S. Frascarelli, M. Marchini, S. Ghelardoni, A. Raffaelli, M. Tonacchera,
P. Vitti, T. S. Scanlan & R. Zucchi (2010) Tissue distribution and cardiac metabolism of
3-iodothyronamine. Endocrinology, 151, 5063-73.
Safran, M., V. Chalifa-Caspi, O. Shmueli, T. Olender, M. Lapidot, N. Rosen, M. Shmoish, Y.
Peter, G. Glusman, E. Feldmesser, A. Adato, I. Peter, M. Khen, T. Atarot, Y. Groner &
D. Lancet (2003) Human Gene-Centric Databases at the Weizmann Institute of Science:
GeneCards, UDB, CroW 21 and HORDE. Nucleic Acids Res, 31, 142-6.
Scanlan, T. S., K. L. Suchland, M. E. Hart, G. Chiellini, Y. Huang, P. J. Kruzich, S. Frascarelli,
D. A. Crossley, J. R. Bunzow, S. Ronca-Testoni, E. T. Lin, D. Hatton, R. Zucchi & D. K.
Grandy (2004) 3-Iodothyronamine is an endogenous and rapid-acting derivative of
thyroid hormone. Nat Med, 10, 638-42.

30
Schena, M., D. Shalon, R. W. Davis & P. O. Brown (1995) Quantitative monitoring of gene
expression patterns with a complementary DNA microarray. Science, 270, 467-70.
Schneider, C., R. M. King & L. Philipson (1988) Genes specifically expressed at growth arrest of
mammalian cells. Cell, 54, 787-93.
Shugart, E. C., A. S. Levenson, C. M. Constance & R. M. Umek (1995) Differential expression
of gas and gadd genes at distinct growth arrest points during adipocyte development. Cell
Growth Differ, 6, 1541-7.
Smyth, G. 2005. Limma: linear models for microarray data. In Bioinformatics and
Computational Biology Solutions using R and Bioconductor., eds. R. Gentleman, V.
Carey, S. Dudoit, R. Irizarry & W. Huber, 397-420. New York: Springer.
Smyth, G. K. (2004) Linear models and empirical bayes methods for assessing differential
expression in microarray experiments. Stat Appl Genet Mol Biol, 3, Article3.
Snead, A. N., M. S. Santos, R. P. Seal, M. Miyakawa, R. H. Edwards & T. S. Scanlan (2007)
Thyronamines inhibit plasma membrane and vesicular monoamine transport. ACS Chem
Biol, 2, 390-8.
Sorli, S. C., S. Le Gonidec, B. Knibiehler & Y. Audigier (2007) Apelin is a potent activator of
tumour neoangiogenesis. Oncogene, 26, 7692-9.
Steyrer, E. & G. M. Kostner (1988) Activation of lecithin-cholesterol acyltransferase by
apolipoprotein D: comparison of proteoliposomes containing apolipoprotein D, A-I or C-
I. Biochim Biophys Acta, 958, 484-91.
Sugiyama, T., H. Kumagai, Y. Morikawa, Y. Wada, A. Sugiyama, K. Yasuda, N. Yokoi, S.
Tamura, T. Kojima, T. Nosaka, E. Senba, S. Kimura, T. Kadowaki, T. Kodama & T.
Kitamura (2000) A novel low-density lipoprotein receptor-related protein mediating
cellular uptake of apolipoprotein E-enriched beta-VLDL in vitro. Biochemistry, 39,
15817-25.
Tatemoto, K., M. Hosoya, Y. Habata, R. Fujii, T. Kakegawa, M. X. Zou, Y. Kawamata, S.
Fukusumi, S. Hinuma, C. Kitada, T. Kurokawa, H. Onda & M. Fujino (1998) Isolation
and characterization of a novel endogenous peptide ligand for the human APJ receptor.
Biochem Biophys Res Commun, 251, 471-6.
Trigatti, B., H. Rayburn, M. Viñals, A. Braun, H. Miettinen, M. Penman, M. Hertz, M.
Schrenzel, L. Amigo, A. Rigotti & M. Krieger (1999) Influence of the high density
lipoprotein receptor SR-BI on reproductive and cardiovascular pathophysiology. Proc
Natl Acad Sci U S A, 96, 9322-7.
Trigatti, B., A. Rigotti & M. Krieger (2000) The role of the high-density lipoprotein receptor SR-
BI in cholesterol metabolism. Curr Opin Lipidol, 11, 123-31.
Vandesompele, J., K. De Preter, F. Pattyn, B. Poppe, N. Van Roy, A. De Paepe & F. Speleman
(2002) Accurate normalization of real-time quantitative RT-PCR data by geometric
averaging of multiple internal control genes. Genome Biol, 3, RESEARCH0034.
Varanasi, U., R. Chu, Q. Huang, R. Castellon, A. V. Yeldandi & J. K. Reddy (1996)
Identification of a peroxisome proliferator-responsive element upstream of the human
peroxisomal fatty acyl coenzyme A oxidase gene. J Biol Chem, 271, 2147-55.
Venditti, P., G. Napolitano, L. Di Stefano, G. Chiellini, R. Zucchi, T. S. Scanlan & S. Di Meo
(2011) Effects of the thyroid hormone derivatives 3-iodothyronamine and thyronamine
on rat liver oxidative capacity. Mol Cell Endocrinol, 341, 55-62.
Viguerie, N., L. Millet, S. Avizou, H. Vidal, D. Larrouy & D. Langin (2002) Regulation of
human adipocyte gene expression by thyroid hormone. J Clin Endocrinol Metab, 87,
630-4.
White, U. A. & J. M. Stephens (2010) Transcriptional factors that promote formation of white
adipose tissue. Mol Cell Endocrinol, 318, 10-4.

31
Wood, W. J., T. Geraci, A. Nilsen, A. E. DeBarber & T. S. Scanlan (2009) Iodothyronamines are
oxidatively deaminated to iodothyroacetic acids in vivo. Chembiochem, 10, 361-5.
Wu, S. Y., W. L. Green, W. S. Huang, M. T. Hays & I. J. Chopra (2005) Alternate pathways of
thyroid hormone metabolism. Thyroid, 15, 943-58.
Xie, Z., X. Wu, C. Zhuang, F. Chen, Z. Wang, Y. Wang & X. Hua (2009) [Protective effects of
Ginkgo biloba extract on morphology and function of retinal ganglion cells after optic
nerve transection in guinea pigs]. Zhong Xi Yi Jie He Xue Bao, 7, 940-6.
Yang, X., X. Lu, M. Lombès, G. B. Rha, Y. I. Chi, T. M. Guerin, E. J. Smart & J. Liu (2010)
The G(0)/G(1) switch gene 2 regulates adipose lipolysis through association with adipose
triglyceride lipase. Cell Metab, 11, 194-205.
Yu, B. L., S. P. Zhao & J. R. Hu (2010) Cholesterol imbalance in adipocytes: a possible
mechanism of adipocytes dysfunction in obesity. Obes Rev, 11, 560-7.
Zhang, Y., X. Jiang, X. Qin, D. Ye, Z. Yi, M. Liu, O. Bai, W. Liu, X. Xie, Z. Wang, J. Fang &
Y. Chen (2010) RKTG inhibits angiogenesis by suppressing MAPK-mediated autocrine
VEGF signaling and is downregulated in clear-cell renal cell carcinoma. Oncogene, 29,
5404-15.