dysregulated apoptosis in teratogen-induced neural …
TRANSCRIPT

DYSREGULATED APOPTOSIS IN TERATOGEN-INDUCED
NEURAL TUBE DEFECTS IN MICE
Murali Krishna Mallela
Dissertation submitted to the faculty of the Virginia Polytechnic Institute and State
University in partial fulfillment of the requirements for the degree of
DOCTOR OF PHILOSOPHY
IN
BIOMEDICAL & VETERINARY SCIENCES
Theresa Hrubec, Chair
Steven Holladay,
Dennis Blodgett,
Jill Sible
January 27th
, 2011
Blacksburg, VA
Keywords: Neural Tube Defects, teratogenesis, apoptosis, maternal immune stimulation

DYSREGULATED APOPTOSIS IN TERATOGEN-INDUCED
NEURAL TUBE DEFECTS IN MICE
Murali Krishna Mallela
ABSTRACT
Dysregulation of apoptosis during development is a possible mechanism for teratogen-
induced birth defects. Neural tube defects (NTDs) are the second most common fetal
malformations. Non-specific stimulation of maternal immune system prevents birth
defects. This study investigated the role of dysregulated apoptosis in formation of NTDs
from two teratogens: valproic acid (VA) and an unknown teratogen found in tap water.
Interferon- γ (IFN γ) was used to stimulate maternal immunity to evaluate the role of
altered apoptosis in this protective mechanism.
Apoptosis was evaluated using flow cytometry, Terminal Transferase dUTP Nick End
Labeling (TUNEL) assay and gene expression changes by RT2 Profiler PCR arrays.
Additionally, changes in the expression of key signal transduction pathway genes that
play a role in development were determined.
Increased apoptosis, suggesting involvement in VA teratogenicity, was observed along
the neural tube in both normal and abnormal embryos from VA-exposed dams. Increased
apoptosis in normal VA-exposed embryos suggests that VA may alter other cellular
processes such as cell proliferation and differentiation in addition to apoptosis. Apoptotic
percentages in embryos with NTDs from IFNγ+VA dams were similar to controls, which

iii
indicated resistance to teratogen-induced apoptosis. In IFNγ+VA-exposed embryos with
NTDs, immune stimulation failed to prevent apoptosis.
VA initiated both death and survival signaling in the embryos; however, upregulation of
the apoptotic genes and down regulation of anti-apoptotic genes of p53 and Bcl2 family
tended to shift the balance towards death signaling. This change in gene expression
patterns could result in increased apoptosis and NTDs in VA-exposed embryos. Immune
stimulation normalized changes in the expression of pro-apoptotic signaling molecules.
These results suggest immune stimulation protects embryos from teratogenicity of VA by
preventing VA-induced apoptosis.
VA altered the hedgehog, Wnt, retinoic acid and fibronectin signaling pathways in
embryos with NTDs. These results suggest that VA also disrupted signaling pathways
required for various morphogenic events during organogenesis. Immune stimulation
normalized the expression of Fn1 and Hspb1 and thus may mediate protection through
these signaling pathways.
In tap water exposed embryos, no change in apoptotic pattern was observed by flow
cytometry, TUNEL assay and RT-PCR. Also, none of the signal transduction pathway
genes tested were significantly altered in tap water-exposed embryos. This suggests that
apoptosis is not a mechanism for teratogenicity resulting from exposure to the
contaminant in tap water.

iv
ACKNOWLEDGMENTS
I am heartily thankful to my advisor, Dr. Terry Hrubec for her encouragement, patience,
guidance and support from the very early stage of this research work. It has been both an
honor and a pleasure to work with her. I would like to express my appreciation to my
committee members. I would like to thank Dr. Steven Holladay for his constant support
and guidance. I would like thank Dr. Jill Sible for her guidance and suggestions
especially on the molecular work. I also would like to thank Dr. Dennis Blodgett for his
guidance and helpful suggestions in writing my dissertation. I wish to extend special
thanks to Dr. Stephen Werre for his assistance in the data analysis and Melissa Makris for
helping me with the flow cytometry analysis. I would like to thank faculty, staff and my
friends from VMRCVM for their support and help.
I am forever indebted to my parents, Srinivasa Rao & Anantha Laxmi Mallela, for their
loving support and encouragement over the years. I also would like to thank my loving
wife Bhargavi for all of her support and understanding over the years.

v
TABLE OF CONTENTS
ABSTRACT ......................................................................................................................................... ii
ACKNOWLEDGMENTS ..................................................................................................................... iv
LIST OF FIGURES .............................................................................................................................. ix
LIST OF TABLES ................................................................................................................................ xi
I. INTRODUCTION ............................................................................................................................ 1
II. LITERATURE REVIEW .................................................................................................................... 4
1. Apoptosis in normal development and neural tube formation ................................................ 4
2. Disruption of apoptosis by teratogens to induce NTDs ........................................................... 6
2 a. Valproic acid ..................................................................................................................... 9
2 b. General contaminants in water ...................................................................................... 11
3. Molecular mechanism associated with apoptosis in the formation of neural tube defects .... 15
4. Nonspecific immune stimulation and birth defects ............................................................... 20
4 a. Role of nonspecific immune stimulation in preventing birth defects ............................ 20
4 b. Proposed mechanisms by which maternal immune stimulation prevents birth defects
............................................................................................................................................... 21
III. MATERIALS AND METHODS ...................................................................................................... 27
Study 1. Neural tube defects in mice exposed to tap water ....................................................... 29
1 a. Animals ........................................................................................................................... 29
1 b. Experimental conditions to screen for possible risk factors .......................................... 31
1 c. Association of source, strain and NTDs .......................................................................... 33
1 d. Association of housing and NTDs ................................................................................... 33
1 e. Association of diet and NTDs .......................................................................................... 33
1 f. Association of water and NTDs ....................................................................................... 33
1 g. F2 Generation: Association of water and NTDs .............................................................. 34
1 h. Statistical analysis ........................................................................................................... 34
Study 2. Characterization of teratogen present in tap water ...................................................... 35
2 a. Chemical characterization of teratogen present in tap water ....................................... 35
2 b. Metabolism study to determine whether teratogenicity is caused by a parent
compound or its metabolite .................................................................................................. 37
2 c. Determination of whether the teratogen is a disinfection byproduct ........................... 39

vi
Study 3. Apoptotic changes in embryos from teratogens and maternal immune stimulation ... 42
3 a. Quantitative estimation of apoptotic changes by flow cytometry in the heads of mouse
embryos exposed to VA with or without maternal immune stimulation and in embryos
exposed to tap water ............................................................................................................ 44
3 b. Localization of specific apoptotic regions in the heads of mouse embryos exposed to
VA with or without maternal immune stimulation and in embryos exposed to tap water by
Terminal Transferase dUTP Nick End Labeling (TUNEL) assay .............................................. 46
Study 4. Molecular regulation of apoptosis by VA with or without maternal immune
stimulation and by tap water...................................................................................................... 48
4 a. Changes in apoptotic pathway gene expression in GD 8.5 and 9 mouse embryos from
VA with and without maternal immune stimulation exposure ............................................. 48
4 b. Changes in expression of apoptotic pathway genes in GD 9 embryos from tap water
exposure ................................................................................................................................ 56
Study 5. Molecular regulation of signal transduction pathways by VA with and without
maternal immune stimulation and by tap water......................................................................... 57
5 a. Changes in expression of signal transduction pathway genes in GD 8.5 and 9 mouse
embryos from VA with and without maternal immune stimulation exposure ..................... 57
5 b. Changes in expression of signal transduction pathway genes in GD 9 mouse embryos
from tap water exposure ....................................................................................................... 58
IV. RESULTS .................................................................................................................................... 59
Study 1. Neural tube defects in mice exposed to tap water ....................................................... 59
1 a. Screening for infectious and toxic exposure .................................................................. 60
1 b. Association of housing and NTDs ................................................................................... 60
1 c. NTDs in timed pregnant mice from commercial suppliers ............................................. 61
1 d. Association of diet and NTDs .......................................................................................... 62
1 e. Association of source of water and NTDs ....................................................................... 63
1 f. F2 Generation: Association of water and NTDs .............................................................. 64
Study 2. Characterization of teratogen present in tap water ...................................................... 67
2 a. Chemical characterization of teratogen present in tap water ....................................... 67
2 b. Metabolism study to determine whether the teratogenicity is caused by a parent
compound or its metabolite .................................................................................................. 68
2 c. Determining if the teratogen is a disinfection byproduct .............................................. 69
Study 3. Apoptotic changes in embryos from teratogens and maternal immune stimulation ... 70

vii
3 a. Quantitative estimation of apoptotic changes by flow cytometry in the heads of mouse
embryos exposed to VA with and without maternal immune stimulation and in embryos
exposed to tap water ............................................................................................................ 70
3 b. Localization of specific apoptotic regions in the heads of mouse embryos exposed to
VA with or without maternal immune stimulation and in embryos exposed to tap water by
Terminal Transferase dUTP Nick End Labeling (TUNEL) assay .............................................. 75
Study 4. Molecular regulation of apoptosis by VA with and without maternal immune
stimulation and tap water........................................................................................................... 79
4 a. Changes in expression of apoptotic pathway genes in GD 8.5 and 9 embryos from VA
with and without maternal immune stimulation exposure .................................................. 79
4 b. Changes in expression of apoptotic pathway genes in GD 9 embryos from tap water
exposure ................................................................................................................................ 89
Study 5. Molecular regulation of signal transduction pathways by VA with and without
maternal immune stimulation and by tap water......................................................................... 90
5 a. Changes in expression of signal transduction pathway genes in GD 8.5 and 9 embryos
from VA with and without maternal immune stimulation exposure .................................... 90
5 b. Changes in expression of signal transduction pathway genes in GD 9 embryos from tap
water exposure ...................................................................................................................... 93
IV. DISCUSSION .............................................................................................................................. 94
Study 1. Neural tube defects in mice exposed to tap water ...................................................... 94
Study 2. Characterization of teratogen present in tap water ..................................................... 97
Study 3. Detection of apoptotic changes in embryos from teratogens and maternal immune
stimulation ............................................................................................................................... 101
Study 4. Molecular regulation of apoptosis by VA with and without maternal immune
stimulation and by tap water.................................................................................................... 109
Study 5. Molecular regulation of signal transduction pathways by VA with and without
maternal immune stimulation and by tap water....................................................................... 116
V. Conclusions.............................................................................................................................. 122
VI. References .............................................................................................................................. 125
VII. APPENDIX .............................................................................................................................. 146
APPENDIX A. Functional Gene Grouping- Apoptotic pathways .......................................... 146
APPENDIX B. Functional gene grouping- Signal transduction pathways ............................. 147
APPENDIX C. Fold change of genes related to apoptotic pathways in GD 8.5 embryos from
VA treated dams compared to control group ..................................................................... 148

viii
APPENDIX D. Fold change of genes related to apoptotic pathways in GD 8.5 embryos from
IFNγ+VA-treated dams compared to IFNγ only control group ............................................ 149
APPENDIX E. Fold change of genes related to apoptotic pathways in GD9 embryos with
open neural tubes from VA-treated dams compared to control group .............................. 150
APPENDIX F. Fold change of genes related to apoptotic pathways in GD9 embryos with
closed neural tubes from VA-treated dams compared to control group............................ 151
APPENDIX G. Fold change of genes related to apoptotic pathways in GD9 embryos with
closed neural tubes from IFNγ+VA-treated dams compared to IFNγ only control group .. 152
APPENDIX H. Fold change of genes related to apoptotic pathways in GD9 embryos with
open neural tubes from IFNγ+VA-treated dams compared to IFNγ only control group..... 153
APPENDIX I. Fold change of genes related to apoptotic pathways in GD9 embryos with
open neural tubes from tap water exposed dams compared to control group ................. 154
APPENDIX J. Fold change of genes related to signal transduction pathways in GD 8.5
embryos from VA-treated dams compared to control group ............................................. 155
APPENDIX K. Fold change of genes related to signal transduction pathways in GD 8.5
embryos from IFNγ+VA-treated dams compared to IFNγ only control group .................... 156
APPENDIX L. Fold change of genes related to signal transduction pathways in GD9 embryos
with closed neural tubes from VA-treated dams compared to control group ................... 157
APPENDIX M. Fold change of genes related to signal transduction pathways in GD9
embryos with open neural tubes from VA-treated dams compared to control group ...... 158
APPENDIX N. Fold change of genes related to signal transduction pathways in GD9
embryos with closed neural tubes from IFNγ+VA-treated dams compared to IFNγ only
control group ....................................................................................................................... 159
APPENDIX O. Fold change of genes related to signal transduction pathways in GD9
embryos with open neural tubes from IFNγ+VA-treated dams compared to IFNγ only
control group ....................................................................................................................... 160
APPENDIX P. Fold change of genes related to signal transduction pathways in GD9 embryos
with open neural tubes from tap water exposed dams compared to control group ......... 161

ix
LIST OF FIGURES
Figure 1 Breeding scheme of mice to obtain embryos from mice provided with
DDI water for 2 generations (F2-DDI) 30
Figure 2 Separation of volatile and non-volatile fractions of water samples
using distillation and solid phase extraction, respectively 36
Figure 3 Flow chart showing different steps involved in water treatment
process 40
Figure 4 Removal of heads from the GD9 embryos for RNA isolation 49
Figure 5 Schematic diagram showing pooling of the embryos, isolation of RNA,
cDNA synthesis and Real-Time PCR from each treatment group 52
Figure 6 Layout of RT2 Profiler PCR array 54
Figure 7 NTDs in late day 9 to day 13 mouse embryos caused by tap water 59
Figure 8 Association of type of housing and NTDs in CD-1 mice 61
Figure 9 NTDs in timed pregnant mice 62
Figure 10 Association of diet and NTDs in CD-1 mice 63
Figure 11 Association of type of water and neural tube defects in purchased
CD-1 mice 64
Figure 12 NTDs in offspring of dams maintained exclusively on DDI for 2
generations (F2-DDI) and switched to municipal tap water 2 or 8
weeks prior to breeding 66
Figure 13 NTDs in embryos from mice provided volatile or non-volatile fractions
of tap and DDI water 67
Figure 14 NTDs in embryos from mice injected with SKF-525A, phenobarbital or
saline 68
Figure 15 NTDs in embryos from F2-DDI mice provided with DDI water,
autoclaved river water, autoclaved chlorinated water, chloraminated
tap water, or chlorinated well water 69
Figure 16 Apoptotic changes in heads of GD 9 embryos exposed to VA with and
without maternal immune stimulation 72

x
Figure 17
Percentage of apoptotic cells in embryo heads (GD 9) from control,
VA, IFNγ and VA+ IFNγ exposed dams
73
Figure 18 Percentage of apoptotic cells in GD 9 embryo heads from DDI water
and tap water exposed embryos 74
Figure 19 Identification of apoptotic regions in heads of GD9 mouse embryos
from VA exposed dams by Terminal Transferase dUTP Nick End
Labeling (TUNEL) assay 76
Figure 20 Identification of apoptotic regions in heads of GD9 mouse embryos
from IFN γ +VA group by Terminal Transferase dUTP Nick End Labeling
(TUNEL) assay 77
Figure 21 Identification of apoptotic regions in heads of GD9 mouse embryos
from tap water exposed dams by Terminal Transferase dUTP Nick End
Labeling (TUNEL) assay 78
Figure 22 Fold change of genes related to apoptotic pathways significantly
altered in GD9 embryos with closed neural tube from VA-treated
dams compared to control group 85
Figure 23 Fold change of genes related to apoptotic pathways significantly
altered in GD9 embryos with open neural tube from VA-treated dams
compared to control group 86
Figure 24 Fold change of genes related to apoptotic pathways significantly
altered in GD9 embryos with closed neural tube from IFN γ +VA-
treated dams compared to control group 87
Figure 25 Fold change of genes related to apoptotic pathways significantly
altered in GD9 embryos with open neural tube from IFN γ +VA-
treated dams compared to control group 88

xi
LIST OF TABLES
Table 1 Fold change and p-values of genes significantly altered in GD8.5
embryos from IFNγ +VA group compared to IFNγ only 80
Table 2 Fold change and p-values of genes significantly altered in GD9
embryos with open neural tube from VA-treated dams compared to
control group 81
Table 3 Fold change and p-values of genes significantly altered in GD9
embryos with closed neural tube from VA-treated dams compared to
control (saline injected) group 82
Table 4 Fold change and p-values of genes significantly altered in GD9
embryos with open neural tube from IFNγ+VA-treated dams
compared to control group 84
Table 5 Genes significantly over-expressed or under-expressed in GD9
embryos with closed neural tube from VA-treated dams compared to
control (saline injected) group 91
Table 6 Genes significantly over-expressed or under-expressed in GD 9
embryos with open neural tube from IFNγ+VA-treated dams
compared to IFNγ only group 92
Table 7 Genes significantly over-expressed or under-expressed in GD 9
embryos with closed neural tube from IFNγ+VA-treated dams
compared to IFNγ only group 92
Table 8 Genes over-expressed or under-expressed in GD 9 embryos with open
neural tube from dams provided with tap water for 2 months
compared to embryos form F2-DDI mice. 93

1
I. INTRODUCTION
Neural tube defects (NTDs) are serious birth defects where the malformed brain or spinal
cord is not covered by bone or skin. NTDs are the second most common malformation
after congenital heart defects affecting 324,000 births every year (March of Dimes global
report, 2006). In the United States, the incidence rate is 1 in every 1000 births (CDC).
Failure of the neural tube to close during development, results in exencephaly or
anencephaly, and spina bifida. Many, if not most, birth defects have a multifactorial
etiology where embryonic development of a genetically susceptible fetus is altered by
environmental factors. Several environmental, genetic and nutritional factors have been
shown to cause NTDs in mice including drugs, physical agents (hyperthermia), vitamin
excess or deficiency, and maternal infectious and metabolic diseases. The incidence of
NTDs was greatly reduced following folic acid fortification of the diet in United States
and other countries. Post folate fortification studies have found no difference in serum
folic acid levels between pregnancies affected with NTDs and pregnancies without any
birth defects that suggested folic acid levels may have reached threshold levels in
preventing NTDs (Mosley et al., 2007). Even though folate intake has several health
benefits, increased consumption may have cancer promoting effects (Osterhues et al.,
2009). Also, using folate as the sole preventive measure of NTDs is debatable due to the
multifactorial etiology of NTDs.
The central nervous system and spinal cord are formed by a process called neurulation
that begins with the formation of the neural plate from the neuroepithelium. Changes in
shape of neural plate cells cause intrinsic movements at the edges of neural plate to

2
elevate on either side of the midline and bend towards each other. The edges then fuse to
form the neural tube. In mice, differential neural fold elevation causes neural tube closure
at multiple sites (Harris and Juriloff, 1999). The primary neurulation process starts at the
hindbrain and cervical boundary and then extends into the hind brain cranially and
caudally into the spinal cord region. Two other fusion points form between mid -
forebrain boundary and at rostral extremity of the forebrain. The spinal cord forms from
secondary neurulation by a canalization process (Copp & Green, 2010, review). Failure
of neural fold closure at these three sites leads to variety of malformations such as
excencephaly, spina bifidia, or split face depending on location of the open neural tube
(Harris and Juriloff, 1999). Failure to the close at hindbrain and cervical boundary leads
to craniorachischisis. Failure to close between forebrain and midbrain leads to
anencephaly, and incomplete closure at rostral extremity of the forebrain leads to split
face with anencephaly (Copp & Green, 2010, review).
Neural development is a complicated process involving multiple cells and processes.
Teratogens may alter cellular functions or processes such as: cell viability, apoptosis, cell
cycle, cell proliferation and interactions between cell surface and extra cellular matrix.
Alteration in these processes may lead to neural tube defects (Copp and Greene, 2010).
Recent studies identified that alteration in the expression of genes related to these
processes may cause neural tube defects; however, specific mechanisms by which these
genes cause neural tube defects are not well understood. Identifying specific molecular,
biochemical or signaling pathways that are responsible for teratogen-induced NTDs will
help in developing intervention methods to prevent NTDs.

3
This present study investigated the role of altered programmed cell death or apoptosis in
formation of teratogen-induced neural tube defects from two teratogens, valproic acid
(VA), and an unknown teratogen in tap water. At the beginning of the study, neural tube
defects were observed in control mice not exposed to an experimental teratogen.
Historically, the CD-1 strain has a low background rate of 1/500 to 1/1000 NTDs (Dr. D
Juriloff, U British Columbia; Dr. C Clifford, Charles River Labs; personal
communication). Consistent with this low rate of spontaneous NTDs, our lab has
examined over 1700 fetuses (130 litters) prior to May, 2006 without encountering a
single NTD. Our investigation eventually identified tap water as the source of an
unknown teratogen responsible for NTDs in control mice. Studies were initially
conducted to characterize the unknown teratogen present in tap water; then the teratogen
was used to investigate the role of apoptosis in formation of NTDs. Apoptosis was
evaluated to identify the location and amount of apoptosis in head regions of embryos
from the two teratogens. Relative expression of genes related to apoptosis and cellular
signaling pathways that are important in development were analyzed to identify the
molecular mechanisms responsible for NTD formation. Nonspecific maternal immune
stimulation was employed to evaluate the role of apoptosis in NTDs.
4
II. LITERATURE REVIEW
1. Apoptosis in normal development and neural tube formation
Apoptosis or programmed cell death is an essential component of normal fetal
development. Apoptosis is a physiological process that plays a major role in tissue
remodeling and organogenesis (Shi et al., 1998). Apoptosis also establishes and maintains
tissue architecture during development (Meier et al., 2000). Surplus cells and structures
formed during development are removed by apoptosis (e.g., oviduct in males) or
remodeled (e.g., digit separation). This process enables fetal structures to execute
different functions at various stages of development (Meier et al., 2000).
Neural tube closure involves cell migration, proliferation, differentiation and apoptosis
(Sabapathy et al., 1999). Disruption of these processes can cause NTDs. Some amount of
normal cell death occurs during the formation of neural tube in mice embryos (Schlüter,
1973). Neural folds elevate dorsally and medially and appose each other in order to fuse.
During the fusion, the continuity between surface ectoderm and neuroepithelium has to
be restructured by apoptosis so that the opposing neural folds can converge to form the
neural tube (Copp, 2005). This tissue remodeling by apoptosis is a tightly controlled
process. Alteration in this apoptosis process in several knockout mouse strains causes
neural tube closure defects (Barrier et al., 2009; Hsu et al., 2008; Shirane et al., 2008;
Wong et al., 2008).
Pani et al., (2002) showed that failure to close the neural tube was related to alteration in
apoptosis in splotch mouse embryos. This strain carries a loss-of-function of pax3, whose

5
expression may influence several downstream genes that control apoptosis. These authors
demonstrated that cells with loss- of- function in pax3 fail to regulate p53 dependent
apoptosis in these embryos. They found an increased apoptotic index using Terminal
Transferase dUTP Nick End Labeling (TUNEL) assay in embryos with NTDs compared
to control embryos. Apoptosis was also reduced by inhibition of p53 in pax3-/- embryos
that suggested role of altered apoptosis in formation of NTDs in splotch mutant embryos.
Cartilage homeoprotein gene (Cart-1) is required for cell viability and proliferation; its
loss-of-function caused NTDs in Cart-1 knockout mice (Greene and Copp 2005).
Zhao et al., (1996) demonstrated increased cell death in forebrain as detected by acridine
orange staining in Cart-1 mutant mouse embryos that exhibited NTDs.
Barbera et al., (2002) showed increased apoptosis at the forebrain and midbrain junction
in Cited2 (CBP/p300-Interacting Transactivators with glutamic acid (E)/aspartic acid (D)-
rich C-terminal domain 2) knockout mice that exhibit NTDs. Forebrain and midbrain
regions with increased apoptosis were demonstrated in Cited2 null mice that indicated
increased apoptosis may be associated with formation of NTDs in these embryos.
Similar findings were also reported by Bamforth et al., (2001) where increased apoptosis
was observed in the midbrain region of GD 9.5 embryos of Cited2 knockout mice.
Association of NTDs with increased or decreased cell death was shown in several
additional knockout mouse models. Decreased apoptosis in Apaf1, Caspase 9 and p53
knockout mice was associated with NTDs (Reviewed by Copp, 2005). Apaf1 initiates

6
apoptosis by regulating the activation of apoptotic caspases (Yoshida et al., 1998).
Increased apoptosis was associated with NTDs in tubby-like protein 3 (Tulp3), Bcl10 and
Map3k4 knockout mice, (reviewed by Harris and Juriloff, 1999; Ikeda et al., 2001).
Specific role of Tulp3 and Map3k4 in regulation of apoptosis is not known. Bcl10
induces apoptosis through activation of NF- κB (Ruland et al., 2001). Apoptosis is a
normal phenomenon in a developing embryo and it helps in tissue sculpting and removal
of unwanted cells (Toder et al., 2002) and any alterations in this tightly controlled
biological process may also affect the neuronal development thus resulting in NTDs.
2. Disruption of apoptosis by teratogens to induce NTDs
Rapid proliferation of the neuroepithelial cells during neurulation causes the neural folds
to come together and close (Sadler, 2005). These rapidly dividing cells are vulnerable to
teratogens. Exposure to teratogens can modulate programmed cell death (Sulik et al.,
1988). Studies have suggested that teratogenic deregulation of apoptosis during
development is a potential mechanism for birth defects including NTDs.
Several methods can be used to evaluate apoptosis. These techniques detect alterations in
the cell membrane integrity, condensation of chromatin, and DNA fragmentation, which
are hallmarks of apoptosis. Localization of apoptotic changes can be done using
techniques such as electron microscopy, confocal microscopy and TUNEL assay.
Quantitative estimation of apoptosis can be achieved using flow cytometry, confocal
microscopy and caspase activity. Numerous studies have evaluated teratogen-induced

7
apoptosis using different techniques; however, most of these studies used localization
techniques such as TUNEL assay rather than quantitative estimation.
Thompson et al., (2005) demonstrated increased apoptosis in neural tubes of chicken
embryos exposed to cadmium that suggested role of altered apoptosis in cadmium-
induced NTDs. Cadmium-induced NTDs in C57BL/6 mouse strain are related to up
regulation of p53-dependent mediators Ccng1 and Pmaip1 that can cause increased
apoptosis. However, this mechanism was not observed in the SWV mouse strain
(Robinson et al., 2009). These results indicate that not only do teratogens act differently,
but also the same teratogen can have different mechanisms to impair NTD formation in
different strains of mice.
Altered apoptosis in cyclophosphamide-induced NTDs in rat embryos was evaluated by
Xiao et al., (2007). Increased apoptosis was found in embryonic neuronal cells in
response to cyclophosphamide. This suggests increased apoptosis as a possible
mechanism for induction of NTDs by cyclophosphamide. Li et al., (1999) demonstrated
homocysteine teratogenicity caused NTDs by increased apoptosis in chicken embryos.
Ambroso et al., (1998) found increased apoptosis in medial regions of the anterior neural
tube and neural crest in gestational day (GD) 8 embryos from CD-1 mice exposed to 2-
methoxyethanol. They demonstrated a dose dependent increase in apoptosis by confocal
laser scanning microscopy and also by in situ immunohistochemical staining for
apoptosis. They proposed increased apoptosis in embryos as a mechanism for the NTDs

8
in 2-methoxyethanol exposed CD-1 mice. A dose dependent increase in neuroepithelial
apoptosis and neural tube defects was also observed from methylmercury chloride
teratogenicity (Li and Zhu, 1998). These authors showed increased apoptosis by TUNEL
assay and also by electron microscopy in Sprague -Dawley (SD) rat embryos that were
exposed to methyl mercury.
Zhao and Reece (2005) evaluated effect of nicotine on mouse embryos during early
embryogenesis. They demonstrated increased apoptosis by LysoTracker Red staining of
whole embryos and TUNEL assay of tissue sections in ventral neural epithelium in
nicotine exposed embryos. These authors also showed that nicotine increases intracellular
Ca2+
and reactive oxygen species (ROS) leading to oxidative stress, which in turn
increased apoptosis and produced NTDs.
Hyperglycemia produces a variety of birth defects including NTDs and acts by altering
the apoptotic mechanism. Oyama et al., (2009) showed increased apoptosis in the
hindbrain region of GD 9.5 embryos from diabetic dams compared to controls. These
authors also observed decreased apoptosis when the diabetic dams were treated with folic
acid. Jiang et al., (2008) showed increased apoptotic cells by TUNEL staining in the
cranial neural tube of embryos from diabetic mice. Increased apoptosis in diabetic mice
could be decreased by treatment of diabetic embryos with iNOS (inductible nitric oxide
synthase) (Sugimura et al., 2009). The authors proposed that iNOS was reducing NTDs
by decreasing apoptosis in diabetic embryos.

9
Neural tube formation is a complicated process involving multiple cellular processes.
Apoptosis is one such process that plays a major role in neural tube closure. Several
studies show that teratogens may disrupt apoptosis in developing embryos by inducing
apoptosis in the neuroepithelium. These teratogens include cadmium, cyclophosphamide,
nicotine, 2-methoxyethanol, hyperglycemia and possibly others. Intervention strategies
such as folic acid and ascorbic acid reduce teratogen-induced apoptosis in embryos and
may be protective.
2 a. Valproic acid
Valproic acid (2-propylvaleric acid) is widely used for treatment of epileptic seizures and
bipolar disorder (Kostrouchova et al., 2007). Its therapeutic actions are through
augmentation of gamma-aminobutyric acid-mediated (GABA) neurotransmission by
increased synthesis and decreased degradation of GABA (Johannessen and Johannessen,
2003). Valrproic acid (VA) is also emerging as an anticancer drug to treat a variety of
tumour types and is currently in clinical trial testing (Catalano et al., 2004). The drug’s
antitumor properties are by histone deacetylase (HDAC) inhibition, causing apoptosis
and cell cycle arrest (Catalano et al., 2005). Microarray analysis of primary tumors in
VA- treated patients demonstrated that VA affects multiple processes such as cell cycle,
antigen processing and presentation, apoptosis, and the TGF-β and Wnt signaling
pathways (reviewed by Duenas-Gonzalez et al., 2008). Efforts are being made to develop
a second generation of VA drugs, such as VA analogues containing a urea moiety, that
have less terarogenicity and similar or greater anti-epileptic properties (Okada et al.,
2009; Shimshoni et al., 2007).

10
Administration of VA during early organogenesis can induce fetal malformations
including craniofacial, urogenital and skeletal anomalies in animals and humans
(Dieterich et al., 1980; Clayton-Smith and Donnai, 1995; Nau et al., 1991). A recent case-
control study found an association between use of VA as an antiepiletpic drug during
early pregnancy and various birth defects including spina bifida, atrial septal defect, cleft
palate, hypospadias, polydactyly, and craniosynostosis in humans (Jentink et al., 2010).
VA causes neural tube defects in exposed fetuses at a rate 20 times higher than in the
general population possibly through inhibition of cell proliferation or increased apoptosis
during neurulation (Eikel et al., 2006; Gurvich et al., 2005; Wiltse, 2005). Recent studies
have shown that VA affects cell growth, differentiation, and apoptosis in cancer cells
(Aouali et al., 2009; Chen et al., 2009; Bokelmann et al., 2008; Iacomino et al., 2008).
VA also induces apoptosis in the developing brain in rats (Bittigau et al., 2003; Koz et al.,
2010) and thus likely induces developmental malformation by altering apoptosis.
The mechanism of teratogenicity of VA and its metabolites has not been fully elucidated.
Recent studies (Eikel et al., 2006; Menegola et al., 2005) suggest that VA teratogenicity
may be related to the ability to inhibit histone deacetylases (HDACs). This action was
separate from its therapeutic actions to treat epilepsy and therefore provides a means to
differentiate therapeutic and teratogenic actions of this drug. Eikel et al., (2006)
demonstrated that teratogenicity of 20 different VA derivatives was through inhibition of
HDACs in teratocarcinoma mouse cells that are equivalent to early embryonic cells. In a
recent study, Zhang et al., (2010) showed VA altered glutathione homeostasis in CD-1
mouse embryos, thereby causing oxidative stress and NTDs. Oxidative stress-induced

11
apoptosis in the developing embryo as a mechanism for NTD formation was also
observed in studies on other teratogens such as nicotine (Zhao and Reece, 2005) and
hyperglycemia (Loeken et al., 2005).
2 b. General contaminants in water
Approximately 292 million people in the United States rely on community water systems
for their drinking water needs (U.S EPA, 2008). Most municipal water comes from
surface water that is increasingly contaminated with agricultural or man-made pollutants.
Contamination of surface water with pathogens and toxicants significantly impacts
human and animal health. The US Geological Survey found in 2002 that 80% of the
nation’s rivers and streams were contaminated with wastewater contaminants. The most
frequently detected compounds in surface water were cholesterol, coprostanol (fecal
steroid), N,N-diethyltoluamide (DEET – insect repellant), caffeine, triclosan
(antimicrobial disinfectant), tri(2-chloroethyl)phosphate (fire retardant), and 4-
nonylphenol (sewage treatment surfactant, and endocrine disruptor) (Kolpin et al., 2002).
Other ubiquitous contaminants of drinking water include trihalomethanes, haloacetic
acid, MTBE, phthalates, synthetic estrogens and other pharmaceuticals, atrazine, DDT,
benzene, toluene, xylene, tributyl tin, arsenic, fluoride, selenium, and heavy metals
(Schwarzenbach et al., 2006). The Safe Drinking Water Act sets the limits for the
maximum allowable concentrations of water contaminants. Safe concentrations in
municipal drinking water have not been established for some of these contaminants, nor
is their presence monitored (Schwarzenbach et al., 2006). The most important classes of
drinking water contaminants associated with adverse developmental or reproductive

12
effects are pharmaceuticals, endocrine disruptors, water disinfection byproducts and
petroleum products.
Recent studies have found trace amounts of pharmaceuticals and endocrine disruptors in
both surface and drinking water, although, adverse health effects from this contamination
have not been positively identified (Reviewed by Snyder and Benotti, 2010).
Pharmaceuticals and their metabolites can enter the environment or waste water from
excretion of those compounds, or from disposal of expired and unused pharmaceuticals.
Common pharmaceutical compounds such as antibiotics, anti-inflammatory agents, anti-
epileptics, antacids, diuretics and β blockers have been found in a variety of water
sources including surface and ground water (Fent et al., 2006; Glassmeyer et al., 2009
reviews). In another study, conducted from 19 U.S. water utilities, the most frequently
detected contaminants were atrazine, carbamazepine, estrone, gemfibrozil, meprobamate,
naproxen, phenytoin, sulfamethoxazole, tris (2-carboxyethyl) phosphine (TCEP) and
trimethoprim (Benotti et al., 2009).
Contamination of drinking water sources with agricultural herbicides can also adversely
affect reproductive health including intrauterine growth retardation, low birth weight and
prematurity (Ochoa-Acuña et al., 2009, Villanueva et al., 2005, Munger et al., 1997).
Specifically, atrazine concentrations found in the drinking water were associated with
small for gestational age (SGA) births (Ochoa-Acuña et al., 2009). Increases in
intrauterine growth retardation (IUGR) were shown to be associated with the presence of
triazine herbicides in Iowa (Munger et al., 1997). Specific contaminants may not be

13
present in toxic concentrations in drinking water, but mixtures can act synergistically
such that the resulting combination is toxic. Little is known about the potential toxicity or
long term human health effects from chronic exposure to mixtures of these common
water contaminants. The stable chemical structure of some organic contaminants,
including various pharmaceuticals and endocrine disruptors, may prevent their removal
by water treatment systems (Stackelberg et al., 2004, 2007; Falconer, 2006). Occurrence
of pharmaceutical or chemical contaminats in finished drinking water may also depend
on the type of water treatment (Benotti et al., 2009).
Petroleum products such as diesel, gasoline and kerosene are obtained by refining crude
oil, natural gas and coal. Various storage, handling and transport conditions required for
the extensive use of petroleum products provide opportunities for spills. Petroleum
products may be released into the environment because of leaks from storage tanks and
pipes, overfills, spills or intentional disposal. These products can travel through soil and
contaminate drinking water sources. Petroleum products contain potentially toxic
compounds such as xylene and toluene as well as additives such as lead and methyl
tertiary-butyl ether (MTBE). These compounds have various adverse health effects
including teratogenesis. Xylene causes low birth weight, cleft palate and other skeletal
deformities (Marks et al., 1982; Saillenfait et al., 2003). Toluene is teratogenic and reacts
synergistically with acetylsalicylic acid and other compounds that may be present in the
water (reviewed by Wilkins-Haug, 1997).

14
Both epidemiologic and laboratory animal studies suggest an association between water
disinfection byproducts and adverse pregnancy outcomes including NTDs (Bove et al.,
2002 review; Ahmed et al., 2005, Andrews et al., 2004; Hunter et al., 1996; Hunter et al.,
2006). Disinfection of water is necessary to prevent water-borne diseases such as
cholera, typhoid and cryptosporidiosis. Common disinfection methods use chemical
oxidation by chlorine, chloramines, ozone or chlorine dioxide depending on the water
quality and supply system. The disinfectants can react with other compounds present in
the water producing toxic by-products referred to as DBPs (disinfection by-products)
(Rice et al., 2008). Many of these DBPs have not been identified, raising concerns about
safety and health effects of water treatment methods (Richardson et al., 2008 & 2007).
The nature and concentrations of DBPs depend on the type of disinfectant used and also
on the distribution time of the treated water (reviewed by Bull et al., 2009).
Chlorination, the most common disinfection method, forms by-products including
trihalomethanes (THMs) such as chloroform, bromodichloromethane (BDCM),
cholorodi-bromomethane (CDBM), and bromoform. Some of these DBPs are teratogenic
to laboratory animals. Haloacetic acids, at concentrations higher than found in tap water,
cause NTDs in rat embryos (Ahmed et al., 2005, Andrews et al., 2004; Hunter et al.,
1996; Hunter et al., 2006). Ahmed et al., (2005) demonstrated that exposure to
chloroacetonitrile (CAN), another disinfection by-product, caused degeneration of
neurons affecting the development of fetal brain in CD-1 mice. Additionally, CAN
crossed the placenta to induce oxidative stress and apoptosis in the fetal brain.
Epidemiological data on reproductive effects of chlorination disinfectant by-products

15
indicate that these products can cause a variety of birth defects including: low birth
weight, skeletal deformities, growth retardation, spontaneous abortions and NTDs but at
relatively low rates (reviewed by Bove et al., 2002). Schenck et al., (2009) demonstrated
a dose dependent correlation between the mutagenicity and chlorination of the drinking
water. In general, it has been accepted that health risks from exposure to disinfection
byproducts (DBPs) are less than from consuming untreated water.
3. Molecular mechanism associated with apoptosis in the formation of
neural tube defects
Wlodarczyk et al., (1996) analyzed expression of genes regulating early embryogenesis,
cell cycle and proliferation (Emx-1, Emx-2, c-fos, c-jun, Creb, p53 and bcl-2) in the
LM/Bc mouse embryos in response to VA. Expression of transcription factors that
regulate morphogenic events (Emx-1, Emx-2, c-fos, c-jun, and Creb) were increased in
response to VA exposure. Expression of genes that regulate cell proliferation, p53 and
Bcl2, was also increased in VA-treated embryos. Upregulation of p53 results in inhibition
of cell proliferation and induction of apoptosis. Bcl2 prevents apoptosis induced by a
variety of death stimuli (Thomadaki et al., 2007). Since p53/ Bcl2 gene expression ratio
was favored towards Bcl2, Wlodarczyk et al., (1996) speculated cell proliferation rather
than apoptosis may be responsible for the NTDs in this strain. Neither levels of apoptosis
nor inhibition of cell proliferation were analyzed directly, however. Pax3 expression
which has recently been associated with increased apoptosis and NTD formation was also
down regulated (Chappell et al., 2009, Green et al., 2009, Burren et al., 2008, Morgan et
al., 2008, Loeken 2006, Pani et al., 2002).

16
Zinc deficiency is associated with NTDs (Golalipour et al., 2006, Zhang et al., 2005,
Srinivas et al., 2001). Okada et al., (2005) studied effect of VA on polycomb group genes
in GD8 NMRI mouse embryos by microarray analysis. They noticed down regulation of
genes of the polycomb group complex such as Egr2, Zfp105 and Zfp144 that are
associated with zinc finger proteins in VA-treated embryos. Down regulation of zinc
finger proteins is related to increased apoptosis (Herkert et al., 2010, Lademann et al.,
2001, Przyborski et al., 1998). Jergil et al.,(2009) found an association between zinc
finger proteins and NTDs. Okada (2005) also found down regulation of Sirt-1, Eed,
Ezh2, YY1 polycomb group genes in VA exposed embryos. Inhibition of these genes
leads to apoptosis through HDACs pathway (Wang et al., 2010, Peck et al., 2010, He et
al., 2010). Also Sirt1, a histone deacetylase, inhibits apoptosis by binding to p53. Many
teratogens induce genetic damage in the embryo; and in response, expression of p53 may
be increased to prevent the genetic damage (Finnel et al., 2003).
Wlodarczyk et al., (1996) evaluated cell cycle gene expression changes (Bcl-2, p53, Wee-
1 and Wnt-1) in mouse embryos that are exposed to arsenic. Among the 4 genes that were
analyzed, Bcl2 and p53 were up regulated that indicated a DNA damaging effect for
arsenic. Upregulation of p53 results in inhibition of cell proliferation and induction of
apoptosis whereas upregulation of Bcl2 results in inhibition of apoptosis. The authors
proposed that arsenic inhibited cell proliferation rather than increasing apoptosis to cause
NTDs since both the Bcl2 and p53 were overexpressed. Neither cell proliferation nor
apoptosis levels were measured directly, however.

17
Eikel et al., (2006) showed an immediate inhibition of HDAC in response to VA in F9
embryonic carcinoma cells. They proposed that HDAC inhibition by VA may initiate a
molecular pathway leading to NTD formation since HDAC inhibition stimulates the
intrinsic apoptosis pathway through induction of pro-apoptotic genes (Zhang et al, 2006;
Zhao et al., 2005).
Jergil et al., (2009) evaluated the gene expression profile in p19 murine embryonal
carcinoma cells in response to VA using microarrays. These p19 cells are considered as a
model system for early embryonic cells since both have high proliferation rates and
pluripotency. VA-induced apoptosis and decreased cell viability in these cells. Caspase 3
was also activated by VA that indicated induction of apoptosis. Expression levels of
genes related to HDAC inhibition, G1-phase cell cycle arrest and apoptosis (Btg1,
Eif2ak3, Nme5, Plekhf1, Tradd) were altered by VA in this study indicating VA can
affect both cell proliferation as well as apoptosis.
Dawson et al., (2006) evaluated expression of proteins that regulate apoptosis in GD 9.5
embryos of CD-1 mice in response to VA. These proteins include the gene products of
p53, NF-κB, Pim-1, c-Myb, Bax and Bcl-2. p53 protein levels were increased in VA
exposed embryos with open neural tubes compared to embryos with closed neural tubes
of both VA exposed and control embryos. Expression of NF-κB, c-Myb and Pim-1
proteins was decreased in the VA exposed embryos with open neural tubes compared to
the VA-treated normal embryos and the control embryos. Bcl-2 protein levels were
decreased in both embryos that have open and closed neural tubes in the VA exposed

18
group compared to controls. There was no difference between the levels of pro-apoptotic
protein, Bax, observed in VA exposed embryos and control embryos. The ratio of pro-
apoptotic and anti-apoptotic proteins Bax and Bcl2 was significantly higher in embryos
with open neural tubes from VA-treated dams.
Dawson et al (2006) also evaluated the effect of folic acid or pantothenic acid
supplementation on VA-induced NTDs in CD-1 mice. Folic acid reduced alterations in
p53, NF-κB, c-Myb, and Pim-1 protein levels caused by VA. Folic acid did not reduce
alterations in pro-apoptotic protein Bax and the anti-apoptotic protein Bcl-2 levels; but
the ratio of Bax and Bcl-2 was shown to be shifted towards anti-apoptotic pattern.
Pantothenic acid did not affect VA altered p53 protein levels but did reduce VA altered
NF-κB, c-Myb and Pim-1 protein levels. Expression levels of Bax, Bcl-2 or their ratio of
protein expression were not significantly affected by pantothenic acid in VA-exposed
embryos. The authors suggested that folic acid and pantothenic acid have different
mechanisms of actions in preventing the NTDs induced by same teratogen, VA.
Zhang et al., (2010) demonstrated that VA inhibits Hoxa2 gene expression in CD-1
mouse embryos in culture. This effect was reversed when the embryos were grown in
media with ascorbic acid. They proposed that ascorbic acid may be preventing neural
tube defects in embryos exposed to VA by preventing the alteration of Hoxa2 gene
expression.

19
Bennette et al., (2000) demonstrated that VA affects different molecular pathways in
LM/Bc and SWV embryos at three different time points including GD 8.75, GD 9 and
GD 9.5. They showed that VA causes NTDs in the two strains by different molecular
pathways or genes. In LM/Bc embryos, nerve growth factor (Ngf), Trk, Ngf-R and basic
fibroblast growth factor (Bfgf) were up regulated at all these time points. These genes
were not up regulated in SWV embryos; however, in SWV embryos, Tgf-α, Tgf-ß1, Tgf-
ß2, Tgf-β3 were up regulated at GD 9. These genes remain unaltered in LM/Bc embryos
with the exception of Tgf-ß2 that was down regulated at GD 9. Bennette et al., (2000)
performed both PCA and univariate analysis revealing that VA mainly affects principle
components containing TGFs in LM/Bc embryos but not in SWV embryos. This
indicates that VA disrupts regulation of the cell cycle in LM/Bc strain. The authors
suggested that down regulation of TGFs may be the major pathway responsible for VA-
induced NTDs, since TGFs protect neuroepithelial cells from apoptosis. The authors also
proposed regulation of TGFs by VA in SWV may result in decreased cell proliferation
rates leading to NTDs.
Together, the majority of these studies regarding teratogen-induced NTDs show that
NTDs are related to alteration in apoptotic or cell proliferation rates. Teratogens alter the
expression of the genes belong to Bcl-2, p53, NF-kB, Zinc finger proteins and TGF
families. Alteration in the expression of these genes is associated with increased
apoptosis or inhibition of cell proliferation. These studies indicate that different
teratogens induce NTDs by different molecular pathways. Additionally, a single
teratogen can cause NTDs by different mechanisms in different strains. Similarly,

20
intervention strategies reduce the same birth defect through different molecular
mechanisms.
4. Nonspecific immune stimulation and birth defects
4 a. Role of nonspecific immune stimulation in preventing birth defects
Nonspecific stimulation of maternal immune system in mice reduces a wide variety of
teratogen-induced fetal malformations. The immune stimulants shown to have broad-
spectrum activity in reducing the birth defects (including NTDs) were Freund's complete
adjuvant, Bacillus Calmette-Guerin (BCG), inert particles, allogeneic or zenogeneic
lymphocytes, granulocyte macrophage colony-stimulating factor (GM-CSF), or
interferon- γ (IFN-γ). The teratogens tested include various physical and chemical agents,
and also diseases such as diabetes mellitus (Nomura et al., 1990; Holladay et al., 2000;
Prater et al., 2004; Punareewattana and Holladay 2004; Toder et al., 1996; Laudermilch
et al., 2005; Hrubec et al., 2006; Khaksary et al., 2006; Latorre et al., 2007).
Cleft palate, and palate shortening (Hrubec et al., 2009) as well as shortening of
mandibular and maxillary lengths (Hrubec et al., 2006) are reduced by nonspecific
immune stimulation of pregnant diabetic dams with Freund’s complete adjuvant (FCA)
or GM-CSF. Punareewattana and Holladay (2004) demonstrated reduction in incidence
of various birth defects including NTDs and eye defects in fetuses from diabetic ICR
mice by maternal immune stimulation with FCA, GM-CSF or INF-γ. Cleft palate, digit
defects and tail defects are reduced by maternal immune stimulation in ICR mice exposed
to urethane or methyl nitrosourea (Nomura et al., 1990; Holladay et al., 2000; Prater et

21
al., 2004). Birth defects such as open eyes, exencephaly, and resorptions in ICR mice
induced by hyperthermia are reduced by immune stimulation with rat splenocytes
(Yitzhakie et al., 1999). Laudermilch et al., (2005) showed reduced incidence of
syndactyly, polydactyly, and interdigital webbing in MNU-exposed C57BL/6N mice and
CD-1 mice by maternal immune stimulation with IFNγ. Methylnitrosourea-induced
endothelial and trophoblast placental damage was also diminished by maternal immune
stimulation in both strains of mice. Maternal immune modulation reduces
cyclophosphamide-induced fetal malformations such as resorptions and decreased
embryonic weight in mice (Toder et al., 1996). Stress-triggered abortions (Clark et al.,
1993) and spontaneous early embryonic resorptions that are induced by bacterial
lipopolysaccharide (LPS) (Baines et al., 1996) in mice are prevented by immune
stimulation. Gutierrez et al., (2009) reported reduced cardiac malformations with
maternal immune stimulation using FCA in embryos from hyperglycemic mice. The
protective mechanism of maternal immune stimulation is not well understood, however.
4 b. Proposed mechanisms by which maternal immune stimulation prevents birth
defects
Nomura et al., (1990) proposed a mechanism whereby maternal immune stimulation
activates macrophages. These activated macrophages then enter the fetus from the
mother, kill and remove the pre- teratogenic cells that are then replaced with normal
totipotent cells. However, later studies disproved this hypothesis by using flow
cytometry and a cell–tracking probe to demonstrate that no maternal cells crossed the
placenta to effect the protection (Holladay et al., 2002).

22
Sharova et al., (2003) suggested that prevention of teratogen-induced changes in maternal
cytokine profile is a mechanism for the protective effect of maternal stimulation in
reducing teratogenicity. These authors showed that maternal immune stimulation restored
changes in Th1 and Th2 cytokine balance following urethane exposure. They observed
that urethane favors the ratio towards Th1 cytokine profile (IFNγ and IL-2) whereas
maternal immune stimulation shifts the ratio towards Th2 profile by up regulating the
cytokine genes, IL-4, IL-10 and IL-13.
Teratogens, as mentioned in the previous sections, can affect the apoptotic process in
developing embryos. Maternal immune stimulation prevents cyclophosphamide-induced
apoptosis in mouse embryos (Toder et al., 1996; Torchinsky et al, 1995). This indicates
involvement of apoptosis in the protective mechanism of maternal immune stimulation in
reducing the teratogenicity. In later studies, Savion et al., (2003 & 2009) showed that this
protective effect of maternal immune stimulation in reducing cyclophosphamide-induced
apoptosis in embryos was mediated through the normalization of p53 and Bcl2. Maternal
immune stimulation also reduces hyperthermia-induced apoptosis in developing embryos
that may be related to its protective effect (Yitzhakie et al., 1999).
Most teratogens cause malformations by altering expression of important cell cycle
regulatory and/or apoptotic genes (Green et al., 2009, Eikel et al., 2005, Thomson et al.,
2005, Wlodarczyk et al., 1996). Stimulation of the maternal immune system appears to
normalize these alterations and reduce malformations (Sharova et al., 2002). Intervention

23
strategies such as antioxidants or folic acid that reduce birth defects, including NTDs,
prevent the alteration in the expression pattern of genes that regulate apoptosis or cell
cycle (Pani et al., 2002). Fetal gene expression normalized by maternal immune
stimulation so far includes important regulatory genes of cell cycle such as Tgf-β2, Tnf-α
from diabetes (Fein et al., 2001 & 2002; Sharova et al., 2003); Bcl2α, Bcl2β, PkCα and
p53 from urethane (Sharova et al., 2000); and Tgf-β and Tnf-α from cyclosphosphamide
(Ivnitsky et al., 1998; Gorivodsky et al., 1999). Punareewattana et al., (2003) evaluated
immune changes in pregnant dams resulting from maternal immune stimulation by
microarray analysis of gene expression in the spleen of diabetic mice. Maternal immune
stimulation normalized the expression of apoptotic, anti-apoptotic and cell proliferative
genes. Sharova (2000) et al., studied protective effect of maternal immune stimulation in
prevention of urethane-induced cleft palates. These authors analyzed the changes in gene
expression of cell cycle and apoptotic genes due to maternal immune stimulation and
urethane in heads of GD 14 embryos. They noticed down regulation of Bcl2α, Bcl2ß and
PkCα from urethane. These changes were reduced by maternal immune stimulation with
IFNγ. In another study, Punareewattana et al., (2005) noticed up regulation of anti-
apoptotic gene, Bcl2, and down regulation of apoptotic genes R-ras and p-21 in the
embryos from hyperglycemic dams that indicated decreased apoptosis in the embryo as a
potential protective mechanism by which maternal immune stimulation acts to prevent
birth defects.
Gutierrez et al., (2009) showed increased apoptotic cells in fetal myocardium from
hyperglycemic mice. Maternal immune stimulation reduced apoptotic cells in the fetal

24
myocardium. Gutierrez et al., (2009) observed up regulation of Bcl2, an anti-apoptotic
gene, in fetal myocardium of hyperglycemic mice. However, these authors reported that
the increase in Bcl2 in hyperglycemic fetuses was in contrast to other published studies
where the expression of Bcl2 was down regulated. Gutierrez et al (2009) also observed
down regulation of pro-apoptotic gene Casp9 in hyperglycemic embryos. Maternal
immune stimulation did not alter the Casp9 compared to hyperglycemic group. These
authors proposed that increase in pro-apoptotic genes and decrease in anti-apoptotic
genes may be a result of intracellular response in myocardial cells override the earlier
extra cellular apoptotic signals.
Damage to the placental structure can expose the developing embryo to teratogens
present in the maternal circulation. Intervention strategies that prevent birth defects may
act by reducing the placental damage caused by teratogens. Sharova et al., (2003) noticed
damage to the syncytiotrophoblast of placenta caused by urethane. Other changes to
placenta caused by urethane include diffuse fibrosing villosis and reduced vascularization
in the placenta. These changes were reduced by maternal immune stimulation with FCA
or IFNγ. Prater et al., (2004) studied the protective mechanism by which maternal
immune stimulation prevents methylnitrosourea (MNU)-induced limb defects. MNU
caused necrosis of trophoblasts and endothelial cells of the labyrinthine layer and
maternal immune stimulation with IFNγ reduced cell death in placental layers. Similar to
Prater et al., (2004), Laudermilch et al (2005) noticed multifocal areas of necrosis,
karyolysis and pyknosis, cellular fragmentation, hypereosinophilia, and collapse of
vascular patency in labyrinthine layers of placenta in urethane exposed dams. These

25
changes were reduced with maternal immune stimulation. VA did not cause any
histological changes in placenta in mice (Hrubec et al., 2006). This indicates placenta
may not be involved in VA teratogencity. Punareewattana et al., (2005) also did not
observe any changes in expression of placental genes from maternal immune stimulation
in diabetic mice. This implies protective effect of immune stimulation is not be related to
changes in the placenta.
Teratogens induce birth defects through different mechanisms depending on the type and
timing of teratogen exposure. Maternal immune stimulation can prevent a wide array of
birth defects. Thus, it appears that maternal immune stimulation may act through various
mechanisms depending on the type of teratogen exposure and type of malformation. The
predominant mechanism by which maternal immune stimulation appears to reduce fetal
malformations is by preventing the changes in the genes or molecular pathways
regulating cell proliferation and apoptosis in placenta and fetus.
Present literature suggests that teratogens may alter normal apoptotic processes in the
embryo resulting in fetal malformations. This study will test the hypothesis that both VA
and the teratogen present in tap water alter the location or amount of fetal apoptosis by
changing apoptotic signaling in embryos resulting in formation of NTDs. The mechanism
of protection by maternal immune stimulation is not well understood but believed to
involve maternal modulation of developmental processes in embryo. This study will
explore the role of apoptosis in the protection by maternal immune stimulation. These
studies are expected to significantly increase our understanding of the role of apoptosis in

26
NTD formation and identify specific molecular mechanisms responsible for teratogen-
induced NTDs. This research is of importance to human health as understanding the
mechanisms of NTD induction will lead to successful intervention strategies.

27
III. MATERIALS AND METHODS
This project investigated the role of apoptosis in NTD formation induced by two
teratogens: valproic acid (VA) and unknown contaminant present in tap water in a series
of 5 experiments.
Study 1 identified the source of an unknown teratogen causing NTDs in control mice by
testing multiple combinations of housing conditions, mouse strain, diet and water.
Study 2 characterized the teratogen in tap water to narrow down possible contaminants
and aid in the identification of the unknown by analytical methods. This study
determined whether the teratogen acted directly or was a metabolite, and also determined
if the teratogen was a water disinfection byproduct.
Study 3 determined the role of apoptosis in the formation of NTDs from two teratogens,
VA and tap water. The study also determined whether the protective effects of maternal
immune stimulation are mediated by changes in apoptosis.
Study 4 profiled apoptotic pathway genes responsible for teratogen (VA and tap water) -
induced apoptosis. The study also profiled apoptotic pathway genes that play a role in
protective effects of maternal immune stimulation.
Study 5 determined which cellular signaling pathways were altered during teratogen-
induced NTDs. Expression of key genes related to 18 different developmentally

28
important signaling pathways was analyzed. This study was carried out to elucidate if
teratogens alter these signaling pathways to induce NTDs and also if the protective effect
of maternal immune stimulation is related to changes in these signaling pathways.

29
Study 1. Neural tube defects in mice exposed to tap water
1 a. Animals
The following sources and strains of mice were used for to determine the cause of neural
tube defects in control mice:
1. CD-1 strain raised in-house from brood stock obtained from Company A.
2. Purchased CD-1 mice were obtained from Company A at 5-8 weeks of age.
3. ICR strain, 6 weeks of age, purchased from Company B.
4. Time pregnant mice were purchased from laboratory animal providers as follows:
CD-1 from Company A, Raleigh NC and Portage MI; ICR strain from both
Company B, Dublin, VA and Company C, Germantown, NY; and Swiss Webster
mice from Company C, Germantown, NY. All mice were bred at the vendor’s
facility and shipped on gestation day (GD) 10-11 after neural tube closure.
Embryos were evaluated for NTDs immediately upon arrival in our facility on GD
11-12.
5. F2-DDI were derived from purchased CD-1 mice from Company A. Mice were
provided only distilled de-ionized (DDI) water for two generations as described in
Figure 1 to obtain F2-DDI mice.

30
Figure 1. Breeding scheme of mice to obtain embryos from mice provided with distilled de-
ionized (DDI) water for 2 generations (F2-DDI).
Mice that were raised or maintained in house were housed in conventional cages in a
standard mouse room with 12 hours day length, 70-73oF, 50±20% humidity and ad
libitum access to feed and water. For breeding, 2 or 3 females were housed with a male of
the same strain provided with the same experimental conditions. The females were
checked for copulation plugs every morning. When a copulation plug was found, the
female was separated and midpoint of the dark cycle was designated as gestation day
(GD) 0. Mice were euthanized on GD 9.5 by an overdose of CO2 and embryos were
evaluated for NTDs under a stereozoom microscope (Olympus SZX7, Melville, NY).
Embryos were staged by somite count, number of brachial arches and amount of limb
bud growth to verify sufficient development for neural tube closure.

31
All procedures related to animal use were approved by and conducted in compliance with
the Institutional Animal Care and Use Committee (IACUC) at the College of Veterinary
Medicine at Virginia Tech, an Association for Assessment and Accreditation of
Laboratory Animal Care International (AAALAC) accredited facility.
1 b. Experimental conditions to screen for possible risk factors
Purchased CD-1 mice were exposed to multiple combinations of housing, diet and water
for 2 weeks in order to narrow down possible causes for the observed malformations. The
feed was certified by the manufacturer (Teklad) using independent analysis to be free or
within normal limits of the following potential contaminants.
• arsenic • cadmium • lead
• mercury • selenium • aflatoxin B1, B2, G1, G2
• aldrin • lindane • chlordane
• thiodan • dieldrin • endrin
• heptachlor • heptachlor epoxide • toxaphene
• PCB’s • Thimet • Hexachlorobenzene
• Mirex • Methoxychlor • DDT & related substances
• Diazinon • Disulfoton • methyl parathion
• malathion • parathion • α, β, γ Benzene hexachloride
• ethion • trithion
Bedding material was tested independently by the manufacturer (ALPHA-Dri, Shepherd
Specialty Papers, Watertown, TN) for the following possible contaminants.
• Arsenic • organophosphate pesticides
• bismuth • organochlorine pesticides
• cadmium • PCBs
• Lead

32
Experimental and sentinel mice were tested numerous times over a 7 month period for
routine and comprehensive screens of known mouse pathogens by Rodent & Rabbit
Serology Laboratory at BioReliance, Rockville, MD. The infectious agents that were
tested include:
• Cilia-associated aespiratory bacillus • Mouse hepatitis virus (MHV)
• Clostridium piliforme (Tyzzer’s) • Mouse minute virus (MMV)
• Convict Creek virus (CCV) • Mouse parvovirus (MPV)
• Ectromelia virus (Ectro) • Mouse reovirus
• Encephalitozoon cuniculi (E. cun.) • Mouse reovirus type 3 (Reo3)
• Epizootic diarrhea of infant mice • Mouse thymic virus (MTV)
• Epstein-Barr related virus (EBV) • Murine cytomegalovirus (MCMV)
• Helicobacter bilis • Murine norovirus (MNV)
• Helicobacter hepaticus • Mycoplasma arthritidis
• Helicobacter rodentium • Mycoplasma pulmonis
• Helicobacter typhlonius • Parvovirus
• Hantaan virus • Pneumonia virus of mice (PVM)
• Helicobacter spp • European hantavirus
• K Virus (Mouse pneumonitis virus), • Respiratory synctial virus
• Lymphocytic choriomeningitis virus • Rotavirus sendai virus
• Mouse adenovirus 1 & 2 • Theiler’s mouse encephalomyelitis
virus

33
1 c. Association of source, strain and NTDs
The source and strain of mice was tested using CD-1 strain raised in house from brood
stock obtained from Company A, CD-1 mice obtained from Company A and ICR mice
obtained from Company B.
1 d. Association of housing and NTDs
Housing location was tested by raising mice at two different facilities of VA-MD
Regional College of Veterinary Medicine in Blacksburg located approximately 2 miles
apart.
Housing type was tested by maintaining newly purchased CD-1 mice in conventional
cages (n= 92), in microisolator cages under sterile conditions in a HEPA filtered laminar
flow hood (n=9), and under Biosafety Level 2 (BSL2) containment conditions in a
separate facility (n=3).
1 e. Association of diet and NTDs
The effect of diet on NTDs was tested by providing newly purchased CD-1 mice four
commercial rodent diets from three different vendors (Harlan, Purina and Ziegler). The
commercial rodent diets that were tested included Harlan Teklad Rodent Diet 7013 (n=3),
Madison, WI; Ziegler Rodent diets 18-6 (n=61) and NTP-2000 (n=9), Gardeners, PA and
Purina 5001 (n=31), Richmond, IN, USA. All were complete diets suitable for growth
and reproduction.
1 f. Association of water and NTDs
Three different sources of water were tested in newly purchased CD-1 mice including tap
water from location A, south west VA (n=25), distilled-deionized (DDI) water (Milli-Q

34
system water at 18 Ohm resistance, Millipore Corporation, Billerica, MA) (n=30), and
HPLC water (OmniSolv, EMD Chemicals Inc, Gibbstown, NJ) (n=26). Mice received
fresh water once or twice a week. Mice that were maintained under sterile conditions
received new autoclaved water once or twice a week.
1 g. F2 Generation: Association of water and NTDs
In our last experiment, F2-DDI mice were tested with five sources of water under
controlled conditions. All mice were housed in conventional cages and were fed Zeigler
NTP diet. The five sources of water were: municipal tap water from location 1 in
southwest VA (n=25); municipal tap water from location 2 in northeast MD (n=23);
municipal tap water from location 3 in central MD (n=21); DDI water (n=20); and HPLC
water (n=8). Among these water sources, location 2 and 3 were from urban commercial
water suppliers whereas location 1 was from a rural commercial water supplier.
Freshwater from the five sources was provided to the mice once or twice a week.
1 h. Statistical analysis
Statistical analysis was conducted by the Laboratory for Study Design and Statistical
Service at Virginia Tech. Dams were considered the treatment unit and the percentage of
NTDs was calculated as the mean percentage of embryos with NTDs per litter.
Associations between treatment variables and percentage of NTDs were assessed by
Poisson regression using the Statistical Analysis System (version 9.1.3, SAS Institute,
Cary, NC 27513) and statistical significance was set at p≤ 0.05.

35
Study 2. Characterization of teratogen present in tap water
2 a. Chemical characterization of teratogen present in tap water
This study determined if the teratogenic compound(s) was volatile or non-volatile. The
results were helpful for further identification of the compound by chemical analysis.
Volatile and non-volatile fractions of tap water were prepared using distillation and solid
phase extraction, respectively (Figure 2). Tap water and DDI water were collected and
processed every week. Each week one liter of tap water sample was heated to vaporize
the volatile compounds. The vapors, containing the volatile compounds, were passed
through a condenser to cool and the condensate collected. The condensate was
reconstituted back to 1 L with DDI to obtain the initial concentration in tap water. The
non-volatile fraction was obtained by passing the remaining water sample after removal
of volatile compounds through a C18 solid phase extraction column and the elute (~1 ml)
was reconstituted back to original concentrations by adding DDI water (~999 ml).
F2-DDI mice were housed in conventional cages in a standard mouse room with 12 hours
day length, 70-73oF, 50±20% humidity and ad libitum access to Zeigler NTP diet 18-6
and DDI water. For the exposure study, 15 F2-DDI females were provided either volatile
or non-volatile water fractions for 4 weeks prior to breeding. Fresh fractionated water
was provided to the mice every week. Pregnant dams were continued on their water
treatments during gestation and were euthanized by CO2 inhalation on GD 9. Embryos
were evaluated for the presence of NTDs.

36
Statistical analysis
Dams were considered the treatment unit and the percentage of NTDs was calculated as
the mean percentage of embryos with NTDs per litter. Associations between treatment
variables and percentage of NTDs were assessed by One way analysis of variance
(ANOVA) (Statistix 8, Analytical Software, Tallahassee, FL). When a significant
difference was observed (p<0.05), a Tukey’s means comparison was used to determine
differences between treatment groups.
Figure 2. Separation of volatile and non-volatile fractions of water samples using distillation and
solid phase extraction, respectively.
C18 Column
1
2
3
45 6
7
8
9
1 10
2
3
45 6
7
8
9
11
Volatile
Non-volatile

37
2 b. Metabolism study to determine whether teratogenicity is caused by a parent
compound or its metabolite
The objective of this experiment was to demonstrate whether the parent compound or a
metabolite was responsible for the fetal malformations. Cytochrome P450 enzymes are
liver enzymes involved in metabolism of various xenobiotic compounds in order to
eliminate them from the body (Anzenbacher et al., 2001, review). Cytochrome P450s
may activate a chemical to a toxic metabolite or may inactivate a toxicant by
metabolizing it to a non-toxic metabolite and/or increase the elimination of the compound
from the body. If the parent compound is teratogenic, the teratogenicity should decrease
when cytochrome P450 enzymes are induced as more parent compound is metabolized to
a non-tertogenic form. If teratogenicity is caused by a metabolite, the number of
malformations will increase when cytochrome P450 enzymes are induced as more
teratogenic metabolites are formed. Cytochrome P450 enzyme inhibitors increase the
teratogenicity if the parent compound is teratogenic and decrease the teratogenicity if
teratogenicity is caused by a metabolite.
Administration of SKF 525-A dissolved in sterile water was used to inhibit cytochrome
P450 enzymes. Initially, β-naphthoflavone in corn oil was selected to induce cytochrome
P450 enzymes as suggested by previous studies (Brauze et al., 2002; Azoulay-Dupuis et
al., 1988) but the compound did not dissolve in corn oil. β-naphthoflavone was then
dissolved in DMSO; but when administered, 3 of the 5 mice injected died unexpectedly.
Due to the unexpected results with β-naphthoflavone, phenobarbital dissolved in saline
was selected as cytochrome P450 inducer.

38
F2-DDI mice bred in our lab were provided with either tap water or DDI water for 2
weeks prior to breeding. Each treatment group received either phenobarbital or SKF 525-
A on gestational days 6, 7, 8 (spanning the time of neural tube closure) as described
below.
Treatment groups:
• Phenobarbital (80 mg/kg/d in saline by IP injection) administered to F2 DDI dams
provided with tap water (n=12).
• SKF 525-A (40 mg/kg/d in sterile water by IP injection) administered to F2 DDI
dams provided with tap water (n=15).
• Normal Saline (0.1 ml by IP injection) administered to F2 DDI dams provided
with tap water (n=11).
• Phenobarbital (80 mg/kg/d in saline by IP injection) administered to F2 DDI dams
provided with DDI water (n=12).
• SKF 525-A (40 mg/kg/d in sterile water by IP injection) administered to F2 DDI
dams provided with DDI water (n=11).
Animal housing conditions, diet and water were same as described in study 2a. For
breeding, 2 or 3 females were added to a male. The females were checked for copulation
plugs every morning. When a copulation plug was found, the female was separated and
the midpoint of the dark cycle was designated as GD 0. Mice were euthanized on GD 9
by an over dosage of CO2, and the embryos were evaluated for NTDs under stereozoom
microscope (Olympus SZX7, Melville, NY).

39
Statistical analysis
Dams were considered the treatment unit and the percentage of NTDs was calculated as
the mean percentage of embryos with NTDs per litter. NTD levels in embryos of mice
consuming tap water were compared to DDI in each treatment group by student t-test.
Statistical significance was set at p≤0.05.
2 c. Determination of whether the teratogen is a disinfection byproduct
Disinfection of drinking water results in numerous disinfection by-products (DBPs) such
as haloacetic acids. Epidemiological as well as rodent studies have shown that DBPs are
developmental toxicants and can cause NTDs (Bove et al., 2002). The appearance of
NTDs in our mice in May 2006 correlated with increase in nitrates subsequent to a
change in the water treatment from chlorination to chloramination. Drinking water
facilities are increasingly changing the water treatment process from chlorination to
chloramination in order to meet regulatory standards for drinking water. Chloramination
results in low levels of haloacetic acids and other DBPs compared to chlorination;
however, production and toxicity of novel DBPs resulting from chloramination are not
well known. This experiment determined whether the unknown teratogen in tap water
was a result of change in the water treatment.
Water treatment process (Chloramination):
Raw water is obtained from water sources (river, well, reservoir) and chlorine is added
immediately to kill microorganisms (Figure 3). Water is then treated with flocculants to
coagulate particulate matter and flows through sedimentation tanks where the coagulated

40
particles settle at the bottom of the tank. Water is then filtered to remove remaining
particles. Chlorine is added again after filtration to kill remaining bacteria and the water
is then stored until distributed. Ammonia is added to the water right before distribution to
form stable chloramines that provide long-lasting disinfection in the distribution system.
Chloramination allows treatment with less total chlorine because the long-lasting
chloramines are more stable than chlorine.
Figure 3. Flow chart showing different steps involved in water treatment process.
Storage Reservoirs
Distribution System
Sedimentation
Filtration
Clear Well
Raw Water
Mixing
Flocculation
Pre- Chlorination &
Addition of Alum for coagulation
Addition of Ammonia
Post- Chlorination

41
Mice were provided with water collected from different points during the treatment
process. Treatment groups included:
• River water without any treatment collected right before entering treatment
line (autoclaved to kill pathogens)
• River water after chlorinated treatment collected right before entering the
distribution (autoclaved)
• Tap water collected post distribution (Chloraminated)
• Tap water collected post distribution (Chloraminated + Autoclaved)
• Well water collected post distribution (Chlorinated) from a separate municipal
system in SW Virginia
Animal housing conditions, diet and water were the same as described in study 2a. River
water and well water were autoclaved and refrigerated immediately after collection. Mice
(n=15 per treatment) were provided with the above water types for 2 months prior to
breeding. Pregnant dams were continued on their water treatments during gestation and
were euthanized by CO2 inhalation on GD 9. Embryos were evaluated for the presence
of NTDs.
Satistical analysis
One way analysis of variance (ANOVA) (Statistix 8, Analytical Software, Tallahassee,
FL) with the mother as the treatment unit was used to determine differences between the
treatment groups. When a significant difference was observed (p<0.05), a Tukey’s means
comparison was used to determine differences between treatment groups.

42
Study 3. Apoptotic changes in embryos from teratogens and maternal
immune stimulation
To determine if apoptosis plays a significant role in formation of NTDs from valproic
acid (VA) and tap water, apoptotic percentages were quantified by flow cytometry and
apoptotic regions were identified by TUNEL assay in GD 9 mouse embryonic heads
exposed to teratogens. To determine whether maternal immune stimulation could prevent
changes in apoptotic levels, apoptotic regions were assessed in embryos of IFNγ
stimulated VA-treated mice.
Animal housing conditions, diet and water were same as described in study 2a. Mice
from the various treatment groups were sacrificed on GD 9 and embryos were collected.
The amount of apoptosis was determined by flow cytometry (study 3a) and the location
of apoptotic pattern was determined by TUNEL assay (study 3b) in embryonic heads.
Valproic acid and maternal immune stimulation
To determine the apoptotic changes from VA and immune stimulant administration, the
following 4 treatment groups of CD-1 mice (n=12 litters per group) were used:
• Control (0.1 ml saline by IP injection pre-breeding day -10 & day -5, and on
GD 8)
• Valproic acid (0.1 ml saline by IP injection pre-breeding day -10 & day -5,
and 500 mg/kg body wt. of VA by IP injection on gestation day (GD) 8)
• Immune stimulation with IFNγ (1000 IU by IP injection on pre-breeding day
-10 & day -5, and 0.1 ml saline by IP injection on GD 8)

43
• Valproic acid + IFNγ (1000 IU of IFNγ by IP injection on pre-breeding day
-10 & day -5, and 500 mg/kg body wt. of VA by IP injection on GD 8)
DDI and tap water
Apoptosis in embryos of tap water exposed dams was determined to identify whether
apoptosis was involved in the formation of NTDs by the water teratogen.
The following groups were examined (n=12 litters/group)
• Control (F2-DDI mice provided with DDI water only)
• Tap water (F2-DDI mice provided with tap water for 4 weeks prior to
breeding)
Stastical analysis
One way analysis of variance (ANOVA) (Statistix 8, Analytical Software, Tallahassee,
FL) with the mother as the treatment unit was used to determine differences between the
treatment groups. When a significant difference was observed (p<0.05), a Tukey’s means
comparison was used to determine differences between treatment groups.

44
3 a. Quantitative estimation of apoptotic changes by flow cytometry in the heads of
mouse embryos exposed to VA with or without maternal immune stimulation and in
embryos exposed to tap water
An assay to quantify apoptotic cells in early embryos was developed. The technique uses
differential staining of disassociated embryonic cells to allow identification of apoptotic
and dead cells. Apoptotic and dead cells both stain with Annexin V-FITC, since it binds
to the exposed phospholipid phosphatidyl-serine of disintegrating cells. Dead cells will
only stain with propidium iodide (PI) since this stain enters through leaks in the cell
membrane of dead cells to bind DNA. Thus, single staining apoptotic cells can be
differentiated from the double staining dead cells.
The percentage of apoptotic cells in the developing heads of GD 9 mouse embryos was
quantified in each treatment group using flow cytometry. Embryos were isolated from the
decidua and the heads were separated in Dulbecco's Modified Eagle Medium (DMEM).
Heads were then incubated for 1 hour at 37oC in 1 ml of Dispase II enzyme (2.4 U/ml)
(Roche Diagnostics GmbH, Penzbeg, Germany) to disassociate the cells. After the
incubation, cells were further disassociated by gently pressing the tissue with a plunger.
Cells in the Dispase II solution were collected in a 5 ml centrifuge tube and centrifuged
for 5 min at 1000 x g rpm. The supernatant was poured off, cells were then re-suspended
in 1 ml DMEM and aliquoted in to 4 separate tubes (250 ml each). Annexin V-FITC (BD
Biosciences Pharmingen, San Jone, CA) and PI (Sigma-Aldrich, St. Louis, MO) dyes
were added to the 4 separate tubes and incubated for 5 min in the dark to stain the cells as
follows:

45
• Negative control (No annexin V and no PI)
• Annexin V control (5 µl of Annexin V only)
• PI control (20 µl of PI only)
• Test (5 µl of Annexin V + 20 µl of PI)
The cells were then evaluated by flow cytometry to quantify apoptosis. Flow cytometry
acquisition was performed on a BD FACSAria I (BD Bioscience, San Jose, CA, USA)
and data were analyzed with FlowJo Software (TreeStar, Ashland, OR, USA). As the
cells pass through the laser beam in flow cytomter, light is scattered. Cell size was
measured by analyzing the light scattered in a forwarding direction. Granularity was
measured by analyzing side scatter. Three different gates were used to isolate singlet cells
and exclude aggregate cells. The first gate was drawn on a forward scatter pulse area
(FSC-A) vs side scatter pulse area (SSC-A) plot and included all events except debris.
The second gate was drawn on a forward scatter pulse width (FSC-W) vs a forward
scatter pulse height (FSC-H) plot to exclude most aggregated cells. The third gate was
drawn on a side scatter pulse width (SSC-W) vs side scatter pulse height (SSC-H) plot to
exclude remaining aggregated cells missed in the second gate. On the final plot of
Annexin V-FITC vs PI, a quadrant gate was drawn using the single color controls to
determine placement. For each sample, 10,000 singlet cells were counted.

46
3 b. Localization of specific apoptotic regions in the heads of mouse embryos
exposed to VA with or without maternal immune stimulation and in embryos
exposed to tap water by Terminal Transferase dUTP Nick End Labeling (TUNEL)
assay
Apoptotic cells were localized by visualizing fragmented DNA, one of the hallmarks of
apoptosis. Fragmentation of DNA results in free 3’-hydroxyl ends. Terminal
deoxynucleotidyl transferase (TdT) is used to add the fluorescein -2’deoxyuridine 5’-tri-
phosphate (fluorescein-dUTP) to the free hydroxyl ends of DNA. The incorporated
BrdUTP can then be detected by an anti-fluorescein antibody colour conjugate alkaline
phosphatase that can be visualized by light microscopy.
Apoptotic cells were localized by TUNEL assay in the heads of mouse embryos from
above mentioned treatment groups in study 3a. The assay was performed following the
procedure of Kultima et al., (2004) using an In-situ Cell Death Detection Kit (Roche
Molecular Biochemicals, Indianapolis, USA). Gestation day 9 embryo heads were fixed
in 4% paraformaldehyde in phosphate buffer solution with 0.1% Tween-20 (PBS-T)
overnight. Heads were then transferred to 100 % methanol and stored at -20oC until the
assay. Embryos were prepared for the assay by placing them in 70% methanol in PBS-T
for 10 minutes followed by transfer to 100% PBS-T for an additional 10 minutes before
permeabilization in 1% Triton X- 100 in PBS-T for 2 minutes on ice to allow the reagents
to reach their target molecules. Embryos were transferred to depression slides and rinsed
3 times using PBS-T and 50 µl of TUNEL reaction mixture containing 10 µl of TdT
enzyme solution and 40 µl of labeling solution (dUTP nucleotide mix) was added to the
embryo heads in depression slides. The heads were incubated at 37oC in a dark

47
humidified chamber for 1 hour. After incubation, slides were rinsed 3 times with PBS-T
and covered with 50 µl of 3% bovine serum albumin (BSA) in PBS-T to block non-
specific activity of endogenous alkaline phosphatase. BSA was washed off and then 50 µl
Converter - AP (anti- fluorescein-alkaline phosphatase conjugate) was added and
incubated at 37oC in a dark humidified chamber for 30 minutes. The heads were then
rinsed 3 times with PBS-T and covered with 50 µl of NBT (nitro blue tetrazolium
chloride) /BCIP (5-Bromo-4-chloro-3-indolyl phosphate, toluidine salt) substrate
solution (200 µl NBT/BCIP in 10 ml 0.1 M Tris-HCl, pH 9.5 (20°C), 0.1 M NaCl, 0.05
M MgCl2) and incubated in dark at room temperature for 20 minutes. The heads were
rinsed 3 times with PBS-T and analyzed for apoptotic cells under light microscopy.
Positive controls were prepared by pre-treating embryos with DNase to induce DNA
strand brakes that would satin positive in the reaction. Negative controls were prepared
by only adding TUNEL labeling solution that contained nucleotides (no TdT enzyme)
instead of the standard TUNEL mixture. Negative controls ensured the staining did not
result from nonspecific binding or other reagents such as Converter – AP and substrate
solution.

48
Study 4. Molecular regulation of apoptosis by VA with or without
maternal immune stimulation and by tap water
Analysis of pathway-focused genes provides insight regarding the overall mechanism of
VA and tap water-induced teratogenicity and protection by immune stimulation. In this
study, alterations in expression of apoptotic pathway genes were determined in response
to VA with or without maternal immune stimulation and tap water. Gene families
included in this study were TNF ligands and their receptors, TRAF, death domain and
death effector domain family genes, IAPs (inhibitor of apoptosis proteins) family genes,
Caspases, Bcl-2 family genes and p53 pathway and other DNA damage induced genes
(Appendix 1 for complete list of genes).
4 a. Changes in apoptotic pathway gene expression in GD 8.5 and 9 mouse embryos
from VA with and without maternal immune stimulation exposure
The following 4 groups of CD-1 mice were tested:
• Control (0.1 ml saline by IP injection pre-breeding day -10 & day -5 and on
GD 8)
• Valproic acid (0.1 ml saline by IP injection pre-breeding day -10 & day -5 and
500 mg/ kg body wt. of VA by IP injection on gestation day (GD 8)
• Immune stimulation with IFNγ (1000 IU of IFNγ by IP injection on pre-
breeding day -10 & day -5 and 0.1 ml saline by IP injection on GD 8)
• Valproic acid + IFNγ ( 1000 IU of IFNγ by IP injection on pre-breeding day
-10 & day -5 and 500 mg/kg body wt. of VA by IP injection on GD 8)

49
Animal housing conditions, diet and water were same as described in study 2a. Mice
were euthanized by carbon dioxide and embryonic heads were collected on days 8.5 and
9 of gestation (spanning the time of neural tube closure) from the above 4 groups of mice
(n=3 for each treatment). Embryos from each dam were divided into two pools based on
whether they had open or closed neural tubes. Embryonic heads were separated (Figure
4) and then were stored in RNAlater until RNA extraction (Figure 5). Pooling embryos
belonging to the same litter (keeping embryos with open and closed neural tubes
separate) was necessary, since the amount of RNA from one embryo was not sufficient
for our RT² Profiler PCR Arrays experiments. RNA was isolated separately from each
pool using RNeasy Mini, RNA isolation kit (QIAGEN, Valencia, CA) as described
below.
Figure 4. Removal of heads from the GD9 embryos for RNA. Embryonic heads were
removed by cutting along the red line.

50
Isolation of RNA:
RNA was isolated as follows.
1. Pooled embryo heads from each litter in RNAlater were transferred to a collection
tube containing 350 µL of lysis buffer (Buffer RLT in β- meracapto ethanol,
1:100).
2. Heads were homogenized immediately using a tissue homogenizer making sure
there were no chunks of tissue remaining in solution. The homogenate was
transferred to a capped test tube.
3. The homogenate was centrifuged for 4 min at 14,000 g at 20-25oC. (To pellet
tissue debris and film).
4. The supernatant was transferred into a new 2 mL microcentrifuge tube and 1
volume equivalent (~ 350 µL) of 70% ethanol was added to the supernatant and
mixed well by pipetting.
5. The above supernatant (700 µL), including any precipitate that may have formed,
was transferred into an RNeasy Mini Spin Column in a 2 mL collection tube and
centrifuged at 10,000 g for 15 sec.
6. The flow-through was discarded and 350 µL Buffer RW1 was pipetted into the
column that was then centrifuged at 10,000 g for 15 sec to wash. The flow-
through was discarded again.
7. To eliminate the genomic DNA contamination, 80 µL of DNase I solution (10 µL
of DNase I stock solution in 70 µL Buffer RDD) was added directly onto the
RNeasy silica-gel membrane of the column and incubated at room temp for 15
min.

51
8. The column was washed with 350 µL Buffer RPE and centrifuged for 15 s at
10,000 g.
9. The flow-through and the collection tube were discarded and the column was
transferred into a new 2 mL collection tube.
10. Buffer RPE (500 µL) was transferred onto the column and centrifuged for 15 sec
at 10,000 g. The flow-through was discarded.
11. Another 500 µL of Buffer RPE was added onto the column and centrifuged for 2
min at 10,000 g to dry the silica gel membrane.
12. The column was removed from the collection tube without touching the flow-
through and was placed in a new 2 mL collection tube. The old tube and flow-
through were discarded. The column was then centrifuged at 14,000 g for 2 min.
13. To elute, the column was transferred into a new 1.5 mL collection tube. 15 µL
RNase-free water was pipetted directly onto the membrane and centrifuged for 1
min at 10,000 g to elute.
14. Quantity (µg/ml) and quality (260/280 ratio) of RNA sample aliquot were
measured using Eppendorf BioPhotometer.
15. The eluted RNA sample was stored at -20oC until cDNA synthesis.

52
Figure 5. Schematic diagram showing pooling of the embryos, isolation of RNA, cDNA
synthesis and Real-Time PCR from each treatment group.
cDNA synthesis:
cDNA was prepared from 1 µg total RNA of each pooled sample by using a RT
2 PCR
array first strand kit (C-03; SuperArray Bioscience, Frederick, MD) according to the
manufacturer’s instructions. Briefly, 1 µg sample of extracted RNA was mixed with 2 µl
of super array 5 X genomic DNA elimination mixture to eliminate genomic DNA
contamination. RNase-free water was added to makeup the final volume of 10 µl. The
Treatment
group
Dam 1 Dam 2 Dam 3
Embryos
with open
NT
Embryos
with closed
NT
Embryos
with open
NT
Embryos
with closed
NT
Embryos
with open
NT
Embryos
with closed
NT
RNA
cDNA
RT-PCR
RNA
cDNA
RT-PCR
RNA
cDNA
RT-PCR
RNA
cDNA
RT-PCR
RNA
cDNA
RT-PCR
RNA
cDNA
RT-PCR

53
above mixture was incubated at 42oC for 5 min and immediately chilled on ice. To the
above mixture, equal amount of RT cocktail (containing 4 µl of 5X super array RT
buffer, 1 µl of Primer and External Control Mix, 2 µl of super array RT enzyme mix 3,
and 3 µl RNase-free water) was added. The mix was incubated at 42oC for 15 min, and
then heated at 95oC for 5 min to inactivate the reverse transcriptase. The mix was then
stored at -20oC until analysis.
Real time PCR for gene expression
Real time PCR was performed using mouse apoptosis RT2 Profiler PCR array (PAMM-
012, Super Array Biosciences Corporation, Frederick, MD). The expressions of 84 genes
associated with apoptosis were analyzed according to the manufacturer instructions.
Each PCR array plate layout consisted of 96 wells (8 rows (A-H) X 12 columns (1-12)).
Wells A1 through G12 contained a real-time PCR assay for apoptotic pathway genes
(Figure 6). Wells H1 through H5 contained a housekeeping gene panel to normalize PCR
Array data. The 5 housekeeping genes that were included in this PCR array were Gusb,
Hprt1, Hsp90ab1, Gapdh and ß-actin. Well H6 contained the Genomic DNA Control
(GDC) to test for genomic DNA contamination in each sample during each run. Wells H7
through H9 contained replicate Reverse Transcription Controls (RTC) to test for
impurities in RNA sample that could affect reverse transcription reaction during cDNA
synthesis. Wells H10 through H12 contained replicate Positive PCR Controls (PPC) to
test for inhibitors of PCR amplification.
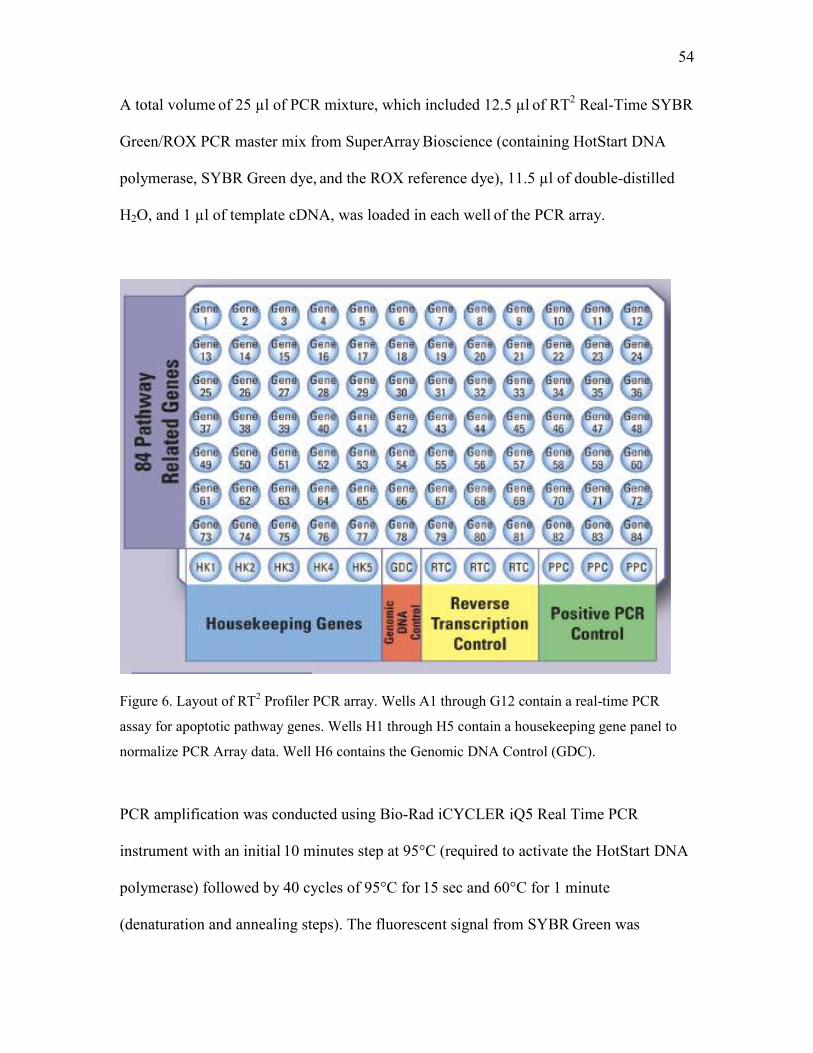
54
A total volume of 25 µl of PCR mixture, which included 12.5 µl
of RT
2 Real-Time SYBR
Green/ROX PCR master mix from SuperArray Bioscience (containing HotStart DNA
polymerase, SYBR Green dye, and the ROX reference dye), 11.5 µl of double-distilled
H2O, and 1 µl of template cDNA, was loaded in each well of the PCR array.
Figure 6. Layout of RT2 Profiler PCR array. Wells A1 through G12 contain a real-time PCR
assay for apoptotic pathway genes. Wells H1 through H5 contain a housekeeping gene panel to
normalize PCR Array data. Well H6 contains the Genomic DNA Control (GDC).
PCR amplification was conducted using Bio-Rad iCYCLER iQ5 Real Time PCR
instrument with an initial 10 minutes step at 95°C (required to activate the HotStart DNA
polymerase) followed by 40 cycles of 95°C for 15 sec and 60°C for 1 minute
(denaturation and annealing steps). The fluorescent signal from SYBR Green was

55
detected immediately after the extension step of each cycle, and the cycle at which the
product was first detectable was recorded as the cycle threshold.
Statistical Analysis
Data were imported into an Excel database and analyzed using the comparative cycle
threshold (∆∆ Ct) method with normalization of the raw data to housekeeping genes
using
software from www.superarray.com website. The ∆∆ Ct was determined as follows: ∆ Ct
value of each gene on the PCR plate was calculated by subtracting Ct value of the gene of
interest (GOI) with average the Ct value of housekeeping genes. To calculate ∆∆ Ct
value of each gene of interest, the ∆ Ct value of the gene of interest in the treatment
group was subtracted from the same GOI of the control group.
∆ Ct of GOI = Ct of GOI- Average Ct of housekeeping genes
∆∆ Ct = ∆ Ct of GOI (treatment group) - ∆ Ct (control group)
The fold change for each gene from treatment group to control group was calculated as
2 -∆∆ Ct
. Fold change values less than one indicate a down-regulation and values greater
than one indicate an up-regulation. The p values were calculated based on a Student’s t-
test of the replicate 2 -∆ Ct
values for each gene in the control group and treatment groups,
and statistical significance was set at p≤0.05. Genes with significant changes more than
2-fold regulation (Fold-change greater than 2 or less than 0.5) were considered to be
major contributors.

56
4 b. Changes in expression of apoptotic pathway genes in GD 9 embryos from tap
water exposure
The following groups of F2-DDI mice were tested (n=3 litters for each treatment).
• Tap water (F2-DDI mice provided tap water for 8 weeks prior to breeding).
(GD 9 only)
• DDI water (GD 9 only)
Mice were euthanized by carbon dioxide (CO2) and embryonic heads were collected on 9
of gestation from above groups. Embryos from each litter were divided into open or
closed neural tube group and stored in RNAlater (AM 7021, Ambion, Naugatuck, CT) as
described for the VA study until RNA extraction. RNA was isolated using RNeasy Mini,
RNA isolation kit (Qiagen) as described in study 4a.

57
Study 5. Molecular regulation of signal transduction pathways by VA
with and without maternal immune stimulation and by tap water
The expression pattern of 84 key genes representative of 18 different signal transduction
pathways that are important in development and apoptosis was analyzed. The pathways
that were analyzed included Wnt pathway, TGF- β pathway, hedgehog pathway, PI3
Kinase / AKT Pathway, Jak/Src pathway, NFκB pathway and retinoic acid pathway (see
the Appendix 2 for full list of genes). If any pathways were shown to be involved in VA
induced teratogenicity or maternal immune stimulation protective effect, the specific
pathway can be analyzed more comprehensively.
5 a. Changes in expression of signal transduction pathway genes in GD 8.5 and 9
mouse embryos from VA with and without maternal immune stimulation exposure
The following 4 groups of CD-1 mice were tested (n=3 litters per group):
• Control (0.1 ml saline by IP injection pre-breeding day -10 & day -5 and on
GD 8)
• Valproic acid (0.1 ml saline by IP injection pre-breeding day -10 & day -5 and
500 mg/ kg body wt. of VA by IP injection on gestation day (GD 8)
• Immune stimulation with IFNγ (1000 IU of IFNγ by IP injection on pre-
breeding day -10 & day -5 and 0.1 ml saline by IP injection on GD 8)
• Valproic acid + IFNγ ( 1000 IU of IFNγ by IP injection on pre-breeding day
-10 & day -5 and 500 mg/kg body wt. of VA by IP injection on GD 8)
Mice were euthanized by CO2 and embryonic heads were collected on 8.5 and 9:0 of
gestation (spanning the time of neural tube closure) from the above 4 groups of mice.

58
Embryos from each litter were divided into open or closed neural tube group and were
stored in RNAlater (AM 7021, Ambion, Naugatuck, CT) until RNA extraction. RNA was
isolated using RNeasy Mini, RNA isolation kit (Qiagen) as described in study 4a. cDNA
was prepared from 1 µg total RNA of each pooled sample by using a RT
2 PCR array first
strand kit (C-03; SuperArray Bioscience, Frederick, MD) according to the manufacturer’s
instructions as described in study 4a. The real time PCR was performed using mouse
apoptosis RT2 Profiler PCR array (PAMM- 014, Super Array Biosciences Corporation,
Frederick, MD). Real time PCR was performed using Signal Transduction Pathway
Finder RT2 Profiler PCR array (PAMM- 014; Super Array Biosciences Corporation,
Frederick, MD) as described in study 4a.
5 b. Changes in expression of signal transduction pathway genes in GD 9 mouse
embryos from tap water exposure
The following groups of F2-DDI mice were tested (n=3 litters per group):
• Tap water (F2-DDI mice provided tap water for 8 weeks prior to breeding,
GD 9 only.
• DDI water, GD 9 only.
Mice were euthanized by carbon dioxide (CO2) and embryonic heads were collected on
day 9 of gestation from above groups. Embryos from each litter were divided into open or
closed neural tube group and stored in RNAlater (AM 7021, Ambion, Naugatuck, CT) as
described for the VA study until RNA extraction. RNA isolation, cDNA synthesis and
Real Time PCR were performed as described in study 5a.

59
IV. RESULTS
Study 1. Neural tube defects in mice exposed to tap water
NTDs were observed in control CD-1 mice not exposed to an experimental teratogen.
Embryos showed failure of neural fold closure at 3 distinct locations thus resulting in
spina bifida, exencephaly, and a split face defect (Figure 7). Split face defects were
observed in embryos with unfused neural folds at initiation site 3 (Figure 7D). Unfused
neural folds in the midbrain region (initiation site 2) were observed in day 9 embryos
(Figure 7 E&F). Some embryos exhibited both split face and unfused neural folds in the
mid brain region (Figure 7G). Spina bifidia was also observed in some embryos with
unfused neural folds rostral to initiation site 1 (Figure 7 H).
Figure 7. NTDs in late day 9 to day 13
mouse embryos caused by tap water. A-
C. Normal day 9 embryos, 3 different
views; D. Day 9 embryo with unfused
neural folds at initiation site 3 resulting
in a split face defect; E-F. Day 9 embryo
with unfused neural folds in the midbrain
region resulting in classic exencephaly;
G. Day 9 embryo with unfused neural
folds at both initiation sites 2 and 3
resulting in exencephaly and a split face;
H. Day 10 embryo with unfused neural
folds rostral to initiation site 1, resulting
in spina bifida; and I. Day 13 embryo
with classic exencephaly caused by
failure of the neural folds to fuse in the
midbrain region.

60
The source of the unknown teratogen that caused NTDs in control mice was identified by
testing multiple combinations of housing, mouse strain, diet and water.
1 a. Screening for infectious and toxic exposure
Tests to determine the source of teratogen were conducted including analysis of the
bedding and feed. The feed analysis demonstrated the feed to be free of heavy metals,
organophosphates, and chlorinated hydrocarbons. The feed also tested negative for
aflatoxin and fumonisin, two common mycotoxins in corn-based feeds. Bedding material
was free of arsenic, bismuth, cadmium, lead, organophosphate pesticides, organochlorine
pesticides, PCBs and other possible contaminants (see Materials and Methods section for
detailed list of contaminants). Serological tests to identify possible infectious causes of
NTDs in the mice were consistently negative (see Materials and Methods section for
detailed list of serological tests). These analyses indicated that a source of NTDs from
infectious agent or common toxicants was unlikely.
1 b. Association of housing and NTDs
Purchased mice held under all three housing conditions continued to produce embryos
with NTDs (Figure 8). There was no significant difference in NTD rates observed among
mice that were raised in conventional open mouse boxes, under sterile conditions in a
HEPA filtered laminar flow hood, and in a separate facility under BSL2 containment
conditions (p≤0.05). This indicates that NTDs were not resulting from housing
conditions.
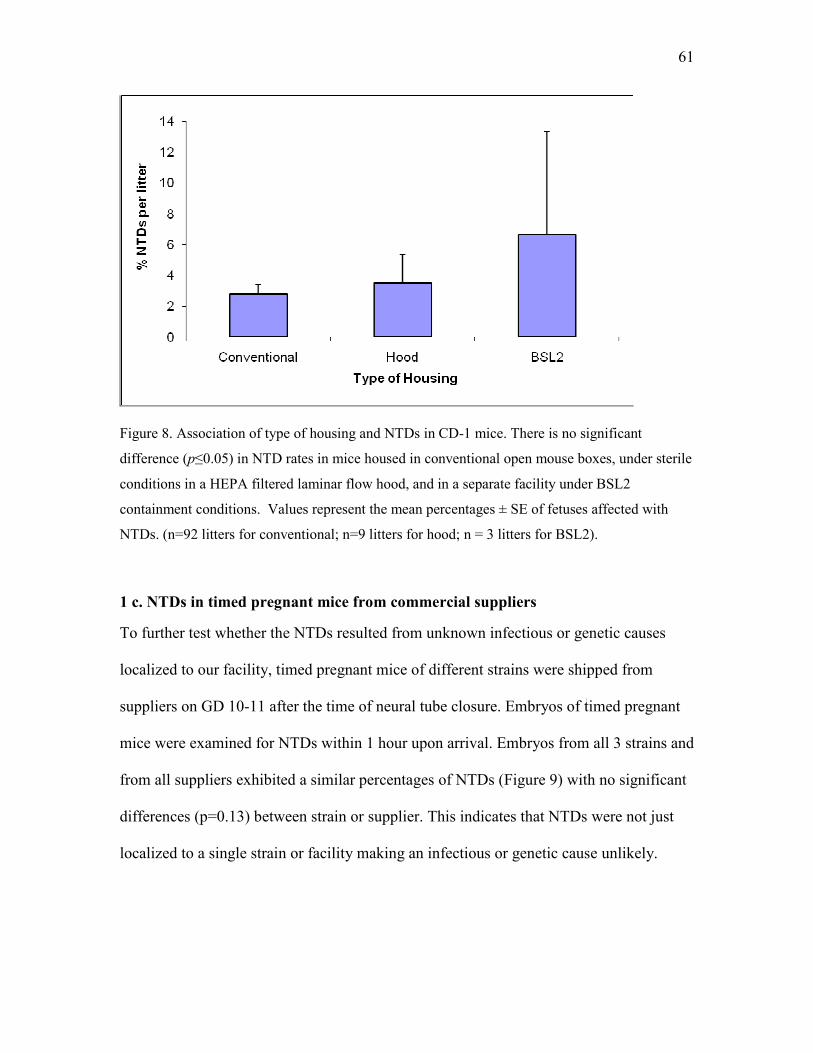
61
Figure 8. Association of type of housing and NTDs in CD-1 mice. There is no significant
difference (p≤0.05) in NTD rates in mice housed in conventional open mouse boxes, under sterile
conditions in a HEPA filtered laminar flow hood, and in a separate facility under BSL2
containment conditions. Values represent the mean percentages ± SE of fetuses affected with
NTDs. (n=92 litters for conventional; n=9 litters for hood; n = 3 litters for BSL2).
1 c. NTDs in timed pregnant mice from commercial suppliers
To further test whether the NTDs resulted from unknown infectious or genetic causes
localized to our facility, timed pregnant mice of different strains were shipped from
suppliers on GD 10-11 after the time of neural tube closure. Embryos of timed pregnant
mice were examined for NTDs within 1 hour upon arrival. Embryos from all 3 strains and
from all suppliers exhibited a similar percentages of NTDs (Figure 9) with no significant
differences (p=0.13) between strain or supplier. This indicates that NTDs were not just
localized to a single strain or facility making an infectious or genetic cause unlikely.

62
Figure 9. NTDs in timed pregnant mice from 3 different commercial suppliers in 4 different
geographical locations. Values represent the mean percentages ± SE of fetuses affected with
NTDs from 8-9 litters per group. No statistical significance difference is noted between the
groups (p≤0.05).
1 d. Association of diet and NTDs
The percentage of NTD formation was compared in fetuses of newly purchased dams
provided 4 different commercial rodent diets for 2 weeks prior to breeding. There was no
significant effect of diet on the percentage of NTDs (p=0.7) (Figure 10).

63
Figure 10. Association of diet and NTDs in CD-1 mice. There is no significant difference
(p≤0.05) in NTD rates in mice fed Teklad 7013 diet, Ziegler diet NTP-2000, Zeigler 18-6 diet or
Purina 5001. Values represent the mean percentages ± SE of fetuses affected with NTDs. (n=3
litters for Teklad 7013; n = 9 litters for Zeigler NTP-2000; n=61 litters for Zeigler 18:6; n=31
litters for Purina 5001).
1 e. Association of source of water and NTDs
NTD rates were compared in embryos from newly purchased mice provided 3 different
sources of water for 2 weeks prior to breeding: tap water (location 1), DDI and HPLC
water. Embryos from mice provided DDI (p=0.005) or HPLC water (p=0.001) had
significantly lower percentage of NTDs compared to tap water (Figure 11) that indicated
water as the source of the teratogen.

64
Figure 11. Association of type of water and neural tube defects in purchased CD-1 mice. NTD
rates are significantly decreased in mice provided DDI or HPLC water for 2 weeks prior to
breeding compared to tap water. Values represent the mean percentages ± SE of fetuses affected
with NTDs. (n = 25 litters for Tap; n=30 litters for DDI; n=26 litters for HPLC water). Statistical
significance is set at p≤0.05. Different litters indicate treatments are significantly different.
1 f. F2 Generation: Association of water and NTDs
Initial results indicated that tap water may be responsible for the NTDs in control mice.
The NTDs were only reduced, not eliminated, with DDI or HPLC water, however. We
hypothesized that a residual effect of teratogen, possibly due to a long half-life, may be
responsible for the low levels of NTDs in purchased mice when provided DDI or HPLC
water in our facility. To eliminate the possibility that purchased mice may have received
prior teratogen exposure, mice were provided DDI for two generations. When F2-DDI
mice (provided only DDI water) were bred, NTDs were completely eliminated in the
offspring (Figure 12).
65
NTDs were not observed when F2-DDI mice were transferred to HPLC water for 2
weeks prior to breeding. When F2-DDI mice were provided tap water from Location 1,
Location 2, or Location 3 for 2 weeks prior to breeding, NTDs were observed in all
groups of tap water exposed mice (Figure 12). The comparisons, however, did not reach
statistical significance compared to DDI water (p-values: 0.18, 0.13, 0.06 for Locations 1,
2, 3 respectively). When the tap water exposure length was increased to 8 weeks prior to
breeding, all three groups of mice had significantly higher rates of NTDs than age
matched F2-DDI controls (p-values: 0.003, 0.005, 0.007 for Locations 1, 2, 3
respectively). NTDs were completely eliminated in F2-DDI mice and reappeared when
F2-DDI mice transferred to tap water confirming that the unknown teratogen was present
tap water. Longer periods of exposure to tap water from all municipalities revealed a dose
response effect. The same relative percentage of NTDs between the three locations was
maintained at both exposure times.

66
a a
a
aa
a
b
bb
0
2
4
6
8
10
12
14
% NTDs per litter
Water Source and Exposure Time
8 week exposure2 week exposure
Figure 12. NTDs in offspring of dams maintained exclusively on DDI for 2 generations (F2-
DDI) and switched to municipal tap water 2 or 8 weeks prior to breeding. Mice exposed to tap
water for 8 weeks had higher percentages of NTDs in their embryos than mice exposed to DDI
and tap water for 2 weeks. Values represent the mean percentages ± SE of fetuses affected with
neural tube defects. n= 7-9 litters per group in the 2 week exposure, and 14-15 litters per group in
the 8 week exposure. Statistical significance is set at p≤0.05. Different letters indicate statistically
different groups.

67
Study 2. Characterization of teratogen present in tap water
The teratogen in the tap water was characterized in order to narrow down possible
contaminants and help identify the teratogen by analytical methods. The study had three
components. The first was to determine whether the teratogen was volatile or non-
volatile. The second was to determine if the teratogen acted directly or was metabolized.
The third was to determine whether the teratogen was introduced into tap water during
the water treatment process.
2 a. Chemical characterization of teratogen present in tap water
Water was prepared to separate volatile and non-volatile compounds. Embryos from mice
provided the volatile fraction of tap water had higher levels of NTDs (2.87±1.2 %) than
the non-volatile fraction of tap water (0.67±0.6 %). Embryos from mice provided with
either volatile or non-volatile fractions of DDI did not develop NTDs (Figure 13). These
results indicated that the teratogen mainly partitioned into the volatile fraction.
Figure 13. NTDs in embryos from mice provided volatile or non-volatile fractions of tap and DDI
water. Values represent the mean percentages ± SE of fetuses affected with NTDs (n=11 litters
for volatile fraction of tap water; n= 9 litters for volatile fraction of DDI water; n=10 litters for
non-volatile fraction of tap water; n= 10 litters for non-volatile fraction of DDI water). No
statistical significance difference is noted between the groups (p≤0.05).

68
2 b. Metabolism study to determine whether the teratogenicity is caused by a parent
compound or its metabolite
Tap water exposed embryos treated with SKF-525A (cytochrome p450 inhibitor)
exhibited NTDs at levels similar to tap water exposed embryos from saline injected mice
(Figure 14). NTDs were also exhibited in embryos from both tap water and DDI exposed
mice treated with phenobarbital (cytochrome p450 inducer) (Figure 14).
Figure 14. NTDs in embryos from mice injected with SKF-525A, phenobarbital or saline. Mice
were provided either with tap water or DDI for 1 month prior to breeding. (n=15 litters for mice
provided with tap water and injected with SKF-525A; n=11 litters for mice provided with DDI
and injected with SKF 525-A; n=12 litters for mice provided with tap water and injected with
phenobarbital; n=12 litters for mice provided with DDI and injected with phenobarbital; n=11
litters for mice provided with tap water and injected with saline). No statistical significance
difference is noted between the groups (p≤0.05).

69
2 c. Determining if the teratogen is a disinfection byproduct
NTDs were not observed in embryos from mice provided DDI or well water treated with
chlorine (Figure 15). NTDs were observed, and were significantly increased in mice
provided any of the surface water types (autoclaved river water, autoclaved chlorinated
water, chloraminated tap water, autoclaved chloraminated tap water) (Figure 15). The
results indicated that was teratogen causing NTDs was not introduced into the water
during the treatment process.
Figure 15. NTDs in embryos from F2-DDI mice provided with DDI water, autoclaved river
water, autoclaved chlorinated water, chloraminated tap water, or chlorinated well water for 8
weeks prior to breeding. Statistical significance is set at p≤0.05. Different letters indicate groups
are significantly different.

70
Study 3. Apoptotic changes in embryos from teratogens and maternal
immune stimulation
3 a. Quantitative estimation of apoptotic changes by flow cytometry in the heads of
mouse embryos exposed to VA with and without maternal immune stimulation and
in embryos exposed to tap water
To determine if apoptosis played a significant role in formation of NTDs by VA or tap
water, and also to determine whether maternal immune stimulation could prevent VA
induced changes in apoptotic levels, flow cytometry and TUNEL assay were used to
assess apoptotic changes in GD9 embryos.
Valproic acid and maternal immune stimulation
The percentage of apoptotic cells was higher in embryos with open neural tubes from
VA-exposed mice compared to controls (saline injected). A significant increase in
apoptosis was also observed in embryos with closed neural tubes from VA-exposed dams
compared to controls (Figures 16 & 17). Therefore, VA caused apoptosis in heads of
embryos with both open and closed neural tubes.
Embryos from mice treated with IFNγ+VA had lower levels of NTDs (21.2±4 %) than
the embryos from the mice treated with VA (45.3±10.4 %). There was no significant
difference in percentage of apoptotic cells between embryos from IFNγ and saline control
groups, which indicated IFNγ did not affect apoptosis. There was no significant
difference in the percentage of apoptotic cells between the IFNγ+VA-treated embryos
with closed neural tubes compared to controls. Apoptosis was significantly increased in
IFNγ+VA treated embryos with open neural tubes compared to controls (Figure 16 &

71
17). Maternal immune stimulation with IFNγ was able to prevent apoptosis in embryos
with closed neural tubes but not in embryos with open neural tubes.

72
Figure 16. Apoptotic changes in the heads of GD 9 embryos exposed to VA with and without
maternal immune stimulation. Histograms are from representatives of A: Embryos from
control dams; B: Embryos with closed neural tubes from VA-exposed dams; C: Embryos with
open neural tubes from VA-exposed dams; D: Embryos from IFNγ dams; E: Embryos with
closed neural tubes from IFNγ +VA-exposed dams; F: Embryos with open neural tubes from
IFNγ +VA-exposed dams. The X-axis represents Annexin-V FITC staining intensity and Y-
axis represents Propidium Iodide (PI) staining intensity. In each histogram, lower left quadrant
shows viable cells (stained negative for Annexin-V or PI), lower right quadrant shows apoptotic
cells (stained positive for Annexin-V only) and upper right quadrant shows dead cells (stained
positive for both Annexin-V & PI). Increased apoptotic cells can be observed in (lower right
quadrant) embryos from VA-exposed dams (open and closed neural tubes) and embryos with
open neural tubes from IFNγ +VA-exposed dams compared to embryos from control, IFNγ -
exposed dams, and also embryos with closed neural tubes from IFNγ +VA-exposed dams.
A B C
D E F
Annexin V- FITC
Pro
pid
ium
Io
did
e

73
a
b b
a a
c
0
5
10
15
20
25
30
35
40
control VA
closed
VA
open
IFN IFN+VA
closed
IFN+VA
open
% A
po
pto
sis
Treatment
Figure 17. Percentage of apoptotic cells in embryo heads (GD 9) from control (n=10 litters), VA
(n=10 litters), IFNγ (n=8 litters) and VA+ IFNγ (n=8 litters) exposed dams. Embryos from VA
and VA+ IFNγ treatment groups are separated based on the open and closed neural tubes.
Statistical significance is set at p≤0.05. Different letters indicate groups are significantly different.
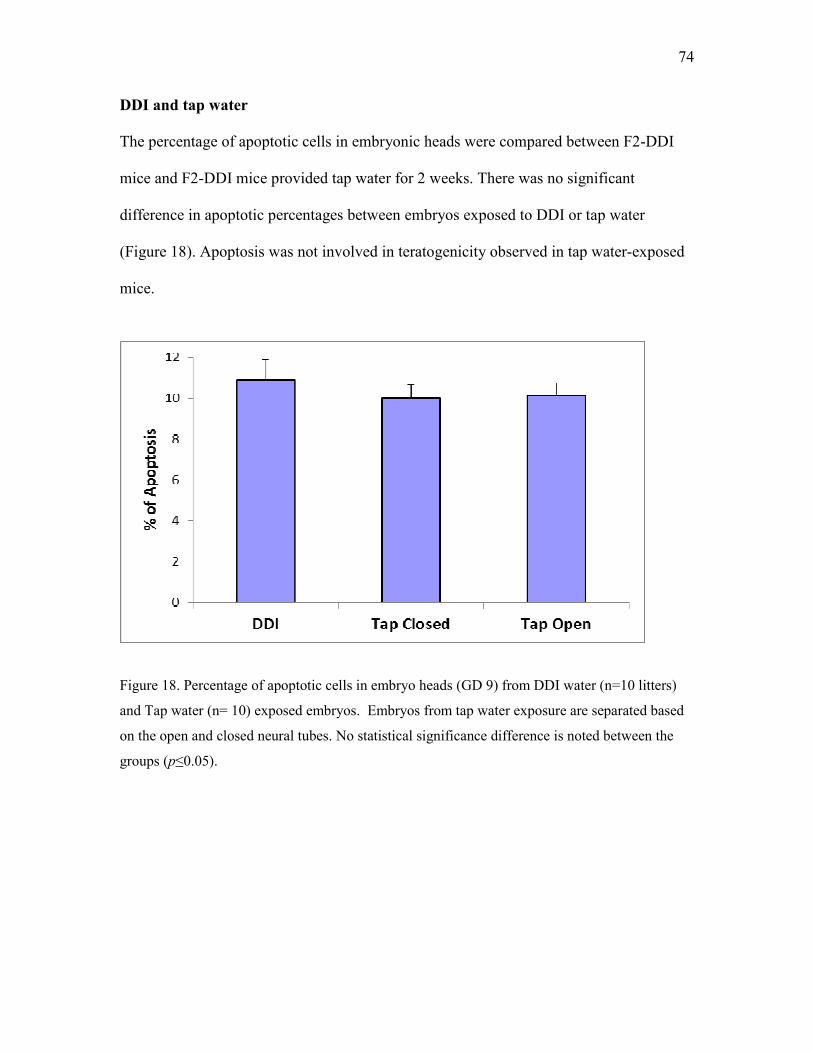
74
DDI and tap water
The percentage of apoptotic cells in embryonic heads were compared between F2-DDI
mice and F2-DDI mice provided tap water for 2 weeks. There was no significant
difference in apoptotic percentages between embryos exposed to DDI or tap water
(Figure 18). Apoptosis was not involved in teratogenicity observed in tap water-exposed
mice.
Figure 18. Percentage of apoptotic cells in embryo heads (GD 9) from DDI water (n=10 litters)
and Tap water (n= 10) exposed embryos. Embryos from tap water exposure are separated based
on the open and closed neural tubes. No statistical significance difference is noted between the
groups (p≤0.05).

75
3 b. Localization of specific apoptotic regions in the heads of mouse embryos
exposed to VA with or without maternal immune stimulation and in embryos
exposed to tap water by Terminal Transferase dUTP Nick End Labeling (TUNEL)
assay
Valproic acid and maternal immune stimulation
Embryos from saline injected control mice exhibited low amounts of apoptotic staining
along the midline of the developing neural tube. Apoptotic staining was observed along
the open neural folds of the embryos from VA-treated dams. The increased apoptosis
observed in these embryos by flow cytometry was likely localized to the midline of the
neural folds. Even though increased apoptosis was observed along the neural folds in
VA-exposed embryos, it was more pronounced in midbrain/hind brain region (indicated
by arrows in Figure 19). Embryos with closed neural tubes from the VA-treated dams
also exhibited apoptosis along the neural folds, but to a lesser degree than in embryos
with open neural tubes.
Embryos from dams treated with IFNγ only exhibited a low amount of apoptosis along
the neural folds. Similar to embryos with open neural tubes from VA-exposed dams,
embryos with open neural tubes from IFNγ +VA-treated dams exhibited increased
apoptosis particularly in hind and mid brain regions along the neural folds (indicated by
arrows in Figure 20). Embryos with closed neural tubes from IFNγ +VA dams showed
low to moderate apoptosis (Figure 20).

76
Figure 19. Identification of apoptotic regions in the heads of GD9 mouse embryos from VA-
exposed dams by Terminal Transferase dUTP Nick End Labeling (TUNEL) assay in different
views. A-C: Embryos from control group; D-F: Embryos with closed neural tubes from VA
group; G-I: Embryos with open neural tubes from VA group. Purple stained apoptotic regions are
identified by yellow arrows.
I

77
Figure 20. Identification of apoptotic regions in the heads of GD9 mouse embryos from IFNγ
+VA group by Terminal Transferase dUTP Nick End Labeling (TUNEL) assay in different
views. J-L: Embryos from IFNγ group; M-O: Embryos with closed neural tubes from IFNγ
+VA dams; P-R: Embryos with open neural tubes from IFNγ +VA dams. Purple stained
apoptotic regions are identified by white arrows.

78
DDI and tap water
Embryos from F2-DDI mice provided DDI showed low amounts of apoptotic staining
along the midline of the neural tube. Similar to embryos from F2-DDI mice, only light
apoptotic staining was observed in tap water-exposed embryos with NTDs (Figure 21).
These results supported the flow cytometry results, which indicated tap water exposure
did not increase apoptosis in GD 9 embryonic heads.
Figure 21. Identification of apoptotic regions in the heads of GD9 mouse embryos from tap
water-exposed dams by Terminal Transferase dUTP Nick End Labeling (TUNEL) assay in
different views. A-C: Embryos from F2-DDI mice provided with DDI; D-F: Embryos with
open neural tubes from F2-DDI dams provided with tap water for 4 weeks prior breeding.
Apoptotic regions (purple staining) are not observed in embryos from either group.
79
Study 4. Molecular regulation of apoptosis by VA with and without
maternal immune stimulation and tap water
Changes in the relative expression of apoptotic pathway genes were determined in
embryonic heads from dams treated by VA with and without immune stimulation and by
tap water. This study was conducted to evaluate the molecular mechanisms responsible
for alteration of apoptosis.
4 a. Changes in expression of apoptotic pathway genes in GD 8.5 and 9 embryos
from VA with and without maternal immune stimulation exposure
Changes in gene expression of GD 8.5 and GD 9 embryos from VA-treated mice were
compared to embryos from mice injected with saline. Changes in gene expression of GD
8.5 and GD 9 embryos from VA+ IFNγ-treated mice were compared to embryos from
mice injected with IFNγ only. In our study, genes with significant changes more than 2-
fold regulation (fold-change greater than 2 or less than 0.5) were considered as major
contributors. Complete lists of results are presented in Appendices 3-9.
Gestation Day 8.5
Apoptosis inducing gene, Cideb, was the only gene significantly down regulated in
embryos exposed to VA compared to saline injected controls. In VA+IFNγ- treated
embryos, pro-apoptotic genes, Nod1 and Trp73 were significantly down regulated
compared to embryos treated with IFNγ only (Table 1).

80
Table 1. Fold change and p-values of genes significantly altered in GD8.5 embryos from
IFNγ +VA group compared to IFNγ only
Gene Family Function Fold change p-value
Nod1 CARD Pro-apoptotic 0.25 0.002
Trp73 p53 Pro-apoptotic 0.16 0.005
Gestation day 9
Changes in gene expression of GD 9 embryos with open and closed neural tubes from
VA-treated mice were compared to embryos from mice injected with saline. In GD9
embryos with open neural tube from VA-treated dams, apoptotic genes Bad, Bak1, Bok,
Casp9 and Cideb, and anti-apoptotic genes Mcl1 and Prdx2 were significantly up
regulated (Table 2) compared to embryos from control mice (saline injected). Apoptotic
genes Apaf1, Casp8, Cradd, Dffa, Fadd, Ripk1 and Traf2, and anti-apoptotic genes Akt1,
Bcl2l1, Cflar, Dad1, Cd40, were significantly down regulated (Table 2). These results
indicate overall gene expression favored pro-apoptotic processes in GD 9 embryos with
open neural tubes from VA-treated mice (Figure 22).

81
Table 2. Fold change and p-values of genes significantly altered (p≤0.05) in GD9
embryos with open neural tubes from VA-treated dams compared to control group.
Gene Family Function Fold Regulation p-value
Bak1 Bcl-2 Pro-apoptotic 213.7 0.008
Cideb CIDE domain Pro-apoptotic 14.32 0.000
Bad Bcl-2 Pro-apoptotic 3.92 0.028
Casp9 p53 Pro-apoptotic 3.84 0.020
Bok Bcl-2 Pro-apoptotic 2.36 0.000
Fadd Death Effector Domain Pro-apoptotic 0.46 0.000
Dffa CIDE domain Pro-apoptotic 0.39 0.006
Ripk1 CARD/Death domain Pro-apoptotic 0.37 0.000
Cradd CARD Pro-apoptotic 0.34 0.019
Apaf1 p53 Pro-apoptotic 0.29 0.042
Traf2 TRAF Pro-apoptotic 0.05 0.001
Casp8 Death Effector Domain Pro-apoptotic 0.03 0.01
Prdx2 Anti-oxidant Anti-apoptotic 77.35 0.000
Mcl1 Bcl-2 Anti-apoptotic 64.29 0.005
Akt1 p53 Anti-apoptotic 0.46 0.003
Cd40 TNF Anti-apoptotic 0.29 0. 032
Cflar Death Effector Domain Anti-apoptotic 0.23 0.005
Bcl2l1 Bcl-2 Anti-apoptotic 0.15 0.000
Dad1 Anti-apoptotic 0.002 0.000
In GD9 embryos with closed neural tube from VA- treated dams, apoptotic genes Bad,
Bak1, Bok, Casp9 and Cideb, and anti-apoptotic genes Mcl1 and Prdx2, were
significantly up regulated compared to embryos from control (saline injected) mice.
Apoptotic genes Apaf1, Casp8, Cradd, Dffa, Fadd, Ripk1 and Traf2, and anti-apoptotic

82
genes Akt1, Bcl2l1, Cflar, Dad1, Cd40, were significantly down regulated (Table 3). The
results revealed that both pro and anti-apoptotic gene expression levels in GD 9 embryos
with closed neural tubes changed, but overall expression tended towards a pro-apoptotic
pattern (Figure 23).
Table 3. Fold change and p-values of genes significantly altered (p≤0.05) in GD9
embryos with closed neural tube from VA-treated dams compared to control (saline
injected) group.
Gene Family Function Fold Change p-value
Bak1 Bcl-2 Pro-apoptotic 206.98 0.004
Cideb CIDE domain Pro-apoptotic 15.56 0.000
Bad Bcl-2 Pro-apoptotic 4.17 0.005
Casp9 p53 Pro-apoptotic 3.55 0.022
Bok Bcl-2 Pro-apoptotic 2.13 0.017
Fadd Death Effector Domain Pro-apoptotic 0.46 0.000
Ripk1 CARD/Death domain Pro-apoptotic 0.42 0.000
Dffa CIDE domain Pro-apoptotic 0.41 0.007
Apaf1 p53 Pro-apoptotic 0.29 0.042
Cradd CARD Pro-apoptotic 0.29 0.016
Traf2 TRAF Pro-apoptotic 0.05 0.001
Casp8 Death Effector Domain Pro-apoptotic 0.03 0.01
Prdx2 Anti-oxidant Anti-apoptotic 78.43 0.000
Mcl1 Bcl-2 Anti-apoptotic 63.7 0.003
Akt1 p53 Anti-apoptotic 0.42 0.004
Cd40 TNF Anti-apoptotic 0.35 0.039
Cflar Death Effector Domain Anti-apoptotic 0.22 0.005
Bcl2l1 Bcl-2 Anti-apoptotic 0.14 0.000
Dad1 Anti-apoptotic 0.002 0.000

83
Gene expression levels of embryos from VA+IFNγ embryos were compared to IFNγ only
embryos. In embryos with open neural tubes from VA+IFNγ dams compared to IFNγ
only embryos, apoptotic genes Bad, Bak1, Casp9, and Cideb were significantly over
expressed, whereas Casp8, Dffa, Fadd, Fas, Ripk1, Tnfrsf1a, and Traf2 were significantly
under expressed. Among anti-apoptotic genes, Prdx2 was significantly over expressed
whereas Akt1, Bcl2l1, Cflar, Cd40, and Dad were significantly down regulated (Table 4).
Among the pro-apoptotic genes, some of the genes were up-regulated and some genes
were down regulated, whereas most anti-apoptotic genes were down regulated (Figure
24). This indicates an overall trend towards an increased apoptotic pattern.

84
Table 4. Fold change and p-values of genes significantly altered (p≤0.05) in GD9
embryos with open neural tubes from IFNγ +VA-treated dams compared to control
group.
Gene Symbol Family Function Fold Regulation p-value
Bak1 Bcl-2 Pro-apoptotic 249 0.003
Cideb CIDE domain Pro-apoptotic 19.6 0.000
Bad Bcl-2 Pro-apoptotic 3.89 0.024
Casp9 p53 Pro-apoptotic 3.63 0.012
Tnfrsf1a TNF Pro-apoptotic 0.44 0.02
Ripk1 CARD/Death domain Pro-apoptotic 0.37 0.015
Dffa CIDE domain Pro-apoptotic 0.36 0.009
Cd40 TNF Pro-apoptotic 0.26 0.04
Fas Death Effector Domain Pro-apoptotic 0.21 0.021
Fadd Death Effector Domain Pro-apoptotic 0.18 0.047
Traf2 TRAF Pro-apoptotic 0.05 0.006
Casp8 Death Effector Domain Pro-apoptotic 0.03 0.004
Prdx2 Anti-oxidant Anti-apoptotic 62.25 0.000
Cflar Death Effector Domain Anti-apoptotic 0.26 0.045
Akt1 p53 Anti-apoptotic 0.21 0.022
Bcl2l1 Bcl-2 Anti-apoptotic 0.04 0.001
Dad1 Anti-apoptotic 0.002 0.002
In embryos with closed neural tubes from VA+IFNγ dams compared to IFNγ only
embryos, only caspase 9 (pro-apoptotic gene) was over expressed significantly. Pro-
apoptotic gene Traf2 was significantly down regulated (Figure 25). Therefore, IFNγ
prevented major alterations in genes related to apoptotic process.

85
0.001
0.01
0.1
1
10
100
1000Fold Chagne
Figure 22. Fold change of genes related to apoptotic pathways significantly altered in GD9
embryos with open neural tube from VA-treated dams compared to control (saline injected)
group. Statistical significance is set at p≤0.05.
Pro-apoptotic & significant
Pro-apoptotic & non-significant
Anti-apoptotic & significant
Anti-apoptotic & non-significant

86
0.001
0.01
0.1
1
10
100
1000Fold Change
Figure 23. Fold change of genes related to apoptotic pathways significantly altered in GD9
embryos with closed neural tube from VA-treated dams compared to control (saline injected)
group. Statistical significance is set at p≤0.05.
Pro-apoptotic & significant
Pro-apoptotic & non-significant
Anti-apoptotic & significant
Anti-apoptotic & non-significant

87
Figure 24. Fold change of genes related to apoptotic pathways significantly altered in GD9
embryos with open neural tube from IFNγ +VA-treated dams compared to control (IFNγ only)
group. Statistical significance is set at p≤0.05.
Pro-apoptotic & significant
Pro-apoptotic & non-significant
Anti-apoptotic & significant
Anti-apoptotic & non-significant
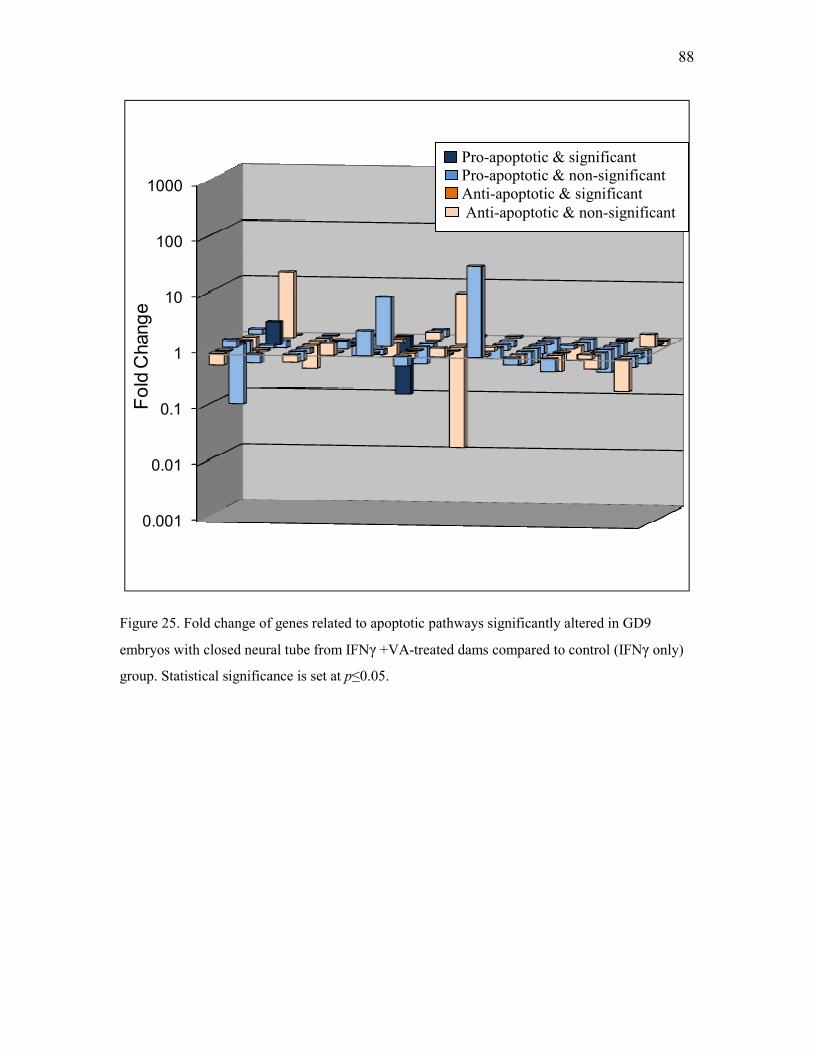
88
0.001
0.01
0.1
1
10
100
1000
Fold Change
Figure 25. Fold change of genes related to apoptotic pathways significantly altered in GD9
embryos with closed neural tube from IFNγ +VA-treated dams compared to control (IFNγ only)
group. Statistical significance is set at p≤0.05.
Pro-apoptotic & significant
Pro-apoptotic & non-significant
Anti-apoptotic & significant
Anti-apoptotic & non-significant

89
4 b. Changes in expression of apoptotic pathway genes in GD 9 embryos from tap
water exposure
In embryos with open neural tubes from mice provided with tap water compared to DDI
group, none of the genes were significantly altered. Pro-apoptotic genes, Trp53inp1,
card6, and anti-apoptotic genes, Atf5, Rnf7 were up regulated more than two-fold. Also
pro-apoptotic gene, Ltbr and anti-apoptotic gene, Bcl10 were down regulated more than
two-fold. These results indicated that apoptotic pathways were not altered in tap water-
exposed embryos.

90
Study 5. Molecular regulation of signal transduction pathways by VA
with and without maternal immune stimulation and by tap water
Changes in the relative expression of signal transduction pathway genes were determined
in embryonic heads from dams treated by VA with and without immune stimulation and
by tap water. This study was conducted to evaluate the molecular mechanisms
responsible for NTD formation in mice.
5 a. Changes in expression of signal transduction pathway genes in GD 8.5 and 9
embryos from VA with and without maternal immune stimulation exposure
Changes in gene expression of signal transduction pathways in GD 8.5 and GD 9
embryos from VA-treated mice were compared with embryos from mice injected with
saline. Changes in gene expression of GD 8.5 and GD 9 embryos from VA+ IFNγ-
treated mice were compared with embryos from mice injected with IFNγ. Genes with
significant 2-fold change in their expression from treatment are discussed here. All other
results are in Appendices 10-16.
Gestation day 8.5
In GD 8.5 embryos from mice exposed to VA compared to saline injected controls, Tank
and Vegfa were significantly up regulated more than two-fold. In embryos from
VA+IFNγ dams compared to IFNγ only embryos, none of the signal transduction genes
were significantly changed.

91
Gestation day 9
Embryos from VA-treated mice were compared to embryos from saline injected dams. In
GD9 embryos with closed neural tube from VA-treated dams, Fgf4 (Wnt family), was
significantly down regulated compared to embryos from control mice.
In GD9 embryos with open neural tubes from VA-treated dams, Bmp2 (Hedgehog),
Wnt2, Fgf4 (Wnt family), Hoxa1 (Retinoic acid) and Hspb1 (Stress pathway) were
significantly down regulated compared to controls (Table 5). None of the signal
transduction genes were significantly up regulated compared to saline injected controls.
Table 5. Genes significantly (p≤0.05) altered in GD9 embryos with open neural tubes
from VA-treated dams compared to control (saline injected) group.
Gene Family Fold change p-value
Bmp2 Hedgehog 0.36 0.011
Wnt2 Wnt/hedgehog 0.02 0.000
Fgf4 Wnt 0.14 0.003
Hoxa1 Retinoic acid 0.05 0.005
Hspb1 Stress 0.17 0.028
Fn1 PI3/AKT 0.48 0.008
In GD 9 embryos with open neural tube from VA+IFNγ dams compared to IFNγ only
embryos, Il4ra (NFκB Pathway) was significantly up regulated and mdm2 (p53 pathway),
Cdh1, Wnt2 (Wnt pathway), and Hoxa1 (Retinoic acid) were significantly down
regulated (Table 6).

92
Table 6. Genes significantly altered (p≤0.05) in GD 9 embryos with open neural tube
from IFNγ +VA-treated dams compared to IFNγ only group.
Gene Family Fold Change p-value
Il4ra NFκB Pathway 2.28 0.022
Birc3 NFκB Pathway 0.08 0.029
Cdh1 Wnt 0.5 0.009
Hoxa1 Retinoic acid 0.21 0.031
Mdm2 p53 0.01 0.019
Wnt2 Hedgehog/Wnt 0.045 0.034
In embryos with closed neural tubes from VA+IFNγ dams compared to IFNγ only
embryos, none of the gene expression levels were significantly up regulated. Hoxa1
(retinoic acid pathway), Wnt2 (Wnt pathway), and Bmp2 (Hedgehog pathway) were
significantly down regulated (Table 7).
Table 7. Genes significantly altered (p≤0.05) in GD 9 embryos with closed neural tubes
from IFNγ +VA-treated dams compared to IFNγ only group.
Gene Family Fold Change p-value
Bmp2 Hedgehog 0.46 0.000
Hoxa1 Retinoic acid 0.08 0.017
Wnt2 Hedgehog/Wnt 0.021 0.031

93
5 b. Changes in expression of signal transduction pathway genes in GD 9 embryos
from tap water exposure
In embryos with open neural tubes from mice provided with tap water compared to DDI,
none of the genes were significantly changed. Some of the genes were up or down
regulated more than two-fold, but failed to reach significance. Cdkn2a (TGF- ß pathway),
and Tank (NFkB pathway) were up regulated, whereas Nab2 (mitogenic pathway), Rbp1
(retinoic acid pathway) Wnt1 (hedgehog pathway) were down regulated (>2-fold), but
expression levels did not reach significance (Table 8).
Table 8. Genes over-expressed or under-expressed in GD 9 embryos with open neural
tube from dams provided with tap water for 2 months compared to embryos form F2-DDI
mice.
Gene Family Fold Change p-value
Cdkn2a TGF-β 2.08 0.29
Tank NFkB 5.13 0.52
Nab2 Mitogenic 0.27 0.17
Rbp1 Retinoic Acid 0.08 0.59
Tert NFkB 0.47 0.29
Wnt1 Hedgehog 0.29 0.11

94
IV. DISCUSSION
Study 1. Neural tube defects in mice exposed to tap water
NTDs have multifactorial etiologies. To investigate the possible cause of NTDs in the
CD-1 mouse colony maintained in our laboratory, we examined feed, water, housing
location, bedding material, mouse strain and exposure to infectious agents. Each
condition was evaluated for NTD production in the embryos of exposed mice to
determine whether NTDs were increased or decreased.
Exposure to heavy metals such as arsenic and cadmium can induce neural tube defects in
mice (Chaineau et al., 1990; Padmanabhan, 1987). Additionally, several epidemiological
and animal studies have shown that fungal toxins such as fumonisin can induce neural
tube defects (reviewed by Cabrera et al., 2004; Marasas et al., 2004). Most rodent diets
contain corn that can become contaminated with mycotoxins such as aflotoxin and
fumonisin. Fumonisin, produced by Fusarium verticilloides, reduces receptor mediated
folate uptake (Stevens and Tang, 1997), thereby inducing NTDs (Cabrera et al., 2004;
Marasas et al., 2004; Sadler et al., 2002). Heavy metals and fungal toxins were ruled out
as likely causes of the NTDs by the negative feed and bedding analyses.
Maternal infectious diseases such as rubella, cytomegalovirus and Toxoplasma gondii
directly affect development of the nervous system. Infectious agents can also elevate
maternal core body temperature altering embryonic development and inducing NTDs
(Shiota et al., 1988; Seller et al., 1987). The multiple negative serologic tests for

95
infectious diseases in our mice coupled with the fact that mice raised in different housing
types and facilities all produced NTDs, make an infectious cause unlikely.
Spontaneous gene mutations may occur from inbreeding. Several single gene mutations
can cause NTDs (Harris and Juriloff, 1999 & 2007). The presence of NTDs in embryos
of timed pregnant mice obtained from commercial vendors indicated that the NTDs were
not isolated to our facility nor were they localized to a single supplier or strain of mouse.
Because of the presence of NTDs in different strains of mice from different suppliers, a
direct genetic cause for these NTDs is unlikely.
In mice, it is known that maternal diet alters the risk of NTD development (Harris and
Juriloff, 2005; Stoate et al., 2008). Lower dietary folate levels increase susceptibility to
NTDs; however, we found that diet had no significant effect on NTDs in newly
purchased mice, thus excluding diet as a possible cause of these unknown NTDs.
The percentage of NTDs was decreased but not completely eliminated when newly
purchased mice were provided DDI or HPLC water for 2 weeks. This indicated water
might be involved in the etiology of the NTDs (Figure 11). Since the timed pregnant mice
obtained from commercial vendors exhibited NTDs (Figure 9), it was possible that the
purchased mice were exposed to a teratogen prior to arrival. We hypothesized that the
residual effect of teratogen, due to a long half-life, may be responsible for the low
percentages of NTDs in purchased mice provided DDI or HPLC water after arriving in
96
our facility. This was confirmed when mice provided DDI water for 2 generations (F2-
DDI) produced offspring without NTDs.
Since NTDs were not observed in F2-DDI mice or in F2-DDI mice transferred to HPLC
water, but reappeared when the mice were exposed to a variety of tap waters from
different municipalities, it was concluded that the cause of these unknown NTDs was
exposure to tap water. The higher NTD rates in mice exposed for 8 weeks vs. 2 weeks,
indicated a dose effect of some contaminant present in tap water. This dose response may
account for the observed differences in NTD rates in the timed pregnant mice (Figure
12). The length of time of tap water exposure affected NTDs more so than strain or water
source (i. e location). Different strains, however, may show variable vulnerability to
teratogens because of their difference in genetic background (Burren et al., 2010; Ogawa
et al., 2005; Lemos et al., 2009). Our data suggest that the teratogen apparently has wide
geographic distribution as mice from different regions of the country exhibited NTDs.
In this study, we demonstrated an association between tap water and NTDs in mouse
embryos. This was the first study to show fetal malformations from ambient exposure to
tap water. Specific seasonal variation in NTD rates was not tested; however, we did not
notice any fluctuations in percentages of NTDs throughout the 2 year project. Published
literature indicates that many teratogenic compounds can be found in drinking water
(discussed in literature review), but most are found at below what are believed to be toxic
concentrations. The teratogen responsible for NTDs in our mice has not yet been
identified.

97
Study 2. Characterization of teratogen present in tap water
Many toxic compounds are routinely found at low concentrations in tap water
(Schwarzenbach et al., 2006). The US Geological Survey found in 2002 that 80% of the
nation’s rivers and streams were contaminated with wastewater contaminants. As many
potential contaminants could be present in the water, chemical analysis to identify an
unknown teratogen is a difficult task. Characterization of the teratogen in the tap water
helps to narrow down the possible suspect contaminants and aids in identifying specific
compound(s) by chemical analysis. To determine the chemical nature of the teratogen,
tap water was fractioned chemically into volatile and non-volatile fractions and provided
to F2-DDI mice. Additionally, this study also determined whether the teratogen acted
directly or was a metabolite. Lastly, to identify the possible source of the teratogen and
also to determine if the teratogen was a water disinfection byproduct, F2-DDI mice were
exposed to municipal tap water with different water treatment regimens and from
different locations within the water treatment plant.
According to U.S Environmental Protection Agency (US-EPA), one-fifth of the US water
supplies contained volatile organic compounds. The U.S Geological Survey during 1985-
2002, identified 55 volatile compounds present in domestic well waters; 1% of the
samples contained high concentrations of volatile organic compounds known to cause
adverse health effects (Rowe et al., 2007). In our study, embryos from mice provided the
volatile fraction of tap water had higher percentages of NTDs, which indicated the
predominant teratogen was a volatile compound. However, NTDs were still present in
embryos from mice provided the non-volatile fraction. This may indicate either a mixture

98
of both volatile and non-volatile teratogens present in the water acting additively or
synergistically to produce NTDs in mice, or retention of a small amount of compound in
the non-volatile fraction because of low volatility.
The hepatic cytochrome P450 enzymes commonly play a major role in metabolism of
xenobiotic compounds, converting them to metabolites that can be readily excreted from
the body. Induction of cytochrome P450s can reduce the teratogenicity of compounds by
converting the toxic parent compound to less toxic metabolites. For example, induction of
cytochrome P450 enzymes using phenobarbital reduced the teratogenicity of
cyclophosphamide (Gibson and Becker, 1968; Greenaway et al., 1982; Hales, 1981) by
metabolizing the toxic cyclophospahmide into less toxic metabolites. In some instances
however, teratogenicity increases when metabolites are more toxic than parent compound
(Wells and Winn, 1996). Phenobarbital increased carbamazepine metabolism, resulting in
greater teratogenicity from increased formation of a more toxic metabolite (Finnell et al.,
1995). Increased teratogenicity of compounds such as phenytoin and cyclophosphamide
was also observed with inhibition of cytochrome P450 enzymes by SKF525A
(Greenaway et al., 1982).
In our study, neither SKF 525A nor phenobarbital altered the NTD levels in embryos
exposed to tap water. These results indicated a number of possibilities. First, it is possible
that neither SKF-525A nor phenobarbital inhibited or induced the specific cytochrome
P450 enzymes involved in metabolism of this teratogen. Alternatively, cytochrome P450
enzymes are not big players in the metabolism of this teratogen. Lastly, it is possible that

99
both the parent compound and cytochrome P450 metabolite(s) were toxic and both
induced NTDs. It was interesting to note that embryos from the F2-DDI mice pre-treated
with phenobarbital exhibited NTDs. This might result from folate antagonistic properties
of phenobarbital similar to other classes of anti-convulsants such as VA (Halwachs et al.,
2009).
Teratogens could be produced in municipal water during the treatment processes used to
make the water potable. Water is commonly treated with chlorine or chloramine to kill
microorganisms. This treatment results in formation of a variety of disinfection
byproducts. Adverse effects of water disinfection byproducts on pregnancy have been
demonstrated in both laboratory animal studies as well as human epidemiological studies
(Bove et al., 2002 review; Ahmed et al., 2005, Andrews et al., 2004; Hunter et al., 1996;
Hunter et al., 2006). These adverse pregnancy outcomes include small for gestational age
(SGA), low birth weight (Kramer et al., 1992; Munger et al., 1997), neural tube defects
(Klotz and Pyrch, 1999; Bove et al. 1995; Dodds and King 2001; Klotz and Pyrch 1999),
cardiac defects (Cedergren et al., 2002; Chisholm et al., 2008; Hwang et al., 2002) and
cleft palates (Bove et al. 1995). In our study, NTD rates varied more with the source of
water, not the treatment method. NTDs were not observed in embryos from mice
exposed to chlorinated well water (ground water) but were significantly increased in
embryos from mice exposed to all surface water sources including chlorinated surface
water. This indicated that the teratogen may be a surface water pollutant. Surface waters
are more frequently contaminated as they receive rain water runoff containing
agricultural and man-made pollutants. Ground water is generally less contaminated than

100
the surface water since it is naturally filtered through layers of soil and rock. NTD rates
were similar in mice provided autoclaved river water, chloraminated river water collected
from the treatment plant and autoclaved and non-autoclaved chloraminated tap water.
This indicated the teratogen causing NTDs was not introduced during the water treatment
process and was a contaminant(s) in the surface water prior to water treatment. It is also
interesting to note that neither autoclaving nor the water treatment process altered the
teratogenicity of the compound.

101
Study 3. Detection of apoptotic changes in embryos from teratogens and
maternal immune stimulation
Apoptosis is an essential component of normal development in the mammalian embryo.
During embryonic development, cells proliferate rapidly and are vulnerable to teratogens.
Exposure to teratogens can cause programmed cell death (Sulik et al., 1988). Many
studies show increased apoptosis after exposure to various teratogens that indicated a
correlation between increased apoptosis and teratogen-induced fetal malformations.
Arsenic-induced fetal malformations in the brain, optic system, somite segmentation and
limb bud of rat embryos are related to increased apoptosis in those areas (Li et al., 1998).
Singh et al., (2009) demonstrated increased apoptosis and fetal malformations in
developing embryos exposed to salicylic acid and proposed a relation between apoptosis
and teratogenesis. A positive correlation exists between homocysteine-induced apoptosis
in heart and brain and teratogenesis in avian embryos (Li et al., 1999). Exposure to
retinoic acid resulted in increased apoptosis in the neuroepithelium, spinal cord and heart
of developing mice embryos that suggested apoptosis as a possible mechanism for
retinoic acid induced NTDs and other fetal malformations (Sarkar and Sharma, 2002).
Increased apoptosis also occurs in neural epithelium of nicotine-exposed embryos (Zhao
et al., 2005). Increased apoptosis also is related to skeletal deformities in COX-2
transgenic mouse (Shim et al., 2010).
Cyclophosphamide induces a dose dependent increase in apoptotic cells in developing
embryos as was demonstrated using flow cytometric analysis as well as TUNEL assay.
Therefore, that altered apoptosis may be involved in the teratogenesis of malformations

102
(Singh et al., 2005; Savion et al., 2003; Torchinsky et al., 1995). Chen et al., (1994)
found increased apoptosis in rat cultured embryos exposed to cyclophosphamide. This
also suggests involvement of altered apoptosis in cyclophosphamide teratogenicity.
Correlations between infectious diseases, altered apoptosis and fetal malformations are
also reported. Congenital eye malformations and NTDs from influenza B virus infection
in both mouse and chicken embryos are related to increased apoptosis in neuroepithelium
and surface ectoderm of the head regions (Chen et al., 2009). Teratogenicity of rubella
virus is linked to increased apoptosis in humans (Lee and Bowden, 2000).
Increased apoptosis is a fundamental mechanism in hyperglycemia teratogenicity. Oyama
et al., (2009) showed increased apoptosis in hindbrain region of mouse embryos from
diabetic dams compared to controls. These apoptotic levels decreased when the diabetic
dams were treated with folic acid. Jiang et al., (2008) showed an increase in apoptotic
cells by TUNEL staining in cranial neural tube of embryos from diabetic mice. Apoptosis
decreases in embryos from iNOS (inductible nitric oxide synthase)-treated diabetic mice,
which suggests iNOS reduce NTDs by decreasing apoptosis in embryos from diabetic
mice (Sugimura et al., 2009).
Altered apoptosis as a mechanism for VA induced teratogenicity has also been suggested
but has not been clearly elucidated. VA causes oxidative stress that can induce cell death
(Defoort et al., 2006). VA causes apoptosis in rat uterine and ovarian cells (Cansu et al.,
2010). Inhibition of histone deacetylase (HDAC) increases sensitivity towards apoptotic

103
stimuli (Bai et al., 2010, Kisseberth et al., 2008, Pei et al., 2004). VA inhibits HDAC and
induces apoptosis in various cell lines (Hubaux et al., 2010, Papi et al., 2010). Jergil et
al., (2009) demonstrated a dose dependent increase in cell death in P19 embryonal
carcinoma cells treated with VA. Evaluation of gene expression in these VA-treated
carcinoma cells indicated approximately 200 altered genes; 30% of which were involved
in NTD formation. Di Renzo et al., (2010) showed a relationship between axial skeletal
malformations and increased apoptosis in somites caused by VA exposure in CD-1 mice.
From the studies just described, it is clear that increased apoptosis may result from
teratogen exposure in developing embryos. It is also clear that the tissues or organs with
increased apoptosis following teratogen exposure are prone to malformations. Several
gene knockout models with altered apoptosis also exhibit fetal malformations that
suggest a relationship between altered apoptosis and fetal malformations. There is,
however, no clear evidence that altered apoptosis is directly responsible for the
malformation.
Neural tube closure involves cell migration, proliferation, differentiation and apoptosis
(Sabapathy et al., 1999). Disruption of these processes can cause NTDs. A certain degree
of cell death occurs normally during formation of the neural tube in mice (Schlüter,
1973). Neural folds elevate dorsally and medially and appose each other in order to fuse.
During fusion, the continuity between surface ectoderm and neuroepithelium is
restructured by apoptosis so that the opposing neural folds can converge to form the
neural tube (Copp, 2005). This tissue remodeling by apoptosis is a tightly controlled

104
process. Alteration of this process in several knockout mouse strains demonstrated neural
tube closure defects associated with apoptosis related genes (Barrier et al., 2009; Hsu et
al., 2008; Shirane et al., 2008; Wong et al., 2008). An insufficient number of cells
resulting from increased apoptosis may affect morphogenetic processes that are critical to
neural tube closure (Massa et al., 2009). Exuberant apoptosis in the neural folds could
result in insufficient tissue for normal fold elevation and apposition resulting in NTDs.
Thus, VA could prevent neural fold fusion by increasing apoptosis in neural folds.
In our study, flow cytometric analysis of cells from VA-treated embryonic heads with
open neural tubes revealed increased apoptosis compared to saline injected controls. This
correlated with increased apoptotic TUNEL staining along the neural folds of the VA
exposed embryos compared to controls. The increased apoptosis was localized to neural
folds, which suggested VA-induced apoptosis may lead to NTD formation. In contrast,
Kultima et al., (2004) did not observe increased apoptosis in embryos along the neural
folds from VA teratogenicity. Instead, a transverse band of apoptotic cells in forebrain
region was observed. Apoptosis was measured 48 hours post exposure to VA as opposed
to 12 hours in our study. At 48 hours post exposure, apoptotic cells might already have
been removed from the neural tube area leading to the difference in results.
Interestingly apoptotic levels, measured by flow cytometry, were also increased in VA-
exposed embryos with closed neural tubes. Therefore, VA also enhanced apoptosis in
these embryos. These flow cytometry results were corroborated by TUNEL assay that
revealed increased apoptosis along the midline of the neural fold of the VA embryos with

105
closed neural tubes. Dawson et al., (2006) observed changes in Bcl-2 family genes
towards pro-apoptotic pattern in VA-exposed embryos with both open and closed neural
tubes with no significant difference between these two groups. Although apoptosis was
not measured by these authors, VA likely disrupts the apoptotic pattern in all exposed
embryos.
Nonspecific stimulation of the maternal immune system in mice reduces a wide variety of
teratogen-induced fetal malformations. The mechanism(s) by which broad-spectrum
activity of immune stimulants reduces birth defects has not been completely elucidated,
but embryos from immune stimulated dams are resistant to teratogen-induced apoptosis.
Savion et al., (2003) demonstrated by flow cytometry and TUNEL assay that maternal
immune stimulation prevented cyclophosphamide-induced apoptosis in the head region
of developing mouse embryos. The authors suggested that immune stimulation prevented
head malformations such as exencephaly, cleft palate and open eyes by regulating the
apoptotic process. Similarly, Toder et al., (1996) showed a protective effect of immune
stimulation with cyclophosphamide-induced limb defects. These authors demonstrated
that cyclophosphamide-induced limb bud apoptosis. Maternal immune stimulation
prevented cyclophosphamide-induced apoptosis thus reducing the malformations. Heat-
shock also induces apoptosis causing NTDs and eye abnormalities. Maternal immune
modulation prevents heatshock-induced alterations in apoptosis and also reduces these
fetal malformations (Yitzhakie et al., 1999).

106
In our study, low TUNEL staining was observed in embryos from both saline injected
controls and IFNγ only treated dams concomitant with low apoptotic levels in these two
groups detected by flow cytometry. This suggests that IFNγ treatment by itself did not
affect apoptosis. No significant difference in apoptotic levels was observed in embryos
with closed neural tube from IFNγ +VA-treated dams, and apoptotic TUNEL staining in
these embryos was similar to controls. This suggests embryos with closed neural tubes
from immune stimulated dams were more resistant to teratogen-induced apoptosis. In
embryos with NTDs from IFNγ +VA-treated dams, apoptotic levels were found to be
significantly higher compared to embryos from control (IFNγ only) dams. Increased
apoptotic TUNEL staining was visualized in the head regions along the neural fold edges
in these embryos as well. This suggests that maternal immune stimulation failed to reduce
apoptotic cells and also did not prevent NTDs in these embryos.
Increased apoptosis from VA exposure possibly resulted from a protective mechanism in
the embryo that removes damaged cells and replaces them with new cells. If the ratio of
damaged cells and live cells is too high, the beneficial effects of apoptosis become
detrimental causing too many cells to be removed and disrupting normal organogenesis
(Levy et al., 2001). In addition to induction of apoptosis, VA also inhibits cell
proliferation rates (Voisard et al., 2010; Byun et al., 2009). Decreased cell proliferation
rates together with increased apoptosis in embryos may reduce viable cells in VA-
exposed embryos. Low number of viable cells in the neural folds could result in failure of
neural tube closure thus causing NTDs. This idea was supported by microarray analysis
of embryonic carcinoma cell lines (Jergil et al., 2009) and mouse embryos (Okada et al.,

107
2005) where both cell cycle arrest genes and apoptosis genes were altered from exposure
to VA.
Decreased apoptosis in embryos with closed neural tubes from IFNγ +VA dams suggests
that immune stimulation increases resistance to teratogen-induced apoptosis. This was
supported by other studies that observed prevention of teratogen-induced apoptosis by
immune stimulation (Toder et al., Yitzhakie et al., 1999). Increased apoptosis observed in
embryos with open neural tubes from IFNγ +VA dams suggests immune stimulation
could not prevent the teratogen-induced apoptosis in these embryos resulting in NTDs.
This could have resulted from irreversible DNA damage induced by VA to the
neuroepithelial cells in these embryos.
Overall, this study demonstrated increased apoptosis in embryos from VA-exposed dams
by both flow cytometry and TUNEL assay. The increase in apoptosis was localized to
midline of the neural tube closure in these embryos, which implicated involvement of
altered apoptosis in teratogenicity of VA in inducing NTDs. Increased apoptosis in
normal embryos form VA-exposed dams indicated that there may be other cellular
processes such as cell proliferation and differentiation that might be affected in addition
to apoptosis. Increased apoptosis together with inhibition of proliferation may have
resulted in fewer cells available during neural tube closure that caused NTDs. Apoptotic
changes in embryos with closed neural tubes from IFNγ +VA dams were similar to
controls, which implied maternal immune stimulation could protect against teratogen-
induced apoptosis. This protection may be related to decreased apoptosis in these

108
embryos. In the embryos that maternal immune stimulation failed to regulate apoptosis,
exposure to VA resulted in NTDs.
Tap water-exposed embryos with open neural tubes had a similar apoptotic pattern
compared to F2-DDI controls. Neural tube formation is a complicated process involving
multiple cells and processes, such as cellular cytoskeleton, cell viability, apoptosis, cell
cycle, cell proliferation and interactions between cell surface and extra cellular matrix.
Alterations in any of these cellular functions or processes may lead to NTDs (Copp and
Greene, 2010). Different teratogens can act through different mechanisms to cause a
specific malformation (van Gelder et al., 2010). Unchanged apoptosis in embryos
exposed to tap water suggests that apoptosis is not involved in this particular
teratogenicity. It is possible that other cellular functions such as cell proliferation,
differentiation, or migration might be involved other than apoptosis.

109
Study 4. Molecular regulation of apoptosis by VA with and without
maternal immune stimulation and by tap water
Regulation of apoptosis is an essential component of normal development. Teratogens
alter apoptosis by changing the expression of apoptotic regulatory genes. Analysis of
single genes provides little information regarding the regulation of apoptosis. Conversely,
analysis of a number of pathway-focused genes can provide insight in to the overall
apoptotic mechanisms. In this study, expression of 84 key genes involved in apoptosis
was determined in response to VA with and without maternal immune stimulation and to
tap water exposure. The analysis included the TNF ligands and their receptors; members
of the Bcl-2, caspases, IAP, TRAF, CARD, death domain, death effector domain, and
CIDE families; as well as genes involved in the p53 and ATM pathways. TNF family
members can send both survival and death signals to cells and play a major role in
various cellular processes such as apoptosis, cell proliferation and differentiation
(Kawasaki et al., 2002). p53 signaling regulates a variety of genes involved in apoptosis,
inhibition of cell proliferation and growth arrest in response to cellular stress. Interaction
between pro-apoptotic and anti-apoptotic members of the Bcl-2 family controls the
mitochondrial apoptosis pathway (Jin and El-Deiry, 2005; Maddika et al., 2007). The
balance between pro-apoptotic and anti-apoptotic signals is established upon activation of
TRAF, CARD, death domain, death effector domain, and CIDE families that activate
death stimuli. ATM (Ataxia Telangiectasia Mutated Protein) signaling plays a key role in
regulating multiple signaling cascades in response to DNA strand breaks induced by
damaging agents. Caspases, triggered by apoptosis signaling, activate a number of
proteins in the cell that causes cell death and removal of cell debris. In our study, genes

110
that were significantly altered more than 2-fold were considered as major contributors
and are discussed here.
In GD 8.5 embryos exposed to VA, no apoptotic genes were significantly up regulated
more than two-fold compared to controls. CIDE proteins including Cideb activate
apoptosis in mammalian cell lines (Inohara et al., 1998). In our study; however, the CIDE
domain family gene, Cideb, that induces apoptosis, was significantly down regulated in
GD 8.5 embryos exposed to VA compared to controls. p53 genes are involved in ethyl
carbamate teratogenicity (Sharova et al., 2000). Similarly, congenital eye malformations
induced by teratogens are related to increased apoptosis resulting from p53 dysregulation
(Wubah et al., 1996; Charlap et al., 2003). Loeken et al., (2006) suggested a role for p53
induced apoptosis in diabetes-induced NTDs by demonstrating inhibition of Pax3 by
excess glucose that is needed to check p53 dependent apoptosis. In our study, the p53
pathway gene, Trp63, which induces apoptosis, was up-regulated significantly but was
not altered more than two fold (1.51 fold). This suggests that p53 pathway may only be
partially involved in VA-induced teratogenicity.
In GD 9 embryos, both apoptotic and anti-apoptotic gene expressions were affected by
VA. Bcl-2, p53, and death effector domain family genes were predominantly affected in
GD9 embryos from VA-treated dams compared to embryos from control mice (saline
injected). Pro-apoptotic Bcl-2 family genes, Bad, Bak1 and Bok, were up regulated in
embryos from VA-treated dams. This indicates involvement of Bcl-2 family genes in
teratogenesis of VA. Chemical and physical agents induce death stimuli by causing

111
oxidative stress and DNA damage. Death stimuli induced by chemicals leads to
activation of pro-apoptotic Bcl-2 family proteins such as Bax, Bid and Bak (Reviewed by
Torchinsky et al., 2005). Bok is a pro-apoptotic family gene that promotes
chemotherapeutic-induced apoptosis in growing cells (Rodriguez et al., 2006) and is an
essential for p53 induced apoptosis (Yakovlev et al., 2004). The results from our study
indicated increased apoptosis in embryos from VA-treated dams could be related to up
regulation of Bcl-2 family genes such as Bad, Bak1 and Bok.
Expression of the Bcl-2 family apoptotic genes, Bad, Bak1, Bok, were normalized in
embryos with closed neural tube from VA+IFNγ dams. Therefore, immune stimulation
prevented the change in pro-apoptotic regulatory molecules belonging to Bcl-2 family.
Similar results were obtained by Savion et al., (2009), with cyclophosphamide
teratogenicity. Cyclophosphamide induced expression of Bcl2, whereas maternal immune
stimulation normalized the expression.
In our study, expression of an anti-apoptotic gene in the Bcl-2 family, Bcl2l, was
decreased by VA exposure. This is similar to results obtained by Dawson et al., (2006),
who observed decreased expression of anti-apoptotic gene, Bcl2, in VA-exposed embryos
with both open and closed neural tubes. Increased ratio of pro-apoptotic and anti-
apoptotic genes of Bcl-2 family is associated with increased apoptosis (Dawson et al.,
2006). Our results suggest that down regulation of anti-apoptotic Bcl-2 gene, Bcl2l1,
together with up regulation of pro-apoptotic Bcl-2 family genes shifted the ratio towards

112
activation of pro-apoptotic signaling resulting in increased apoptosis in VA-exposed
embryos.
Maternal immune stimulation normalized the expression levels of Bcl-2 family genes,
which indicated these genes play a major role in the protective effect of immune
modulation of VA-induced NTDs. Sharova et al., (2000) found similar results where
maternal immune stimulation normalized decreased expression of anti-apoptotic Bcl-2
family genes in embryos exposed to urethane. In embryos with open neural tube from
VA+IFNγ dams, apoptotic genes, Bad, Bak1, Casp9, Cideb were significantly over
expressed compared to IFNγ only embryos similar to the VA-exposed embryos. These
results were corroborated by the flow cytometric as well as TUNEL staining results that
demonstrated higher percentages of apoptosis in VA+IFNγ embryos with open neural
tubes. Taken together, these results indicate immune stimulation failed to reduce the
expression of these apoptotic genes possibly resulting in the excessive apoptosis observed
in this group.
Induction of Casp9, a positive regulator of apoptosis, is a major cellular event in stress
conditions (reviewed by Torchinsky et al., 2005). Teratogens such as hyperthermia,
cyclophosphamide, staurosporin (Little and Mirkes, 2002) and arsenic (Singh et al.,
2010) induce cell death in GD 9 mouse embryos by induction of Casp9. The
neuroepithelium is one of the most sensitive tissues prone to teratogen-induced apoptosis
(Mirkes and Little, 1998. Our results are in agreement with the above studies. The over

113
expression of Casp9 was observed in VA-exposed embryos with open and closed neural
tubes that indicates a role of Casp9 in the VA teratogenesis.
The apoptotic gene, Casp9, was also up regulated in GD9 embryos with closed neural
tube from VA+IFNγ dams; however, expression levels were low compared to VA-
exposed embryos. This indicates immune stimulation partially normalized the expression
of Casp9 towards control embryos. Casp9 levels were up regulated in embryos with open
neural tube from VA+IFNγ group. Expression levels in these embryos were similar to
embryos from VA group, which indicates immune stimulation failed to reduce the
expression of Casp9 in these embryos.
Akt negatively regulates apoptosis by suppressing a variety of pro-apoptotic molecules
such as Bad and Casp9 (Kim et al., 2001). In our study, Akt1 under expressed in VA-
exposed embryos and also in embryos with open neural tube from IFNγ +VA dams,
which suggests the effect of VA on negative regulators of apoptosis. In IFNγ +VA
embryos with closed neural tubes, immune stimulation normalized the expression of
Akt1. Chen et al., (2006) showed that VA induces apoptosis in cell lines by reducing the
expression of Akt1 thereby activating caspase 9. Our results indicate Akt1 is a potential
target for VA teratogenicity through caspase 9. Immune stimulation was able to prevent
the effect of VA on this negative regulator of apoptosis.
Anti-apoptotic genes, Cflar and Dad1, were significantly down regulated by VA and may
be a direct effect of the teratogen. Pro-apoptotic genes such as Cradd, Fadd, Ripk1 and
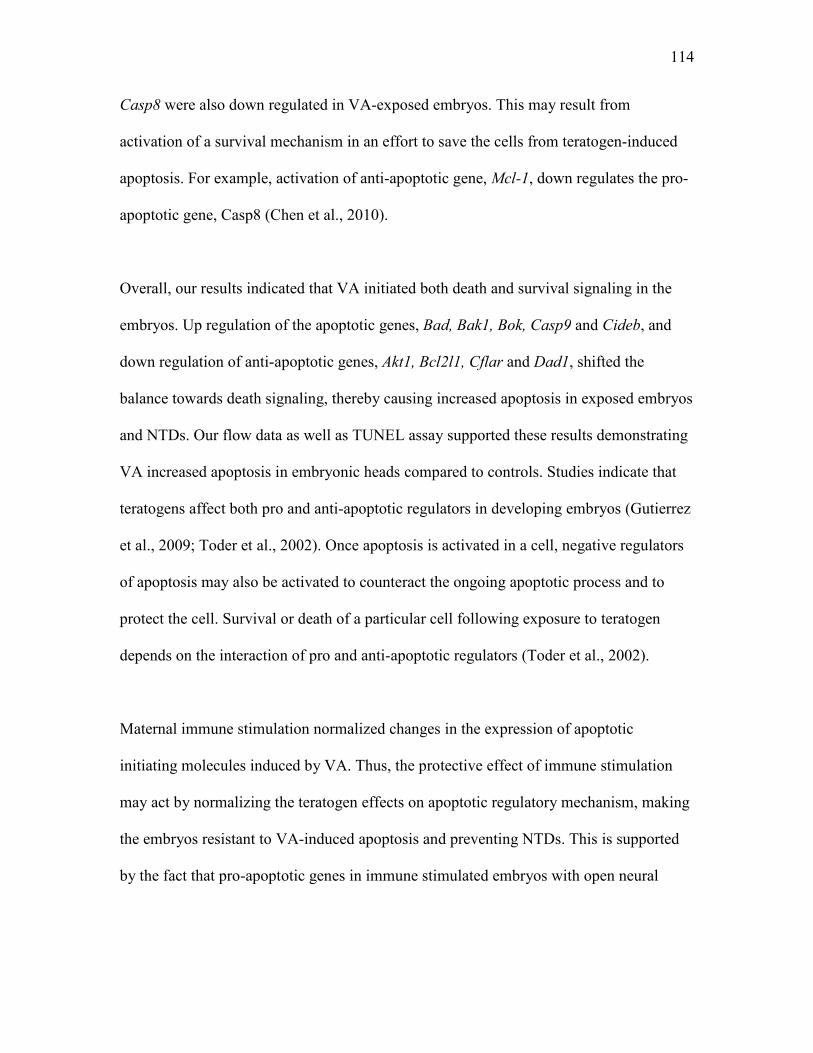
114
Casp8 were also down regulated in VA-exposed embryos. This may result from
activation of a survival mechanism in an effort to save the cells from teratogen-induced
apoptosis. For example, activation of anti-apoptotic gene, Mcl-1, down regulates the pro-
apoptotic gene, Casp8 (Chen et al., 2010).
Overall, our results indicated that VA initiated both death and survival signaling in the
embryos. Up regulation of the apoptotic genes, Bad, Bak1, Bok, Casp9 and Cideb, and
down regulation of anti-apoptotic genes, Akt1, Bcl2l1, Cflar and Dad1, shifted the
balance towards death signaling, thereby causing increased apoptosis in exposed embryos
and NTDs. Our flow data as well as TUNEL assay supported these results demonstrating
VA increased apoptosis in embryonic heads compared to controls. Studies indicate that
teratogens affect both pro and anti-apoptotic regulators in developing embryos (Gutierrez
et al., 2009; Toder et al., 2002). Once apoptosis is activated in a cell, negative regulators
of apoptosis may also be activated to counteract the ongoing apoptotic process and to
protect the cell. Survival or death of a particular cell following exposure to teratogen
depends on the interaction of pro and anti-apoptotic regulators (Toder et al., 2002).
Maternal immune stimulation normalized changes in the expression of apoptotic
initiating molecules induced by VA. Thus, the protective effect of immune stimulation
may act by normalizing the teratogen effects on apoptotic regulatory mechanism, making
the embryos resistant to VA-induced apoptosis and preventing NTDs. This is supported
by the fact that pro-apoptotic genes in immune stimulated embryos with open neural

115
tubes were not normalized. Excessive apoptosis resulting from the altered apoptotic genes
may lead to NTDs in these embryos.
In embryos from tap water-exposed dams, none of the apoptotic genes were significantly
different compared to controls. Our flow cytometry and TUNEL results corroborated
these findings with no increase in apoptosis observed in embryos exposed to tap water.
Together, these results suggest that apoptosis may not be involved in the teratogenicity
associated with tap water.

116
Study 5. Molecular regulation of signal transduction pathways by VA
with and without maternal immune stimulation and by tap water
Signaling pathways can regulate many normal and abnormal cellular mechanisms and are
important for development. The relative expressions of genes involved in regulating
signal transduction were determined in VA (with and without immune stimulation) and in
tap water-exposed embryos. Alterations in gene expression of signal transduction
pathways were used to identify possible pathways involved in the formation of NTDs.
The pathways that were analyzed included Wnt pathway, TGF- β pathway, hedgehog
pathway, PI3 Kinase / AKT Pathway, Jak / Src pathway, NFκB pathway and retinoic acid
pathway. Neural tube closure involves several morphogenic mechanisms such as cell
proliferation, dorsoventral (DV) patterning, cell migration, cell fate specification and cell
shaping (Copp et al., 1988, Padmanabhan, 2006). Numerous cell signaling molecules and
pathways control cellular processes during normal development. Wnt, TGF- β, hedgehog
pathway, PI3 Kinase / AKT, Jak / Src and NFκB pathways are the most prominent
regulatory signals controls these biological processes. Wnt and Hedgehog family
signaling molecules play a part in multiple developmental processes during
embryogenesis such as cell proliferation, cell fate specification and cell differentiation
(Logan and Nusse, 2004). AKT signaling pathway molecules participate in several
biological responses such as inhibition of apoptosis and stimulation of cell proliferation.
Hedgehog or BMP/Wnt signaling pathway genes such as Fgf4, Bmp2, Wnt2 were
significantly down regulated in GD9 embryos with open neural tube from VA-treated
dams. Only Fgf4 was significantly down regulated in VA-exposed embryos with closed

117
neural tubes. Fibroblast growth promoter (Fgf) family genes promote cell proliferation in
several cell lines (Tsuboi et al., 1990; Boilly et al., 2000; LaValle et al., 1998). Kosaka et
al., (2006) demonstrated the ability of Fgf4 to induce neural progenitor cell proliferation.
Down regulation of Fgf in a cancer line following VA exposure was observed by Zgouras
et al., (2004). In our study, down regulation of Fgf4 was observed in VA-exposed
embryos with both open and closed neural tubes; however, the down regulation of Fgf4
was more pronounced in embryos with open neural tubes. This effect on Fgf4 implied the
possible arrest of cell proliferation by VA.
Immune stimulation with IFNγ normalized the expression of Fgf4 in embryos with closed
neural tubes, which indicates a role of Fgf4 in immune stimulation protective mechanism.
Immune stimulation also normalized the expression of Fgf4 in embryos with open neural
tubes. This suggests involvement of multiple molecular pathways including apoptotic
pathways along with Fgf4 in formation of VA-induced NTDs and also in protective
mechanism of maternal immune stimulation.
Bone morphogenetic proteins (BMPs) play a major role in dorso-ventral (DV) patterning
(Barth et al., 1999; Liem et al., 2000; Kishigami and Mishina, 2005), whereas sonic
hedgehog determines the ventral patterning during neural tube formation (Briscoe et al.,
1999). In our study, Bmp2 was significantly down regulated in VA-exposed embryos
with open neural tubes but not in embryos with closed neural tubes. Castranio and
Mishina et al., 2009 observed failure of neural tube closure in Bmp2 chimeras that
indicated Bmp2 is essential for the neural tube closure. Reduced expression of Bmp2 in

118
embryonic and/or maternal tissues results in NTDs (Singh et al., 2008). Our results
supported this idea as Bmp2 in embryos with open neural tube was down regulated in
VA-exposed dams that suggests role of Bmp2 in VA teratogenesis. Maternal immune
stimulation failed to normalize the expression of Bmp2 in embryos with open as well as
closed neural tubes from IFNγ +VA dams. Therefore, Bmp2, was not involved in the
reduction of NTDs by maternal immune stimulation
Wnt signaling genes play a major role in intercellular signaling during embryonic
development. Involvement of Wnts in CNS patterning and regulation of asymmetric cell
divisions is seen in various gene knockouts (Wodarz and Nusse, 1998). Various studies
on cancer cell lines demonstrate a decrease in cell proliferation and an increase in
apoptosis resulting from inhibition of Wnt2 expression (Shi et al., 2007; You et al., 2004;
Pu et al., 2009; Wang et al., 2010). Expression of Wnt2 in VA-exposed embryos with
open neural tubes was decreased indicating role of Wnt2 in VA teratogenicity. Maternal
immune stimulation failed to normalize the expression of Wnt2 in embryos with open as
well as closed neural tubes from IFNγ +VA dams. This suggests that Wnt2 was not
involved in the reduction of NTDs by maternal immune stimulation.
Hox group genes, key regulators in early embryonic development, play a major role in
patterning of the embryo. Disruption of these genes leads to malformations (Stodgell et
al., 2006; Carpenter et al., 1993). In our study, expression of Hoxa1 was reduced in
embryos with open neural tubes. Recently Zhang et al., (2010) observed inhibition of
Hoxa2 in VA-exposed embryos. The authors also demonstrated that ascorbic acid

119
normalized Hoxa2 expression and reduced VA-induced NTDs. These results imply that
VA may disrupt Hox genes. In contrast to our study, Stodgell et al., (2006) observed over
expression of Hoxa1 in rat embryos exposed to VA. Whether this is a species difference
or is due to measuring genes from whole embryos opposed to just embryonic heads as in
our study is not known. Maternal immune stimulation failed to normalize the expression
of Hoxa1 in embryos with open as well as closed neural tubes from IFNγ+VA dams.
Therefore, Hoxa1 was not involved in the reduction of NTDs by maternal immune
stimulation.
Fibronectins (Fn) promote cell migration and cytoskeletal organization (Hynes and
Yamada, 1982; Darribere et al., 2000). Lack of fibronectin in developing embryos causes
defects in the developing neural tube (George et al., 1993). In our study, VA significantly
reduced the expression of Fn1 in embryos with open neural tubes but not in embryos with
closed neural tubes that indicated a role of Fn1 in VA-induced teratogenesis. Maternal
immune stimulation normalized the expression of Fn1 in embryos with open as well as
closed neural tubes indicated that Fn1 may be involved in maternal immune stimulation
protective mechanism.
Hspb1 is not essential for the mammalian development but can act together with other
regulators to protect the embryo from stress-induced apoptosis (Huang et al., 2007).
Down regulation of Hspb1 was observed in our VA-exposed embryos with open neural
tubes but not in embryos with closed neural tubes, which indicates a lack of cellular
protective mechanism to prevent VA-induced apoptosis. Maternal immune stimulation

120
normalized the expression of Hspb1 in embryos with closed neural tubes, which indicates
that Hspb1 may be involved in maternal immune stimulation protective mechanism.
Maternal immune stimulation also normalized the expression of Hspb1 in embryos with
open neural tubes. Our studies showed that VA-induced alterations in apoptotic pathways
were not normalized in these embryos. This indicates normalization of both pathways
could be required for protection by immune stimulation.
In summary, VA altered the hedgehog (Bmp2), Wnt (Fgf4, wnt2), retinoic acid (Hoxa1)
and AKT (Fn1) signaling pathways in embryos with open neural tubes but not in
embryos with closed neural tubes except Fn1. These signaling pathways play roles in
various morphogenic events during organogenesis including neural tube formation. The
results from of our study indicate a role of these signaling pathways in formation of
NTDs in addition to the apoptotic pathways. Maternal immune stimulation normalized
the expression of Fn1 and Hspb1 in embryos with open as well as closed neural tubes,
which indicated Hspb1 and Fn1 may be involved in maternal immune stimulation
protective mechanism. Maternal immune stimulation failed to normalize the expression
of Bmp2, Wnt2 and Hoxa1 in embryos with open as well as closed neural tubes from
IFNγ+VA dams. This indicated that Wnt2, Bmp2 and Hoxa1 were not involved in the
reduction of NTDs by maternal immune stimulation.
In embryos exposed to tap water, none of the signal transduction genes were significantly
altered compared to controls. Expressions of the genes related to NFkB (Tank and Tert),
Tgf- β pathway (Cdkn2a), mitogenic pathway (Nab2), retinoic acid pathway (Rbp1) and

121
hedgehog pathway (Wnt1) were altered more than two-fold, however, expression levels
did not reach significance. As discussed above, all of these pathways play a role in
embryonic development including neural tube formation. As only biological triplicates
were used in this study, further analysis with larger sample size may give more insight
into the molecular mechanisms behind the tap water teratogenicity. NTDs can result from
functional change in the single gene or multiple genes (Copp and Greene, 2007). As this
assay only screened candidate genes related to signaling pathways that are important in
development, more detailed analysis of the pathways that showed a trend may be required
to identify the specific signaling pathways that play a role in teratogenesis of the
contaminat in the tap water.

122
V. CONCLUSIONS
VA-treated embryonic heads with open neural tubes had increased apoptosis localized to
neural folds. Increased apoptosis from VA exposure possibly resulted from a protective
mechanism in the embryo that removes damaged cells and replaces them with new cells.
In addition to induction of apoptosis, VA also inhibits cell proliferation rates. Exuberant
VA-induced apoptosis together with inhibition of cell proliferation in the neural fold
could create insufficient tissue for normal fold elevation and apposition thus resulting in
NTDs. Increased apoptosis in VA-exposed embryos with closed neural tubes suggests
that other cellular processes such as cell proliferation and differentiation were not
affected in these embryos. Apoptotic levels in embryos with closed neural tubes from
IFNγ+VA dams were similar to controls indicating resistance to teratogen-induced
apoptosis and protection against teratogens. In IFN+VA-exposed embryos with open
neural tubes, maternal immune stimulation failed to regulate apoptosis, resulting in
NTDs. This could have resulted from irreversible DNA damage induced by VA to the
neuroepithelial cells in these embryos.
VA affected both apoptotic and anti-apoptotic gene expressions in GD 9 embryos. Bcl-2,
p53, and death effector domain family genes were predominantly affected. VA down
regulated anti-apoptotic Bcl-2 family genes and up regulated pro-apoptotic Bcl-2 family
genes thereby shifting the ratio towards activation of pro-apoptotic signaling and
increased apoptosis in neural folds. Expression of the Bcl-2 family apoptotic genes were
normalized in embryos with closed NT from IFNγ+VA dams but not in embryos with
open neural tubes, which indicates Bcl-2 family genes play a major role in the protective

123
effect of immune modulation of VA-induced NTDs. VA up regulated caspase 9 and
IFNγ+VA reduced the up regulation of caspase 9. VA down regulated Akt1 and
IFNγ+VA decreased the down regulation of Akt1. This indicated that VA affects
regulators of apoptosis that belong to p53 family and immune stimulation normalizes this
effect.
VA altered signal transduction genes relating to the hedgehog (Bmp2), Wnt (Fgf4, wnt2),
retinoic acid (Hoxa1) and AKT (Fn1) families in embryos with open neural tubes but not
in embryos with closed neural tubes. These results suggest that in addition to apoptotic
pathways, VA also disrupted signaling pathways for various morphogenic events during
organogenesis, including neural tube formation. Maternal immune stimulation
normalized the expression of Fn1 and Hspb1 and thus may mediate protection through
these signaling pathways.
In tap water-exposed embryos, neither flow cytometry nor TUNEL assay revealed any
change in apoptosis compared to controls indicating apoptosis is not involved in
teratogenicity from tap water exposure. These results were consistent with the PCR
analysis that detected no changes in apoptotic pathway genes with exposure to tap water.
This suggests that alteration of apoptosis is not a mechanism for teratogenicity resulting
from exposure to the contaminant in tap water. Also, none of the pathways were
significantly altered in tap water-exposed embryos.

124
Overall, these results suggest that teratogens may alter several biological processes
including apoptosis to induce fetal malformations. Resistance to teratogen-induced
apoptosis in embryos resulting from maternal immune stimulation may be involved in a
protective mechanism.

125
VI. REFERENCES
Ahmed AE, Jacob S, Campbell GA, Harirah HM, Perez-Polo JR, Johnson KM. 2005.
Fetal origin of adverse pregnancy outcome: The water disinfectant by-product
chloroacetonitrile induces oxidative stress and apoptosis in mouse fetal brain. Brain Res
Dev Brain Res. 159:1–11.
Alexander PG, Chau L, Tuan RS. 2007. Role of nitric oxide in chick embryonic
organogenesis and dysmorphogenesis. Birth Defects Res A Clin Mol Teratol. 79(8):581-
94.
Allen JR, Barsotti DA, Carstens LA. 1980. Residual effects of polychlorinated biphenyls
on adult nonhuman primates and their offspring. J Toxicol Environ Health. 6(1):55-66.
Ambroso JL, Stedman DB, Elswick BA, Welsch F. 1998. Characterization of cell death
induced by 2-methoxyethanol in CD-1 mouse embryos on gestation day 8. Teratology.
58(6):231-40.
Andrews JE, Nichols HP, Schmid JE, Mole LM, Hunter ES III, Klinefelter GR. 2004.
Developmental toxicity of mixtures: The water disinfection by-products dichloro-,
dibromo- and bromochloro acetic acid in rat embryo culture. Reprod Toxicol. 19: 111–
116.
Aouali N, Palissot V, El-Khoury V, Moussay E, Janji B, Pierson S, Brons NH, Kellner L,
Bosseler M, Van Moer K, Berchem G. 2009. Peroxisome proliferator-activated receptor
gamma agonists potentiate the cytotoxic effect of valproic acid in multiple myeloma
cells. Br J Haematol. 147(5):662-71.
Azoulay-Dupuis E, Mansour H, Moreau J, Lachia L. 1988. Protective effect of beta-
naphthoflavone against NO2 toxicity in mice with genetically inducible lung cytochrome
P450. Toxicol Appl Pharmacol. 93(2):220-30.
Bai LY, Omar HA, Chiu CF, Chi ZP, Hu JL, Weng JR. 2010. Antitumor effects of (S)-
HDAC42, a phenylbutyrate-derived histone deacetylase inhibitor, in multiple myeloma
cells. Cancer Chemother Pharmacol. (In press)
Baines MG, Duclos AJ, de Fougerolles AR, Gendron RL. 1996. Immunological
prevention of spontaneous early embryo resorption is mediated by non-specific
immunosimulation. Am J Reprod Immunol. 35(1):34-42.
Bamforth SD, Bragança J, Eloranta JJ, Murdoch JN, Marques FI, Kranc KR, Farza H,
Henderson DJ, Hurst HC, Bhattacharya S. 2001. Cardiac malformations, adrenal
agenesis, neural crest defects and exencephaly in mice lacking Cited2, a new Tfap2 co-
activator. Nat Genet. 29(4):469-74.

126
Barbera JP, Rodriguez TA, Greene ND, Weninger WJ, Simeone A, Copp AJ, Beddington
RS, Dunwoodie S. 2002. Folic acid prevents exencephaly in Cited2 deficient mice. Hum
Mol Genet. 11(3):283-93.
Barrier M, Dix DJ, Mirkes PE. 2009. Inducible 70 kDa heat shock proteins protect
embryos from teratogen-induced exencephaly: Analysis using Hspa1a/a1b knockout
mice. Birth Defects Res A Clin Mol Teratol. 85(8):732-40.
Barth KA, Kishimoto Y, Rohr KB, Seydler C, Schulte-Merker S, Wilson SW. 1999. Bmp
activity establishes a gradient of positional information throughout the entire neural plate.
Development. 126(22):4977-87.
Bennett GD, Wlodarczyk B, Calvin JA, Craig JC, Finnell RH. 2000. Valproic
acid-induced alterations in growth and neurotrophic factor gene expression in
murine embryos. Reprod Toxicol. 14(1):1-11.
Benotti MJ, Trenholm RA, Vanderford BJ, Holady JC, Stanford BD, Snyder SA. 2009.
Pharmaceuticals and endocrine disrupting compounds in US drinking water. Environ Sci
Technol. 43:597–603.
Bittigau P, Sifringer M, Ikonomidou C. 2003. Antiepileptic drugs and apoptosis in the
developing brain. Ann N Y Acad Sci. 993:103-14.
Boilly B, Vercoutter-Edouart AS, Hondermarck H, Nurcombe V, Le Bourhis X. 2000.
FGF signals for cell proliferation and migration through different pathways. Cytokine
Growth Factor Rev. 11(4):295-302.
Bokelmann I, Mahlknecht U. 2008. Valproic acid sensitizes chronic lymphocytic
leukemia cells to apoptosis and restores the balance between pro- and antiapoptotic
proteins. Mol Med. 14(1-2):20-7.
Bove F, Shim Y, Zeitz P. 2002. Drinking water contaminants and adverse pregnancy
outcomes: A review. Environ Health Perspect. 110(Suppl 1):61–74.
Bove FJ, Fulcomer MC, Klotz JB, Esmart J, Dufficy EM, Savrin JE. 1995. Public
drinking water contamination and birth outcomes. Am J Epidemiol. 141(9):850-62.
Brauze D, Januchowski R, Szyfter K. 2002. Differences between rats and mice in
induction of 4S beta-naphthoflavone-binding protein expression by treatment with beta-
naphthoflavone. J Appl Genet. 43(3):371-6.
Brill A, Torchinsky A, Carp H, Toder V. 1999. The role of apoptosis in normal and
abnormal embryonic development. J Assist Reprod Genet. 16(10):512-9.
Briscoe J, Sussel L, Serup P, Hartigan-O'Connor D, Jessell TM, Rubenstein JL, Ericson
J. 1999. Homeobox gene Nkx2.2 and specification of neuronal identity by graded Sonic
hedgehog signalling. Nature. 398(6728):622-7.

127
Bull RJ, Rice G, Teuschler LK. 2009. Determinants of whether or not mixtures of
disinfection by-products are similar. J Toxicol Environ Health A. 72:437–460.
Burren KA, Savery D, Massa V, Kok RM, Scott JM, Blom HJ, Copp AJ, Greene ND.
2008. Gene-environment interactions in the causation of neural tube defects: folate
deficiency increases susceptibility conferred by loss of Pax3 function. Hum Mol Genet.
17(23):3675-85.
Burren KA, Scott JM, Copp AJ, Greene ND. 2010. The genetic background of the curly
tail strain confers susceptibility to folate- deficiency-induced exencephaly. Birth Defects
Res A Clin Mol Teratol. 88:76–83.
Byun SS, Kim FJ, Khandrika L, Kumar B, Koul S, Wilson S, Koul HK. 2009.
Differential effects of valproic acid on growth, proliferation and metastasis in HTB5 and
HTB9 bladder cancer cell lines. Cancer Lett. 281(2):196-202.
Cabrera RM, Hill DS, Etheredge AJ, Finnell RH. 2004. Investigations into the etiology of
neural tube defects. Birth Defects Res C Embryo Today. 72:330–344.
Cansu A, Erdogan D, Serdaroglu A, Take G, Coskun ZK, Gurgen SG. 2010. Histologic
and morphologic effects of valproic acid and oxcarbazepine on rat uterine and ovarian
cells. Epilepsia. 51(1):98-107.
Carpenter EM, Goddard JM, Chisaka O, Manley NR, Capecchi MR. 1993. Loss of Hox-
A1 (Hox-1.6) function results in the reorganization of the murine hindbrain.
Development. 118(4):1063-75.
Castranio T, Mishina Y. 2009. Bmp2 is required for cephalic neural tube closure in the
mouse. Dev Dyn. 238(1):110-22.
Catalano MG, Fortunati N, Pugliese M, Costantino L, Poli R, Bosco O, Boccuzzi G.
2005. Valproic acid induces apoptosis and cell cycle arrest in poorly differentiated
thyroid cancer cells. J Clin Endocrinol Metab. 90:1383-1389.
Cedergren MI, Selbing AJ, Lofman O, Källen B. 2002. Chlorination byproducts and
nitrate in drinking water and risk of congenital cardiac defects. Environ Res. 89(2):124–
130.
Chaineau E, Binet S, Pol D, Chatellier G, Meininger V. 1990. Embryotoxic effects of
sodium arsenite and sodium arsenate on mouse embryos in culture. Teratology.
41(1):105-12.
Chappell JH Jr, Wang XD, Loeken MR. 2009. Diabetes and apoptosis: neural crest cells
and neural tube. Apoptosis. 14(12):1472-83.
Charlap JH, Donahue RJ, Knudsen TB. 2003. Exposure-disease continuum for
2-chloro-2'-deoxyadenosine, a prototype ocular teratogen. 3. Intervention with PK11195.
Birth Defects Res A Clin Mol Teratol. 67(2):108-15.

128
Chen BY, Chang HH, Chen ST, Tsao ZJ, Yeh SM, Wu CY, Lin DP. 2009. Congenital
eye malformations associated with extensive periocular neural crest apoptosis after
influenza B virus infection during early embryogenesis. Mol Vis. 15:2821-8.
Chen X, Wong P, Radany E, Wong JY. 2009. HDAC inhibitor, valproic acid, induces
p53-dependent radiosensitization of colon cancer cells. Cancer Biother Radiopharm.
24(6):689-99.
Chen J, Ghazawi FM, Bakkar W, Li Q. 2006. Valproic acid and butyrate induce
apoptosis in human cancer cells through inhibition of gene expression of Akt/protein
kinase B. Mol Cancer. 5:71.
Chen B, Cyr DG, Hales BF. 1994. Role of apoptosis in mediating phosphoramide
mustard-induced rat embryo malformations in vitro. Teratology. 50(1):1-12.
Chisholm K, Cook A, Bower C, Weinstein P. 2008. Risk of birth defects in Australian
communities with high brominated disinfection by-product levels. Environ Health
Perspect. 116:1267–1273.
Christianson A, Howson CP, Model B. 2006. March of Dimes Global Report, Executive
Summary: The Hidden Toll of Dying and Disabled Children. White Plains, NY: March of
Dimes Foundation.
Clark DA, Banwatt D, Chaouat G. 1993. Stress-triggered abortion in mice prevented by
alloimmunization. Am J Reprod Immunol. 29(3):141-7.
Clayton-Smith J, Donnai D. 1995. Fetal valproate syndrome. J Med Genet. 32:724-727.
Copp AJ, Greene ND. 2010. Genetics and development of neural tube defects. J Pathol.
220(2):217-30.
Copp AJ. 2005. Neurulation in the cranial region--normal and abnormal. J Anat.
207(5):623-35.
Copp AJ, Brook FA, Roberts HJ. 1988. A cell-type-specific abnormality of cell
proliferation in mutant (curly tail) mouse embryos developing spinal neural tube defects.
Development. 104(2):285-95.
Darribère T, Schwarzbauer JE. 2000. Fibronectin matrix composition and organization
can regulate cell migration during amphibian development. Mech Dev. 92(2):239-50.
Dawson JE, Raymond AM, Winn LM. 2006. Folic acid and pantothenic acid protection
against valproic acid-induced neural tube defects in CD-1 mice. Toxicol Appl Pharmacol.
211(2):124-32.
Defoort EN, Kim PM, Winn LM. 2006. Valproic acid increases conservative homologous
recombination frequency and reactive oxygen species formation: A potential mechanism
for valproic acid-induced neural tube defects. Mol Pharmacol. 69(4):1304-10.

129
Derradji H, Bekaert S, De Meyer T, Jacquet P, Abou-El-Ardat K, Ghardi M, Arlette M,
Baatout S. 2008. Ionizing radiation-induced gene modulations, cytokine content changes
and telomere shortening in mouse fetuses exhibiting forelimb defects. Dev Biol.
322(2):302-13.
Di Renzo F, Broccia ML, Giavini E, Menegola E. 2007. Relationship between embryonic
histonic hyperacetylation and axial skeletal defects in mouse exposed to the three HDAC
inhibitors apicidin, MS-275, and sodium butyrate. Toxicol Sci. 98:582-588.
Di Renzo F, Broccia ML, Giavini E, Menegola E. 2010. VPA-related axial skeletal
defects and apoptosis: a proposed event cascade. Reprod Toxicol. 29(1):106-12.
Dieterich E, Steveling A, Lukas A, Seyfeddinipur N, Spranger J. 1980. Congenital
anomalies in children of epileptic mothers and fathers. Neuropediatrics. 11:274-283.
Dodds L, King WD. 2001. Relation between trihalomethane compounds and birth
defects. Occup Environ Med. 58(7):443-6.
Dong J, Sulik KK, Chen SY. 2010. The role of NOX enzymes in ethanol-induced
oxidative stress and apoptosis in mouse embryos. Toxicol Lett. 193(1):94-100.
Duenas-Gonzalez A, Candelaria M, Perez-Plascencia C, Perez-Cardenas E, de la Cruz-
Hernandez E, Herrera LA. 2008. Valproic acid as epigenetic cancer drug: Preclinical,
clinical and transcriptional effects on solid tumors. Cancer Treatment Reviews. 34:206-
222.
Edwards M, Dudi A. 2004. Role of chlorine and chloramine in corrosion of lead-bearing
plumbing materials. J Am Water Works Assoc. 96(10):69–81.
Eikel D, Lampen A, Nau H. 2006. Teratogenic effects mediated by inhibition of histone
deacetylases: Evidence from quantitative structure activity relationships of 20 valproic
acid derivatives. Chem Res Toxicol. 19:272-278.
Emmanouil-Nikoloussi EN, Foroglou NG, Kerameos-Foroglou CH, Thliveris JA. 2004.
Effect of valproic acid on fetal and maternal organs in the mouse: A morphological study.
Morphologie. 88:41-45.
Falconer IR. 2006. Are endocrine disrupting compounds a health risk in drinking water?
Int J Environ Res Public Health. 3:180–184.
Fei P, Wang W, Kim SH, Wang S, Burns TF, Sax JK, Buzzai M, Dicker DT, McKenna
WG, Bernhard EJ, El-Deiry WS. 2004. Bnip3L is induced by p53 under hypoxia, and its
knockdown promotes tumor growth. Cancer Cell. 6(6):597-609.
Fein A, Magid N, Savion S, Orenstein H, Shepshelovich J, Ornoy A, Torchinsky A,
Toder V. 2002. Diabetes teratogenicity in mice is accompanied with distorted expression
of TGF-beta2 in the uterus. Teratog Carcinog Mutagen. 22:59-71.

130
Fein A, Kostina E, Savion S, Orenstein H, Shepshelovich J, Ornoy A, Torchinsky A,
Toder V. 2001. Expression of tumor necrosis factor-alpha in the pregnant uterus of
diabetic mice: effect of maternal immunopotentiation. Am J Reprod Immunol. 46:161-
168.
Fent K, Weston AA, Caminada D. 2006. Ecotoxicology of human pharmaceuticals.
Aquat Toxicol. 76:122–159.
Finnell RH, Bennett GD, Slattery JT, Amore BM, Bajpai M, Levy RH. 1995. Effect of
treatment with phenobarbital and stiripentol on carbamazepine-induced teratogenicity and
reactive metabolite formation. Teratology. 52(6):324-32.
Finnell RH, Gould A, Spiegelstein O. 2003. Pathobiology and genetics of neural tube
defects. Epilepsia. 44(Suppl3):14-23.
Focazio MJ, Kolpin DW, Barnes KK, Furlong ET, Meyer MT, Zaugg SD, Barber LB,
Thurman ME. 2008. A national reconnaissance for pharmaceuticals and other organic
wastewater contaminants in the United States--II) Untreated drinking water sources. Sci
Total Environ. 402:201-216.
George EL, Georges-Labouesse EN, Patel-King RS, Rayburn H, Hynes RO. 1993.
Defects in mesoderm, neural tube and vascular development in mouse embryos lacking
fibronectin. Development. 119(4):1079-91.
Gibson JE, Becker BA. 1968. Effect of phenobarbital and SKF 525-A on the
teratogenicity of cyclophosphamide in mice. Teratology. 1(4):393-8.
Glassmeyer ST, Hinchey EK, Boehme SE, Daughton CG, Ruhoy IS, Conerly O, Daniels
RL, Lauer L, McCarthy M, Nettesheim TG, Sykes K, Thompson VG. 2009. Disposal
practices for unwanted residential medications in the United States. Environ Int. 35:566–
572.
Golalipour MJ, Mansourian AR, Keshtkar A. 2006. Serum zinc levels in newborns with
neural tube defects. Indian Pediatr. 43(9):809-12.
Gorivodsky M, Torchinsky A, Zemliak I, Savion S, Fein A, Toder V. 1999. TGF beta 2
mRNA expression and pregnancy failure in mice. Am J Reprod Immunol. 42:124-133.
Greenaway JC, Fantel AG, Shepard TH, Juchau MR. 1982. The in vitro teratogenicity of
cyclophosphamide in rat embryos. Teratology. 25(3):335-43.
Greene ND, Copp AJ. 2005. Mouse models of neural tube defects: investigating
preventive mechanisms. Am J Med Genet C Semin Med Genet. 135C(1):31-41.
Greene ND, Massa V, Copp AJ. 2009. Understanding the causes and prevention of neural
tube defects: Insights from the splotch mouse model. Birth Defects Res A Clin Mol
Teratol. 85(4):322-30.

131
Gurvich N, Berman MG, Wittner BS, Gentleman RC, Klein PS, Green JB. 2005.
Association of valproate-induced teratogenesis with histone deacetylase inhibition in
vivo. FASEB J. 19:1166-1168.
Gutierrez JC, Prater MR, Smith BJ, Freeman LE, Mallela MK, Holladay SD. 2009.
Late-gestation ventricular myocardial reduction in fetuses of hyperglycemic CD1 mice is
associated with increased apoptosis. Birth Defects Res B Dev Reprod Toxicol. 86(5):409-
15.
Hales BF. 1981. Modification of the mutagenicity and teratogenicity of
cyclophosphamide in rats with inducers of the cytochromes P-450. Teratology. 24(1):1-
11.
Halwachs S, Schäfer I, Seibel P, Honscha W. 2009. Antiepileptic drugs reduce efficacy
of methotrexate chemotherapy by downregulation of Reduced folate carrier transport
activity. Leukemia. 23(6):1087-97.
Harris MJ, Juriloff DM. 1999. Mini-review: Toward understanding mechanisms of
genetic neural tube defects in mice. Teratology. 60:292–305.
Harris MJ, Juriloff DM. 2005. Maternal diet alters excencephaly frequency in SELH/Bc
strain mouse embryos. Birth Defects Res A Clin Mol Teratol. 73:532–540.
Harris MJ, Juriloff DM. 2007. Mouse mutants with neural tube closure defects and their
role in understanding human neural tube defects. Birth Defects Res A. Clin Mol Teratol.
79(3):187-210.
He W, Wang Y, Zhang MZ, You L, Davis LS, Fan H, Yang HC, Fogo AB, Zent R,
Harris RC, Breyer MD, Hao CM. 2010. Sirt1 activation protects the mouse renal medulla
from oxidative injury. J Clin Invest. 120(4):1056-68.
Herkert B, Dwertmann A, Herold S, Abed M, Naud JF, Finkernagel F, Harms GS, Orian
A, Wanzel M, Eilers M. 2010. The Arf tumor suppressor protein inhibits Miz1 to
suppress cell adhesion and induce apoptosis. J Cell Biol. 188(6):905-18.
Hinck L, Thissen JP, De Hertogh R. 2003. Identification of caspase-6 in rat blastocysts
and its implication in the induction of apoptosis by high glucose. Biol Reprod.
68(5):1808-12.
Holladay SD, Sharova L, Smith BJ, Gogal RM, Jr., Ward DL, Blaylock BL. 2000.
Nonspecific stimulation of the maternal immune system. I. Effects on teratogen-induced
fetal malformations. Teratology. 62:413-419.
Holladay SD, Sharova LV, Punareewattana K, Hrubec TC, Gogal RM, Jr., Prater MR,
Sharov AA. 2002. Maternal immune stimulation in mice decreases fetal malformations
caused by teratogens. Int Immunopharmacol. 2:325-332.

132
Hrubec TC, Prater MR, Toops KA, Holladay SD. 2006. Reduction in diabetes-induced
craniofacial defects by maternal immune stimulation. Birth Defects Res B Dev Reprod
Toxicol. 77(1):1-9.
Hrubec TC, Toops KA, Holladay SD. 2009. Modulation of diabetes-induced palate
defects by maternal immune stimulation. Anat Rec. 292(2):271-6.
Hrubec TC, Yan M, Ye K, Salafia CM, Holladay SD. 2006. Valproic acid-induced fetal
malformations are reduced by maternal immune stimulation with granulocyte-
macrophage colony-stimulating factor or interferon. Anat Rec A Discov Mol Cell Evol
Biol. 288(12):1303-1309.
Hsu CY, Chang NC, Lee MW, Lee KH, Sun DS, Lai C, Chang AC. 2008. LUZP
deficiency affects neural tube closure during brain development. Biochem Biophys Res
Commun. 376(3):466-71.
Hsu H, Xiong J, Goeddel DV. 1995. The TNF receptor 1-associated protein TRADD
signals cell death and NF-kappa B activation. Cell. 81(4):495-504.
Hunter ES III, Blanton MR, Rogers EH, Leonard Mole M, Andrews J, Chernoff N. 2006.
Short-term exposures to dihaloacetic acids produce dysmorphogenesis in mouse
conceptuses in vitro. Reprod Toxicol. 22:443–448.
Hunter ES III, Rogers EH, Schmid JE, Richard A. 1996. Comparative effects of
haloacetic acids in whole embryo culture. Teratology. 54:57–64.
Huang L, Min JN, Masters S, Mivechi NF, Moskophidis D. 2007. Insights into function
and regulation of small heat shock protein 25 (HSPB1) in a mouse model with targeted
gene disruption. Genesis. 45(8):487-501.
Hubaux R, Vandermeers F, Crisanti MC, Kapoor V, Burny A, Mascaux C, Albelda SM,
Willems L. 2010. Preclinical evidence for a beneficial impact of valproate on the
response of small cell lung cancer to first-line chemotherapy. Eur J Cancer. 46(9):1724 -
34.
Hwang B-F, Magnus P, Jaakkola JJK. 2002. Risk of specific birth defects in relation to
chlorination and the amount of natural organic matter in the water supply. Am J
Epidemiol. 156:374–382.
Hynes RO, Yamada KM. 1982. Fibronectins: multifunctional modular glycoproteins. J
Cell Biol. 95(2 Pt 1):369-77.
Iacomino G, Medici MC, Russo GL. 2008. Valproic acid sensitizes K562
erythroleukemia cells to TRAIL/Apo2L-induced apoptosis. Anticancer Res. 28(2A):855-
64.
Ikeda A, Ikeda S, Gridley T, Nishina PM, Naggert JK. 2001. Neural tube defects and
neuroepithelial cell death in Tulp3 knockout mice. Hum Mol Genet. 10(12):1325-34.

133
Inohara N, Koseki T, Chen S, Wu X, Núñez G. 1998. CIDE, a novel family of cell death
activators with homology to the 45 kDa subunit of the DNA fragmentation factor. EMBO
J. 17(9):2526-33.
Ivnitsky I, Torchinsky A, Gorivodsky M, Zemliak I, Orenstein H, Savion S,
Shepshelovich J, Carp H, Fein A, Toder V. 1998. TNF-alpha expression in embryos
exposed to a teratogen. Am J Reprod Immunol. 40:431-440.
Jentink J, Loane MA, Dolk H, Barisic I, Garne E, Morris JK, de Jong-van den Berg LT.
2010. Valproic acid monotherapy in pregnancy and major congenital malformations. N
Engl J Med. 362(23):2185-93.
Jergil M, Kultima K, Gustafson AL, Dencker L, Stigson M. 2009. Valproic acid-induced
deregulation in vitro of genes associated in vivo with neural tube defects. Toxicol Sci.
108(1):132-48.
Jiang B, Kumar SD, Loh WT, Manikandan J, Ling EA, Tay SS, Dheen ST. 2008. Global
gene expression analysis of cranial neural tubes in embryos of diabetic mice. J Neurosci
Res. 86(16):3481-93.
Jin Z, El-Deiry WS. 2005. Overview of cell death signaling pathways. Cancer Biol Ther.
4(2):139-63.
Johannessen CU, Johannessen SI. 2003. Valproate: Past, present, and future. CNS Drug
Rev. 9:199-216.
Kawasaki H, Onuki R, Suyama E, Taira K. 2002. Identification of genes that function
in the TNF-alpha-mediated apoptotic pathway using randomized hybrid ribozyme
libraries. Nat Biotechnol. (4):376-80.
Khaksary Mahabady M, Ranjbar R, Arzi A, Papahn AA, Najafzadeh H. 2006. A
comparison study of effects of Echinacea extract and levamisole on phenytoin-induced
cleft palate in mice. Regul Toxicol Pharmacol. 46(3):163-6.
Kim AH, Khursigara G, Sun X, Franke TF, Chao MV. 2001. Akt phosphorylates and
negatively regulates apoptosis signal-regulating kinase 1. Mol Cell Biol. 21(3):893-901.
Kishigami S, Mishina Y. 2005. BMP signaling and early embryonic patterning. Cytokine
Growth Factor Rev. 16(3):265-78.
Kisseberth WC, Murahari S, London CA, Kulp SK, Chen CS. 2008. Evaluation of the
effects of histone deacetylase inhibitors on cells from canine cancer cell lines. Am J Vet
Res. 69(7):938-45.
Klotz JB, Pyrch LA. 1999. Neural tube defects and drinking water disinfection by-
products. Epidemiology. 10(4):383-90.

134
Kolpin DW, Furlong ET, Meyer MT, Thurman EM, Zaugg SD, Barber LB, Buxton HT.
2002. Pharmaceuticals, hormones, and other organic wastewater contaminants in US
streams, 1999–2000: A national reconnaissance. Environ Sci Technol. 36:1202–1211.
Kosaka N, Kodama M, Sasaki H, Yamamoto Y, Takeshita F, Takahama Y, Sakamoto H,
Kato T, Terada M, Ochiya T. 2006. FGF-4 regulates neural progenitor cell proliferation
and neuronal differentiation. FASEB J. 20(9):1484-5.
Kostrouchova M, Kostrouch Z, Kostrouchova M. 2007. Valproic acid, a molecular lead
to multiple regulatory pathways. Folia Biol (Praha). 53:37-49.
Koz ST, Gouwy NT, Demir N, Nedzvetsky VS, Etem E, Baydas G. 2010. Effects of
maternal hyperhomocysteinemia induced by methionine intake on oxidative stress and
apoptosis in pup rat brain. Int J Dev Neurosci. 28(4):325-9.
Kramer MD, Lynch CF, Isacson P, Hanson JW. 1992. The association of waterborne
chloroform with intrauterine growth retardation. Epidemiology. 3(5):407-13.
Kubli DA, Quinsay MN, Huang C, Lee Y, Gustafsson AB. 2008. Bnip3 Functions as a
Mitochondrial Sensor of Oxidative Stress during Myocardial Ischemia and Reperfusion.
Am J Physiol Heart Circ Physiol. 295(5):H2025-31.
Kultima K, Nystrom AM, Scholz B, Gustafson AL, Dencker L, Stigson M. 2004.
Valproic acid teratogenicity: A toxicogenomics approach. Environ Health Perspect.
112:1225-1235.
Lademann U, Kallunki T, Jäättelä M. 2001. A20 zinc finger protein inhibits TNF-induced
apoptosis and stress response early in the signaling cascades and independently of
binding to TRAF2 or 14-3-3 proteins. Cell Death Differ. 8(3):265-72.
Latorre AO, Hueza IM, Gorniak SL. 2007. Association of Ipomoea carnea and BCG
reduces birth defects caused by cyclophosphamide in rats. Life Sci. 80:430-435.
Laudermilch CL, Holladay SD, Sponenberg DP, Saunders GK, Ward DL, Prater MR.
2005. Placental improvement and reduced distal limb defects by maternal interferon-
gamma injection in methylnitrosourea-exposed mice. Birth Defects Res A Clin Mol
Teratol. 73(9):597-604.
LaVallee TM, Prudovsky IA, McMahon GA, Hu X, Maciag T. 1998. Activation of the
MAP kinase pathway by FGF-1 correlates with cell proliferation induction while
activation of the Src pathway correlates with migration. J Cell Biol. 141(7):1647-58.
Lee JY, Bowden DS. 2000. Rubella virus replication and links to teratogenicity. Clin
Microbiol Rev. 13(4):571-87.
Lemos MC, Harding B, Reed AA, Jeyabalan J, Walls GV, Bowl MR, Sharpe J, Wedden
S, Moss JE, Ross A, Davidson D, Thakker RV. 2009. Genetic background influences

135
embryonic lethality and the occurrence of neural tube defects in Men1 null mice:
Relevance to genetic modifiers. J Endocrinol. 203:133–142.
Levy RR, Cordonier H, Czyba JC, Guerin JF. 2001. Apoptosis in preimplantation
mammalian embryo and genetics. Ital J Anat Embryol. 106(2 Suppl 2):101-8.
Li Y, Chen X, Zhao X, Hu B. 1999. Relationship between homocysteine-induced
apoptosis and teratogenesis in developing avian embryo. Wei Sheng Yan Jiu. 28(5):275-
8.
Li Y, Pan Y, Zhu H. 1998. Relation between methylmercury chloride-induced
programmed cell death and the development of nervous system in rats. Wei Sheng Yan
Jiu. 27(4):241-4.
Li Y, Yu Z, Zhu H. 1998. Role of programmed cell death in mediating arsenic-induced
rat embryo anomalies. Wei Sheng Yan Jiu. 27(2):91-4.
Liem KF Jr, Jessell TM, Briscoe J. 2000. Regulation of the neural patterning activity of
sonic hedgehog by secreted BMP inhibitors expressed by notochord and somites.
Development. 127(22):4855-66.
Little SA, Kim WK, Mirkes PE. 2003. Teratogen-induced activation of caspase-6 and
caspase-7 in early postimplantation mouse embryos. Cell Biol Toxicol. 19(4):215-26.
Little SA, Mirkes PE. 2002. Teratogen-induced activation of caspase-9 and the
mitochondrial apoptotic pathway in early postimplantation mouse embryos. Toxicol
Appl Pharmacol. 181(2):142-51.
Loeken MR. 2006. Advances in understanding the molecular causes of diabetes-induced
birth defects. J Soc Gynecol Investig. 13(1):2-10.
Loeken MR. 2005. Current perspectives on the causes of neural tube defects resulting
from diabetic pregnancy. Am J Med Genet C Semin Med Genet. 135C(1):77-87.
Logan CY, Nusse R. 2004. The Wnt signaling pathway in development and disease.
Annu Rev Cell Dev Biol. 20:781-810.
Maddika S, Ande SR, Panigrahi S, Paranjothy T, Weglarczyk K, Zuse A, Eshraghi M,
Manda KD, Wiechec E, Los M. 2007. Cell survival, cell death and cell cycle pathways
are interconnected: implications for cancer therapy. Drug Resist Updat. 10(1-2):13-29.
Manassaram DM, Backer LC, Moll DM. 2007. A review of nitrates in drinking water:
Maternal exposure and adverse reproductive and developmental outcomes. Cien Saude
Colet. 12:153-163.
Marasas WF, Riley RT, Hendricks KA, Stevens VL, Sadler TW, Gelineau-van Waes J,
Missmer SA, Cabrera J, Torres O, Gelderblom WC, Allegood J, Martinez C, Maddox J,
Miller JD, Starr L, Sullards MC, Roman AV, Voss KA, Wang E, Merrill AH Jr. 2004.

136
Fumonisins disrupt sphingolipid metabolism, folate transport, and neural tube
development in embryo culture and in vivo: A potential risk factor for human neural tube
defects among populations consuming fumonisin-contaminated maize. J Nutr. 134:711–
716.
Marks TA, Ledoux TA, Moore JA. 1982. Teratogenicity of a commercial xylene mixture
in the mouse. J Toxicol Environ Health A. 9:97–105.
Massa V, Savery D, Ybot-Gonzalez P, Ferraro E, Rongvaux A, Cecconi F, Flavell R,
Greene ND, Copp AJ. 2009. Apoptosis is not required for mammalian neural tube
closure. Proc Natl Acad Sci. 106(20):8233-8.
Mayanil CS, Pool A, Nakazaki H, Reddy AC, Mania-Farnell B, Yun B, George D,
McLone DG, Bremer EG. 2006. Regulation of murine TGFbeta2 by Pax3 during early
embryonic development. J Biol Chem. 281:24544-24552.
Meier P, Finch A, Evan G. 2000. Apoptosis in development. Nature. 407:796-801.
Menegola E, Di Renzo F, Broccia ML, Giavini E. 2006. Inhibition of histone deacetylase
as a new mechanism of teratogenesis. Birth Defects Res C Embryo Today. 78:345-353.
Menegola E, Di Renzo F, Broccia ML, Prudenziati M, Minucci S, Massa V, Giavini E.
2005. Inhibition of histone deacetylase activity on specific embryonic tissues as a new
mechanism for teratogenicity. Birth Defects Res B Dev Reprod Toxicol. 74:392-398.
Miranda ML, Kim D, Hull AP, Paul CJ, Galeano MA. 2007. Changes in blood lead levels
associated with use of chloramines in water treatment systems. Environ Health Perspect.
115:221-225.
Mirkes PE, Little SA. 1998. Teratogen-induced cell death in postimplantation mouse
embryos: Differential tissue sensitivity and hallmarks of apoptosis. Cell Death Differ.
5(7):592-600.
Morgan SC, Relaix F, Sandell LL, Loeken MR. 2008. Oxidative stress during diabetic
pregnancy disrupts cardiac neural crest migration and causes outflow tract defects. Birth
Defects Res A Clin Mol Teratol. 82(6):453-63.
Mosley BS, Cleves MA, Siega-Riz AM, Shaw GM, Canfield MA, Waller DK, Werler
MM, Hobbs CA; National Birth Defects Prevention Study. 2009. Neural tube defects and
maternal folate intake among pregnancies conceived after folic acid fortification in the
United States. Am J Epidemiol. 169(1):9-17.
Munger R, Isacson P, Hu S, Burns T, Hanson J, Lynch CF, Cherryholmes K, Van Dorpe
P, Hausler WJ Jr. 1997. Intrauterine growth retardation in Iowa communities with
herbicide contaminated drinking water supplies. Environ Health Perspect. 105:308–314.

137
Nau H, Hauck RS, Ehlers K. 1991. Valproic acid-induced neural tube defects in mouse
and human: Aspects of chirality, alternative drug development, pharmacokinetics and
possible mechanisms. Pharmacol Toxicol. 69:310-321.
Nieuwenhuijsen MJ, Toledano MB, Bennett J, Best N, Hambly P, de Hoogh C, Wellesley
D, Boyd PA, Abramsky L, Dattani N, Fawell J, Briggs D, Jarup L, Elliott P. 2008.
Chlorination disinfection by-products and risk of congenital anomalies in England and
Wales. Environ Health Perspect. 116:216-222.
Nishioka T, Miyai Y, Haga H, Kawabata K, Shirato H, Homma A, Shibata K, Yasuda M.
2009. Novel function of transcription factor ATF5: Blockade of p53-dependent apoptosis
induced by ionizing irradiation. Cell Struct Funct. 34(1):17-22.
Nomura T, Hata S, Kusafuka T. 1990. Suppression of developmental anomalies by
maternal macrophages in mice. J Exp Med. 172: 1325-1330.
Ochoa-Acun˜a H, Frankenberger J, Hahn L, Carbajo C. 2009. Drinking-water herbicide
exposure in Indiana and prevalence of small-for-gestational-age and preterm delivery.
Environ Health Perspect. 117:1619–1624.
Ogawa T, Kuwagata M, Ruiz J, Zhou FC. 2005. Differential teratogenic effect of alcohol
on embryonic development between C57BL/6 and DBA/2 mice: A new view. Alcohol
Clin Exp Res. 29:855–863.
Okada A, Noyori H, Yagen B, Shimshoni JA, Bialer M, Fujiwara M. 2009.
Anticonvulsant profile and teratogenic evaluation of potent new analogues of a valproic
acid urea derivative in NMRI mice. Birth Defects Res B Dev Reprod Toxicol. 86(5):394-
401.
Okada A, Aoki Y, Kushima K, Kurihara H, Bialer M, Fujiwara M. 2004. Polycomb
homologs are involved in teratogenicity of valproic acid in mice. Birth Defects Res A
Clin Mol Teratol. 70(11):870-9.
Okada A, Kushima K, Aoki Y, Bialer M, Fujiwara M. 2005. Identification of early-
responsive genes correlated to valproic acid-induced neural tube defects in mice. Birth
Defects Res A Clin Mol Teratol. 73:229-238.
Osterhues A, Holzgreve W, Michels KB. 2009. Shall we put the world on folate? Lancet.
374 (9694):959-61.
Oyama K, Sugimura Y, Murase T, Uchida A, Hayasaka S, Oiso Y, Murata Y. 2009. Folic
acid prevents congenital malformations in the offspring of diabetic mice. Endocr J.
56(1):29-37.
Ozolins TR. 2010. Cyclophosphamide and the Teratology Society: An awkward
marriage. Birth Defects Res B Dev Reprod Toxicol. 89(4):289-99.
138
Padmanabhan R. 2006. Etiology, pathogenesis and prevention of neural tube defects.
Congenit Anom (Kyoto). 46(2):55-67.
Padmanabhan R. 1987. Abnormalities of the ear associated with exencephaly in mouse
fetuses induced by maternal exposure to cadmium. Teratology. 35(1):9-18.
Pani L, Horal M, Loeken MR. 2002. Rescue of neural tube defects in Pax-3-deficient
embryos by p53 loss of function: Implications for Pax-3- dependent development and
tumorigenesis. Genes Dev. 16:676-680.
Papi A, Ferreri AM, Rocchi P, Guerra F, Orlandi M. 2010. Epigenetic modifiers as
anticancer drugs: Effectiveness of valproic acid in neural crest-derived tumor cells.
Anticancer Res. 30(2):535-40.
Peck B, Chen CY, Ho KK, Di Fruscia P, Myatt SS, Coombes RC, Fuchter MJ, Hsiao CD,
Lam EW. 2010. SIRT inhibitors induce cell death and p53 acetylation through targeting
both SIRT1 and SIRT2. Mol Cancer Ther. (In press).
Pekar O, Molotski N, Savion S, Fein A, Toder V, Torchinsky A. 2007. p53 regulates
cyclophosphamide teratogenesis by controlling caspases 3, 8, 9 activation and NF-
kappaB DNA binding. Reproduction. 134(2):379-88.
Pei XY, Dai Y, Grant S. 2004. Synergistic induction of oxidative injury and apoptosis in
human multiple myeloma cells by the proteasome inhibitor bortezomib and histone
deacetylase inhibitors. Clin Cancer Res. 10(11):3839-52.
Phelan SA, Ito M, Loeken MR. 1997. Neural tube defects in embryos of diabetic mice:
role of the Pax-3 gene and apoptosis. Diabetes. 46:1189-1197.
Prater MR, Zimmerman KL, Ward DL, Holladay SD. 2004. Reduced birth defects caused
by maternal immune stimulation in methylnitrosourea-exposed mice: Association with
placental improvement. Birth Defects Res A Clin Mol Teratol. 70:862-869.
Przyborski SA, Damjanov I, Knowles BB, Ackerman SL. 1998. Differential expression
of the zinc finger gene TCF17 in testicular tumors. Cancer Res. 58(20):4598-601.
Pu P, Zhang Z, Kang C, Jiang R, Jia Z, Wang G, Jiang H. 2009. Downregulation of Wnt2
and beta-catenin by siRNA suppresses malignant glioma cell growth. Cancer Gene Ther.
16(4):351-61.
Punareewattana K, Gogal RM, Jr., Sharova LV, Ward DL, Holladay SD. 2005. Reduced
birth defects caused by maternal immune stimulation in diabetic ICR mice: lack of
correlation with placental gene expression. Immunol Invest. 34:71-89.
Punareewattana K, Holladay SD. 2004. Immunostimulation by complete Freund's
adjuvant, granulocyte macrophage colony-stimulating factor, or interferon-gamma

139
reduces severity of diabetic embryopathy in ICR mice. Birth Defects Res A Clin Mol
Teratol. 70:20-27.
Punareewattana K, Sharova LV, Li W, Ward DL, Holladay SD. 2003. Reduced birth
defects caused by maternal immune stimulation may involve increased expression of
growth promoting genes and cytokine GM-CSF in the spleen of diabetic ICR mice. Int
Immunopharmacol. 3:1639-1655.
Punareewattana K, Smith BJ, Blaylock BL, Longstreth J, Snodgrass HL, Gogal RM, Jr.,
Prater RM, Holladay SD. 2001. Topical permethrin exposure inhibits antibody
production and macrophage function in C57Bl/6N mice. Food Chem Toxicol. 39:133-
139.
Rice G, Teuschler LK, Speth TF, Richardson SD, Miltner RJ, Schenck KM, Gennings C,
Hunter ES III, Narotsky MG, Simmons JE. 2008. Integrated disinfection by-products
research: Assessing reproductive and developmental risks posed by complex disinfection
by-product mixtures. J Toxicol Environ Health A. 71:1222–1234.
Richardson SD, Plewa MJ, Wagner ED, Schoeny R, Demarini DM. 2007. Occurrence,
genotoxicity, and carcinogenicity of regulated and emerging disinfection by-products in
drinking water: A review and roadmap for research. Mutat Res. 636:178–242.
Richardson SD, Thruston AD Jr, Krasner SW, Weinberg HS, Miltner RJ, Schenck KM,
Narotsky MG, McKague AB, Simmons JE. 2008. Integrated disinfection by-products
mixtures research:Comprehensive characterization of water concentrates prepared from
chlorinated and ozonated/postchlorinated drinking water. J Toxicol Environ Health A.
71:1165–1186.
Robinson JF, Yu X, Hong S, Griffith WC, Beyer R, Kim E, Faustman EM. 2009.
Cadmium-induced differential toxicogenomic response in resistant and sensitive mouse
strains undergoing neurulation. Toxicol Sci. 107(1):206-19.
Rodriguez JM, Glozak MA, Ma Y, Cress WD. 2006. Bok, Bcl-2-related ovarian killer, is
cell cycle-regulated and sensitizes to stress-induced apoptosis. J Biol Chem.
281(32):22729-35.
Rowe BL, Toccalino PL, Moran MJ, Zogorski JS, Price CV. 2007. Occurrence and
potential human-health relevance of volatile organic compounds in drinking water from
domestic wells in the United States. Environ Health Perspect. 115(11):1539-46.
Ruland J, Duncan GS, Elia A, del Barco Barrantes I, Nguyen L, Plyte S, Millar DG,
Bouchard D, Wakeham A, Ohashi PS, Mak TW. 2001. Bcl10 is a positive regulator of
antigen receptor-induced activation of NF-kappaB and neural tube closure. Cell.
104(1):33-42.

140
Sabapathy K, Jochum W, Hochedlinger K, Chang L, Karin M, Wagner EF. 1999.
Defective neural tube morphogenesis and altered apoptosis in the absence of both JNK1
and JNK2. Mechanisms of Development. 89:115-124.
Sadler TW. 2005. Embryology of neural tube development. Am J Med Genet C Semin
Med Genet. 135C:2–8.
Saillenfait AM, Gallissot F, Morel G, Bonnet P. 2003. Developmental toxicities of
ethylbenzene, ortho-, meta-, para-xylene and technical xylene in rats following inhalation
exposure. Food Chem Toxicol. 41:415–429.
Sarkar SA, Sharma RP. 2002. Expression of c-Myc and other apoptosis-related genes in
Swiss Webster mouse fetuses after maternal exposure to all trans-retinoic acid. Reprod
Toxicol. 16(3):245-52.
Savion S, Aroch I, Mammon K, Orenstein H, Fein A, Torchinsky A, Toder V. 2009.
Effect of maternal immunopotentiation on apoptosis-associated molecules expression in
teratogen-treated embryos. Am J Reprod Immunol. 62(6):400-11.
Savion S, Kamshitsky-Feldman A, Ivnitsky I, Orenstein H, Shepshelovich J, Carp H,
Fein A, Torchinsky A, Toder V. 2003. Potentiation of the maternal immune system may
modify the apoptotic process in embryos exposed to developmental toxicants. Am J
Reprod Immunol. 49(1):30-41.
Schenck KM, Sivaganesan M, Rice GE. 2009. Correlations of water quality parameters
with mutagenicity of chlorinated drinking water samples. J Toxicol Environ Health A.
72:461–467.
Schluter G. 1973. Ultrastructural observations on cell necrosis during formation of the
neural tube in mouse embryos. Z Anat Entwickl-Gesch. 141:251–264
Schwarzenbach RP, Escher BI, Fenner K, Hofstetter TB, Johnson CA, von Gunten U,
Wehrli B. 2006. The challenge of micropollutants in aquatic systems. Science. 313:1072–
1077.
Seller MJ, Perkins-Cole KJ. 1987. Hyperthermia and neural tube defects of the curly-tail
mouse. J Craniofac Genet Dev Biol. 7(4):321-30.
Sharova LV, Sharov AA, Sura P, Gogal RM, Smith BJ, Holladay SD. 2003. Maternal
immune stimulation reduces both placental morphologic damage and down-regulated
placental growth-factor and cell cycle gene expression caused by urethane: are these
events related to reduced teratogenesis? Int Immunopharmacol. 3(7):945-55.
Sharova LV, Gogal RM, Jr., Sharov AA, Chrisman MV, Holladay SD. 2002. Immune
stimulation in urethane-exposed pregnant mice increases expression level of spleen
leukocyte genes for TGFbeta3 GM-CSF and other cytokines that may play a role in
reduced chemical-induced birth defects. Int Immunopharmacol. 2:1477-1489.

141
Sharova L, Sura P, Smith BJ, Gogal RM, Jr., Sharov AA, Ward DL, Holladay SD. 2000.
Nonspecific stimulation of the maternal immune system. II. Effects on gene expression in
the fetus. Teratology. 62:420-428.
Shi Y, He B, Kuchenbecker KM, You L, Xu Z, Mikami I, Yagui-Beltran A, Clement G,
Lin YC, Okamoto J, Bravo DT, Jablons DM. 2007. Inhibition of Wnt-2 and galectin-3
synergistically destabilizes beta-catenin and induces apoptosis in human colorectal cancer
cells. Int J Cancer. 121(6):1175-81.
Shi YB, Li Q, Damjanovski S, Amano T, Ishizuya-Oka A. 1998. Regulation of apoptosis
during development: input from the extracellular matrix (review). Int J Mol Med.
2(3):273-82.
Shim M, Foley J, Anna C, Mishina Y, Eling T. 2010. Embryonic expression of
cyclooxygenase-2 causes malformations in axial skeleton. J Biol Chem. 285(21):16206-
17.
Shimshoni JA, Bialer M, Wlodarczyk B, Finnell RH, Yagen B. 2007. Potent
anticonvulsant urea derivatives of constitutional isomers of valproic acid. J Med Chem.
50(25):6419-27.
Shiota K, Shionoya Y, Ide M, Uenobe F, Kuwahara C, Fukui Y. 1988. Teratogenic
interaction of ethanol and hyperthermia in mice. Proc Soc Exp Biol Med. 187(2):142-8.
Shirane M, Ogawa M, Motoyama J, Nakayama KI. 2008. Regulation of apoptosis and
neurite extension by FKBP38 is required for neural tube formation in the mouse. Genes
Cells. 13(6):635-51.
Singh AP, Castranio T, Scott G, Guo D, Harris MA, Ray M, Harris SE, Mishina Y. 2008.
Influences of reduced expression of maternal bone morphogenetic protein 2 on mouse
embryonic development. Sex Dev. 2(3):134-41.
Singh G, Sinha N, Koushik C J, Mathur SK, Srivastava S. 2005. Detecting role of
apoptosis in mediating cyclophosphamide induced teratogenesis in vitro. Toxicol Mech
Methods. 15(6):391-7.
Singh G, Sinha N, Mahipag SN. 2009. Role of apoptosis in mediating salicylic acid-
induced teratogenesis in vitro. Toxicol Mech Methods. 19(2):161-8.
Singh G, Sinha N. 2010. Involvement of apoptosis in mediating mitomycin C-induced
teratogenesis in vitro. Toxicol Mech Methods. 20(4):190-6.
Singh S, Greene RM, Pisano MM. 2010. Arsenate-induced apoptosis in murine
embryonic maxillary mesenchymal cells via mitochondrial-mediated oxidative injury.
Birth Defects Res A Clin Mol Teratol. 88(1):25-34.
Smith MK, Randall JL, Read EJ, Stober JA. 1989. Teratogenic activity of trichloroacetic
acid in the rat. Teratology. 40:445-451.

142
Snyder SA, Benotti MJ. 2010. Endocrine disruptors and pharmaceuticals: Implications
for water sustainability. Water Sci Technol. 61:145–154.
Srinivas M, Gupta DK, Rathi SS, Grover JK, Vats V, Sharma JD, Mitra DK. 2001.
Association between lower hair zinc levels and neural tube defects. Indian J Pediatr.
68(6):519-22.
Stackelberg PE, Furlong ET, Meyer MT, Zaugg SD, Henderson AK, Reissman DB.
2004. Persistence of pharmaceutical compounds and other organic wastewater
contaminants in a conventional drinking-water-treatment plant. Science Total Environ.
329:99–113.
Stackelberg PE, Gibs J, Furlong ET, Meyer MT, Zaugg SD, Lippincott RL. 2007.
Efficiency of conventional drinking-water treatment processes in removal of
pharmaceuticals and other organic compounds. Science Total Environ. 377:255–272.
Stevens VL, Tang J. 1997. Fumonisin B1-induced sphingolipid depletion inhibits vitamin
uptake via the glycosylphosphatidylinositol-anchored folate receptor. J Biol Chem.
272(29):18020-5.
Stoate KL, Harris MJ, Juriloff DM. 2008. Accelerated embryonic development associated
with increased risk of neural tube defects induced by maternal diet in offspring of
SELH/Bc mice. Birth Defects Res A Clin Mol Teratol. 82:720–727.
Stodgell CJ, Ingram JL, O'Bara M, Tisdale BK, Nau H, Rodier PM. 2006. Induction of
the homeotic gene Hoxa1 through valproic acid's teratogenic mechanism of action.
Neurotoxicol Teratol. 28(5):617-24.
Sugimura Y, Murase T, Oyama K, Uchida A, Sato N, Hayasaka S, Kano Y, Takagishi Y,
Hayashi Y, Oiso Y, Murata Y. 2009. Prevention of neural tube defects by loss of function
of inducible nitric oxide synthase in fetuses of a mouse model of streptozotocin-induced
diabetes. Diabetologia. 52(5):962-71.
Sulik KK, Cook CS, Webster WS. 1988. Teratogens and craniofacial malformations:
relationships to cell death. Development. 103:213–232.
Thomadaki H, Talieri M, Scorilas A. 2007. Prognostic value of the apoptosis related
genes BCL2 and BCL2L12 in breast cancer. Cancer Lett. 247(1):48-55.
Thompson J, Hipwell E, Loo HV, Bannigan J. 2005. Effects of cadmium on cell death
and cell proliferation in chick embryos. Reprod Toxicol. 20(4):539-48.
Tiemann M. 2005. Lead in Drinking Water: Washington, DC, Issues and Broader
Regulatory Implications. Washington, DC:Congressional Research Service.
Toder V, Carp H, Fein A, Torchinsky A. 2002. The role of pro- and anti-apoptotic
molecular interactions in embryonic maldevelopment. Am J Reprod Immunol. 48(4):235-
44.

143
Toder V, Savion S, Gorivodsky M, Shepshelovich J, Zaslavsky Z, Fein A, Torchinsky A.
1996. Teratogen-induced apoptosis may be affected by immunopotentiation. J Reprod
Immunol. 30(2-3):173-85.
Torchinsky A, Fein A, Toder V. 2005. Teratogen-induced apoptotic cell death: does the
apoptotic machinery act as a protector of embryos exposed to teratogens? Birth Defects
Res C Embryo Today. 75(4):353-61.
Torchinsky A, Brokhman I, Shepshelovich J, Orenstein H, Savion S, Zaslavsky Z,
Koifman M, Dierenfeld H, Fein A, Toder V. 2003. Increased TNF-alpha expression in
cultured mouse embryos exposed to teratogenic concentrations of glucose. Reproduction.
125(4):527-34.
Torchinsky A, Savion S, Gorivodsky M, Shepshelovich J, Zaslavsky Z, Fein A, Toder V
1995. Cyclophosphamide-induced teratogenesis in ICR mice: The role of apoptosis.
Teratogen Carcinogen Mutagen. 15:179–190.
Tsuboi R, Sato Y, Rifkin DB. 1990. Correlation of cell migration, cell invasion, receptor
number, proteinase production, and basic fibroblast growth factor levels in endothelial
cells. J Cell Biol. 110(2):511-7.
United States-Environmental Protection Agency (US-EPA). 2008. Factoids: Drinking
Water and Ground Water Statistics for 2008. EPA 816-K-08-004.
van Gelder MM, van Rooij IA, Miller RK, Zielhuis GA, de Jong-van den Berg LT,
Roeleveld N. 2010. Teratogenic mechanisms of medical drugs. Hum Reprod Update.
16(4):378-94.
Villanueva CM, Durand G, Coutte´ MB, Chevrier C, Cordier S. 2005. Atrazine in
municipal drinking water and risk of low birth weight, preterm delivery, and small-for-
gestational-age status. Occup Environ Med. 62:400–405.
Voisard R, Krebs R, Baur R, Hombach V. 2010. Valproic acid inhibits proliferation of
human coronary vascular cells (SI/MPL-ratio: 0.5): A novel candidate for systemic and
local therapy of postinterventional restenosis. Coron Artery Dis. 21(5):286-91.
Wang J, Chen J. 2010. SIRT1 regulates autoacetylation and histone acetyltransferase
activity of TIP60. J Biol Chem. 285(15):11458-64.
Wang W, Xue L, Liu H, Wang P, Xu P, Cai Y. 2010. Aberrant changes of Wnt2/beta-
catenin signaling pathway induced by sodium nitroprusside in human esophageal
squamous cell carcinoma cell lines. Cancer Invest. 28(3):230-41.
Wei Y, Jiang J, Sun M, Chen X, Wang H, Gu J. 2006. ATF5 increases cisplatin-induced
apoptosis through up-regulation of cyclin D3 transcription in HeLa cells. Biochem
Biophys Res Commun. 339(2):591-6.

144
Wells PG, Winn LM. 1996. Biochemical toxicology of chemical teratogenesis. Crit Rev
Biochem Mol Biol. 31(1):1-40.
Wilkins-Haug L. 1997. Teratogen update: Toluene. Teratology. 55: 145–151.
Wiltse J. 2005. Mode of action: Inhibition of histone deacetylase, altering WNT-
dependent gene expression, and regulation of beta-catenin--developmental effects of
valproic acid. Crit Rev Toxicol 35:727-738.
Wlodarczyk BJ, Bennett GD, Calvin JA, Finnell RH. 1996. Arsenic-induced neural tube
defects in mice: Alterations in cell cycle gene expression. Reprod Toxicol. 10(6):447-54.
Wodarz A, Nusse R. 1998. Mechanisms of Wnt signaling in development. Annu Rev Cell
Dev Biol. 14:59-88.
Wong RL, Wlodarczyk BJ, Min KS, Scott ML, Kartiko S, Yu W, Merriweather MY,
Vogel P, Zambrowicz BP, Finnell RH. 2008. Mouse Fkbp8 activity is required to inhibit
cell death and establish dorso-ventral patterning in the posterior neural tube. Hum Mol
Genet. 17(4):587-601.
Wubah JA, Ibrahim MM, Gao X, Nguyen D, Pisano MM, Knudsen TB. 1996. Teratogen-
induced eye defects mediated by p53-dependent apoptosis. Curr Biol. 6(1):60-9.
Xiao R, Yu HL, Zhao HF, Liang J, Feng JF, Wang W. 2007. Developmental
neurotoxicity role of cyclophosphamide on post-neural tube closure of rodents in vitro
and in vivo. Int J Dev Neurosci. 25(8):531-7.
Yakovlev AG, Di Giovanni S, Wang G, Liu W, Stoica B, Faden AI. 2004. BOK and
NOXA are essential mediators of p53-dependent apoptosis. J Biol Chem. 279(27):28367-
74.
Yitzhakie D, Torchinsky A, Savion S, Toder V. 1999. Maternal immunopotentiation
affects the teratogenic response to hyperthermia. J Reprod Immunol. 45(1):49-66.
Yoshida H, Kong YY, Yoshida R, Elia AJ, Hakem A, Hakem R, Penninger JM, Mak
TW. 1998. Apaf1 is required for mitochondrial pathways of apoptosis and brain
development. Cell. 94(6):739-50.
You L, He B, Xu Z, Uematsu K, Mazieres J, Mikami I, Reguart N, Moody TW,
Kitajewski J, McCormick F, Jablons DM. 2004. Inhibition of Wnt-2-mediated signaling
induces programmed cell death in non-small-cell lung cancer cells. Oncogene.
23(36):6170-4.
Zabihi S, Loeken MR. 2010. Understanding diabetic teratogenesis: Where are we now
and where are we going? Birth Defects Res A Clin Mol Teratol. (In press).
Zgouras D, Becker U, Loitsch S, Stein J. 2004. Modulation of angiogenesis-related
protein synthesis by valproic acid. Biochem Biophys Res Commun. 316(3):693-7.

145
Zhang B, Wang X, Nazarali AJ. 2010. Ascorbic acid reverses valproic acid-induced
inhibition of hoxa2 and maintains glutathione homeostasis in mouse embryos in culture.
Cell Mol Neurobiol. 30(1):137-48.
Zhang Y, Adachi M, Kawamura R, 2006. Bmf is a possible mediator in histone
deacetylase inhibitors FK228 and CBHA-induced apoptosis. Cell Death Differ. 13:129–
140.
Zhang W, Ren AG, Pei LJ, Hao L, Ou YL, Zhong XY, Zhang FR, Diao CH, Luo WB,
Zhou LZ, Zhang ML, Li Z. 2005. A case control study on the relationship between trace
elements and human neural tube defects. Zhonghua Liu Xing Bing Xue Za Zhi.
26(10):772-6.
Zhao Q, Behringer RR, de Crombrugghe B. 1996. Prenatal folic acid treatment
suppresses acrania and meroanencephaly in mice mutant for the Cart1 homeobox gene.
Nat Genet. 13(3):275-83.
Zhao Y, Tan J, Zhuang L, 2005. Inhibitors of histone deacetylases target the Rb-E2F1
pathway for apoptosis induction through activation of proapoptotic protein. Bim. Proc
Natl Acad Sci. 102:16090–16095.
Zhao Z, Reece EA. 2005. Nicotine-induced embryonic malformations mediated by
apoptosis from increasing intracellular calcium and oxidative stress. Birth Defects Res B
Dev Reprod Toxicol. 74(5):383-91.

146
VII. APPENDIX
APPENDIX A. Functional Gene Grouping- Apoptotic pathways
TNF Ligand Family: Fasl (Tnfsf6), Tnf, Tnfsf10, Tnfsf12, Cd40lg, Cd70.
TNF Receptor Family: Fas (Tnfrsf6), Ltbr, Tnfrsf10b, Tnfrsf11b, Tnfrsf1a, Cd40.
Bcl-2 Family: Bad (Bbc2), Bag1, Bag3, Bak1, Bax, Bcl2, Bcl2l1, Bcl2l2, Bcl2l10, Bid, Bnip2,
Bnip3, Bnip3l, Bok, Mcl1.
Caspase Family: Casp1, Casp2, Casp3, Casp4, Casp6, Casp7, Casp8, Casp9, Casp12, Casp14.
IAP Family: Birc1a, Birc1b, Birc2, Birc3, Birc4, Birc5.
TRAF Family: Traf1, Traf2, Traf3.
CARD Family: Apaf1, Bcl10, Birc3, Birc4, Nod1, Card6, Card10, Casp1, Casp2, Casp4, Casp9,
Cradd, Nol3, Pycard (Asc), Ripk1.
Death Domain Family: Cradd, Dapk1, Fadd, Fas (Tnfrsf6), Ripk1, Tnfrsf10b (TRAIL-R),
Tnfrsf11b, Tnfrsf1a.
Death Effector Domain Family: Casp8, Cflar (Cash), Fadd.
CIDE Domain Family: Cidea, Cideb, Dffa, Dffb.
p53 and DNA Damage-Induced Apoptosis: Akt1, Apaf1, Bad (Bbc2), Bax, Bcl2, Bcl2l1, Bid,
Casp3, Casp6, Casp7, Casp9, Trp53 (p53), Trp53bp2, Trp53inp1, Trp63, Trp73.
Anti-Apoptosis: Akt1, Api5, Atf5, Bag1, Bag3, Bcl2, Bcl2l1, Bcl2l10, Bcl2l2, Birc1a, Birc1b,
Birc2, Birc3, Birc4, Birc5, Bnip2, Bnip3, Casp2, Cflar, Dad1, Tsc22d3, Fas (Tnfrsf6), Hells, Il10,
Lhx4, Mcl1, Nfkb1, Nme5, Pak7 (Arc), Pim2, Polb, Prdx2, Rnf7, Sphk2, Tnf, Cd40lg (CD40L),
Zc3hc1 (Nipa)
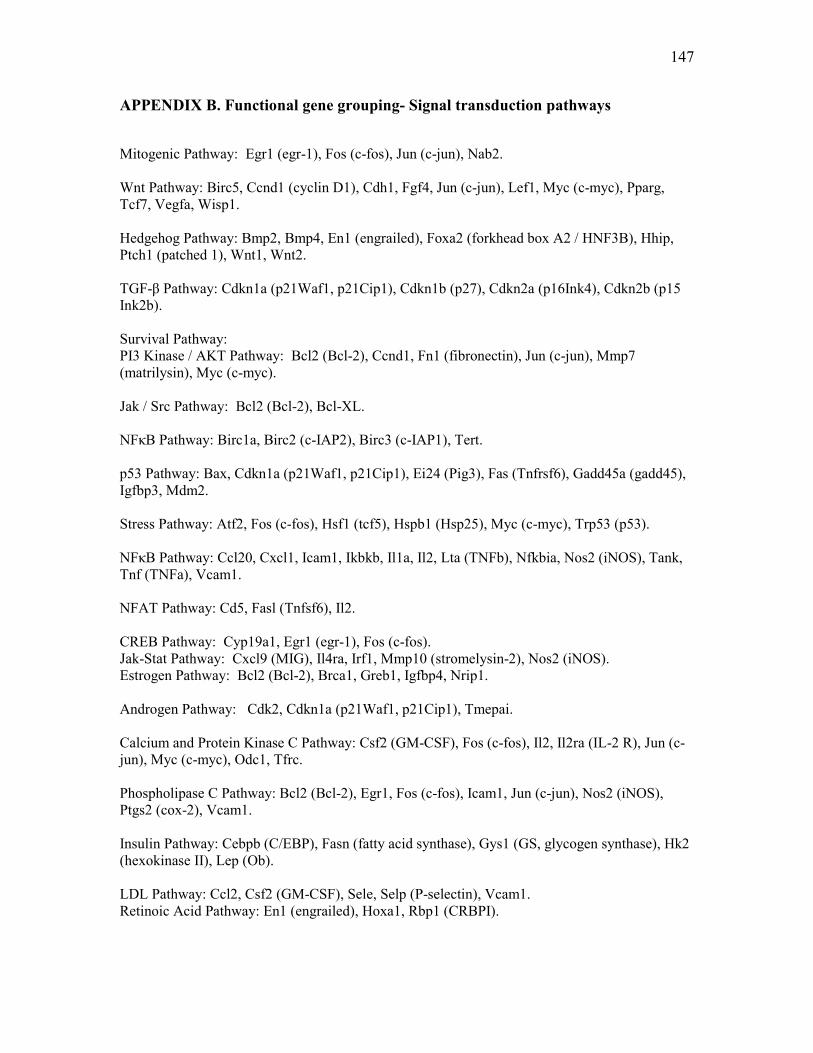
147
APPENDIX B. Functional gene grouping- Signal transduction pathways
Mitogenic Pathway: Egr1 (egr-1), Fos (c-fos), Jun (c-jun), Nab2.
Wnt Pathway: Birc5, Ccnd1 (cyclin D1), Cdh1, Fgf4, Jun (c-jun), Lef1, Myc (c-myc), Pparg,
Tcf7, Vegfa, Wisp1.
Hedgehog Pathway: Bmp2, Bmp4, En1 (engrailed), Foxa2 (forkhead box A2 / HNF3B), Hhip,
Ptch1 (patched 1), Wnt1, Wnt2.
TGF-β Pathway: Cdkn1a (p21Waf1, p21Cip1), Cdkn1b (p27), Cdkn2a (p16Ink4), Cdkn2b (p15
Ink2b).
Survival Pathway:
PI3 Kinase / AKT Pathway: Bcl2 (Bcl-2), Ccnd1, Fn1 (fibronectin), Jun (c-jun), Mmp7
(matrilysin), Myc (c-myc).
Jak / Src Pathway: Bcl2 (Bcl-2), Bcl-XL.
NFκB Pathway: Birc1a, Birc2 (c-IAP2), Birc3 (c-IAP1), Tert.
p53 Pathway: Bax, Cdkn1a (p21Waf1, p21Cip1), Ei24 (Pig3), Fas (Tnfrsf6), Gadd45a (gadd45),
Igfbp3, Mdm2.
Stress Pathway: Atf2, Fos (c-fos), Hsf1 (tcf5), Hspb1 (Hsp25), Myc (c-myc), Trp53 (p53).
NFκB Pathway: Ccl20, Cxcl1, Icam1, Ikbkb, Il1a, Il2, Lta (TNFb), Nfkbia, Nos2 (iNOS), Tank,
Tnf (TNFa), Vcam1.
NFAT Pathway: Cd5, Fasl (Tnfsf6), Il2.
CREB Pathway: Cyp19a1, Egr1 (egr-1), Fos (c-fos).
Jak-Stat Pathway: Cxcl9 (MIG), Il4ra, Irf1, Mmp10 (stromelysin-2), Nos2 (iNOS).
Estrogen Pathway: Bcl2 (Bcl-2), Brca1, Greb1, Igfbp4, Nrip1.
Androgen Pathway: Cdk2, Cdkn1a (p21Waf1, p21Cip1), Tmepai.
Calcium and Protein Kinase C Pathway: Csf2 (GM-CSF), Fos (c-fos), Il2, Il2ra (IL-2 R), Jun (c-
jun), Myc (c-myc), Odc1, Tfrc.
Phospholipase C Pathway: Bcl2 (Bcl-2), Egr1, Fos (c-fos), Icam1, Jun (c-jun), Nos2 (iNOS),
Ptgs2 (cox-2), Vcam1.
Insulin Pathway: Cebpb (C/EBP), Fasn (fatty acid synthase), Gys1 (GS, glycogen synthase), Hk2
(hexokinase II), Lep (Ob).
LDL Pathway: Ccl2, Csf2 (GM-CSF), Sele, Selp (P-selectin), Vcam1.
Retinoic Acid Pathway: En1 (engrailed), Hoxa1, Rbp1 (CRBPI).

148
APPENDIX C. Fold change of genes related to apoptotic pathways in GD 8.5
embryos from VA treated dams compared to control group
Gene Fold Change p-value
Akt1 0.906 0.171
Apaf1 1.168 0.040
Api5 0.906 0.528
Atf5 0.671 0.067
Bad 0.687 0.013
Bag1 1.116 0.391
Bag3 0.719 0.095
Bak1 1.017 0.884
Bax 0.994 0.969
Bcl10 0.994 0.936
Bcl2 0.994 0.865
Bcl2l1 1.065 0.578
Bcl2l10 0.826 0.284
Bcl2l2 1.438 0.147
Bid 1.090 0.462
Naip1 0.826 0.284
Naip2 1.017 0.877
Birc2 1.168 0.392
Birc3 0.927 0.690
Xiap 1.406 0.260
Birc5 1.065 0.790
Bnip2 0.885 0.354
Bnip3 1.406 0.265
Bnip3l 1.168 0.336
Bok 0.753 0.089
Card10 0.994 0.866
Nod1 1.855 0.103
Card6 1.017 0.899
Casp1 0.687 0.303
Casp12 0.927 0.808
Casp14 0.826 0.284
Casp2 1.065 0.581
Casp3 1.252 0.211
Casp4 0.826 0.284
Casp6 0.885 0.117
Casp7 1.017 0.803
Casp8 1.090 0.489
Casp9 0.826 0.152
Cflar 1.142 0.242
Cidea 0.826 0.284
Cideb 0.206 0.012
Cradd 0.971 0.893
Dad1 0.736 0.042
Gene Fold Change p-value
Dapk1 0.906 0.503
Dffa 0.994 0.967
Dffb 1.342 0.221
Tsc22d3 1.196 0.290
Fadd 0.736 0.109
Fas 0.807 0.472
Fasl 1.168 0.608
Hells 1.116 0.630
Il10 0.826 0.284
Lhx4 0.807 0.612
Ltbr 1.090 0.730
Mcl1 1.374 0.460
Nfkb1 1.017 0.866
Nme5 0.994 0.999
Nol3 0.703 0.136
Pak7 1.065 0.773
Pim2 0.885 0.300
Polb 0.885 0.293
Prdx2 0.927 0.486
Pycard 0.789 0.289
Ripk1 1.406 0.046
Rnf7 1.988 0.111
Sphk2 0.949 0.357
Tnf 0.826 0.284
Tnfrsf10b 1.252 0.188
Tnfrsf11b 1.224 0.646
Tnfrsf1a 1.090 0.462
Cd40 0.994 0.925
Tnfsf10 0.826 0.284
Tnfsf12 0.641 0.052
Cd40lg 0.826 0.284
Cd70 0.826 0.284
Traf1 0.789 0.119
Traf2 0.906 0.249
Traf3 1.116 0.554
Trp53 0.885 0.214
Trp53bp2 1.142 0.358
Trp53inp1 1.090 0.414
Trp63 1.507 0.039
Trp73 0.826 0.284
Zc3hc1 0.687 0.022

149
APPENDIX D. Fold change of genes related to apoptotic pathways in GD 8.5
embryos from IFNγ+VA-treated dams compared to IFNγ only control group
Gene Fold Change p-value
Akt1 1.643 0.218
Apaf1 1.304 0.502
Api5 1.274 0.168
Atf5 1.059 0.695
Bad 0.554 0.400
Bag1 1.643 0.000
Bag3 1.304 0.055
Bak1 0.110 0.350
Bax 0.965 0.661
Bcl10 1.643 0.103
Bcl2 1.533 0.375
Bcl2l1 2.861 0.341
Bcl2l10 0.401 0.089
Bcl2l2 1.162 0.674
Bid 1.605 0.097
Naip1 0.401 0.089
Naip2 0.401 0.089
Birc2 1.011 0.909
Birc3 0.732 0.339
Xiap 0.802 0.279
Birc5 0.667 0.278
Bnip2 1.274 0.299
Bnip3 1.217 0.735
Bnip3l 1.398 0.277
Bok 1.245 0.427
Card10 0.802 0.231
Nod1 0.252 0.002
Card6 0.901 0.571
Casp1 0.401 0.089
Casp12 0.401 0.089
Casp14 0.401 0.089
Casp2 1.245 0.747
Casp3 0.802 0.462
Casp4 0.401 0.089
Casp6 1.274 0.079
Casp7 1.304 0.405
Casp8 3.605 0.360
Casp9 0.802 0.885
Cflar 1.430 0.426
Cidea 0.401 0.089
Cideb 0.608 0.448
Cradd 1.464 0.384
Dad1 2.996 0.376
Gene Fold Change p-value
Dapk1 0.652 0.482
Dffa 1.334 0.505
Dffb 1.304 0.146
Tsc22d3 1.398 0.051
Fadd 1.605 0.344
Fas 0.440 0.139
Fasl 0.699 0.949
Hells 1.109 0.701
Il10 0.517 0.139
Lhx4 0.840 0.635
Ltbr 1.681 0.359
Mcl1 0.341 0.132
Nfkb1 1.274 0.327
Nme5 0.943 0.904
Nol3 0.988 0.922
Pak7 0.608 0.067
Pim2 0.622 0.188
Polb 1.011 0.849
Prdx2 0.236 0.298
Pycard 0.732 0.217
Ripk1 1.217 0.547
Rnf7 0.784 0.098
Sphk2 0.965 0.898
Tnf 0.401 0.089
Tnfrsf10b 1.189 0.319
Tnfrsf11b 0.637 0.342
Tnfrsf1a 1.761 0.181
Cd40 1.398 0.361
Tnfsf10 0.401 0.089
Tnfsf12 0.766 0.300
Cd40lg 0.401 0.089
Cd70 0.401 0.089
Traf1 0.105 0.061
Traf2 2.378 0.382
Traf3 0.965 0.946
Trp53 1.059 0.552
Trp53bp2 0.901 0.511
Trp53inp1 0.110 0.272
Trp63 0.667 0.895
Trp73 0.155 0.004
Zc3hc1 0.098 0.661

150
APPENDIX E. Fold change of genes related to apoptotic pathways in GD9 embryos
with open neural tubes from VA-treated dams compared to control group
Gene Fold Change p-value
Akt1 0.423 0.004
Apaf1 0.292 0.042
Api5 0.703 0.079
Atf5 1.857 0.001
Bad 4.169 0.005
Bag1 0.558 0.032
Bag3 1.170 0.371
Bak1 206.978 0.003
Bax 0.656 0.025
Bcl10 0.950 0.677
Bcl2 0.886 0.592
Bcl2l1 0.139 0.000
Bcl2l10 0.687 0.277
Bcl2l2 0.866 0.687
Bid 0.533 0.045
Naip1 0.687 0.277
Naip2 0.687 0.277
Birc2 0.972 0.805
Birc3 1.018 0.737
Xiap 0.720 0.225
Birc5 0.808 0.432
Bnip2 0.453 0.094
Bnip3 0.846 0.528
Bnip3l 0.571 0.029
Bok 2.133 0.016
Card10 0.995 0.967
Nod1 1.773 0.085
Card6 1.225 0.514
Casp1 0.656 0.267
Casp12 0.687 0.277
Casp14 0.687 0.277
Casp2 1.693 0.181
Casp3 0.627 0.220
Casp4 0.687 0.277
Casp6 2.183 0.914
Casp7 0.950 0.886
Casp8 0.027 0.010
Casp9 3.547 0.022
Cflar 0.216 0.004
Cidea 0.687 0.277
Cideb 15.562 0.000
Cradd 0.285 0.015
Dad1 0.002 0.000
Gene Fold Change p-value
Dapk1 0.368 0.147
Dffa 0.413 0.006
Dffb 1.197 0.121
Tsc22d3 0.313 0.085
Fadd 0.464 0.000
Fas 0.184 0.074
Fasl 0.585 0.095
Hells 0.423 0.104
Il10 0.687 0.277
Lhx4 0.703 0.625
Ltbr 0.687 0.058
Mcl1 63.704 0.002
Nfkb1 0.808 0.184
Nme5 0.907 0.509
Nol3 0.656 0.217
Pak7 0.545 0.169
Pim2 1.945 0.055
Polb 0.585 0.163
Prdx2 78.43 0.000
Pycard 0.907 0.618
Ripk1 0.423 0.000
Rnf7 1.225 0.249
Sphk2 1.143 0.328
Tnf 0.687 0.277
Tnfrsf10b 0.720 0.078
Tnfrsf11b 0.612 0.146
Tnfrsf1a 0.486 0.097
Cd40 0.351 0.038
Tnfsf10 0.687 0.277
Tnfsf12 1.042 0.804
Cd40lg 0.687 0.277
Cd70 0.687 0.277
Traf1 0.720 0.309
Traf2 0.049 0.001
Traf3 1.990 0.025
Trp53 1.018 0.987
Trp53bp2 1.117 0.292
Trp53inp1 0.328 0.102
Trp63 1.066 0.570
Trp73 0.687 0.277
Zc3hc1 0.754 0.049

151
APPENDIX F. Fold change of genes related to apoptotic pathways in GD9 embryos
with closed neural tubes from VA-treated dams compared to control group
Gene Fold Change p-value
Akt1 0.458 0.002
Apaf1 0.288 0.042
Api5 0.678 0.097
Atf5 1.388 0.112
Bad 3.926 0.027
Bag1 0.590 0.042
Bag3 0.915 0.757
Bak1 213.782 0.008
Bax 0.563 0.011
Bcl10 0.854 0.395
Bcl2 0.854 0.560
Bcl2l1 0.147 0.000
Bcl2l10 0.604 0.192
Bcl2l2 0.835 0.575
Bid 0.502 0.036
Naip1 0.604 0.192
Naip2 0.604 0.192
Birc2 0.816 0.524
Birc3 1.076 0.844
Xiap 0.761 0.263
Birc5 0.959 0.916
Bnip2 0.458 0.094
Bnip3 0.835 0.524
Bnip3l 0.577 0.037
Bok 2.362 0.000
Card10 1.127 0.711
Nod1 1.594 0.089
Card6 1.028 0.966
Casp1 0.577 0.195
Casp12 0.604 0.192
Casp14 0.604 0.192
Casp2 1.963 0.056
Casp3 0.662 0.239
Casp4 0.604 0.192
Casp6 2.153 0.931
Casp7 0.854 0.680
Casp8 0.03 0.010
Casp9 3.837 0.020
Cflar 0.229 0.004
Cidea 0.604 0.192
Cideb 14.320 0.000
Cradd 0.339 0.018
Dad1 0.002 0.000
Gene Fold Change p-value
Dapk1 0.632 0.185
Dffa 0.389 0.005
Dffb 1.076 0.521
Tsc22d3 0.331 0.091
Fadd 0.458 0.000
Fas 0.181 0.075
Fasl 0.514 0.055
Hells 0.417 0.102
Il10 0.604 0.192
Lhx4 0.816 0.974
Ltbr 0.551 0.045
Mcl1 64.296 0.004
Nfkb1 0.678 0.034
Nme5 0.727 0.203
Nol3 0.618 0.363
Pak7 0.662 0.258
Pim2 1.790 0.096
Polb 0.538 0.139
Prdx2 77.350 0.000
Pycard 0.797 0.502
Ripk1 0.372 0.000
Rnf7 1.236 0.211
Sphk2 1.028 0.823
Tnf 0.604 0.192
Tnfrsf10b 0.563 0.012
Tnfrsf11b 0.538 0.091
Tnfrsf1a 0.447 0.083
Cd40 0.288 0.032
Tnfsf10 0.604 0.192
Tnfsf12 0.915 0.499
Cd40lg 0.604 0.192
Cd70 0.604 0.192
Traf1 0.604 0.192
Traf2 0.053 0.001
Traf3 1.918 0.060
Trp53 0.959 0.799
Trp53bp2 1.076 0.610
Trp53inp1 0.323 0.099
Trp63 0.835 0.412
Trp73 0.604 0.192
Zc3hc1 0.662 0.027

152
APPENDIX G. Fold change of genes related to apoptotic pathways in GD9 embryos
with closed neural tubes from IFNγ+VA-treated dams compared to IFNγ only
control group
Gene Fold Change p-value
Akt1 0.627 0.344
Apaf1 0.703 0.549
Api5 0.737 0.316
Atf5 1.654 0.066
Bad 2.751 0.150
Bag1 0.672 0.132
Bag3 1.440 0.156
Bak1 42.029 0.117
Bax 0.754 0.302
Bcl10 0.585 0.325
Bcl2 1.197 0.779
Bcl2l1 0.272 0.123
Bcl2l10 0.972 0.790
Bcl2l2 1.066 0.746
Bid 0.687 0.278
Naip1 0.972 0.790
Naip2 0.950 0.751
Birc2 0.808 0.356
Birc3 0.950 0.757
Xiap 0.928 0.690
Birc5 0.703 0.273
Bnip2 0.521 0.199
Bnip3 0.585 0.180
Bnip3l 0.641 0.176
Bok 1.344 0.313
Card10 1.117 0.699
Nod1 0.808 0.713
Card6 1.407 0.105
Casp1 0.808 0.533
Casp12 0.972 0.790
Casp14 0.972 0.790
Casp2 1.170 0.475
Casp3 0.571 0.244
Casp4 0.972 0.790
Casp6 0.509 0.246
Casp7 0.827 0.399
Casp8 0.086 0.053
Casp9 2.508 0.042
Cflar 0.386 0.117
Cidea 0.972 0.790
Cideb 7.603 0.121
Cradd 0.497 0.157
Dad1 0.016 0.143
Gene Fold Change p-value
Dapk1 0.641 0.609
Dffa 0.558 0.078
Dffb 1.170 0.067
Tsc22d3 0.395 0.161
Fadd 0.571 0.266
Fas 0.509 0.514
Fasl 0.772 0.380
Hells 0.772 0.466
Il10 0.972 0.790
Lhx4 0.571 0.160
Ltbr 0.720 0.214
Mcl1 7.963 0.125
Nfkb1 0.79 0.051
Nme5 0.703 0.270
Nol3 0.545 0.023
Pak7 0.612 0.222
Pim2 1.654 0.157
Polb 0.533 0.081
Prdx2 15.562 0.121
Pycard 0.79 0.401
Ripk1 0.509 0.047
Rnf7 0.886 0.874
Sphk2 1.375 0.111
Tnf 0.972 0.790
Tnfrsf10b 0.808 0.081
Tnfrsf11b 0.907 0.668
Tnfrsf1a 0.687 0.247
Cd40 0.404 0.092
Tnfsf10 0.972 0.790
Tnfsf12 1.225 0.399
Cd40lg 0.972 0.790
Cd70 0.972 0.790
Traf1 0.972 0.790
Traf2 0.094 0.039
Traf3 1.344 0.031
Trp53 1.066 0.717
Trp53bp2 1.066 0.619
Trp53inp1 0.386 0.161
Trp63 0.641 0.197
Trp73 0.972 0.790
Zc3hc1 0.808 0.388

153
APPENDIX H. Fold change of genes related to apoptotic pathways in GD9
embryos with open neural tubes from IFNγ+VA-treated dams compared to IFNγ
only control group
Gene Fold Change p-value
Akt1 0.211 0.021
Apaf1 0.413 0.205
Api5 0.248 0.180
Atf5 0.972 0.681
Bad 3.890 0.024
Bag1 0.193 0.069
Bag3 0.509 0.819
Bak1 248.999 0.003
Bax 0.886 0.996
Bcl10 1.474 0.383
Bcl2 0.368 0.390
Bcl2l1 0.040 0.001
Bcl2l10 0.808 0.505
Bcl2l2 0.497 0.386
Bid 0.598 0.142
Naip1 0.808 0.505
Naip2 0.79 0.471
Birc2 0.211 0.185
Birc3 0.497 0.483
Xiap 0.486 0.198
Birc5 0.423 0.155
Bnip2 0.260 0.101
Bnip3 0.351 0.282
Bnip3l 0.521 0.073
Bok 1.544 0.240
Card10 0.972 0.826
Nod1 0.972 0.896
Card6 1.313 0.284
Casp1 0.672 0.411
Casp12 0.808 0.505
Casp14 0.808 0.505
Casp2 0.292 0.934
Casp3 0.754 0.431
Casp4 0.808 0.505
Casp6 0.433 0.251
Casp7 0.433 0.418
Casp8 0.029 0.004
Casp9 3.630 0.012
Cflar 0.260 0.045
Cidea 0.808 0.505
Cideb 19.607 0.000
Cradd 0.328 0.061
Dad1 0.001 0.002
Gene Fold Change p-value
Dapk1 0.558 0.237
Dffa 0.360 0.009
Dffb 0.928 0.531
Tsc22d3 0.180 0.084
Fadd 0.180 0.046
Fas 0.211 0.021
Fasl 0.585 0.139
Hells 0.720 0.422
Il10 0.808 0.505
Lhx4 0.533 0.248
Ltbr 0.509 0.046
Mcl1 4.680 0.155
Nfkb1 0.641 0.013
Nme5 0.720 0.245
Nol3 0.598 0.133
Pak7 0.377 0.111
Pim2 1.440 0.289
Polb 0.533 0.082
Prdx2 62.249 0.000
Pycard 0.808 0.396
Ripk1 0.386 0.015
Rnf7 1.170 0.274
Sphk2 1.143 0.571
Tnf 0.808 0.505
Tnfrsf10b 0.627 0.006
Tnfrsf11b 0.754 0.403
Tnfrsf1a 0.443 0.019
Cd40 0.260 0.040
Tnfsf10 0.808 0.505
Tnfsf12 1.117 0.687
Cd40lg 0.808 0.505
Cd70 0.808 0.505
Traf1 0.808 0.505
Traf2 0.045 0.005
Traf3 1.254 0.287
Trp53 1.066 0.704
Trp53bp2 1.066 0.561
Trp53inp1 0.266 0.124
Trp63 0.453 0.106
Trp73 0.808 0.505
Zc3hc1 0.545 0.110

154
APPENDIX I. Fold change of genes related to apoptotic pathways in GD9 embryos
with open neural tubes from tap water exposed dams compared to control group
Gene Fold Change p-value
Akt1 1.168 0.799
Apaf1 0.826 0.889
Api5 0.807 0.758
Atf5 5.247 0.561
Bad 0.971 0.955
Bag1 0.736 0.638
Bag3 0.971 0.877
Bak1 1.252 0.846
Bax 0.753 0.274
Bcl10 0.376 0.445
Bcl2 0.703 0.628
Bcl2l1 0.584 0.621
Bcl2l10 1.224 0.610
Bcl2l2 1.041 0.878
Bid 1.142 0.636
Naip1 1.224 0.610
Naip2 0.906 0.866
Birc2 0.687 0.815
Birc3 0.927 0.798
Xiap 0.865 0.899
Birc5 0.826 0.546
Bnip2 0.687 0.476
Bnip3 0.753 0.598
Bnip3l 0.906 0.925
Bok 1.017 0.937
Card10 1.281 0.474
Nod1 0.865 0.660
Card6 3.462 0.369
Casp1 1.252 0.446
Casp12 1.578 0.268
Casp14 0.949 0.969
Casp2 0.771 0.723
Casp3 0.703 0.380
Casp4 1.065 0.791
Casp6 0.719 0.264
Casp7 0.807 0.728
Casp8 1.065 0.881
Casp9 0.771 0.665
Cflar 1.065 0.741
Cidea 1.224 0.610
Cideb 1.142 0.882
Cradd 1.065 0.774
Dad1 0.719 0.934
Gene Fold Change p-value
Dapk1 1.041 0.928
Dffa 1.041 0.846
Dffb 0.807 0.415
Tsc22d3 0.865 0.731
Fadd 0.826 0.932
Fas 1.041 0.910
Fasl 1.342 0.414
Hells 1.142 0.985
Il10 1.224 0.610
Lhx4 1.281 0.555
Ltbr 0.242 0.592
Mcl1 1.406 0.933
Nfkb1 0.736 0.208
Nme5 1.116 0.950
Nol3 1.281 0.518
Pak7 0.736 0.454
Pim2 1.281 0.810
Polb 1.017 0.815
Prdx2 0.545 0.576
Pycard 0.807 0.668
Ripk1 0.703 0.401
Rnf7 2.685 0.386
Sphk2 0.807 0.443
Tnf 1.224 0.610
Tnfrsf10b 0.845 0.533
Tnfrsf11b 0.771 0.562
Tnfrsf1a 0.807 0.464
Cd40 0.885 0.741
Tnfsf10 1.224 0.610
Tnfsf12 1.017 0.979
Cd40lg 1.224 0.610
Cd70 1.224 0.610
Traf1 1.116 0.724
Traf2 0.906 0.909
Traf3 0.571 0.899
Trp53 1.041 0.688
Trp53bp2 1.116 0.486
Trp53inp1 4.784 0.223
Trp63 1.017 0.875
Trp73 1.224 0.610
Zc3hc1 0.771 0.493

155
APPENDIX J. Fold change of genes related to signal transduction pathways in GD
8.5 embryos from VA-treated dams compared to control group
Gene Fold Change p-value
Atf2 0.821 0.171
Bax 1.430 0.050
Bcl2 2.118 0.202
Naip1 0.683 0.009
Birc2 1.304 0.029
Birc3 0.529 0.105
Birc5 1.109 0.740
Bmp2 0.840 0.392
Bmp4 1.059 0.630
Brca1 1.430 0.093
Ccl2 0.608 0.145
Ccl20 0.683 0.009
Ccnd1 2.324 0.089
Cd5 0.420 0.189
Cdh1 0.374 0.082
Cdk2 0.471 0.129
Cdkn1a 1.189 0.102
Cdkn1b 1.109 0.448
Cdkn2a 0.567 0.356
Cdkn2b 1.887 0.030
Cebpb 0.637 0.007
Csf2 0.683 0.009
Cxcl1 0.715 0.053
Cxcl9 0.683 0.009
Cyp19a1 0.683 0.009
Egr1 0.318 0.106
Ei24 1.802 0.027
En1 1.189 0.255
Fas 0.860 0.633
Fasl 0.471 0.382
Fasn 7.551 0.111
Fgf4 0.965 0.794
Fn1 1.109 0.498
Fos 0.505 0.126
Foxa2 0.943 0.615
Gadd45a 1.011 0.956
Greb1 1.245 0.120
Gys1 0.988 0.976
Hhip 1.084 0.649
Hk2 0.988 0.896
Hoxa1 0.567 0.146
Hsf1 0.784 0.227
Hspb1 0.318 0.119
Gene Fold Change p-value
Icam1 1.162 0.439
Igfbp3 1.135 0.351
Igfbp4 1.189 0.509
Ikbkb 1.011 0.897
Il1a 0.471 0.231
Il2 0.683 0.009
Il2ra 0.683 0.009
Il4ra 5.722 0.448
Irf1 1.304 0.094
Jun 1.189 0.025
Lef1 0.567 0.150
Lep 0.683 0.009
Lta 0.860 0.592
Mdm2 0.191 0.109
Mmp10 0.683 0.009
Mmp7 0.683 0.009
Myc 0.880 0.608
Nab2 1.334 0.207
Nfkbia 0.542 0.100
Nos2 0.392 0.241
Nrip1 0.554 0.213
Odc1 1.059 0.433
Pparg 2.219 0.129
Ptch1 1.533 0.057
Ptgs2 1.274 0.585
Rbp1 1.245 0.346
Sele 1.084 0.589
Selp 0.450 0.234
Tank 47.945 0.045
Tcf7 0.483 0.056
Tert 1.189 0.360
Tfrc 1.533 0.068
Pmepa1 2.434 0.756
Tnf 0.840 0.710
Trp53 1.245 0.072
Vcam1 0.494 0.150
Vegfa 2.669 0.036
Wisp1 0.283 0.115
Wnt1 1.217 0.111
Wnt2 0.440 0.516

156
APPENDIX K. Fold change of genes related to signal transduction pathways in GD
8.5 embryos from IFNγ+VA-treated dams compared to IFNγ only control group
Gene Fold Change p-value
Atf2 0.762 0.159
Bax 1.422 0.116
Bcl2 2.011 0.267
Naip1 0.855 0.850
Birc2 0.917 0.408
Birc3 0.619 0.365
Birc5 1.422 0.437
Bmp2 0.960 0.896
Bmp4 1.455 0.196
Brca1 0.982 0.838
Ccl2 1.327 0.459
Ccl20 0.855 0.850
Ccnd1 1.560 0.445
Cd5 0.458 0.235
Cdh1 0.648 0.657
Cdk2 0.577 0.346
Cdkn1a 1.238 0.266
Cdkn1b 1.389 0.463
Cdkn2a 2.364 0.404
Cdkn2b 1.965 0.105
Cebpb 0.780 0.109
Csf2 0.855 0.850
Cxcl1 0.855 0.850
Cxcl9 2.156 0.391
Cyp19a1 1.21 0.488
Egr1 0.564 0.388
Ei24 1.103 0.729
En1 1.21 0.212
Fas 1.078 0.949
Fasl 0.381 0.395
Fasn 2.310 0.797
Fgf4 1.155 0.615
Fn1 0.917 0.555
Fos 1.455 0.451
Foxa2 1.053 0.767
Gadd45a 1.596 0.323
Greb1 1.005 0.919
Gys1 0.817 0.300
Hhip 0.917 0.559
Hk2 1.029 0.795
Hoxa1 0.982 0.899
Hsf1 0.711 0.131
Hspb1 0.564 0.528
Gene Fold Change p-value
Icam1 0.780 0.140
Igfbp3 1.21 0.107
Igfbp4 1.238 0.465
Ikbkb 0.836 0.433
Il1a 0.591 0.569
Il2 0.896 0.815
Il2ra 1.029 0.586
Il4ra 2.911 0.817
Irf1 1.389 0.266
Jun 0.896 0.143
Lef1 0.648 0.244
Lep 1.489 0.429
Lta 1.560 0.116
Mdm2 0.526 0.403
Mmp10 0.855 0.850
Mmp7 1.965 0.396
Myc 0.780 0.231
Nab2 1.103 0.428
Nfkbia 0.648 0.244
Nos2 1.524 0.402
Nrip1 0.437 0.170
Odc1 1.005 0.860
Pparg 2.979 0.334
Ptch1 1.155 0.503
Ptgs2 2.011 0.116
Rbp1 0.128 0.978
Sele 4.311 0.375
Selp 1.524 0.412
Tank 36.971 0.117
Tcf7 0.679 0.391
Tert 0.938 0.731
Tfrc 1.389 0.069
Pmepa1 3.193 0.657
Tnf 1.422 0.290
Trp53 1.155 0.476
Vcam1 0.648 0.813
Vegfa 1.455 0.497
Wisp1 0.347 0.17
Wnt1 1.21 0.451
Wnt2 0.855 0.892

157
APPENDIX L. Fold change of genes related to signal transduction pathways in
GD9 embryos with closed neural tubes from VA-treated dams compared to control
group
Gene Fold Change p-value
Atf2 0.911 0.677
Bax 1.148 0.625
Bcl2 0.850 0.763
Naip1 0.850 0.685
Birc2 0.775 0.228
Birc3 0.775 0.709
Birc5 1.447 0.182
Bmp2 0.535 0.200
Bmp4 0.740 0.113
Brca1 1.071 0.940
Ccl2 0.870 0.535
Ccl20 0.850 0.685
Ccnd1 1.023 0.877
Cd5 0.707 0.568
Cdh1 0.615 0.670
Cdk2 0.850 0.942
Cdkn1a 0.977 0.970
Cdkn1b 0.850 0.307
Cdkn2a 0.337 0.740
Cdkn2b 0.831 0.527
Cebpb 1 0.953
Csf2 0.850 0.685
Cxcl1 0.812 0.547
Cxcl9 0.850 0.685
Cyp19a1 0.870 0.789
Egr1 0.793 0.971
Ei24 0.911 0.721
En1 0.740 0.162
Fas 0.933 0.984
Fasl 0.396 0.355
Fasn 0.757 0.647
Fgf4 0.353 0.029
Fn1 0.561 0.113
Fos 0.574 0.751
Foxa2 0.587 0.140
Gadd45a 0.659 0.208
Greb1 0.775 0.156
Gys1 0.911 0.224
Hhip 0.954 0.895
Hk2 0.890 0.696
Hoxa1 0.198 0.386
Hsf1 0.870 0.963
Hspb1 0.267 0.935
Gene Fold Change p-value
Icam1 0.850 0.454
Igfbp3 0.723 0.077
Igfbp4 0.831 0.533
Ikbkb 1 0.813
Il1a 0.587 0.363
Il2 0.850 0.685
Il2ra 0.850 0.685
Il4ra 0.850 0.743
Irf1 0.933 0.635
Jun 0.691 0.065
Lef1 1 0.876
Lep 0.850 0.685
Lta 0.812 0.558
Mdm2 0.775 0.898
Mmp10 0.850 0.685
Mmp7 0.850 0.685
Myc 0.707 0.246
Nab2 0.870 0.712
Nfkbia 1.023 0.972
Nos2 0.977 0.617
Nrip1 0.691 0.792
Odc1 0.954 0.829
Pparg 0.435 0.147
Ptch1 0.775 0.296
Ptgs2 0.477 0.116
Rbp1 0.977 0.830
Sele 0.740 0.331
Selp 1.289 0.467
Tank 0.707 0.546
Tcf7 0.812 0.889
Tert 0.850 0.480
Tfrc 0.659 0.143
Pmepa1 1.259 0.693
Tnf 0.707 0.282
Trp53 0.675 0.101
Vcam1 1.122 0.828
Vegfa 0.775 0.621
Wisp1 0.691 0.790
Wnt1 0.740 0.124
Wnt2 0.086 0.331

158
APPENDIX M. Fold change of genes related to signal transduction pathways in
GD9 embryos with open neural tubes from VA-treated dams compared to control
group
Gene Fold Change p-value
Atf2 1.633 0.396
Bax 1.078 0.792
Bcl2 0.917 0.989
Naip1 0.836 0.485
Birc2 0.347 0.263
Birc3 0.591 0.292
Birc5 1.053 0.627
Bmp2 0.363 0.011
Bmp4 0.663 0.016
Brca1 0.960 0.850
Ccl2 0.855 0.839
Ccl20 0.836 0.485
Ccnd1 1.633 0.366
Cd5 0.526 0.403
Cdh1 0.427 0.273
Cdk2 0.817 0.580
Cdkn1a 0.960 0.706
Cdkn1b 1.965 0.344
Cdkn2a 0.240 0.103
Cdkn2b 0.982 0.997
Cebpb 0.817 0.384
Csf2 0.836 0.485
Cxcl1 0.798 0.336
Cxcl9 1.21 0.518
Cyp19a1 0.836 0.485
Egr1 0.744 0.698
Ei24 1.078 0.878
En1 0.679 0.114
Fas 0.896 0.785
Fasl 0.39 0.352
Fasn 0.982 0.970
Fgf4 0.141 0.002
Fn1 0.480 0.007
Fos 0.679 0.964
Foxa2 0.762 0.155
Gadd45a 0.817 0.410
Greb1 0.982 0.898
Gys1 1.005 0.898
Hhip 0.982 0.856
Hk2 0.982 0.810
Hoxa1 0.054 0.005
Hsf1 1.078 0.666
Hspb1 0.169 0.027
Gene Fold Change p-value
Icam1 0.663 0.108
Igfbp3 0.514 0.024
Igfbp4 0.917 0.551
Ikbkb 1.267 0.337
Il1a 0.836 0.876
Il2 0.836 0.485
Il2ra 0.836 0.485
Il4ra 0.875 0.555
Irf1 1.029 0.874
Jun 0.798 0.102
Lef1 1.238 0.569
Lep 1.029 0.786
Lta 0.875 0.774
Mdm2 0.109 0.328
Mmp10 0.836 0.485
Mmp7 0.836 0.485
Myc 0.619 0.099
Nab2 1.053 0.919
Nfkbia 1.078 0.899
Nos2 3.584 0.377
Nrip1 0.711 0.457
Odc1 0.938 0.365
Pparg 0.514 0.203
Ptch1 0.762 0.573
Ptgs2 0.372 0.067
Rbp1 0.064 0.276
Sele 0.798 0.517
Selp 0.836 0.485
Tank 4.412 0.942
Tcf7 0.875 0.842
Tert 0.982 0.959
Tfrc 0.780 0.298
Pmepa1 1.455 0.481
Tnf 0.695 0.169
Trp53 1.078 0.481
Vcam1 1.267 0.731
Vegfa 0.982 0.988
Wisp1 0.399 0.328
Wnt1 0.591 0.273
Wnt2 0.022 0.000

159
APPENDIX N. Fold change of genes related to signal transduction pathways in
GD9 embryos with closed neural tubes from IFNγ+VA-treated dams compared to
IFNγ only control group
Gene Fold Change p-value
Atf2 1.252 0.311
Bax 1.252 0.179
Bcl2 0.885 0.577
Naip1 0.927 0.932
Birc2 1.090 0.451
Birc3 0.865 0.910
Birc5 0.906 0.684
Bmp2 0.463 0.000
Bmp4 0.826 0.248
Brca1 1.017 0.789
Ccl2 1.090 0.988
Ccl20 0.807 0.589
Ccnd1 2.082 0.211
Cd5 1.252 0.589
Cdh1 0.508 0.075
Cdk2 0.807 0.802
Cdkn1a 1.116 0.205
Cdkn1b 0.508 0.215
Cdkn2a 0.071 0.078
Cdkn2b 0.571 0.307
Cebpb 1.116 0.675
Csf2 0.927 0.932
Cxcl1 0.927 0.932
Cxcl9 0.175 0.201
Cyp19a1 0.927 0.932
Egr1 0.719 0.794
Ei24 1.507 0.169
En1 0.927 0.608
Fas 1.065 0.858
Fasl 1.116 0.599
Fasn 3.383 0.329
Fgf4 0.403 0.069
Fn1 0.545 0.011
Fos 0.558 0.093
Foxa2 1.224 0.064
Gadd45a 0.571 0.048
Greb1 1.252 0.144
Gys1 0.971 0.877
Hhip 1.374 0.157
Hk2 0.641 0.145
Hoxa1 0.080 0.016
Hsf1 0.906 0.438
Hspb1 0.164 0.126
Gene Fold Change p-value
Icam1 1.342 0.070
Igfbp3 0.971 0.737
Igfbp4 1.691 0.044
Ikbkb 1.090 0.243
Il1a 0.703 0.414
Il2 0.927 0.932
Il2ra 0.927 0.932
Il4ra 3.014 0.339
Irf1 1.065 0.882
Jun 0.949 0.702
Lef1 0.865 0.454
Lep 0.927 0.977
Lta 0.927 0.932
Mdm2 0.497 0.724
Mmp10 0.927 0.932
Mmp7 0.927 0.932
Myc 0.807 0.337
Nab2 1.652 0.159
Nfkbia 1.542 0.155
Nos2 0.034 0.253
Nrip1 0.719 0.736
Odc1 1.142 0.373
Pparg 0.753 0.594
Ptch1 1.196 0.441
Ptgs2 0.753 0.634
Rbp1 167.924 0.088
Sele 0.598 0.353
Selp 0.753 0.420
Tank 0.153 0.487
Tcf7 0.687 0.303
Tert 1.041 0.710
Tfrc 1.017 0.840
Pmepa1 3.977 0.333
Tnf 0.927 0.932
Trp53 0.906 0.507
Vcam1 1.311 0.350
Vegfa 1.342 0.382
Wisp1 0.826 0.644
Wnt1 2.035 0.067
Wnt2 0.021 0.031
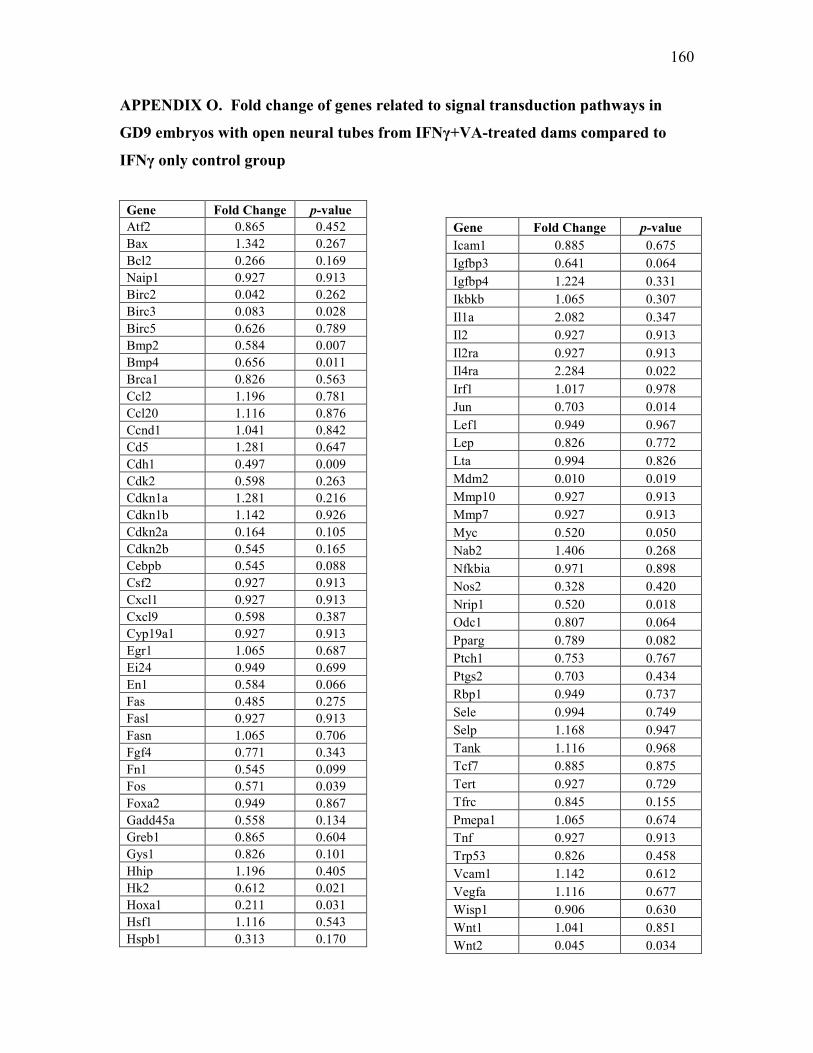
160
APPENDIX O. Fold change of genes related to signal transduction pathways in
GD9 embryos with open neural tubes from IFNγ+VA-treated dams compared to
IFNγ only control group
Gene Fold Change p-value
Atf2 0.865 0.452
Bax 1.342 0.267
Bcl2 0.266 0.169
Naip1 0.927 0.913
Birc2 0.042 0.262
Birc3 0.083 0.028
Birc5 0.626 0.789
Bmp2 0.584 0.007
Bmp4 0.656 0.011
Brca1 0.826 0.563
Ccl2 1.196 0.781
Ccl20 1.116 0.876
Ccnd1 1.041 0.842
Cd5 1.281 0.647
Cdh1 0.497 0.009
Cdk2 0.598 0.263
Cdkn1a 1.281 0.216
Cdkn1b 1.142 0.926
Cdkn2a 0.164 0.105
Cdkn2b 0.545 0.165
Cebpb 0.545 0.088
Csf2 0.927 0.913
Cxcl1 0.927 0.913
Cxcl9 0.598 0.387
Cyp19a1 0.927 0.913
Egr1 1.065 0.687
Ei24 0.949 0.699
En1 0.584 0.066
Fas 0.485 0.275
Fasl 0.927 0.913
Fasn 1.065 0.706
Fgf4 0.771 0.343
Fn1 0.545 0.099
Fos 0.571 0.039
Foxa2 0.949 0.867
Gadd45a 0.558 0.134
Greb1 0.865 0.604
Gys1 0.826 0.101
Hhip 1.196 0.405
Hk2 0.612 0.021
Hoxa1 0.211 0.031
Hsf1 1.116 0.543
Hspb1 0.313 0.170
Gene Fold Change p-value
Icam1 0.885 0.675
Igfbp3 0.641 0.064
Igfbp4 1.224 0.331
Ikbkb 1.065 0.307
Il1a 2.082 0.347
Il2 0.927 0.913
Il2ra 0.927 0.913
Il4ra 2.284 0.022
Irf1 1.017 0.978
Jun 0.703 0.014
Lef1 0.949 0.967
Lep 0.826 0.772
Lta 0.994 0.826
Mdm2 0.010 0.019
Mmp10 0.927 0.913
Mmp7 0.927 0.913
Myc 0.520 0.050
Nab2 1.406 0.268
Nfkbia 0.971 0.898
Nos2 0.328 0.420
Nrip1 0.520 0.018
Odc1 0.807 0.064
Pparg 0.789 0.082
Ptch1 0.753 0.767
Ptgs2 0.703 0.434
Rbp1 0.949 0.737
Sele 0.994 0.749
Selp 1.168 0.947
Tank 1.116 0.968
Tcf7 0.885 0.875
Tert 0.927 0.729
Tfrc 0.845 0.155
Pmepa1 1.065 0.674
Tnf 0.927 0.913
Trp53 0.826 0.458
Vcam1 1.142 0.612
Vegfa 1.116 0.677
Wisp1 0.906 0.630
Wnt1 1.041 0.851
Wnt2 0.045 0.034

161
APPENDIX P. Fold change of genes related to signal transduction pathways in
GD9 embryos with open neural tubes from tap water exposed dams compared to
control group
Gene Fold Change p-value
Atf2 1.374 0.451
Bax 0.865 0.568
Bcl2 1.168 0.684
Naip1 1.196 0.605
Birc2 0.753 0.660
Birc3 1.311 0.428
Birc5 0.906 0.853
Bmp2 0.789 0.725
Bmp4 1.090 0.706
Brca1 0.845 0.342
Ccl2 1.578 0.180
Ccl20 1.196 0.605
Ccnd1 0.845 0.454
Cd5 1.652 0.084
Cdh1 1.142 0.592
Cdk2 1.017 0.837
Cdkn1a 0.865 0.345
Cdkn1b 1.691 0.449
Cdkn2a 2.082 0.292
Cdkn2b 1.615 0.109
Cebpb 1.406 0.251
Csf2 1.196 0.605
Cxcl1 1.196 0.605
Cxcl9 1.542 0.419
Cyp19a1 1.196 0.605
Egr1 0.906 0.741
Ei24 0.994 0.799
En1 1.196 0.334
Fas 1.065 0.647
Fasl 1.168 0.651
Fasn 1.196 0.979
Fgf4 0.753 0.442
Fn1 0.927 0.867
Fos 0.612 0.672
Foxa2 0.927 0.871
Gadd45a 1.142 0.550
Greb1 1.041 0.735
Gys1 0.736 0.361
Hhip 1.224 0.423
Hk2 0.807 0.967
Hoxa1 1.615 0.253
Hsf1 1.142 0.610
Hspb1 1.771 0.450
Gene Fold Change p-value
Icam1 0.771 0.743
Igfbp3 1.311 0.422
Igfbp4 0.789 0.314
Ikbkb 1.065 0.719
Il1a 1.017 0.853
Il2 1.196 0.605
Il2ra 1.196 0.605
Il4ra 0.687 0.614
Irf1 0.719 0.058
Jun 1.224 0.338
Lef1 1.196 0.551
Lep 1.196 0.605
Lta 1.196 0.605
Mdm2 1.855 0.552
Mmp10 1.196 0.605
Mmp7 1.196 0.605
Myc 0.771 0.848
Nab2 0.272 0.174
Nfkbia 0.753 0.742
Nos2 1.943 0.404
Nrip1 1.116 0.537
Odc1 0.845 0.496
Pparg 1.507 0.409
Ptch1 1.116 0.854
Ptgs2 1.615 0.467
Rbp1 0.080 0.594
Sele 1.196 0.605
Selp 1.196 0.605
Tank 5.127 0.521
Tcf7 0.671 0.935
Tert 0.474 0.286
Tfrc 0.885 0.834
Pmepa1 1.142 0.775
Tnf 1.196 0.605
Trp53 0.885 0.679
Vcam1 1.090 0.549
Vegfa 0.753 0.310
Wisp1 1.731 0.541
Wnt1 0.285 0.109
Wnt2 1.406 0.462

162