dynamique des rivières - université de · pdf filetorrent st pierre, ecrins,...
TRANSCRIPT
1
Dynamique Dynamique des rivides rivièèresres

2
Rivers are enormously diverse
size: varies by many orders of magnitude
geometry: highly variable
substrate: bedrock or sediment
sediment type: sediment size ranges from mud to gravel
stage of development: young, with rugged topographyand rapid change, to old, with gentle topography and slow change
climate: ephemeral and flashy to very steady

3
Morphology of rivers
wetted perimeters
perimeterwettedareasectionalcrossradiushydraulic −
=

4
Morphology of rivers

5
Morphology of rivers
The base level of a river is the elevation of the water surface of the water body, either the world ocean or a lake along the river course, into which the river flows.

6
Morphology of rivers
Poisson, 2002
Northern Tian Shan, China

7
Morphology of rivers
The river has some equilibrium longitudinal profile, in the sensethat if conditions of tectonic, precipitation, sediment supply, and base level remain constant the longitudinal profile stays the same.

8
Classifying rivers
Rivers can be classified in several ways:
by the nature of their substrate
by the percentage of time they flow
by their relationship to the groundwater table
by their morphology
by the kind of sediment load they carry
by the dominant particle size of the bed sediment
9
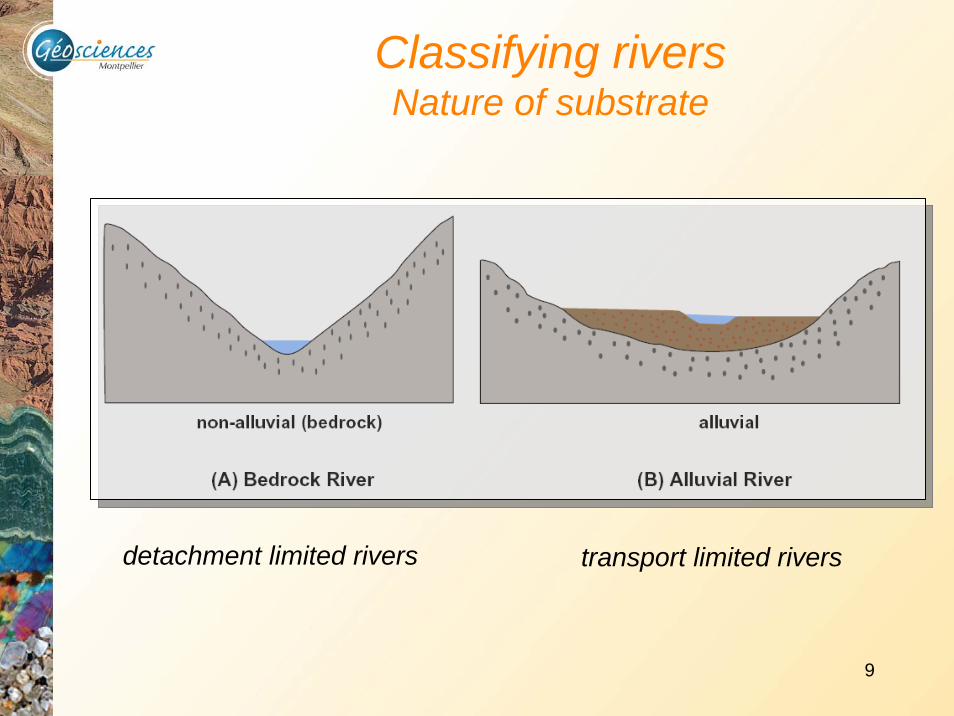
Classifying riversNature of substrate
detachment limited rivers transport limited rivers

10
Classifying riversNature of substrate
Taiwan, bedrock river Tibet, Alluvial river

11
Classifying riversPercentage of time river flows

12
Classifying riversPercentage of time river flows
Runoff cycle
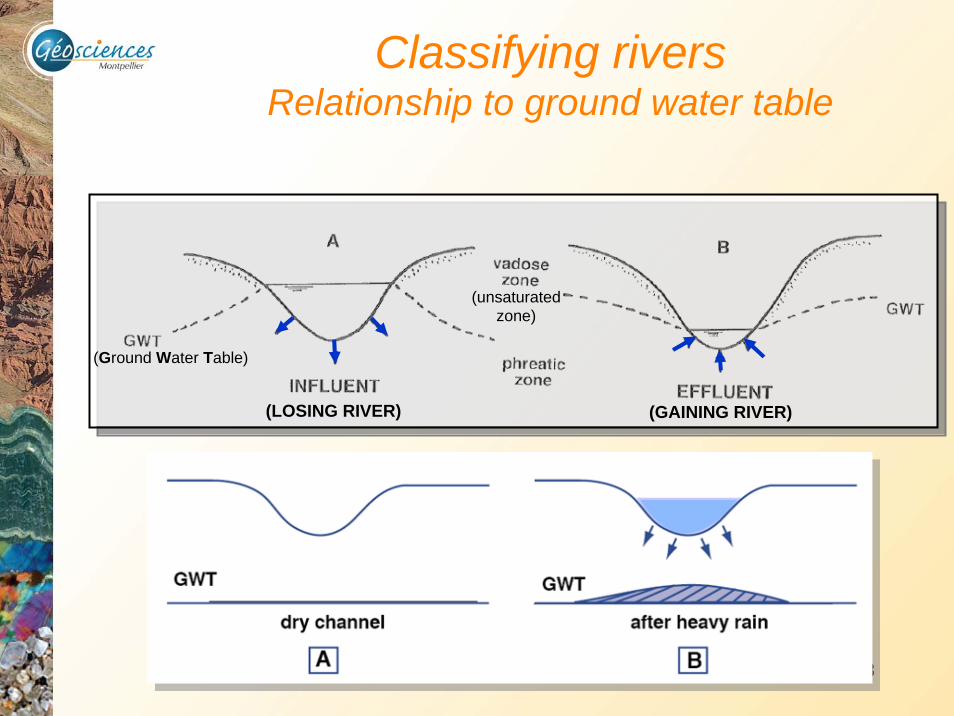
At the end of the first dry spell the river level lies below the ground water table in the river banks.
After a heavy rainfall the river stage rises rapidly to lie well above the level of the ground water table in the banks. Ground water is stored in the river banks, in the sense that the ground water table is locally and temporarily higher therethan in the surroundings.
At the end of the rainy period both the river stage and the ground water levelare of about the same height and are about at their highest.
Then both the river stage and the ground water table fall back to the dry spell situation shown.
13
Classifying riversRelationship to ground water table
(Ground Water Table)
(unsaturatedzone)
(GAINING RIVER)(LOSING RIVER)

14
Classifying riversMorphology

15
Classifying riversMorphology
L
l
1sinuosity
sinuosity
≥
=lL

16
Classifying riversMorphology
Meandered Anastomosed
Straight
Minnesota, USA
Braided
Sunwapta River, Alberta, Canada
Columbia River in British Columbia, Canada Yukon, Canada

17
Classifying riversMorphology
wavelength
ampl
itude
radius of
curvature

18
Classifying riversMorphology

19
Classifying riversMorphology
2003 McGraw-Hill Higher Education

20
Classifying riversMorphology
point bar
meanderscrolls
Laonong river, Taiwan

21
Classifying riversMorphology
narrow neck
cutoff
sealing
channelrealignment
oxbow lake

22
Classifying riversMorphology
Tortous meanders
Confined meander scrolls

23
Classifying riversMorphology
Torrent St Pierre, Ecrins, FranceMeunier, 2004
~100 m
24
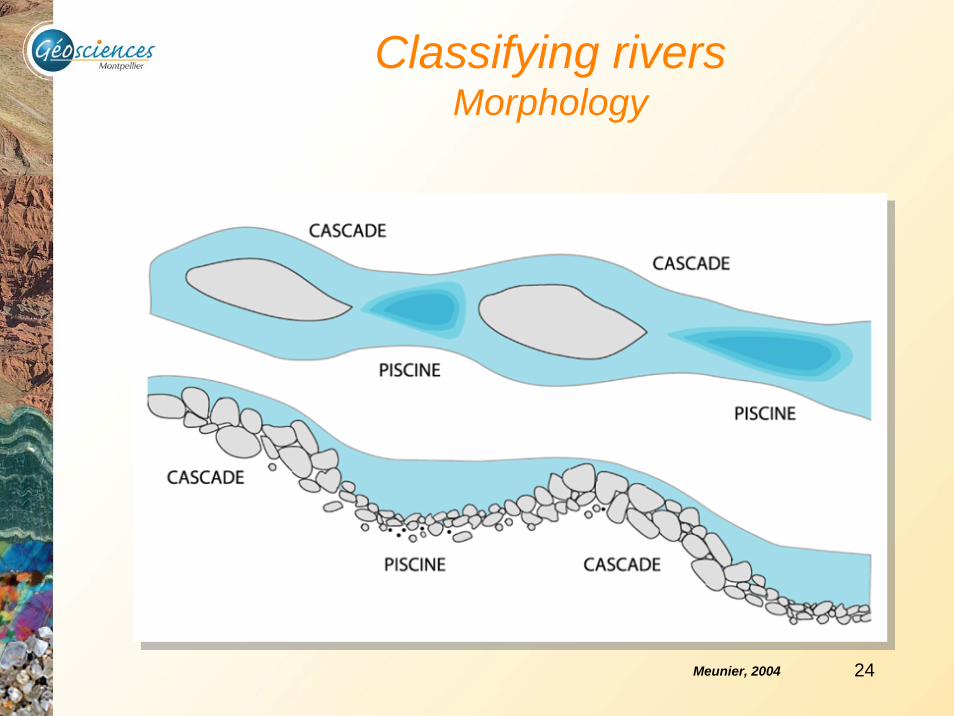
Classifying riversMorphology
Meunier, 2004

25
Classifying riversMorphology
Burbank & Anderson, 2001
1.5<sinus.<1.8sinus.>1.8

26
Classifying riversMorphology
Church, 2006

27
Measurements of stream flow
The stage of a river is the height of the water surface of the stream above an arbitrary datum, usually either sea level or an elevation slightly below the channel bed. Stage is related to depth, but the two are not the same.

28
Measurements of stream flow
The stage of a river is fairly easy to measure. Various kinds of streamgauges are in use.
29
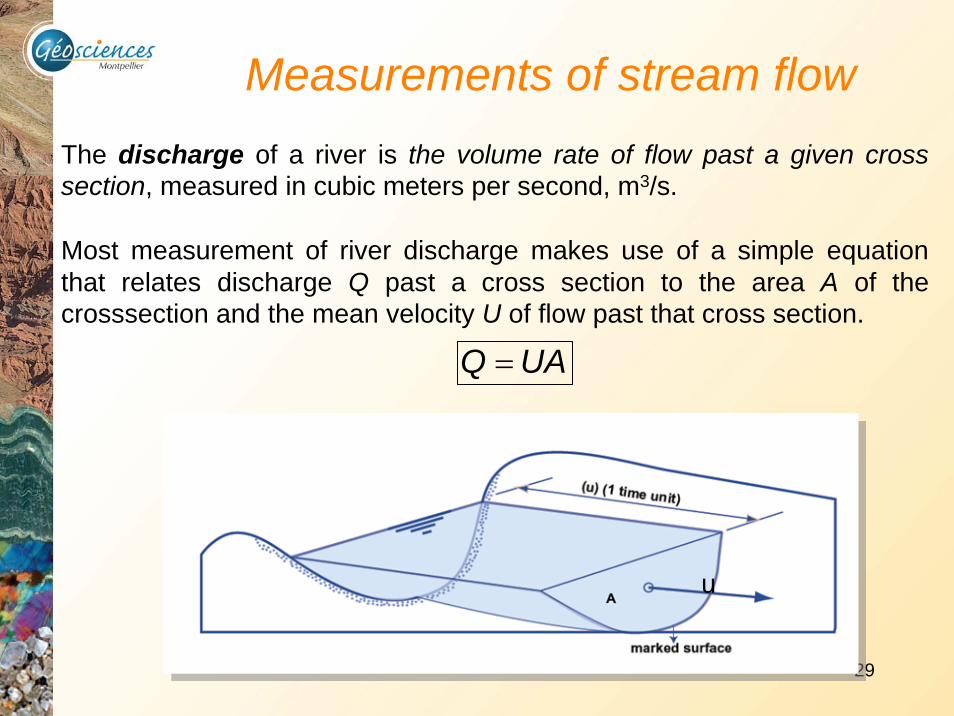
Measurements of stream flowThe discharge of a river is the volume rate of flow past a given cross section, measured in cubic meters per second, m3/s.
Most measurement of river discharge makes use of a simple equationthat relates discharge Q past a cross section to the area A of the crosssection and the mean velocity U of flow past that cross section.
UAQ =
u
30
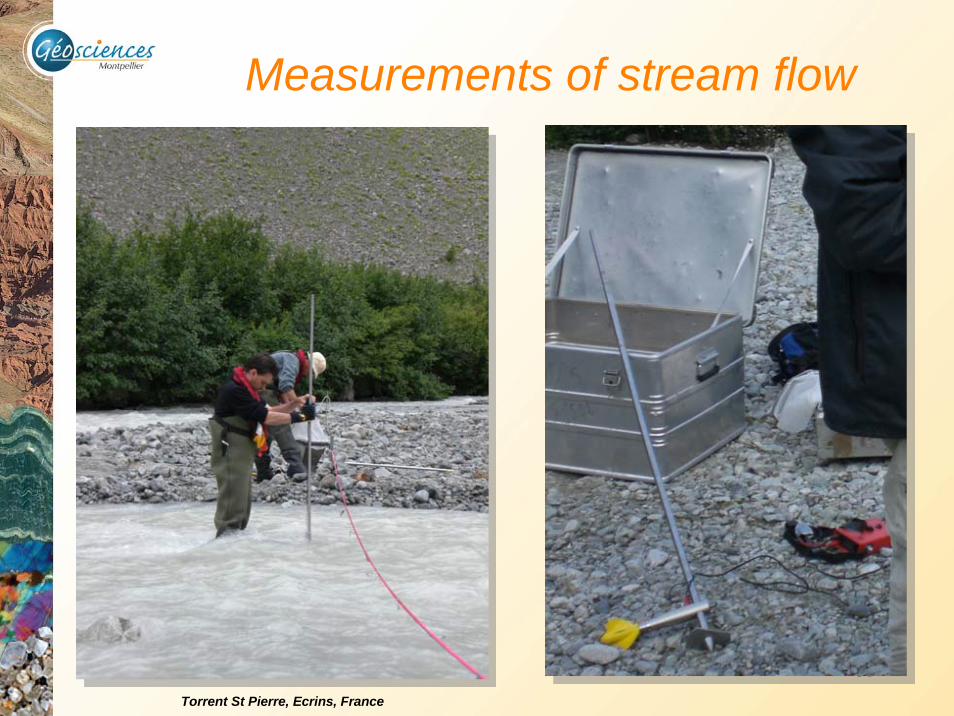
Measurements of stream flow
Torrent St Pierre, Ecrins, France

31
Measurements of stream flow
Hydrographs

32
Measurements of stream flow
Stage-discharge diagram or rating curve

33
Measurements of stream flow

34
Measurements of stream flow
AB: end of spell without rainfall; all surface runoff has ceased, and groundwater runoff is gradually decreasing.B: surface runoff from a rainstorm reaches the channel.BC: this is the rising limb of the hydrograph; surface runoff increasessharply.

35
Measurements of stream flow
C: this is the peak or crest of the hydrograph; surface runoff peaks.CD: this is the falling limb or recession limb of the hydrograph. Groundwater runoff peaks here somewhere, then tails off slowly; surface runoff decreases to zero.D: by this time there’s no more surface runoff, only decreasinggroundwater runoff.

36
Measurements of stream flow
A B
C
D
37
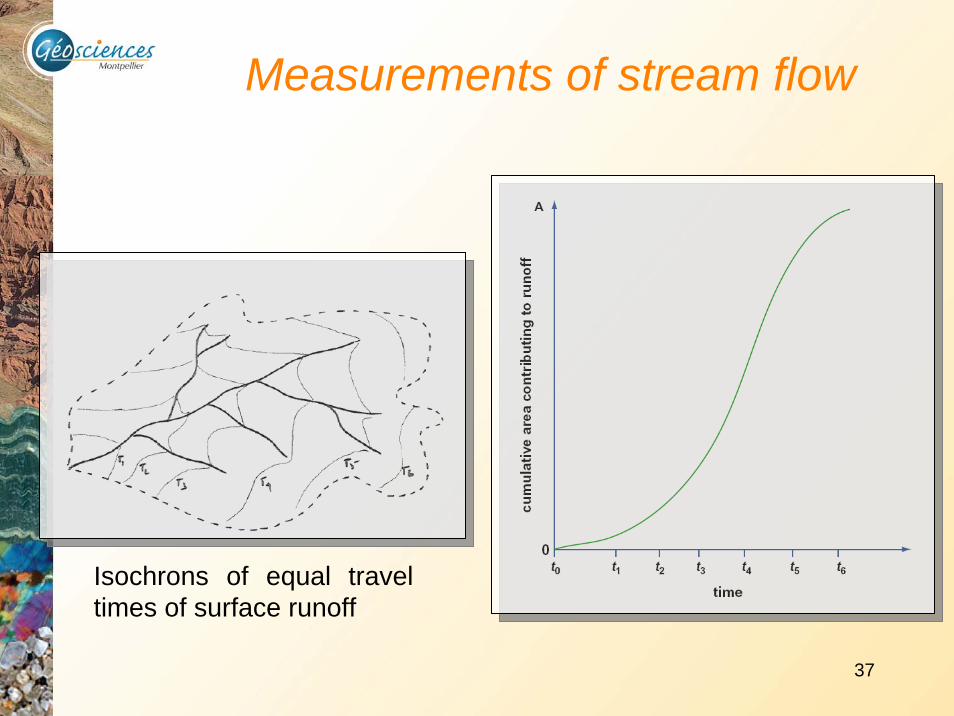
Measurements of stream flow
Isochrons of equal traveltimes of surface runoff

38
The resistance equation for open channel flow
39
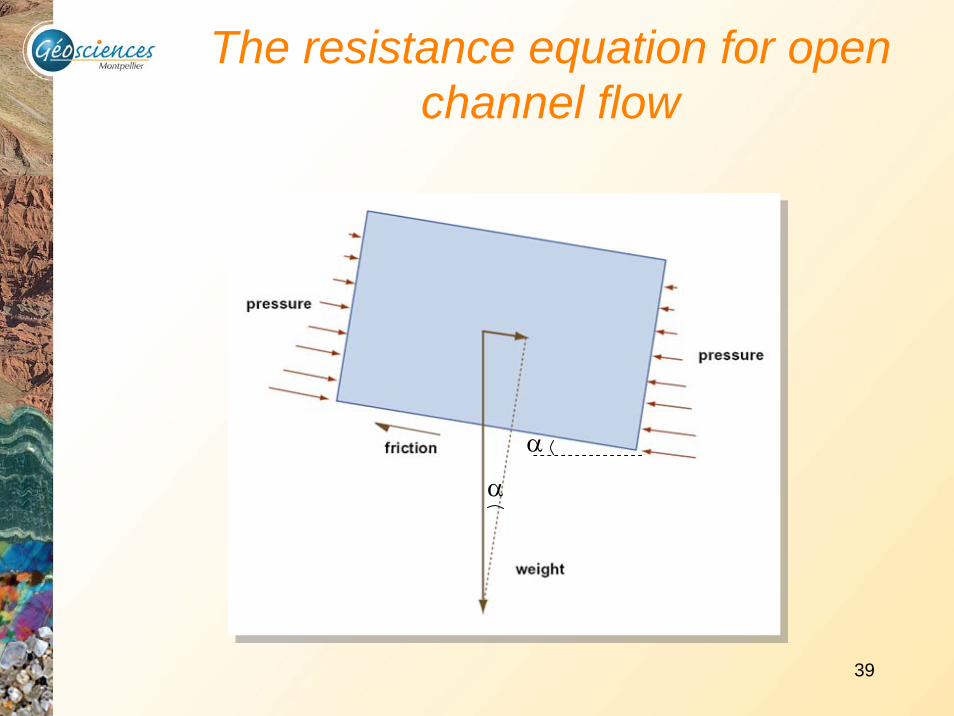
The resistance equation for open channel flow
α
α

40
The resistance equation for open channel flow
α

41
The resistance equation for open channel flow
α
α
Hydrostatic fluid pressure on both upstream and downstream are the sameand they act opposite to each other.

42
The resistance equation for open channel flow
α
α
W
)).(1.( WforceFrictional oτ=
Basal shear stress

43
The resistance equation for open channel flow
α
α αρ sin.).).(1.(weigththeof
componentDownstream
gAw=
A

44
The resistance equation for open channel flow
WgA
gAW
wo
wo
αρτ
αρτsin...
sin.).).(1.().1.(
=⇒
=
W
d αρτ sin....
gddWA
wo =⇒=

45
Stream power
river bedFrom Burbank & Anderson, 2001
Δx
Δh Stream power = rate of change of potential energy
xtE
lengthunitpowerStream p
ΔΔ
Δ==Ω
.
xhgQQ
tm
tm
tVQ w
ww
w
ΔΔ
=Ω⇒=Δ
⇔Δ
=Δ
=....
.ρρ
ρ
SgQ w ...ρ=Ω⇒xhS
ΔΔ
=
xthgmhgmEp ΔΔ
Δ=Ω⇒Δ=Δ
.....Recall that change of potential energy
Discharge
Slope

46
Stream power
river bedFrom Burbank & Anderson, 2001
Δx
ΔhSpecific Stream power = power available per unit area of the bed
WgQS
Wwρω =
Ω=
W
d
txSdg
txdWQ w Δ
Δ=⇒
ΔΔ
=ααρωαα cos/)cos()cos/)(cos(But
αα tanS that and,cos/ thatRecall =Δ
Δ=
txU
Udgw αρω sin So, = Uoτω =⇒
47
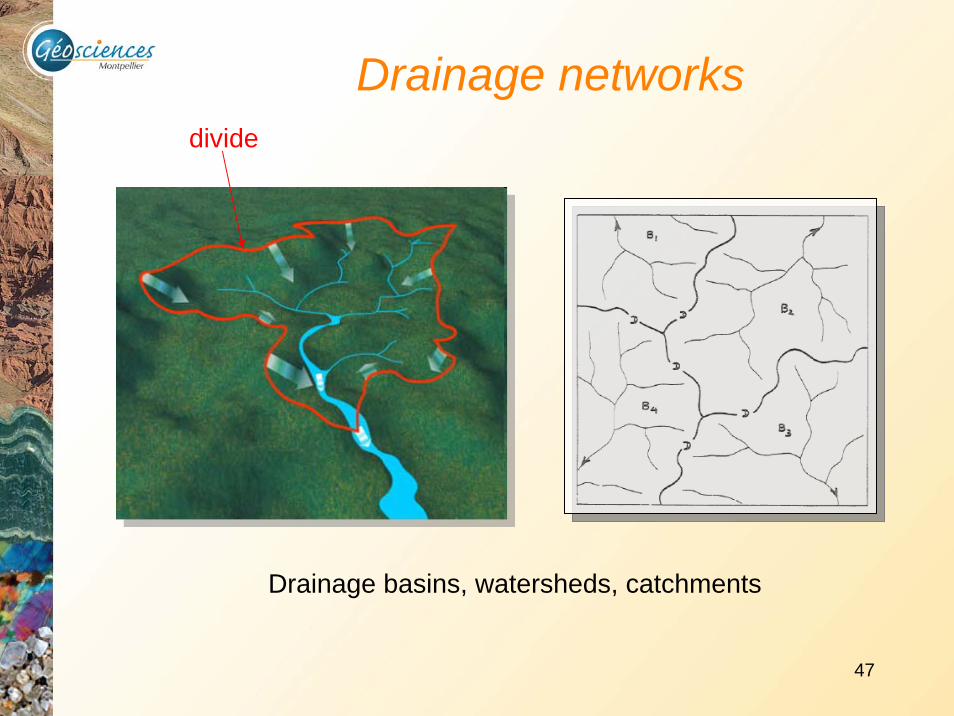
Drainage networks
Drainage basins, watersheds, catchments
divide

48
Drainage networks

49
Drainage networks
Putorana Plateau, Russia

50
Drainage networks
Canadian shield

51
Drainage networks
Wyoming, USA

52
Drainage networks
Cantal, France

53
Drainage networks
Central Tibet

54
Drainage networks
Strahler Stream OrderArthur Newell Strahler, 1918-2002

55
Drainage networks
Order Number of Segments
Bifurcation Ratio
1 142 43 1
3.54
1
2
3
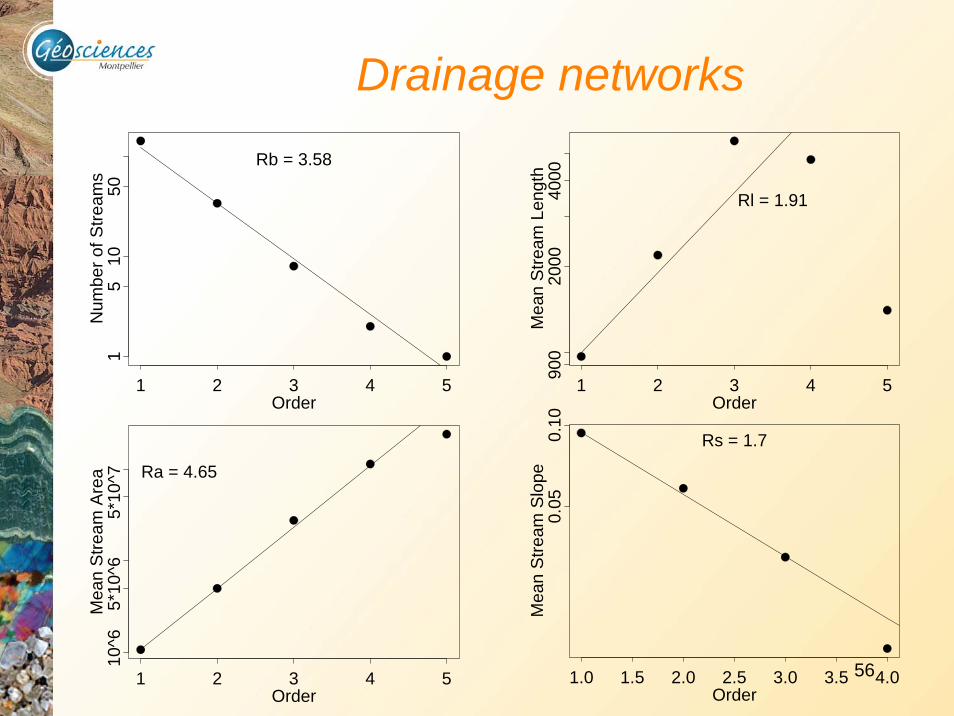
56
Drainage networks
Order
Num
ber o
f Stre
ams
1 2 3 4 5
15
1050
Rb = 3.58
Order
Mea
n S
tream
Len
gth
1 2 3 4 5
900
2000
4000
Rl = 1.91
Order
Mea
n S
tream
Are
a
1 2 3 4 5
10^6
5*10
^65*
10^7 Ra = 4.65
Order
Mea
n S
tream
Slo
pe
1.0 1.5 2.0 2.5 3.0 3.5 4.0
0.05
0.10
Rs = 1.7

57
Drainage networks
Link Contributing Area
Link
Slo
pe
5*10^4 5*10^5 5*10^6 5*10^7
0.00
50.
050
0.50
0
S ~ A^-0.35
Data from Reynolds Creek 30 m DEM, 50 grid cell threshold, points, individual links, big dots, bins of size 100
Flint’s Law
6.03.0. <<= − θθ avecAkS

58
Drainage networks
Montgomery et al., 1996

59
Drainage networks
Link Contributing Area
Long
est U
pstre
am L
engt
h
10^3 10^5 10^7 10^9
500
5000
5000
0L = 1.7 A^0.51
Hack’s Law
6.05.0. << havecACL hlα