dynamics and performance
TRANSCRIPT
DYNAMICS AND PERFORMANCE
OF FLYING DISCS
A thesis submitted to the University of Manchester for the degree of
Doctor of Philosophy
in the Faculty of Engineering and Physical Sciences
2011
Noorfazreena Mohammad Kamaruddin
School of Mechanical, Aerospace and Civil Engineering

Table of Contents
1
Table of Contents
Table of Contents ........................................................................................................ 1
List of Figures ............................................................................................................. 4
List of Tables............................................................................................................. 12
Nomenclature ............................................................................................................ 14
Abstract ..................................................................................................................... 17
Declaration ................................................................................................................ 18
Copyright Statement ................................................................................................. 18
Acknowledgement..................................................................................................... 20
1 Introduction ....................................................................................................... 21
1.1 Introductory remarks .................................................................................. 22
1.2 Thesis aim ................................................................................................... 26
1.3 Thesis objectives ........................................................................................ 27
2 Literature Review .............................................................................................. 28
2.1 Development of disc research .................................................................... 30
2.1.1 Experimental work .............................................................................. 30
2.1.2 Computational work ............................................................................ 37
2.2 Range of Flying Objects ............................................................................. 40
2.2.1 Balls .................................................................................................... 40
2.2.2 Discus .................................................................................................. 43
2.2.3 Javelin ................................................................................................. 45
2.2.4 Shot Put ............................................................................................... 46
3 Theoretical Background .................................................................................... 49
3.1 Disc dynamics ............................................................................................ 51

Table of Contents
2
3.1.1 Aerodynamics ..................................................................................... 51
3.1.2 Flight dynamics ................................................................................... 53
3.1.3 Disc Simulation ................................................................................... 55
3.2 Range and sensitivity .................................................................................. 60
3.2.1 Sensitivity analysis of a spherical projectile ....................................... 61
3.2.2 Disc range and sensitivity ................................................................... 63
4 Methods ............................................................................................................. 65
4.1 Experimental Method ................................................................................. 67
4.1.1 Experimental Apparatus ...................................................................... 67
4.1.2 Disc Models ........................................................................................ 72
4.1.3 Experimental Measurements ............................................................... 78
4.1.4 Measurement Uncertainty ................................................................... 81
4.2 Numerical Simulation Method ................................................................... 85
4.2.1 Simulation Implementation ................................................................. 85
4.2.2 Initial conditions setup ........................................................................ 85
5 Experimental Results and Discussions ............................................................. 86
5.1 Finite wing theory and flat plate data ......................................................... 88
5.2 Parametric discs .......................................................................................... 90
5.2.1 Effect of thickness ............................................................................... 91
5.2.2 Effect of rim edge curvature ............................................................... 96
5.2.3 Effect of camber ................................................................................ 100
5.2.4 Effect of cavity .................................................................................. 103
5.3 Commercial Golf Discs ............................................................................ 106
6 Simulation Results and Discussions ............................................................... 118
6.1 Sphere flight trajectories .......................................................................... 120
6.1.1 Range and sensitivity of sphere......................................................... 120
6.1.2 Comparison for dimensionless range and sensitivity of sphere with
flying discs ...................................................................................................... 121
6.2 Golf disc flight trajectories ....................................................................... 123
6.2.1 XY and XZ plane .............................................................................. 123
6.2.2 Golf disc landing locations ............................................................... 130
6.3 Effect of release attitude on range ............................................................ 131

Table of Contents
3
6.3.1 Effect of varying launch pitch angles on range (at fixed launch roll
angle) 131
6.3.2 Effect of varying launch roll angles on range (at fixed launch pitch
angle) 133
6.4 Golf disc range and sensitivity ................................................................. 135
6.4.1 Disc range sensitivity as a function of launch pitch angles .............. 136
6.4.2 Golf disc favourable shot .................................................................. 143
7 Conclusions and Future Works ....................................................................... 145
7.1 Concluding remarks ................................................................................. 146
7.2 Future research recommendations ............................................................ 149
References ............................................................................................................... 154
Appendix A ............................................................................................................. 166
Final Word Count: 31, 036.

List of Figures
4
List of Figures
Figure 1.1: A disc-golf player player throwing a golf disc towards a target basket on
a pole above the ground (Taken from PDGA). ......................................................... 22
Figure 1.2: Schematic cross-sectional profiles of the driver (top), mid-range and
putter (bottom) discs. ................................................................................................ 24
Figure 2.1: Outline of Chapter 2. .............................................................................. 29
Figure 2.2: Effect of spin on the aerodynamic coefficients for Frisbee at V = 20 m s-1
for various spin rates of 0, 4, 8, 16, 24 Hz. Spin has very minimal effect on disc
aerodynamic loads (Taken from Potts, 2005). .......................................................... 32
Figure 2.3: The trailing vortex pair at various spin rates at Reynolds number of 5.67
x 104. Spin causes an asymmetric vortex wake (Taken from Potts, 2005). .............. 34
Figure 2.4: Frisbee throwing model to study the backhand throw. The humerus
produces the highest source of launch energy at 100 W while the wrist flick only
manages to produce 8 W (Taken from Hummel, 2003)............................................ 35
Figure 2.5: Frisbee free-flight data is obtained using on-board instrumentation.
Electronic devices such as pressure sensor, infra-red sensor, accelerometer and
magnetometer are mounted underneath the Frisbee cavity (Taken from Lorenz,
2006). ........................................................................................................................ 36
Figure 2.6: Inspired disc-wing aircraft designs. Photos of (a)-(c) are taken from
Lorenz (2006) and (d) from Lindenbaum and Blake (1998)..................................... 37
Figure 2.7: The “bouncing bomb” developed by Barnes Wallis used similar principle
as a bouncing golf ball (Taken from Podesta, 2007). ............................................... 40

List of Figures
5
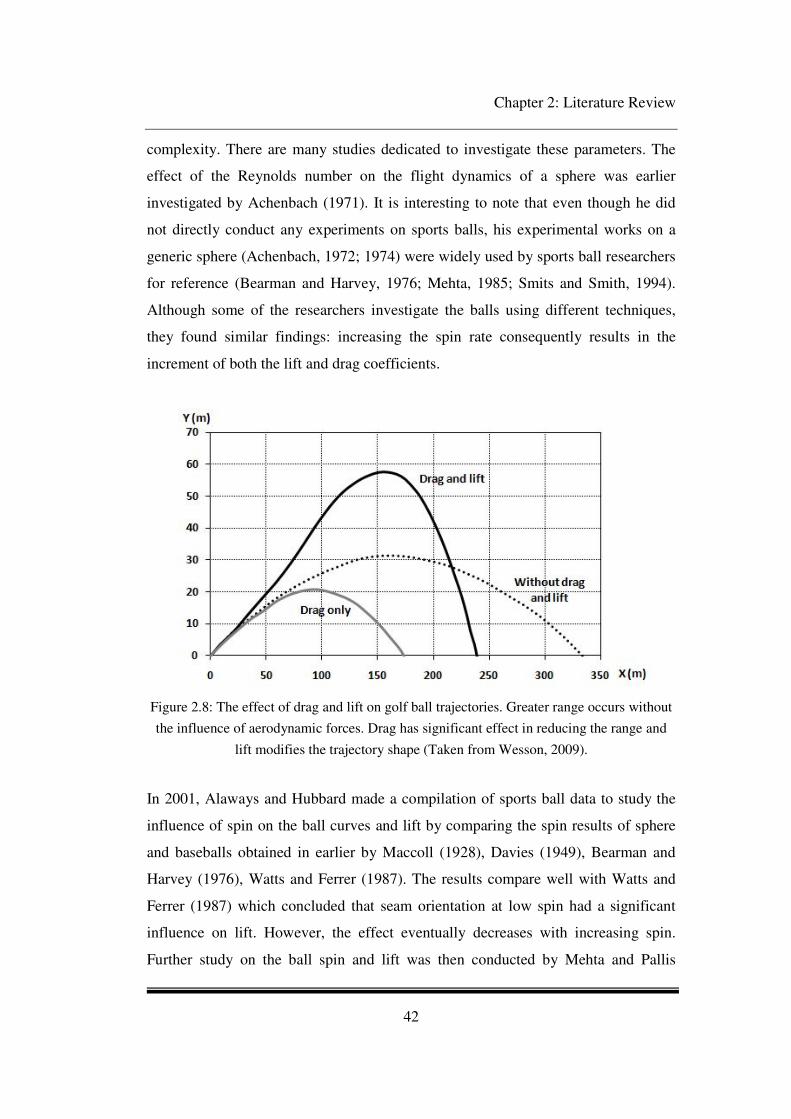
Figure 2.8: The effect of drag and lift on golf ball trajectories. Greater range occurs
without the influence of aerodynamic forces. Drag has significant effect in reducing
the range and lift modifies the trajectory shape (Taken from Wesson, 2009). ......... 42
Figure 2.9: Jürgen Schult hold the men’s World Record in 1986 with a throw of
74.08 m. (Taken from German Federal Archive, 1988). .......................................... 44
Figure 2.10: The most common throwing techniques in shot-putting. The
preliminary movements are different but the delivery phases are similar (Taken from
Linthorne, 2001). ....................................................................................................... 48
Figure 3.1: Outline of Chapter 3. .............................................................................. 50
Figure 3.2: The aerodynamic forces acting on a disc (Taken from Potts, 2005). ..... 51
Figure 3.3: The longitudinal forces and moments acting on a disc. Trim
characteristics of a disc as an example of a tailless flight vehicle. A disc must have a
positive camber to provide balance (Taken from Potts, 2005). ................................ 53
Figure 3.4: Trim characteristics of a disc as an example of a tailless flight vehicle. A
disc must have a positive camber to provide balance (Taken from Potts, 2005). ..... 54
Figure 3.5: The relationship between earth axes (xyz)1 and body axes (xyz)2
coordinate systems defined in terms of the Euler roll (φ), pitch (θ)and yaw (ψ)
angles (taken from Crowther and Potts, 2007).......................................................... 56
Figure 3.6: The zero sideslip body axes are obtained by rotating the body axes
through the sideslip angle (β2). The zero sideslip wind axes are obtained by rotating
the body axes through the angle of attack (α3) (taken from Crowther and Potts,
2007). ........................................................................................................................ 56
Figure 3.7: The location of the disc aerodynamic centre. ......................................... 59

List of Figures
6
Figure 3.8: Motion of a sphere under uniform acceleration due to gravity and no
aerodynamic forces. .................................................................................................. 61
Figure 4.1: Outline of Chapter 4. .............................................................................. 66
Figure 4.2: Diagram of the Project Wind Tunnel facility at the Goldstein Research
Laboratory of the University of Manchester in Barton. ............................................ 67
Figure 4.3: A photograph of the working section in the wind tunnel facility. .......... 68
Figure 4.4: (a) Illustration of the wind tunnel balance from the side. Drag and pitch
transducers are hidden on the other side. (b) Overview of the round turntable and
strut bolted to the balance frame. (c) View of the round turntable connected to the
balance. (d) View of the strut screwed to the balance I-beam. ................................. 69
Figure 4.5: The balance yaw angle controller used to vary the disc pitch angle for
aerodynamic load measurement and the balance incidence angle controller used to
vary the disc incidence angle for surface flow visualisation. ................................... 70
Figure 4.6: Load measurement rig setup in the test section. ..................................... 71
Figure 4.7: Flow visualisation rig setup in the test section. ...................................... 71
Figure 4.8: Parametric disc models constructed to study the effect of thickness. .... 73
Figure 4.9: Parametric disc models constructed to study the effect of camber......... 73
Figure 4.10: Parametric disc models constructed to study the effect of edges
curvature. ................................................................................................................... 74
Figure 4.11: Parametric disc models constructed to study the effect of cavity......... 74
Figure 4.12: Schematic view of a typical golf disc profile geometry. ...................... 75

List of Figures
7
Figure 4.13: Schematic view of commercial golf discs full cross-sectional profiles
focussing on the rim edge curvatures that vary in between discs. ............................ 76
Figure 4.14: (a) Illustration of the flow visualisation chemicals. (b) Ratio of kerosene
and fluorescent powder mixture. ............................................................................... 80
Figure 4.15: (a) Illustration of the drag calibration setup. (b) View of the
inclinometer used to check the frame is level. .......................................................... 82
Figure 4.16: Illustration of the strut tare and interference effects. (a) View of the
support strut bolted to the balance beam and dummy strut bolted to the turn table. 84
Figure 5.1: Outline of Chapter 5. .............................................................................. 87
Figure 5.2: Comparison of the flat plate data discs to finite wing theory. ................ 89
Figure 5.3: Comparison of the influence of disc thickness on aerodynamic
characteristics. ........................................................................................................... 93
Figure 5.4: Surface flow visualisations performed on flat plate discs with t/d = 0.01
and 0.1 with increasing angle of attack. Regions of separated flow near the leading
edge indicated by the crescent shape separation line increases with thickness. The
flow direction is vertically from top to bottom of the image. ................................... 95
Figure 5.5: Influence of disc rim edge curvature on aerodynamic characteristics.... 98
Figure 5.6: Surface flow visualisations performed on rounded and sharp edge discs
at angle of attack = 0o. Regions of separated flow edge indicated by the crescent
shape separation line can be seen near the leading edge for rounded edge disc. The
line moves downstream nearly 25% of the disc diameter for sharp edge disc. A pair
of nodes was produced which indicate the detachment of trailing vortices from the
surface. The flow direction is vertical from top to bottom of the image. ................. 99

List of Figures
8
Figure 5.7: Influence of disc camber on aerodynamic characteristics. ................... 102
Figure 5.8: Influence of disc cavity on aerodynamic characteristics. ..................... 104
Figure 5.9: Comparison of the aerodynamic forces and moment data for typical
putter, mid-range and driver discs with a flat plate disc t/c = 0.01 and a Frisbee
(Potts, 2005). ........................................................................................................... 112
Figure 5.10: Comparison of the aerodynamic forces and moment data for a putter
disc ‘Aviar’ with a flat plate disc t/c = 0.01 and a Frisbee (Potts, 2005) disc. ....... 113
Figure 5.11: Comparison of the aerodynamic forces and moment data for the
commercial ‘driver’ golf discs. ............................................................................... 114
Figure 5.12: Comparison of the aerodynamic forces and moment data for all
commercial golf discs with a flat plate disc t/c = 0.01. ........................................... 115
Figure 5.13: Comparison of the upper surface flow visualisation for commercial
driver discs at α = 0o and α = 5
o. The flow direction is vertically from top to bottom
of the image. ............................................................................................................ 116
Figure 5.14: Comparison of the lower surface flow visualisation for commercial
driver discs at α = 0o and α = 5
o. The flow direction is vertically from top to bottom
of the image. ............................................................................................................ 117
Figure 6.1: Outline of Chapter 6. ............................................................................ 119
Figure 6.2: Comparison of sphere with drag at varying launch speed for dimensional
range. ....................................................................................................................... 120
List of Figures
9
Figure 6.3: Comparison between flying discs with spheres at launch speed 20 m s-1
.
The flying disc curves generally skewed to the left mainly due to the influence of lift
and causes the optimal launch pitch angle to occur at lower values. ...................... 122
Figure 6.4: Comparison of the (a) putter, (b) mid-range and (c) driver disc in plan
view as the launch pitch angles vary from 5o to 30
o. The initial conditions are: VL =
20 m s-1, φL = 0o, αL = 0o, ψL = 0o. .......................................................................... 126
Figure 6.5: Comparison of the (a) putter, (b) mid-range and (c) driver disc in side
view as the launch pitch angles vary from 5o to 30
o. The initial conditions are: VL =
20 m s-1
, φL = 0o, αL = 0
o, ψL = 0
o. .......................................................................... 127
Figure 6.6: Comparison of the (a) putter, (b) mid-range and (c) driver disc in plan
view as the launch roll angles vary from -30o to 30
o. The initial conditions are: VL =
20 m s-1
, θL = 15o, αL = 0
o, ψL = 0
o. ......................................................................... 128
Figure 6.7: Comparison of the (a) putter, (b) mid-range and (c) driver disc in side
view as the launch roll angles vary from -30o to 30
o. The initial conditions are: VL =
20 m s-1
, θL = 15o, αL = 0
o, ψL = 0
o. ......................................................................... 129
Figure 6.8: Attitude time histories for a typical putter, mid-range and driver discs
launched at VL = 20 m s-1
, θL = 15o, αL = 0
o, ψL = 0
o. Note that driver disc roll rate
magnitude is higher than mid-range or putter disc (t’ is the dimensionless time). . 130
Figure 6.9: The landing locations for putter, mid-range and driver discs as a function
of launch roll angles from -30o to 30
o at different launch speed. The launch pitch
angle is fixed at θL = 15o and AdvR = 0.5. .............................................................. 131
Figure 6.10: The effect of varying launch pitch angles towards range for putter, mid-
range and driver discs. VL = 20 m s-1
, φL = 0o, αL = 0
o, ψL = 0
o, AdvR = 0.5. ...... 134

List of Figures
10
Figure 6.11: The effect of varying launch roll angles towards range for putter, mid-
range and driver discs. VL = 20 m s-1, θL = 15o, αL = 0o, ψL = 0o, AdvR = 0.5. ..... 135
Figure 6.12: Dimensional comparison of putter disc launched at varying launch
speed. The shape of the peak bucket is generally wider indicates that putter disc is
less sensitive to the changes in launch conditions. ................................................. 139
Figure 6.13: Dimensional comparison of driver disc launched at varying launch
speed. The shape of the peak bucket is generally narrow indicates that driver disc is
more sensitive to the changes in launch conditions. ............................................... 140
Figure 6.14: Dimensionless comparison of putter disc launched at varying launch
speed. The optimal launch pitch angle generally increases as speed reduces and the
most favourable shot occurs at dR’/dθ = 0 as range sensitivity is zero at this point.
................................................................................................................................. 141
Figure 6.15: Dimensionless comparison of driver disc launched at varying launch
speed. The optimal launch pitch angle that corresponds to zero sensitivity generally
increases as speed reduces. ..................................................................................... 142
Figure 6.16: Discs designed for long range such as driver is highly sensitive to the
changes in launch conditions and therefore, requires a greater skill to control. In
contrast, putter disc typically covers a much shorter distance but they are less
sensitive to the changes in launch conditions and therefore, easier to control at
launch. ..................................................................................................................... 144
Figure A1: Flight trajectories for typical putter, mid-range and driver discs at
varying launch roll angles: 5o, -5o, 0o. The initial conditions are: VL = 20 m s-1, θL =
15o, αL = 0
o, ψL = 0
o, AdvR = 0.5, unless stated otherwise....................................166

List of Figures
11
Figure A2: Flight trajectories for typical putter, mid-range and driver discs at varying launch
pitch angles from 5o to 30o. The initial conditions are: VL = 20 m s-1, φL = 0o, αL = 0o, ψL =
0o, AdvR = 0.5, unless stated otherwise.....................................................................167
Figure A3: Flight trajectories for typical putter, mid-range and driver discs at
varying launch roll angles: 30o, -30o, 20o, -20o, 10o, -10o. The initial conditions are:
VL = 20 m s-1
, θL = 15o, αL = 0
o, ψL = 0
o, AdvR = 0.5, unless stated otherwise....168

List of Tables
12
List of Tables
Table 4.1: The properties of commercial golf discs. ................................................. 77
Table 4.2: Wind tunnel balance ranges and tolerances. ............................................ 83
Table 5.1: Summary of parametric discs aerodynamic data. .................................... 90
Table 5.2: Location of the aerodynamic centre with respect to the disc thickness. A
thinner disc produces a larger nose up pitching moment, as a result of the position of
the aerodynamic centre located further from the disc centre of gravity (indicated by a
higher % of the chord length ahead of the half chord point). ................................... 96
Table 5.3: Location of the aerodynamic centre with respect to the disc rim edge
curvature. A square edge disc produces a reduced nose up pitching moment, as a
result of the position of the aerodynamic centre located closer to the disc centre of
gravity (indicated by a lower % of the chord length ahead of the half chord point).
................................................................................................................................. 100
Table 5.4: Location of the aerodynamic centre with respect to the disc camber. A
disc with higher camber produces a larger nose up pitching moment, as a result of
the position of the aerodynamic centre located further from the disc centre of gravity
(indicated by a higher % of the chord length ahead of the half chord point). ......... 103
Table 5.5: Location of the aerodynamic centre with respect to the disc cavity height.
A disc with higher cavity height produces a reduced nose up pitching moment, as a
result of the position of the aerodynamic centre located closer to the disc centre of
gravity. .................................................................................................................... 106
Table 5.6: A summary of the wind tunnel aerodynamic characteristics data for the
commercial golf discs. ............................................................................................ 110

List of Tables
13
Table 5.7: Location of the aerodynamic centre for commercial golf discs. A putter
disc generally produces a reduced nose up pitching moment as a result of the
position of the aerodynamic centre located closer to the disc centre of gravity
(indicated by a lower % of the chord length ahead of the half chord point). The result
is in contrast with a driver disc which generally produces a larger nose up pitching
moment. ................................................................................................................... 111
Table 6.1: The golf discs local optimal launch pitch angles that correspond to the
disc maximum distance at φL = 0o. ......................................................................... 132
Table 6.2: The golf discs local optimal launch roll angles that correspond to the disc
maximum distance. ................................................................................................. 133

Nomenclature
14
Nomenclature
AdvR advance ratio
d disc diameter (m)
c chord (m)
CD drag coefficient
CL lift coefficient
CM pitching moment coefficient
CX axial coefficient
CZ normal coefficient
CY side coefficient
CMcg pitching moment coefficient about centre of gravity
CMo zero lift pitching moment coefficient
CN yawing moment coefficient
CR rolling moment coefficient
FX axial force (N)
FZ normal force (N)
FY side force (N)
FR rolling moment (N)
L lift force (N)
D drag force (N)
g gravitational acceleration (m s-2
)
kn static margin
Nomenclature
15
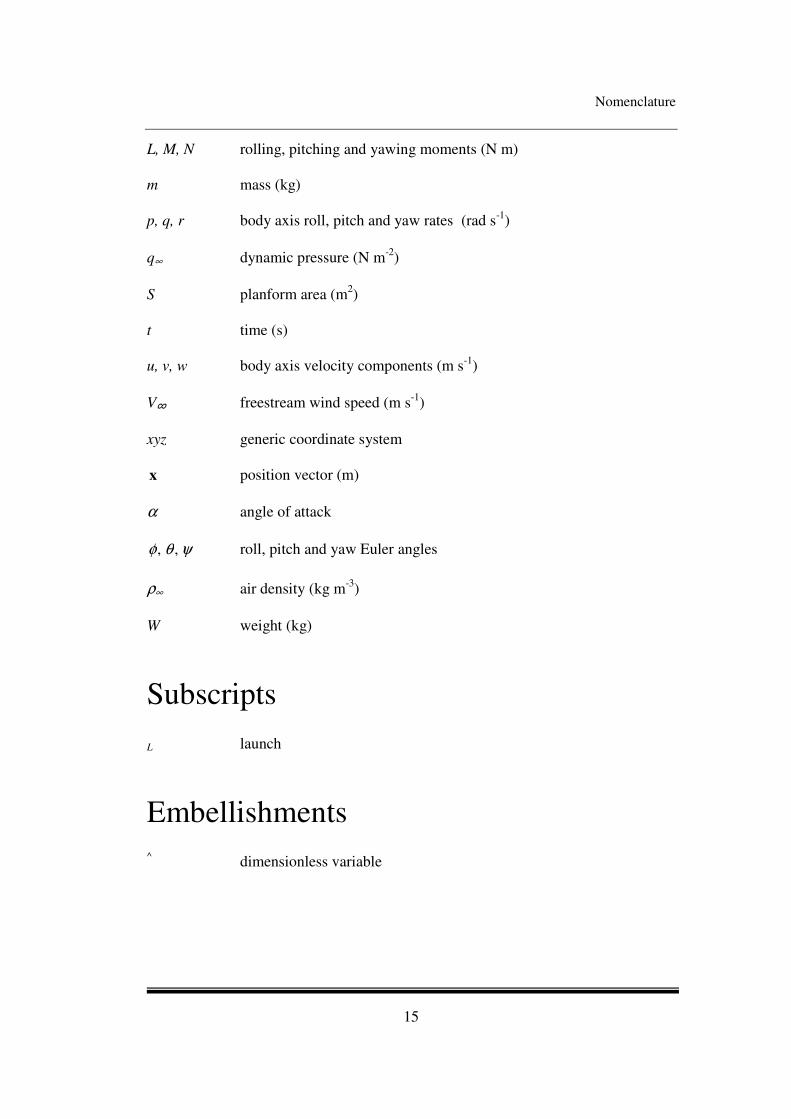
L, M, N rolling, pitching and yawing moments (N m)
m mass (kg)
p, q, r body axis roll, pitch and yaw rates (rad s-1)
q∞ dynamic pressure (N m-2
)
S planform area (m2)
t time (s)
u, v, w body axis velocity components (m s-1)
V∞ freestream wind speed (m s-1
)
xyz generic coordinate system
x position vector (m)
α angle of attack
ψθφ ,, roll, pitch and yaw Euler angles
ρ∞ air density (kg m-3
)
W weight (kg)
Subscripts
L launch
Embellishments
^ dimensionless variable

Nomenclature
16
Abbreviations
AoA angle of attack
cg centre of gravity
cp centre of pressure
ac aerodynamic centre
R dimensional range (m)
R’ dimensionless range
θL launch pitch angle (degree)
ϕL launch roll angle (degree)
V’ dimensionless speed
t time (s)
t’ dimensionless time
Ttotal total time (s)
VL launch speed (m s-1
)
Vo initial speed (m s-1
)
t/d thickness-to-diameter ratio
ch/t cavity height-to-thickness ratio
t time (s)
L/D lift-to-drag ratio

Abstract
17
Abstract
ABSTRACT OF THESIS submitted by Noorfazreena Mohammad Kamaruddin
for the Degree of Doctor of Philosophy and entitled ‘Dynamics and Performance
of Flying Discs’.
Submitted October 2011
The study of dynamics and performance of flying discs is motivated by how
variations in their design features influence the aerodynamic characteristics and
flight performance, particularly range. Reviews in the literature focus on the
development of fundamental research in flying discs and on the performance of
sports projectiles. Theoretical background on disc dynamics, range and sensitivity
are given. This work investigates disc aerodynamics by performing wind tunnel
experiments to measure aerodynamic loads on a set of generic parametric discs and a
set of commercial golf discs. The parametric discs isolate various geometrical
features such as thicknesses, cavities, leading edge curvatures and cambers to study
the influence of these parameters on aerodynamic characteristics. The commercial
golf discs consist of three different categories known as putter, mid-range and
driver: these discs are used for short, medium and long flight range, respectively. To
study the performance, aerodynamic data of the golf discs are used as inputs in
numerical simulations to predict their flight trajectories and range. Effects of launch
attitude on range are assessed to study the optimal initial launch conditions to
achieve maximum range. Further, the simulation provides a direct approach to
analyse range sensitivity on launch parameters.
Results from the experiments show a number of significant findings on disc
geometry. First, a cavity is fundamentally important for a disc to have satisfactory
flying qualities: the presence of the cavity produces a significant aft shift in the
aerodynamic position to minimize the pitching moment about the centre of the disc.
Hence, the disc will have a minimal tendency to roll about the flight axis. Second,
the thickness of a disc has a significant effect on its profile drag: increasing the
thickness increases the profile drag. Third, a disc with a positive camber produces a
relatively higher lift-to-drag ratio (CL/CD) compared to one with no camber. Fourth,
the effect of tapering a flat leading or trailing edge of a disc leads to a reduction in
its lift (within the angles of attack tested in the study) with a significant reduction in
its drag. Fifth, it is shown that peak lift-to-drag ratio of a free flying disc is not
necessarily a good indicator of performance because the angle of attack (and hence,
lift-to-drag ratio) varies widely through a typical flight. Furthermore, a disc with a
significant pitching moment will roll significantly about the flight path direction,
further reducing the achievable range for a given lift or drag characteristic. Finally, a
novel method to quantify disc sensitivity with respect to changes in launch
conditions has been developed. The simulations show that the range sensitivity of
each disc with respect to launch pitch angle varies significantly, with discs design
for long range being much more sensitive (and therefore harder to throw accurately)
than discs designed for short range.
Declaration
18
Declaration
No portion of the work referred to in the thesis has been submitted in support of an
application for another degree or qualification of this or any other university or other
institute of learning.
Noorfazreena Mohammad Kamaruddin, October 2011.
Copyright Statement
The author of this thesis (including any appendices and/or schedules to this thesis)
owns certain copyright or related rights in it (the “Copyright” and s/he has given The
University of Manchester certain rights to use such Copyright, including for
administrative purposes.
Copies of this thesis, either in full or in extracts and whether in hard or electronic
copy, may be made only in accordance with the Copyright, Designs and Patents Act
1988 (as amended) and regulations issued under it or, where appropriate, in
accordance with licensing agreements which the University has from time to time.
This page must form part of any such copies made.
The ownership of certain Copyright, patents, design, trademarks and other
intellectual property (the “Intellectual Property) and any reproductions of copyright
works in the thesis, for example graphs and tables (“Reproductions”), which may be
described in this thesis, may not be owned by the author and may be owned by third
parties. Such Intellectual Property and Reproductions cannot and must not be made
available for use without the prior written permission of the owner(s) of the relevant
Intellectual Property and/or Reproductions.

Declaration
19
Further information on the conditions under which disclosure, publication and
commercialisation of this thesis, the Copyright and Intellectual Property and/or
Reproductions describes in it may take place is available in the University IP Policy
(seehttp://documents.manchester.ac.uk/medialibrary/polices/intellectual-
property.pdf), in any relevant Thesis restriction declarations deposited in the
University Library, The University Library’s regulations (see
http://www.library.manchester.ac.uk/aboutus/regulations/) and in The University’s
policy on Presentation of Theses.

Acknowledgement
20
Acknowledgement
In the Name of God, the Most Gracious, the Most Merciful. All Praises to the Almighty God
Who has given me so much strength throughout my PhD journey and with His Will, I
manage to complete this thesis.
My life has been like a roller-coaster for the past 4 years, but without help from the people
around me, it would be impossible to endure the ride. To my supervisor, Dr. William
Crowther, who taught me to be strong to face criticism, I will forever be indebted for his
help and guidance. To Dr. Jonathan Potts, my mentor, whom I went to for advice and
guidance throughout my research, I hope one day we will find the ‘Magic number’ if it ever
exists. To my friend Kailash who helped me to find a job, when I didn’t even have a pound
to ride the bus, I will never forget your kindness. To Chip, Chris, Paul, Ben, John, Matt,
Phil, Steve and David, thank you for the friendship. I now know how to brew a proper
English tea. To Andrew and Ian who helped me out when the wind tunnel decides to take a
‘break’, I am very grateful for the assistance. To the skilful lab technicians, Mike and Ken
who let me drilled my disc models even without safety clearance, I truly appreciate it. To
Dave, thank you for driving me out to Barton every day. I also would like to acknowledge
the financial support from my sponsors, the Universiti Sains Malaysia and the Ministry of
Higher Education Malaysia.
To my parents, Kamaruddin and Fadzillah, who have shaped me to be who I am today, who
support me all the time, I am eternally grateful for everything and for all the prayers.
Without their blessing, I don’t think I will be able to go this far. To my brother, Azfaruddin,
and his wife, Ekin, who are always there when I need them the most, I really missed you
guys.
I am deeply grateful that God has blessed me with a beautiful princess, Eisya Syifaa, who
stays late at night and constantly asking me what time I will finish my work, who made me
smile every day and means everything to me. Most of all, I am truly grateful to my beloved
husband, Zulfaa, who supports me throughout everything, who sacrifices his career so I can
pursue my dream, who never gives up on me and always believe in me. There are no words
enough to describe how grateful I am to have someone like him in my life. I pray to the
Almighty, that we will always be together...

Chapter 1: Introduction
21
Chapter 1
Introduction
1 Introduction

Chapter 1: Introduction
22
This chapter introduces the study presented in this thesis on flying discs and
describes the motivation behind it. A background on golf discs, which are studied
extensively in this work as models for the flying discs, is presented first with a
particular focus on their characteristics and flight dynamics. Two major phases of
this study are then described to highlight the significance of each phase. The aim of
this thesis is defined following the introduction. Finally, the objectives of each
chapter are described to establish the foundation of this thesis.
1.1 Introductory remarks
The game of disc golf was invented by Ed Headrick in the late 1960’s as an adapted
version of the standard game of golf. The game is similar to that of golf but uses
discs commonly known as golf discs instead of golf balls. The goal of a player is to
throw his or her disc with the least number of throws possible into a target hole,
which is a metallic basket placed above the ground on a pole looped with chains to
help capture the disc (a scene at a game of disc golf is shown in Figure 1.1). The
game is relatively new in the United Kingdom but has been increasingly popular in
the United States and managed by the Professional Disc Golf Association (PDGA).
Figure 1.1: A disc-golf player player throwing a golf disc towards a target basket on a pole
above the ground (Taken from PDGA).
Chapter 1: Introduction
23
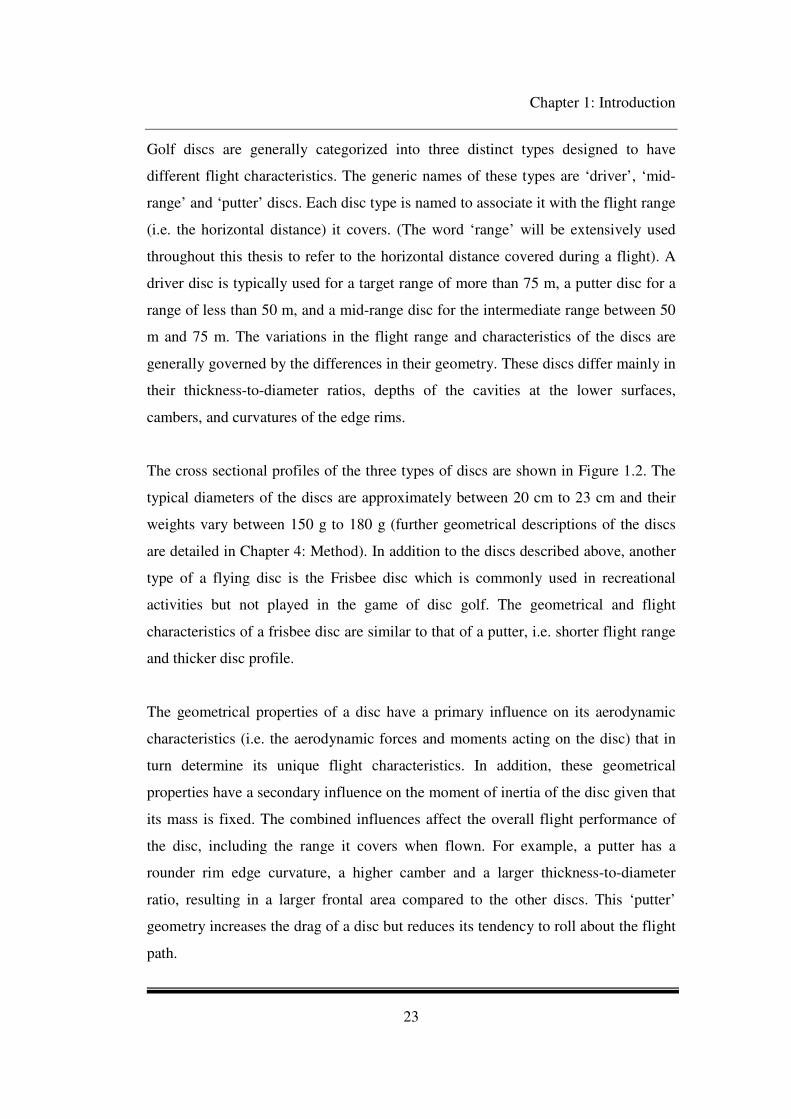
Golf discs are generally categorized into three distinct types designed to have
different flight characteristics. The generic names of these types are ‘driver’, ‘mid-
range’ and ‘putter’ discs. Each disc type is named to associate it with the flight range
(i.e. the horizontal distance) it covers. (The word ‘range’ will be extensively used
throughout this thesis to refer to the horizontal distance covered during a flight). A
driver disc is typically used for a target range of more than 75 m, a putter disc for a
range of less than 50 m, and a mid-range disc for the intermediate range between 50
m and 75 m. The variations in the flight range and characteristics of the discs are
generally governed by the differences in their geometry. These discs differ mainly in
their thickness-to-diameter ratios, depths of the cavities at the lower surfaces,
cambers, and curvatures of the edge rims.
The cross sectional profiles of the three types of discs are shown in Figure 1.2. The
typical diameters of the discs are approximately between 20 cm to 23 cm and their
weights vary between 150 g to 180 g (further geometrical descriptions of the discs
are detailed in Chapter 4: Method). In addition to the discs described above, another
type of a flying disc is the Frisbee disc which is commonly used in recreational
activities but not played in the game of disc golf. The geometrical and flight
characteristics of a frisbee disc are similar to that of a putter, i.e. shorter flight range
and thicker disc profile.
The geometrical properties of a disc have a primary influence on its aerodynamic
characteristics (i.e. the aerodynamic forces and moments acting on the disc) that in
turn determine its unique flight characteristics. In addition, these geometrical
properties have a secondary influence on the moment of inertia of the disc given that
its mass is fixed. The combined influences affect the overall flight performance of
the disc, including the range it covers when flown. For example, a putter has a
rounder rim edge curvature, a higher camber and a larger thickness-to-diameter
ratio, resulting in a larger frontal area compared to the other discs. This ‘putter’
geometry increases the drag of a disc but reduces its tendency to roll about the flight
path.

Chapter 1: Introduction
24
Figure 1.2: Schematic cross-sectional profiles of the driver (top), mid-range and putter
(bottom) discs.
The flight characteristics of a putter are similar to those of a typical frisbee disc,
which possesses shorter but straighter flight paths compared to long-range discs, i.e.
discs designed to travel farther distances. One such example of a long-range disc is a
driver disc, which is designed with a smaller frontal area due to its smaller
thickness-to-diameter ratio and a more aerodynamically streamlined shape to reduce
drag. The improved flight performance is, however, at the expense of an increased
tendency to roll about the flight path, which means that a player would need to have
greater throwing skills to achieve the same accuracy achieved when throwing a
putter disc. A mid-range disc is transitional in their design and performance
characteristics between those of a putter and a driver discs.
A flying disc, also known as a disc-wing or a circular planform wing, has by
definition an aspect ratio of 1.27 and thus can be generally classified as a low aspect
ratio wing. It requires spinning about its centre axis to achieve stability during flight
via the gyroscopic principle. The most recent and important work on the
aerodynamics of one type of flying discs – the Frisbee disc – was performed by Potts
(2005). His extensive experimental investigation with a secondary focus on flight
dynamics using numerical simulations lead to the observation that the aerodynamic
forces and moments acting on a disc are crucial to understanding its flight

Chapter 1: Introduction
25
characteristics. In addition, the spinning of a disc was observed by Potts to have
negligible effects on its aerodynamic characteristics (further details of the work are
described in the Chapter 2: Literature Review).
The work performed herein is motivated to investigate a variety of other discs with
different designs to analyse how their geometrical properties affect their
aerodynamic characteristics.
The earlier phase of the research reported herein focused on gathering experimental
data via wind tunnel testing to investigate the aerodynamic forces and moments
acting on the three different types of golf discs described above, i.e. the putter, the
mid-range, and the driver discs. The three designs chosen for each of the category
are based on existing commercially available golf discs (further details are provided
in the Chapter 4: Method). Results show that each discs exhibit aerodynamic
characteristics consistent with what was expected based on their generic flight
performance. For example, the drag coefficient of a putter disc is larger than that of
a driver disc at typical flight angles of attack. Wind tunnel experiments were also
performed on a ‘control’ disc, which is a flat-plate disc referred to hereafter as the
baseline disc.
In addition to the use of a control disc, a more systematic approach of isolating
various geometrical features of a disc was done. For this purpose, a large number of
disc models were fabricated. These discs have simpler design features compared to
those on the three golf discs experimented above; the design features of the simpler
discs were varied parametrically to isolate the effect of one geometrical property
while keeping other geometrical properties unchanged. These simpler disc models
will be extensively referred to hereafter as the parametric discs. Design features that
are particularly important to the aerodynamic characteristics of a disc in general are
its thickness-to-diameter ratio, cavity (at the lower surface of the disc), camber shape
and rim edge curvature: these features were isolated in this experimental study.

Chapter 1: Introduction
26
Analysis from this parametric study shows that the cavity of a disc fundamentally
influences its aerodynamic characteristics.
The later phase of this research is concentrated on evaluating the flight performance
and range of golf discs via numerical simulations of the complete six-degree-of-
freedom equations of motion of the discs developed by Crowther and Potts (2007).
These simulations allowed more detailed assessments on how the flight performance
of a disc was influenced by its aerodynamic characteristics. The experimental data
on the golf discs gathered in the first phase of study functioned as part of the input
parameters into the simulation. Another important aspect that the numerical
simulations allowed was how variations in the conditions of launching a disc (e.g.
the launch pitch and roll angles, and the launch speed) affect its flight trajectory.
Parametric variations of these launch conditions were performed to analyse their
sensitivity toward the performance of a disc. Different types of discs were found in
this study to have different sensitivity levels towards variations in the launch
conditions; for example, a putter disc is less sensitive towards variations in the
launch pitch angle compared to a driver disc. This sensitivity analysis was found to
be an important tool to assess the throwing accuracy required of a player to achieve
a certain target. The association between the sensitivity of a disc (towards a certain
launch parameter) and the accuracy required of a player would allow one to assess
the player’s throwing skills. This analysis of this thesis, however, is not extended to
include the player skill assessment because such an effort would require detailed
study of the biomechanics of throwing.
1.2 Thesis aim
The aim of this thesis is to develop an understanding of the influence of disc
geometry on the aerodynamic characteristics of golf discs and their subsequent
flight performance in terms of range and accuracy.
Chapter 1: Introduction
27
1.3 Thesis objectives
The objectives of the thesis are sub-divided based on its chapters.
• To introduce the background on the characteristics and the dynamics of
flying discs, describe the major phases of the investigation performed herein,
and clarify the motivation and aim behind the work (Chapter 1).
• To provide a relevant literature review with a particular focus on the
historical development of flying disc studies, and to describe studies
investigating the flight range of sports projectiles (Chapter 2).
• To describe the theory relevant to the aerodynamics and the flight dynamics
of discs and to present the derivation of range and sensitivity with respect to
launch attitude (Chapter 3).
• To describe the experimental methods used in the work and to present the
simulation methods implemented in the thesis (Chapter 4).
• To present and discuss results of the experimental work particularly on
commercial golf discs and parametric discs (Chapter 5).
• To present and discuss results of the simulation work on flight performance,
range and sensitivity of discs (Chapter 6).
• To present conclusions of the work and recommend potential studies for
future research (Chapter 7).

Chapter 2: Literature Review
28
Chapter 2
Literature Review
2 Literature Review

Chapter 2: Literature Review
29
The first aim of this chapter is to review the development of fundamental research in
the experimental and computational study of flying discs. Historical timelines of
various works are provided to outline critical growth in this area. This outline tracks
the previous interest and advancement in the field which leads to the identification
of a need to develop and extend the work on geometry of the discs as well as their
range. An overview of the content of this chapter is shown in Figure 2.1.
Figure 2.1: Outline of Chapter 2.
The second aim of this chapter is to provide a background on flying objects in sports
with a focus on the factors influencing the range flown by the objects. Sports objects
such as balls, discus, javelins, and shot puts rely on a number of factors critical for

Chapter 2: Literature Review
30
the determination of their flight ranges. The range-influencing factors studied in
these previous works are the aerodynamic forces, the biomechanics of launching
techniques and most importantly the initial launch conditions, which is the subject of
interest in this thesis. The review of the various sports objects highlights the
similarity of the important factors influencing their flight despite the differences in
the shapes of these objects. This similarity is extended for the study of flying discs to
identify the main factors influencing their flight performances and ranges.
2.1 Development of disc research
2.1.1 Experimental work
There are significantly fewer experimental studies in the field of disc aerodynamics
and flight dynamics compared to those on conventional prismatic-shaped wing
planforms. One possible reason for the relative lack of research in this area could be
due to their limited commercial applications. Some of the earlier works in this field,
as will be described subsequently, are related to projects with military and sports
applications.
Most experimental works carried out in disc research were mainly focused on
understanding the aerodynamic characteristics. The earliest study on the
aerodynamic characteristics of non-circular low aspect ratio wings were conducted
by Zimmerman in 1935. The first study on the aerodynamics characteristics of discs,
which can be classed as circular low aspect ratio wings, was performed almost four
decades later by Stilley and Carsten in 1972. This experimental study was funded by
the U.S. Navy whose practical interest was to develop self-suspended flares. Their
models were tested in a wind tunnel and results for the lift, drag and pitching
moment were gathered. The results produced by Stilley and Carsten exhibited some
patterns that were similar to those obtained on the non-circular low aspect ratio
wings. Specifically, the lift increased linearly with the angle of attack and the shape
of the drag profile was parabolic. In addition to the flare configurations, they also

Chapter 2: Literature Review
31
tested a hollow Frisbee-like model to observe the effect of cavity. They observed
that the disc has a large nose-down (i.e. negative) pitching moment, which they
speculated was due to the existence of a cavity at the lower surface of the disc.
However, their study did not carefully investigate or isolate the effect of the cavity
because they did not vary the cavity height nor compared with a control disc without
a cavity. In contrast, the experimental work performed in this thesis tested the effect
of varying the cavity height and found that the thickness of the disc also contributed
towards the negative pitching moment although it was not as significant compared to
the effect of the cavity.
A decade later, disc study was redefined with a new interest in the effect of spinning
on aerodynamics by Lazzara et al. (1980). They measured aerodynamic loads of a
Frisbee-shaped disc at various speeds and spin rates at angles of attack ranging from
0o to 10
o. The study found that a small lift increment could be generated by spinning.
However, it was not clearly stated how the spinning effect could generate the lift and
recent experimental studies contradicted this finding – disc rotation at typically
experienced spin rates does not generate any lift (Potts 2005).
The Reynolds number effect on discs was first investigated by Mitchell (1999). He
measured lift and drag for three non-spinning discs and varied the flow speed to vary
the Reynolds number. His results suggested that there were significant Reynolds
number effects over the typical flight speed range. In contrast, Potts and Crowther
(2000(a); 2001(a)) showed that Reynolds number effects are relatively insignificant
for flight speed below 30 m s-1
. This contradiction is largely due to the different
range of speeds tested. Potts and Crowther studied disc speeds typical to those
measured for sports-related discs while Mitchell used discs with higher speeds. It is
worth noting that besides Potts and Crowther’s study, the measurement of disc
rolling moments has never been performed in previous disc studies. They also
complemented the Frisbee load measurement with pressure distribution analysis.
They found that spinning has relatively little effect on disc aerodynamic loads as
shown in Figure 2.2 (a)-(c). Note that there is a small rolling moment effect due to

Chapter 2: Literature Review
32
spin that was attributed to the asymmetric lift distribution as a result of early
separation on the advancing side and delayed separation on the retreating side. The
advance ratio (AdvR) in their study is defined as the ratio of disc rim speed to flow
speed (Potts and Crowther, 2000).
Figure 2.2: Effect of spin on the aerodynamic coefficients for Frisbee at V = 20 m s-1
for
various spin rates of 0, 4, 8, 16, 24 Hz. Spin has very minimal effect on disc aerodynamic
loads (Taken from Potts, 2005).
In addition to the experimental works on aerodynamic loads measurement, a number
of disc studies focus on the flow visualisation technique to understand the flow
behaviour around the disc. Nakamura and Fukamachi (1991) performed a flow
visualisation study on a Frisbee disc by using a smoke wire technique. They
observed that a strong downwash effect is generated by a pair of vortices (as would
(a) Lift coefficient vs. α
(d) Rolling moment coefficient vs. α (c) Pitching moment coefficient vs. α
(b) Drag coefficient vs. α
Chapter 2: Literature Review
33
be expected for a low aspect ratio wing). However, their results were for an advance
ratio of 2.26, which did not match the typical flight value that is usually less than
one (Potts, 2005). There was no clear justification of the reason how that advance
ratio was higher than a typical flight value in their experiment, but this shows that
limited disc literature could lead to unjustified method and misinterpretation of the
experimental results.
A similar study was performed by Higuchi et al. (2000) to study flow over a
spinning golf disc model complemented by particle image velocimetry measurement
of its vortex strength. Their measurement shows that spinning did not affect the
vortex strength at lower angles of attack. However, the vortex strength magnitude
started to reduce as the angle of attack increases at higher angles of attack (α > 15o).
Their observation suggests this was due to large areas of upper surface separation. In
addition, they also discovered that the reattachment line on the golf disc moves
further downstream as the angle of attack increases, consistent with the present golf
disc flow visualisation study.
Potts and Crowther (2000(b), 2001(b)) also conducted a flow visualisation study on
a spinning and non-spinning Frisbee disc model by using a similar technique as
Nakamura and Fukamachi (1991), coupled with a surface-paint flow visualisation
technique. They found that a crescent-shaped separation bubble representing a
boundary layer separation line occurred near the disc leading edge. A similar study
by the author performed on a driver golf disc in this thesis confirmed Potts and
Crowther’s findings. However, the location of the boundary layer separation line
occurrence varies between the Frisbee and the golf discs. At an angle of attack of 0o,
the separation line of a Frisbee occurred at about 20% ahead of the leading edge
while the driver golf disc’s separation line is at approximately 5%. In addition, Potts
(2002(a)) also discovered that the Frisbee wake flow is strongly influenced by the
roll-up of the trailing vortex pair and revealed that spin causes an asymmetric vortex
wake as shown in Figure 2.3. His results show that as the advance ratio increases

Chapter 2: Literature Review
34
from 0 (i.e. non-spinning) to 0.7, the spin causes a slight asymmetry in the vortex
wake which becomes more evident as the advance ratio increases to 1.6.
Figure 2.3: The trailing vortex pair at various spin rates at Reynolds number of 5.67 x 10⁴.
Spin causes an asymmetric vortex wake (Taken from Potts, 2005).
Apart from the study of disc aerodynamics in the wind tunnel, there are several
studies dedicated towards the biomechanics aspect with a focus on the throwing
technique to achieve maximum range. Cotroneo (1980) proposed that range was not
influenced by the back-hand or the side-arm throwing technique: the range remains
approximately the same with both techniques. He also relates the launch speed and
its association with respect to range to study the general trend between these
parameters. He established that the launch speed was the most influential factor on
determining the maximum range thrown. The study could have been improved if it
had considered the effect of launch angles on disc range from the biomechanics
point of view. This may be achieved by comparing the athlete’s optimal launch
angle and correlating their technique with maximum range.
In line with Cotroneo’s work, Hummel (2003) also conducted a Frisbee
biomechanics study, focusing on the backhand throws as shown in Figure 2.4.
Although Cotroneo had already established that range remains unchanged despite
having a different throwing style, Hummel’s intention was to understand the Frisbee
throwing technique for an individual. She developed a musculoskeletal Frisbee
thrower’s model with kinetic chains of seven rigid bodies (i.e. torso, scapula,
clavicle, ulna, humerus, radius and hand) to study how these bodily movement can
(a) AdvR = 0 (b) AdvR = 0.7 (c) AdvR = 1.6

Chapter 2: Literature Review
35
be fully utilized to enhance the throwing technique. She reported that the humerus
released the highest launch energy at about 100 W while the wrist flick contributed
the least at only 8 W.
Figure 2.4: Frisbee throwing model to study the backhand throw. The humerus produces the
highest source of launch energy at 100 W while the wrist flick only manages to produce 8 W
(Taken from Hummel, 2003).
There have been a number of field studies on disc performance. Pozzy (2002)
managed to record golf discs launch speed and the corresponding range made by
golf disc players at sports events by using a radar gun. His data collection was
considerably scattered but still manage to capture reasonable trend. The data
suggested a linear relationship between the launch speed and range instead of
quadratic (as would be expected for an ideal point-mass projectile with negligible
drag). The main reasons for this difference could be due to lift and drag on the discs.
In addition, wind conditions or the altitude could also have some influence on the
linear trend. Nevertheless, the results highlighted an important statistical pattern and

Chapter 2: Literature Review
36
if combined with rigorous technique, the data could be used as estimations in disc
flight simulations.
Lorenz (2005) measured free flight dynamics of a Frisbee disc by using on-board
instrumentation as shown in Figure 2.5. He recorded a real-time Frisbee flight data
by mounting a number of electronic devices (i.e. pressure sensor, infra-red sensor,
accelerometer and magnetometer) underneath the cavity. His data generally were in
well-agreement with Potts and Crowther (2003) although there were inconsistencies
in drag and pitching moment, but the discrepancy could be due to the wobble effect
of the disc following the launch but subsequently dampened afterward. (This wobble
seems to be analogous to the phugoid effect experienced by an aircraft). The
asymmetric distribution of the on-board instrumentation could have some influence
on the flight wobble. This methodology is still in progress but the collected free
flight data may potentially provide a significant contribution for comparison with
wind tunnel data.
Figure 2.5: Frisbee free-flight data is obtained using on-board instrumentation. Electronic
devices such as pressure sensor, infra-red sensor, accelerometer and magnetometer are
mounted underneath the Frisbee cavity (Taken from Lorenz, 2006).
The development of disc research also witnesses a number of inspired disc-wing
aircraft design such as Lee-Richards annular wings biplane, Zimmerman ‘Vought V-
173’ (Ginter, 1992), EC-2 Hawkeye and E-3 Sentry as shown in Figure 2.6.

Chapter 2: Literature Review
37
However, the most historical disc-wing aircraft design achievement was ‘Avrocar’
designed by John Frost in 1959 (Lindenbaum and Blake, 1998). It was a circular
vertical take-off (VTOL) aircraft as shown in Figure 2.6 (d). Unfortunately, apart
from its spectacular design, Avrocar’s performance was very disappointing as it
failed to fly steadily due to an engine thrust problem. Amongst other issues, the
exhaust air flow recirculated into the engine inlet causing the thrust performance to
reduce significantly.
Figure 2.6: Inspired disc-wing aircraft designs. Photos of (a)-(c) are taken from Lorenz
(2006) and (d) from Lindenbaum and Blake (1998).
2.1.2 Computational work
The development of disc research is complemented with the study in computational
area. Most computational works on disc wings have focused on flight dynamics
modelling and simulation. In 1968, Katz investigated flight trajectories and stability
of a disc with the intention to replace ballistic artillery shells with discs rotating at
(a) Lee- Richards annular wings (b) Vought V-173
(c) EC-2 Hawkeye (d) Avrocar
Chapter 2: Literature Review
38
high speeds. He presented a mathematical model to calculate the disc flight
trajectory in two-dimension with spin treated as an independent parameter.
Lissaman (1994) later improved disc flight dynamics modelling by analyzing
dynamic models of spinning sports objects. He developed linearized flight dynamics
equations of motion to produce longitudinal and lateral flight trajectories (Lissaman,
1996; 1998; 1999; 2001; 2003). These tasks were considered computationally at that
time as they require small time-steps for convergence.
Along this line of research, Hubbard and Hummel (2000) conducted a disc study
from the biomechanics aspect with, focus on investigating the effect of launch
conditions and parameter identification from free-flight data. This data, captured
with high speed video cameras, allowed them to derive the disc’s aerodynamic
coefficients from linear approximations. These coefficients were used to simulate
Frisbee flight trajectories (Hummel and Hubbard, 2001; 2002; 2004). The results of
their work compare well with Potts’s wind tunnel data. Their work serves as an
important input of disc free flight parameters for Crowther and Potts’s (2007)
numerical simulations of disc trajectories.
In 2002, Danowsky and Cohanim (2002) also developed a model to simulate disc
flight trajectories. In contrast to Hummel and Hubbard who uses free flight data,
they applied potential flow theory to estimate the aerodynamic parameters in the
simulation. This approach was not justified by the authors and the study is of limited
value. They also ran experiments on disc aerodynamics to provide aerodynamics
data required in the modelling. However, as the experimental disc model was made
of plastic and would most likely deform during the wind tunnel test, the accuracy of
the data obtained in the experiment might influenced the simulation results.
Although most computational studies focus on the flight dynamics simulation, Axel
Rohde (2000) has performed a rigorous computational fluid dynamics (CFD)
analysis around a rotating disc. He found that spinning did not affect the

Chapter 2: Literature Review
39
aerodynamic forces, consistent with Potts’s (2005) experimental results. The
developed computational method was based on compressible Navier Stokes
equations; however, the solutions were performed at a Mach number of 0.5. This is
clearly impractical with respect to the typical throwing discs used in sports as they
do not reach such a speed. Nonetheless, the solutions could still be potentially
applicable for future studies with high speed flying discs; one such possibility is a
ballistic projectile for military application.
In 2007, a six-degree-of-freedom disc flight simulation was developed by Crowther
and Potts (2007), with the incorporation of actual Frisbee free flight data (Hummel
and Hubbard, 2002) as well as wind tunnel aerodynamics data (Potts, 2005). The
simulation estimates the disc flight trajectories and shows good agreement with
experimental data. In the simulation, the effect of range on launch parameters was
observed and the results highlight some important information. As expected, a disc
with a high advance ratio (i.e. high spin rate) would result in a straighter flight
trajectory but not necessarily lead to a greater range. Their simulation results
revealed that range is very sensitive to launch pitch angle which agrees well with the
golf disc study investigated in this thesis. However, their study did not include the
effect of roll angle on range (Crowther and Potts 2007).
The review of computational works on discs research development in the
computational area shows that although there have been a number of flight dynamics
simulation studies, none have been used to thoroughly investigate the effect of
launch parameters and disc aerodynamics on the range. The following sections aim
to provide some insights to understand the range of flying sports objects (i.e. balls,
discus, javelin, shot put) in general and to assist in the investigation of disc range in
this thesis.

Chapter 2: Literature Review
40
2.2 Range of Flying Objects
The study of ballistic projectiles has been relevant and practical in both military and
sports fields. In one unique application of golf ball dynamics for a military purpose,
Barnes Wallis developed “bouncing bombs” to breach the German Mo hne dam in
1943 (Hutchings, 1976). The bombs were dropped with a back-spin at 500 rpm to
cause them to bounce and skip on the water surface, much like spinning golf balls
bouncing on fields. The bouncing bomb technique was necessary to skip over
torpedo nets used to protect the dam wall (Figure 2.7). Important scientific
collaborations in sports fields have also been noted, particularly to improve range of
throwing and jumping events (Linthorne, 2006; Leigh et al., 2010).
Figure 2.7: The “bouncing bomb” developed by Barnes Wallis used similar principle as a
bouncing golf ball (Taken from Podesta, 2007).
2.2.1 Balls
This section briefly reviews study on golf balls, baseballs and footballs with a focus
on factors influencing their range. The main launch parameters that affect range are
the launch speed and the launch angle (Hubbard, 2000; Linthorne and Everett,
2006). The effect of launch speed on range is rather direct, as range is proportional

Chapter 2: Literature Review
41
to the square of speed. It was more common for researchers in this field to
investigate launch angles to determine optimum launch angles for maximum range
(Hubbard, 1984; Linthorne, 2006; Hubbard and Cheng, 2007). This is due to the
human difficulty to achieve the same speed at all launch angles. The common
assumption is that launch angle is independent of launch speed. However, there are
several studies dedicated to investigate the dependency of these parameters in sports
objects that suggest the opposite, like in the case of javelin, shot put and discus
(Bartlett, 2000; Leigh et al, 2010) but this topic will be discussed in brief in the
following section.
The simple way to study the influence of range in principle is to understand the basic
theory of projectile motion that was first discovered by Galileo in 1592. In addition
to the basic understanding of projectiles, an extensive mathematical theory of sports
projectiles can be referred to de Mestre (1990). Based from the projectile motion
theory, for any given launch speed in idealized ball flight (zero air resistance), the
maximum range would occur at 45o. According to Wesson (2009) who investigated
golf balls, if the launch speed is fixed and the ball is launched at 30o or 60
o, the
range would be about 13% less than the maximum range obtained at 45o. In the case
where the launch angle is fixed at 20o, the range of a golf ball with a launch speed of
72 m s-1
would extend four times further compared to that with a launch speed of 36
m s-1
. These results signify that the launch speed has more influence on range
compared to the launch angle with both parameters independent of each other.
In reality, the range would be modified once the aerodynamic forces such as drag
and lift are present. The effect of drag on the range of the golf ball launched with a
high speed would result in nearly 50% reduction (Wesson, 2009). Lift also affects
the trajectory of a golf ball by increasing its flight range and height. These effects
are shown in Figure 2.8.
In general, the ball aerodynamic effects are complex as they depend on the Reynolds
number and the spin rate. In addition, the surface roughness also contributes to the
Chapter 2: Literature Review
42
complexity. There are many studies dedicated to investigate these parameters. The
effect of the Reynolds number on the flight dynamics of a sphere was earlier
investigated by Achenbach (1971). It is interesting to note that even though he did
not directly conduct any experiments on sports balls, his experimental works on a
generic sphere (Achenbach, 1972; 1974) were widely used by sports ball researchers
for reference (Bearman and Harvey, 1976; Mehta, 1985; Smits and Smith, 1994).
Although some of the researchers investigate the balls using different techniques,
they found similar findings: increasing the spin rate consequently results in the
increment of both the lift and drag coefficients.
Figure 2.8: The effect of drag and lift on golf ball trajectories. Greater range occurs without
the influence of aerodynamic forces. Drag has significant effect in reducing the range and
lift modifies the trajectory shape (Taken from Wesson, 2009).
In 2001, Alaways and Hubbard made a compilation of sports ball data to study the
influence of spin on the ball curves and lift by comparing the spin results of sphere
and baseballs obtained in earlier by Maccoll (1928), Davies (1949), Bearman and
Harvey (1976), Watts and Ferrer (1987). The results compare well with Watts and
Ferrer (1987) which concluded that seam orientation at low spin had a significant
influence on lift. However, the effect eventually decreases with increasing spin.
Further study on the ball spin and lift was then conducted by Mehta and Pallis
Chapter 2: Literature Review
43
(2001), James and Haake (2008), Carre et al (2002), Passmore et al. (2008) with
extensive work on the surface roughness by Haake et al (2007). All these studies
show all the parameters above (i.e. spin and roughness) have significant effect on the
ball aerodynamic characteristics and subsequently influence the flight trajectory. The
change in the flight trajectory ultimately modifies the range of the ball. Although
most of the studies mentioned above did not relate directly the aerodynamic
characteristics to the range of the balls, their results contribute to further
understanding of the ball physics. This information is essential in the development
of ball range study.
A study that investigates the ball range directly was conducted by Linthorne and
Everett (2006). They reported that athlete musculoskeletal structure has more
influence on range compared to the ball physical properties. They also found that the
optimum launch angle for maximum range is lower than 45o as it is relatively easier
for the athlete to launch the ball at lower launch angles. Their result agrees well with
Wesson’s findings (2002; 2009) on footballs and golf balls.
2.2.2 Discus
Discus is one of the oldest sports in the world that is still popular today. According
to the International Association of Athletics Federation (IAAF), the men’s World
Record for the longest discus throw is held by Ju rgen Schult in 1986 with a throw of
74.08 m, while the women’s World Record is held by Gabriele Reinsch in 1988 with
a throw of 76.80 m. Discus range is influenced by the release angles (Leigh et al,
2010), release speed and height (Soong, 1976; Bartlett, 1992).
Over the years, significant efforts have been made to estimate discus the optimal
release conditions for maximum range (Hildebrand, 2001; Hubbard, 2002; Soodak,
2004). A comprehensive review of the discus literature is provided by Bartlett
(1992). His compilation of nearly six decades of discus literature review has enabled
optimization work to be accomplished in later years. In 2007, Hubbard and Cheng

Chapter 2: Literature Review
44
successfully simulated a dynamic model for optimal discus trajectories for men and
women. They found that discus range is more sensitive to the flight path angle rather
than roll angle (for both genders). However, their findings did not consider the
dependence of discus release speed and spin due to lack of experimental data
available in the literature. This factor could possibly change the discus sensitivity
result towards range. Nevertheless, their work provides substantial understanding of
discus optimization.
Figure 2.9: Jürgen Schult hold the men’s World Record in 1986 with a throw of 74.08 m.
(Taken from German Federal Archive, 1988).
In terms of the influence of athlete throwing technique on range, Leigh and Yu
(2007) correlated discus throwing performance and the technical parameters
between men and women. They identified that men rely most on their physical
strength to achieve the longest distance, while women depend on a specific throwing
technique. Their result agrees well with Leigh et al. (2008) who found than men and
women have different techniques to throw the discus effectively. Similar effort was
also made by Chiu (2009) to estimate the optimal release conditions for men and
women where he used a numerical simulation in different wind condition.
Recently, Leigh et al. (2010) discovered that the optimal release angle of a discus
depend on each thrower. Their finding suggests that the optimal release angle of a
Chapter 2: Literature Review
45
discus throw should be a combination of the discus aerodynamic characteristics and
the thrower throwing technique. They also found that a relationship exists between
the release angle and the release speed as these parameters are not independent.
Based from the disc study investigated in this thesis, the author offers some insight
to integrate the aerodynamics of the flying object and the athlete throwing technique
with a method typically implemented in the uncertainty analysis (BSI, 2003).
However, this potential method will be discussed for future work in Chapter 7
(Conclusion) as it is beyond the scope of this thesis and requires further
investigations as well as interdisciplinary collaboration between the fields of
aerodynamics and biomechanics for complete analysis.
2.2.3 Javelin
The javelin is another field sport with the aim to achieve the longest throwing
distance. Unlike discus in which the throwing action involves a rotational motion,
javelin throwing action involves over-arm throw (Bartlett, 2000). Based on the
record by IAAF, the men’s World Record for the longest javelin throw is held by Jan
Zelezny in 1996 with a throw of 98.48 m, while the women’s World Record is held
by Barbara Spotakova in 2008 with a throw of 72.28 m.
Most research carried out to investigate the javelin and its association with
maximum range is usually focused on the release speed and angle. Several studies
were carried out to simulate javelin flight by using experimental data (Hubbard and
Rust, 1984; Hubbard and Alaways, 1989). The results provide some important input
parameters for optimal javelin trajectories (Hubbard, 1984). As anticipated,
maximizing the release speed would increase the prospect of the javelin thrower to
achieve maximum throwing distance. In a previous javelin study, Lichtenberg and
Wills (1978) assumed that the release speed and angle is independent of each other.
Although the assumption was made to simplify the mathematical analysis, it is found
later on that these parameters are not independent as small deviation from one
parameter leads to significant changes on another parameter and ultimately affect the

Chapter 2: Literature Review
46
maximum range (Hubbard, 1984; Hubbard and Rust, 1984; Hubbard and Alaways,
1989; Best et al, 1995).
In parallel to the development of a javelin simulation to understand its flight
characteristics and predict the optimal release angle previously, studies were also
conducted to investigate the release conditions from a biomechanics perspective.
This is due to the significant influence of javelin thrower technique in increasing the
distance thrown. The biomechanics of javelin throw were studied comprehensively
by Red and Zogaib (1977), Mero et al (1994), Zatsiorsky (1995), Morriss and
Bartlett (1996) and Bartoniez (2000). Most recommendations from these studies
suggest that in order to improve the throwing technique, thrower needs to focus on
the muscular strength to increase the release speed. Young (2000) discovered that
proximal-to-distal firing patterns and the body segments active acceleration-
deceleration movement are important to increase the thrower success. He identified
that this type of movement has the advantage to transfer the momentum from the
lower body of a thrower to the upper body.
Recently, Chiu (2009) discovered that the javelin physical structure also plays an
important role in maximizing the range. This is quite interesting as previous
literature on javelin mostly focus on the release parameters, as well as the
biomechanics aspect. According to Chiu (2009), the javelin throwing distance can be
increased if the javelin centre of mass is located nearer to the javelin centre of
pressure. This would eventually produce a smaller release angle and therefore,
increases the range.
2.2.4 Shot Put
Shot-putting is another ancient sport with a similar aim to discus and javelin, but the
throwing movement is confined within a circular base. In contrast to the discus or
javelin, shot put is relatively heavy, with the male shot put weight at 7.26 kg and the
female shot put weight at about 4.00 kg. Shot puts are heaviest compared to discus

Chapter 2: Literature Review
47
and javelins. Therefore, the distance recorded for shot put throw is not as far as the
discus or javelin. According to IAAF, the men’s World Record for the longest shot
put throw is held by Randy Barnes in 1990 with a throw of 23.12 m, while the
women’s World Record is held by Natalya Lisovskaya in 1987 with a throw of
22.63 m.
The development of shot put research mainly focuses on the biomechanics aspect
particularly the shot-putting technique, as studies found that the implementation of
appropriate techniques could enhance the athlete performance to throw as far as
possible (Lichtenberg and Will, 1978; Hubbard, 1989; Maheras, 1995; Lanka, 2000).
The focus of research in shot put literature is in biomechanics as shot put is mainly
influenced by gravitational effects rather than aerodynamic drag and lift. The most
common shot-putting techniques are the glide technique and the rotational technique
as shown in Figure 2.10. If observed carefully, both techniques involve preliminary
movements that are different but share similarity in the delivery phases.
In shot put, most studies were conducted to determine the optimal release angle.
Although the effect of release angle on range is less significant compared to the
effect of release speed, any deviation from the optimal release angle has significant
effect on range. Shot put researchers found that the optimum release angle is usually
less than 45o
(McCoy et al, 1984; Bartoniez et al, 1995). Simulation models for shot
put were widely developed to estimate the optimal release angle (de Mestre et al,
1998; Maheras, 1995; Hubbard et al, 2001; Linthorne, 2001). Recent shot put study
by Linthorne shows similar result with Leigh et al. (2010) in discus. The study found
that the optimal release angle varies with individual athlete as their decrement rate of
release speed varies with increasing release angle.

Chapter 2: Literature Review
48
Figure 2.10: The most common throwing techniques in shot-putting. The preliminary
movements are different but the delivery phases are similar (Taken from Linthorne, 2001).
(a) The glide technique.
(b) The rotational technique.

Chapter 3: Theoretical Background
49
Chapter 3
Theoretical Background
3 Theoretical Background

Chapter 3: Theoretical Background
50
This chapter establishes the theoretical principles relevant to disc dynamics and the
fundamentals used to quantify the range and sensitivity of a flying disc. The first
part lays out the background principles consist of the variables and equations used to
analyse the aerodynamics and flight dynamics of a disc. Principles governing the
trim and stability of the disc are given here. The second part introduces the general
concept of range and sensitivity of a projectile applied on a point-mass sphere. The
outline of this chapter is summarized in Figure 3.1.
Figure 3.1: Outline of Chapter 3.

Chapter 3: Theoretical Background
51
3.1 Disc dynamics
3.1.1 Aerodynamics
In a wind tunnel experiment to study the aerodynamic forces acting on a disc, the
typical measured quantities are the axial (FX), normal (FZ), and side (FY) forces. The
lift and drag forces on the disc are derived quantities. Figure 3.2 illustrates the
aerodynamic forces acting on a disc and their relationships; α is the geometric angle
of attack and V∞ is the air speed. Coefficients of dimensionless aerodynamic forces
are obtained by normalising the forces with the dynamic pressure q∞ and surface
planform area S.
Figure 3.2: The aerodynamic forces acting on a disc (Taken from Potts, 2005).
The lift (L) and the drag(D) forces are derived from the axial and the normal forces
as follows:
= cos ∝ − sin ∝ (3.1)
= sin ∝ + cos ∝ (3.2)

Chapter 3: Theoretical Background
52
The dynamic pressure q∞ is defined by:
∞ = (3.3)
The coefficients for the lift, drag, axial, normal, and side forces are defined,
respectively, as follows:
= ! (3.4)
" = " ! (3.5)
= #$ ! (3.6)
= #% ! (3.7)
& = #' ! (3.8)
The moments measured on the disc are the yaw (N), pitch (M), and roll (FR) and
their coefficients CN, CM, and CR, are defined as follows with d the disc diameter.
( = ( !) (3.9)
* = * !) (3.10)
+ = #, !) (3.11)
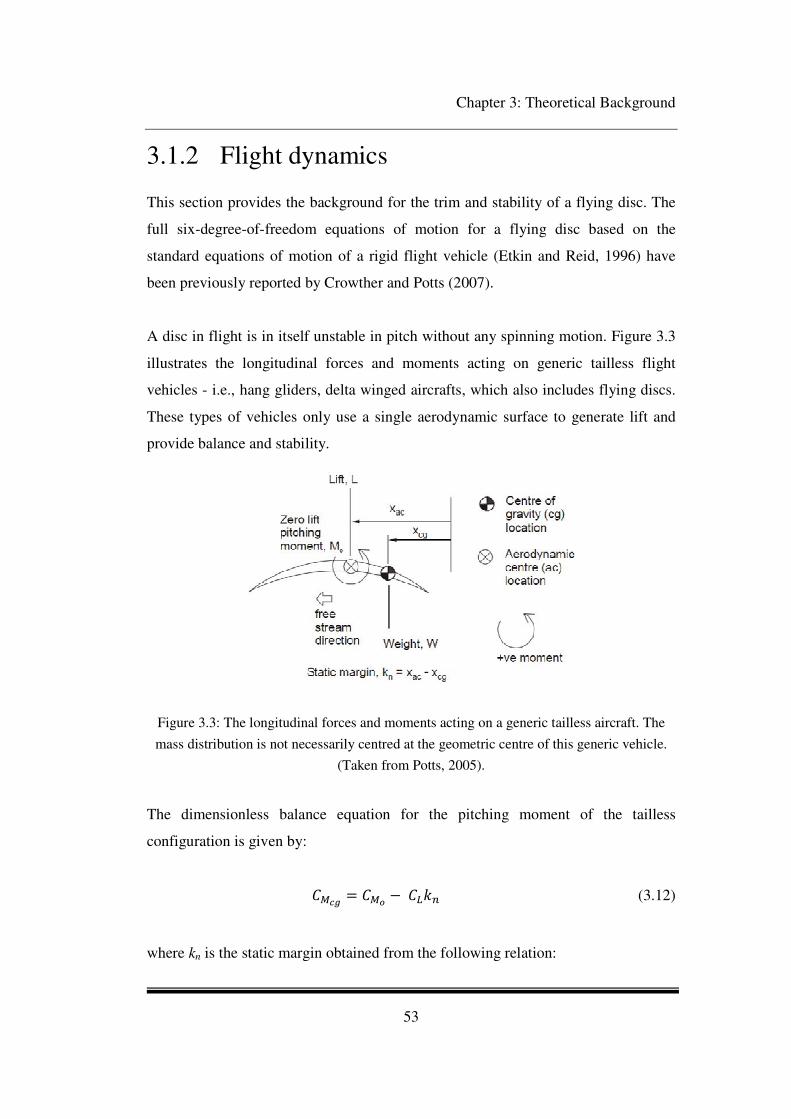
Chapter 3: Theoretical Background
53
3.1.2 Flight dynamics
This section provides the background for the trim and stability of a flying disc. The
full six-degree-of-freedom equations of motion for a flying disc based on the
standard equations of motion of a rigid flight vehicle (Etkin and Reid, 1996) have
been previously reported by Crowther and Potts (2007).
A disc in flight is in itself unstable in pitch without any spinning motion. Figure 3.3
illustrates the longitudinal forces and moments acting on generic tailless flight
vehicles - i.e., hang gliders, delta winged aircrafts, which also includes flying discs.
These types of vehicles only use a single aerodynamic surface to generate lift and
provide balance and stability.
Figure 3.3: The longitudinal forces and moments acting on a generic tailless aircraft. The
mass distribution is not necessarily centred at the geometric centre of this generic vehicle.
(Taken from Potts, 2005).
The dimensionless balance equation for the pitching moment of the tailless
configuration is given by:
*-. = */ − 01 (3.12)
where kn is the static margin obtained from the following relation:

Chapter 3: Theoretical Background
54
01 = 234-5 3-.) 6. (3.13)
The system is trimmed when *-. = 0. In order to obtain the static margin in terms
of the lift coefficient and the zero lift pitching moment coefficient, Equation (3.13)
is substituted into Equation (3.12) to give:
01 = 29:/9;
6 (3.14)
The change in the pitching moment about the centre of gravity with respect to the lift
coefficient must be negative for positive longitudinal stability. From differentiation
of Equation (3.12), the static margin is given by
01 = − <9:/<9;
. (3.15)
Based on Equation (3.15), an unstable configuration such as that of a flying disc
requires a negative */for balance as shown in Figure 3.4. Note that the disc centre
of gravity is located at the centre of the disc. Thus, the static margin is negative as
the disc aerodynamic centre is usually ahead of the centre of gravity (Potts, 2005).
Figure 3.4: Trim characteristics of a disc as an example of a tailless flight vehicle. A disc
must have a positive camber to provide balance (Taken from Potts, 2005).

Chapter 3: Theoretical Background
55
3.1.3 Disc Simulation
The golf disc numerical simulation implemented in this thesis is derived from the
work of Crowther and Potts (2007). Their numerical code was originally written in
Matlab to simulate the flight of a Frisbee disc. In the work presented here, the
Matlab program has been extended to include the capability of performing multiple
simulations simultaneously; this extension allows optimization and sensitivity
analyses on various flight parameters to be performed.
The core of the simulation uses a six degree-of-freedom mathematical model of a
rotating disc. The gyroscopic motion associated with a spinning disc is incorporated
into the model via the parameter called the Advance Ratio (AdvR), a dimensionless
number derived from the spin rate, the disc geometry, and the flight velocity. The
main assumptions built into the model are that the disc is a uniform circular cylinder
of negligible height, that the disc does not wobble, and that the disc spin is constant
during flight. These limitations definitely are not representative of the real situations,
but do not introduce significant losses in the simulation accuracy according to
Crowther and Potts (2007).
Disc Axes, Forces, and Moments
In this section, important steps in the model derivation are briefly described starting
with the definitions of their axes systems (detailed mathematical formulations of
these steps are referred to Crowther and Potts (2007)). Four axes systems are needed
to derive the disc equations of motion. These axes are defined as follows:
1. Earth axes, ( )1
xyz
2. Body axes, ( )2xyz
3. Zero sideslip body axes, ( )3
xyz
4. Zero sideslip wind axes, ( )4
xyz

Chapter 3: Theoretical Background
56
The relationship between the earth and the body axes coordinate systems is
illustrated in Figure 3.5; rotations from the earth axes into the body axes is achieved
using the Euler roll (φ), pitch (θ) and yaw (ψ) angles. The zero sideslip body and the
wind axes are illustrated in Figure 3.6. The angle of attack of the disc is achieved
through a rotation from the zero sideslip body axes into the zero sideslip wind axes.
The corresponding coordinate transformations between these different axes have
been detailed in Crowther and Potts (2007).
Figure 3.5: The relationship between earth axes (xyz)1 and body axes (xyz)2 coordinate
systems defined in terms of the Euler roll (φ), pitch (θ)and yaw (ψ) angles (taken from
Crowther and Potts, 2007).
Figure 3.6: The zero sideslip body axes are obtained by rotating the body axes through the
sideslip angle (β2). The zero sideslip wind axes are obtained by rotating the body axes
through the angle of attack (α3) (taken from Crowther and Potts, 2007).

Chapter 3: Theoretical Background
57
The system dynamics of the model is developed starting from the application of
Newton’s II Law on the disc in its body axes, where the disc linear and angular
accelerations are related to the external forces and moments and its linear and
angular velocities. The angular velocities, in the body axes, are the identical to the
pitching (q), rolling (p), and yawing (r) rates. After transformation into the zero
sideslip body axes, the aerodynamic forces and moments are rewritten as
dimensionless coefficients. In this study, the values of these dimensionless
aerodynamic coefficients are extracted from wind tunnel data.
The forces acting on the disc, in flight, are the gravitational force and the
aerodynamic forces, which are the lift and the drag. The centre of pressure of the
aerodynamic forces is located away from the geometric centre of the disc, thus
resulting in a non-zero pitching moment. The aerodynamic rolling and yawing
moments are negligible for the range of speeds tested in the experiments. After a
simulation is performed, the main outputs are the coordinate, flight time, velocity,
and acceleration of the disc centre of gravity in the earth axes system.
Gyroscopic Precession of Rotating Discs
An important aspect of the disc simulation is the coupling between the aerodynamic
and the gyroscopic effects on the disc flight. This is achieved in the model by first
setting the disc yaw rate (r) equal to the disc spin rate (Ω), which is assumed to be a
constant. The spinning of the disc, in turn, causes the disc to precess via the
gyroscopic principle whereby its pitching moment is translated into a rolling motion.
The gyroscopic precession results when the spinning disc tries to resist the torque
applied as a pitch (M) perpendicular to the spinning axis, but in turn manifested into
a rolling motion at an angular rate p in the axis perpendicular to both the spinning
and the pitching axes. This gyroscopic relation can be formally expressed in the
mathematical form as
= = > × @A (3.16)

Chapter 3: Theoretical Background
58
where I is the moment of inertia of the disc. From the relationship in 3.16, the rolling
rate is proportional to the pitching moment but inversely proportional to the spinning
rate. Hence, the rolling rate can be reduced by increasing the spinning rate and/or
decreasing the pitching moment. Increasing the moment of inertia of the disc can
also reduce the rolling rate; one approach to achieve larger moment of inertia is by
distributing the mass of the disc away from its geometric centre. Also, the spinning
direction determines the direction of the rolling motion.
The entire flight dynamics of the disc are mainly governed by the aerodynamic and
the gyroscopic effects, in addition to the gravitational influence. However, spinning
does not affect the aerodynamics characteristics as has been investigated by Potts
(2005). If one throws a disc without spinning (i.e., with zero spin rate), the nose-up
pitching moment will destabilize the disc and cause it to tumble. Therefore, the disc
needs to be spun to translate the pitching moment (which causes the instability) via
gyroscopic precession into a rolling motion; this translation of pitch stabilizes the
disc. The coupling between the pitching and rolling moments causes the disc to steer
left or right depending on the spin direction. Throwing a disc in a clock-wise
direction will cause the disc to bank left and vice versa.
Disc Aerodynamic Centre
The aerodynamic centre (ac) is defined as the location where the pitching moment is
constant with respect to the angle of attack. For a typical airfoil, the aerodynamic
centre is located at about 25% of the chord (i.e., the quarter-chord location) from the
leading edge. The flow dynamics on a disc is not similar to those of a typical airfoil.
As a result, the disc’s aerodynamic centre is much closer to its geometric centre, or
centre of gravity (cg), as opposed to its leading edge. Figure 3.5 shows the definition
and a schematic location of the aerodynamic centre for a disc, which is measured
with respect to the disc geometric centre.

Chapter 3: Theoretical Background
59
Figure 3.7: The location of the disc aerodynamic centre.
The moment acting on the disc, in its dimensionless form, is defined as below:
cgM
ac
LMac Cc
xCC += (3.17)
Differentiation of Equation 3.69 with respect to an angle of attack produces:
ααα d
dC
c
x
d
dC
d
dC cgMacLMac += (3.18)
The disc’s aerodynamic centre can be calculated by recognizing that the moments at
the aerodynamic centre, by definition, do not vary with respect to the angles of
attack (i.e., 0. =αddC cMa ); hence:
−=
α
α
ddC
d
dC
c
x
L
Mcg
ac (3.19)
Once obtained, the value of the aerodynamic centre is used to calculate the static
margin kn which is directly used in the simulation. In this work, the aerodynamic

Chapter 3: Theoretical Background
60
centre is assumed not to vary with respect to the angles of attack (within the range
studied). This assumption is supported by the experimental data of the commercial
discs studied here, where the variations of their pitching moments with respect to the
angles of attack are approximately linear.
On the other hand, there can be cases where different disc designs might produce
pitching moments that do not exhibit linear variations with the angles of attack. For
such a disc, the determination of its static margin is not as straight forward as
described above as it will vary with the angles of attack. One impact of assuming a
constant static margin for this disc could be a reduced accuracy in its flight
simulation. However, the case of variable static margin is not explored in this thesis.
3.2 Range and sensitivity
Range is defined as the linear distance the disc travels from the launch position to
the point of impact with the ground, i.e. the landing point. For the present work, it is
assumed that disc is launched at ground level. The analysis in this thesis is mainly
concerned with how the range is affected by the launch attitude rather than by the
launch speed.
Sensitivity is defined as the partial derivative of range with respect to launch
conditions (i.e. attitude and velocity). For the sensitivity analysis, this work is
mainly focused on the range sensitivity with respect to launch attitude. A ‘sensitive’
disc will be harder to throw accurately than an ‘insensitive’ disc because for the
same level of precision in landing location, the tolerance towards a variation on
launch attitude for an insensitive disc will be higher than the tolerance for sensitive
disc. For example, a small variation of launch pitch angle would not affect the range
travelled by a putter disc as much as compared to the range travelled by a driver
disc. This behaviour may be translated into a requirement for a higher player skill
level for a sensitive disc.

Chapter 3: Theoretical Background
61
3.2.1 Sensitivity analysis of a spherical projectile
To introduce the concept of range and sensitivity on a disc, a theoretical formulation
is devised for a simpler problem to allow us to arrive at an analytical solution; the
problem is reduced to that of a flying point-mass spherical projectile under the
influenced of the gravitational force only as shown in Figure 3.5. For a flying disc,
the problem is less straight-forward analytically due to the inclusion of the
aerodynamic forces (lift and drag) acting on it. Due to this increased complexity,
solutions from numerical simulations are used to calculate the sensitivity of discs
analysed in this thesis.
The flight range of a point-mass sphere is a function of the launch speed Vo and
launch pitch angle θo, if all other launch variables (e.g. launch height and roll or yaw
angles) remain fixed. The following analytical problem is simplified by assuming
that the sphere trajectory is only influenced by the gravitational acceleration g.
Figure 3.8: Motion of a sphere under uniform acceleration due to gravity and no
aerodynamic forces.
The dimensional range R of the sphere is derived directly from Newton’s 2nd
Law
that produce the relationship
B = C2 sin 2ECF . (3.20)
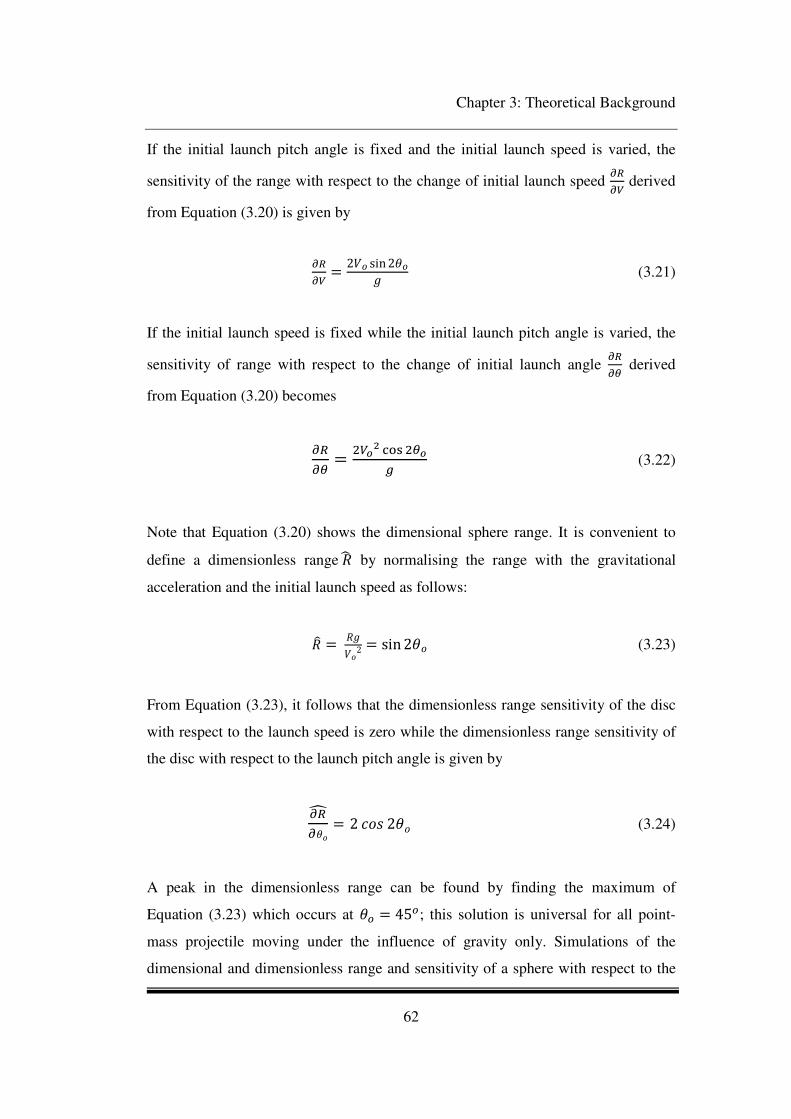
Chapter 3: Theoretical Background
62
If the initial launch pitch angle is fixed and the initial launch speed is varied, the
sensitivity of the range with respect to the change of initial launch speed <+<G derived
from Equation (3.20) is given by
<+<G = 2C sin 2EC
F (3.21)
If the initial launch speed is fixed while the initial launch pitch angle is varied, the
sensitivity of range with respect to the change of initial launch angle <+<H derived
from Equation (3.20) becomes
<+<H = G/I JKL H/
M (3.22)
Note that Equation (3.20) shows the dimensional sphere range. It is convenient to
define a dimensionless range BN by normalising the range with the gravitational
acceleration and the initial launch speed as follows:
BO = BFC2 = sin 2EC (3.23)
From Equation (3.23), it follows that the dimensionless range sensitivity of the disc
with respect to the launch speed is zero while the dimensionless range sensitivity of
the disc with respect to the launch pitch angle is given by
<+<ECP = 2 QCR 2EC (3.24)
A peak in the dimensionless range can be found by finding the maximum of
Equation (3.23) which occurs at ES = 45S; this solution is universal for all point-
mass projectile moving under the influence of gravity only. Simulations of the
dimensional and dimensionless range and sensitivity of a sphere with respect to the

Chapter 3: Theoretical Background
63
initial launch conditions are presented in Chapter 6 (Simulation Results and
Discussions).
3.2.2 Disc range and sensitivity
The range of a flying disc is a function of its launch speed (VL), its launch pitch
angle (θL) and its launch roll angle (φL). The range could not be obtained directly as
in the sphere case because analytical solutions to the disc governing equations
(Crowther and Potts, 2005) are non-linear and can only be solved numerically.
The definitions of the range sensitivity with respect to changes in either the launch
speed, the launch pitch angle, or the launch roll angles are defined as <+
<G;, <+
<H;, or
<+<∅;, respectively. If all of the launch parameters are allowed to vary within a small
tolerance, then the resulting overall sensitivity of the disc range WB)XYZ can be
combined as
WB)XYZ = [2\ <+<G; W6\ + 2\ <+
<H; WE6\ + 2\ <+<∅; W∅6\. (3.25)
The relationship above is derived using the standard method for determining the
overall uncertainty of a collection of independent variables, each having an
uncertainty of its own (BSI, 2003).
Chapter 6 (Simulation Results and Discussions) presents the simulation results for
the range sensitivities of two discs – putter and driver discs – to compare between
the short and long range golf discs. The results are used to demonstrate the use of
range sensitivities in determining the accuracy of a throw. Dimensionless launch
speed V’ is used in Chapter 6 to compare discs with a fixed diameter d at varying
launch speeds; V’ is obtained using the Buckingham Pi Theorem as

Chapter 3: Theoretical Background
64
] = S ^FW⁄ (3.26)
The disc flight time, t, is normalised by the total flight time, Ttotal, to provide a
dimensionless comparator as each disc has a different flight time such that the non-
dimensional time is given by:
`] = abc/c4d. (3.27)

Chapter 4: Methods
65
Chapter 4
Methods
4 Methods

Chapter 4: Methods
66
This chapter presents the experimental method performed on a generic set of
parametric discs and commercial golf discs to measure aerodynamic loads in the
wind tunnel. The experimental apparatus and disc model configurations are
described including measurement techniques (i.e. surface flow visualisation) and
uncertainties. This chapter also presents the computational method implemented to
simulate flight trajectories and range of golf discs. The numerical simulation code,
written in MATLAB and developed by Crowther and Potts (2007) uses wind tunnel
data as the aerodynamic inputs. The outline to illustrate this chapter is shown in
Figure 4.1.
Figure 4.1: Outline of Chapter 4.
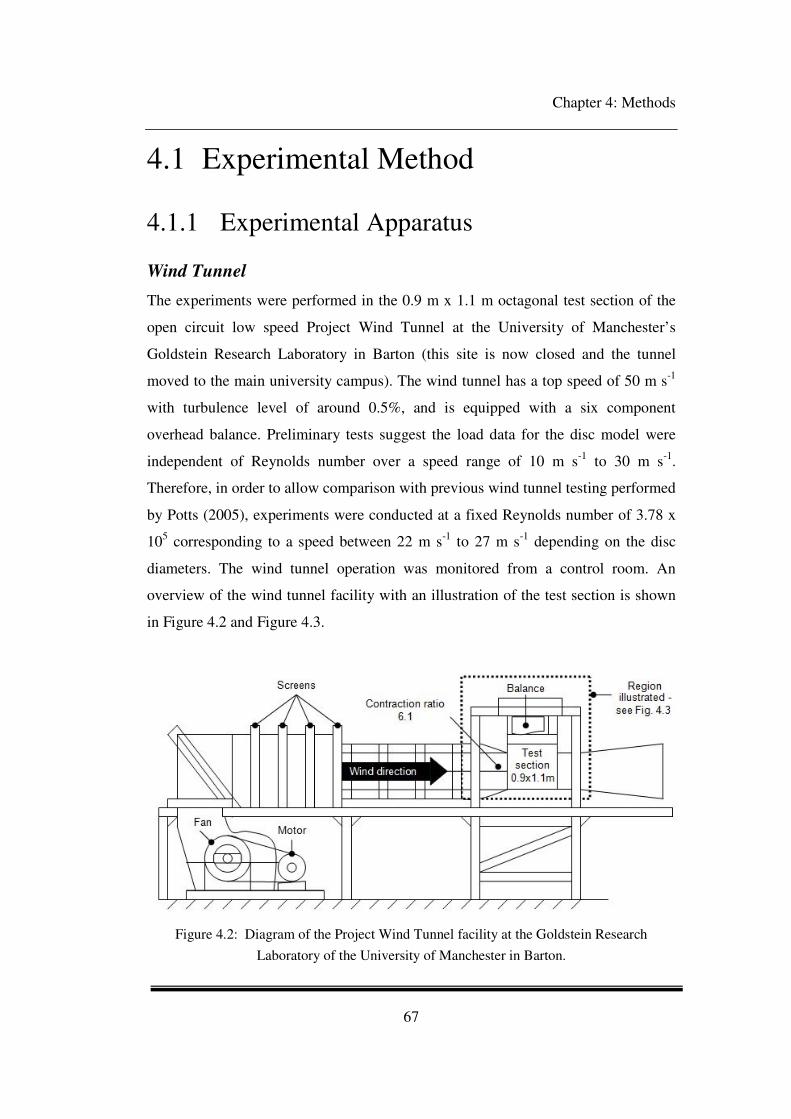
Chapter 4: Methods
67
4.1 Experimental Method
4.1.1 Experimental Apparatus
Wind Tunnel
The experiments were performed in the 0.9 m x 1.1 m octagonal test section of the
open circuit low speed Project Wind Tunnel at the University of Manchester’s
Goldstein Research Laboratory in Barton (this site is now closed and the tunnel
moved to the main university campus). The wind tunnel has a top speed of 50 m s-1
with turbulence level of around 0.5%, and is equipped with a six component
overhead balance. Preliminary tests suggest the load data for the disc model were
independent of Reynolds number over a speed range of 10 m s-1
to 30 m s-1
.
Therefore, in order to allow comparison with previous wind tunnel testing performed
by Potts (2005), experiments were conducted at a fixed Reynolds number of 3.78 x
105 corresponding to a speed between 22 m s
-1 to 27 m s
-1 depending on the disc
diameters. The wind tunnel operation was monitored from a control room. An
overview of the wind tunnel facility with an illustration of the test section is shown
in Figure 4.2 and Figure 4.3.
Figure 4.2: Diagram of the Project Wind Tunnel facility at the Goldstein Research
Laboratory of the University of Manchester in Barton.

Chapter 4: Methods
68
Figure 4.3: A photograph of the working section in the wind tunnel facility.
Balance mechanism
Images of the wind tunnel balance manufactured by Elven Precision Ltd (model
158) are shown in Figure 4.4. The overhead six component balance used in this
study measured the forces and moments accurately. The balance consists of an earth
frame mounted on a round turntable which allows it to yaw with respect to the
vertical axis test section. Figure 4.4 illustrates the view of the balance frame bolted
at the centre of the turntable. The turntable was built-in to the test section roof and
can be rotated through 360o. The rotation was performed to allow strut adjustment to
the balance ‘I’-beam, particularly for load measurements. In order to avoid excessive
loading due to the weight distribution of the model or rig, the moments and forces
frame were locked to the earth frame when the disc was being fitted or adjusted to
the balance. The loads should not exceed the maximum allowable loads on the
balance as provided in Table 4.2 in Section 4.1.4. The detailed configuration of the
balance frame bolted to the turntable is shown in Figure 4.4 (c).

Chapter 4: Methods
69
Figure 4.4: (a) Illustration of the wind tunnel balance from the side. Drag and pitch
transducers are hidden on the other side. (b) Overview of the round turntable and strut
bolted to the balance frame. (c) View of the round turntable connected to the balance. (d)
View of the strut screwed to the balance I-beam.

Chapter 4: Methods
70
Rig
There were two types of rig used in the experimental work; a primary rig for
aerodynamic load measurements and a secondary rig for surface flow visualisation.
These rigs were previously used by Potts and Crowther (2000) in their wind tunnel
testing. For the primary rig, the disc models mounted in the wind tunnel test section
were static and mounted vertically on a horizontal axle supported by a vertical strut
as shown in Figure 4.5. The vertical strut was bolted onto the I-beam of the balance.
Due to the unconventional mounting arrangement of the disc model, the disc pitch
angle was varied by rotating the balance about its vertical (yaw) axis. An electric
motor and gear box controlled the incidence and yaw angles as illustrated in Figure
4.5. The tunnel speed and the model incidence angle were slowly changed during
testing to avoid overloading the balance. An image of the test section for
aerodynamic load measurement setup is shown in Figure 4.6
Figure 4.5: The balance yaw angle controller used to vary the disc pitch angle for
aerodynamic load measurement and the balance incidence angle controller used to vary the
disc incidence angle for surface flow visualisation.

Chapter 4: Methods
71
Figure 4.6: Load measurement rig setup in the test section.
The secondary rig was used for surface flow visualisations as shown in Figure 4.7.
The disc model was mounted in the horizontal between two vertical struts. An
incidence arm was used to adjust the disc pitch angle. In addition, an inclinometer
was placed on the model and balance to check the respective incidence angle. This
was performed to reduce errors associated with misalignment when the model was
attached to the strut and balance.
Figure 4.7: Flow visualisation rig setup in the test section.

Chapter 4: Methods
72
4.1.2 Disc Models
Parametric Disc Models
The parametric disc configurations were designed using Solid Works 2007 and
manufactured using ABS (Acrylinitrile butadiene styrene) plastic material with 0.2
m diameter and 0.02 m thickness (thickness-to-diameter ratio, t/d = 0.1). There were
initially 17 disc models manufactured to investigate the disc geometric variation
including 3 circular flat plate discs made from aluminium used to study the thickness
variation (all others were ABS). However, only 12 selected disc models are
presented in this thesis due to their significant results. The geometric variation was
grouped into 4 categories:
• Thickness
• Rim edge curvature
• Camber
• Cavity
The geometric variations were categorized into four categories to serve two
purposes; firstly, to isolate the disc design features in order to understand the effect
of various design parameters, and secondly, to evaluate the design geometry and
understand how the aerodynamic performance varies for different disc geometries.
The basic geometric definitions are shown in detail using schematic representations.
The cross section view of the disc models are presented in Figure 4.8 to Figure 4.11.
A circular flat disc with thickness-to-diameter ratio of 0.1 was used as a baseline for
comparison in each test. In order to facilitate the load and surface flow visualisation
investigation, careful attention was given to the surface finish. This was achieved by
polishing the models with a minimum of 1000 grade wet and dry abrasive sheet, and
spraying with matt black paint.

Chapter 4: Methods
73
Figure 4.8: Parametric disc models constructed to study the effect of thickness.
Figure 4.9: Parametric disc models constructed to study the effect of camber.

Chapter 4: Methods
74
Figure 4.10: Parametric disc models constructed to study the effect of edges curvature.
Figure 4.11: Parametric disc models constructed to study the effect of cavity.
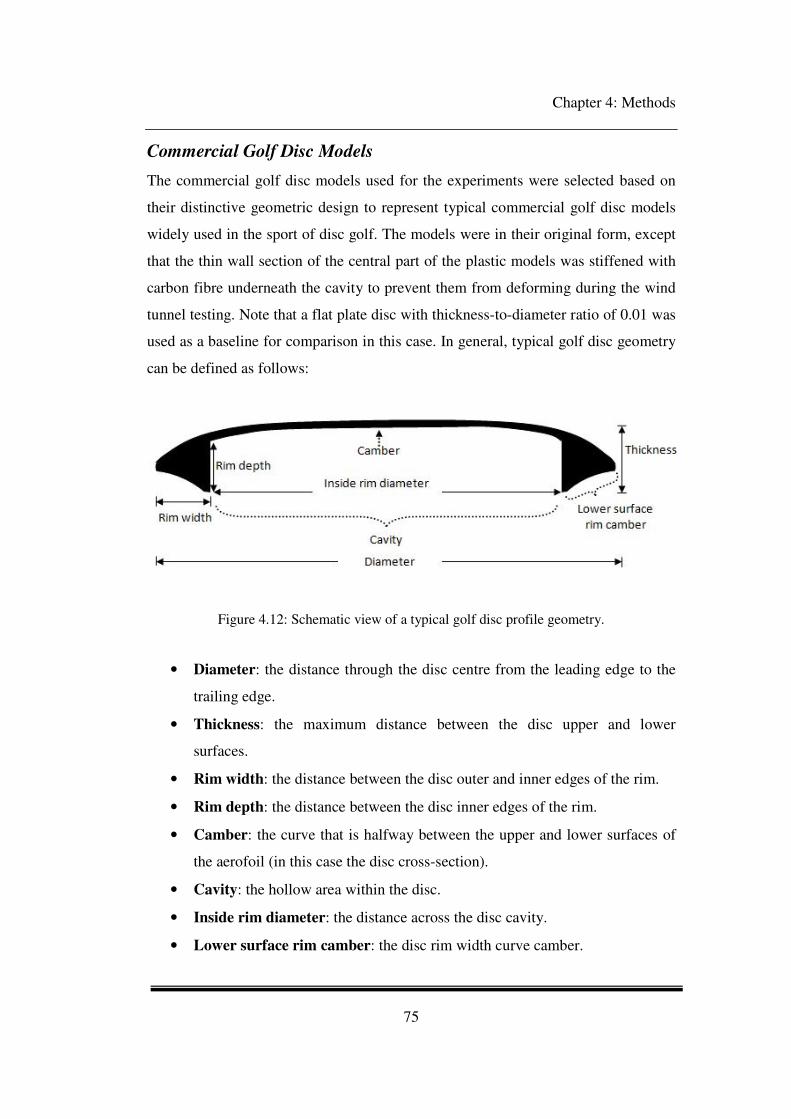
Chapter 4: Methods
75
Commercial Golf Disc Models
The commercial golf disc models used for the experiments were selected based on
their distinctive geometric design to represent typical commercial golf disc models
widely used in the sport of disc golf. The models were in their original form, except
that the thin wall section of the central part of the plastic models was stiffened with
carbon fibre underneath the cavity to prevent them from deforming during the wind
tunnel testing. Note that a flat plate disc with thickness-to-diameter ratio of 0.01 was
used as a baseline for comparison in this case. In general, typical golf disc geometry
can be defined as follows:
Figure 4.12: Schematic view of a typical golf disc profile geometry.
• Diameter: the distance through the disc centre from the leading edge to the
trailing edge.
• Thickness: the maximum distance between the disc upper and lower
surfaces.
• Rim width: the distance between the disc outer and inner edges of the rim.
• Rim depth: the distance between the disc inner edges of the rim.
• Camber: the curve that is halfway between the upper and lower surfaces of
the aerofoil (in this case the disc cross-section).
• Cavity: the hollow area within the disc.
• Inside rim diameter: the distance across the disc cavity.
• Lower surface rim camber: the disc rim width curve camber.

Chapter 4: Methods
76
The commercial golf disc models used for the experiments with their commercial
company’s name are shown in Table 4.1.The full cross-sectional profiles of the
commercial golf discs are shown in Figure 4.13.
Model
Full cross-sectional profiles
Aviar
Roc
Buzz
Wraith
Flick
Quarter K
Figure 4.13: Schematic view of commercial golf discs full cross-sectional profiles focussing
on the rim edge curvatures that vary in between discs.

Chapter 4: Methods
77
Model Manufacturer Type Diameter
(m)
Thickness
(m) t/d
Inside
rim
diameter
(m)
Rim
width
(m)
Rim
depth
(m)
Aviar
Roc
Buzz
Innova Champion Discs Inc.
Innova Champion Discs Inc.
Discraft Inc.
Putter
Mid-range
Mid-range
0.212
0.212
0.217
0.020
0.020
0.019
0.094
0.094
0.088
0.194
0.194
0.193
0.009
0.009
0.012
0.015
0.012
0.013
Wraith Innova Champion Discs Inc. Driver 0.211 0.014 0.066 0.169 0.021 0.012
Flick
Quarter K
Discraft Inc.
Discwing Ltd.
Driver
Driver
0.211
0.213
0.013
0.020
0.062
0.094
0.169
0.167
0.021
0.023
0.011
0.014
Table 4.1: The properties of commercial golf discs.

Chapter 4: Methods
78
4.1.3 Experimental Measurements
Aerodynamic Loads
Load measurements were performed to analyse the disc aerodynamic characteristics,
due to the large amount of disc models tested in the wind tunnel. The angle of attack
for the load data was varied from -5o to 15
o with 1
o increments. These angles were
chosen as from the simulation data for a typical disc throw, the percentage of
trajectory for which the angles of attack is usually larger than 0o and less than 15o
(with conventional higher aspect ratio wing, there is usually a clear stall and hence,
it is more defined over the common angles of attack ranges the data should be
plotted). The operating Reynolds number was fixed at 3.78 x 10⁵ corresponding to a
speed of 27.5 m s-1
for parametric discs and 22 m s-1
to 27 m s-1
depending on the
commercial golf disc diameters unless stated otherwise. (Note that the disc pitching
moment is measured as the torque about the half chord position, rather than the
conventional quarter chord position as in the case of an aircraft).
The general procedure to run the wind tunnel to obtain the loads data is described as
follows. The disc models were attached to the support strut and set at the required
angle of attack by rotating the balance turntable. The turntable was locked safely and
the balance was zeroed. The wind tunnel was run up to the required speed and the
initial load data were acquired. The raw data from the balance transducers were
passed through a 16-channel, analogue-to-digital (A/D) converter. The output from
the converter was then fed into a computer. The load data is stored in three forms;
pure forces and moments in N or Nm, aerodynamic coefficients and a sample
average in counts. The tunnel speed and the disc incidence angles were also
recorded. The wind tunnel was then stopped and the overall procedure was repeated
for the next disc models.
All tests were repeated at least three times to ensure consistency of the results. In
order to maintain good repeatability and avoid overloading the load transducers,

Chapter 4: Methods
79
extra care was performed as the disc models were removed and during fitting of the
disc model to the balance beam. A small movement or vibration could results in a
large change of output volts and therefore, it is vital to ensure accurate load
measurements. The load tolerance associated with the balance is carried out in
Section 4.1.4.
Surface Flow Visualisation
Surface flow visualisation is a valuable method to support the aerodynamic load
analysis, by providing information about the flow characteristics around the disc.
However, in this thesis, the surface flow visualisation was only performed on
selected parametric discs and commercial golf discs (the selection was based on the
distinctive disc configurations focusing on the basic geometry).
The surface flow visualisation paint mixture consists of two parts of kerosene and
one part fluorescent powder. The mixture was painted to the surface of the disc
model using a paint brush as shown in Figure 4.14. In order to prevent any non-
dissolved paint mixture particle from forming which could disrupt the flow, oleic
acid was added to dilute the mixture. The paint mixture was then applied with brush
strokes parallel to the flow direction to avoid any residual brush marks. To visualise
the flow pattern, the painted disc model was mounted in the test section until the
kerosene evaporated. Then, the disc model was removed from the wind tunnel test
section and photographed. A pair of ultra violet strip lights were used to illuminate
the flow pattern whilst a camera was positioned facing the centre of the disc model.

Chapter 4: Methods
80
a)
b)
Figure 4.14: (a) Illustration of the flow visualisation chemicals. (b) Ratio of kerosene and
fluorescent powder mixture.

Chapter 4: Methods
81
4.1.4 Measurement Uncertainty
The results presented in this thesis had already taken into account the measurement
uncertainty to ensure the accuracy of the experimental results. The wind tunnel
measurement system was calibrated to ensure accurate and reliable experimental
results. Uncertainty estimates for results presented in this thesis are made at a
confidence level of 95% based on the British Standard Institutes - Guide to the
Expression of Uncertainty in Measurement (2004).
Balance calibration
The balance was calibrated to ensure the load data obtained in the experiments was
accurate. An ‘X’ calibration frame comprising a pair of calibration strut, pulley,
weight hanger, pulley base and a calibrated weight set were used to perform the
balance calibration. A tunnel centre line was scribed on the test section floor to
ensure the pulley base was aligned precisely. In order to load the balance drag
component, a pulley was aligned extending out from the ‘X’ frame as shown in
Figure 4.15 (a). A calibrated weight was applied to the weight hanger lining
vertically from the pulley. As more calibrated weights were applied, an inclinometer
was placed on the tee frame centre to ensure the tee frame remain in the level
position throughout the calibration process. The balance lift, yaw, pitch, roll and side
component were loaded similarly in respective direction to the drag component as
described above. This setup follows the standard procedure outlined by Barlow et al
(1999). The maximum allowable loads on the balance, with the sensitivity of the
system in each degree of freedom are shown in Table 4.2.

Chapter 4: Methods
82
a)
b)
Figure 4.15: (a) Illustration of the drag calibration setup. (b) View of the inclinometer used
to check the frame is level.
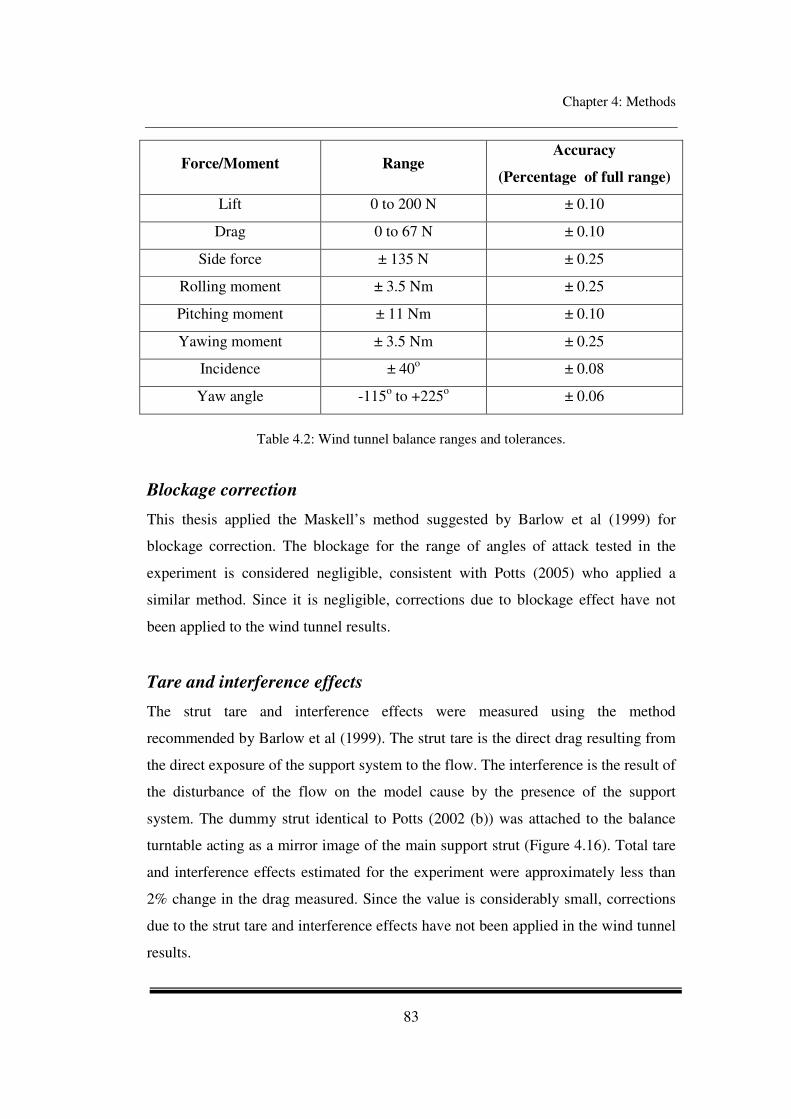
Chapter 4: Methods
83
Force/Moment Range Accuracy
(Percentage of full range)
Lift 0 to 200 N ± 0.10
Drag 0 to 67 N ± 0.10
Side force ± 135 N ± 0.25
Rolling moment ± 3.5 Nm ± 0.25
Pitching moment ± 11 Nm ± 0.10
Yawing moment ± 3.5 Nm ± 0.25
Incidence ± 40o ± 0.08
Yaw angle -115o to +225
o ± 0.06
Table 4.2: Wind tunnel balance ranges and tolerances.
Blockage correction
This thesis applied the Maskell’s method suggested by Barlow et al (1999) for
blockage correction. The blockage for the range of angles of attack tested in the
experiment is considered negligible, consistent with Potts (2005) who applied a
similar method. Since it is negligible, corrections due to blockage effect have not
been applied to the wind tunnel results.
Tare and interference effects
The strut tare and interference effects were measured using the method
recommended by Barlow et al (1999). The strut tare is the direct drag resulting from
the direct exposure of the support system to the flow. The interference is the result of
the disturbance of the flow on the model cause by the presence of the support
system. The dummy strut identical to Potts (2002 (b)) was attached to the balance
turntable acting as a mirror image of the main support strut (Figure 4.16). Total tare
and interference effects estimated for the experiment were approximately less than
2% change in the drag measured. Since the value is considerably small, corrections
due to the strut tare and interference effects have not been applied in the wind tunnel
results.

Chapter 4: Methods
84
a)
b)
Figure 4.16: Illustration of the strut tare and interference effects. (a) View of the support
strut bolted to the balance beam and dummy strut bolted to the turn table.

Chapter 4: Methods
85
Uncertainties in the load measurement
The individual errors associated with the calibration process have been considered
appropriately before the total uncertainty can be established. The total error for the
measurement of load was ± 0.3%, which is an acceptable level of error.
4.2 Numerical Simulation Method
4.2.1 Simulation Implementation
The disc flight simulation was based on the standard equations of motion for a rigid
flight vehicle (Etkin and Reid, 1996). Simulation code developed by Crowther and
Potts (2007) was implemented with some modification to simulate different disc
geometries simultaneously. The modified simulation code uses the ODE23s solver
in MATLAB 7.11. For comparison, the modified simulation code uses the golf discs
wind tunnel data as inputs to simulate the flight trajectories of short, medium and
long range discs. Further reference on the derivation of the disc equations of motion
can be referred to Crowther and Potts (2007).
4.2.2 Initial conditions setup
The flight trajectory simulation in this thesis only considers the range as a function
of launch pitch angles (θL). The advance ratio (AdvR), defined as the ratio of the
disc’s rim speed to that of the free-stream, is fixed at 0.5. The value represents an
approximate typical value widely used by player in real life (Potts, 2005; Nathan,
2008). For each disc, the mass and radius were set to 0.177 kg and 0.107 m,
respectively. As range is proportional to the square of launch speed, and each player
is assumed to have a maximum achievable launch speed, the launch speed in this
analysis is fixed at VL = 20 m s-1
with default initial conditions as follows: φL, αL, ψL
= [0 0 0]o unless stated otherwise. Note that the launch kinetic energy also was fixed
since mass is approximately constant. The launch position was fixed at (0, 0).

Chapter 5: Experimental Results and Discussions
86
Chapter 5
Experimental Results and
Discussions
5 Experimental Results and
Discussions

Chapter 5: Experimental Results and Discussions
87
This chapter presents and discusses experimental results obtained from aerodynamic
loads measurement performed on a set of generic parametric discs and a set of
commercial golf discs. The main objective of the work is to understand the influence
of disc geometric parameters on aerodynamic characteristics, particularly the effect
of thickness, rim edge curvature, cavity and camber. A comparison of flat plate data
with finite wing theory will also be presented to establish the fundamental
understanding of low aspect ratio wings. The result gathered from this study has
established the mapping between the disc geometry and aerodynamics (i.e. disc
thickness is proportional to drag). The outline to illustrate this chapter is shown in
Figure 5.1.
Figure 5.1: Outline of Chapter 5.
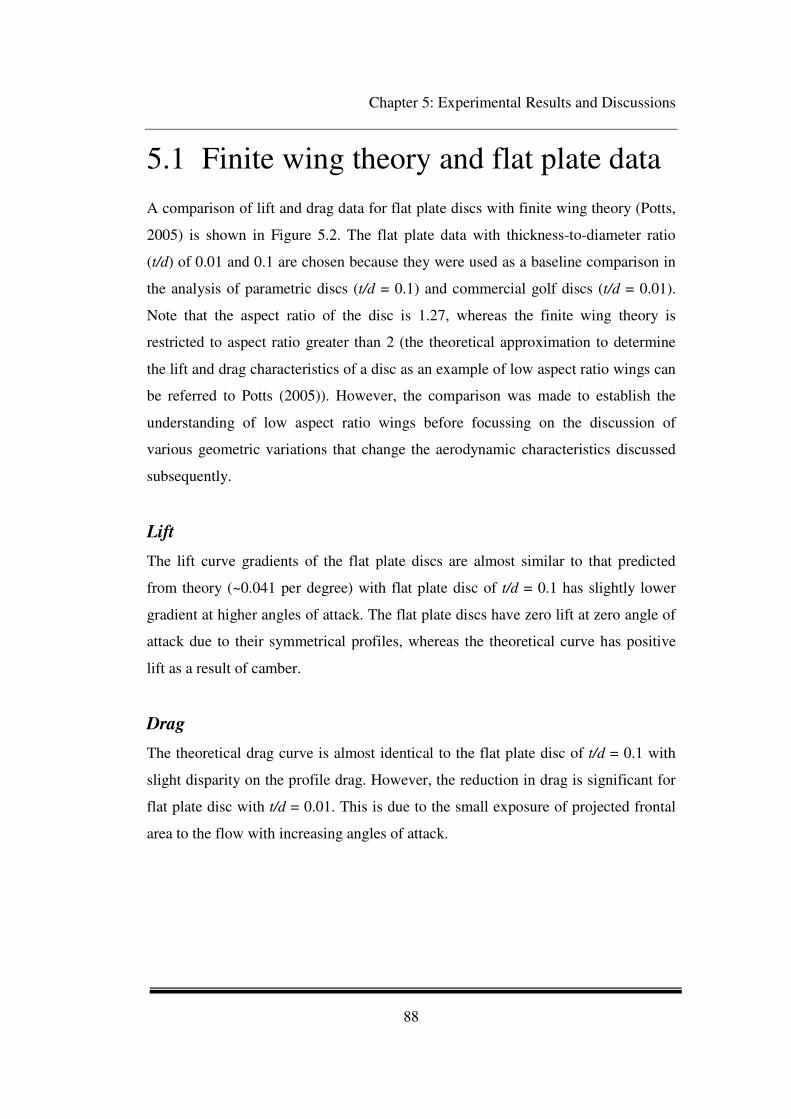
Chapter 5: Experimental Results and Discussions
88
5.1 Finite wing theory and flat plate data
A comparison of lift and drag data for flat plate discs with finite wing theory (Potts,
2005) is shown in Figure 5.2. The flat plate data with thickness-to-diameter ratio
(t/d) of 0.01 and 0.1 are chosen because they were used as a baseline comparison in
the analysis of parametric discs (t/d = 0.1) and commercial golf discs (t/d = 0.01).
Note that the aspect ratio of the disc is 1.27, whereas the finite wing theory is
restricted to aspect ratio greater than 2 (the theoretical approximation to determine
the lift and drag characteristics of a disc as an example of low aspect ratio wings can
be referred to Potts (2005)). However, the comparison was made to establish the
understanding of low aspect ratio wings before focussing on the discussion of
various geometric variations that change the aerodynamic characteristics discussed
subsequently.
Lift
The lift curve gradients of the flat plate discs are almost similar to that predicted
from theory (~0.041 per degree) with flat plate disc of t/d = 0.1 has slightly lower
gradient at higher angles of attack. The flat plate discs have zero lift at zero angle of
attack due to their symmetrical profiles, whereas the theoretical curve has positive
lift as a result of camber.
Drag
The theoretical drag curve is almost identical to the flat plate disc of t/d = 0.1 with
slight disparity on the profile drag. However, the reduction in drag is significant for
flat plate disc with t/d = 0.01. This is due to the small exposure of projected frontal
area to the flow with increasing angles of attack.

Chapter 5: Experimental Results and Discussions
89
Figure 5.2: Comparison of the flat plate data discs to finite wing theory.
(a) Lift coefficient, CL
(b) Drag coefficient, CD

Chapter 5: Experimental Results and Discussions
90
5.2 Parametric discs
The geometry of a disc influences its aerodynamics. The following sub-sections
discuss important features of disc geometry and their effect on the disc aerodynamic
characteristics. Lift, drag and pitching moment about the half chord on non-spinning
parametric discs were measured at angles of attack ranging from -5o to 15
o with 1
o
increments. The operating Reynolds number was fixed at 3.78 x 10⁵ corresponding
to a speed of 27.5 m s-1 unless stated otherwise. A summary of the wind tunnel
aerodynamic characteristics data for the parametric discs is presented in Table 5.1.
Table 5.1: Summary of parametric discs aerodynamic data.

Chapter 5: Experimental Results and Discussions
91
Table 5.1 summarizes important parameters for the aerodynamic characteristics:
these are the lift, drag and moment coefficients at zero angle of attack, CL0, CD0, and
CM0, respectively; the change of the lift and moment coefficients with respect to the
angles of attack, or dCL/dα and dCM/dα, respectively; and the trim angle, i.e., the
angle of attack at which the disc’s pitching moment is zero. The summary highlights
that a symmetrical disc with a solid shape has zero lift and zero pitching moment at
zero angle of attack (CLo = 0 and CMo = 0). The gradients of the pitching moment
about the centre of gravity (dCM/dα) for all the discs are positive signifying that the
discs are unstable in pitch. The profile drag (CDo) for a disc with cavity is relatively
higher compared to a solid disc. The trim angles of almost all the parametric discs
studied are found to be zero.
Note that the aerodynamic centre of a disc is obtained by using Equation 3.19 in
Chapter 3. However, the gradients of the pitching moment were averaged across the
range of angles of attack from 0o to 15
o (i.e., using linear variation). The impact of
non-linearity on the position of aerodynamic centre of the disc is discussed in sub-
section 3.1.3. It is important to highlight that the concept of steady-state flight in
typical aircraft is not applicable in the context of a flying disc as it exhibits variable
stability throughout its flight as the angle of attack varies.
5.2.1 Effect of thickness
A comparison of the force and moment data for various flat plate discs with
thickness-to-diameter ratio of 0.01, 0.025, 0.05 and 0.1 is presented in Figure 5.3
(note: The thickness-to-diameter ratio will be referred to as the thickness only
hereafter).
Lift
The data in Figure 5.3 (a) shows that all discs have zero lift at zero angle of attack,
consistent with geometric symmetry of these profiles about the xy-plane. The
gradients of the lift curves are almost identical (~0.04/ degree) but slight decrement

Chapter 5: Experimental Results and Discussions
92
started to occur for α > 12o as the thickness increases. From the literature (Ashley
and Landahl, 1985; Pelletier and Mueller, 2000), it would be expected that
increasing thickness reduces the lift curve gradient. However, in the present case, the
disc aspect ratio is so low that the thickness effect is only apparent at relatively
higher angles of attack and the lift curve is dominated by the 3d effects. Note that
the stall is not evidenced in lift curves over the range of angles of attack tested.
However, the surface flow visualisation result suggests that increasing thickness
leads to a larger separation bubble on the upper surface leading edge. Hence, this
behaviour could reduce the leading edge peak in the chordwise pressure distribution,
but further investigation in the future is required to confirm this phenomenon.
Drag
Thickness has significant effect on drag through an increase in profile drag as shown
in Figure 5.3 (b). This behaviour occurs due to the large exposure of projected
frontal area to the flow. Since the lift is largely unchanged by thickness, the induced
drag (lift dependent) component is similar between discs of different thickness.
There is evidence from the surface flow visualisation that changing the thickness
changes the extent of the upper surface leading edge separation bubble as shown in
Figure 5.4. This behaviour is indicated by the formation of the crescent shape
separation line as the angle of attack increases from α = 0o to α = 5
o. This
phenomenon does make a significant contribution to the overall drag.
L/D
The lift-to-drag ratio (L/D or CL/CD) results in Figure 5.3 (c) shows that increasing
thickness would increases the drag but has small effect on the lift (the term of L/D
and CL/CD will be used interchangeably in this thesis). This result means that CL/CD
reduces with increasing disc thickness for all angles of attack range tested. The
CL/CD plot is commonly used to evaluate the aerodynamic efficiency and
performance of an aircraft (Anderson, 2007); a higher value of maximum CL/CD
usually indicates a better performance. However, the graph shown in Figure 5.3 (c)
did not show a common trend of CL/CD plot which usually has a peak at the

Chapter 5: Experimental Results and Discussions
93
maximum CL/CD. For discs, the CL/CD value increases with increasing angle of
attack, then it reaches a plateau and remains relatively constant. The maximum
CL/CD for the thinnest disc (t/d = 0.01) is around 5, whereas the peak CL/CD for the
10% thick disc is around 2.5 (50% reduction).
Pitching moment
The pitching moment result in Figure 5.3 (d) shows that all discs have zero pitching
moment at zero angle of attack, consistent with all profiles that have zero camber.
Pitching moment with angle of attack for different thicknesses is approximately
similar for lower angles of attack. At higher angles, the effect of thickness is to
flatten off the pitching moment curves, with increasing thickness leading to greater
reduction in pitching moment. This is consistent with the stall behaviour of
conventional wings in which stall shifts the aerodynamic centre aft and reduces the
magnitude of nose up pitching moment.
Figure 5.3: Comparison of the influence of disc thickness on aerodynamic characteristics.
(a) Lift coefficient, CL
(c) Lift-to-drag ratio, CL/CD (d) Pitching moment coefficient, CM
(b) Drag coefficient, CD
Chapter 5: Experimental Results and Discussions
94
Aerodynamic centre position
The pitching moment gradients are positive, signifying that in free flight they are
dynamically unstable in pitch. The gradients of the pitching moment curves
generally increase with angle of attack and decrease with increasing thickness. The
gradients can be associated with the position of the aerodynamic centre (xac) with
respect to the disc centre of gravity (Etkin and Reid, 1996). A steeper gradient is
associated with the location of the aerodynamic centre that is further from the disc
centre, equivalent to a larger nose-up pitching moment. Based on the position of the
disc aerodynamic centre (obtained from the experiment) presented in Table 5.2, it
indicates that a disc with lower thickness (t/d = 0.01) produces a larger nose up
pitching moment, as a result of the position of the aerodynamic centre located
further from the disc centre of gravity (indicated by a steeper pitching moment
gradient) at approximately 21% of the chord length ahead of the chord point (Note:
the chord of a disc is equal to its diameter. The term chord is used here in keeping
with standard practice in flight analysis). In contrast, a disc with a higher thickness
(t/d = 0.1) produces a reduced nose down pitching moment resulting from the
position of the aerodynamic centre that is located closer to the disc centre of gravity
at approximately 12% of the chord length ahead of the chord point.

Chapter 5: Experimental Results and Discussions
95
Figure 5.4: Surface flow visualisations performed on flat plate discs with t/d = 0.01 and 0.1
with increasing angle of attack. Regions of separated flow near the leading edge indicated
by the crescent shape separation line increases with thickness. The flow direction is
vertically from top to bottom of the image.
(a) Angle of attack = 0o, t/d = 0.01
(d) Angle of attack = 5o, t/d = 0.1 (c) Angle of attack = 5
o, t/d = 0.01
(b) Angle of attack = 0o, t/d = 0.1

Chapter 5: Experimental Results and Discussions
96
Table 5.2: Location of the aerodynamic centre with respect to the disc thickness. A thinner
disc produces a larger nose up pitching moment, as a result of the position of the
aerodynamic centre located further from the disc centre of gravity (indicated by a higher %
of the chord length ahead of the half chord point).
5.2.2 Effect of rim edge curvature
A comparison of the force and moment data for various discs with rim edge
curvature from sharp to blunt including a flat plate disc with t/d = 0.1 is presented in
Figure 5.5.
Lift
All discs have zero lift at zero angle of attack due to their symmetrical design as
shown in Figure 5.5 (a). The disc with square leading and trailing edge (t/d = 0.1)
exhibits the highest lift gradient compared to all evaluated disc configurations.
Interestingly, rounding off or tapering of a square leading or trailing edge leads to a
reduction in lift for the range of angles of attack tested. This behaviour was not
expected initially as the rounded edge shape is usually observed with a lower lift
gradient compared to the sharp edge shape. The common observation in those cases
is due to the large amount of trailing vortices produced by the rounded edge that
create a large induced drag and results in the reduction of the lift gradient. As disc in

Chapter 5: Experimental Results and Discussions
97
principle is classified as a very low aspect ratio wing, Prandtl Lifting Line Theory
(Abbott and Von Doenhoff, 1959) could not be applied to estimate the lift as in the
usual comparison of the rounded and sharp edge case. A reasonable explanation may
be deduced from the investigation of Hoerner (1993) on sharp and rounded edges,
which closely correspond to the present study. Apparently, a sharper edge disc has a
lower effective aspect ratio compared to a rounded edge disc that has a higher
effective aspect ratio. As a smaller effective aspect ratio leads to higher induced drag
and therefore, causes the lift gradient to reduce. Note that given a non-square leading
or trailing edge curvature, the difference in lift between the profiles is relatively
slight, with the rounded edge profile producing higher lift gradient compared to the
sharp edge profile.
Drag
The drag result illustrated in Figure 5.5 (b) shows that some degree of fairing of the
leading or trailing edge significantly reduces the drag compared to the non-fairing
case (square edge) over the range of angles of attack tested. Between the faired
cases, the two tapered profiles (sharp edges) perform better than the rounded profile
particularly at higher angles of attack. In addition, qualitative flow visualisation
conducted to observe the flow behaviour between sharp and rounded edge support
the load results. It reveals that a sharp edge shape has lower drag because they
generate a small amount of wake compared to the rounded edge. This is indicated by
the size of a pair of nodes produced close to the trailing edge as shown in Figure 5.6.
It shows the stagnation points that suggest trailing vortices detach from the surface.
This behaviour is expected as Hoerner (1993) data compilation of drag for sharp and
rounded edge shapes, which closely correspond to the present investigations, also
shows similar aerodynamic characteristics. However, Pelletier and Mueller (2000)
who conducted a study on a low aspect ratio flat plate wing (with sharp and elliptical
trailing edge only) observed that the edge curvature does not have significant
influence on drag. The difference between their observation and the present
investigation is believed due to the influence of Reynolds number. Their
investigation was conducted at Reynolds number of 8 x 10⁴, lower than the present
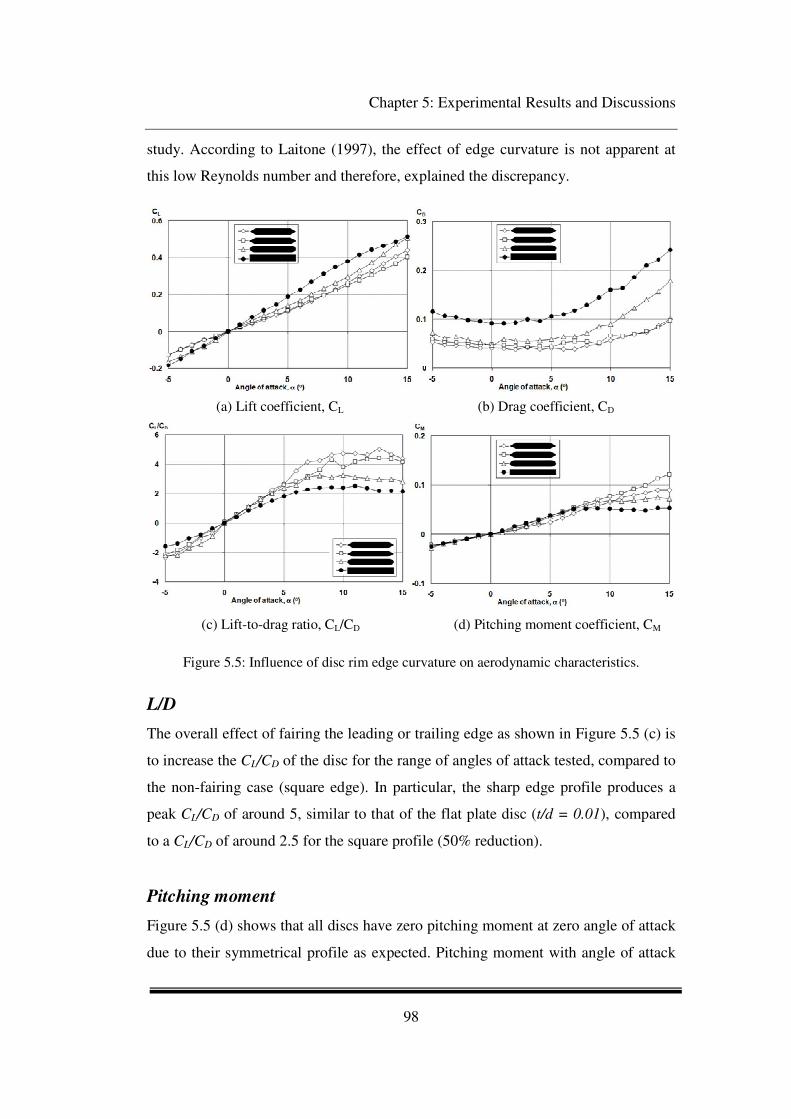
Chapter 5: Experimental Results and Discussions
98
study. According to Laitone (1997), the effect of edge curvature is not apparent at
this low Reynolds number and therefore, explained the discrepancy.
Figure 5.5: Influence of disc rim edge curvature on aerodynamic characteristics.
L/D
The overall effect of fairing the leading or trailing edge as shown in Figure 5.5 (c) is
to increase the CL/CD of the disc for the range of angles of attack tested, compared to
the non-fairing case (square edge). In particular, the sharp edge profile produces a
peak CL/CD of around 5, similar to that of the flat plate disc (t/d = 0.01), compared
to a CL/CD of around 2.5 for the square profile (50% reduction).
Pitching moment
Figure 5.5 (d) shows that all discs have zero pitching moment at zero angle of attack
due to their symmetrical profile as expected. Pitching moment with angle of attack
(a) Lift coefficient, CL
(c) Lift-to-drag ratio, CL/CD (d) Pitching moment coefficient, CM
(b) Drag coefficient, CD

Chapter 5: Experimental Results and Discussions
99
for different rim edge curvature is approximately similar for lower angles of attack.
At higher angles of attack particularly at α > 9o, the effect of non-fairing (square
edge) is to flatten off the pitching moment curves. However, tapering the disc edge
leads to greater increment in pitching moment.
Aerodynamic centre position
Table 5.3 indicates that the sharp edge discs produce a large nose-up pitching
moment as the angles of attack increases, corresponds to the distance of the disc
aerodynamic centre that is located further from the disc centre of gravity (between
22% to 28% of the chord length ahead of the half chord point). In contrast, the
square edge discs produce a small magnitude of nose-up pitching moment as the
angle of attack increases at around 12% of the chord length ahead of the half chord
point, corresponds to the distance of the disc aerodynamic centre located near to the
disc centre of gravity.
Figure 5.6: Surface flow visualisations performed on rounded and sharp edge discs at angle
of attack = 0o. Regions of separated flow edge indicated by the crescent shape separation
line can be seen near the leading edge for rounded edge disc. The line moves downstream
nearly 25% of the disc diameter for sharp edge disc. A pair of nodes was produced which
indicate the detachment of trailing vortices from the surface. The flow direction is vertical
from top to bottom of the image.
(b) Disc with sharp edge (a) Disc with rounded edge

Chapter 5: Experimental Results and Discussions
100
Table 5.3: Location of the aerodynamic centre with respect to the disc rim edge curvature. A
square edge disc produces a reduced nose up pitching moment, as a result of the position of
the aerodynamic centre located closer to the disc centre of gravity (indicated by a lower %
of the chord length ahead of the half chord point).
5.2.3 Effect of camber
Four disc geometries with varying camber including a flat plate disc with t/d = 0.1
were studied to investigate the effect of camber as shown in Figure 5.7. Camber is
introduced to generate lift at zero angle of attack.
Lift
Comparisons of the results for the effect of camber in Figure 5.7 (a) show that disc
with a negative and zero camber produce zero lift at zero angle of attack (CLo = 0).
Disc with 25% and 50% camber produce a slight increase of CLo at 0.06 and 0.08,
respectively. The difference in pressure distribution over the upper and lower surface
when a disc is cambered increased due to the asymmetry and therefore, leads to the
increment in lift. The gradients of the lift curves are almost identical (~0.03/degree)
but the baseline flat plate disc gradient is slightly higher (~0.04/degree). The
development of disc camber and subsequent interaction with the aerodynamic

Chapter 5: Experimental Results and Discussions
101
characteristics for each case shows that camber has the advantage to increase the
positive lift at zero angle of attack as expected.
Drag
Camber has significant effect on drag as shown in Figure 5.7 (b), with the reduction
in profile drag as a result of increased camber. The discs with positive camber have
lower profile drag at around 0.05 compared to the disc with negative and zero
camber which have a profile drag around 0.1. Comparisons of the results with
Gordon and Rom (1985) investigations of low aspect ratio delta wing planform leads
to a conclusion that a disc designed with positive camber produce a small wake
compared to a disc with zero camber. Hence, the small wake results in a small drag.
L/D
The CL/CD results in Figure 5.7 (c) shows that discs with positive camber have a
significantly higher CL/CD compared to the discs with negative and zero camber.
This is expected due to the small amount of drag produced by the positive camber.
The results imply that disc with a positive camber has the advantage to increase the
lift at zero angle of attack as well as to reduce the drag quite significantly.
Pitching moment
Discs with positive camber have approximately zero pitching moment at zero angle
of attack as shown in Figure 5.7 (d). At higher angles of attack, the effect of camber
is to elevate the pitching moment curves, with increasing camber leading to greater
increment in pitching moment gradient. The result indicates that there is a limit
beyond which the pitching moment becomes more destabilized if the camber is
increased more than a disc requires as this would result in a large nose-up pitching
moment. As the effect of camber allows the aerodynamic characteristics of the disc
to be changed in flight, this may explain why a commercial golf disc driver is
usually designed with a moderate camber to reduce the large nose-up pitching
moment as the angle of attack increases while flying.

Chapter 5: Experimental Results and Discussions
102
Aerodynamic centre position
Table 5.4 shows that disc with 50% camber produces a large nose-up pitching
moment, corresponds to the distance of the disc aerodynamic centre that is located
further from the disc centre of gravity (at about 23% of the chord length ahead of the
half chord point). Disc with zero camber produce almost less than half of the amount
of nose-up pitching moment produces by disc with 50% camber, as indicated by the
location of the aerodynamic centre at about 12% of the chord length ahead of the
half chord point.
Figure 5.7: Influence of disc camber on aerodynamic characteristics.
(a) Lift coefficient, CL
(c) Lift-to-drag ratio, CL/CD (d) Pitching moment coefficient, CM
(b) Drag coefficient, CD

Chapter 5: Experimental Results and Discussions
103
Table 5.4: Location of the aerodynamic centre with respect to the disc camber. A disc with
higher camber produces a larger nose up pitching moment, as a result of the position of the
aerodynamic centre located further from the disc centre of gravity (indicated by a higher %
of the chord length ahead of the half chord point).
5.2.4 Effect of cavity
Two variations of disc geometric shape with cavity height-to-thickness ratio ch/t of
0.8 (square symbol) and 0.9 (triangle symbol) were compared with the flat plate disc
of t/d = 0.1 to study the effect of cavity on aerodynamic loads as shown in Figure
5.8. Note that the disc with ch/t of 0.8 has t/d equivalent to the flat plate disc.
Lift
The gradients of the lift curves shown in Figure 5.8 (a) are almost identical for the
discs with cavity regardless of the cavity height, with a constant offset in lift
consistent with the difference in CLo. However, the flat plate disc (with zero cavity
height) has a lower lift gradient. Comparison of the discs with same thickness, but
with and without cavity (square and circle symbol) at zero angle of attack shows that
introduction of a cavity on the lower surface produces a positive increase in lift. The
result exhibits similar behaviour to a disc with positive camber. However, increasing
the disc cavity depth further (means thickness is also increasing at the same time)
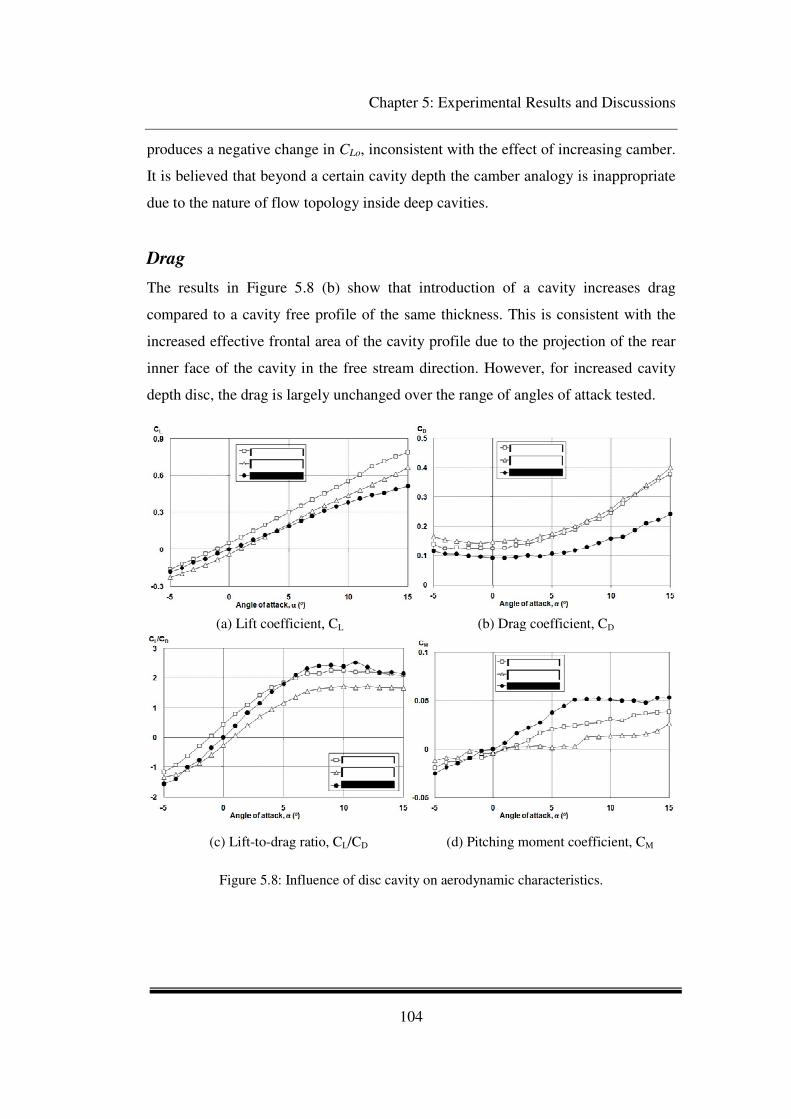
Chapter 5: Experimental Results and Discussions
104
produces a negative change in CLo, inconsistent with the effect of increasing camber.
It is believed that beyond a certain cavity depth the camber analogy is inappropriate
due to the nature of flow topology inside deep cavities.
Drag
The results in Figure 5.8 (b) show that introduction of a cavity increases drag
compared to a cavity free profile of the same thickness. This is consistent with the
increased effective frontal area of the cavity profile due to the projection of the rear
inner face of the cavity in the free stream direction. However, for increased cavity
depth disc, the drag is largely unchanged over the range of angles of attack tested.
Figure 5.8: Influence of disc cavity on aerodynamic characteristics.
(a) Lift coefficient, CL
(c) Lift-to-drag ratio, CL/CD (d) Pitching moment coefficient, CM
(b) Drag coefficient, CD

Chapter 5: Experimental Results and Discussions
105
L/D
The results in Figure 5.8 (c) shows that changes in lift and drag as a result of the
introduction of the cavity means that the CL/CD for the same thickness disc with and
without cavity is approximately similar. The increased cavity depth disc (triangle
symbol) has significantly reduced CL/CD compared to the other discs.
Pitching moment
The pitching moment result in Figure 5.8 (d) demonstrates the reason why all
practical discs need to have a cavity in the lower surface. The presence of this cavity
produces a significant afterwards shift in the aerodynamic centre position (xac) such
that the pitching moment about the centre of the disc is substantially zero
particularly for the angles of attack ranging from 0o to 7o. This means that the disc
will have minimal tendency to roll about the flight axis and hence, require less skill
to throw towards a given target and achieve a greater range compared to a disc with
the same CL/CD but strong roll divergence. Note that the introduction of cavity
produces a reversed flow on the lower surface which subsequently causes negative
CMo at zero angle of attack.
Aerodynamic centre position
Data in Table 5.5 shows that a disc with a higher cavity depth produces a significant
reduced nose-down pitching moment as indicated by the aerodynamic centre at
approximately 4% of the chord length ahead of the half chord point. The
introduction of cavity reduces the magnitude of nose-down pitching moment by
almost 50% compared to a cavity free profile of the same thickness.

Chapter 5: Experimental Results and Discussions
106
Table 5.5: Location of the aerodynamic centre with respect to the disc cavity height. A disc
with higher cavity height produces a reduced nose up pitching moment, as a result of the
position of the aerodynamic centre located closer to the disc centre of gravity.
5.3 Commercial Golf Discs
The aerodynamic loads on non-spinning commercial golf discs were measured at
angles of attack ranging from -5o to 15
o with 1
o increments. The operating Reynolds
number was fixed at 3.78 x 10⁵ corresponding to a speed between 22 m s
-1 to 25
m s-1
depending on the golf disc diameter. The Reynolds number was fixed to ensure
the viscous effects were accurately modelled for all discs as the diameter for short
and long range disc vary. A flat plate disc with thickness-to-diameter ratio of 0.01
was used as a baseline disc to provide reference data to which the commercial golf
discs can be compared. A summary of the wind tunnel aerodynamic characteristics
data for the commercial golf discs for short (putter), medium (mid-range) and long
range (driver) disc is presented in Table 5.6.
The results in Figure 5.9 show a comparison of the force and moment data for flat
plate and frisbee with putter ‘Aviar’, mid-range ‘Roc’ and driver ‘Wraith’ discs.
These discs were representative of the typical shape of commercial golf discs that
are widely used in disc golf game. A comparison of the force and moment data for
all putter discs and all driver discs is presented in Figure 5.10 and Figure 5.11,
respectively, in order to demonstrate the aerodynamic characteristics for short and
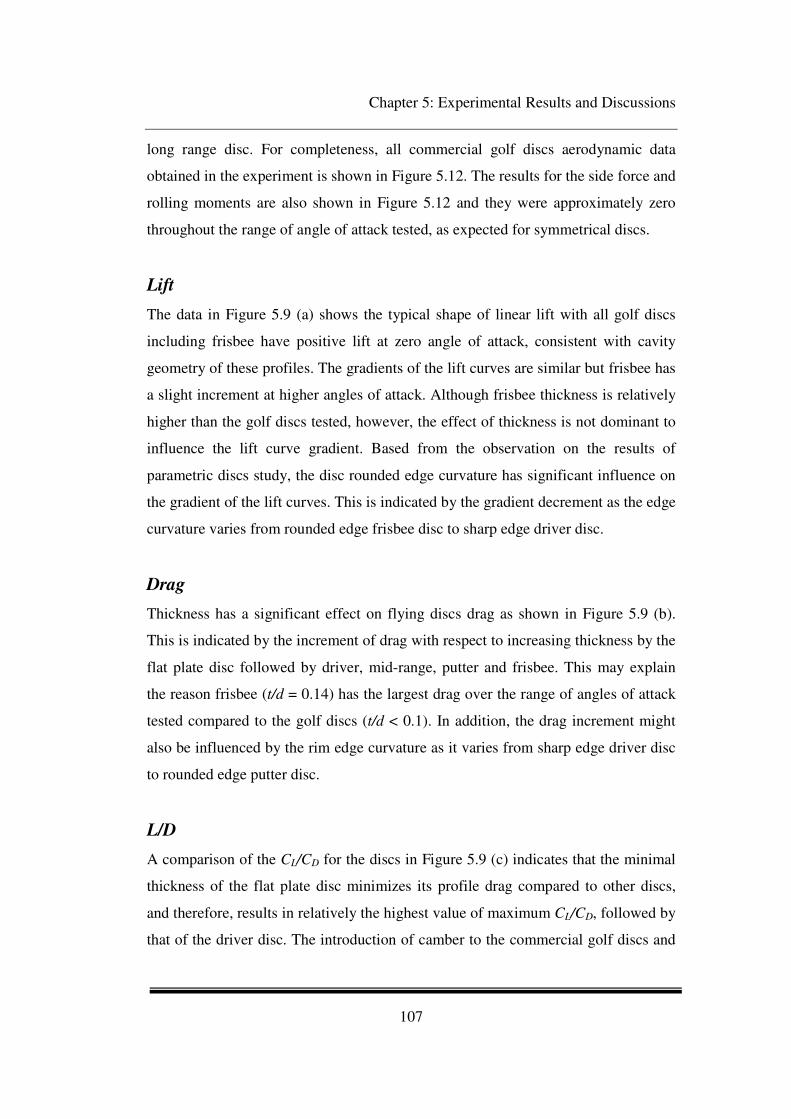
Chapter 5: Experimental Results and Discussions
107
long range disc. For completeness, all commercial golf discs aerodynamic data
obtained in the experiment is shown in Figure 5.12. The results for the side force and
rolling moments are also shown in Figure 5.12 and they were approximately zero
throughout the range of angle of attack tested, as expected for symmetrical discs.
Lift
The data in Figure 5.9 (a) shows the typical shape of linear lift with all golf discs
including frisbee have positive lift at zero angle of attack, consistent with cavity
geometry of these profiles. The gradients of the lift curves are similar but frisbee has
a slight increment at higher angles of attack. Although frisbee thickness is relatively
higher than the golf discs tested, however, the effect of thickness is not dominant to
influence the lift curve gradient. Based from the observation on the results of
parametric discs study, the disc rounded edge curvature has significant influence on
the gradient of the lift curves. This is indicated by the gradient decrement as the edge
curvature varies from rounded edge frisbee disc to sharp edge driver disc.
Drag
Thickness has a significant effect on flying discs drag as shown in Figure 5.9 (b).
This is indicated by the increment of drag with respect to increasing thickness by the
flat plate disc followed by driver, mid-range, putter and frisbee. This may explain
the reason frisbee (t/d = 0.14) has the largest drag over the range of angles of attack
tested compared to the golf discs (t/d < 0.1). In addition, the drag increment might
also be influenced by the rim edge curvature as it varies from sharp edge driver disc
to rounded edge putter disc.
L/D
A comparison of the CL/CD for the discs in Figure 5.9 (c) indicates that the minimal
thickness of the flat plate disc minimizes its profile drag compared to other discs,
and therefore, results in relatively the highest value of maximum CL/CD, followed by
that of the driver disc. The introduction of camber to the commercial golf discs and

Chapter 5: Experimental Results and Discussions
108
the frisbee disc, on the other hand, increases the lift and the corresponding CL/CD is
positive at α = 0.
Pitching moment
The pitching moment gradients result for the discs are positive, signifying that they
are dynamically unstable in pitch. As expected, the effect of cavity in golf discs is
significant that it reduces the gradient of pitching moment particularly for frisbee,
putter and mid-range disc. Note that the pitching moment gradient increases from
short range disc to long range disc.
Evaluating disc performance using the CL/CD curves alone would conclude that the
flat plate disc is superior. However, the performance of a free flying disc does not
depend on maximizing its lift and minimizing its drag alone. Based on the results, it
shows that the pitching moment has significant influence on the disc performance.
The pitching moment is translated into rolling rate as a disc spins. A minimal CMα
means that the rolling motion is minimized and this behaviour could improve the
disc performance.
Aerodynamic centre position
The disc aerodynamic centre data shown in Table 5.7 indicates that driver disc
‘Flick’ produces a large nose-up pitching moment, as a result of the position of the
aerodynamic centre which is further from the disc centre of gravity (at
approximately 21% of the chord length ahead of the half chord point). In contrast,
putter disc ‘Aviar’ produces a reduced nose-down pitching moment due to the
position of the aerodynamic centre that is located closer to the disc centre of gravity
(at about 5% of the chord length ahead of the half chord point).
Flow visualisation
In addition, qualitative flow visualisation conducted to investigate the behaviour of
three long range discs (Flick, Wraith and Quarter K) presented in Figure 5.13 and
5.14 found that the boundary layer separates near the leading edge to form a

Chapter 5: Experimental Results and Discussions
109
separation bubble that produces a crescent shape separation line at α = 0o on the
upper surface. As the angle of attack increases to 5o, the separation line move
further downstream closer to the trailing edge and the shear layer at the trailing edge
separates from the separation line. This indicates that trailing vortices detach from
the surface. The separation line movement is influenced by the disc thickness as the
driver disc thickness increasing from Flick, Wraith to Quarter K (properties of
commercial golf discs can be referred in Chapter 4 Method). The separation and
reattachment of reversed flows underneath the lower surface shows that the shear
layer that separates off the trailing edge reattaches to the surface inside the trailing
edge rim and is predominantly influenced by the cavity.

Chapter 5: Experimental Results and Discussions
110
Table 5.6: A summary of the wind tunnel aerodynamic characteristics data for the
commercial golf discs.

Chapter 5: Experimental Results and Discussions
111
Table 5.7: Location of the aerodynamic centre for commercial golf discs. A putter disc
generally produces a reduced nose up pitching moment as a result of the position of the
aerodynamic centre located closer to the disc centre of gravity (indicated by a lower % of
the chord length ahead of the half chord point). The result is in contrast with a driver disc
which generally produces a larger nose up pitching moment.

Chapter 5: Experimental Results and Discussions
112
Figure 5.9: Comparison of the aerodynamic forces and moment data for typical putter, mid-
range and driver discs with a flat plate disc t/c = 0.01 and a Frisbee (Potts, 2005).
(a) Lift coefficient, CL
(c) Lift-to-drag ratio, CL/CD (d) Pitching moment coefficient, CM
(b) Drag coefficient, CD

Chapter 5: Experimental Results and Discussions
113
Figure 5.10: Comparison of the aerodynamic forces and moment data for a putter disc
‘Aviar’ with a flat plate disc t/c = 0.01 and a Frisbee (Potts, 2005) disc.
(a) Lift coefficient, CL
(d) Lift-to-drag ratio, CL/CD (c) Pitching moment coefficient, CM
(b) Drag coefficient, CD

Chapter 5: Experimental Results and Discussions
114
Figure 5.11: Comparison of the aerodynamic forces and moment data for the commercial
‘driver’ golf discs.
(a) Lift coefficient, CL
(d) Lift-to-drag ratio, CL/CD (c) Pitching moment coefficient, CM
(b) Drag coefficient, CD

Chapter 5: Experimental Results and Discussions
115
Figure 5.12: Comparison of the aerodynamic forces and moment data for all commercial
golf discs with a flat plate disc t/c = 0.01.
(a) Lift coefficient, CL
(d) Lift-to-drag ratio, CL/CD (c) Pitching moment coefficient, CM
(b) Drag coefficient, CD
(f) Lift coefficient, CN (e) Side force coefficient, CY

Chapter 5: Experimental Results and Discussions
116
Figure 5.13: Comparison of the upper surface flow visualisation for commercial driver discs
at α = 0o and α = 5o. The flow direction is vertically from top to bottom of the image.
(a) Quarter K, α = 0o
(f) Flick, α = 5o (e) Flick, α = 0
o
(d) Wraith, α = 5o (c) Wraith, α = 0
o
(b) Quarter K, α = 5o
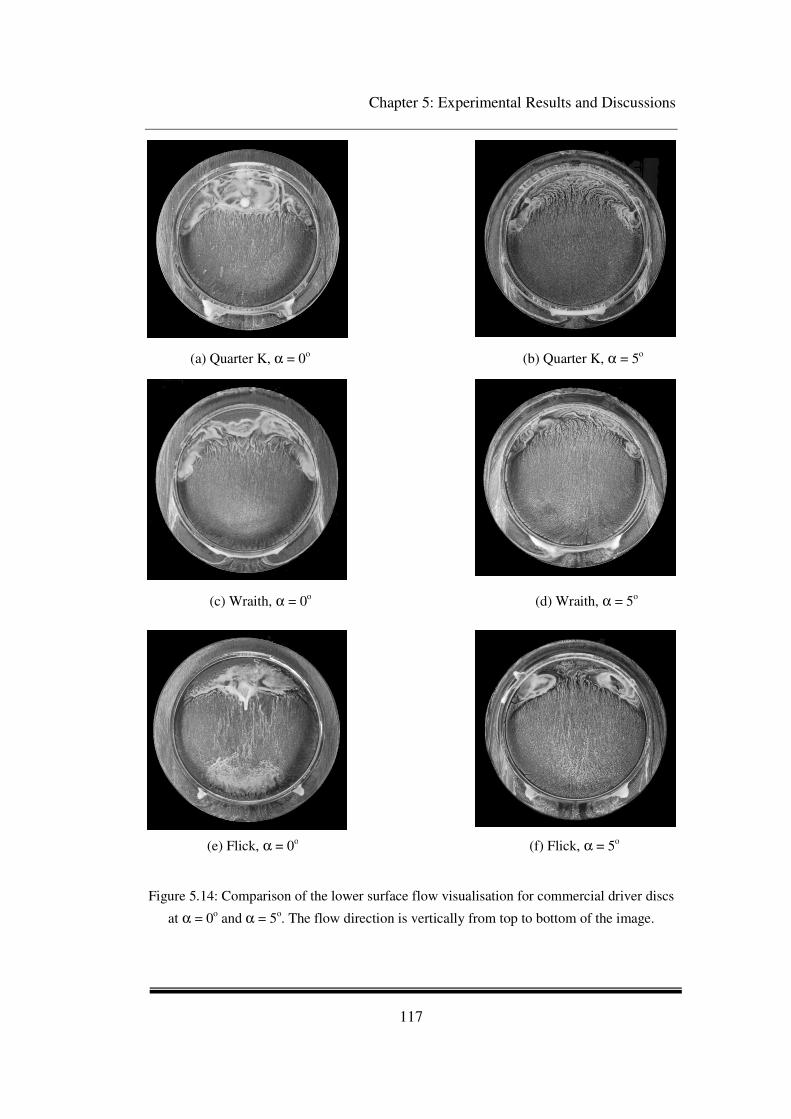
Chapter 5: Experimental Results and Discussions
117
Figure 5.14: Comparison of the lower surface flow visualisation for commercial driver discs
at α = 0o and α = 5
o. The flow direction is vertically from top to bottom of the image.
(a) Quarter K, α = 0o
(f) Flick, α = 5o (e) Flick, α = 0
o
(d) Wraith, α = 5o (c) Wraith, α = 0
o
(b) Quarter K, α = 5o

Chapter 6: Simulation Results and Discussions
118
Chapter 6
Simulation Results and
Discussions
6 Simulation Results and
Discussions

Chapter 6: Simulation Results and Discussions
119
This chapter presents and discusses simulation results for commercial golf discs
particularly the putter and driver discs. The main objective of the work is to
understand the flight trajectories of short and long range discs, with focus on the
range and sensitivity. A comparison of sphere with other flying objects is presented
in the beginning to establish the concept of range and sensitivity analysis. Then, the
golf discs flight trajectories are discussed, as well as the effect of launch attitude on
achievable range. A range and sensitivity analysis will finally be employed to assess
the throwing skill level required of a player with respect to the golf discs categories.
The outline to illustrate this chapter is shown in Figure 6.1.
Figure 6.1: Outline of Chapter 6.

Chapter 6: Simulation Results and Discussions
120
6.1 Sphere flight trajectories
A comparison of sphere flight trajectories with respect to launch angles as a function
of launch speeds is presented in Figure 6.2. (Note that the sphere in the simulation is
analogous to a baseball with a diameter = 0.073 m, mass = 0.145 kg and CD = 0.5).
6.1.1 Range and sensitivity of sphere
Range as a function of launch angles at varying launch speeds
The data in Figure 6.2 (a) shows that dimensional sphere range at varying launch
angles from 0o to 90
o have parabolic shapes. The maximum range occurs at around
43o, lower than the angle predicted by projectile theory because the sphere is under
the influenced of the drag force. Sphere has zero sensitivity (dR/dθ = 0) at the
maximum range with launch angle of 43o as shown in Figure 6.2 (b). It means a
change of sphere range with respect to the changes of launch angle is zero at this
point.
Figure 6.2: Comparison of sphere with drag at varying launch speed for dimensional range.
(a) (b)

Chapter 6: Simulation Results and Discussions
121
6.1.2 Comparison for dimensionless range and
sensitivity of sphere with flying discs
A comparison of dimensionless range and sensitivity analysis for spheres (with and
without drag) and golf discs (putter ‘Aviar’, mid-range ‘Roc’ and driver ‘Wraith’)
including Frisbee (simulated by using Potts (2005) data) is shown in Figure 6.3.
Note that for ease of comparison, the legend displays sphere as a ‘baseball’ to
illustrate the physical size of the sphere.
Sphere with and without drag
Figure 6.3 (a) shows that both spheres with and without drag curves have a parabolic
shape as expected. The maximum range for sphere without drag occurs at 45o while
sphere with drag occurs at approximately 43o. As drag is introduced in the sphere
case, maximum sphere range substantially reduces to 25%. This suggests that drag
has significant impact on reducing the maximum range.
Flying discs
There is significant dissimilarity between the spheres and the flying discs results as
shown in Figure 6.3 (b). The flying disc curves generally skewed to the left with
zero sensitivity occurs at lower launch angles between 10o to 13
o. This is mainly due
to the influence of lift as Wesson (2009) also observes similar phenomenon in a ball
(his works indicate that as the lift is introduced in the ball case, the symmetrical
parabolic curve started to skew to the left and the optimal launch angle value
becomes lower). The level of difficulty in throw is quantified by the width of the
‘peak bucket’, with wider width can be associated with a less sensitive disc. Figure
6.3 (b) shows that flying discs are generally more sensitive than spheres as indicated
by the narrow width of the peak bucket. This means that flying discs are more
difficult to be thrown at launch and generally requires greater skill to throw than
spheres.

Chapter 6: Simulation Results and Discussions
122
Figure 6.3: Comparison between flying discs with spheres at launch speed 20 m s-1
. The
flying disc curves generally skewed to the left mainly due to the influence of lift and causes
the optimal launch pitch angle to occur at lower values.
(a)
(b)

Chapter 6: Simulation Results and Discussions
123
6.2 Golf disc flight trajectories
The results in this section only consider the golf disc flight trajectories as a function
of launch pitch angles (θL). Each disc was launched with a clockwise direction and
the launch pitch angles (θL) vary from 5o to 30
o. The remaining initial conditions
were as follows: VL = 20 m s-1
, φL = 0o, αL = 0
o, ψL = 0
o and AdvR = 0.5. The
commercial golf disc models used throughout the simulation to represent the short,
medium and long range discs are putter ‘Aviar’, mid-range ‘Roc’ and driver ‘Wraith’
unless stated otherwise.
The advance ratio in the simulation is fixed at 0.5 as it represents the typical value
widely used by players in practice (Potts, 2005; Nathan, 2008). The effect of the
advance ratio is briefly explored in the study; it was found that increasing the
advance ratio to 1.0 reduces the roll rate but this produces negligible effect on the
disc flight range for typical flight trajectories.
6.2.1 XY and XZ plane
Trajectories at varying launch pitch angles (with fixed roll angle)
The golf discs flight trajectories as a function of launch pitch angles in the XY and
XZ plane are plotted in Figure 6.4 and Figure 6.5. The golf discs generally have a
tendency to bank right (positive roll) initially before banking left for the remainder
of the flight as the discs fly through their trim condition. The reason that causes the
changes is due to the following. The disc has a negative pitching moment when
launched at low angle of attack. As the angle of attack throughout the flight steadily
increases due to the incremental value of vertical velocity and reaches its trim angle,
the pitching moment becomes positive leading to a negative roll rate with increasing
magnitude as shown in the attitude time history in Figure 6.8.
Chapter 6: Simulation Results and Discussions
124
Driver disc then banks sharply to the left followed by the mid-range and putter discs.
The results show that for a fixed launch speed, the driver disc produces the greatest
range, followed by the mid-range disc and the putter disc. The optimal launch pitch
angle for maximum range for the putter, mid-range and driver discs occur
approximately at 15o, 10
o and 10
o, respectively, giving ranges of 51 m, 54 m, and 61
m. Note that the symbols are at fixed time intervals so the disc relative velocity can
be inferred by the symbol spacing.
The simulation result agrees well with Potts (2005) findings in which similar
behaviour was also observed in the frisbee disc simulation. The golf discs
comparison implies that the optimal launch pitch angle is unique to the disc. This
means that the optimal launch pitch angle values for other golf disc models would be
different; which depends on the disc geometrical shape and their aerodynamic
characteristics.
Trajectories at varying launch roll angles (with fixed pitch angle)
Note that the results discussed previously were obtained when the disc launch roll
angle (φL) is fixed at zero (Chapter 4 has stated the default initial conditions for the
simulation). It assumes that the launch pitch angle is independent of launch roll
angle. If the disc launch roll angle is not fixed at zero, the disc flight direction
change more abrupt due to increasing roll rate. Therefore, another case study was
simulated to understand the disc behaviour when the launch roll angles were varied
from -30o to 30o. The golf disc flight trajectories as a function of launch roll angle in
the XY and XZ plane are plotted in Figure 6.6 and Figure 6.7. All parameters remain
the same as the previous case study except that the launch pitch angle was fixed at
θL = 15o. The results show that the optimal launch roll angle for the putter, mid-
range and driver discs occur approximately at 0o, 5
o and 10
o, respectively, giving
maximum ranges of 50 m, 53 m, and 60 m, respectively. The general trend of
increased optimum launch roll angle values from putter to driver disc indicates that
the driver roll rate is higher than putter and therefore results in greater range.

Chapter 6: Simulation Results and Discussions
125
In summary, the trajectories result highlights that:
• The disc aerodynamics is a function of disc geometry.
• The disc dynamics is a function of the aerodynamics and disc
inertial properties.
The parameter values for maximum range depend on the geometry of the disc and
hence, each disc categories have to be thrown with particular initial conditions to
achieve maximum range.

Chapter 6: Simulation Results and Discussions
126
Figure 6.4: Comparison of the (a) putter, (b) mid-range and (c) driver disc in plan view as
the launch pitch angles vary from 5o to 30
o. The initial conditions are: VL = 20 m s
-1, φL =
0o, αL = 0
o, ψL = 0
o.
Putter
Mid-range
Driver
(a)
(b)
(c)

Chapter 6: Simulation Results and Discussions
127
Figure 6.5: Comparison of the (a) putter, (b) mid-range and (c) driver disc in side
view as the launch pitch angles vary from 5o to 30o. The initial conditions are: VL =
20 m s-1
, φL = 0o, αL = 0
o, ψL = 0
o.
Putter
Mid-range
Driver

Chapter 6: Simulation Results and Discussions
128
Figure 6.6: Comparison of the (a) putter, (b) mid-range and (c) driver disc in plan view as
the launch roll angles vary from -30o to 30o. The initial conditions are: VL = 20 m s-1
, θL =
15o, αL = 0
o, ψL = 0
o.
Putter
Mid-range
Driver

Chapter 6: Simulation Results and Discussions
129
.
Figure 6.7: Comparison of the (a) putter, (b) mid-range and (c) driver disc in side view as
the launch roll angles vary from -30o to 30o. The initial conditions are: VL = 20 m s-1, θL =
15o, αL = 0o, ψL = 0o.
Putter
Mid-range
Driver

Chapter 6: Simulation Results and Discussions
130
(a) Pitch angle
(b) Roll angle
Figure 6.8: Attitude time histories for a typical putter, mid-range and driver discs launched
at VL = 20 m s-1, θL = 15o, αL = 0o, ψL = 0o. Note that driver disc roll rate magnitude is higher
than mid-range or putter disc (t’ is the dimensionless time).
6.2.2 Golf disc landing locations
Figure 6.9 shows the landing locations for the putter, mid-range and driver discs at
different launch speed of 15 m s-1
, 20 m s-1
and 25 m s-1
. In this investigation, the
launch pitch angle is fixed at θL = 15o, with the launch roll angles vary from -30
o to
30o. At speed of 15 m s
-1, the golf discs produce a ‘C’ shaped locus. However, as
the speed increases to 25 m s-1
, the ‘C’ shaped locus becomes less pronounced. In

Chapter 6: Simulation Results and Discussions
131
sports science, the landing locus plot can be a useful tool to visualise and understand
the sensitivity of landing location with respect to launch parameters. Given that a
player can influence the landing location of a disc by varying the launch attitude, the
landing locus plot would give some insight upon launching the disc to reach
maximum distance.
Figure 6.9: The landing locations for putter, mid-range and driver discs as a function of
launch roll angles from -30o to 30
o at different launch speed. The launch pitch angle is fixed
at θL = 15o and AdvR = 0.5.
6.3 Effect of release attitude on range
6.3.1 Effect of varying launch pitch angles on
range (at fixed launch roll angle)
The variation of launch pitch angles for the putter disc, mid-range disc and driver
disc towards range is shown in Figure 6.10. The launch roll angle (φL) is fixed at 0o
with launch pitch angles varying from 0o
to 80o. As expected, the driver disc

Chapter 6: Simulation Results and Discussions
132
produces the greatest range compared to the mid-range disc and the putter disc.
However, the difference between the maximum range of the putter and driver discs
is not so much as expected based on their difference in geometric parameters. Based
on the simulation results, the local optimal launch pitch angle for the putter, mid-
range and driver discs occur approximately at 13o,12
o and 9
o, respectively, for
maximum range of 52 m, 55 m and 63 m as shown in Table 6.1. The value of local
optimal launch pitch angles and the corresponding value of maximum range in this
analysis is different from the value in the flight trajectories analysis (Section 6.1)
due to the angle interval. In the flight trajectories analysis, the golf discs were
simulated with 5o interval to capture the general trend of the golf discs flight
trajectories as the launch pitch angles vary. Whereas in this analysis, the golf discs
were simulated with 1o interval to determine more accurate local optimal launch
pitch angle that corresponds to the maximum range.
The graph indicates that the launch pitch angle is a sensitive parameter influencing
the maximum range as es expected. Note that the local optimal launch pitch angle
value at which maximum distance occurs generally decreases from short-range disc
to long-range disc due to the different aerodynamic charateristics of the discs.
Table 6.1: The golf discs local optimal launch pitch angles that correspond to the disc
maximum distance at φL = 0o.

Chapter 6: Simulation Results and Discussions
133
6.3.2 Effect of varying launch roll angles on
range (at fixed launch pitch angle)
The effect of varying launch roll angles from -60o to 60
o is shown in Figure 6.11. In
this case, the launch pitch angle (θL) is fixed at 15o. The results in this study also
found that the difference in between the maximum range of the putter and driver disc
is not so large as expected. The local optimal launch roll angle for the golf disc
occurs at -5o, -2
o and 5
o for the putter, midrange and driver, respectively, for
maximum range of 51 m, 54 m, 64 m as shown in Table 6.2. The result shows that
range is sensitive to launch roll angle, as well as the launch pitch angle simulated in
the previous case. In contrast to the case of launch pitch angle, the local optimal
launch roll angle value trend generally increases from short-range disc to long-range
disc. For positive launch roll angle case, the disc distance generally reduces as the
launch roll angle increases. While in the case of a negative launch roll angle, the disc
distance reduces as the launch roll angles become more negative.
Table 6.2: The golf discs local optimal launch roll angles that correspond to the disc
maximum distance.
Concluding remarks
It is already established in the projectile study that range is generally influenced by
two parameters; the speed and the launch angle. In this thesis, the launch speed in
the simulation is fixed to eliminate the influence of speed on range (as the range is
proportional to the square of speed and each player has a maximum achievable
launch speed). By doing this, it can focus the influence of launch angles (pitch and
roll) on disc range. As a result, the thesis found that golf disc range is sensitive to

Chapter 6: Simulation Results and Discussions
134
launch pitch angle and launch roll angle which modified the maximum disc distance.
In addition, the optimal launch pitch angle and optimal launch roll angle are unique
to the disc. This information would give a player some insight to manipulate their
disc upon launching to achieve maximum distance. The roll rate also has substantial
effect on the disc range as disc designed with more streamlined geometry like driver
produces higher roll rate that eventually increases the range. However, the most
significant results from the simulation show that the difference in between the
maximum range of the putter and driver discs is not so large despite their differences
in the geometry.
Figure 6.10: The effect of varying launch pitch angles towards range for putter, mid-range
and driver discs. VL = 20 m s-1
, φL = 0o, αL = 0
o, ψL = 0
o, AdvR = 0.5.

Chapter 6: Simulation Results and Discussions
135
Figure 6.11: The effect of varying launch roll angles towards range for putter, mid-range
and driver discs. VL = 20 m s-1, θL = 15o, αL = 0o, ψL = 0o, AdvR = 0.5.
6.4 Golf disc range and sensitivity
The thesis has established that the variation of disc geometry did change the disc
aerodynamic characteristics as the quantitative data measured in the wind tunnel
study support this. The changes eventually influence the disc performance in terms
of the range as demonstrated in the comparison of short, medium and long range
discs simulation. Of particular interest now is how these results can be interpreted to
help the player improve their performance in the game. This section will discuss the
relationship derived from the disc range with respect to changes in the launch
conditions – the disc range sensitivity. A scheme to match the skill level of a player
with the type of discs thrown to achieve a given target distance will be introduced.
Note that the analysis only varies the launch pitch angles with respect to range. It is
felt that these results are sufficient enough to demonstrate the relationship of disc

Chapter 6: Simulation Results and Discussions
136
range with respect to the changes in launch conditions and how the disc range
sensitivity is interpreted.
6.4.1 Disc range sensitivity as a function of
launch pitch angles
First, it is important to highlight that there are two parameters that contribute to a
successful flying disc game; the player accuracy combined with the disc sensitivity.
It is also important to note that this thesis will only consider the disc sensitivity, as
the player accuracy requires biomechanics study which is beyond the scope of this
thesis. As described in Chapter 3 (Theory), the disc range can be associated with the
changes of the launch conditions. This relationship will be called as disc range
sensitivity from hereafter and to simplify the analysis, it can be classified as the
following:
• Zero sensitivity means that any changes of the initial launch conditions
would result in zero changes in the landing distance.
• As range sensitivity value increases, it means that any changes of the initial
launch conditions would result in more divergence from the target distance.
This suggests that the disc is more difficult to be launched and becomes less
accurate at hitting the target distance.
• The level of difficulty is quantified by the width of the peak bucket, with
wider width can be associated with a less sensitive disc and therefore easier
to be launched. In contrast, narrower width can be associated with a more
sensitive disc and therefore difficult to throw.
In Chapter 3 (Theory), an example to illustrate the basic theory of the relationship
derived for the range with respect to the changes of initial conditions for a sphere
has been demonstrated. As disc is more complex, the range could not be obtained

Chapter 6: Simulation Results and Discussions
137
directly as in the sphere case because the disc governing equations can only be
solved numerically. Therefore, the simulation is used to determine the disc range.
The disc range sensitivity is then measured similar to the method demonstrated in
the sphere range sensitivity.
The results in Figure 6.12 to Figure 6.15 show the plot of range with respect to
launch pitch angles as a function of launch speeds for the putter and the driver discs,
in dimensional and dimensionless forms. The plots shown in Figure 6.12 (a) and
Figure 6.13 (a) represent the putter and driver disc dimensional range variation with
respect to launch pitch angle as a function of launch speed. As expected, the disc
range increases as the launch speed rises with the driver disc has a higher maximum
range than the putter disc. When these results are associated with Figure 6.12 (b) and
Figure 6.13 (b) that represents the data for changes of range with respect to the
changes of launch pitch angle, the following information can be extracted:
• Zero sensitivity (at which changes of range with respect to the changes of
launch pitch angle is zero (dR/dθ=0)) occurs at the maximum range.
• The shape of the peak bucket for the putter disc is generally wider than the
driver disc.
• The trend of local optimal launch pitch angle that corresponds to maximum
range generally decreases as the launch speed increases regardless of the golf
disc categories.
In order to provide some insight to relate to the player skill level with the type of
discs thrown, the extracted information can be interpreted as the following. The
driver disc is generally more sensitive than the putter disc as indicated by the narrow
width of the peak bucket. Although the driver disc produces a greater distance, they
are highly sensitive to the changes in launch conditions which made them difficult to
be thrown at launch. In contrast to driver disc, the putter disc typically covers a
much shorter distance but they are less sensitive to the changes in launch conditions
and therefore, easier to be controlled at launch. This suggests that disc designed for

Chapter 6: Simulation Results and Discussions
138
long range requires a greater skill to throw compared to disc designed for short
range.
In regards to the local optimal launch pitch angle trend that corresponds to disc
maximum range, it highlights some important aspect to be considered by the player
particularly the launch speed. Based from the results shown in Figure 6.14 and
Figure 6.15, if the player decides to throw the disc with a low launch speed, it is
advisable for the player to throw their disc at high launch pitch angle as this action is
more favourable to produce a greater distance. In contrast to that, if the player
decides to throw the disc with a high launch speed, it is perhaps best for the player to
throw their disc at low launch pitch angle for the same reason stated previously.

Chapter 6: Simulation Results and Discussions
139
(a) Range at different launch speed for putter disc.
(b) The change of range with respect to launch pitch
angles at varying launch speed for putter disc.
Figure 6.12: Dimensional comparison of putter disc launched at varying launch speed. The
shape of the peak bucket is generally wider indicates that putter disc is less sensitive to the
changes in launch conditions.
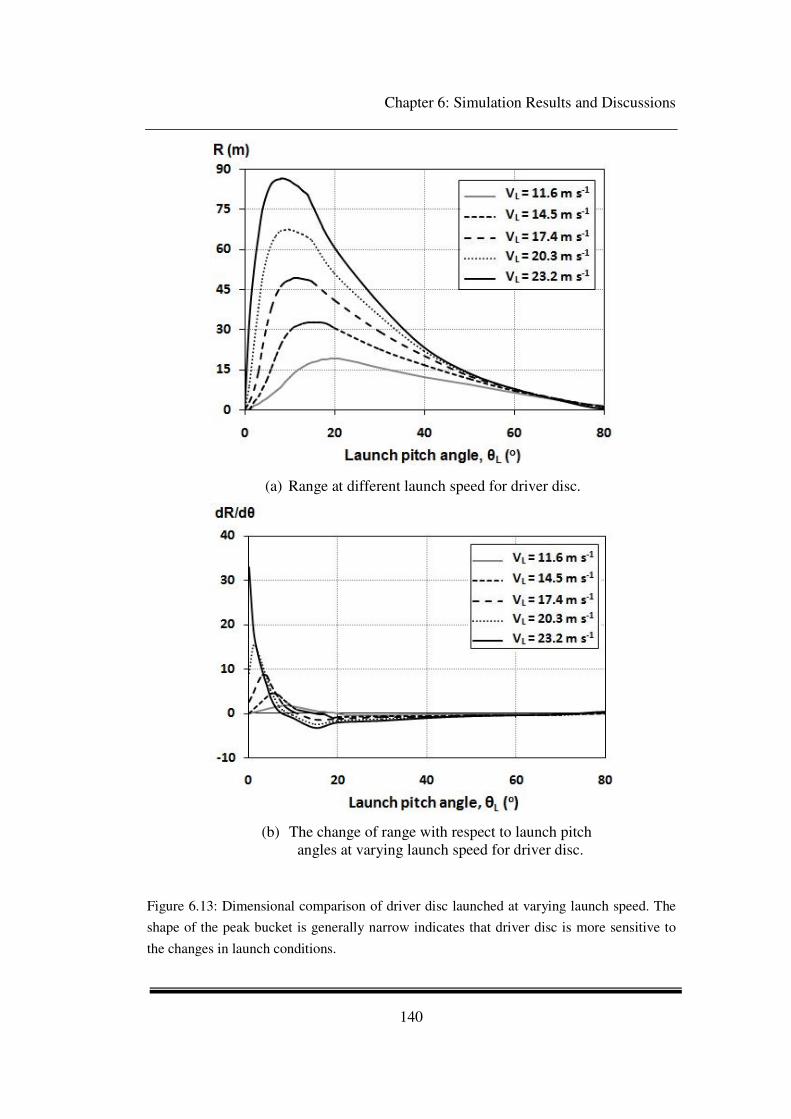
Chapter 6: Simulation Results and Discussions
140
(a) Range at different launch speed for driver disc.
(b) The change of range with respect to launch pitch
angles at varying launch speed for driver disc.
Figure 6.13: Dimensional comparison of driver disc launched at varying launch speed. The
shape of the peak bucket is generally narrow indicates that driver disc is more sensitive to
the changes in launch conditions.

Chapter 6: Simulation Results and Discussions
141
(a) Dimensionless range at different launch speed for putter disc.
(b) The change of dimensionless range with respect to launch
pitch angles at varying launch speed for putter disc.
Figure 6.14: Dimensionless comparison of putter disc launched at varying launch speed. The
optimal launch pitch angle generally increases as speed reduces and the most favourable
shot occurs at dR’/dθ = 0 as range sensitivity is zero at this point.
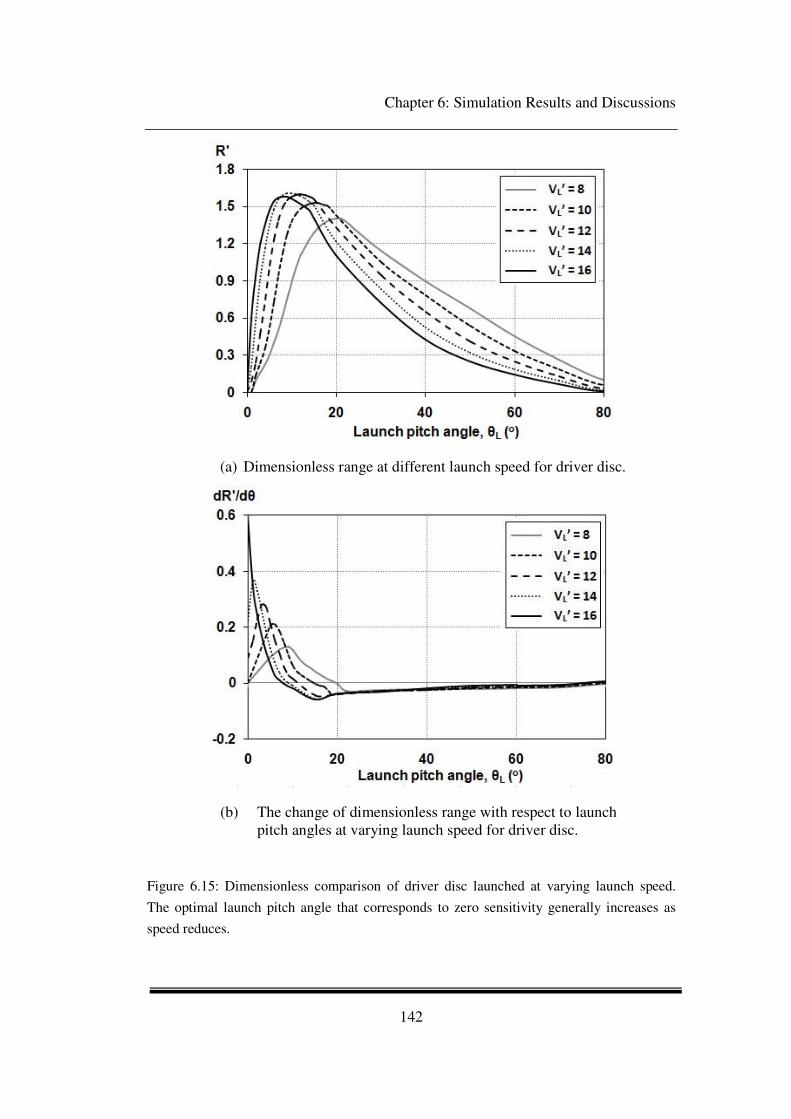
Chapter 6: Simulation Results and Discussions
142
(a) Dimensionless range at different launch speed for driver disc.
(b) The change of dimensionless range with respect to launch
pitch angles at varying launch speed for driver disc.
Figure 6.15: Dimensionless comparison of driver disc launched at varying launch speed.
The optimal launch pitch angle that corresponds to zero sensitivity generally increases as
speed reduces.

Chapter 6: Simulation Results and Discussions
143
6.4.2 Golf disc favourable shot
The previous results lead to another interesting aspect to be considered. If the player
decides to throw a disc to hit a desired maximum range, the following information
offers some insight. If observed carefully in Figure 6.12 (a) or Figure 6.13 (a), each
maximum range has a minimum launch speed required. It is indicated by the peak of
the graph and corresponds to zero value in Figure 6.12 (b) and Figure 6.13 (b). It can
be considered as the most favourable shot as range sensitivity is zero at this point.
To better understand the situation, assume the player aim to throw a putter disc at
about 52 m. In Figure 6.12 (a) that represents the putter disc plot, maximum range of
52 m occurs at launch speed of approximately 20.3 m s-1
with local optimal launch
pitch angle of 13o. The player can aim to launch the disc at the stated launch
conditions. However, if the player decides to throw the disc at higher launch speed,
they have two available launch shot options. They can either throw it with ‘skimmer
shot’ (low) or ‘lob shot’ (high).
A skimmer shot in this case is illustrated in positive slope of the graph and can be
defined as the shot at which the launch angles are less than the local optimum launch
pitch angle. Whereas a lob shot is illustrated in negative slope of the graph and can
be defined as the shot where the angles are more than the local optimum launch
pitch angle. Both shots would give the same maximum range value of 52 m. This is
due to the fact that the maximum range does not only occur at the minimum speed
required, but also occurs at a higher speed and both shots can reach the desired
maximum range. However, it is important to note that if the player throws the disc
less than the minimum speed required, the desired maximum range will fail to be
achieved as demonstrated in the simulation result.
The next interesting aspect that is worth to be considered is the favourable shot.
Based on the graph of Figure 6.14 and Figure 6.15, the most favourable shot is at the
optimal launch pitch angle at which the maximum range occurred. This is due to the

Chapter 6: Simulation Results and Discussions
144
fact that changes of range with respect to the changes of launch pitch angle is zero
(dR/dθ = 0). In practical, this shot is only possible if the player knows the specific
local optimal launch pitch angle for their disc (although it would be difficult to
throw the disc exactly at this angle). However, assuming that a player does not know
that value and usually would opt to have either a low shot or a high shot to reach
maximum distance, therefore it is important to identify which shot is more
favourable. The results suggest that the high shot is more favourable than the low
shot. This is due to the low range sensitivity values of high shot compared to low
shot which can be seen clearly from the slope.
In summary, the golf discs sensitivity that relates the disc categories with the player
skill level is illustrated in Figure 6.16.
Figure 6.16: Discs designed for long range such as driver is highly sensitive to the changes
in launch conditions and therefore, requires a greater skill to control. In contrast, putter disc
typically covers a much shorter distance but they are less sensitive to the changes in launch
conditions and therefore, easier to control at launch.

Chapter 7: Conclusions and Future Work
145
Chapter 7
Conclusions and Future Work
7 Conclusions and Future Works

Chapter 7: Conclusions and Future Work
146
This thesis has studied the aerodynamics and flight dynamics of flying discs. A
review of the study of flying discs, especially those used in sports, and the flight
performance of other relevant sports objects were given in Chapter 2. The review
highlighted the need to investigate the relationship between the designs of discs and
their flight performance, particularly the range covered during flight. For this
purpose, experimental and computational investigations were performed on three
types of golf discs – putter, mid-range and driver discs; in addition, a number of
parametric disc models were used to experimentally isolate the effect of important
design features on the disc aerodynamic characteristics. Note that disc parametric
study (for low aspect ratio wing less than two) has never been performed previously.
This chapter provides conclusions to the results of this work and highlights the
original contributions of this work on the study of flying discs. It evaluates the
achievements of the goals set forth at the beginning of the thesis and identifies some
limitations of the study. Some recommendations for future work are also suggested.
7.1 Concluding remarks
1. The experimental result shows that practical discs need to have cavities for
satisfactory flying qualities.
• The main aerodynamic characteristic influenced by the disc cavity is
the pitching moment. The experimental result demonstrates that the
presence of this cavity produces a significant aft shift in the
aerodynamic centre position (xac) such that the pitching moment
about the centre of the disc is substantially zero for an angle of attack
ranging from 0o to 7
o.
• The shift in the aerodynamic centre means that the disc will have a
minimal tendency to roll about the flight axis and therefore, require
less skill to throw towards a given target, and achieve a greater range

Chapter 7: Conclusions and Future Work
147
compared to a disc with the same lift-to-drag ratio (L/D) but with
strong roll divergence.
2. Disc thickness influences the aerodynamic characteristics of golf discs,
particularly the drag.
• Thickness has a significant effect on drag through an increase in the
profile drag. As the lift is largely unchanged by the thickness, the
induced drag (lift-dependent) component is similar between discs of
different thickness.
• There is evidence from the flow visualization study that changing the
thickness eventually changes the extent of the upper surface leading
edge separation bubble. This behaviour as well as the profile drag has
a significant contribution to the overall drag.
3. The overall effect of fairing (i.e. rounding or tapering) the circumferential
edge is to increase the lift-to-drag ratio of the disc for the range of angles of
attack tested compared to the non-fairing case.
• The experimental result demonstrates that the effect of fairing on the
disc leading or trailing edge significantly reduces the drag compared
to the non-fairing case over the range of angles of attack tested.
Between the faired profiles, the sharp edge disc performs better
where its lift-to-drag ratio is higher than that of the rounded profile,
particularly at higher angles of attack.
4. The performance of a free flying disc does not depend on the lift-to-drag
ratio (CL/CD) alone such as for a typical aircraft, but also the pitching
moment, because the disc does not reach a steady dynamic state flight as the
aerodynamic and flight dynamics are constantly changing due to its spin.

Chapter 7: Conclusions and Future Work
148
• The experimental result shows that the driver disc is designed to have
a relatively higher lift-to-drag ratio compared to the putter disc over
the range of angles of attack tested. Although the putter disc has a
low lift-to-drag ratio, it has the advantage of reduced nose-down
pitching moment (as a result of the position of the aerodynamic
centre located closer to the disc centre of gravity) which leads to a
minimal tendency to roll about the flight axis.
• The range of a trimmed fixed-wing flying vehicle is directly
proportional to its lift-to-drag ratio. In contrast, the range of a disc is
influenced by both its lift-to-drag ratio and its pitching moment,
which is coupled to the disc rolling motion via its spin. Although the
driver has the highest lift-to-drag ratio, its actual range is reduced
from a potentially larger range due to this rolling motion.
5. The difference between the range of the short and long range discs is small
and not as large as expected because disc dynamics and trajectories vary
widely throughout the flight.
• The putter disc has a maximum range that is 21% less than that for a
driver disc, while the mid-range disc has a maximum range that is
12% less than that for a driver disc. Meanwhile, the putter disc has a
maximum CL/CD that is 24% less than that for a driver disc, while the
mid-range disc has a maximum CL/CD that is 20% less than that for a
driver disc.
• The range computed from the disc simulation measures the ground
range (between the launch to landing point) instead of the actual
ground distance followed by the disc trajectory. A more curved disc
trajectory reduces the maximum potential range it could achieve. The
range of a driver disc is less than expected because of its more curved
flight path compared to that of the putter disc.

Chapter 7: Conclusions and Future Work
149
6. A novel method to quantify disc sensitivity with respect to changes in launch
conditions has been developed.
• This approach of quantifying the disc sensitivity is useful because it
provides a method to determine the ability to ‘control’ the disc when
throwing it at a target: a less sensitive disc is easier to control
compared to a more sensitive one. As the control of a disc can be
related to the difficulty level of throwing the disc, the sensitivity
analysis could be used as a metric to analyse the skill level required
to throw the disc, or other objects in general (e.g., ball, discus,
javelin, etc).
• The simulation result shows that different flight characteristics exist
between the long and short range disc.
• A driver disc can fly the furthest but was highly sensitive to
divergence from the optimal release conditions. A putter disc
typically covers a much shorter distance but was less sensitive to
throwing perturbations.
• A correlation exists between skill level and divergence from the
intended target position. Discs designed for long range require a
higher skill level compared to discs designed for short range.
7.2 Future research recommendations
The thesis has established the mapping between the geometry of a disc and its
aerodynamic characteristics and subsequently its flight dynamics. The findings in
this study can be utilized or extended to benefit a number of related works. These
potential future works are described below.
1. The performance of an athlete based on his or her throwing accuracy could
be assessed quantitatively by combining the study of disc sensitivity and the
biomechanics of disc throwing.

Chapter 7: Conclusions and Future Work
150
• The overall performance of a disc to achieve its goal (of reaching a
target) in reality is a combination of the disc sensitivity and the
athlete throwing accuracy. The disc sensitivity determines its
chances of reaching a certain target given a tolerance in the input
conditions. The throwing accuracy of a player, on the other hand,
describes his or her ability to produce consistent throws. While the
sensitivity of a disc has been shown in this work to be quantifiable
using flight simulations, the quantification of a player’s throwing
accuracy (i.e. his or her ability to reproduce similar or identical
repeatable throwing actions) requires knowledge on the
biomechanics of throwing. By using a point-mass sphere for a
demonstration, a method is proposed here to couple variables related
to both aspects of disc performance (i.e. sensitivity and accuracy)
based on the technique of analysing uncertainty (BSI, 2003). The
overall uncertainty dR of reaching a desired target range when
throwing a sphere, given that only two independent variables can be
varied, is given as
WB = [2\<+<G W6\ + 2\<+
<H WE6\ (7.1)
where dV is the change in the launch speed and dθ is the change in
the launch pitch angle. The values for <+<G and
<+<H are the measures
of the ‘sphere sensitivity’ to initial launch conditions, which depends
on the value of the initial launch speed Vo and the initial launch angle
θo. However, the values for dV and dθ measures a player’s throwing
accuracy. These accuracy measures depend on a player’s unique
throwing skills which differ between players; these values can only
be measured through field experiments. Note that the square root
summation follows the basic technique of summing uncertainties for

Chapter 7: Conclusions and Future Work
151
a number of independent variables to obtain the total uncertainty dR
of a parameter R as expressed below:
WB = [∑ 2\<+<3f
WgX6\. (7.2)
In the case of throwing a disc, where R is range, then dxi is the change
in the independent launch variables and <+<3f
is the change of range
with respect to the change of the launch variables.
2. The experimental data can be used as a benchmark to validate
computational fluid dynamics (CFD) study. The understanding of complex
airflow around disc with a cavity could be enhanced using the tools of CFD.
Parametric variations of various design features could be performed much
faster and more efficiently with better visualization techniques.
• The aerodynamics of golf discs have been evaluated experimentally
in this study from wind tunnel experiments. These experiments,
albeit valuable, were time consuming, challenging particularly when
dealing with equipment malfunctions, and limited in terms of the
type of information collected. These limitations could be addressed
and minimized by studying the same problem using CFD tools. The
data gathered herein from experiments can serve as the benchmark
data to validate any CFD study.
• Following a proper validation, a CFD study could be fully utilized to
expand the current study. One example would be to extend the
parametric study in this work by including other design parameters
not included here. In addition, the aerodynamic analysis could be
detailed further by extending the regimes of angles of attack, to
include more pronounced stages of flow separation, or varying the
flow speeds to study the effect of Reynolds number on flow regimes

Chapter 7: Conclusions and Future Work
152
beyond those common to low-speed disc flight, i.e. for medium to
large a Mach number flow. More importantly, the effect of disc
geometrical properties could be studied in more details with relative
ease.
• These computational analyses are useful as they provide further
understanding on disc aerodynamic characteristics, as well as allow
improvement on disc design at low cost.
• More uniquely, a CFD study would allow one to visualize the flow
dynamics with greater details at various configurations. Based on the
findings in this thesis, it would be interesting to be able to visualize
the flow dynamics underneath a cavity with greater detail. It should
also be possible to track how the complex flows inside the cavity
evolve with varying angles of attack, for example. Studying the
evolution of tip vortex around disc side edges could also prove to be
important with respect to the overall disc aerodynamics and flight
dynamics.
3. The optimization of disc geometric parameters requires some compromise in
design.
• It is clear from the study that minimizing the pitching moment is
necessary to improve disc stability; however, the parametric study
shows that this minimization (i.e., increasing the cavity height) also
increases the drag. As such, specific design requirements on a disc
must be tailored to the purpose of the disc – for example, a long
distance disc must be designed to have low drag characteristics while
a disc designed for high accuracy must have minimal pitching
moment characteristics.
• In this regard, a future work is recommended to study the detailed
effect of combining different disc features for specific purposes. This
detailed analysis could be used to identify dominant geometrical
features associated with any required flight characteristics. Such
Chapter 7: Conclusions and Future Work
153
study could be of immediate interest to improve the efficiency of
flying discs in any practical applications (e.g., sports, military
projectile, etc). Another future work could focus on the fundamental
aspect of a flying disc with regards to the different disc geometrical
features studied in this thesis. Here, detailed experimental and/or
computational studies could be conducted to understand how each
disc feature influence, or govern, the flow dynamics surrounding the
disc. Understanding gained from this type of fundamental study on
flow dynamics could help identify better disc geometries (not studied
in this thesis) that could have superior flying qualities.

References
154
References
Abbott, I. H. and Von Doenhoff, A.E., 1959. Theory of Wing Sections: including a
summary of airfoil data, Dover Publications.
Achenbach, E., 1971. Influence of surface roughness on the cross-flow around a
circular cylinder. Journal of Fluid Mechanics, 46 (02), p. 321.
Achenbach, E., 1972. Experiments on the flow past spheres at very high Reynolds
numbers. Journal of Fluid Mechanics, 54 (03), p. 565.
Achenbach, E., 1974. The effects of surface roughness and tunnel blockage on the
flow past spheres. Journal of Fluid Mechanics, 65 (01), p. 113.
Alaways, L.W. and Hubbard, M, 2001. Experimental determination of baseball spin
and lift. Journal of Sports Sciences, 19 (5), pp. 349-58.
Anderson JR, J.D., 2007. Fundamentals of Aerodynamics, McGraw-Hill.
Ashley, H. and Landahl, M., 1985. Aerodynamics of Wings and Bodies, Dover
Publications.
Barlow, J.B., Rae, W.H. and Pope, A., 1999. Low-speed wind tunnel testing, John
Wiley & Sons.
Bartlett, R.M., 1992. The biomechanics of the discus throw: a review. Journal of
Sports Sciences, 10 (5), pp. 467-510.
Bartlett, R. M., 2000. Principles of throwing. Biomechanics in Sport: Performance
Enhancement and Injury Prevention (edited by Zatsiorsky, V.M.), pp. 365-380.

References
155
Bartonietz, K., Best, R.J. and Börgstrom, A., 1995. The throwing events at the
World Championships in Athletics 1995, Göteberg – technique of the world’s best
athletes, part 2: Discus and javelin.
Bartoniez, K., 2000. Javelin Throwing: An Approach to Performance Development,
(edited by Zatsiorsky V.M. Biomechanics in Sport: Performance Enhancement and
Injury Prevention, pp. 401-434.
Bearman, P.W. and Harvey, J.K.,1976. Golf Ball Aerodynamics. Aeronautical
Quarterly, 27, pp. 112-122.
Best, R.J., Bartlett, R.M. and Sawyer, R.A., 1995. Optimal javelin release. Journal of
Applied Biomechanics, 11, pp. 371-394.
British Standards Institute, 2003. General metrology - Part 3: Guide to the
expression of uncertainty in measurement.
British Standards Institute, 2004. General metrology - Part 4: Practical guide to
measurement uncertainty.
Carre, M.J., Asai T, Akatsuka, T. and Haake, S.J., 2002. The curve kick of a football
II: flight through the air. Sports Engineering, 5 (4), pp. 193-200.
Chiu, C.-hua, 2009. Estimating the Optimal Release Conditions for World Record
Holders in Discus. International Journal of Sport and Exercise Science, 1 (1), pp. 9-
14.
Chiu, C.-hua, 2009. Discovering Optimal Release Conditions for the Javelin World
Record Holders by Using Computer Simulation. International Journal of Sport and
Exercise Science, 1 (2), pp. 41-50.
References
156
Cotroneo, P. W., June 1980. Biomechanical and Aerodynamical Aspects of the
Backhand and Sidearm Frisbee-Disc Throws for Distance. MS Thesis, California
State University.
Crowther, W.J. and Potts, J.R., 2007. Simulation of a spin-stabilised sports disc.
Sports Engineering, 10 (1), pp. 3-21.
Danowsky, B. and Cohanim, B., 2002. Analysis of a Flying Disc. Senior Project
Report No. SP-S02-006-R-BPD, Iowa State University, USA.
Davies, J.M., 1949. The Aerodynamics of Golf Balls. J. Appl. Phys., 20, pp. 821-
828.
de Mestre, N.J., Hubbard, M. and Scott, J., 1998. Optimizing the shot put. In
Proceedings of the Fourth Conference on Mathematics and Computers in Sport
(edited by de Mestre, N. and Kumar, K.), pp. 249-257.
de Mestre, N., 1990. The Mathematics of Projectiles in Sport, Cambridge Univ
Press, Cambridge.
Deutsches Bundesarchiv (German Federal Archive) [Online], Available from:
http://www.bild.bundesarchiv.de/archives/barchpic/search/_1310232113/?search[vie
w]=detail&search[focus]=1 [Accessed: 20 May 2009].
Etkin, B. and Reid, L.D., 1996. Dynamics of Flight: Stability and Control, John
Wiley & Sons.
Ferrer, R.G. and Watts, R., 1987. The Lateral Force on a Spinning Sphere:
Aerodynamics of a Curveball. American Journal of Physics, 55, pp. 40-44.
Ginter, S., 1992. Chance Vought V-173 and XF5U-1 Flying Pancakes. Naval
Fighters, 21.

References
157
Gordon, R. and Rom, J., 1985. Calculation of nonlinear subsonic characteristics of
wings with thickness and camber at high incidence. AIAA Journal, 23 (6), pp. 817-
825.
Haake, S.J., Goodwill, S.R. and Carre, M.J., 2007. A new measure of roughness for
defining the aerodynamic performance of sports balls. Proceedings of the Institution
of Mechanical Engineers, Part C: Journal of Mechanical Engineering Science, 221
(7), pp. 789-806.
Higuchi, H., Goto Y., Hiramoto, R. and Meisel, I., August 2000. Rotating Flying
Disks and Formation of Trailing Vortices. AIAA 2000-4001, 18th AIAA Applied
Aerodynamics Conference, Denver, CO, USA.
Hildebrand, F., 2001. Modelling of discus flight. In: Blackwell, J.R. (Ed.),
Proceedings of Oral Sessions, XIX International Symposium on Biomechanics in
Sports. International Society of Biomechanics in Sports, San Francisco., pp. 371-
374.
Hoerner, S., 1993. Fluid Dynamic Drag: Practical information on aerodynamic drag
and hydrodynamic resistance, Midland Park N.J.
Hubbard, M., 2000. The Flight of Sports Projectiles. Biomechanics in Sport:
Performance Enhancement and Injury Prevention (edited by Zatsiorsky, V.M.), pp.
381-400.
Hubbard, M., 2002. Optimal discus release conditions including pitching moment-
induced roll. In: Proceedings of World Congress of Biomechanics, University of
Calgary, Calgary.
Hubbard, M., 1989. The Throwing Events in Track and Field. In Biomechanics of
Sport (edited by Vaughan, C.L.) Boca Raton, Florida: CRC Press, pp. 213-38.
References
158
Hubbard, M., 1984.Optimal Javelin Trajectories. Journal of Biomechanics, 17 (10),
pp. 777-787.
Hubbard, M. and Alaways, L.W., 1989. Rapid and accurate estimation of release
conditions in the javelin throw. Journal of Biomechanics, 22 (6-7), pp. 583-95.
Hubbard, M. and Cheng, K.B., 2007. Optimal Discus Trajectories. Journal of
Biomechanics, 40, pp. 3650-3659.
Hubbard, M., de Mestre, N.J. and Scott, J., 2001. Dependence of release variables in
the shot put. Journal of Biomechanics, 34 (4), pp. 449-56.
Hubbard, M. and Hummel, S.A., 2000. Simulation of Frisbee Flight. In 5th
Conference on Mathematics and Computers in Sport. Sydney, Australia, pp. 14-16.
Hubbard, M. and Rust, H.J., 1984. Simulation of javelin flight using experimental
aerodynamic data. Journal of Biomechanics, 17 (10), pp. 769-76.
Hubbard, M. and Rust, H.J., 1984. Javelin dynamics with measured lift, drag, and
pitching moment. Transactions of the ASME, 51, pp. 406-408.
Hummel, S.A., 2003. Frisbee Flight Simulation and Throw Biomechanics. MS
Thesis, The University of California, Davis, California, USA.
Hummel, S. and Hubbard, M., July 2001. A Musculoskeletal Model for the
Backhand Frisbee Throw. In 8th International Symposium on Computer Simulation
in Biomechanics. Milan, Italy: Politecnico di Milano, Milan, Italy.
Hummel, S.A. and Hubbard, M., Sept. 2002. Identification of Frisbee Aerodynamic
Coefficients using Flight Data. In 4th International Conference on the Engineering
of Sport. Kyoto, Japan.
References
159
Hummel, S.A. and Hubbard, M., September 2004. Implications of Frisbee Dynamics
and Aerodynamics on Possible Flight Patterns. In 5th International Conference on
the Engineering of Sport. Davis, California, USA.
Hummel, S.A. and Hubbard, M., 2002. Identification of Frisbee Aerodynamic
Coefficients using Flight Data. In 4th International Conference on the Engineering
of Sport. Kyoto, Japan.
Hutchings, I., 1976. The ricochet of spheres and cylinders from the surface of water.
International Journal of Mechanical Sciences, 18, pp. 243-247.
International Association of Athletics Federation (IAAF) [Online], Available from:
http://www.iaaf.org/statistics/records/inout=O/index.html [Accessed: 14 February
2010].
James, D. and Haake, S., 2008. The spin decay of sports balls in flight (P172) 2-
Experimental Arrangements. The Engineering of Sport 7, 2, pp. 165-170.
Katz, P., 1968. The Free Flight of a Rotating Disc. Isreal J. Tech., 6 (1-2), pp. 150-
155.
Laitone, E.V., 1997. Wind tunnel tests of wings at Reynolds numbers below 70 000.
Experiments in Fluids, 23 (5), pp. 405-409.
Lanka, J., 2000. Shot Putting. Biomechanics in Sport: Performance Enhancement
and Injury Prevention (edited by Zatsiorsky V.M.), pp. 435-457.
Lazzara, S., Schweitzer, C. and Toscano, J., May 1980. Design and Testing of a
Frisbee Wind Tunnel Balance. Unpublished Report, Code: Engin 12, Brown
University, Advisor: Prof. Karlson S.K.F.

References
160
Leigh, S., Gross, M.T., Li, L. and Yu, B., May 2008. The relationship between
discus throwing performance and combinations of selected technical parameters.
Sports Biomechanics, 7 (2), pp. 173-193.
Leigh, S., Liu, H. and Hubbard, M., 2010. Individualized optimal release angles in
discus throwing. Journal of Biomechanics, 43 (3), pp. 540–545.
Leigh, S. and Yu, B., 2007. The associations of selected technical parameters with
discus throwing performance: A cross-sectional study. Sports Biomechanics, 6 (3),
pp. 269-284.
Lichtenberg, D.B. and Wills, J.G., 1978. Maximizing the range of the shot put.
American Journal of Physics, 46, pp. 546–549.
Lindenbaum, B. and Blake, W., 1998. The VZ-9 “Avrocar”.
Linthorne, N.P., 2001. Optimum release angle in the shot put. Journal of Sports
Sciences, 19 (5), pp. 359-72.
Linthorne, N., January 2006. Throwing and jumping for maximum horizontal range.
Arxiv: physics/0601148v1, pp. 1-6.
Linthorne, N.P. and Everett, D.J., 2006. Release angle for attaining maximum
distance in the soccer throw-in. Sports biomechanics / International Society of
Biomechanics in Sports, 5(2), pp. 243-60.
Lissaman, P.B.S., 1994. Stability and Dynamics of a Spinning Oblate Spheriod.
Unpublished Document. The University of Southern California.
Lissaman, P.B.S., 1996. The Meaning of Lift. AIAA 96-0161, In 34th Aerospace
Sciences Meeting & Exhibit. Reno, Nevada.

References
161
Lissaman, P.B.S., Dec. 1998. Disc Flight Dynamics. Unpublished Document. The
University of Southern California.
Lissaman, P.B.S., Jan. 1999. Disc Flight Description. Unpublished Document. The
University of Southern California.
Lissaman, P.B.S., Jan. 2001. Range of a Free Disc.Unpublished Document. The
University of Southern California.
Lissaman, P.B.S., Dec. 2003. Physics of the Far Flung Frisbee. Unpublished
Document. The University of Southern California.
Lissaman, P.B.S., Dec. 2003. Upper Bounds on Range of a Free Disc. Unpublished
Document. The University of Southern California.
Lorenz, R.D., 2005. Flight and attitude dynamics measurements of an instrumented
Frisbee. Measurement Science and Technology, 16 (3), pp. 738-748.
Lorenz, R., 2006. Spinning Flight: Dynamics of Frisbees, Boomerangs, Samaras,
and Skipping Stones. Springer.
Maccoll, J., 1928. Aerodynamics of a spinning sphere. J. R. Aeronaut. Soc., 32, pp.
777-798.
Maheras, A.V., 1995. The relationship between the angle of release and the velocity
of release in the shot-put, and the application of a theoretical model to estimate the
optimum angle of release (throwing). Ph.D Thesis, University of Kansas.
McCoy, M.W., Gregor, R.J., Whiting, W.C., Rich, R.C. and Ward, P.E., 1984.
Kinematic analysis of elite shot putters. Track Technique, 90, pp. 2868-2870.
References
162
Mehta, R. D, 1985. Aerodynamics of Sports Balls. Annual Review of Fluid
Mechanics, 17 (1), pp. 151-189.
Mehta, R.D. and Pallis, J.M., 2001. Sports ball aerodynamics: Effects of velocity,
spin and surface roughness. Materials and Science in Sports, 7514 (724), pp. 185–
197.
Mero, A., Komi, P.V., Korjus, T., Navarro, E. and Gregor, R.J., 1994. Body segment
contributions to javelin throwing during final thrust phases. J. Appl. Biomech., 10,
pp. 166-177.
Mitchell, T.L., 1999. The Aerodynamic Response of Airborne Discs. MS Thesis,
The University of Nevada, Las Vegas, NV, USA.
Morriss, C. and Bartlett, R., Biomechanical factors critical for performance in the
menʼs javelin throw. Sports Medicine, 21 (6), pp. 438-446
Nakamura, Y. and Fukamachi, N., 1991. Visualization of the flow past a Frisbee.
Fluid Dynamics Research, 7 (1), pp. 31-35.
Nathan, A.M., 2008. The effect of spin on the flight of a baseball. American Journal
of Physics, 76 (2), p. 119.
Passmore, M.A., Tuplin, S. Spencer, A. and Jones, R., 2008. Experimental studies of
the aerodynamics of spinning and stationary footballs. Proceedings of the Institution
of Mechanical Engineers, Part C: Journal of Mechanical Engineering Science, 222
(2), pp. 195-205.
Pelletier, A. and Mueller, T.J., 2000. Low Reynolds Number Aerodynamics of Low-
Aspect-Ratio, Thin/Flat/Cambered-Plate Wings. Journal of Aircraft, 37 (5), pp. 825-
832.
References
163
Podesta, M.D., 2007. Bouncing steel balls on water. Physics Education, 42 (5), pp.
466-477.
Potts, J. R., 2005. Disc-wing Aerodynamics. PhD Thesis, The University of
Manchester.
Potts, J.R. and Crowther, W.J., April 2000(a). The Flow Over a Rotating Disc-wing.
In RAeS Aerodynamics Research Conference. London, UK.
Potts, J. R. and Crowther, W. J., August 2000(b). Visualisation of the Flow Over a
Disc-wing.In Proc. of the Ninth International Symposium on Flow Visualization,
Edinburgh, Scotland, UK. pp. 1-10.
Potts, J.R. and Crowther, W.J., Jan. 2001(a). Flight control of a spin stabilised axi-
symmetric disc-wing. In 39th AIAA Aerospace Sciences Meeting & Exhibit. Reno,
Nevada.
Potts, J.R. and Crowther, W.J., April 2001(b). Application of Flow Control to a
Disc-wing UAV. In 16th UAV Systems Conference, Bristol. UK.
Potts, J.R. and Crowther, W.J., June 2002(a). A Feasibility Study in Aerodynamics
& Control. In CEAS Aerospace Aerodynamics Research Conference. Cambridge,
UK.
Potts, J.R. and Crowther, W.J., June 2002(b). Frisbee Aerodynamics. In 20th AIAA
Applied Aerodynamics Conference & Exhibit. St. Louis, Missouri, USA.
Potts, J.R. and Crowther, W.J., Jan. 2003. Aerodynamics and Control of a Spin-
stabilised Disc-wing. In CEAS Aerospace Aerodynamics Conference Highlights
(Invited), 41st AIAA Aero. Sciences Meeting & Exhibit. Reno, Nevada, USA.
References
164
Pozzy, T., Winter 2002. Getting More Distance - How The Pros Do It, Disc Golf
World News, No. 60.
Professional Disc Golf Association (PDGA) [Online], Available from:
http://www.pdga.com/introduction?s=f702ca43c853a4e73c76534b97cb254e>
[Accessed: 6 Jun 2009].
Red, W.E. and Zogaib, A.J., 1977. Javelin dynamics including body interaction.
Journal of Applied Mechanics, 44, pp. 496-498.
Rohde, A., 2000. A Computational Study of Flow around a Rotating Disc in Flight,
PhD Thesis, Florida Institute of Technology.
Smits A.J., and Smith, D.R., 1994. A New Aerodynamic Model of a Golf Ball in
Flight. Science and Golf II: In Proceedings of the World scientific congress of golf
(edited by Cochran, A. J. and Farrally, M.R.), pp. 340-346.
Soodak, H., 2004. Geometric top theory of football, discus, javelin. In: Hubbard, M.,
Mehta, R.D., Pallis, J.M. (Eds.) Engineering of Sport 5: Proceedings of the 5th
International Conference on the Engineering of Sport, Davis, CA, vol. 1. September.
ISEA, Sheffield, UK. , pp. 365-371.
Soong, T.C., 1976. The Dynamics of the Discus Throw, J. Appl. Mech, 98, pp. 531-
536.
Stilley, G.D. and Carstens, D.L., 1972. Adaptation of Frisbee Flight Principle to
Delivery of Special Ordinance. AIAA Paper No.72-982.
Watts, R. and Ferrer, R.G., 1987. The Lateral Force on a Spinning Sphere:
Aerodynamics of a Curveball. American Journal of Physics, 55, pp. 40-44.
Wesson, J., 2009. The Science of Golf, Oxford University Press.

References
165
Wesson, J., 2002. The Science of Soccer, Institute of Physics Publishing.
Young, M., 2000. Preparing for the Specific Neuromuscular and Biomechanical
Demands of the Javelin Throw. Human Performance Consulting.
Zatsiorsky, V.M., 1995. Science and Practice of Strength Training (1st ed.),
Champaign, IL: Human Kinetics.
Zimmerman, C.H., August 1935. Aerodynamic Characteristics of Several Airfoils of
Low Aspect Ratio. NACA Langley Memorial Aeronautical Laboratory, NACA-TN-
539.
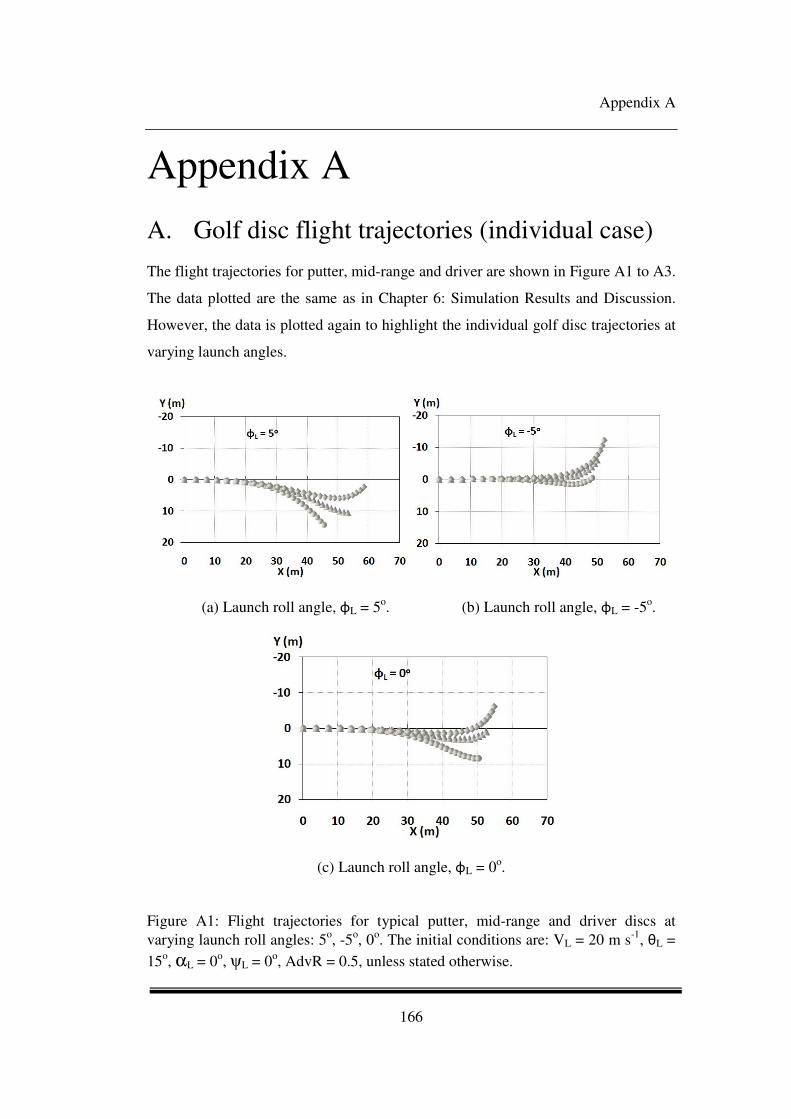
Appendix A
166
Appendix A
A. Golf disc flight trajectories (individual case)
The flight trajectories for putter, mid-range and driver are shown in Figure A1 to A3.
The data plotted are the same as in Chapter 6: Simulation Results and Discussion.
However, the data is plotted again to highlight the individual golf disc trajectories at
varying launch angles.
(a) Launch roll angle, φL = 5o. (b) Launch roll angle, φL = -5
o.
(c) Launch roll angle, φL = 0o.
Figure A1: Flight trajectories for typical putter, mid-range and driver discs at
varying launch roll angles: 5o, -5
o, 0
o. The initial conditions are: VL = 20 m s
-1, θL =
15o, αL = 0
o, ψL = 0
o, AdvR = 0.5, unless stated otherwise.
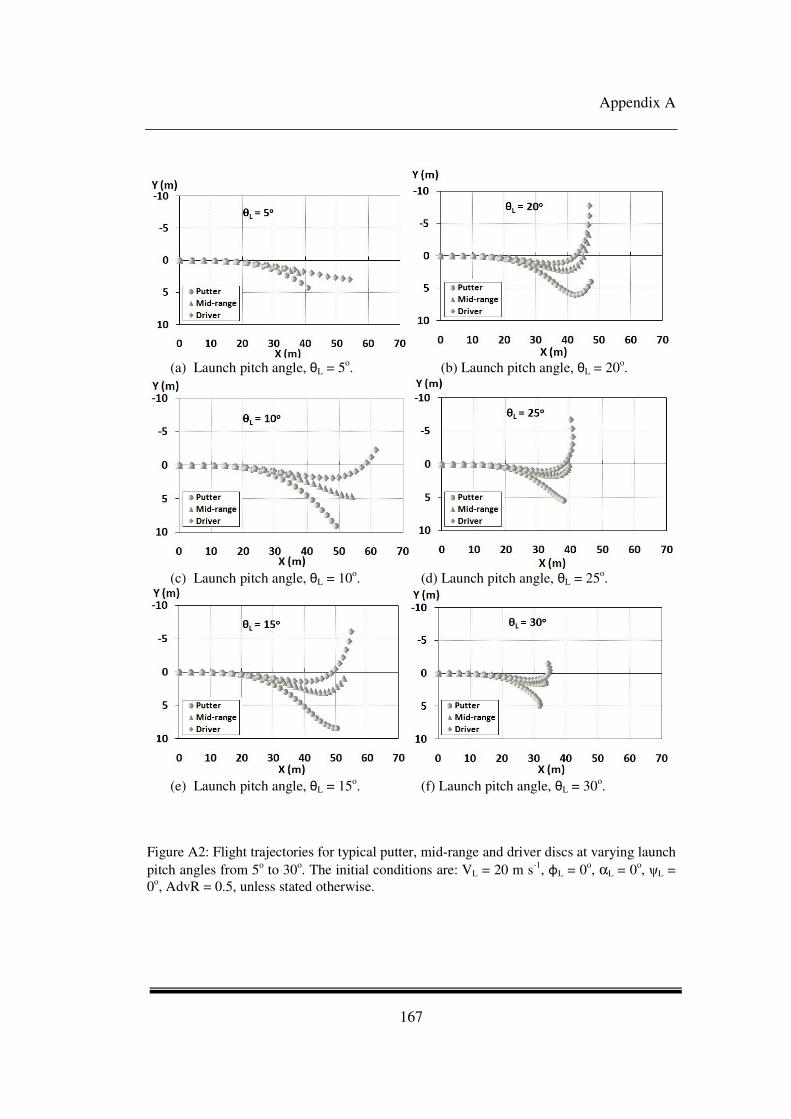
Appendix A
167
(a) Launch pitch angle, θL = 5
o. (b) Launch pitch angle, θL = 20
o.
(c) Launch pitch angle, θL = 10
o. (d) Launch pitch angle, θL = 25
o.
(e) Launch pitch angle, θL = 15
o. (f) Launch pitch angle, θL = 30
o.
Figure A2: Flight trajectories for typical putter, mid-range and driver discs at varying launch
pitch angles from 5o to 30
o. The initial conditions are: VL = 20 m s
-1, φL = 0
o, αL = 0
o, ψL =
0o, AdvR = 0.5, unless stated otherwise.

Appendix A
168
(a) Launch roll angle, φL = 30
o. (b) Launch roll angle, φL = -30
o.
(c) Launch roll angle, φL = 20o. (d) Launch roll angle, φL = -20
o.
(e) Launch roll angle, φL = 10o. (f) Launch roll angle, φL = -10
o.
Figure A3: Flight trajectories for typical putter, mid-range and driver discs at varying launch
roll angles: 30o, -30
o, 20
o, -20
o, 10
o, -10
o. The initial conditions are: VL = 20 m s
-1, θL = 15
o,
αL = 0o, ψL = 0
o, AdvR = 0.5, unless stated otherwise.