dynamical evaluation of model suitability for a retrospective analysis of ozone formation
DESCRIPTION
Dynamical Evaluation of Model Suitability for a Retrospective Analysis of Ozone Formation. Douw Steyn 1 , Bruce Ainslie 1,2 , Christian Reuten 1,3 , Peter Jackson 4 - PowerPoint PPT PresentationTRANSCRIPT
www.rwdi.com
• Slide transitions: Fade through Black is our standard. Never use dissolve to stop the spread of this problematic transition. • To copy slides from one file to this file, copy slides from the other file in the slide sorter view, paste into this file in slide sorter view, select all slides in slide view and
Home>reset all slides to update to the new template• Regarding dates, have a look at Insert>date • If something is to appear on every slide, view slide master and modify the top most template in left pane• To turn off the black last slide, click the office button (top left), PowerPoint Options (bottom), Advanced, Slide Show, End with black slide
Dynamical Evaluation of Model Suitability for a Retrospective Analysis of Ozone Formation
Douw Steyn1, Bruce Ainslie1,2,Christian Reuten1,3, Peter Jackson4
1 Department of Earth, Ocean and Atmospheric Sciences, The University of British Columbia, Vancouver, BC, Canada.
2 MSC, Environment Canada, Vancouver, BC, Canada.3 RWDI AIR Inc., Calgary, AB, Canada.4 Natural Resources & Environmental Studies Institute, University of Northern British Columbia, Prince George, BC, Canada.
2
Agenda
• Setting the stage
• How we evaluated the modeling system (and why we did it that way)
• Some results
3
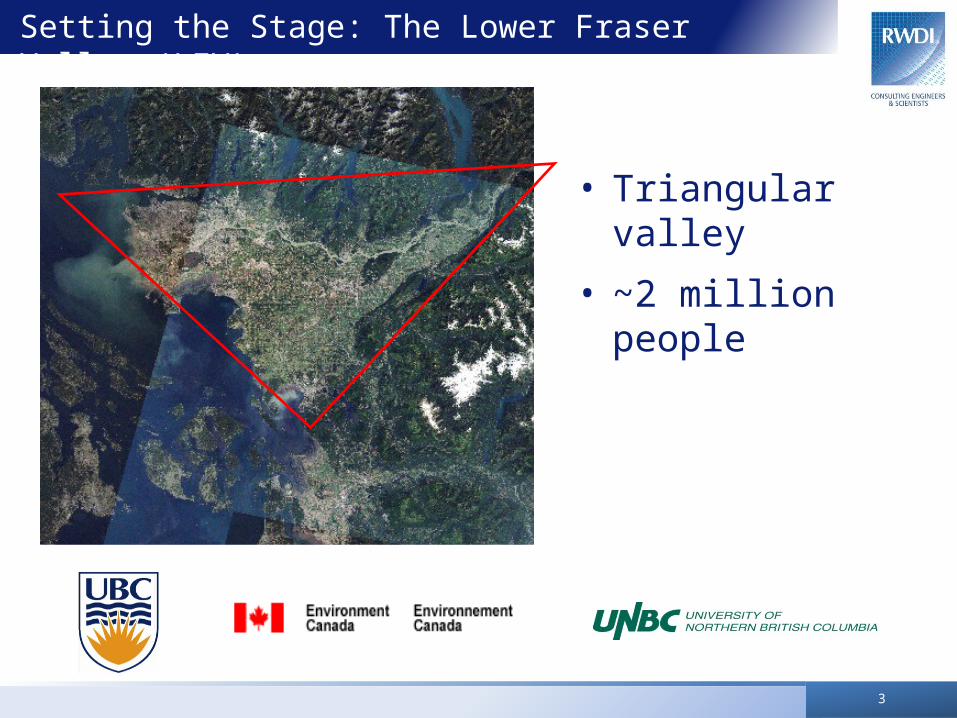
Setting the Stage: The Lower Fraser Valley (LFV)
• Triangular valley
• ~2 million people
4
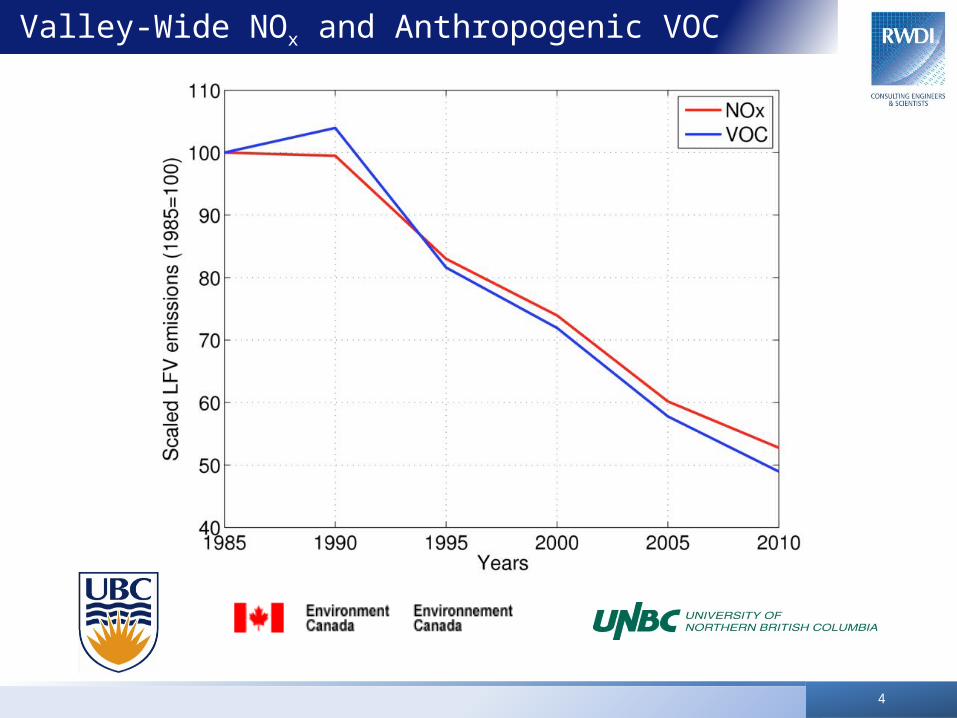
Valley-Wide NOx and Anthropogenic VOC Emissions
5
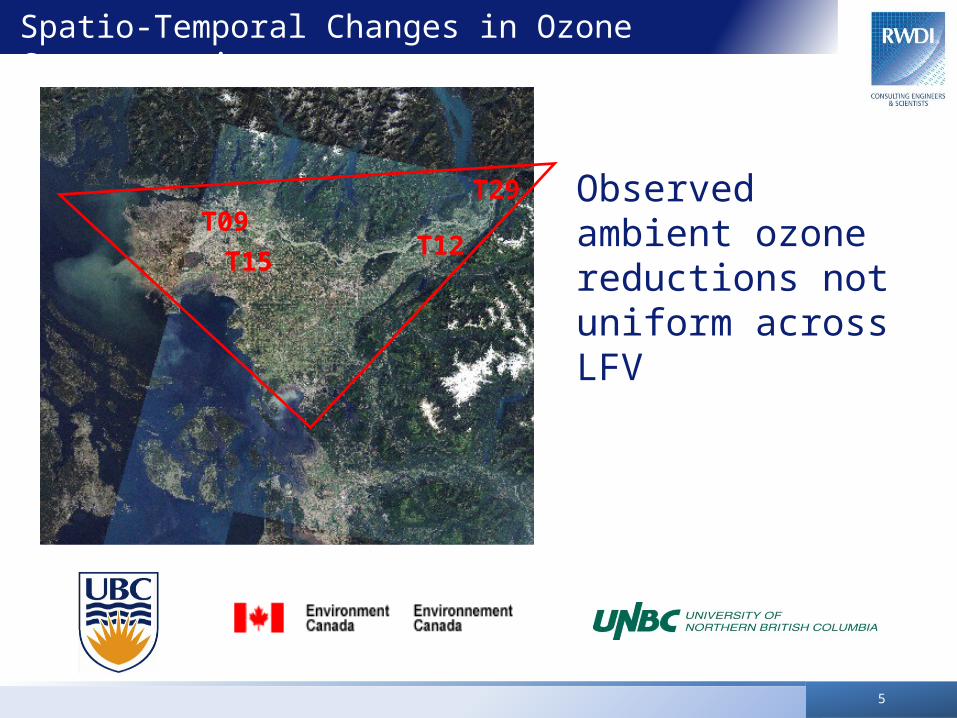
Spatio-Temporal Changes in Ozone Concentrations
Observed ambient ozone reductions not uniform across LFV
T09
T15T12
T29
6
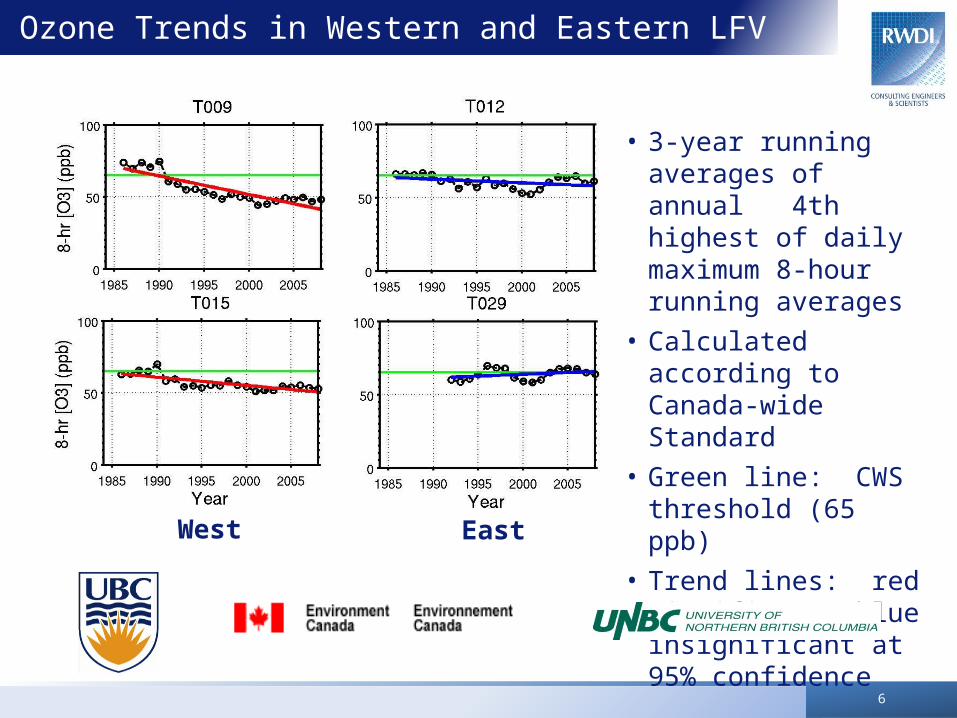
Ozone Trends in Western and Eastern LFV
• 3-year running averages of annual 4th highest of daily maximum 8-hour running averages
• Calculated according to Canada-wide Standard
• Green line: CWS threshold (65 ppb)
• Trend lines: red significant, blue insignificant at 95% confidence
West East
7
Unintended Full-Scale Experiment
• Background ozone and precursors generally from North Pacific and quite low.
• Documented small increase in background ozone.
• Little or no impact from precursor emissions upwind of LFV during ozone episodes.
• Shift in the population patterns over last 25 years.
• No noticeable change in meteorology.→ Ozone formation in LFV almost entirely caused by local
emissions.→ Observed change in behaviour of ozone formation must
arise from reductions in precursor emissions.
8
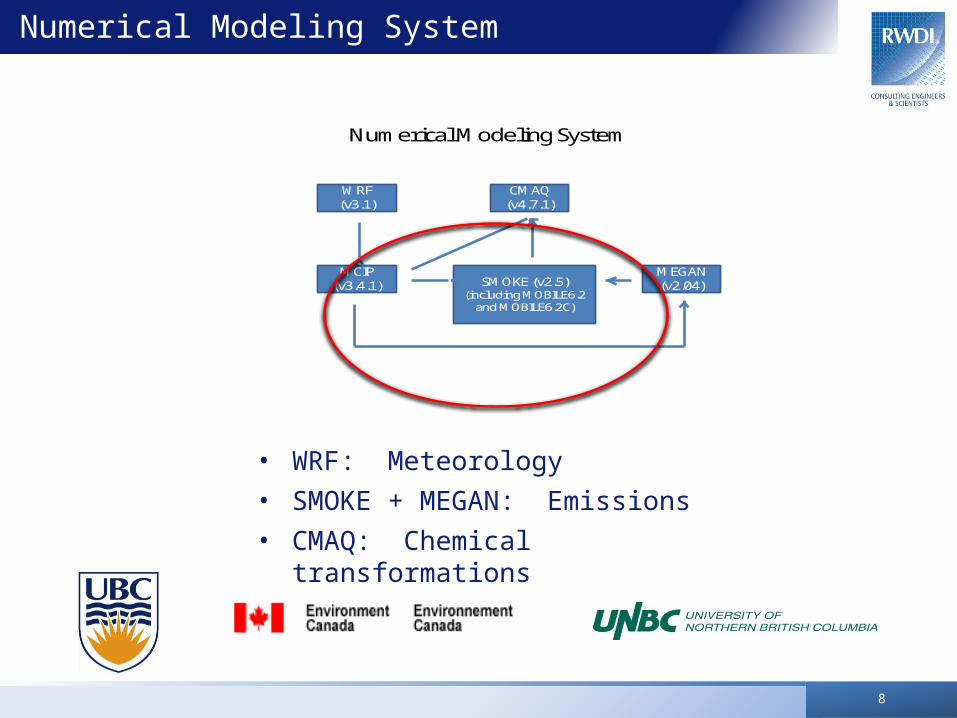
Numerical Modeling System
• WRF: Meteorology
• SMOKE + MEGAN: Emissions
• CMAQ: Chemical transformations
WRF (v3.1)
MCIP (v3.4.1)
CMAQ (v4.7.1)
SMOKE (v2.5)(including MOBILE6.2
and MOBILE6.2C)
MEGAN (v2.04)
Numerical Modeling System
9
Agenda
• Setting the stage
• How we evaluated the modeling system (and why we did it that way)
• Some results
10
How We Evaluated the Modeling System
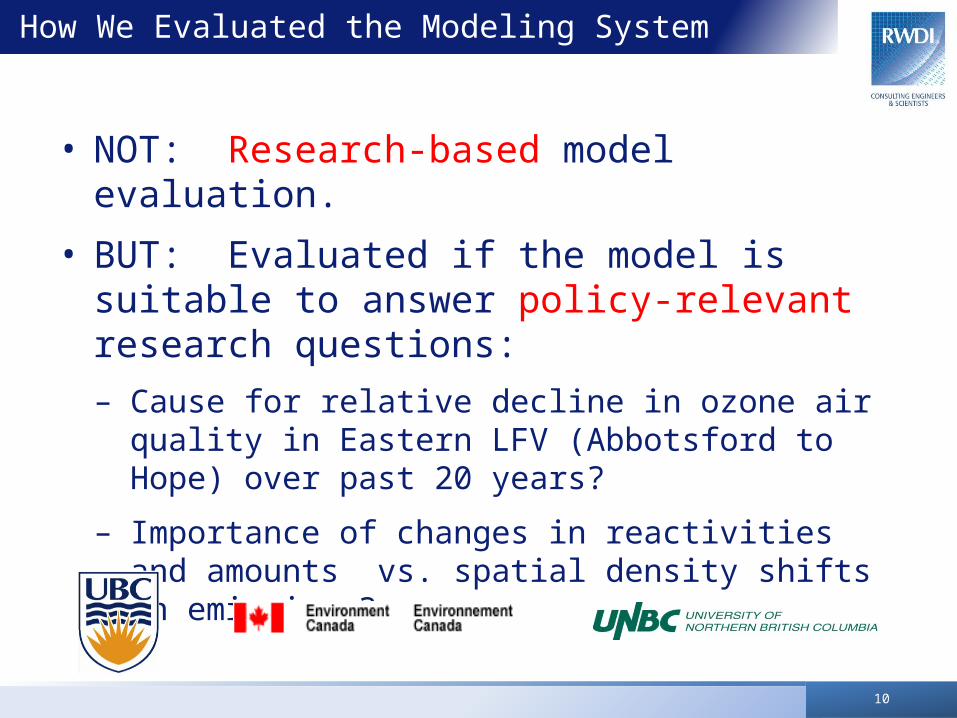
• NOT: Research-based model evaluation.
• BUT: Evaluated if the model is suitable to answer policy-relevant research questions:
– Cause for relative decline in ozone air quality in Eastern LFV (Abbotsford to Hope) over past 20 years?
– Importance of changes in reactivities and amounts vs. spatial density shifts in emissions?
11
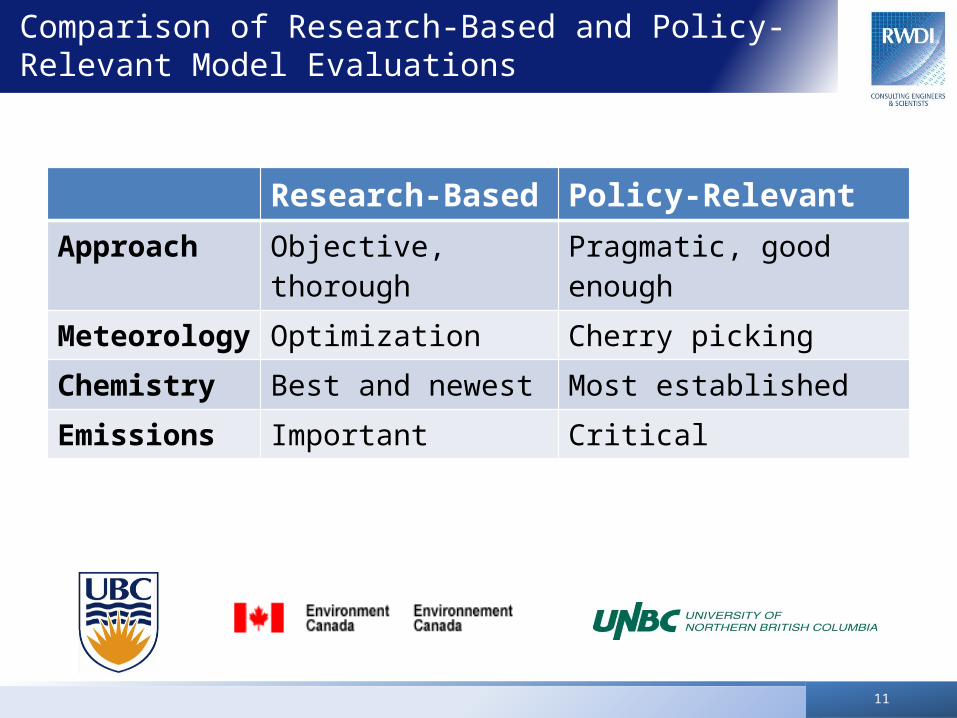
Comparison of Research-Based and Policy-Relevant Model Evaluations
Research-Based Policy-Relevant
Approach Objective, thorough Pragmatic, good enough
Meteorology Optimization Cherry picking
Chemistry Best and newest Most established
Emissions Important Critical
12
Criteria for Choosing Ozone Events
• Span period of greatest emission change.
• Include all meteorology typical of ozone events.
• Coincide as much as possible with previous research.
Started off with 7 events.
13
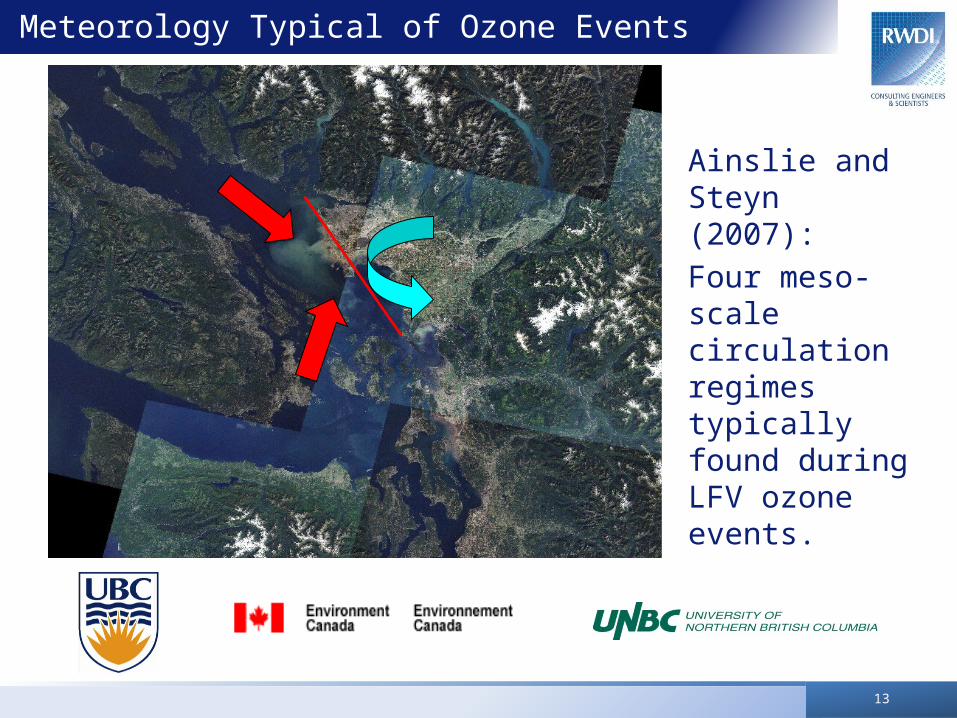
Meteorology Typical of Ozone Events
Ainslie and Steyn (2007):
Four meso-scale circulation regimes typically found during LFV ozone events.
14
Agenda
• Setting the stage
• How we evaluated the modeling system (and why we did it that way)
• Some results
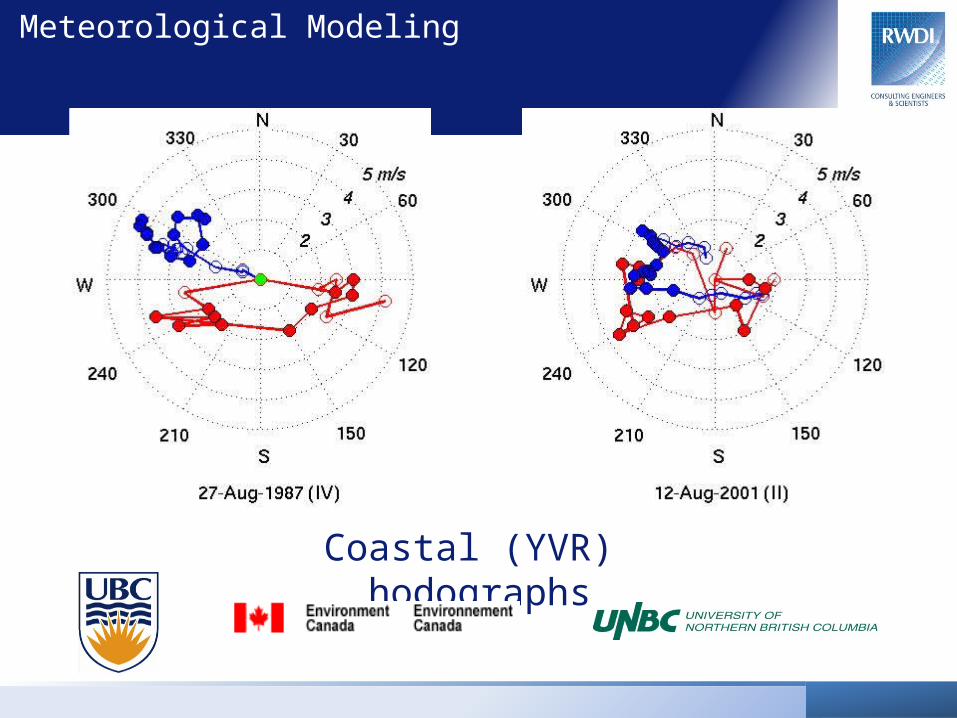
Meteorological Modeling
Coastal (YVR) hodographs
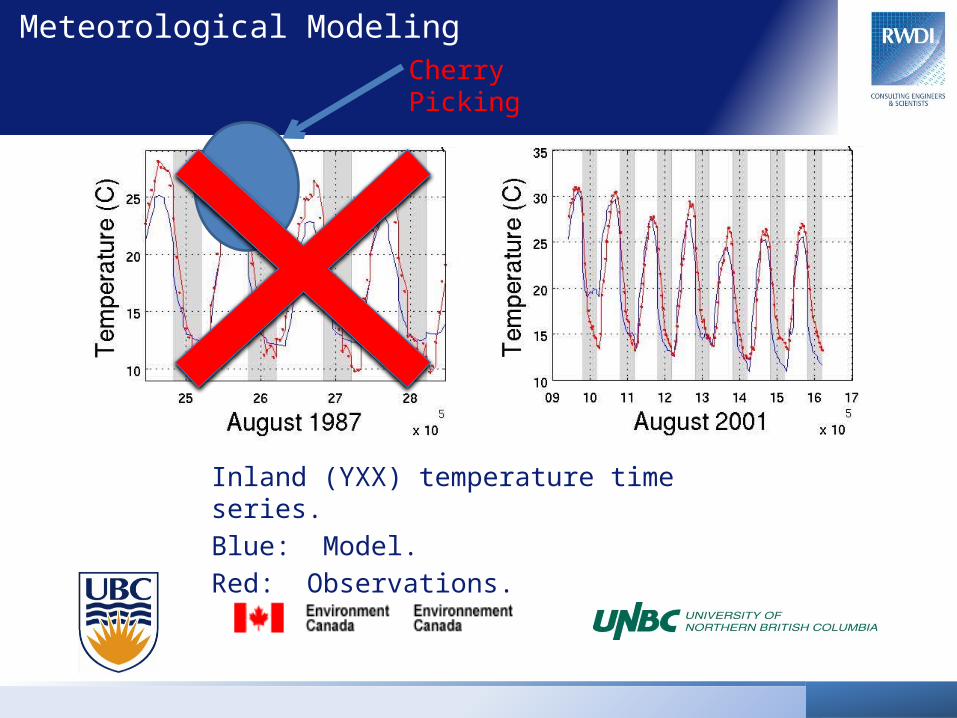
Meteorological Modeling
Inland (YXX) temperature time series.
Blue: Model.
Red: Observations.
Cherry Picking
17
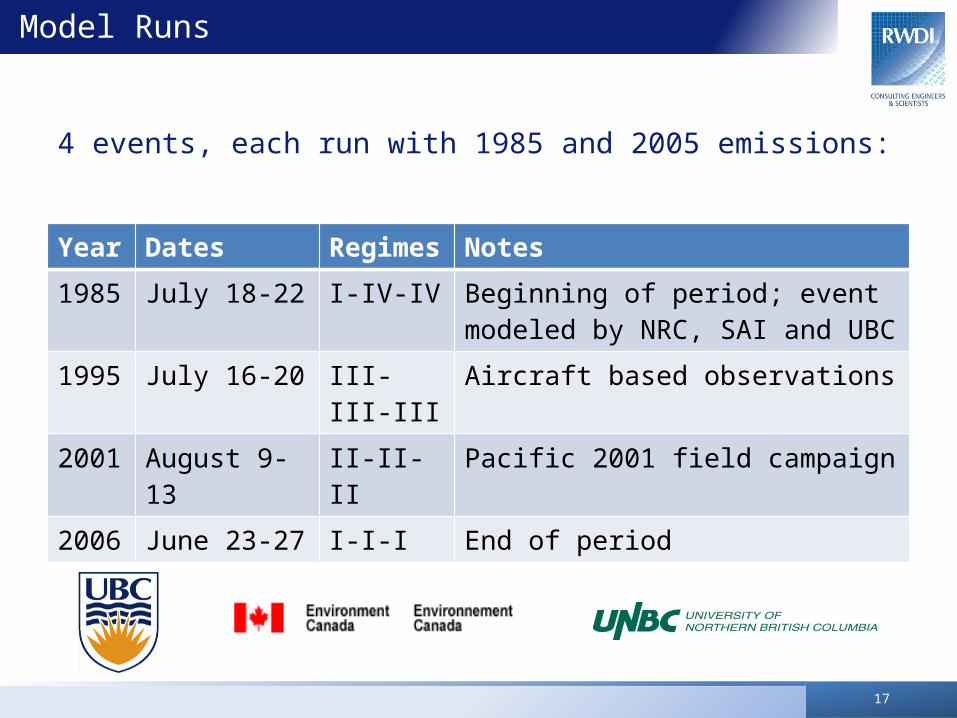
Model Runs
Year Dates Regimes Notes
1985 July 18-22 I-IV-IV Beginning of period; event modeled by NRC, SAI and UBC
1995 July 16-20 III-III-III Aircraft based observations
2001 August 9-13 II-II-II Pacific 2001 field campaign
2006 June 23-27 I-I-I End of period
4 events, each run with 1985 and 2005 emissions:
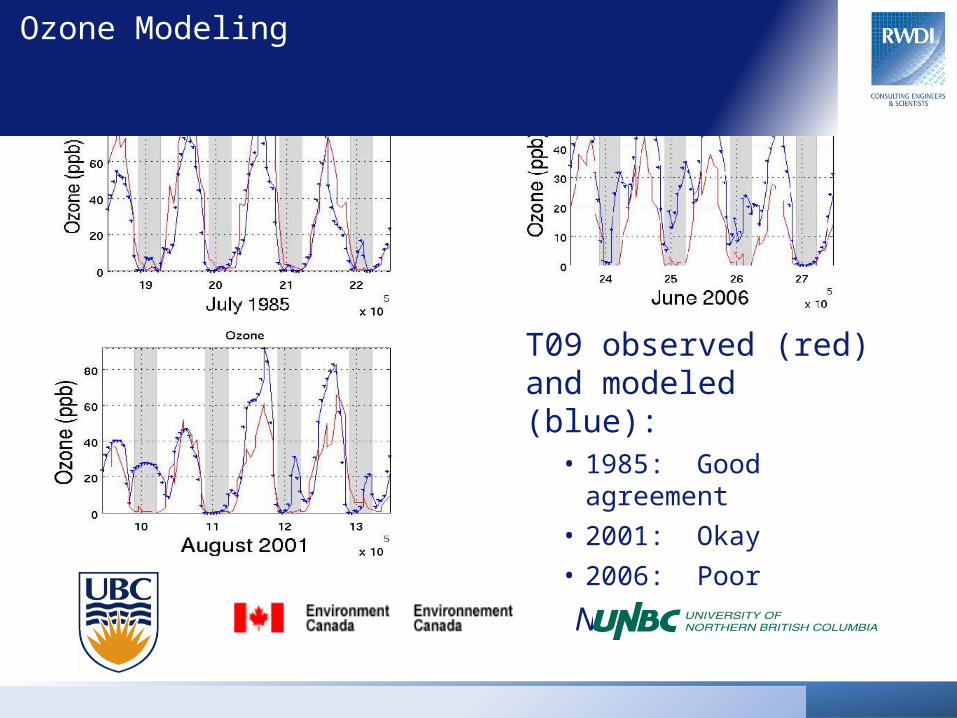
T09 observed (red) and modeled (blue):
• 1985: Good agreement
• 2001: Okay
• 2006: Poor
No cherry picking!
Ozone Modeling
19
Emissions Modeling
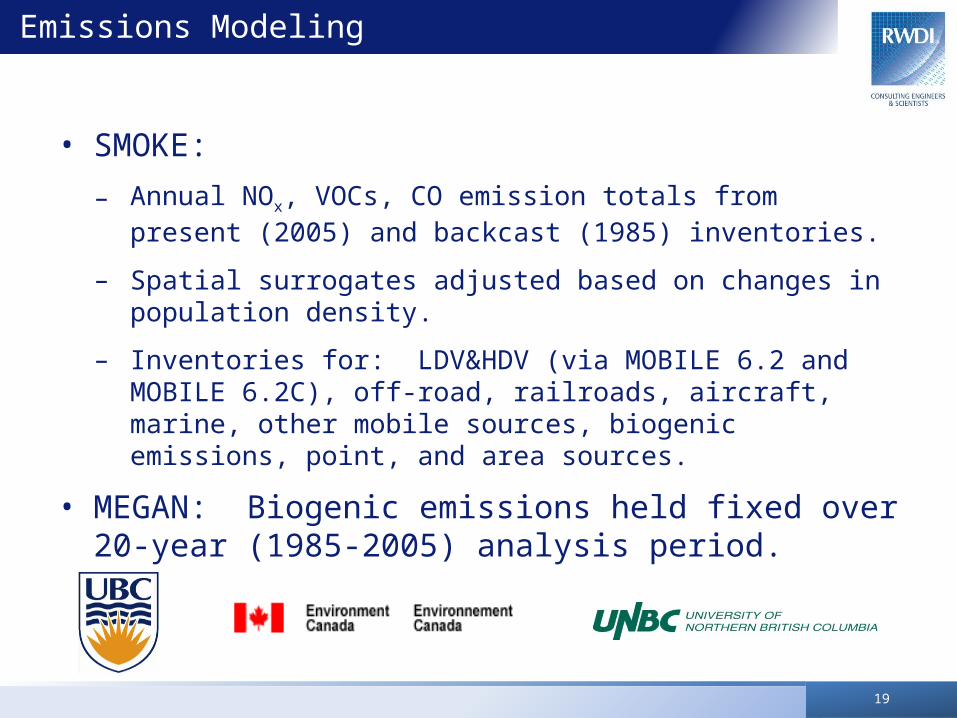
• SMOKE:
– Annual NOx, VOCs, CO emission totals from present (2005) and backcast (1985) inventories.
– Spatial surrogates adjusted based on changes in population density.
– Inventories for: LDV&HDV (via MOBILE 6.2 and MOBILE 6.2C), off-road, railroads, aircraft, marine, other mobile sources, biogenic emissions, point, and area sources.
• MEGAN: Biogenic emissions held fixed over 20-year (1985-2005) analysis period.
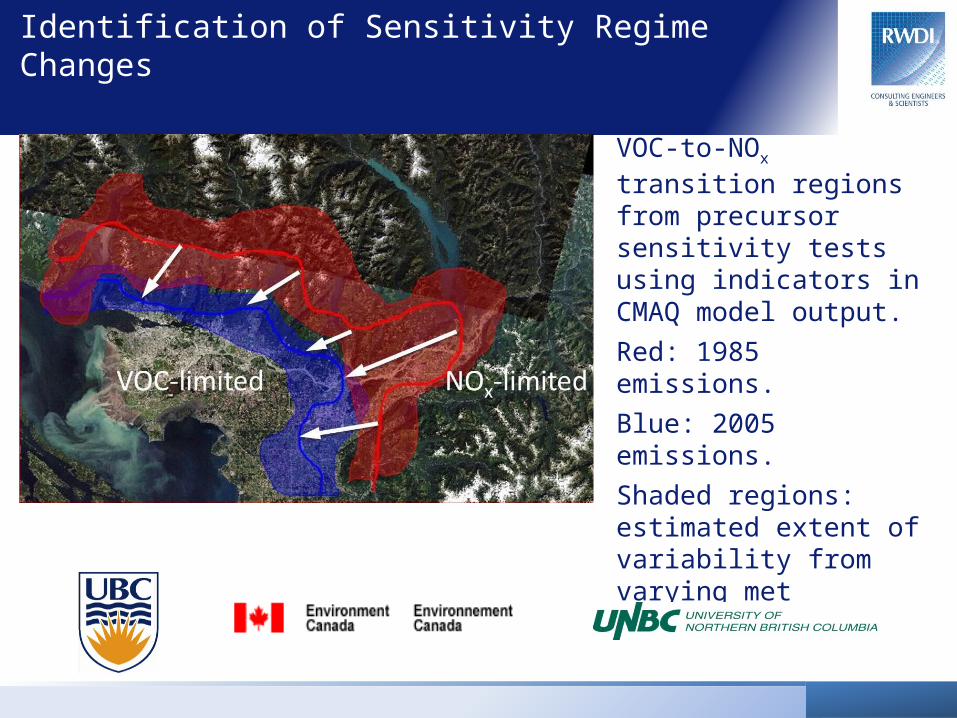
Identification of Sensitivity Regime Changes
VOC-to-NOx transition regions from precursor sensitivity tests using indicators in CMAQ model output.
Red: 1985 emissions.
Blue: 2005 emissions.
Shaded regions: estimated extent of variability from varying met conditions.
21
Policy-Relevant Findings
VOC emission reductions:
• effective in reducing ozone in western LFV;
• partly offset by NOx emissions reductions;
• likely little effect in eastern LFV.
22
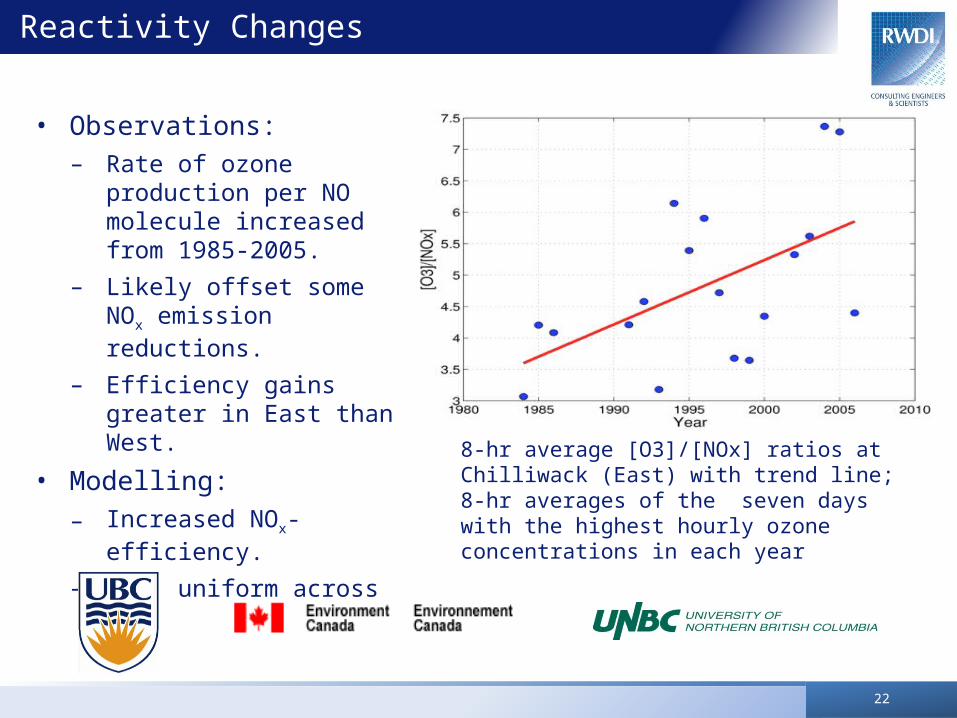
Reactivity Changes
• Observations:– Rate of ozone production
per NO molecule increased from 1985-2005.
– Likely offset some NOx emission reductions.
– Efficiency gains greater in East than West.
• Modelling:
– Increased NOx-efficiency.
– But: uniform across LFV.8-hr average [O3]/[NOx] ratios at Chilliwack (East) with trend line; 8-hr averages of the seven days with the highest hourly ozone concentrations in each year
23
Additional Evaluations
• Temperature
• NOx fields
• VOC spot measurements
• Previous modeling exercises
• Field campaign data
24
Model Caveats
• City of Vancouver (West):– Ozone consistently over-predicted.
– Daytime NOx consistently under-predicted.
• Eastern-most LFV: Ozone under-predicted.→ Consistent with a deficiency in NOx emissions.
• Slightly changing ozone bias over time.→ Uncertainties in the emissions backcasting.
25
Conclusions of Model Evaluation
• Model responsive to changes in emissions from 1985-2005.
• Magnitude of the response comparable to observed changes in LFV ozone plume.
• Model results generally as good or better than previous modeling efforts.
→ Modeling system is suitable for analyzing mechanisms linking spatio-temporal shifts in LFV emissions to observed spatio-temporal shifts in LFV ozone plume.
26
Acknowledgements
• Metro Vancouver (AQ data, support to BC Clean Air Research Fund)
• Fraser Basin Council and Fraser Valley Regional District (support to BC Clean Air Research Fund)
• NSERC (grants to D. Steyn and P. Jackson)
27
References
• Steyn D G, Ainslie B, Reuten C, Jackson P L, 2012: A retrospective analysis of ozone formation in the Lower Fraser Valley, British Columbia, Canada. Part I: Dynamical Model Evaluation. Atmosphere-Ocean, 51, 153-169.
• Ainslie B, Steyn D G, Reuten C, Jackson P L, 2012: A retrospective analysis of ozone formation in the Lower Fraser Valley, British Columbia, Canada. Part II: Influence of emissions reductions on ozone formation. Atmosphere-Ocean, 51, 170-186.
• Reuten C, Ainslie B, Steyn D G, Jackson P L, and McKendry I, 2011: Impact of climate change on ozone pollution in the Lower Fraser Valley, Canada. Atmosphere-Ocean, 50, 42-53.
• Ainslie B and Steyn D G, 2007: Spatiotemporal trends in episodic ozone pollution in the Lower Fraser Valley, British Columbia, in relation to mesoscale atmospheric circulation patterns and emissions. Journal of Applied Meteorology and Climatology, 46, 1631-1644.