dynamic levels sundram fasteners ltd€¦ · sundram fasteners limited is the principal supplier of...
TRANSCRIPT
Page 2 Source: Company, www.dynamiclevels.com
Sundram Fastners
A Fasted Growing Auto Component Company
Company Overview and Stock price ……………………………………….……3
Product Overview……………………………………………………………….….…..4
Industry Outlook……………………………………………………………………….6
Company Financial….……………….…………….……………………….….…….8
Balance Sheet…………………………………………..………….………….….…….9
Cash Flow.…………..………………………………..…………….………………..…10
Ratios……………..………………………………..…………….………………...….…10
Peer Comparison…………….…………………………………………….……..…..11
Shareholding Pattern…………………………………………..……………....…. 14
Investment Rationale………………………………………...………….......…....14
Disclaimer…………………………………………………………………………….…15

Page 3 Source: Company, www.dynamiclevels.com
Company’s Overview and Stock Price
Sundram Fasteners Limited has a global manufacturing
presence that spans India, China, United Kingdom, Malaysia and Germany.
Its product range includes
High tensile fasteners Cold extruded parts
Powder metal parts Iron powder Radiator caps
Gear shifters Hot forged parts
Precision forged differential gears Water pumps
Oil pumps Fuel pumps Belt tensioners
Rocker arm assemblies Cam followers
Bearing housings Hubs and shafts Tappets & other engine components
Valve train parts
EXCHANGE
SYMBOL
SUNDRMFAST (NSE)
Sector AUTO-AUTO ANCL
AND COMPONENTS
Current Price * (Rs.) 159.05
Face Value (Rs.) 1
52 Week High (Rs.) 329.00 (16-Sep-16)
52 Week Low (Rs.) 135.00 (29-Feb-16)
Life Time high (Rs.) 329.00 (16-Sep-16)
Life Time low (Rs.) 7.25 (26-Jul-01)
Average Daily
Movement
12.25
Average Volume 300052
1 Month Return (%) -0.42
PE Ratio 49.80
Book Value 44.26
Market Cap 6124.19 (Cr)
% of Promoter
pledged
0
Page 4 Source: Company, www.dynamiclevels.com
Product overview
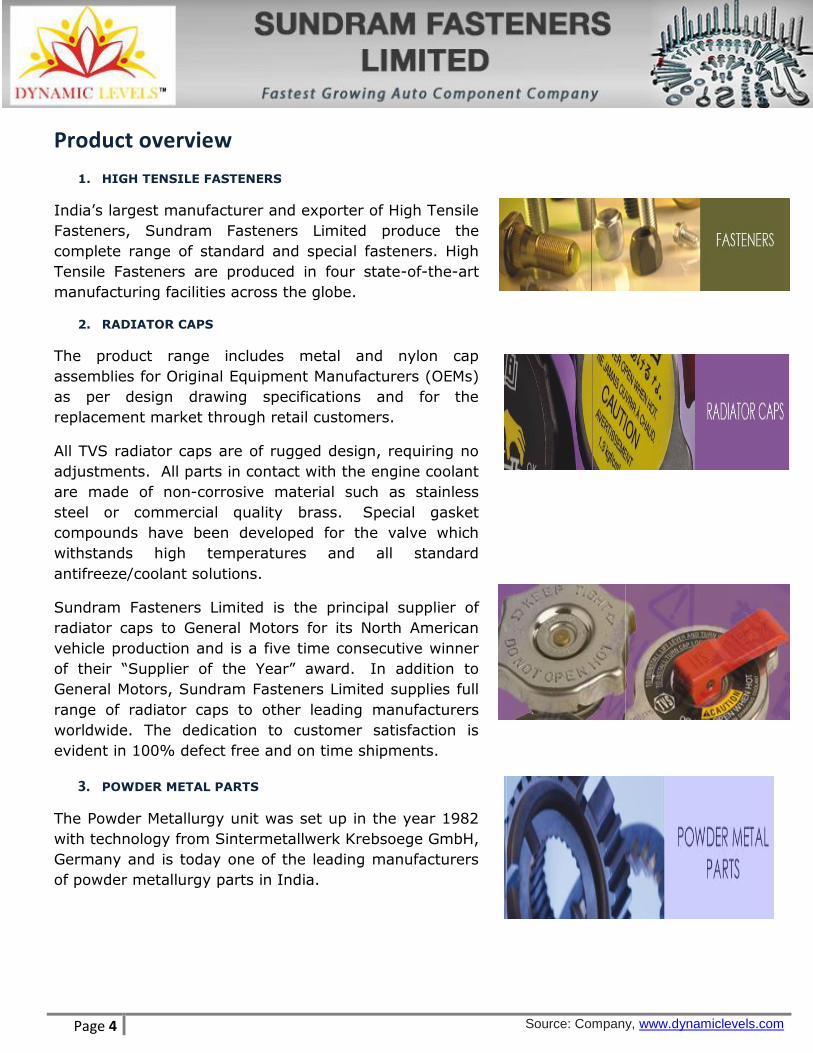
1. HIGH TENSILE FASTENERS
India‟s largest manufacturer and exporter of High Tensile
Fasteners, Sundram Fasteners Limited produce the
complete range of standard and special fasteners. High
Tensile Fasteners are produced in four state-of-the-art
manufacturing facilities across the globe.
2. RADIATOR CAPS
The product range includes metal and nylon cap
assemblies for Original Equipment Manufacturers (OEMs)
as per design drawing specifications and for the
replacement market through retail customers.
All TVS radiator caps are of rugged design, requiring no
adjustments. All parts in contact with the engine coolant
are made of non-corrosive material such as stainless
steel or commercial quality brass. Special gasket
compounds have been developed for the valve which
withstands high temperatures and all standard
antifreeze/coolant solutions.
Sundram Fasteners Limited is the principal supplier of
radiator caps to General Motors for its North American
vehicle production and is a five time consecutive winner
of their “Supplier of the Year” award. In addition to
General Motors, Sundram Fasteners Limited supplies full
range of radiator caps to other leading manufacturers
worldwide. The dedication to customer satisfaction is
evident in 100% defect free and on time shipments.
3. POWDER METAL PARTS
The Powder Metallurgy unit was set up in the year 1982
with technology from Sintermetallwerk Krebsoege GmbH,
Germany and is today one of the leading manufacturers
of powder metallurgy parts in India.
Page 5 Source: Company, www.dynamiclevels.com
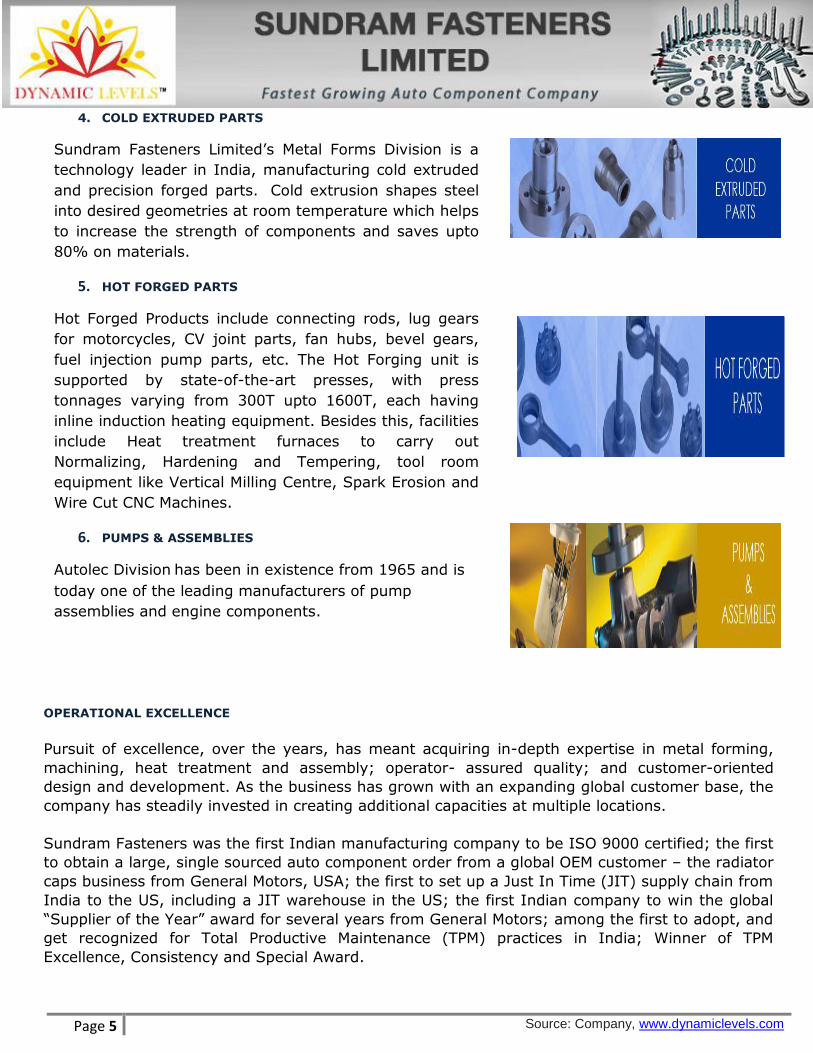
4. COLD EXTRUDED PARTS
Sundram Fasteners Limited‟s Metal Forms Division is a
technology leader in India, manufacturing cold extruded
and precision forged parts. Cold extrusion shapes steel
into desired geometries at room temperature which helps
to increase the strength of components and saves upto
80% on materials.
5. HOT FORGED PARTS
Hot Forged Products include connecting rods, lug gears
for motorcycles, CV joint parts, fan hubs, bevel gears,
fuel injection pump parts, etc. The Hot Forging unit is
supported by state-of-the-art presses, with press
tonnages varying from 300T upto 1600T, each having
inline induction heating equipment. Besides this, facilities
include Heat treatment furnaces to carry out
Normalizing, Hardening and Tempering, tool room
equipment like Vertical Milling Centre, Spark Erosion and
Wire Cut CNC Machines.
6. PUMPS & ASSEMBLIES
Autolec Division has been in existence from 1965 and is
today one of the leading manufacturers of pump
assemblies and engine components.
OPERATIONAL EXCELLENCE
Pursuit of excellence, over the years, has meant acquiring in-depth expertise in metal forming,
machining, heat treatment and assembly; operator- assured quality; and customer-oriented
design and development. As the business has grown with an expanding global customer base, the
company has steadily invested in creating additional capacities at multiple locations.
Sundram Fasteners was the first Indian manufacturing company to be ISO 9000 certified; the first
to obtain a large, single sourced auto component order from a global OEM customer – the radiator
caps business from General Motors, USA; the first to set up a Just In Time (JIT) supply chain from
India to the US, including a JIT warehouse in the US; the first Indian company to win the global
“Supplier of the Year” award for several years from General Motors; among the first to adopt, and
get recognized for Total Productive Maintenance (TPM) practices in India; Winner of TPM
Excellence, Consistency and Special Award.
Page 6 Source: Company, www.dynamiclevels.com
Industry Outlook
The Indian auto-components industry has experienced healthy
growth over the last few years. Some of the factors
attributable to this include: a buoyant end-user market,
improved consumer sentiment and return of adequate liquidity
in the financial system.
The auto-components industry accounts for almost seven per
cent of India‟s Gross Domestic Product (GDP) and employs as
many as 19 million people, both directly and indirectly. A
stable government framework, increased purchasing power,
large domestic market, and an everincreasing development in
infrastructure have made India a favourable destination for
investment.
Market Size
The Indian auto-components industry can be broadly classified
into the organised and unorganised sectors. The organised
sector caters to the Original Equipment Manufacturers (OEMs)
and consists of high-value precision instruments while the
unorganised sector comprises low-valued products and caters
mostly to the aftermarket category.
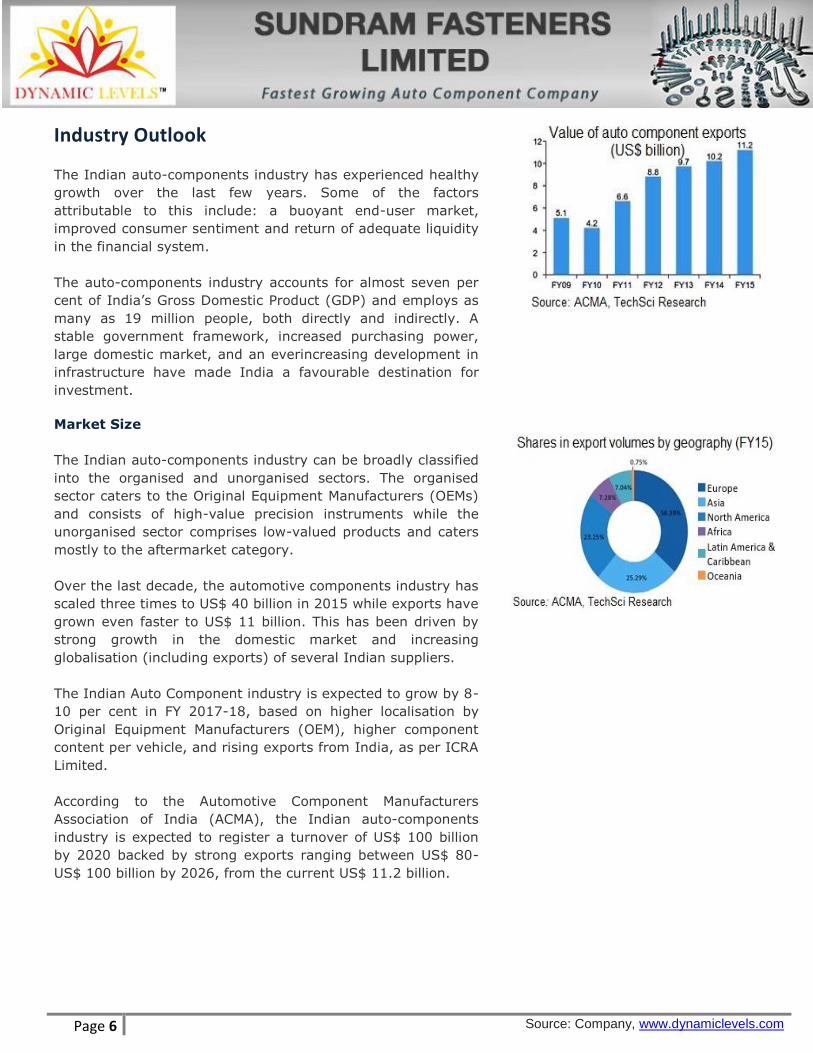
Over the last decade, the automotive components industry has
scaled three times to US$ 40 billion in 2015 while exports have
grown even faster to US$ 11 billion. This has been driven by
strong growth in the domestic market and increasing
globalisation (including exports) of several Indian suppliers.
The Indian Auto Component industry is expected to grow by 8-
10 per cent in FY 2017-18, based on higher localisation by
Original Equipment Manufacturers (OEM), higher component
content per vehicle, and rising exports from India, as per ICRA
Limited.
According to the Automotive Component Manufacturers
Association of India (ACMA), the Indian auto-components
industry is expected to register a turnover of US$ 100 billion
by 2020 backed by strong exports ranging between US$ 80-
US$ 100 billion by 2026, from the current US$ 11.2 billion.
Page 7 Source: Company, www.dynamiclevels.com
Investments
The cumulative Foreign Direct Investment (FDI) inflows into
the Indian automobile industry during the period April 2000 –
March 2016 were recorded at US$ 15.07 billion, as per data by
the Department of Industrial Policy and Promotion (DIPP).
Some of the major investments made into the Indian auto
components sector are as follows:
Japanese auto major Honda is planning to step up
supply and target exporting of auto components worth
Rs 1,500 crore (US$ 224.45 million) from India to it
various international operations.
Auto components maker Bharat Forge Ltd (BFL), the
flagship company of the US$ 3 billion Kalyani Group,
has formalised agreement with Rolls-Royce Plc which
will supply BFL with critical and high integrity forged
and machined components
Canada‟s Magna International Incorporated has started
production at two facilities in Gujarat‟s Sanand, which
will supply auto parts to Ford Motor Co in India
Everstone Capital, a Singapore-based private equity
(PE) firm, has purchased 51 per cent in Indian auto
components maker SJS Enterprises for an estimated Rs
350 crore (US$ 51.35 million).
German auto components maker Bosch Ltd opened its
new factory at Bidadi, near Bengaluru, which is its fifth
manufacturing plant in Karnataka.
French tyre manufacturer Michelin announced plans to
produce 16,000 tonnes of truck and bus tyres from its
Indian facility this year, a 45 per cent rise from last
year.
German luxury car maker Bayerische Motoren Werke
AG‟s ( BMW ‟s) announced it will start sourcing parts
from at least seven India-based auto parts makers in
response to promote „Make in India‟.
Hero MotoCorp is investing Rs 5,000 crore (US$ 733.59
million) in five manufacturing facilities across India,
Colombia and Bangladesh, to increase its annual
production capacity to 12 million units by 2020.
Government Initiatives
The Government of India‟s Automotive
Mission Plan (AMP) 2006–2016 has
come a long way in ensuring growth for
the sector. It is expected that this
sector's contribution to the GDP will
reach US$ 145 billion in 2016 due to
the government‟s special focus on
exports of small cars, multi-utility
vehicles (MUVs), two and three-
wheelers and auto components.
Separately, the deregulation of FDI in
this sector has also helped foreign
companies to make large investments
in India.The Government of India‟s
Automotive Mission Plan (AMP) 2016–
2026 envisages creation of an
additional 50 million jobs along with an
ambitious target of increasing the value
of the output of the sector to up to Rs
18,89,000 crore (US$ 282.65 billion).
Road Ahead
The rapidly globalising world is opening
up newer avenues for the
transportation industry, especially while
it makes a shift towards electric,
electronic and hybrid cars, which are
deemed more efficient, safe and
reliable modes of transportation. Over
the next decade, this will lead to newer
verticals and opportunities for auto-
component manufacturers, who would
need to adapt to the change via
systematic research and development.
The Indian auto-components industry is
set to become the third largest in the
world by 2025. Indian auto-component
makers are well positioned to benefit
from the globalisation of the sector as
exports potential could be increased by
up to four times to US$ 40 billion by
2020.
Page 8 Source: Company, www.dynamiclevels.com
Company Financials
Jun-16 Quarterly
Mar-16 Quarterly
Dec-15 Quarterly
Sep-15 Quarterly
Jun-15 Quarterly
Mar-16 Annual
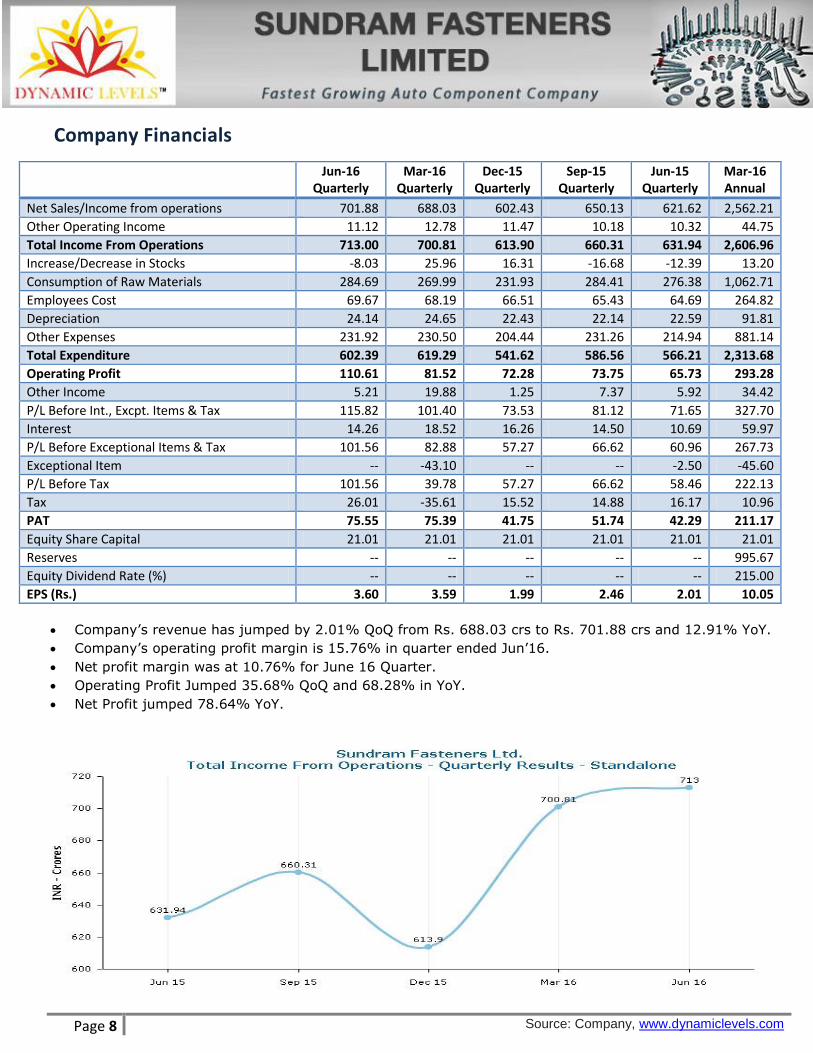
Net Sales/Income from operations 701.88 688.03 602.43 650.13 621.62 2,562.21
Other Operating Income 11.12 12.78 11.47 10.18 10.32 44.75
Total Income From Operations 713.00 700.81 613.90 660.31 631.94 2,606.96
Increase/Decrease in Stocks -8.03 25.96 16.31 -16.68 -12.39 13.20
Consumption of Raw Materials 284.69 269.99 231.93 284.41 276.38 1,062.71
Employees Cost 69.67 68.19 66.51 65.43 64.69 264.82
Depreciation 24.14 24.65 22.43 22.14 22.59 91.81
Other Expenses 231.92 230.50 204.44 231.26 214.94 881.14
Total Expenditure 602.39 619.29 541.62 586.56 566.21 2,313.68
Operating Profit 110.61 81.52 72.28 73.75 65.73 293.28
Other Income 5.21 19.88 1.25 7.37 5.92 34.42
P/L Before Int., Excpt. Items & Tax 115.82 101.40 73.53 81.12 71.65 327.70
Interest 14.26 18.52 16.26 14.50 10.69 59.97
P/L Before Exceptional Items & Tax 101.56 82.88 57.27 66.62 60.96 267.73
Exceptional Item -- -43.10 -- -- -2.50 -45.60
P/L Before Tax 101.56 39.78 57.27 66.62 58.46 222.13
Tax 26.01 -35.61 15.52 14.88 16.17 10.96
PAT 75.55 75.39 41.75 51.74 42.29 211.17
Equity Share Capital 21.01 21.01 21.01 21.01 21.01 21.01
Reserves -- -- -- -- -- 995.67
Equity Dividend Rate (%) -- -- -- -- -- 215.00
EPS (Rs.) 3.60 3.59 1.99 2.46 2.01 10.05
Company‟s revenue has jumped by 2.01% QoQ from Rs. 688.03 crs to Rs. 701.88 crs and 12.91% YoY.
Company‟s operating profit margin is 15.76% in quarter ended Jun‟16.
Net profit margin was at 10.76% for June 16 Quarter.
Operating Profit Jumped 35.68% QoQ and 68.28% in YoY.
Net Profit jumped 78.64% YoY.
Page 9 Source: Company, www.dynamiclevels.com
Balance sheet
In Cr. Mar-16 12 mths
Mar-15 12 mths
Mar-14 12 mths
Mar-13 12 mths
Mar-12 12 mths
EQUITIES AND LIABILITIES
SHAREHOLDERS FUNDS
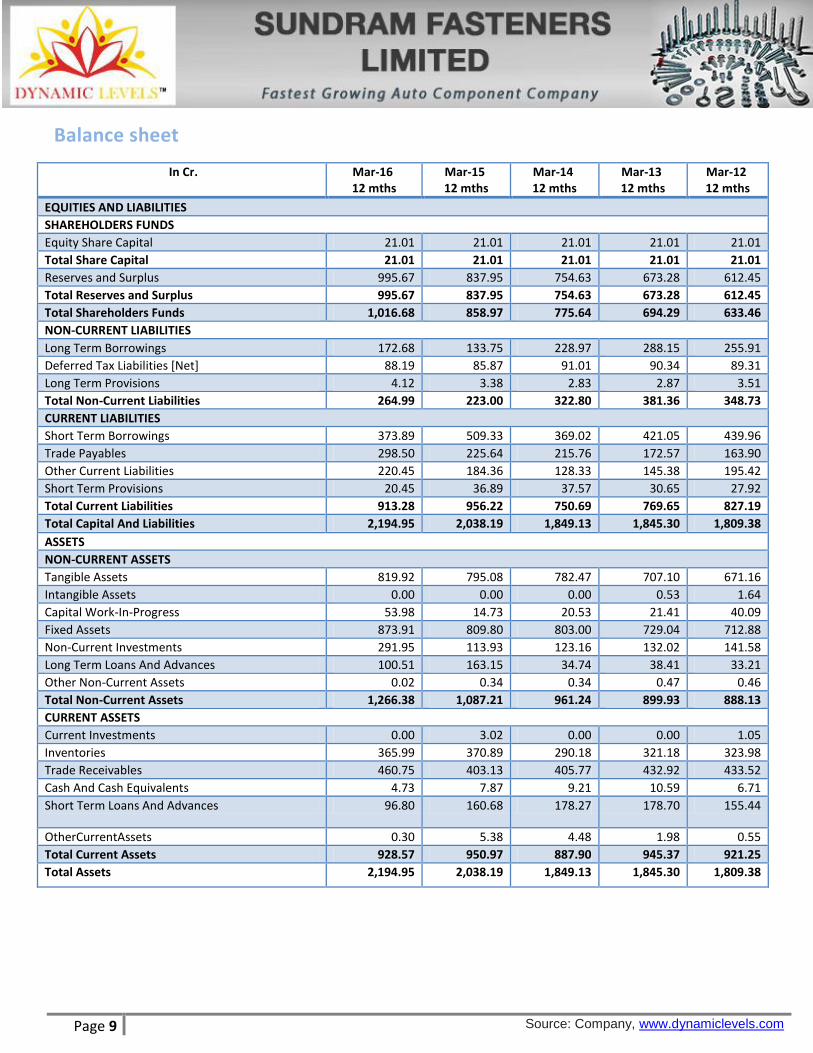
Equity Share Capital 21.01 21.01 21.01 21.01 21.01
Total Share Capital 21.01 21.01 21.01 21.01 21.01
Reserves and Surplus 995.67 837.95 754.63 673.28 612.45
Total Reserves and Surplus 995.67 837.95 754.63 673.28 612.45
Total Shareholders Funds 1,016.68 858.97 775.64 694.29 633.46
NON-CURRENT LIABILITIES
Long Term Borrowings 172.68 133.75 228.97 288.15 255.91
Deferred Tax Liabilities [Net] 88.19 85.87 91.01 90.34 89.31
Long Term Provisions 4.12 3.38 2.83 2.87 3.51
Total Non-Current Liabilities 264.99 223.00 322.80 381.36 348.73
CURRENT LIABILITIES
Short Term Borrowings 373.89 509.33 369.02 421.05 439.96
Trade Payables 298.50 225.64 215.76 172.57 163.90
Other Current Liabilities 220.45 184.36 128.33 145.38 195.42
Short Term Provisions 20.45 36.89 37.57 30.65 27.92
Total Current Liabilities 913.28 956.22 750.69 769.65 827.19
Total Capital And Liabilities 2,194.95 2,038.19 1,849.13 1,845.30 1,809.38
ASSETS
NON-CURRENT ASSETS
Tangible Assets 819.92 795.08 782.47 707.10 671.16
Intangible Assets 0.00 0.00 0.00 0.53 1.64
Capital Work-In-Progress 53.98 14.73 20.53 21.41 40.09
Fixed Assets 873.91 809.80 803.00 729.04 712.88
Non-Current Investments 291.95 113.93 123.16 132.02 141.58
Long Term Loans And Advances 100.51 163.15 34.74 38.41 33.21
Other Non-Current Assets 0.02 0.34 0.34 0.47 0.46
Total Non-Current Assets 1,266.38 1,087.21 961.24 899.93 888.13
CURRENT ASSETS
Current Investments 0.00 3.02 0.00 0.00 1.05
Inventories 365.99 370.89 290.18 321.18 323.98
Trade Receivables 460.75 403.13 405.77 432.92 433.52
Cash And Cash Equivalents 4.73 7.87 9.21 10.59 6.71
Short Term Loans And Advances 96.80 160.68 178.27 178.70 155.44
OtherCurrentAssets 0.30 5.38 4.48 1.98 0.55
Total Current Assets 928.57 950.97 887.90 945.37 921.25
Total Assets 2,194.95 2,038.19 1,849.13 1,845.30 1,809.38
Page 10 Source: Company, www.dynamiclevels.com
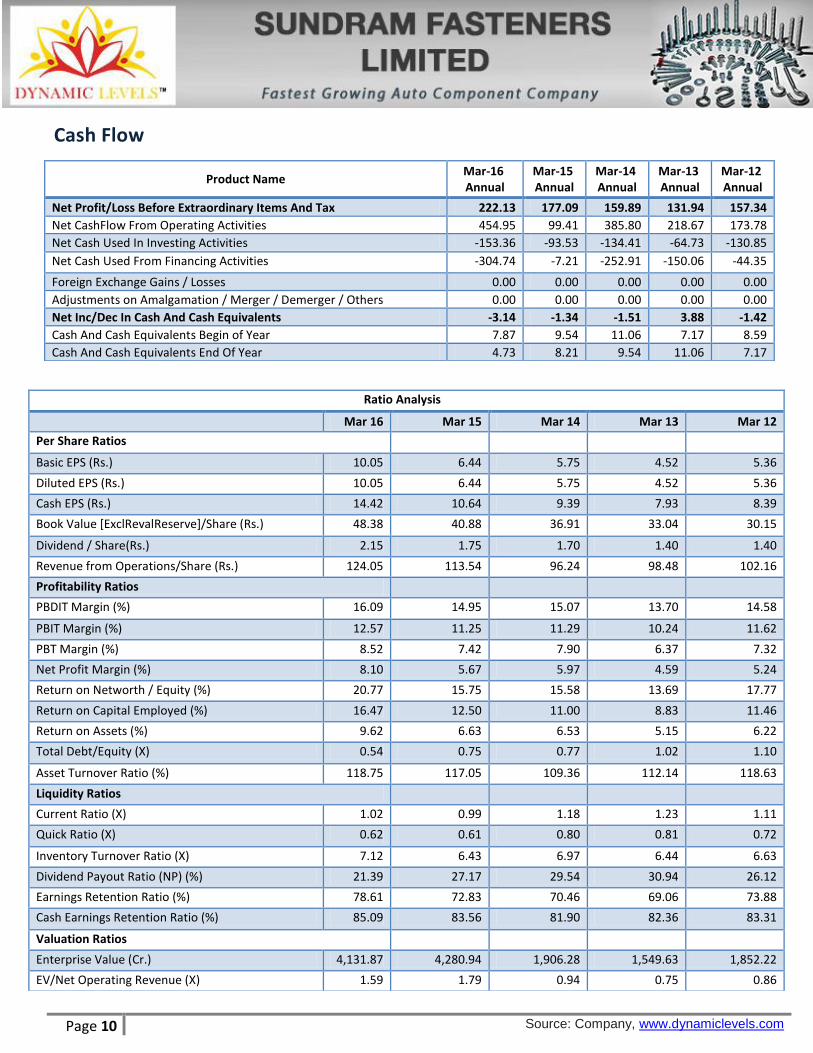
Cash Flow
Product Name Mar-16 Annual
Mar-15 Annual
Mar-14 Annual
Mar-13 Annual
Mar-12 Annual
Net Profit/Loss Before Extraordinary Items And Tax 222.13 177.09 159.89 131.94 157.34
Net CashFlow From Operating Activities 454.95 99.41 385.80 218.67 173.78
Net Cash Used In Investing Activities -153.36 -93.53 -134.41 -64.73 -130.85
Net Cash Used From Financing Activities -304.74 -7.21 -252.91 -150.06 -44.35
Foreign Exchange Gains / Losses 0.00 0.00 0.00 0.00 0.00
Adjustments on Amalgamation / Merger / Demerger / Others 0.00 0.00 0.00 0.00 0.00
Net Inc/Dec In Cash And Cash Equivalents -3.14 -1.34 -1.51 3.88 -1.42
Cash And Cash Equivalents Begin of Year 7.87 9.54 11.06 7.17 8.59
Cash And Cash Equivalents End Of Year 4.73 8.21 9.54 11.06 7.17
Ratio Analysis
Mar 16 Mar 15 Mar 14 Mar 13 Mar 12
Per Share Ratios
Basic EPS (Rs.) 10.05 6.44 5.75 4.52 5.36
Diluted EPS (Rs.) 10.05 6.44 5.75 4.52 5.36
Cash EPS (Rs.) 14.42 10.64 9.39 7.93 8.39
Book Value [ExclRevalReserve]/Share (Rs.) 48.38 40.88 36.91 33.04 30.15
Dividend / Share(Rs.) 2.15 1.75 1.70 1.40 1.40
Revenue from Operations/Share (Rs.) 124.05 113.54 96.24 98.48 102.16
Profitability Ratios
PBDIT Margin (%) 16.09 14.95 15.07 13.70 14.58
PBIT Margin (%) 12.57 11.25 11.29 10.24 11.62
PBT Margin (%) 8.52 7.42 7.90 6.37 7.32
Net Profit Margin (%) 8.10 5.67 5.97 4.59 5.24
Return on Networth / Equity (%) 20.77 15.75 15.58 13.69 17.77
Return on Capital Employed (%) 16.47 12.50 11.00 8.83 11.46
Return on Assets (%) 9.62 6.63 6.53 5.15 6.22
Total Debt/Equity (X) 0.54 0.75 0.77 1.02 1.10
Asset Turnover Ratio (%) 118.75 117.05 109.36 112.14 118.63
Liquidity Ratios
Current Ratio (X) 1.02 0.99 1.18 1.23 1.11
Quick Ratio (X) 0.62 0.61 0.80 0.81 0.72
Inventory Turnover Ratio (X) 7.12 6.43 6.97 6.44 6.63
Dividend Payout Ratio (NP) (%) 21.39 27.17 29.54 30.94 26.12
Earnings Retention Ratio (%) 78.61 72.83 70.46 69.06 73.88
Cash Earnings Retention Ratio (%) 85.09 83.56 81.90 82.36 83.31
Valuation Ratios
Enterprise Value (Cr.) 4,131.87 4,280.94 1,906.28 1,549.63 1,852.22
EV/Net Operating Revenue (X) 1.59 1.79 0.94 0.75 0.86
EV/EBITDA (X) 9.85 12.00 6.25 5.46 5.91
MarketCap/Net Operating Revenue (X) 1.38 1.53 0.65 0.41 0.54
Retention Ratios (%) 78.60 72.82 70.45 69.05 73.87
Price/BV (X) 3.53 4.24 1.70 1.23 1.84
Page 11 Source: Company, www.dynamiclevels.com
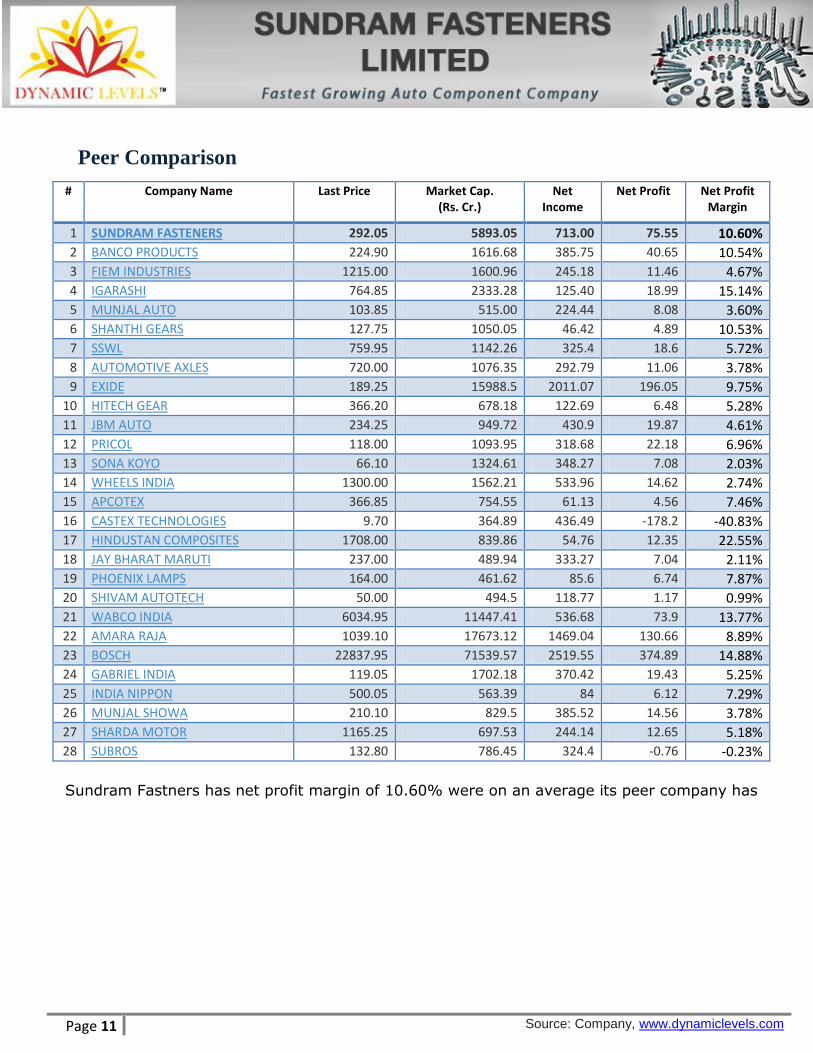
Peer Comparison
# Company Name Last Price Market Cap. (Rs. Cr.)
Net Income
Net Profit Net Profit Margin
1 SUNDRAM FASTENERS 292.05 5893.05 713.00 75.55 10.60%
2 BANCO PRODUCTS 224.90 1616.68 385.75 40.65 10.54%
3 FIEM INDUSTRIES 1215.00 1600.96 245.18 11.46 4.67%
4 IGARASHI 764.85 2333.28 125.40 18.99 15.14%
5 MUNJAL AUTO 103.85 515.00 224.44 8.08 3.60%
6 SHANTHI GEARS 127.75 1050.05 46.42 4.89 10.53%
7 SSWL 759.95 1142.26 325.4 18.6 5.72%
8 AUTOMOTIVE AXLES 720.00 1076.35 292.79 11.06 3.78%
9 EXIDE 189.25 15988.5 2011.07 196.05 9.75%
10 HITECH GEAR 366.20 678.18 122.69 6.48 5.28%
11 JBM AUTO 234.25 949.72 430.9 19.87 4.61%
12 PRICOL 118.00 1093.95 318.68 22.18 6.96%
13 SONA KOYO 66.10 1324.61 348.27 7.08 2.03%
14 WHEELS INDIA 1300.00 1562.21 533.96 14.62 2.74%
15 APCOTEX 366.85 754.55 61.13 4.56 7.46%
16 CASTEX TECHNOLOGIES 9.70 364.89 436.49 -178.2 -40.83%
17 HINDUSTAN COMPOSITES 1708.00 839.86 54.76 12.35 22.55%
18 JAY BHARAT MARUTI 237.00 489.94 333.27 7.04 2.11%
19 PHOENIX LAMPS 164.00 461.62 85.6 6.74 7.87%
20 SHIVAM AUTOTECH 50.00 494.5 118.77 1.17 0.99%
21 WABCO INDIA 6034.95 11447.41 536.68 73.9 13.77%
22 AMARA RAJA 1039.10 17673.12 1469.04 130.66 8.89%
23 BOSCH 22837.95 71539.57 2519.55 374.89 14.88%
24 GABRIEL INDIA 119.05 1702.18 370.42 19.43 5.25%
25 INDIA NIPPON 500.05 563.39 84 6.12 7.29%
26 MUNJAL SHOWA 210.10 829.5 385.52 14.56 3.78%
27 SHARDA MOTOR 1165.25 697.53 244.14 12.65 5.18%
28 SUBROS 132.80 786.45 324.4 -0.76 -0.23%
Sundram Fastners has net profit margin of 10.60% were on an average its peer company has
profit margin of 5.53%.
Page 12 Source: Company, www.dynamiclevels.com
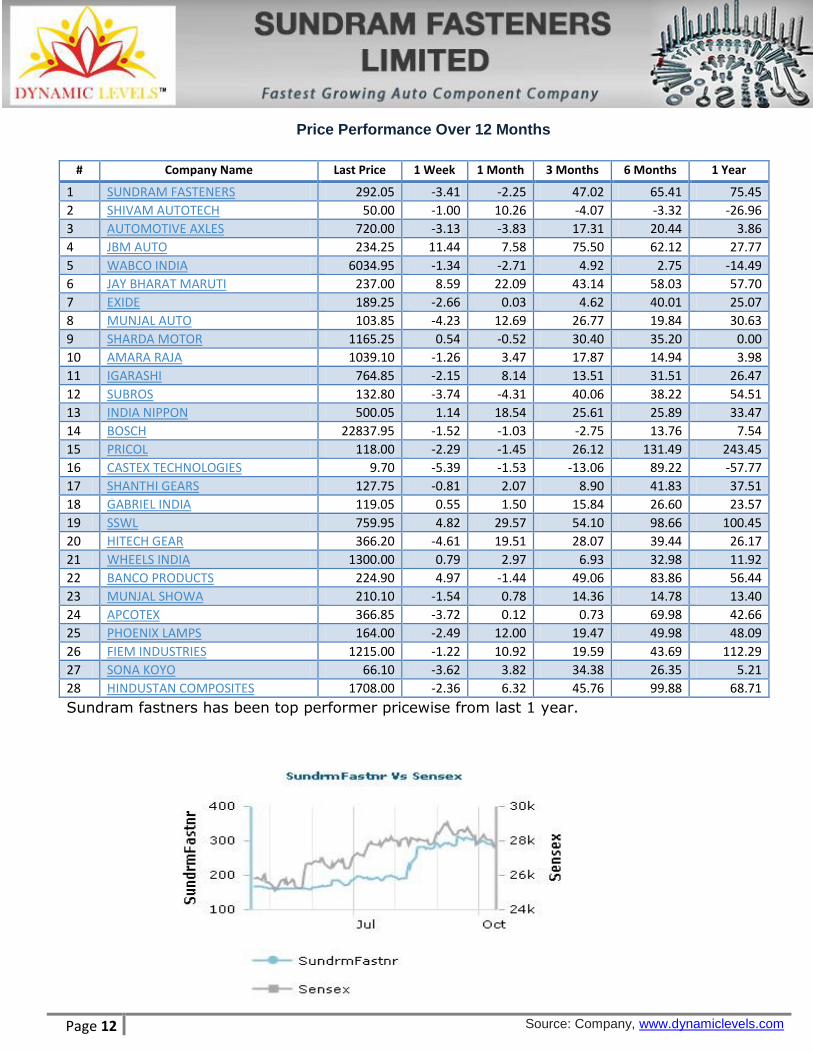
Price Performance Over 12 Months
# Company Name Last Price 1 Week 1 Month 3 Months 6 Months 1 Year
1 SUNDRAM FASTENERS 292.05 -3.41 -2.25 47.02 65.41 75.45
2 SHIVAM AUTOTECH 50.00 -1.00 10.26 -4.07 -3.32 -26.96
3 AUTOMOTIVE AXLES 720.00 -3.13 -3.83 17.31 20.44 3.86
4 JBM AUTO 234.25 11.44 7.58 75.50 62.12 27.77
5 WABCO INDIA 6034.95 -1.34 -2.71 4.92 2.75 -14.49
6 JAY BHARAT MARUTI 237.00 8.59 22.09 43.14 58.03 57.70
7 EXIDE 189.25 -2.66 0.03 4.62 40.01 25.07
8 MUNJAL AUTO 103.85 -4.23 12.69 26.77 19.84 30.63
9 SHARDA MOTOR 1165.25 0.54 -0.52 30.40 35.20 0.00
10 AMARA RAJA 1039.10 -1.26 3.47 17.87 14.94 3.98
11 IGARASHI 764.85 -2.15 8.14 13.51 31.51 26.47
12 SUBROS 132.80 -3.74 -4.31 40.06 38.22 54.51
13 INDIA NIPPON 500.05 1.14 18.54 25.61 25.89 33.47
14 BOSCH 22837.95 -1.52 -1.03 -2.75 13.76 7.54
15 PRICOL 118.00 -2.29 -1.45 26.12 131.49 243.45
16 CASTEX TECHNOLOGIES 9.70 -5.39 -1.53 -13.06 89.22 -57.77
17 SHANTHI GEARS 127.75 -0.81 2.07 8.90 41.83 37.51
18 GABRIEL INDIA 119.05 0.55 1.50 15.84 26.60 23.57
19 SSWL 759.95 4.82 29.57 54.10 98.66 100.45
20 HITECH GEAR 366.20 -4.61 19.51 28.07 39.44 26.17
21 WHEELS INDIA 1300.00 0.79 2.97 6.93 32.98 11.92
22 BANCO PRODUCTS 224.90 4.97 -1.44 49.06 83.86 56.44
23 MUNJAL SHOWA 210.10 -1.54 0.78 14.36 14.78 13.40
24 APCOTEX 366.85 -3.72 0.12 0.73 69.98 42.66
25 PHOENIX LAMPS 164.00 -2.49 12.00 19.47 49.98 48.09
26 FIEM INDUSTRIES 1215.00 -1.22 10.92 19.59 43.69 112.29
27 SONA KOYO 66.10 -3.62 3.82 34.38 26.35 5.21
28 HINDUSTAN COMPOSITES 1708.00 -2.36 6.32 45.76 99.88 68.71
Sundram fastners has been top performer pricewise from last 1 year.
Page 13 Source: Company, www.dynamiclevels.com
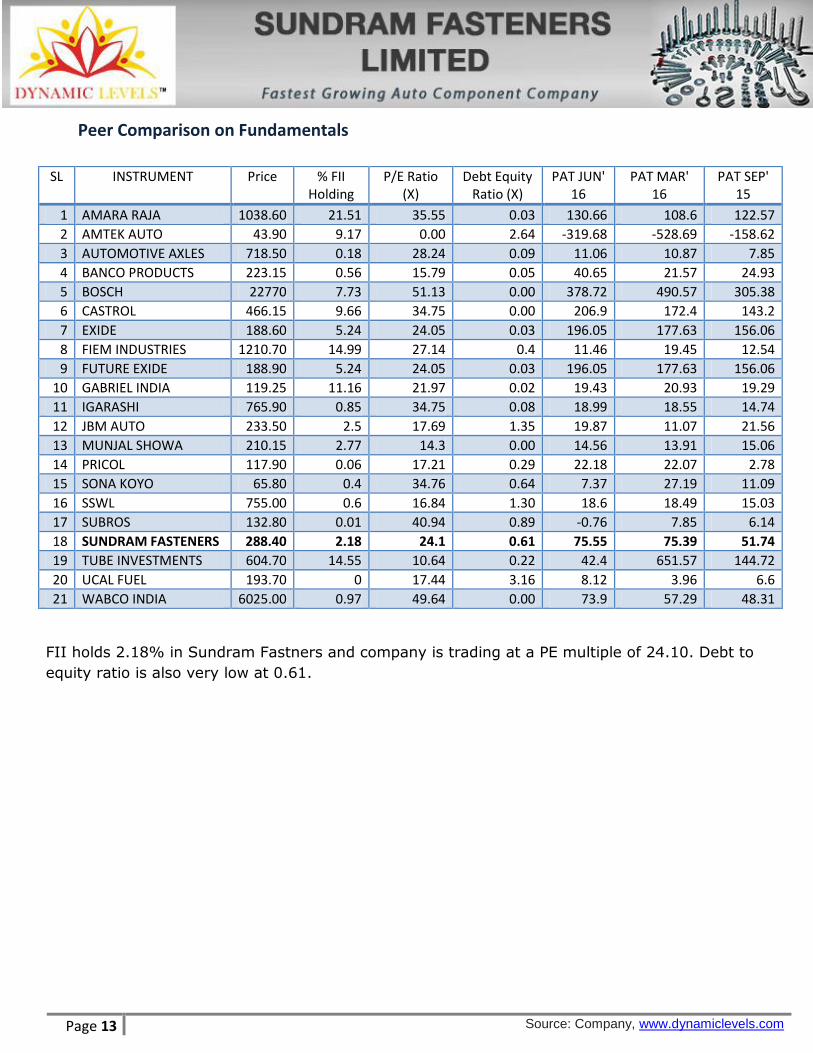
Peer Comparison on Fundamentals
SL INSTRUMENT Price % FII Holding
P/E Ratio (X)
Debt Equity Ratio (X)
PAT JUN' 16
PAT MAR' 16
PAT SEP' 15
1 AMARA RAJA 1038.60 21.51 35.55 0.03 130.66 108.6 122.57
2 AMTEK AUTO 43.90 9.17 0.00 2.64 -319.68 -528.69 -158.62
3 AUTOMOTIVE AXLES 718.50 0.18 28.24 0.09 11.06 10.87 7.85
4 BANCO PRODUCTS 223.15 0.56 15.79 0.05 40.65 21.57 24.93
5 BOSCH 22770 7.73 51.13 0.00 378.72 490.57 305.38
6 CASTROL 466.15 9.66 34.75 0.00 206.9 172.4 143.2
7 EXIDE 188.60 5.24 24.05 0.03 196.05 177.63 156.06
8 FIEM INDUSTRIES 1210.70 14.99 27.14 0.4 11.46 19.45 12.54
9 FUTURE EXIDE 188.90 5.24 24.05 0.03 196.05 177.63 156.06
10 GABRIEL INDIA 119.25 11.16 21.97 0.02 19.43 20.93 19.29
11 IGARASHI 765.90 0.85 34.75 0.08 18.99 18.55 14.74
12 JBM AUTO 233.50 2.5 17.69 1.35 19.87 11.07 21.56
13 MUNJAL SHOWA 210.15 2.77 14.3 0.00 14.56 13.91 15.06
14 PRICOL 117.90 0.06 17.21 0.29 22.18 22.07 2.78
15 SONA KOYO 65.80 0.4 34.76 0.64 7.37 27.19 11.09
16 SSWL 755.00 0.6 16.84 1.30 18.6 18.49 15.03
17 SUBROS 132.80 0.01 40.94 0.89 -0.76 7.85 6.14
18 SUNDRAM FASTENERS 288.40 2.18 24.1 0.61 75.55 75.39 51.74
19 TUBE INVESTMENTS 604.70 14.55 10.64 0.22 42.4 651.57 144.72
20 UCAL FUEL 193.70 0 17.44 3.16 8.12 3.96 6.6
21 WABCO INDIA 6025.00 0.97 49.64 0.00 73.9 57.29 48.31
FII holds 2.18% in Sundram Fastners and company is trading at a PE multiple of 24.10. Debt to
equity ratio is also very low at 0.61.
Page 14 Source: Company, www.dynamiclevels.com
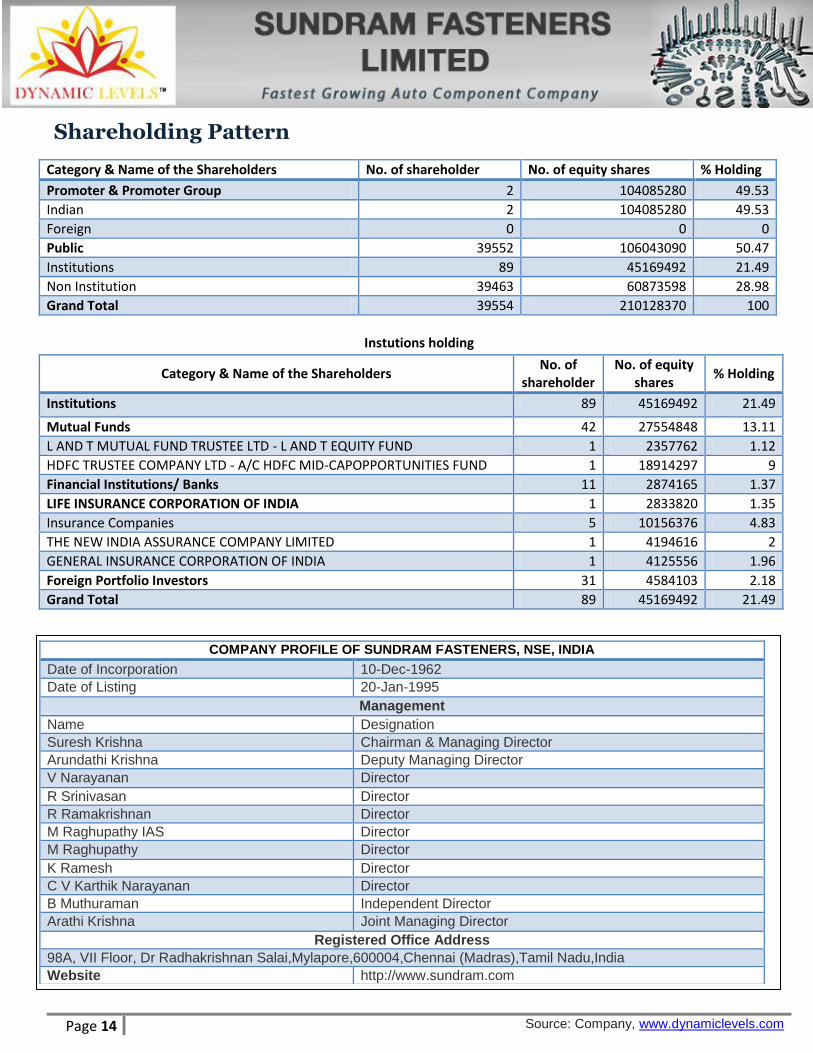
Shareholding Pattern
Category & Name of the Shareholders No. of shareholder No. of equity shares % Holding
Promoter & Promoter Group 2 104085280 49.53
Indian 2 104085280 49.53
Foreign 0 0 0
Public 39552 106043090 50.47
Institutions 89 45169492 21.49
Non Institution 39463 60873598 28.98
Grand Total 39554 210128370 100
Instutions holding
Category & Name of the Shareholders No. of
shareholder No. of equity
shares % Holding
Institutions 89 45169492 21.49
Mutual Funds 42 27554848 13.11
L AND T MUTUAL FUND TRUSTEE LTD - L AND T EQUITY FUND 1 2357762 1.12
HDFC TRUSTEE COMPANY LTD - A/C HDFC MID-CAPOPPORTUNITIES FUND 1 18914297 9
Financial Institutions/ Banks 11 2874165 1.37
LIFE INSURANCE CORPORATION OF INDIA 1 2833820 1.35
Insurance Companies 5 10156376 4.83
THE NEW INDIA ASSURANCE COMPANY LIMITED 1 4194616 2
GENERAL INSURANCE CORPORATION OF INDIA 1 4125556 1.96
Foreign Portfolio Investors 31 4584103 2.18
Grand Total 89 45169492 21.49
COMPANY PROFILE OF SUNDRAM FASTENERS, NSE, INDIA
Date of Incorporation 10-Dec-1962
Date of Listing 20-Jan-1995
Management
Name Designation
Suresh Krishna Chairman & Managing Director
Arundathi Krishna Deputy Managing Director
V Narayanan Director
R Srinivasan Director
R Ramakrishnan Director
M Raghupathy IAS Director
M Raghupathy Director
K Ramesh Director
C V Karthik Narayanan Director
B Muthuraman Independent Director
Arathi Krishna Joint Managing Director
Registered Office Address
98A, VII Floor, Dr Radhakrishnan Salai,Mylapore,600004,Chennai (Madras),Tamil Nadu,India
Website http://www.sundram.com
Page 15 Source: Company, www.dynamiclevels.com
Investment Rationale
Sundram Fasteners is a flagship company of US $ 6 billion TVS Group
Manufacturer of automotive and engineering components
First Indian company to be ISO 9000 certified. All operations are ISO 9000,
IS 14001 & TS 16949 certified.
Company‟s revenue has jumped by 2.01% QoQ from Rs. 688.03 crs to Rs.
701.88 crs and 12.91% YoY.
Company‟s operating profit margin is 15.76% in quarter ended Jun‟16.
Net profit margin was at 10.76% for June 16 Quarter.
Operating Profit Jumped 35.68% QoQ and 68.28% in YoY.
Net Profit jumped 78.64% YoY.
FII holds 2.18% in Sundram Fastners and company is trading at a PE
multiple of 24.10. Debt to equity ratio is also very low at 0.61.
Total no of institutions in Sundram Fastners is 89, they hold 21.49% in the
company out of which 13.11% is held with Mutual Fund.
Sundram Fastners has a diversified product line, world-class facilities in 4
countries and motivated team of talented people
Sundram Fasteners has become a supplier of choice to leading customers in
the automotive and industrial segments worldwide.
At Sundram Fasteners, growth is a natural outcome of total adherence to
three core operating principles: customer orientation, total quality and
ethical business practices.
We recommend BUY in Sundram Fastners @ 285 with the target of 330
Page 16 Source: Company, www.dynamiclevels.com
Disclaimer: Research Disclaimer and Disclosure inter-alia as required under Securities and Exchange Board of India (Research Analysts) Regulations, 2014. Dynamic Equities Pvt. Ltd. is a member of National Stock Exchange of India Ltd. (NSEIL), Bombay Stock Exchange Ltd (BSE), Multi Stock Exchange of India Ltd (MCX-SX) and also a depository participant with National Securities Depository Ltd (NSDL) and Central Depository Services Ltd.(CDSL). Dynamic is engaged in the business of Stock Broking, Depository Services, Investment Advisory Services and Portfolio Management Services. Dynamic Equities Pvt. Ltd. is holding company of Dynamic Commodities Pvt. Ltd. , a member of Multi Commodities Exchange (MCX) & National Commodity & Derivatives Exchange Ltd.(NCDEX). We hereby declare that our activities were neither suspended nor we have defaulted with any stock exchange authority with whom we are registered. SEBI, Exchanges and Depositories have conducted the routine inspection and based on their observations have issued advise letters or levied minor penalty on for certain operational deviations. Answers to the Best of the knowledge and belief of Dynamic/ its Associates/ Research Analyst who prepared this report
DYANMIC/its Associates/ Research Analyst/ his Relative have any financial interest in the subject company? No
DYANMIC/its Associates/ Research Analyst/ his Relative have actual/beneficial ownership of one per cent or more securities of the subject company? No
DYANMIC/its Associates/ Research Analyst/ his Relative have any other material conflict of interest at the time of publication of the research report or at the time of public appearance? No
DYANMIC/its Associates/ Research Analyst/ his Relative have received any compensation from the subject company in the past twelve months? No
DYANMIC/its Associates/ Research Analyst/ his Relative have managed or co-managed public offering of securities for the subject company in the past twelve months? No
DYANMIC/its Associates/ Research Analyst/ his Relative have received any compensation for investment banking or merchant banking or brokerage services from the subject company in the past twelve months? No
DYANMIC/its Associates/ Research Analyst/ his Relative have received any compensation for products or services other than investment banking or merchant banking or brokerage services from the subject company in the past twelve months? No
DYANMIC/its Associates/ Research Analyst/ his Relative have received any compensation or other benefits from the Subject Company or third party in connection with the research report? No
DYANMIC/its Associates/ Research Analyst/ his Relative have served as an officer, director or employee of the subject company? No
DYANMIC/its Associates/ Research Analyst/ his Relative have been engaged in market making activity for the subject company? No
General Disclaimer: - This Research Report (hereinafter called “Report”) is meant solely for use by the recipient and is not for circulation. This Report does not constitute a personal recommendation or take into account the particular investment objectives, financial situations, or needs of individual clients. The recommendations, if any, made herein are expression of views and/or opinions and should not be deemed or construed to be neither advice for the purpose of purchase or sale of any security, derivatives or any other security through Dynamic nor any solicitation or offering of any investment /trading opportunity on behalf of the issuer(s) of the respective security (ies) referred to herein. These information / opinions / views are not meant to serve as a professional investment guide for the readers. No action is solicited based upon the information provided herein. Recipients of this Report should rely on information/data arising out of their own investigations. Readers are advised to seek independent professional advice and arrive at an informed trading/investment decision before executing any trades or making any investments. This Report has been prepared on the basis of publicly available information, internally developed data and other sources believed by Dynamic to be reliable. Dynamic or its directors, employees, affiliates or representatives do not assume any responsibility for, or warrant the accuracy, completeness, adequacy and reliability of such information / opinions / views. While due care has been taken to ensure that the disclosures and opinions given are fair and reasonable, none of the directors, employees, affiliates or representatives of Dynamic shall be liable for any direct, indirect, special, incidental, consequential, punitive or exemplary damages, including loss profits arising in any way whatsoever from the information / opinions / views contained in this Report. The price and value of the investments referred to in this Report and the income from them may go down as well as up, and investors may realize losses on any investments. Past performance is not a guide for future performance. Dynamic levels do not provide tax advice to its clients, and all investors are strongly advised to consult with their tax advisers regarding taxation aspects of any potential investment. Opinions expressed are our current opinions as of the date appearing on this Research only. We do not undertake to advise you as to any change of our views expressed in this Report. User should keep this risk in mind and not hold dynamic levels, its employees and associates responsible for any losses, damages of any type whatsoever. Dynamic and its associates or employees may; (a) from time to time, have long or short positions in, and buy or sell the investments in/ security of company (ies) mentioned herein and it may not be construed as potential conflict of interest with respect to any recommendation and related information and opinions. Without limiting any of the foregoing, in no event shall Dynamic and its associates or employees or any third party involved in, or related to computing or compiling the information have any liability for any damages of any kind. We and our affiliates/associates, officers, directors, and employees, Research Analyst(including relatives) worldwide may: (a) from time to time, have long or short positions in, and buy or sell the securities thereof, of company (ies) mentioned herein or (b) be engaged in any other transaction involving such securities and earn brokerage or other compensation or act as a market maker in the financial instruments of the subject company/company (ies) discussed herein or act as advisor to such company (ies) or have other potential/material conflict of interest with respect to any recommendation and related information and opinions at the time of publication of Research Report. Dynamic may have proprietary long/short position in the above mentioned scrip(s) and therefore may be considered as interested. The views provided herein are general in nature and does not consider risk appetite or investment objective of particular investor; readers are requested to take independent professional advice before investing. This should not be construed as invitation or solicitation to do business with Dynamic. Dynamic Equities Pvt. Ltd. are also engaged in Proprietary Trading apart from Client Business.
https://www.dynamiclevels.com/en/disclaimer