dynamic impact tolerance of shuttle rcc leading edge ... · dynamic impact tolerance of shuttle rcc...
TRANSCRIPT

Dynamic Impact Tolerance of Shuttle RCC Leading Edge Panels Using LS-DYNA
Edwin L. Fasanella1 and Karen E. Jackson2
US Army Research Laboratory, Vehicle Technology Directorate, Hampton, VA 23681 USA
Karen H. Lyle3, Lisa E. Jones4, Robin C. Hardy¶, and Regina L. Spellman#
NASA Langley Research Center, Hampton, VA 23681 USA
Kelly S. Carney** and Matthew E. Melis††
NASA Glenn Research Center, Cleveland, OH 44135 USA
and
Alan E. Stockwell‡‡
Lockheed Martin Space Operations, Hampton, VA 23681 USA
This paper describes a research program conducted to enable accurate prediction of the impact tolerance of the shuttle Orbiter leading-edge wing panels using “physics-based” codes such as LS-DYNA, a nonlinear, explicit transient dynamic finite element code. The shuttle leading-edge panels are constructed of Reinforced-Carbon-Carbon (RCC) composite material, which is used because of its thermal properties to protect the shuttle during re-entry into the Earth’s atmosphere. Accurate predictions of impact damage from insulating foam and other debris strikes that occur during launch required materials characterization of expected debris, including strain-rate effects. First, analytical models of individual foam and RCC materials were validated. Next, analytical models of foam cylinders impacting 6-in. x 6-in. RCC flat plates were developed and validated. LS-DYNA pre-test models of the RCC flat plate specimens established the impact velocity of the test for three damage levels: no-detectable damage, non-destructive evaluation (NDE) detectable damage, or visible damage such as a through crack or hole. Finally, the threshold of impact damage for RCC on representative Orbiter wing panels was predicted for both a small through crack and for NDE-detectable damage.
I. Introduction URING the Columbia Accident Investigation Board (CAIB) investigation, Johnson Space Center (JSC) Orbiter Project Office requested various teams from industry, academia, national laboratories, and NASA to apply
“physics-based” analyses to characterize the expected damage to the shuttle thermal protection system (TPS) tiles and Reinforced Carbon-Carbon (RCC) material, for high-speed foam impacts. The forensic evidence from the Columbia debris eventually led investigators to conclude that the breach to the shuttle Orbiter TPS was caused by a
D
1 Senior Research Engineer, Loads and Dynamics Division, Mail Stop 495, AIAA Associate Fellow 2 Senior Research Engineer, Loads and Dynamics Division, Mail Stop 495, AIAA Associate Fellow 3 Aerospace Engineer, Structural Dynamics Branch, Mail Stop 495 4 Aerospace Engineer, Structural Dynamics Branch, Mail Stop 495 ¶ Aerospace Engineer, Structural Dynamics Branch, Mail Stop 495, AIAA Senior Member # Aerospace Engineer, Structural and Thermal Systems Branch, Mail Stop 431, AIAA Member ** Aerospace Engineer, Structural Mechanics and Dynamics Branch, Mail Stop 49-8, AIAA Member †† Aerospace Engineer, Structural Mechanics and Dynamics Branch, Mail Stop 49-8, AIAA Member ‡‡ Manager, Aerodynamics, Structures, and Materials Department, Mail Stop 460, AIAA Senior Member
American Institute of Aeronautics and Astronautics
1
https://ntrs.nasa.gov/search.jsp?R=20050220706 2018-07-03T17:00:46+00:00Z
block of External Tank (ET) insulating foam from the bipod ramp area that impacted and penetrated the lower portion of a left-wing leading edge RCC panel (see Figure 1). The location of the impact was determined to be the left-wing RCC Panel 8. Consequently, the CAIB sanctioned a foam impact test onto RCC panel 8 in July 2003 at Southwest Research Institute (SwRI) in San Antonio, Texas. In the test, a 1.67-lb. block of foam was shot from a large compressed-air gun and impacted panel 8 at a velocity of 777 ft/s at an angle of incidence of 25.1 degrees in an attempt to simulate the scenario observed approximately 82 seconds into Columbia’s flight. The impact resulted in a large 16-in. x 16-in. hole in panel 8. A. Accident Investigation and Return-to-Flight Activities
Chapter 11 recommendation 3.3-2 of the CAIB report1 requests that NASA initiate a program to improve the impact resistance of the wing leading edge. The second part of the recommendation is to …“determine the actual impact resistance of current materials and the effect of likely debris strikes.” In addition, recommendation 3.8.2 states, “Develop, validate, and maintain physics-based computer models to evaluate Thermal Protection System damage from debris impacts. These tools should provide realistic and timely estimates of any impact damage from possible debris from any source that may ultimately impact the Orbiter. Establish impact damage thresholds that trigger responsive correction action, such as on-orbit inspection and repair, when indicated. ”
During the shuttle Return-to-Flight (RTF) program, a team from NASA Glenn Research Center (GRC), NASA Langley Research Center (LaRC), and Boeing Philadelphia was given the following task: to develop a validated finite-element model of the Orbiter wing leading edge capable of accurately predicting the threshold of critical damage (shuttle could not safely return) from debris including foam, ice, and ablators for a variety of impact conditions. The threshold of damage has evolved as knowledge of impact damage has progressed. Initially, all LS-DYNA models for the shuttle Orbiter Program for both foam and ice used a threshold of damage defined to be a small through crack, which in the model was defined as from one to five RCC shell elements deleted. However, the current definition of RCC threshold of damage is “any detectable NDE damage.” This definition is not as easy to correlate with LS-DYNA predictions as the through crack. Critical RCC damage is currently defined as sufficient front-side silicon carbide (SiC) coating loss plus internal RCC delamination likely to produce burn-through of the leading edge resulting in an unsafe re-entry. Since the CAIB report was released, the team has been developing LS-DYNA models of the RCC leading edge panels, conducting detailed materials characterization tests to obtain dynamic material property data for RCC and debris, and correlating the LS-DYNA models with data obtained from impacts tests for both small-scale flat panels and full-size RCC flight hardware panels2-5.
Full-scale impact testing of shuttle RCC leading-edge wing panels is quite expensive. Although practice shots were made onto replica fiberglass wing leading-edge panels from the Orbiter Enterprise, only two full-scale tests were performed onto RCC wing leading-edge panels during the CAIB investigation. The first RCC test was a foam impact onto leading edge panel 6 in June 2003, which produced only an edge crack. Next, in July, the foam impact onto panel 8 produced a 16-in. wide hole.
In September 2003, three tests of increasing severity were performed in which foam projectiles were shot onto the same RCC panel 9 in the apex region. From LS-DYNA analyses, the apex region with the highest debris incidence angle (about 45 degrees) was predicted to be more vulnerable than the lower surface. The full-scale panels require a long lead-time to manufacture, and there are also only a small number of spare panels available. Obviously, there are not enough panels or resources to test all 22 RCC wing panels plus the nose cap and chin guard for a test matrix of different size debris traveling at expected impact velocities and striking each panel at multiple locations. However, a sufficient number of tests are absolutely necessary to characterize the damage threshold for the RCC panels. For RTF, only foam and ice debris impacts are being analyzed. Some foam debris is expected for the redesigned tank, and ice is the second most likely type of debris.
The foam that brought down Columbia was an abnormally large 1.67-pound wedge of hand-applied foam from the bipod ramp area where the external tank is attached to the Orbiter (see Figure 1). The normal foam debris environment consists of small pieces, each typically only a fraction of a pound. The foam wedge was estimated to impact the left wing of the Orbiter at a velocity of over 700 ft/s. Although the bipod ramp area has been redesigned to use heaters, thus eliminating the large piece of foam, smaller foam debris can still potentially cause serious damage if the impact is at a high velocity at a relatively large incidence angle. According to debris transport analysts, a small piece of foam shed from the external tank stops very quickly in the slipstream, allowing the foam to impact the Orbiter at velocities as high as 2500 ft/s. B. Dynamic Material Characterization In addition to experimental tests of debris impacting RCC, which are needed to correlate and to validate LS-DYNA models, tests are also needed to determine the dynamic material properties of the foam, ice, and ablators.
American Institute of Aeronautics and Astronautics
2

These tests are required to develop the physics-based material models for LS-DYNA that include strain-rate data. Much of the high-speed crush testing of foam, ice, and ablators required to develop these LS-DYNA material models was generated using a high-speed bungee-assisted drop tower at NASA Langley, shown in Figure 2.
Bipod ramp area
Panel8 impact location
Figure 1. Picture of Columbia showing the bipod ramp area where the foam block was released and the panel 8
location on the left wing where the foam impacted.
Figure 2. High-speed bungee-assisted drop tower. C. Model Validation
This report documents the LS-DYNA modeling of foam debris impacts onto RCC and will present the test-analysis correlations for both sub-scale and full-scale debris impacts. Validation occurred at three different levels. Level 1 testing was performed to validate the foam and RCC models. Level 1 tests of foam impacts onto a rigid backstop instrumented with a load cell were conducted to validate the foam model. A series of 3-point bend tests were performed as part of the Level 1 validation of the RCC model. Level 2 validation tests included small foam cylinders that were impacted onto 6-in. by 6-in. RCC flat plates. Level 3 tests were full-scale tests and included impact tests of Orbiter wing panels 8 and 9 that were performed at SwRI. Tests of panel 9 for both foam and ice
American Institute of Aeronautics and Astronautics
3

impacts were conducted in late 2004 and early 2005. The validated RCC and foam material models were used to provide the test engineer with the test impact velocity for each desired damage state. Some of the RCC damage states in order of severity included the following: 1) no damage, meaning no-visible surface damage and no non-destructive evaluation (NDE) detectable damage, 2) NDE-detectable internal damage to the RCC, 3) a through crack or a hole. NDE techniques used to evaluate the RCC leading edge after each shuttle flight include eddy current sensors to detect cracks, thermography to detect internal damage such as delamination, and ultrasonic testing. The test set-up, model description, and test-analysis correlation will be presented in the following sections of the paper for each different test configuration and level.
II. Level 1 Validation Tests
The two Level 1 validation tests are described below. The first test was a quasi-static 3-point bending test
conducted on RCC flex specimens. The second test validated the dynamic foam model and consisted of a ballistic impact of foam onto a rigid backstop. A. Test Setup - RCC 3-Point Bend
Southern Research Institute (SRI) cut twenty 1-in. x 5.8-in. flex coupons, a compression test coupon, a tension test coupon, and a scrap for testing coating crush strength from RCC test panel TC3-11. Static and low-rate dynamic 3-point bend tests of 19-ply RCC coupons 1.0-in. wide x 5.8-in long (5-in. gage length) were conducted with incremental loading and NDE after each load cycle to validate the LS-DYNA RCC threshold of damage predictions. The objectives of the tests were: 1) to study the damage initiation and propagation in the RCC samples under quasi-static 3-point bend loading, 2) to determine the NDE detectable damage threshold, 3) to correlate first-detectable NDE damage with LS-DYNA damage parameters, and 4) to determine if delamination can be initiated in RCC bend tests, and if so, can that delamination be correlated with LS-DYNA damage parameters. A picture of the test set-up is shown in Figure 3.
Figure 3. Level 1 three-point bend test of RCC coupon. B. Model Description - 3-Point Bend Test
SRI performed material testing on the tension and compression test coupons that were cut from the same panel as the flex coupons. SRI provided the complete stress-strain curves to failure that were used as input into LS-DYNA’s “Mat 58” material model6, 7. For all RCC models, the Mat 58 (MAT LAMINATED COMPOSITE
American Institute of Aeronautics and Astronautics
4
FABRIC) with failure was used as the material model for the RCC. The RCC material parameters required for LS-DYNA’s Mat 58 formulation are based on available RCC material data obtained by coupon testing to failure of laminates of varying thickness in both tension and compression. There is a wide variation in the RCC material properties for as-fabricated material. A continuum damage model is used in LS-DYNA’s Mat 58 formulation to simulate internal damage with increasing load, which weakens the material and produces the nonlinear stress-strain curves for tension and compression. The damage parameter starts out at zero and approaches one at failure. By adjusting the strength and maximum strain values plus post maximum-strength (strain softening) parameters “SLIMC” for compression and “SLIMT” for tension, the experimental stress-strain curves can be matched to a reasonable degree. Although RCC stress-strain curves have different Young’s moduli in tension and compression, the modulus in compression was used as the modulus in Mat 58. The RCC was modeled as 19 plies with alternating +/- 90 degree orientations. RCC has an outer layer (several plies) that has been treated to produce SiC to protect the carbon from oxidation at the high re-entry temperatures8. The outer layer was not specifically modeled. Instead, each ply was modeled using the smeared laminate properties. Important RCC parameters include the strength in tension, compression, and shear, the failure strains, SLIMC and SLIMT plus an erosion parameter, “ERODS,” that must be empirically determined. If ERODS is too small, the material will fail too early. If ERODS is too large, the material will fail too late and will deform too much. From an early study of foam impacting simply supported RCC coupons, an ERODS value of 0.1 gave reasonable results and was used in this model. The ERODS, SLIMC, and SLIMT parameters used in Mat 58 have remained “fixed” since late 2003. Since the RCC material properties vary considerably, six standardized RCC models were constructed: minimum, average, and maximum strength as-fabricated; and minimum, average, and maximum strength flight-degraded. In addition, these six different models had to be constructed for each of the different RCC thicknesses (19 plies, 0.233-in. was the nominal thickness).
Other RCC damage models of concern are front-surface SiC coating loss plus internal RCC delamination. Such damage had been noted to produce complete burn-through on test RCC panels that were subjected to arc-jet testing. Also, our LS-DYNA model does not directly predict either coating loss or delamination. It was speculated that if delamination occurred early in the 3-point bend test, then the damage parameters that are generated in the Mat 58 RCC material model could be correlated with the onset of RCC delamination. If no delamination occurred, then the Mat 58 damage parameters would be calibrated to first-detectable NDE damage for the 3-point bend test, which is a one-dimensional test with simple boundary conditions.
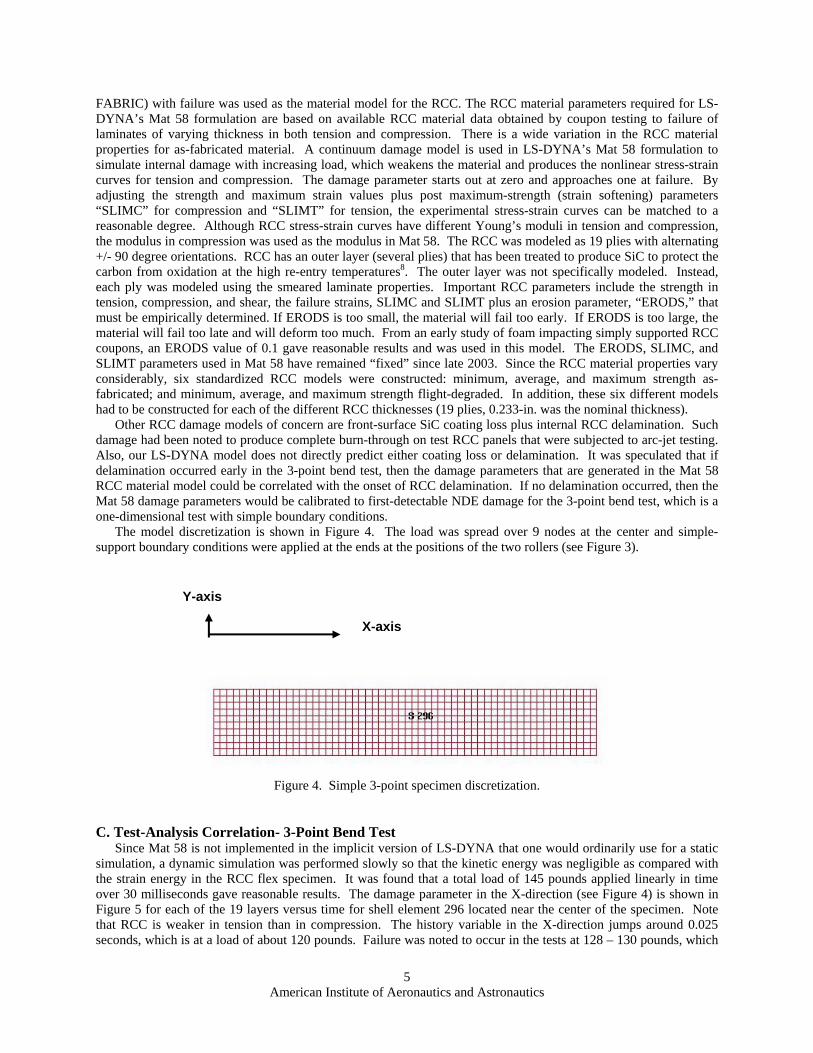
The model discretization is shown in Figure 4. The load was spread over 9 nodes at the center and simple-support boundary conditions were applied at the ends at the positions of the two rollers (see Figure 3).
Y-axis
X-axis
Figure 4. Simple 3-point specimen discretization.
C. Test-Analysis Correlation- 3-Point Bend Test Since Mat 58 is not implemented in the implicit version of LS-DYNA that one would ordinarily use for a static
simulation, a dynamic simulation was performed slowly so that the kinetic energy was negligible as compared with the strain energy in the RCC flex specimen. It was found that a total load of 145 pounds applied linearly in time over 30 milliseconds gave reasonable results. The damage parameter in the X-direction (see Figure 4) is shown in Figure 5 for each of the 19 layers versus time for shell element 296 located near the center of the specimen. Note that RCC is weaker in tension than in compression. The history variable in the X-direction jumps around 0.025 seconds, which is at a load of about 120 pounds. Failure was noted to occur in the tests at 128 – 130 pounds, which
American Institute of Aeronautics and Astronautics
5

was well predicted as shown in Figure 6. First NDE damage was not detected until about 120 lbs, which corresponds to a damage parameter of 0.9 as shown in Figure 6. The initial failure for the bend tests was always a tension crack in the lower ply. Delamination did not occur, or if it did occur, it occurred very late in the loading sequence. For dynamic tests, where NDE damage that looks like internal delamination does occur early in the damage sequence, the maximum damage parameter for NDE-detectable damage ranged from around 0.9 to 0.98, with values 0.95 – 0.97 being typical.
Figure 5. Damage parameter for a center element 296 versus time.
D. Test Setup - Foam Ballistic Impact Data from a series of ballistic tests conducted at NASA GRC were compared with analyses using both BX-250
and BX-265 foam models. The ballistic test consisted of shooting a 1.25-inch by 3.00-inch cylindrical foam projectile onto an aluminum plate instrumented with load cells2. The aluminum plate was oriented at angles of 10, 15, 23, and 90 degrees. The foam projectile speeds were approximately 700 and 800 feet per second. E. Model Description – Foam Ballistic Impact
The external tank foam material representation for the projectile used the Mat 83 MAT_FU_CHANG_FOAM model6. Strain rate effects were found to be important in the foam material at the velocities of interest. The external tank foam is a closed-cell polyurethane foam that is sprayed onto the tank in layers. The material strength is direction-dependent with the “rise-direction” having the greatest crush strength. High strain-rate data for the Fu-Chang model was generated in a specially configured and instrumented 14-ft. bungee-assisted drop tower at the Impact Dynamics Research Facility at NASA Langley that can achieve strain rates of over 400/s (see Figure 2). The high strain-rate data were directly input into the Fu-Chang model. Different foam models were created for different orientations and for different temperatures. A series of curves for the BX-265 room temperature foam model is shown in Figure 7.
American Institute of Aeronautics and Astronautics
6

0
0.1
0.2
0.3
0.4
0.5
0.6
0.7
0.8
0.9
1
0 20 40 60 80 100 120
hv2xypairs.txtMax_HV2Maximum Damage Parameter
Load, lb
Figure 6. Maximum damage parameter versus load (bottom ply). Load, lb.
Strain (in/in)
Figure 7. Foam model for BX-265 in the rise direction for room temperature. Note tension is negative.
American Institute of Aeronautics and Astronautics
7
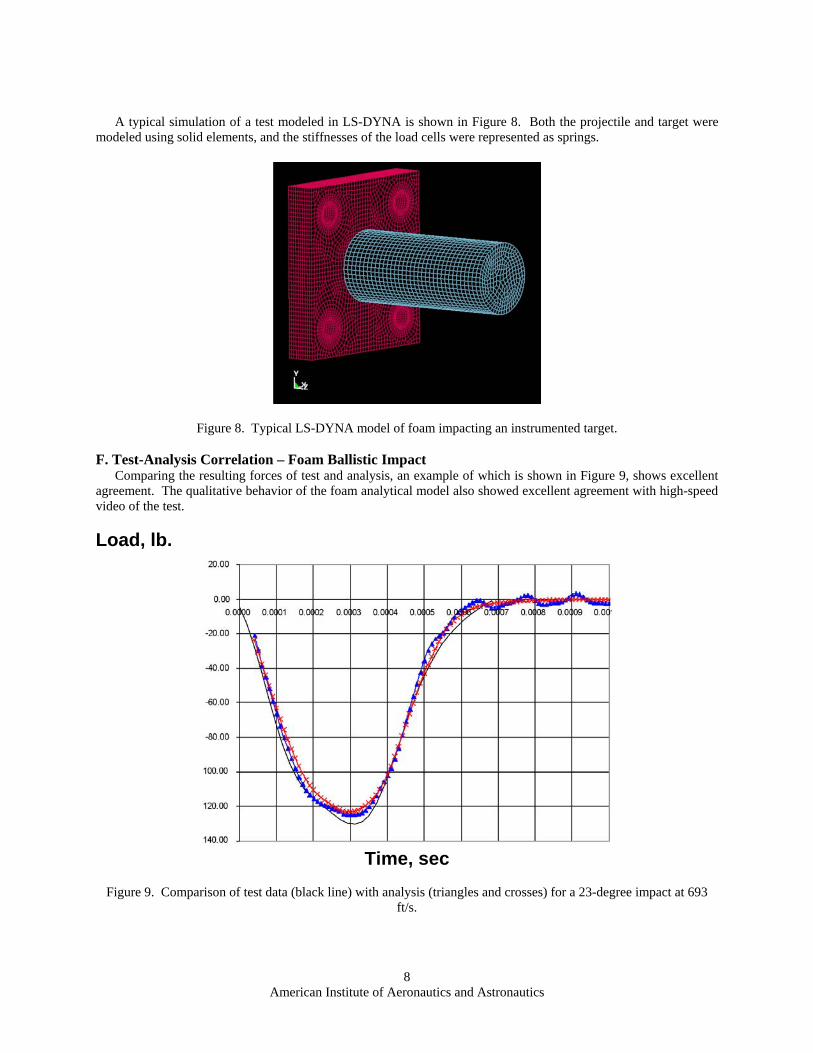
A typical simulation of a test modeled in LS-DYNA is shown in Figure 8. Both the projectile and target were
modeled using solid elements, and the stiffnesses of the load cells were represented as springs.
Figure 8. Typical LS-DYNA model of foam impacting an instrumented target. F. Test-Analysis Correlation – Foam Ballistic Impact
Comparing the resulting forces of test and analysis, an example of which is shown in Figure 9, shows excellent agreement. The qualitative behavior of the foam analytical model also showed excellent agreement with high-speed video of the test. Load, lb.
Time, sec
Figure 9. Comparison of test data (black line) with analysis (triangles and crosses) for a 23-degree impact at 693
ft/s.
American Institute of Aeronautics and Astronautics
8

III. Level 2 Validation Tests A. Test Set-up - Flat Plates
A series of tests were conducted at NASA GRC starting in June 2004 in which a cylindrical foam projectile impacted 6x6-in. RCC flat panels. The panels had 19 plies with a nominal total thickness of 0.233-inches. Foam impact tests were conducted at a normal (90-degree) incident angle to the panel and at a 45-degree incidence angle. The foam was shot from an air-gun into a vacuum box that contained the framed panel. The panel was restrained around the perimeter by half-round aluminum rods that “framed” the specimen. A post-test photograph of the backside of one of the panels is shown in Figure 10. Some backside coating loss is evident. Since the RCC must preserve its SiC coating to survive re-entry, any coating loss on the front side of the panel is significant. The speckle finish on the backside of the panel is a sprayed-on pattern that is used by the Aramis photogrammetric measurement tool. High-speed video cameras were used in conjunction with software to determine the displacement of the panel in three dimensions.
Figure 10. Post-test photograph of the backside of a 6x6-in. RCC flat panel. Coating loss is evident at the center.
The tests were conducted according to procedures developed when the onset of RCC damage was specified as a through-crack. For this reason, most of the impacts exceeded the updated threshold using the onset of NDE-detectable damage instead. Only the results for the 45° impacts are included in this section because: 1) more impacts at the new threshold defined as the onset of NDE-detectable damage exist for 45° impacts; and 2) a glancing impact is much more likely than a normal impact, based on debris transport results.
The 45° test configuration including a foam projectile just prior to impact is shown in Figure 11. In each test, the RCC panel had dimensions 5.95 x 5.95-in. with a nominal thickness of 0.233-inches. The plate thicknesses have been observed to vary from 0.21 to 0.24 inches. The panels were constrained on the upper and lower surfaces with aluminum half-round rods located 0.16 inches from the four edges. The BX-265 foam projectiles were nominally 1.5 inches in diameter and 3.0 inches long with a mass of 3.0 grams. The following information was also acquired for each test: impact velocity, pre- and post-test photographs, pre- and post-test non-destructive evaluations, and dynamic displacements using the Aramis photogrammetry system. B. Model Description - Flat Plates
A typical model of an LS-DYNA simulation of the impact of a 1.25-in. diameter foam cylinder onto a 6x6-in. flat plate of 19-ply RCC material is shown in Figure 12. Various boundary conditions were simulated to bound the actual response. The flat plate was restrained at 0.1625-in. from the edges by round aluminum rods in a picture-frame configuration. Thus, the nominal dimensions of the model were 5.675-in. x 5.675-in. The units used in the LS-DYNA model for length, mass, and time were inch, pound/g, and seconds. The RCC plate was 6 x 6 in., with a shell element edge length of 0.1 in. Idealized boundary conditions were applied at the locations matching the test. Specifically, the out-of-plane displacements were constrained along three edges as represented by the dashed lines in Figure 12. The displacements, both out-of-plane and in-plane perpendicular to Line A-A, were constrained. No rotations were constrained at the boundaries. The RCC material properties and plate thickness were adjusted for
American Institute of Aeronautics and Astronautics
9

each impact to agree with test documentation. The foam projectile was modeled as room-temperature, BX-265 foam using 5250 solid elements. The foam dimensions were 1.5 inches in diameter and 3.0 inches long. The density of the projectile foam was varied to match the test-specific projectile masses. The RCC material was characterized using the LS-DYNA Mat 58 material model.
Figure 11. Photograph of 45-degree foam impact onto 6-in.square RCC plate.
Figure 12. LS-DYNA model of foam cylinder impacting RCC panel at 45-degrees.
American Institute of Aeronautics and Astronautics
10

C. Test-Analysis Correlation – Flat Plates A comprehensive, systematic approach was used for the test-analysis correlations. A review of the test data
indicated that high-quality data were acquired. For example, the deflection data indicated that the panel responses were symmetric about the velocity line of symmetry (see Figure 12). The quantitative correlations, shown in Figure 13, were based on a comparison of displacements at nine locations on the panel as identified in Figure 12. These locations form a grid with coordinates of x,y = 0, ±0.9 inches from the center. In addition to the quantitative correlations, qualitative correlations of end-state damage are shown in Figures 14 and 15. The experimental damage is based on post-test photographs and NDE results. Analytically, the damage is presented as maximum damage parameters generated by the Mat 58 RCC model. The damage parameters represent the accumulation of damage in each of the 19 plies of the RCC material.
Detailed test-analysis correlations were performed for each test. An example of correlation results is shown in Figure 13 for test R285_10, which occurred at 1837 ft/s. This particular test was selected because the damage is very close to the NDE-detectable limit. Several things should be noted. Symmetric locations are plotted on the same figure in the left-hand column. The symmetry in the simulation is nearly ideal and therefore no distinction is discernible for the analytical results. The difference in the experimental results for symmetric locations is small indicating that a nearly symmetric response was measured. The figures in the right-hand column show comparisons for the middle locations. The comparison of the time histories is very close for all locations.
Figure 13. Sample comparison of experimental data and analytical results for
test R285-10 @ 1837 ft/s.
The tests conducted at impact velocities less than 2000 ft/s did not exhibit a significant amount of NDE-detectable damage. The difference in maximum displacements between test and analysis for these tests ranged from
American Institute of Aeronautics and Astronautics
11
1% - 19% with 75% of the comparisons having an error less than 15%. In general, the lower corners are more accurately predicted than the upper corners.
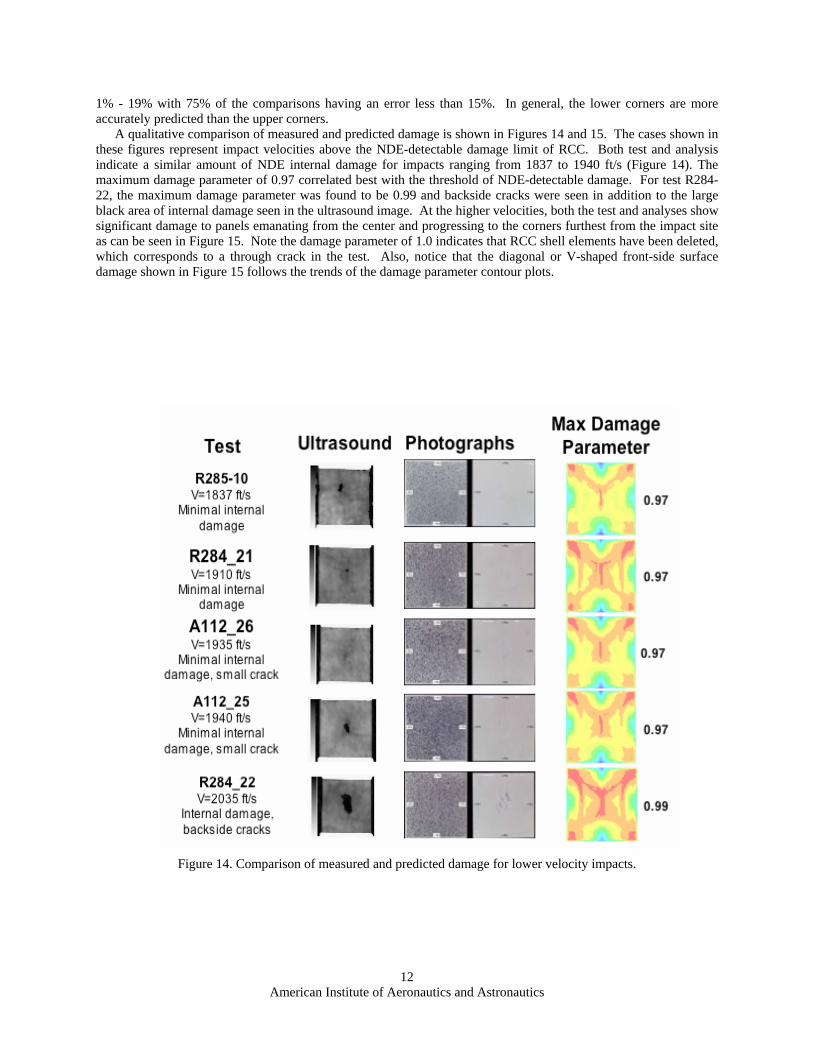
A qualitative comparison of measured and predicted damage is shown in Figures 14 and 15. The cases shown in these figures represent impact velocities above the NDE-detectable damage limit of RCC. Both test and analysis indicate a similar amount of NDE internal damage for impacts ranging from 1837 to 1940 ft/s (Figure 14). The maximum damage parameter of 0.97 correlated best with the threshold of NDE-detectable damage. For test R284-22, the maximum damage parameter was found to be 0.99 and backside cracks were seen in addition to the large black area of internal damage seen in the ultrasound image. At the higher velocities, both the test and analyses show significant damage to panels emanating from the center and progressing to the corners furthest from the impact site as can be seen in Figure 15. Note the damage parameter of 1.0 indicates that RCC shell elements have been deleted, which corresponds to a through crack in the test. Also, notice that the diagonal or V-shaped front-side surface damage shown in Figure 15 follows the trends of the damage parameter contour plots.
Figure 14. Comparison of measured and predicted damage for lower velocity impacts.
American Institute of Aeronautics and Astronautics
12
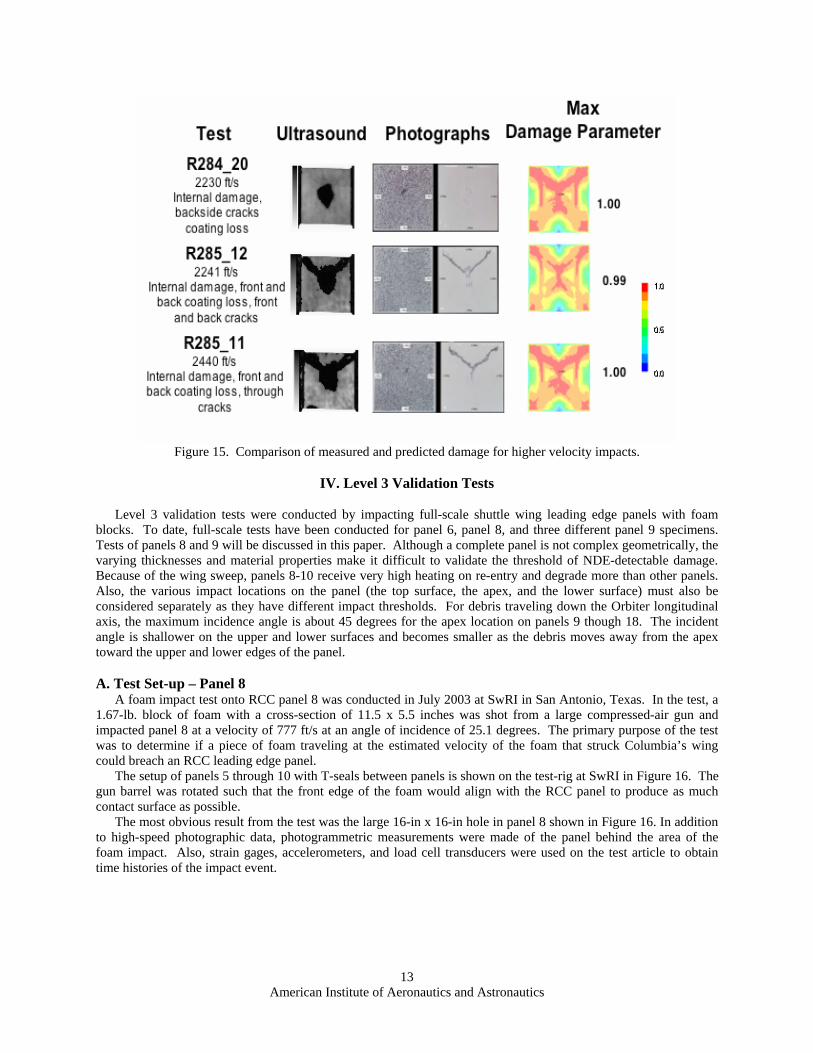
Figure 15. Comparison of measured and predicted damage for higher velocity impacts.
IV. Level 3 Validation Tests
Level 3 validation tests were conducted by impacting full-scale shuttle wing leading edge panels with foam
blocks. To date, full-scale tests have been conducted for panel 6, panel 8, and three different panel 9 specimens. Tests of panels 8 and 9 will be discussed in this paper. Although a complete panel is not complex geometrically, the varying thicknesses and material properties make it difficult to validate the threshold of NDE-detectable damage. Because of the wing sweep, panels 8-10 receive very high heating on re-entry and degrade more than other panels. Also, the various impact locations on the panel (the top surface, the apex, and the lower surface) must also be considered separately as they have different impact thresholds. For debris traveling down the Orbiter longitudinal axis, the maximum incidence angle is about 45 degrees for the apex location on panels 9 though 18. The incident angle is shallower on the upper and lower surfaces and becomes smaller as the debris moves away from the apex toward the upper and lower edges of the panel. A. Test Set-up – Panel 8
A foam impact test onto RCC panel 8 was conducted in July 2003 at SwRI in San Antonio, Texas. In the test, a 1.67-lb. block of foam with a cross-section of 11.5 x 5.5 inches was shot from a large compressed-air gun and impacted panel 8 at a velocity of 777 ft/s at an angle of incidence of 25.1 degrees. The primary purpose of the test was to determine if a piece of foam traveling at the estimated velocity of the foam that struck Columbia’s wing could breach an RCC leading edge panel.
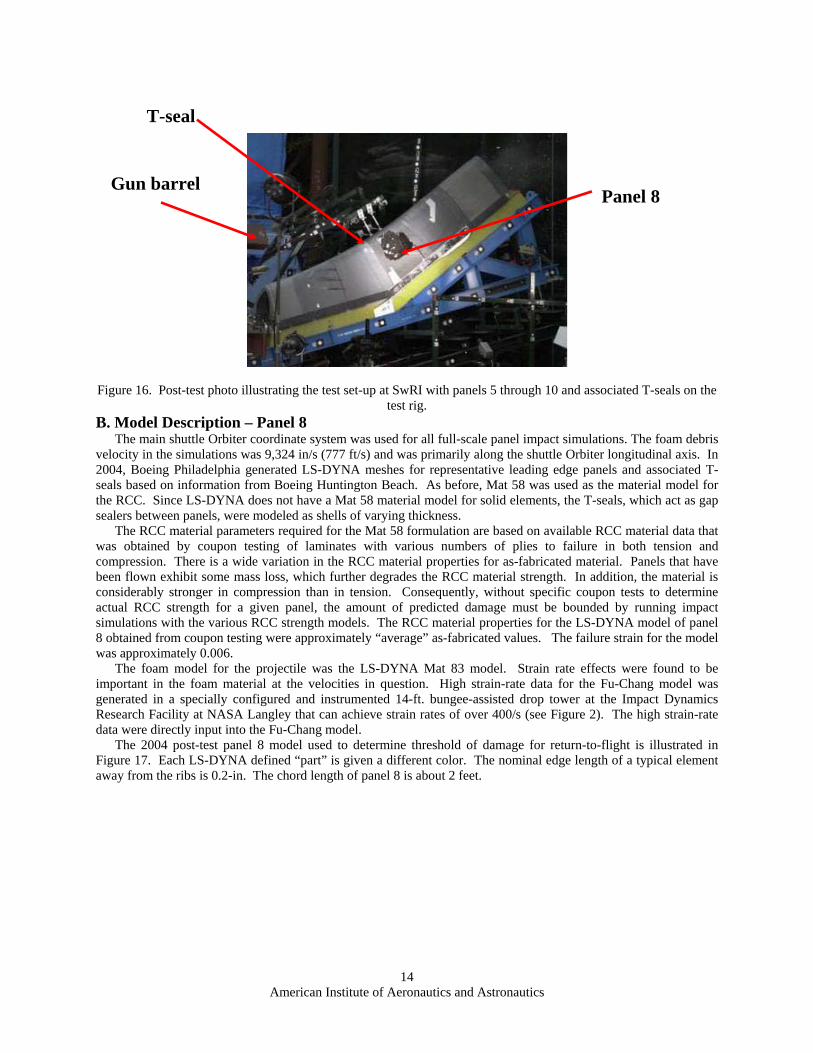
The setup of panels 5 through 10 with T-seals between panels is shown on the test-rig at SwRI in Figure 16. The gun barrel was rotated such that the front edge of the foam would align with the RCC panel to produce as much contact surface as possible.
The most obvious result from the test was the large 16-in x 16-in hole in panel 8 shown in Figure 16. In addition to high-speed photographic data, photogrammetric measurements were made of the panel behind the area of the foam impact. Also, strain gages, accelerometers, and load cell transducers were used on the test article to obtain time histories of the impact event.
American Institute of Aeronautics and Astronautics
13
T-seal
Figure 16. Post-test photo illustrating the test set-up at SwRI with panels 5 through 10 and as
test rig. B. Model Description – Panel 8
The main shuttle Orbiter coordinate system was used for all full-scale panel impact simulavelocity in the simulations was 9,324 in/s (777 ft/s) and was primarily along the shuttle Orbit2004, Boeing Philadelphia generated LS-DYNA meshes for representative leading edge paseals based on information from Boeing Huntington Beach. As before, Mat 58 was used asthe RCC. Since LS-DYNA does not have a Mat 58 material model for solid elements, the T-sealers between panels, were modeled as shells of varying thickness.
The RCC material parameters required for the Mat 58 formulation are based on available was obtained by coupon testing of laminates with various numbers of plies to failurecompression. There is a wide variation in the RCC material properties for as-fabricated matbeen flown exhibit some mass loss, which further degrades the RCC material strength. In aconsiderably stronger in compression than in tension. Consequently, without specific couactual RCC strength for a given panel, the amount of predicted damage must be boundsimulations with the various RCC strength models. The RCC material properties for the LS-8 obtained from coupon testing were approximately “average” as-fabricated values. The failwas approximately 0.006.
The foam model for the projectile was the LS-DYNA Mat 83 model. Strain rate effimportant in the foam material at the velocities in question. High strain-rate data for thegenerated in a specially configured and instrumented 14-ft. bungee-assisted drop tower atResearch Facility at NASA Langley that can achieve strain rates of over 400/s (see Figure 2data were directly input into the Fu-Chang model.
The 2004 post-test panel 8 model used to determine threshold of damage for return-toFigure 17. Each LS-DYNA defined “part” is given a different color. The nominal edge lengaway from the ribs is 0.2-in. The chord length of panel 8 is about 2 feet.
American Institute of Aeronautics and Astronautics
14
Panel 8
Gun barrelsociated T-seals on the
tions. The foam debris er longitudinal axis. In nels and associated T- the material model for seals, which act as gap
RCC material data that in both tension and erial. Panels that have ddition, the material is pon tests to determine ed by running impact DYNA model of panel ure strain for the model
ects were found to be Fu-Chang model was the Impact Dynamics ). The high strain-rate
-flight is illustrated in th of a typical element
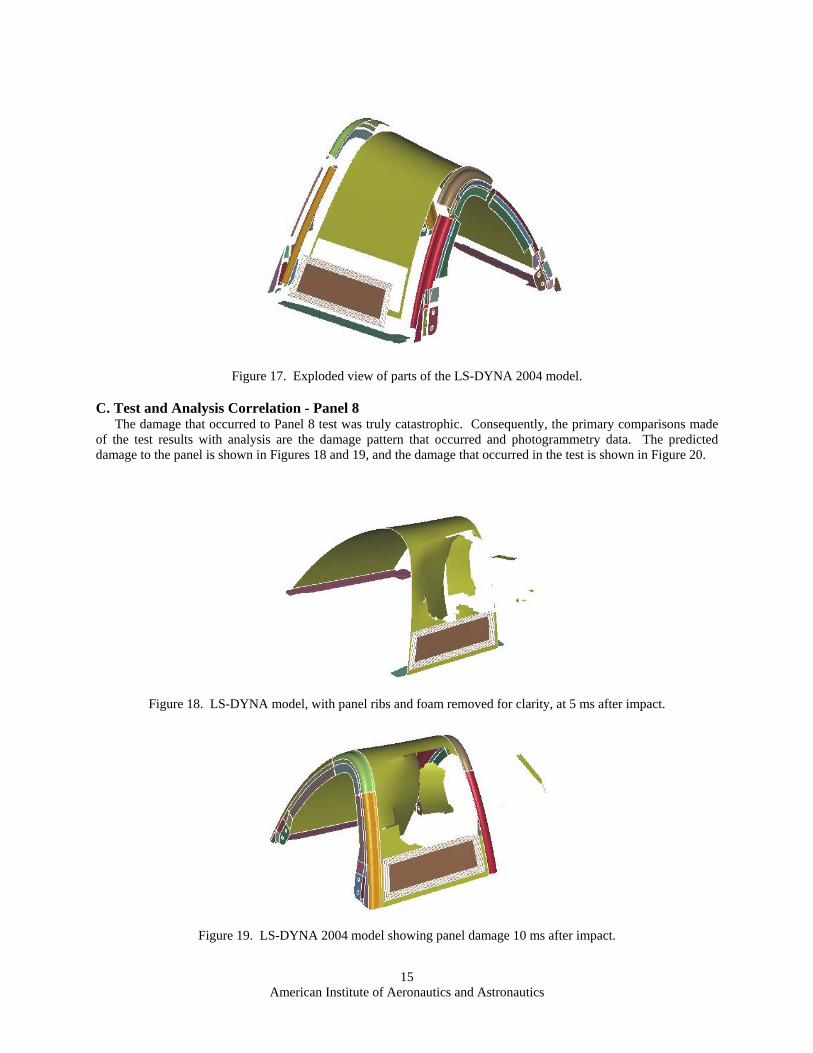
Figure 17. Exploded view of parts of the LS-DYNA 2004 model.
C. Test and Analysis Correlation - Panel 8 The damage that occurred to Panel 8 test was truly catastrophic. Consequently, the primary comparisons made
of the test results with analysis are the damage pattern that occurred and photogrammetry data. The predicted damage to the panel is shown in Figures 18 and 19, and the damage that occurred in the test is shown in Figure 20.
Figure 18. LS-DYNA model, with panel ribs and foam removed for clarity, at 5 ms after impact.
Figure 19. LS-DYNA 2004 model showing panel damage 10 ms after impact.
American Institute of Aeronautics and Astronautics
15

12-inch ruler
Figure 20. Panel debris showing photogrammetric targets on the back side (left) and the damage to panel 8 (right).
The three-dimensional motion of over 100 optical targets on the inside of panel 8 were tracked using
photogrammetry (Figure 21). The motion was tracked semi-automatically using two Phantom 5 digital video cameras that captured 2,000 to 7,000 frames per second. The videos were analyzed by the Image Science and Analysis Group (ISAG) at the NASA Johnson Space Center (JSC). The ISAG examined the position and velocity of each point looking for discontinuities in its trajectory. Spatial continuity was then assessed by comparing the motion of each point with other points in the same row and column.
Area selected for comparison
Local x
Local y
Figure 21. Location of photogrammetric targets on Panel 8 prior to impact. Box outlined in black indicates area of interest.
Since the local axis system shown in Figure 21 did not align with the model axes, the photogrammetric data were further processed to obtain the resultant displacement of each point versus time. Resultant displacement, a scalar quantity independent of the coordinate system, was used for the comparisons with the analysis because of the uncertainty in the coordinate transformation between the measured data and the finite-element model.
The experimental resultant displacements were then plotted as contour plots and compared with the LS-DYNA predicted resultant displacement contours for the interval of 0.5 ms before impact until 3.68 ms after impact, which
American Institute of Aeronautics and Astronautics
16

is the last data point that existed for all of the selected points. A typical comparison of test with analysis is shown in Figure 22 at 2 ms after the foam impact.
Figure 22. Comparison of measured (left) and predicted (right) deflections at 2 ms after foam impact. The maximum deflection contour for both plots is 1.2 inches.
The deflections measured using photogrammetry compare well with the analytical results and thus can be used to
evaluate the simulation results up to the point where the measured data is no longer available. It is assumed that by 3 ms the panel had catastrophically failed. With the success of the Aramis photogrammetric system demonstrated in the Level 2 testing of the 6-in. x 6-in. plates, full-scale panel testing also began using the Aramis system in 2004. D. Test Set-up – Panel 9
Additional Level 3 testing and analysis are in progress to aid in validating LS-DYNA predictions of the RCC threshold of NDE-detectable damage. Panel 9 is one of the most critical panels because it is subjected to very high heating on re-entry, can be hit by debris on ascent, and the incident angle of debris traveling along the Orbiter longitudinal axis is large compared with panels 1-7 and panels 17-22. The first test series was conducted using panel 9L-B to determine the threshold of damage for 0.04-lb foam debris, which is slightly above the maximum probable weight of foam debris because the redesigned external tank is not expected to shed foam greater than 0.01 to 0.03 lb. A total of 9 shots were planned onto panel 9L-B, three along the upper surface, three along the apex, and three along the lower surface. Each test location was separated from the others by as much distance as possible, and was usually 4 – 6 inches. Although 9 shot locations were planned (see Figure 23), only 7 tests were actually conducted because of concerns about proximity to previous damage.
For the upper and lower surface and apex, three impact velocities were defined using LS-DYNA predictions. The lowest impact velocity should produce no detectable damage, the middle impact velocity should have a 50% chance of producing damage such as delamination, and the highest impact velocity should produce severe damage such as a through crack. The projectile was a block of BX-265 foam with dimensions 2 in. x 4 in. x ~4 in. long weighing 0.044lbs. To account for foam density variations, the lengths of the blocks were adjusted so that the weight of each block was 0.044 lbs.
American Institute of Aeronautics and Astronautics
17

Figure 23. The location of the 9 foam impact tests onto panel 9.
E. Pre-Test Threshold Predictions – Panel 9
Since the RCC material properties of a given panel are unknown, pre-test LS-DYNA predictions used minimum and maximum as-fabricated material properties to bound the amount of likely damage. In addition to material property uncertainties, the thickness of the RCC can vary from location to location on the panel. However, since the panel thickness variation for the 19-ply area was unknown, the thickness variation was neglected. The first three shots were to produce no NDE-detectable damage. Tests at location 1, 2, and 3 used minimum as-fabricated properties to ensure no NDE-detectable damage should occur. The target velocities for locations 1, 2, and 3 were predicted to be 1150-, 1000-, and 950-ft/s, respectively. The velocities achieved were 1160, 1042, and 965 ft/s. No damage of any type was observed post-test. Shots 4, 5, and 6, were designed to have a 50% probability of producing detectable damage. Using a maximum damage parameter of approximately 0.9, the predicted velocities were 1775, 1625, and 1375 ft/s, and the test velocities achieved were 1778, 1609, and 1419 ft/s, respectively. The most severe damage was an 8-in. long crack with delamination that was observed at location 4 on the lower surface. At location 5 on the upper surface, there was crushed c , no damage was detected. Thus, the 50%
robability of producing damage was subst ft/s was at location 9 on the apex. An 8-.
with the test results and damage parameters were monitored to assist in
oating. However, at location 6antiated. The final shot at 1511p
in long crack with an associated 10-in. x 2-in. area of NDE-detectable internal damage was observed post-test. Testing was stopped after seven shots because panel 9L-B was so damaged that any further tests would be questionable. F. Test-Analysis Correlation – Panel 9
Test-analysis correlations for the panel 9L-B tests are still in progress because material properties of the panel have not yet been determined. The panel was cut into sections and the samples cut from these sections will be measured for thickness and for strength.
V. Discussion of Results
A systematic test and analysis program was developed to validate LS-DYNA predictions of the threshold of damage to shuttle Orbiter wing leading edge RCC panels from high-speed foam impacts. First, level 1 tests were performed to validate the separate material models of the RCC and foam. The level 1 three-point beam bending test showed that maximum damage parameters exceeding 0.9 produced NDE-detectable damage. Next, level 2 tests of foam impacts onto 6-in. x 6-in. RCC flat panels were conducted using pre-test LS-DYNA predictions to determine the test velocity. The tests were conducted to produce no-damage, NDE-detectable damage, and a through crack. The LS-DYNA model was correlated
American Institute of Aeronautics and Astronautics
18

predicting the minimum velocity needed to produce NDE-detectable damage. A maximum damage parameter of 0.97 correlated well with the threshold of NDE-detectable damage. Although the model was developed to simulate threshold of damage, the model was u si damage of RCC panel 8 produced by the SwRI impact test sponsored by the CAIB. The amount of damage predicted by LS-DYNA, including the resulting 16-
The CAIB requested that NASA determine the current capability of RCC panels to sustain impact. Also, the d that NASA develop physics-based codes to more accurately model RCC impacts than the previous
empirical models. Since RCC wing leadin a ely expensive and are in limited supply, testing to d
the Orbital Debris Investigation Assessment Team (ODIAT). ther individuals that deserve special mention are team members Jonathon Gabrys, Jason Firko, Josh Schatz, and y Lee of Boeing Philadelphia who developed the finite element meshes and who ran thousands of LS-DYNA
sim lations. We also thank Ronny Baccus of NASA JSC who provided hard-to-find RCC material information to the team.
VIII. References 1Gehman, H. W., et al, “Columbia Accident Investigation Board,” Report Volume 1, U. S. Government Printing
Office, Washington, DC, August 2003. 2Carney, K., Melis, M., Fasanella, E., Lyle, K, and Gabrys, J., “Material Modeling of Space Shuttle Leading
Edge and External Tank Materials for Use in the Columbia Accident Investigation.” Proceedings of 8th International LS-DYNA User’s Conference, Dearborn, MI, May 2-4, 2004.
3Melis, M., Carney, K., Gabrys, J., Fasanella, E., and Lyle, K., “A Summary of the Space Shuttle Columbia Tragedy and the Use of LS-DYNA in the Accident Investigation and Return to Flight Efforts.” Proceedings of 8th International LS-DYNA User’s Conference, Dearborn, MI, May 2-4, 2004.
4Gabrys, J., Schatz, J., Carney, K., Melis, M., Fasanella, E., and Lyle, K., “The Use of LS-DYNA in the Columbia Accident Investigation.” Proceedings of 8th International LS-DYNA User’s Conference, Dearborn, MI, May 2-4, 2004.
sed to mulate the catastrophic
in. square hole in panel 8 and the approximate shape of RCC debris, correlated well with the experiment. Finally, the threshold velocities for 0.044-lb foam impacts onto full-scale RCC panel 9L-B were predicted, and seven tests were conducted. Even without knowing exact material properties and panel thickness variations, the test results closely matched the LS-DYNA predictions of damage.
VI. Concluding Remarks
CAIB suggesteg-edge p nels are extrem panel threshold of impaetermine the current shuttle fleet’s RCC ct damage to different types, sizes, and shapes of
debris is not practical or even possible. Consequently, a program was conducted to enable relatively accurate predictions of the impact tolerance of the shuttle leading-edge wing panels using the “physics-based” code LS-DYNA. Accurate predictions of impact damage from insulating foam and other debris strikes that can occur during launch required materials characterization of probable debris, including strain-rate effects. The LS-DYNA Fu-Chang foam model with rate-effects was used to characterize the foam material properties, and the MAT_LAMINATED_COMPOSITE_FABRIC with a cumulative damage failure model was used to characterize the complex RCC material. Level 1 validation of the model was conducted for the individual foam and RCC materials. Lev l 2 validation was achieved by test-analysis correlation of foam impe acts onto 6-in. x 6-in. flat RCC plates. Level 3 test-analysis correlation was performed on the CAIB full-scale panel 8 test. Recently a series of foam impact tests were performed successfully on full-scale RCC panel 9L-B using LS-DYNA predicted velocity thresholds. The test-validated return-to-flight LS-DYNA “physics based” models are now used as a predictive tool for characterizing the threshold of NDE-detectable damage for impacts of both foam and ice onto the RCC leading edge panels, nose cap, and chin panel.
VII. Acknowledgements
The work described in this paper was performed by the RCC Impact Damage Threshold Assessment Team. Special thanks go to Dr. Darwin Moon and Evelyn “Jo” Guthery of Boeing, our team leaders, and to Douglas White
f USA and Charles Shaw of JSC, who together leadoOR an
u
American Institute of Aeronautics and Astronautics
19

American Institute of Aeronautics and Astronautics
20
P
5PLyle, K., Fasanella, E., Melis, M., Carney, K., and Gabrys, J., “Application of Non-Deterministic Methods to
Assess Modeling Uncertainties for Reinforced Carbon-Carbon Debris Impacts.” Proceedings of 8P
thP International
LS-DYNA User’s Conference, Dearborn, MI, May 2-4, 2004. P
6PAnon., “LS-DYNA Keyword User’s Manual Volume I and II – Version 960,” Livermore Software Technology
Company, Livermore, CA, March 2001. P
7PMatzenmiller, A., Lubliner, I. J., and R.L. Taylor, R. L., “A Constitutive Model for Anisotropic Damage in
Fiber-Composites.” Journal of Mechanics and Materials, Vol. 20, pp. 125-152, 1995. P
8PGordon, M. P., “Leading Edge Structural Subsystem and Reinforced Carbon-Carbon Reference Manual.”
Boeing Document KL0-98-088, October 1998.