dynamic fragmentation of an ultra-high strength concrete...
TRANSCRIPT

1
Submitted to the ASCE Journal of Engineering Mechanics, February 2005
Revised, July 2007
Dynamic Fragmentation of an Ultra-High Strength Concrete
during Edge-On Impact Tests
Pascal FORQUIN1,2 and François HILD2,*
1DGA/CTA-Département MSP
16 bis avenue Prieur de la Côte d'Or, F-94114 Arcueil Cedex, France
now at LPMM, CNRS-UMR7554 / Université Paul Verlaine de Metz
Ile du Saulcy, F-57045 Metz Cedex 1, France
2LMT-Cachan, ENS de Cachan / CNRS-UMR 8535 / Université Paris 6
61 avenue du Président Wilson, F-94235 Cachan Cedex, France
*to whom correspondence should be addressed.
Fax: +33 1 47 40 22 40, Email: [email protected]
2
Dynamic Fragmentation of an Ultra-High Strength Concrete
during Edge-On Impact Tests
by
Pascal FORQUIN and François HILD
Abstract:
To understand and model damage generated during impact by a penetrator of ultra-high
strength concrete targets, edge-on impact tests are performed with the so-called Ductal®
concrete, which is unreinforced or reinforced with short fibers. Two edge–on impact
configurations are designed with a dynamic confinement system. The first configuration uses
aluminum projectiles and allows us to study the dynamic fragmentation that spreads out
within the tile without any confined damage close to the impact point. The fragmentation
process is composed of numerous oriented millimetric cracks. In the second configuration,
steel projectiles are used with a higher impact velocity. Damaged zones are visualized by
using an ultra-high speed camera and a sarcophagus configuration designed to prevent the
fragments from moving. The post-mortem studies of impacted tiles enable us to observe an
intense fragmentation of the targets and confined damage close to the impact point if steel
projectiles are used. Simulations are performed with an anisotropic damage model coupled
with a concrete plasticity model. Orientation and crack density are compared with post-
mortem observations.
CE Database Subject Headings:
Cracking, Damage patterns, Dynamic test, Probabilistic models.

3
Introduction
For several years, defense organizations have been interested in the dynamic behavior of new
concrete materials, e.g., Ultra-High Strength Concrete (UHSC). Quasi-static mechanical
properties of concrete have increased considerably in less than 20 years (Malier 1992). The
use of superplastifiers, silica fumes led since the middle of the 1990s to UHSC concrete
materials with a compressive strength of about −200 MPa to be compared with that of
ordinary concrete of about −30 MPa. Research programs that aim at evaluating their ballistic
performance are currently under way. One of the goals is to improve the knowledge and
modeling of these new materials. In the present study, the so-called Ductal® concrete
produced by Lafarge is investigated. Besides its compressive strength (−200 MPa), this
UHSC is of interest to be produced on an industrial scale.
Ductal® concrete is one industrial application of investigations on Reactive Powder
Concrete (RPC) and belongs to the RPC family for its composition and to the USHC family
for its mechanical properties. RPC is characterized by a strict control of the microstructure.
A significant increase of flexural strength and ductility is obtained by adding fibers during the
process. Behloul (1996) studied the influence of different volume fractions of fibers, namely
0%, 1%, 2.4%, 4%. As far as the compressive strength and fracture energy are concerned,
2.4% is the optimal percentage. The influence of fiber orientation on the flexural strength of
RPC was also underlined (Behloul 1996; Boulay et al. 1997). Other studies were performed
by Bayard (2003) who showed the existence of fiber clusters in Ductal® that may induce a
heterogeneous behavior of the material. The aim of the present paper is to investigate the
damage pattern of this class of materials when impacted by a hard projectile.
When a kinetic penetrator hits a thick target made of a brittle material, a compressive
wave propagates in its volume and causes severe degradations. Compressive stresses induce

4
isotropic damage under confined conditions close to the impact point (Forquin 2003).
Moreover, the radial displacement that follows the compressive wave generates hoop tensile
stresses in the target and produces fragmentation (i.e., initiation and propagation of numerous
oriented microcracks). This fragmentation was observed in details during edge-on impact
experiments on monolithic ceramics (Strassburger and Senf 1994; Strassburger et al. 1994;
Riou et al. 1998; Denoual and Hild 2000) and on a porous silicon carbide impregnated or not
with an aluminum alloy (Forquin et al. 2003). The use of an ultra-high speed camera allows
for the observation of a damage pattern made of micro-cracks oriented in the radial direction
that develops from the impact edge to the opposite face. The ceramic tile is mainly damaged
before any wave reflection. An anisotropic damage model was proposed to predict the
orientation and crack density (Denoual and Hild 2000; 2002).
Few hundred microseconds after impact, the projectile penetrates a highly damaged
target. The projectile/target interaction is influenced by the two previous damage regimes.
Their understanding and characterization are essential to describe the projectile penetration
and the target residual strength. To reproduce these damage mechanisms and to validate
damage models, two edge-on impact configurations are designed with a new dynamic
confinement system. Aluminum projectiles are used in the first configuration while steel
projectiles are utilized for the second series of tests. First, the basic quasi-static mechanical
properties of Ductal® are presented in relation with its microstructure. Second, the design of
two edge-on-impact configurations is discussed. Third, ultra-high speed camera observations
and post-mortem studies are examined. Last, the damage regimes are modeled and numerical
simulations are compared with experimental observations.

5
Microstructure and basic mechanical properties of Ductal®
Ductal® by its composition and fabrication belongs to the RPC family. In addition to the use
of superplastifier and silica fumes, an RPC benefits from a reduced grain size (maximum
size < 600 µm) and an optimal granular skeleton that enables one to homogenize the elastic
properties of the grains and the matrix, and to decrease internal stresses (Richard and
Cheyrezy 1995). Grain families are strictly separated by size. For example, the dimension of
fine sand grains in Ductal® is of the order of a few hundred micrometers (Figure 1), followed
by cement grains and crushable quartz grains whose size is about tens of micrometers. A
compact arrangement is obtained by using silica fumes. It enables one to reduce the amount
of water [water / (cement + silica fumes) = 0.13-0.17 in weight] and to minimize the porosity.
The compressive strength is also increased thanks to a small contrast of elastic properties
between the matrix and the grains. It follows that the stress concentrations are reduced at the
interfaces. In its commercial composition, the Ductal® matrix is reinforced by steel fibers
(length: 13 mm, diameter: 0.2 mm, strength: 2400 MPa). In the present study, the role of the
fibers is assessed by looking at ballistic impact experiments. The elastic properties of Ductal®
with or without fibers are obtained by using ultrasound experiments. The velocities of
longitudinal and transverse waves are measured and the elastic properties of an isotropic and
elastic material are deduced (Kolsky 1963). Table 1 summarizes these results. The Young's
modulus of Ductal® reinforced by fibers appears slightly greater than that of Ductal® without
fibers whereas the Poisson’s ratios are identical.
To evaluate the fracture properties under quasi-static loading condition, 3-point flexural
experiments are carried out with beam samples. Beams of size 11 × 10 × 150 mm3 were cut
from a 30 mm high tile. The tensile surface of the beams corresponds to the center plane of
the tile so that a good distribution of fibers (i.e., density and orientation) is expected (Behloul
6
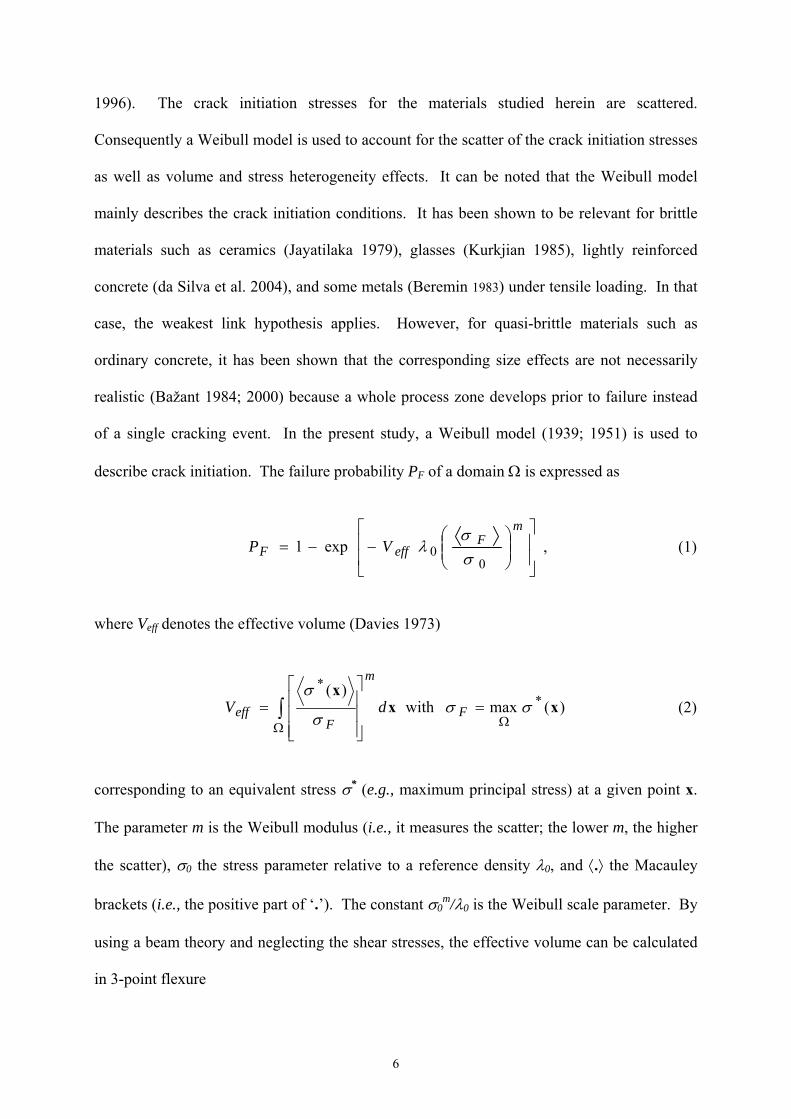
1996). The crack initiation stresses for the materials studied herein are scattered.
Consequently a Weibull model is used to account for the scatter of the crack initiation stresses
as well as volume and stress heterogeneity effects. It can be noted that the Weibull model
mainly describes the crack initiation conditions. It has been shown to be relevant for brittle
materials such as ceramics (Jayatilaka 1979), glasses (Kurkjian 1985), lightly reinforced
concrete (da Silva et al. 2004), and some metals (Beremin 1983) under tensile loading. In that
case, the weakest link hypothesis applies. However, for quasi-brittle materials such as
ordinary concrete, it has been shown that the corresponding size effects are not necessarily
realistic (Bažant 1984; 2000) because a whole process zone develops prior to failure instead
of a single cracking event. In the present study, a Weibull model (1939; 1951) is used to
describe crack initiation. The failure probability PF of a domain Ω is expressed as
⎥⎥
⎦
⎤
⎢⎢
⎣
⎡
⎟⎟⎠
⎞⎜⎜⎝
⎛−−=
mF
effF VP0
0exp1σσ
λ , (1)
where Veff denotes the effective volume (Davies 1973)
)(maxwith)(
**
xxx
σσσ
σ
ΩΩ=
⎥⎥⎥
⎦
⎤
⎢⎢⎢
⎣
⎡= ∫ F
m
Feff dV (2)
corresponding to an equivalent stress σ* (e.g., maximum principal stress) at a given point x.
The parameter m is the Weibull modulus (i.e., it measures the scatter; the lower m, the higher
the scatter), σ0 the stress parameter relative to a reference density λ0, and ⟨.⟩ the Macauley
brackets (i.e., the positive part of ‘.’). The constant σ0m/λ0 is the Weibull scale parameter. By
using a beam theory and neglecting the shear stresses, the effective volume can be calculated
in 3-point flexure

7
( )212 +
=m
VVeff , (3)
where V is the loaded volume (i.e., V = 11 × 10 × 130 mm3). For the Weibull model, the
average failure stress σw is given by
⎟⎠⎞
⎜⎝⎛ +
Γ=−
mmV meffw
1)(1
00 λσσ , (4)
where Γ is the Euler function of the second kind (Abramowitz and Stegun 1965).
Equation (4) accounts for the scatter of the failure stress as well as volume and stress
heterogeneity effects in geomaterials (Hild et al. 2003). Table 1 shows the Weibull moduli m
and average stress σw related to crack initiation. In fiber reinforced Ductal®, crack initiation
may differ from the ultimate strength. Figure 2 shows the maximum tensile stress given by a
beam solution as a function of the crosshead displacement obtained for 3-point flexural tests.
The failure of unreinforced Ductal® is brittle and caused by porosity within the bulk.
Consequently, the crack initiation stress corresponds to the ultimate strength. An example of
failure pattern of unreinforced Ductal® is shown in Figure 3a. A large porosity (≈ 0.6 mm in
diameter) can be seen close to the tensile surface (upper surface of Figure 3a) and is the likely
cause of failure. The flexural behavior of reinforced Ductal® is different. As shown by the
two stress / displacement curves of Figure 2, ‘displacement-hardening’ or ‘displacement-
softening’ is observed. Thus, the load level does not decrease quickly despite crack initiation
that corresponds to the loss of linearity in the stress / displacement curve. As shown in
Figure 3b, the fibers are bridging cracks thereby enhancing the ductility of the material. Even
though the mean ultimate strength is larger (25 MPa) than that of unreinforced Ductal® (22
MPa), the mean crack initiation stress (17 MPa) is lower. This result is probably the
consequence of an excess of large porosities and fiber clusters in reinforced Ductal® in

8
comparison with the unreinforced material. The porosity is trapped in the reinforced material
during the vibration process. Furthermore, while the crack initiation stress scatter of
reinforced Ductal® is quite small (i.e., m = 14) and close to the unreinforced material (i.e.,
m = 11, see Table 1), the scatter in terms of ultimate strength is much more important (i.e.,
m = 3.4). This phenomenon is due to a heterogeneous distribution (density and orientation) of
fibers in the material. The existence of fiber clusters decreases the properties of the
reinforced concrete (Bayard 2003).
Design of edge-on impact tests
Tensile multiple-cracking is one of the major degradation mechanisms that occur during
impact of a rigid projectile against a thick target made of a brittle material such as concrete,
glass or ceramic materials. However, the kinetics and density of cracking are difficult to
study since such damage takes place in the bulk of the target. This is why, laboratory impact
tests called Edge-On Impact (EOI) were developed by the Ernst-Mach-Institute (EMI) in
Germany (Hornemann et al. 1984; Strassburger et al. 1994) and by the Centre Technique
d'Arcueil (CTA) in France (Denoual et al. 1998; Riou et al. 1998). During such test, a
cylindrical projectile hits the edge of a tile for which the thickness is close to the projectile
diameter. In the wake of the compressive wave, tensile hoop stresses develop within the
target, a consequence of the radial motion due to the compressive wave. A high-strain-rate
tensile loading (in the range of some hundreds to thousands of s-1) is obtained far away from
the impact point (at a distance of up to ten diameters of the projectile). The damage
mechanism is similar to that induced in real impact configurations (Denoual et al. 1996).
However, the visualization of damage is easier to perform than for thick targets.
In the present study, new configurations of edge-on impact tests were designed to analyze
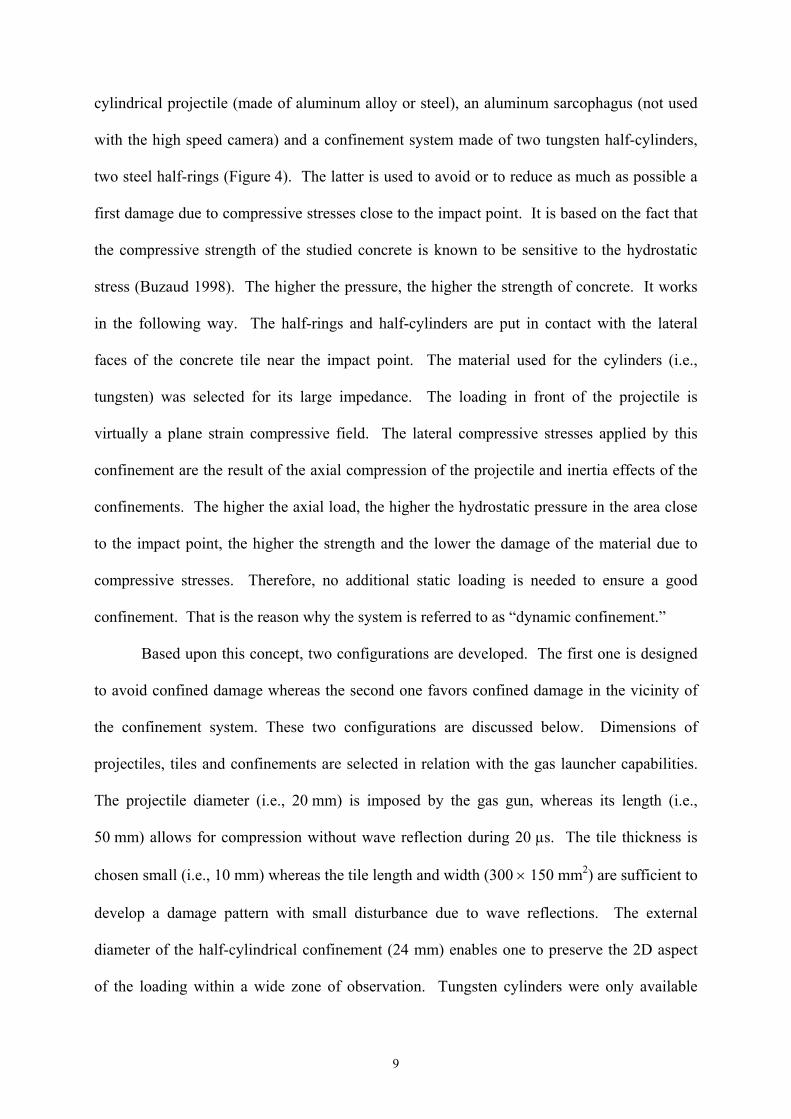
damage regimes in Ductal® tiles. These configurations are composed of a concrete tile, the
9
cylindrical projectile (made of aluminum alloy or steel), an aluminum sarcophagus (not used
with the high speed camera) and a confinement system made of two tungsten half-cylinders,
two steel half-rings (Figure 4). The latter is used to avoid or to reduce as much as possible a
first damage due to compressive stresses close to the impact point. It is based on the fact that
the compressive strength of the studied concrete is known to be sensitive to the hydrostatic
stress (Buzaud 1998). The higher the pressure, the higher the strength of concrete. It works
in the following way. The half-rings and half-cylinders are put in contact with the lateral
faces of the concrete tile near the impact point. The material used for the cylinders (i.e.,
tungsten) was selected for its large impedance. The loading in front of the projectile is
virtually a plane strain compressive field. The lateral compressive stresses applied by this
confinement are the result of the axial compression of the projectile and inertia effects of the
confinements. The higher the axial load, the higher the hydrostatic pressure in the area close
to the impact point, the higher the strength and the lower the damage of the material due to
compressive stresses. Therefore, no additional static loading is needed to ensure a good
confinement. That is the reason why the system is referred to as “dynamic confinement.”
Based upon this concept, two configurations are developed. The first one is designed
to avoid confined damage whereas the second one favors confined damage in the vicinity of
the confinement system. These two configurations are discussed below. Dimensions of
projectiles, tiles and confinements are selected in relation with the gas launcher capabilities.
The projectile diameter (i.e., 20 mm) is imposed by the gas gun, whereas its length (i.e.,
50 mm) allows for compression without wave reflection during 20 µs. The tile thickness is
chosen small (i.e., 10 mm) whereas the tile length and width (300 × 150 mm2) are sufficient to
develop a damage pattern with small disturbance due to wave reflections. The external
diameter of the half-cylindrical confinement (24 mm) enables one to preserve the 2D aspect
of the loading within a wide zone of observation. Tungsten cylinders were only available

10
with a 13-mm diameter. Consequently, half-rings made of steel are placed side by side the
tungsten half-cylinders (Figure 4).
The two configurations are analyzed by performing numerical simulations with the
explicit FE code Pamshock (2001). At this stage of design, a simple constitutive equation is
used. This modeling aims at evaluating tensile stresses within the tile and compressive
stresses beyond the confined area, thus a model able to describe the ultimate strength in the
confined zone is needed. Triaxial compression tests were performed on Ductal® concrete
(Buzaud 2003; Forquin 2003). The ‘deviatoric’ strength observed under high pressure
(|P| ≥ 200 MPa) was almost constant and axial strains can reach up to 10%. Consequently, an
elastoplastic model following a J2 flow rule is chosen for the target with a yield stress σy
equal to 400 MPa. This value corresponds to the strength of an UHSC in quasi-oedometric
compression (Buzaud 2003; Forquin 2003). The mesh used is shown in Figure 5a. This
computation shows that when an aluminum projectile is used the von Mises equivalent stress
remains less than the yield stress in the confined zone (Figure 5b) and the minimum principal
stress level remains less than the compressive strength (i.e., −220 MPa) beyond the confined
area. Consequently, it is expected that confined damage should not occur in this first
configuration.
In the second case utilizing a steel projectile, the von Mises equivalent stress reaches
400 MPa up to 20 mm in front of the impact point and the minimum principal stress exceeds
the −220-MPa limit for a distance greater than 40 mm from the impact point (Figure 5c).
Two damaged zones are expected to occur. Damage due to confined compression in the first
area below the dynamic confinement (i.e., up to 20 mm from the impact point), a damage
representative of a weakly confined compression in the second area (20-40 mm from the
impact point) that may be coupled with a dynamic fragmentation process. Even when the first
configuration is used, the pressure reaches the 350-MPa level in the confined zone 8 µs after
11
impact and confirms the usefulness of the dynamic confinement (Figure 5d). As was
observed during the above-mentioned triaxial compression tests, the strength of Ductal®
increases with the pressure to reach less than −400 MPa for a 300-MPa pressure (Buzaud
2003; Forquin 2003).
Use of an ultra-high speed camera
An ultra-high speed camera was used to visualize the development of the fragmentation
process. Figure 6 shows a schematic of the experimental set-up. A sarcophagus is put in an
aluminum container. The projectile speed is measured by two optical cells 50 mm apart.
When the projectile reaches the second cell, flashes are triggered and when it impacts the
edge of the target, the camera is activated to take pictures. To increase contrast, the ultra-high
speed camera is aligned along the reflection axis of the flashlights and the concrete tiles are
slightly polished. The region of interest is reduced (60 mm) to facilitate the observation of
damage.
Only steel projectiles were used with an impact velocity close to 130 m/s. Damage
appears 12 µs after impact (Figures 7a, 7b) and curved cracks develop until 20 µs after
impact. Then, the damage zone darkens and probably moves from the observed plane. This
compressive damage develops within a zone localized at a distance less than 40 mm from the
impact point. Furthermore, 44 µs after impact, straight radial cracks appear corresponding to
the dynamic fragmentation process. This second damage process spreads out all over the
observed window. Spall cracks, oriented perpendicularly to the projectile axis, are observed
44 µs after impact 70 mm from the impact point. The distance between spall cracks and the
rear edge (60 mm) corresponds approximately to the projectile length (50 mm). The time to
initiation is consistent with a wave velocity close to 5000 m/s (38 µs are required to travel
190 mm). A lower crack density seems to occur for a reinforced material (6 radial cracks and

12
1 spall crack are seen in Figure 7b, as opposed to 11 radial cracks and 6 spall cracks,
Figure 7a). As the post-mortem study will show, fibers may reduce the crack openings
without actually modifying the crack density.
Post-mortem studies of edge-on impact tests
A so-called sarcophagus configuration is used (Denoual et al. 1998) to maintain the fragments
in place and to observe the macroscopic and microscopic post-mortem cracking pattern
(Figure 4). The impedance of the aluminum confinement needs to be less than that of the
concrete tile so that the “confinement” does not interfere with the impacted tile. After impact,
the sample is infiltrated by a hyper-fluid resin and polished for macroscopic and microscopic
analyses (Figure 8).
The first post-mortem study corresponds to an edge-on impact by an aluminum
projectile with a velocity of 88 m/s (Figure 8a). Different zones can be separated with respect
to the cracking pattern and density. Two zones appear intact corresponding to the contact
surface of the tungsten half-cylinder and the steel half-ring. As predicted by the numerical
simulation, the dynamic confinement prevents damage to develop close to the impact point.
Beyond this undamaged zone, a damaged area spreads out between a radius of 12 and 20 mm.
The absence of dynamic confinement in that area probably favors the development of
damage. This observation confirms the usefulness of the dynamic confinement system. An
intense fragmentation is also visible beyond the previous zones composed of cracks oriented
in the radial direction. This damage zone spreads over more than 80 mm. A crack density in
the range of 107 – 2.107 cracks per m3 was estimated between radii of 30 and 50 mm. It is
based upon the evaluation of the mean distance between consecutive cracks along partial
circular paths emanating from the impact point. The measurement uncertainty is evaluated of
the order of a few cracks for about ten cracks detected along the considered partial circular

13
paths. Two spall cracks oriented perpendicular to the axial direction are also visible at a
distance of 60 mm from the impact point.
The damage pattern of the second configuration (Figure 8b) is very different. Three
damage modes are observed as a function of the distance from the impact point. The confined
zone is totally damaged and reduced in debris in spite of fibers that reinforce the target. Close
to this comminuted area, cracks always oriented at 45° with respect to the radial and hoop
directions are seen. These cracks, called snail cracks, develop in mode II with rubbing faces.
Far away from the confinement, one also observes numerous circular-front cracks centered on
the impact point. These cracks are thought to emerge to the surface leading to the dark areas
observed on pictures given by the ultra-high speed camera between 16 µs and 44 µs after
impact. These “emerging crack” or “shell cracks” might be the result of unconfined
compression beyond the confined area, similar to the splitting mode observed in uniaxial
compression of concrete samples. These cracking mechanisms correspond to more or less
confined compressive damage due to radial compression stresses. The dimension of the area
affected by this compressive damage (40 mm) is in good agreement with that predicted by
numerical simulation using a von Mises criterion and no hardening law. This confined
damage does not prevent an intense fragmentation of the tile at a distance of 40 mm to
130 mm from the impact point. This fragmentation is composed of numerous radial cracks,
which are few centimeters long. One may also note the presence of spall cracks (not visible
in Figure 8b) at a distance of 50 mm from the rear edge that corresponds to the projectile
length.
Numerical analysis of damage induced by impact in concrete
The fragmentation process is discrete by essence. Several Continuum Damage Mechanics
models may be used with an isotropic (Grady and Kipp 1980; Margolin 1983; Rajendran

14
1994) or anisotropic (Espinosa et al. 1998; Denoual and Hild 2000) description to account for
multiple fragmentation. In the numerical simulations performed herein, the medium is
assumed to be continuous on the scale of a finite element in which numerous cracks are
expected to form. It may be noted that alternative (discrete) approaches may be followed
(Camacho and Ortiz 1996; Mastilovic and Krajcinovic 1999; Ibrahimbegovic and Delaplace
2003). To account for confined damage, the KST model (Krieg 1978; Swenson and Taylor
1983) is coupled with a damage model based upon a fragmentation analysis (Denoual and
Hild 2000; 2002; Forquin et al. 2003).
KST Model
The KST model gives a good description of geomaterials behavior under low or high
confinement (Schwer et al. 1988). A compaction law is used for the spherical behavior
whereas the equivalent stress depends upon the von Mises stress as well as the hydrostatic
pressure (Drucker and Prager 1956). The higher the pressure, the higher the strength. This
model accounts for the difference of strength in simple and confined compression of
geomaterials.
An irreversible volumetric strain is used to describe the unloading part and is defined
by
KP
vir += εε (5)
where K is the bulk modulus that depends upon the volumetric strain [K = K(εv)]. A
hydrostatic compression test provides the initial and final bulk moduli (Ki, Kf). Between these
two extreme values, a linear variation is assumed

15
⎪⎪
⎩
⎪⎪
⎨
⎧
≤
≥≥−
−+
−
−≥
=
)(
)()2()2()(
)2(
)()2(
)(
)2(
when
when
when
nvvf
nvvv
vn
v
vvfn
vv
nvv
i
vvi
K
KK
K
K
εε
εεεεε
εε
εε
εεεε
(6)
where n denotes the last point used to define the overall behavior (n = 4 in Figure 9). The
same test, performed by Buzaud (2003), also provides other points of the compaction curve
(i.e., the loading part )(ivε vs. )(iP ) that is described by a linear relationship
⎪⎪
⎩
⎪⎪
⎨
⎧
≤−
≥≥−
−+
−
−≥−
= −−
−
−−
)(
)()1()1()(
)1()(
)()1(
)()1(
)2(
when
when
when
nvvvf
ivv
ivi
vi
v
ivvi
iv
iv
ivvi
vvvi
K
PP
K
P
εεε
εεεεεεε
εεεε
εεε
(7)
When the pressure is known, its effect on the deviatoric response can be accounted for. The
equivalent (von Mises) stress is related to the pressure P by a pressure-dependent yield stress
)(Pyσ
⎪⎪⎩
⎪⎪⎨
⎧
>++++
<++++
==min2
2102
210max
max2210
2210
min
when),min(
when),max(
)(
eqeq
eqeq
yeq
PaPaaPaPaa
PaPaaPaPaa
P
σσ
σσ
σσ (8)
In the present study, the stress mineqσ is assumed to be equal to the ultimate strength in a
uniaxial compression test. The mean compression strength measured with hourglass samples
is equal to −222 MPa (Forquin 2003). Other triaxial compression tests were performed on
Ductal® concrete (Buzaud 2003) to tune the coefficients a0, a1, a2 and the maximum
equivalent stress maxeqσ . During these tests, an axial compression is applied on a cylindrical
specimen already loaded by a pure hydrostatic stress. The maximum strength is determined
16
for different hydrostatic stresses (i.e., −200, −300, −400, and −600 MPa). The strength versus
pressure envelope provides data of the ‘deviatoric’ limit σeq (a0, a1, a2, maxeqσ ). The parameters
are given in Table 2. The plastic strain tensor pe is defined as
G
p2see −= (9)
where e is the deviatoric part of the total strain tensor, s the deviatoric stress tensor, and G the
shear modulus. The plastic strain increment pde is given by
eq
sp dddσ
λφ
λ23s
se =
∂∂
= (10)
where dλ is the plastic multiplier obtained from the Kuhn-Tucker conditions associated with
)(Pyeqs σσφ −= .
Fragmentation model
In the following, a damage model is presented. It is based upon a fragmentation analysis
(Denoual and Hild 2000). For brittle materials, the analysis of failure depends upon the
microstructure in terms of flaw density and failure stress distribution (Shockey et al. 1974).
In the present analysis, it is assumed that cracking occurs normal to three principal directions
di (i = 1,2,3). The microstructure is approximated by point defects of density λt with random
locations. It is described by a Poisson point process of intensity λt (Gulino and Phoenix 1991;
Jeulin 1991; Denoual et al. 1997)
( )m
iit ⎟⎟
⎠
⎞⎜⎜⎝
⎛=
οο σ
σλσλ . (11)
17
Equation (11) shows that the higher the local principal stress σi, the more defects can break.
The intensity of the Poisson process is directly related to the Weibull parameters (Denoual
and Hild 2002) that may be identified under quasi-static loading conditions as shown
previously. Under impact, multiple fragmentation is observed (Figures 7 and 8) in many
brittle materials. The weakest link hypothesis no longer applies on a global scale and the
behavior is referred to quasi-brittle. Continuum Damage Mechanics will be used to describe
crack networks. In the following, it is assumed that the defect population leading to damage
and failure is identical when the material is subjected to quasi-static and dynamic loading
conditions (Shockey et al. 1974; Denoual and Hild 2000). To understand why a crack
nucleates, one has to model the interaction of a nucleated crack and other defects that would
nucleate. The microcrack propagation velocity is assumed to be constant and equal to a
fraction k of the longitudinal wave speed C0 (Bluhm 1969; Freund 1972; Riou et al. 1998).
Therefore, one may define a relaxation or obscuration domain of volume Vo around a crack
(i.e., a zone in which the stresses are smaller than the applied stresses, thus do not cause new
crack initiations)
[ ] 30( ) ( )oV t S k C tτ τ− = − , (12)
which is a function of a shape parameter S, the present time t and the time to nucleation τ < t.
The shape parameter S may depend on the Poisson’s ratio ν but it is independent of time so
that the relaxed zones are self-similar. New cracks will initiate only if the defect exists in the
considered zone and if the flaw does not belong to any relaxed zone. It can be noted that the
relaxation volumes are associated with a cracking normal di. The total flaw density λt is split
into two parts, namely, λb, the crack density and the obscured flaw density. The increment of
crack density λb is related to that of total flaw density λt by

18
[ ] [ ] ))(1()()( TPTdt
dTdt
do
tb −= σλσλ , (13)
with λb(0) = λt(0) = 0 and Po the probability of obscuration associated to the cracking
normal di (Denoual et al. 1997)
{ }
⎟⎟
⎠
⎞
⎜⎜
⎝
⎛−−−= ∫
t
it
oo ddt
dtVP0
)()(exp1 ττσλτ (14)
It can be noted that Equation (14) accounts for overlappings of obscuration zones.
When dynamic loadings are considered with a constant stress rate σ , a dimensionless
density )/~( cλλλ = , time )/~( ctTT = , volume )/~( cVVV = and stress )/~( cσσσ = are defined from
the condition (Denoual and Hild 1998)
( ) ( ) 1when,,, ==== cccccocctc VttVVt λσσλλ (15)
where the subscript c denotes characteristic quantities. The characteristic time, stress and
density are expressed as
3
1 13 333
0
m mm mm
moc S kCt λ σ σ
−−+ +− +⎛ ⎞ ⎛ ⎞⎛ ⎞= ⎜ ⎟ ⎜ ⎟⎜ ⎟
⎝ ⎠⎝ ⎠ ⎝ ⎠
33
1 13 333
0
mm mm
moc S kCλ σ σσ
−+ +− +⎛ ⎞ ⎛ ⎞⎛ ⎞= ⎜ ⎟ ⎜ ⎟⎜ ⎟
⎝ ⎠⎝ ⎠ ⎝ ⎠ (16)
3 33
1 13 333
0
m mmm mm
moc S kCλ σ σλ
− −+ +− +⎛ ⎞ ⎛ ⎞⎛ ⎞= ⎜ ⎟ ⎜ ⎟⎜ ⎟
⎝ ⎠⎝ ⎠ ⎝ ⎠
19
According to Equation (16), characteristic quantities are related to 3 types of parameters. The
first term corresponds to the second Weibull parameter (activation of critical defects), the
second term is the stress rate (i.e., related to the load history) and the third one is made of
parameters related to the obscuration volume [Equation (12)]. One may note that the powers
indicate the sensitivity of the characteristic quantities to the three types of parameters that
control the fragmentation process, namely, crack initiation, loading rate and crack
propagation. For example, assuming 3>>m , the characteristic time is inversely proportional
to the stress rate whereas the characteristic density is proportional to the stress rate raised to
the power 3.
A closed-form solution of the obscuration probability reads
⎟⎟⎠
⎞⎜⎜⎝
⎛+Γ
+ΓΓ−−= +3~
)4()1()4(exp1 m
o Tm
mP (17)
By using Equations (11) and (17), the dimensionless crack density becomes
3
3( 4) ( 1) (4)( ) ,3 ( 1) (4) 3 ( 4)
mm
mb
m m m mT Tm m m m
λ γ+
+⎡ ⎤ ⎛ ⎞Γ + Γ + Γ= ⎜ ⎟⎢ ⎥+ Γ + Γ + Γ +⎣ ⎦ ⎝ ⎠
(18)
where γ is the incomplete gamma function
( ) 1
0, exp( )
TT t t dtαγ α −= −∫ (19)
By noting that )(),( ααγ Γ→+∞→T , the normalized crack density at saturation is a function
of only the Weibull modulus m
3( 4)( ) 1
( 1) (4) 3
mm
bm mT
m mλ
+⎡ ⎤Γ + ⎛ ⎞= ∞ = Γ +⎜ ⎟⎢ ⎥Γ + Γ +⎝ ⎠⎣ ⎦ (20)

20
The ultimate macroscopic stress Σu may be also computed as the maximum
macroscopic stress tPo σ)1( −=Σ with respect to time t. The ultimate macroscopic stress
(i.e., the dynamic strength) is then the product of the characteristic stress with a function of
the Weibull modulus m only
3
1
)1()4()3( +
⎟⎟⎠
⎞⎜⎜⎝
⎛+ΓΓ
+Γ=Σ
m
cu memσ (21)
According to Equations (18) and (21), the crack density and the ultimate macroscopic stress
are related to the Weibull parameters, the stress rate and the cracking velocity. The Weibull
parameters are those of unreinforced Ductal®. This choice is consistent with the fact that the
initiation parameters are describing microcracking and the latter are almost identical whether
Ductal® is reinforced or not. The Weibull parameters being known, the last parameter of the
model are those related to the extension of obscuration volumes [Equation (12)]. The shape
parameter S is assumed to be known [in 3D situations S ≈ 3.74 (Denoual and Hild 2002)].
Cracks being propagating, the cracking velocity (Vcracking) is proportional to the 1D wave
speed (e.g., Vcracking = kC0, with C0 = ρ/E ). The value of k is not well known, especially
for new grades of concrete materials. Based upon the concept of conservation of energy, an
analytical solution for k was proposed (Broek 1982; Kanninen and Popelar 1985). It shows
that when the crack length becomes significantly larger than the initial crack size, the cracking
velocity tends to a limit close to 0.38C0. However, according to Freund (1972; 1990), cracks
in brittle materials may accelerate up to the Rayleigh wave speed CR, e.g., CR = 0.586C0 with
ν = 0.2. Further, the parameter k was investigated in several brittle materials, in particular
when transparent. For example, experimental studies showed a limiting velocity about 0.5CR
in glass, about 0.6CR in Plexiglas and about 0.4CR in Homalite-100 (Ravi-Chandar and
Knauss 1982; 1984a; 1984b; 1984c; 1984d; Knauss and Ravi-Chandar 1985; 1986; Sharon et

21
al. 1995). Strassburger and Senf (1995) also investigated the terminal crack velocity in a
silicon carbide and in glass materials and observed a crack velocity approximately half of CR
in both cases.
Molecular dynamics simulations were also performed to investigate the crack
propagation velocity (Sieradzki and Dienes 1988; Abraham and Gao 2000) and crack
branching (Zhou et al. 1996). According to Abraham and Gao (2000), the propagation
velocity is bounded by the Rayleigh wave speed in mode I whereas it could reach the
longitudinal wave speed in mode II. The above-mentioned studies show a scatter in crack
velocity in brittle materials within the range of 0.4CR to CR (or 0.23C0 to 0.59C0 with ν = 0.2)
and more in the range of 0.4CR to 0.6CR according to experimental studies (or 0.23C0 to
0.35C0 with ν = 0.2).
To analyze the sensitivity of the model predictions to this parameter, the closed form
solutions of the model are used [Equations (15) to (21)]. In particular, the characteristic
parameters [Equation (16)] give the explicit dependence of the considered quantity to k. The
ultimate macroscopic stress and the crack density at saturation are plotted in Figure 10 as
functions of k, with k ranging between 0.2 and 0.55, for a stress rate of 10 MPa/µs (i.e.
E/σε = ≈ 175 s-1). The latter is representative of the edge-on impact experiments reported
above, namely a hoop stress rate of the order of 24 MPa/µs, 14 MPa/µs, 9 MPa/µs and
5 MPa/µs, at a distance from impact point of 20, 30, 40 and 50 mm, respectively. The
ultimate macroscopic stress scales as )3/(3 +− mk and varies from 22 MPa to 27.5 MPa in the
considered range of k [0.2-0.55] (Figure 10). Conversely, the crack density at saturation
scales as )3/(3 +− mmk , namely, the largest value of the crack density (2 cracks / mm3) is
reached for k = 0.2, whereas the lowest value (0.2 crack / mm3) is obtained for k = 0.55. By
considering a value k = 0.38, a crack density of about 0.4 crack / mm3 is obtained. Therefore
the crack density predicted by numerical simulations may be compared roughly with that

22
deduced from post-mortem observations. The uncertainty on the crack density associated
with the value of k is of the same order of magnitude as the measurement uncertainty.
Based upon the fragmentation analysis, a damage model is now developed. The
variable Po is used to define a damage variable in the framework of Continuum Damage
Mechanics. The probability Po is assumed to be equal to the damage variable Di associated to
the direction di. In the present analysis, an anisotropic description is used so that three
damage variables are used associated to each cracking directions assumed to be orthogonal.
The strain tensor ε is related to the macroscopic stress tensor Σ by
ΣKε ),,( 321 DDD= (22)
where the compliance tensor K is defined as
⎥⎥⎥⎥⎥⎥⎥⎥⎥⎥⎥⎥⎥⎥⎥
⎦
⎤
⎢⎢⎢⎢⎢⎢⎢⎢⎢⎢⎢⎢⎢⎢⎢
⎣
⎡
−−
+−−
+−−
+−
−−
−−
−
−−−
=
αα
αα
αα
ν
ν
ν
νν
νν
νν
)1()1(100000
0)1()1(
10000
00)1()1(
1000
0001
1
0001
1
0001
1
1
21
13
32
3
2
1
DD
DD
DD
D
D
D
EK
(23)
where E is the Young’s modulus, ν the Poisson’s ratio of the undamaged material, and
5.0=α . The growth of each damage variable Di is based upon the defect density λt and
derived by using Equation (14)
[ ] 0and0when)()(61
1 302
2>>=⎟⎟
⎠
⎞⎜⎜⎝
⎛− i
iit
i
i dtdtkCS
dtdD
Ddtd σσσλ (24)
where no index summation is used, and σi denotes the microscopic principal stress.

23
In the numerical simulations presented bellow, the constant k is chosen equal to 0.38
as for ceramics (Riou et al. 1998; Denoual and Hild 2000). The model has no other
parameters to tune, so the following numerical simulations are predictions.
Model coupling
For each step, the strain increment is given so that the updated volumetric and deviatoric
strain components are known. The pressure is deduced by considering the spherical law of
the KST model [Equations (5) or (7)]. The deviatoric strain increment given as input, it is
used to compute the deviatoric stress by using Equations (8-10) and to update the plastic
strain tensor. The microscopic stress tensor σ being computed, it is used to deduce the
damage increments [Equation (24)] as well as the crack density increments [Equation (13)]
when any component of the principal stress is positive. The macroscopic stress tensor is then
deduced
σKKΣ )0,0,0(),,( 3211 DDD−= (25)
At the end of each step, the user has access to the damage variables along three cracking
directions, the macroscopic stresses as well as the crack density. Depending on the problem,
any of these quantities may be visualized.
Finite Element computations
Finite element simulations are performed with the commercial explicit code Abaqus (Hibbitt
et al. 2001) in which the coupled model is implemented via a VUMAT routine. In the present
case, we will focus on the crack density along the maximum principal stress direction and the
corresponding damage variable.
Numerical simulations of the two previous configurations (impacts with aluminum and
steel projectile with velocities of 88 and 130 m/s) are performed with the coupled model.
24
Damage spreads out within half the concrete tiles 30 µs after impact (Figures 11a, 12a). The
targets are fully damaged 45 µs after impact (Figures 11b, 12b). This result is consistent with
the pictures from ultra-high speed camera (Figure 7). In particular, the 5th picture obtained 44
µs after impact allows one to note the main radial cracks that are clearly visible on the last
picture (100 µs after impact).
Comparing Figures 11 and 12, the patterns of damage and crack density predicted by
the two numerical simulations are very similar despite the difference of projectiles and
velocities. This is also consistent with the similar fragmentation patterns at a distance of
40 mm to 130 mm from the impact point observed on the two post-mortem studies
(Figures 8a and 8b). The crack densities have to be compared quantitatively. In both cases
(Figures 11 and 12), the crack density is about 109 – 108.5 cracks / m3 at a distance of 30 to 50
mm from the impact point. Therefore the predicted crack density is slightly greater than that
observed during edge-on impact tests (in the range of 107 – 2 × 10⁷ cracks per m3 in the same
area, Figure 8). Beyond half of the concrete tiles, the predicted crack density decreases below
108 cracks / m3, which may explain the long radial cracks visible on the post-mortem studies.
Moreover, EOI tests were performed on tiles made of Ductal® without fibers (Forquin 2003).
The patterns of crack density were unchanged in comparison with that of Figures 8a and 8b.
Therefore, one may think that fibers do not avoid or reduce cracking and crack propagation
even though the residual strength increases significantly when fibers are used. This result
confirms that Weibull parameters associated with crack initiation can be used to model
dynamic fragmentation. The present model allows us to reproduce reasonably the
characteristic time to damage, the orientation of cracking as well as the pattern of crack
density (even if the crack density is slightly oversestimated). Therefore, the coupled KST-
fragmentation model is able to predict the damage process of Ductal® resulting from an
impact loading whether the concrete matrix is reinforced or not by short fibers.

25
Summary
Edge-on impact tests were designed and performed by studying an ultra-high strength
concrete Ductal® reinforced or not by small fibers. A dynamic confinement was used to
reduce or avoid confined damage close to the impact point. Numerical simulations performed
with a simple elastoplastic model predict a fragmentation without compressive damage for the
first configuration (aluminum projectile, impact velocity = 88 m/s) whereas two damaged
zones are expected to occur with the second configuration (steel projectile, impact
velocity = 130 m/s). These two zones are indeed observed by using an ultra-high speed
camera. Confined damage develops between 12 µs and 44 µs after impact and fragmentation
is activated subsequently.
An intense fragmentation process made of numerous radial cracks is seen in post-
mortem analyses when an aluminum projectile is used, whereas two different damage patterns
are obtained with the second configuration using a steel projectile. The first one, which is
localized close to the impact point, is generated by the compressive state of stress. This
damage does not prevent fragmentation within the target. These results confirm the
usefulness of the dynamic confinement system. Fibers do not appear to be an obstacle to the
initiation of damage even though they may provide a higher residual strength.
The coupled model describing fragmentation, compaction and confined damage
enables us to get a good prediction of damage (pattern, crack density and orientation) even if
the crack density is over-estimated. This can be explained by the low level of crack openings
that are not easy to visualize.

26
Acknowledgements
This work was funded by the Délégation Générale pour l’Armement (DGA). The authors
acknowledge useful discussions with Dr. L. Rota.
References
Abraham, F., and Gao, H. (2000). "How Fast Can Cracks Propagate?" Phys. Rev. Lett., 84
(14), 3113-3116.
Abramowitz, M., and Stegun, I. A. (1965). Handbook of Mathematical Functions. Dover
Publications, Inc., New York (USA).
Bayard, O. (2003). "Approche multi-échelles du comportement mécanique des bétons à ultra
hautes performances renforcés par des fibres courtes." PhD dissertation (in French),
Ecole Normale Supérieure de Cachan.
Bažant, Z. P. (1984). "Size Effect in Blunt Fracture: Concrete, Rock, Metal." ASCE J. Eng.
Mech., 110, 518-535.
Bažant, Z. P. (2000). "Size Effect." Int. J. Solids Struct., 37, 69-80.
Behloul, M. (1996). "Analyse et modélisation du comportement d'un matériau à matrice
cimentaire fibrée à ultra hautes performances (Bétons de Poudres Réactives). Du
matériau à la structure." PhD dissertation (in French), Ecole Normale Supérieure de
Cachan.
Beremin, F. M. (1983). "A Local Criterion for Cleavage Fracture of a Nuclear Pressure Vessel
Steel." Metallurgical Transactions A, 14A, 2277-2287.
Bluhm, J. I. (1969). "Fracture Arrest." In: Fracture, Academic Press, New York (USA), 1-63.

27
Boulay, C., Le Maou, F., Renwez, S., Sercombe, J., and Toutlemonde, F. (1997).
"Caractérisation du comportement au choc d'un béton de poudres réactives grâce à des
essais de traction directe." LCPC report.
Broek, D. (1982). Elementary Engineering Fracture Mechanics. Martinus Nijhoff, The
Hague, Netherlands.
Buzaud, E. (1998). "Performances mécaniques et balistiques du microbéton MB50." Report,
DGA/Centre d'Etudes de Gramat.
Buzaud, E. (2003). "Unpublished work." DGA/Centre d'Etudes de Gramat.
Camacho, G. T., and Ortiz, M. (1996). "Computational Modelling of Impact Damage in
Brittle Materials." Int. J. Solids Struct., 33 (20-22), 2899-2938.
da Silva, A. R. C., Proença, S. P. B., Billardon, R., and Hild, F. (2004). "Probabilistic
Approach to Predict Cracking in Lightly Reinforced Microconcrete Pannels." J. Eng.
Mech., 130 (8), 931-941.
Davies, D. G. S. (1973). "The Statistical Approach to Engineering Design in Ceramics." Proc.
Brit. Ceram. Soc., 22, 429-452.
Denoual, C., Barbier, G., and Hild, F. (1997). "A Probabilistic Approach for Fragmentation of
Ceramics under Impact Loading." C. R. Acad. Sci. Paris, 325 (Série IIb), 685-691.
Denoual, C., Cottenot, C. E., and Hild, F. (1996). "On the Identification of Damage during
Impact of a Ceramic by a Hard Projectile." Proceedings 16th International Conference
on BALLISTICS, APDS, Arlington (USA), 541-550.
Denoual, C., Cottenot, C. E., and Hild, F. (1998). "Analysis of the Degradation Mechanisms
in an Impacted Ceramic." Proceedings Shock Compression of Condensed Matter, AIP
Press, New York (USA), 427-430.
Denoual, C., and Hild, F. (1998). "On the Characteristic Scales involved in a Fragmentation
Process." J. Phys., IV (8), 119-126.
28
Denoual, C., and Hild, F. (2000). "A Damage Model for the Dynamic Fragmentation of
Brittle Solids." Comp. Meth. Appl. Mech. Eng., 183, 247-258.
Denoual, C., and Hild, F. (2002). "Dynamic Fragmentation of Brittle Solids: A Multi-Scale
Model." Eur. J. Mech. A/Solids, 21 (1), 105-120.
Drucker, D. C., and Prager, W. (1956). "Soil Mechanics and Plastic Analysis of Limit
Design." Quat. of Appl. Math., 14,
Espinosa, H. D., Zavattieri, P. D., and Dwivedi, S. K. (1998). "A Finite Deformation
Continuum/Discrete Model for the Description of Fragmentation and Damage in Brittle
Materials." J. Mech. Phys. Solids, 46, 1909-1942.
Forquin, P. (2003). "Endommagement et fissuration de matériaux fragiles sous impact
balistique, rôle de la microstructure." PhD dissertation (in French), Ecole Normale
Supérieure de Cachan.
Forquin, P., Tran, L., Louvigné, P.-F., Rota, L., and Hild, F. (2003). "Effect of Aluminum
Reinforcement on the Dynamic Fragmentation of SiC Ceramics." Int. J. Impact Eng.,
28, 1061-1076.
Freund, L. B. (1972). "Crack Propagation in an Elastic Solid Subjected to General Loading -
Constant Rate of Extension." J. Mech. Phys. Solids, 20, 129-140.
Freund, L. B. (1990). Dynamic Fracture Mechanics. Cambridge University Press, Cambridge
(UK).
Grady, D. E., and Kipp, M. E. (1980). "Continuum Modeling of Explosive Fracture in Oil
Shale." Int. J. Rock Min. Sci. & Geomech. Abstr., 17, 147-157.
Gulino, R., and Phoenix, S. L. (1991). "Weibull Strength Statistics for Graphite Fibres
Measured from the Break Progression in a Model Graphite/Glass/Epoxy
Microcomposite." J. Mater. Sci., 26 (11), 3107-3118.

29
Hibbitt, H. D., Karlsson, B. I., and Sorensen, P. (2001). "Abaqus User's manual,
ABAQUS/EXPLICIT 6.1." version 5.8, Volume I et II.
Hild, F., Forquin, P., and Silva, A. R. C. (2003). "Single and Multiple Fragmentation of
Brittle Geomaterials." Rev. Franç. Gén. Civil, 7 (7-8), 973-1003.
Hornemann, U., Kalthoff, J. F., Rothenhäusler, H., Senf, H., and Winkler, S. (1984).
"Experimental Investigation of Wave and Fracture Propagation in Glass - Slabs Loaded
by Steel Cylinders at High Impact Velocities." EMI report E 4/84, Weil am Rhein
(Germany).
Ibrahimbegovic, A., and Delaplace, A. (2003). "Microscale and mesoscale discrete models for
dynamic fracture of structures built of brittle material." Comput. Struct., 81 (12), 1255-
1266.
Jayatilaka, A. de S. (1979). Fracture of Engineering Brittle Materials. Applied Sciences
Publishers, London (UK).
Jeulin, D. (1991). "Modèles morphologiques de structures aléatoires et changement
d'échelle." thèse d'État, Université de Caen.
Kanninen, M. F., and Popelar, C. H. (1985). Advanced Fracture Mechanics. Oxford
University Press, Oxford (UK).
Knauss, W. G., and Ravi-Chandar, K. (1985). "Some basic problems in stress wave
dominated fracture."" Int. J. Fract., 27 (3-4), 127-143.
Knauss, W. G., and Ravi-Chandar, K. (1986). "Fundamental considerations in dynamic
fracture." Eng. Fract. Mech., 23 (1), 9-20.
Kolsky, H. (1963). Stress Waves in Solids. Dover Publications, New York (USA).
Krieg, R. D. (1978). "A simple constitutive description for soils and crushable foams." report,
SC-DR-7260883, Sandia National Laboratory.
Kurkjian, C. R. (1985). Strength of Inorganic Glass. Plenum Press, New York (USA).

30
Malier, Y. (1992). Les bétons à hautes performances. Presses de l'ENPC.
Margolin, L. G. (1983). "Elasticity Moduli of a Cracked Body." Int. J. Fract., 22, 65-79.
Mastilovic, S., and Krajcinovic, D. (1999). "High-Velocity Expansion of a Cavity within a
Brittle Material." J. Mech. Phys. Solids, 47, 577-600.
Pamshock (2001). "User's Manual." ESI.
Rajendran, A. M. (1994). "Modeling the Impact Behavior of AD85 Ceramic under Multiaxial
Loading." Int. J. Impact Eng., 15 (6), 749-768.
Ravi-Chandar, K., and Knauss, W. G. (1982). "Dynamic crack-tip stresses under stress wave
loading. A comparison of theory and experiment." Int. J. Fract., 20 (3), 209-222.
Ravi-Chandar, K., and Knauss, W. G. (1984a). "An experimental investigation into dynamic
fracture: I, Crack initiation and arrest." Int. J. Fract., 25 (4), 247-262.
Ravi-Chandar, K., and Knauss, W. G. (1984b). "An experimental investigation into dynamic
fracture: II, Microstructural aspects." Int. J. Fract., 26 (1), 65-80.
Ravi-Chandar, K., and Knauss, W. G. (1984c). "An experimental investigation into dynamic
fracture: III, Steady-state crack propagation and crack branching." Int. J. Fract., 26 (2),
141-154.
Ravi-Chandar, K., and Knauss, W. G. (1984d). "An experimental investigation into dynamic
fracture: IV, On the interaction of stress waves with propagating cracks." Int. J. Fract.,
26 (3), 189-200.
Richard, P., and Cheyrezy, M. (1995). "Composition of reactive power concretes." Cement
Conc. Res., 25 (7), 1501-1511.
Riou, P., Denoual, C., and Cottenot, C. E. (1998). "Visualization of the Damage Evolution in
Impacted Silicon Carbide Ceramics." Int. J. Impact Eng., 21 (4), 225-235.
31
Schwer, L. E., Rosinsky, R., and Day, J. (1988). "An axisymmetric lagrangian technique for
predicting earth penetration including penetrator response." Int. J. Num. Anal. Meth.
Geomech., 12, 235-262.
Sharon, E., Gross, S. P., and Fineberg, J. (1995). "Local crack branching as a mechanism for
instability in dynamic fracture." Phys. Rev. Lett., 74 (25), 5096-5099.
Shockey, D. A., Curran, D. R., Seaman, L., Rosenberg, J. T., and Petersen, C. F. (1974).
"Fragmentation of Rocks under Dynamic Loads." Int. J. Rock Mech. Min. Sci., 11, 303-
317.
Sieradzki, K., and Dienes, G. J. (1988). "Atomistics of crack propagation." Acta Metall., 36
(3), 651-663.
Strassburger, E., and Senf, H. (1994). "Experimental Investigations of Wave and Fracture
Phenomena in Impacted Ceramics." EMI report 3/94.
Strassburger, E., and Senf, H. (1995). "Experimental Investigations of Wave and Fracture
Phenomena in Impacted Ceramics and Glasses." Report, ARL-CR-214, ARL.
Strassburger, E., Senf, H., and Rothenhäusler, H. (1994). "Fracture Propagation during Impact
in Three Types of Ceramics." J. Physique IV, coll. C8 (suppl. IV), 653-658.
Swenson, D. V., and Taylor, L. M. (1983). "A finite element model for the analysis of tailored
pulse stimulation of boreholes." Int. J. Num. Analyt. Meth. Geomech., 7, 469-484.
Weibull, W. (1939). "A Statistical Theory of the Strength of Materials." Report 151, Roy.
Swed. Inst. Eng. Res.
Weibull, W. (1951). "A Statistical Distribution Function of Wide Applicability." ASME J.
Appl. Mech., 18 (3), 293-297.
Zhou, S. J., Lomdahl, P. S., Thomson, R., and Holian, B. L. (1996). "Dynamic Crack
Processes via Molecular Dynamics." Phys. Rev. Lett., 76 (13), 2318-2321.

Table captions
Table 1 – Weibull and elastic parameters of unreinforced and fiber reinforced Ductal®.
Table 2 – Parameters of the fragmentation model coupled with the KST model for
unreinforced and fiber reinforced Ductal®.
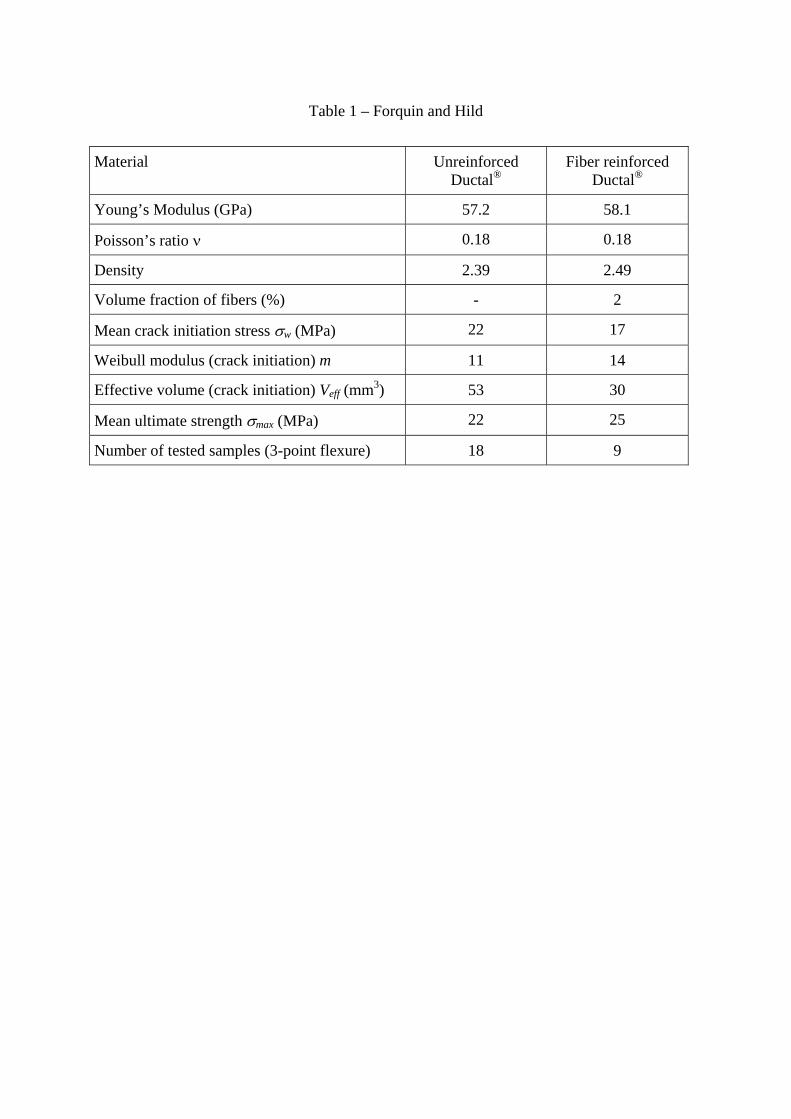
Table 1 – Forquin and Hild
Material Unreinforced Ductal®
Fiber reinforced Ductal®
Young’s Modulus (GPa) 57.2 58.1
Poisson’s ratio ν 0.18 0.18
Density 2.39 2.49
Volume fraction of fibers (%) - 2
Mean crack initiation stress σw (MPa) 22 17
Weibull modulus (crack initiation) m 11 14
Effective volume (crack initiation) Veff (mm3) 53 30
Mean ultimate strength σmax (MPa) 22 25
Number of tested samples (3-point flexure) 18 9

Table 2 – Forquin and Hild
Density, Elastic parameters ρ; E; ν 2.390; 57 GPa; 0.18
Parameters of the spherical behavior
Initial et final bulk moduli
Compaction curve (4 points)
Ki; Kf
εv(i); P(i)
24.1 GPa; 34.0 GPa,
0 ; 0
-0.013 ; 320 MPa
-0.04 ; 600 MPa
-0.059 ; 900 MPa
Parameters of the deviatoric behavior
Coefficient of elliptic equation
Maximum and minimum stresses
a0; a1; a2
maxeqσ ; min
eqσ
104 MPa2; 515 MPa; 0.384
750 MPa; 222 MPa
Parameter of the fragmentation model
Cracks initiation (Weibull) parameters
Cracks propagation parameters
σw; m; Veff
k; C0
22 MPa; 11; 53 mm3
0.38; 4880 m/s

Figure captions
Figure 1: Composition and size of components in Ductal®.
Figure 2: Stress / displacement curves for unreinforced and fiber reinforced Ductal®. For
reinforced Ductal®, the exterme realizations are shown. For unreinforced
Ductal®, an elastic-brittle response is always obtained.
Figure 3: Fracture pattern in 3-point flexure for unreinforced (a) and fiber reinforced (b)
Ductal®.
Figure 4: Schematic of the sarcophagus configuration with dynamic confinement and
Figure 5: Edge-on impact modeling with an elastoplastic model (σy = 400 MPa): (a) mesh
of a quarter, von Mises contours 30 µs after impact with an aluminum projectile,
impact velocity = 80 m/s (b), and steel projectile, impact velocity = 130 m/s (c),
(d) pressure contours (aluminum projectile, impact velocity = 80 m/s) 8 µs after
impact.
Figure 6: Experimental configuration of EOI experiments.
Figure 7: Visualization of damage change during edge-on-impact of a steel projectile (ultra-
high speed camera configuration, impact velocity = 130 m/s): (a) unreinforced
Ductal®, (b) fiber reinforced Ductal®.
Figure 8: Damage pattern after edge-on-impact (sarcophagus configuration): (a) aluminum
projectile (impact velocity = 88 m/s), (b) steel projectile (impact
velocity = 130 m/s).

Figure 9: Compaction data used in the present model, pressure P versus volumetric strain εv
for fiber reinforced Ductal®. In the model, the effect of the fibers on the response
(P, εv) is neglected.
Figure 10: Crack density at saturation and ultimate tensile strength versus normalized crack
velocity (Vcracking / C0 = k) for a stress rate of 10 MPa/µs.
Figure 11: Damage variable (left) and crack density (right) associated with the maximum
principal stress direction 30 μs (a) and 45 μs (b) after impact by an aluminum
projectile (impact velocity = 88 m/s).
Figure 12: Damage variable (left) and cracking density (right) associated with the maximum
principal stress direction 30 μs (a) and 45 μs (b) after impact by a steel projectile
(impact velocity = 130 m/s).
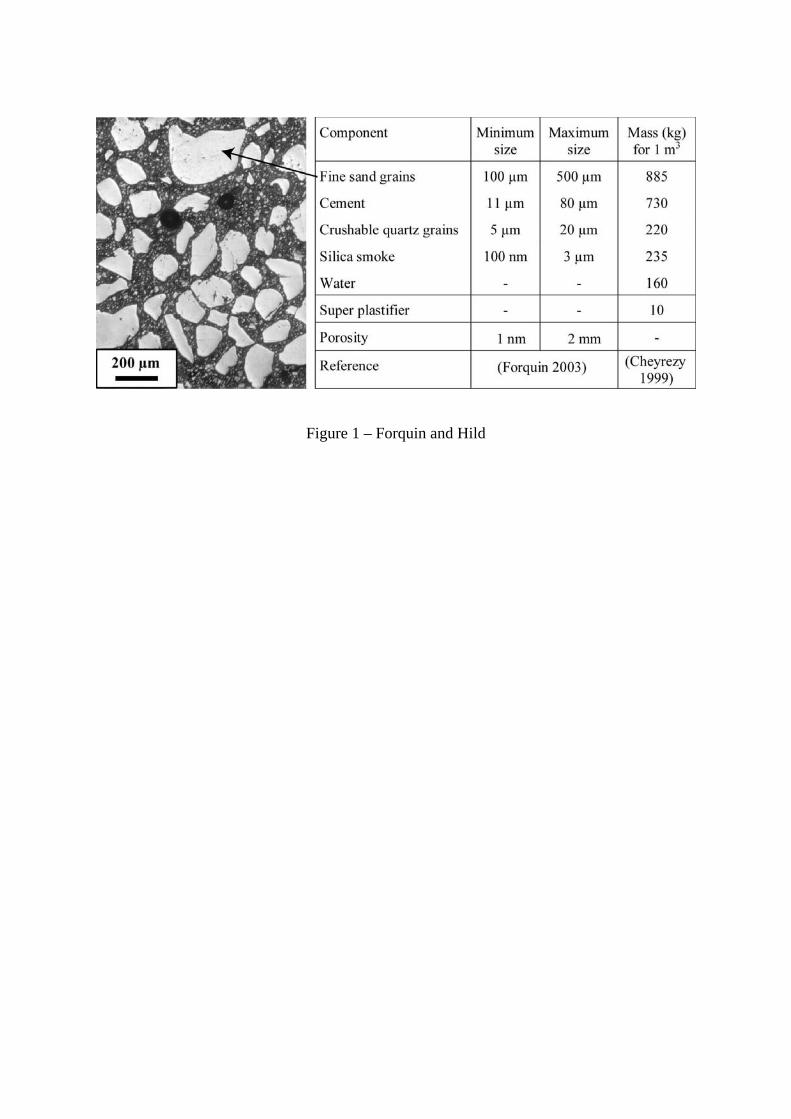
Figure 1 – Forquin and Hild

Figure 2 – Forquin and Hild
Figure 3 – Forquin and Hild
Figure 4 – Forquin and Hild
-a- -b-
-c- -d-
Figure 5 – Forquin and Hild

Figure 6 – Forquin and Hild

Figure 7 – Forquin and Hild

-a-
-b-
Figure 8 – Forquin and Hild

Figure 9 – Forquin and Hild

Figure 10 – Forquin and Hild

Figure 11 – Forquin and Hild

Figure 12 – Forquin and Hild