dynamic electromechanical measurements of carbon black
TRANSCRIPT

Dynamic Electromechanical Measurements of Carbon Black
Loaded SBR
by
Yawlin Hwang
Thesis submitted to the Faculty of the
Virginia Polytechnic Institute and state University
in partial fulfillment of the requirements for the degree of
Master of Science
in
Materials Engineering
APPROVED:
F. William Stephenson
July, 1988
Blacksburg, Virginia
Shinzo Onishi

LO Stt,S~ vr.j~"- . , q¥~
Kqn-c.~

Dynamic Electromechanical Measurements of Carbon Black
Loaded SBR
by
Yawlin Hwang
Larry C. Burton, Chairman
Materials Engineering
(ABSTRACT)
The major objectives of this study were to examine
electrical and electromechanical properties of SBR filled
with carbon black in the 0-70 phr range. The experiments
were divided into four parts: dielectric measurement, loss
modulus and phase angle measurements, temperature rise
measurement during stress cycling, and dynamic conductivity
measurement.
It is established that there are three distinct
conduction regimes existing at carbon black loadings below,
at, and above the percolation threshold. Characteristics of
dielectric dispersion depend strongly on carbon black
loading and frequency. Dielectric and AC conductivity
measurements are shown to provide a nondestructive method to
explore the carbon black network inside the rubber.
Both loss modulus and phase angle are related to
hysteresis properties, and to temperature rise due to
compressive cycling. Measurements o.f these parameters will
be discussed in detail, as functions of carbon black
loading, stress and strain amplitudes, and oscillation

frequency. These and other results can be understood in
terms of the mechanics of the carbon black network.
The variation of conductivity with strain amplitude is
related directly to the interplay between the "persistent"
and "transient" fractions of carbon black network. It is
shown that, owing to its experimental accuracy and great
sensitivity to carbon black network changes, the dynamic
conductivity measurement is preferable to traditional
modulus measurements for determining certain dynamic
properties of carbon black filled rubbers.

Acknowledgements
The author wishes to express his sincere appreciation to
his advisor Dr. L.C. Burton for his guidance, and his
invaluable assistance during the course of his study. Many
thanks also go to the members of his committee, Dr. F.W.
Stephenson, and Dr. S. Onishi for their review and
suggestions.
In addition, the author would like to thank his friends
and fellow officemates C.J. Chen, E. Cole, E. Ellis, P.
Johnson, R. Reddy, S. Sen, Chris Turman, A. Vaseashta, N.
Weaver, I.K. YOo, and T. Zhang, who provided both friendship
and support when he needed them the most.
The U.S. Army Tank and Automotive Command is
acknowledged for providing financial support during the
course of this study.
ACKNOWLEDGEMENTS iv

TABLE OF CONTENTS
1.0 INTRODUCTION •••••••••••••••••••••••••••••••••••••••• 1
2 • 0 LITERA~ REV'IEW ••••••••••••••••••••••••••••••••••• 3
2 • 1 CAR.BON BUCK •••••••••••••••••••••••....••••••.•.•••• 4
2.2 CAR.BON BUCK-POLYMER COMPOUNDS ••.•••••••...•.••••... 4
2.3 EFFECT OF COMPOUND MORPHOLOGY ON ELECTRICAL
CONDUCTIVITY ••••••••••••••••..••••••••.•••••••.•...• 5
2 • 4 CONDUCTION MECHANISMS ••••••••••••..••••••...•.•.••.. 6
2 • 5 AC CONDUCTION •.•••••••••••••••••••••..•••••••••••... 9
2.6 DIELECTRIC PROPERTIES •.•••••••.••••••.•...•••••....• 11
2.7 CHARGE CAR.RIERS IN DIELECTRIC MATERIALS •..•...•••... 16
2.8 DYNAMIC PROPERTIES OF RUBBERS ••••••••.•••••••.•..... 18
2.9 EFFECT OF CAR.BON BUCK ON DYNAMIC PROPERTIES ••••.... 20
2.10 EFFECTS OF CAR.BON BUCK ON HYSTERESIS ••••••••.••••• 23
3.0 EXPERIMENTAL METHODS AND MATERIALS •••••••••••••••••• 24
3 • 1 DIELECTRIC MEASUREMENT ••••.•••••••••.•••••••••.....• 24
3.2 LOSS MODULUS AND PHASE ANGLE MEASUREMENTS •..•••••••. 27
3.3 TEMPERA~ RISE MEASUREMENT ••••••••••••.••••.•..••. 28
3.4 DYNAMIC CONDUCTIVITY MEASUREMENT •••••••••••••••••••• 29
4.0 RESULTS AND DISCUSSION •••••••••••••••••••••••••••••• 30
4.1 DIELECTRIC CONSTANT MEASUREMENT ••••...••••••••••••.. 30
4.2 DIELECTRIC LOSS MEASUREMENT •••••••.••••••••.•••••..• 33
TABLE OF CONTENTS V

4.3 THREE REGIMES OF DIELECTRIC RESPONSE ••••••...••••••. 36
4 • 3 • 1 CONDUCTING REGIME •••.•••••••••••••.••.••••••.•.. 3 6
4 • 3 .2 PERCOLATION REGIME ••••••••.•••••••.••••••••••.•• 40
4.3. 3 DIELECTRIC REGIME ••••••••••••••••••••••••••••••• 44
4.4 AC CONDUCTIVITY MEASUREMENT •••••••••••••••••••••••.• 44
4.5 PHASE ANGLE AND LOSS MODULUS MEASUREMENTS ••••••••••• 51
4.6 HYSTERESIS MEASUREMENT •••••••••••••••...•••••.•••••. 57
4.7 TEMPERATURE RISE MEASUREMENT ••••••••••.•.••••••••... 60
4.8 DYNAMIC CONDUCTIVITY MEASUREMENT .•••••.••••••••••.•• 66
4.9 CONDUCTIVITY EFFECT OF DYNAMIC PROPERTIES OF
CARBON BLACK-FILLED RUBBERS ••••••.•.•••••••••••••••. 72
4.9.1 CORRESPONDENCE BETWEEN CONDUCTIVITY AND MODULUS
CHA.NGES ••••••••••••••••••.•••••••••••••••••••••• 73
4.9.2 EFFECTS OF PERSISTENT AND TRANSIENT STRUCTURES ON
CONDUCTIVITY DURING A CYCLE .••••••.••••••••.•.•• 74
4.9.3 PHYSICAL SIGNIFICANCE OF qmin ..•.•.•••••.••••... 75
4.9.4 CONDUCTIVITY RELAXATION AT LOW STRAIN
AMPLITUDES ••••••••••••••••••••••••••••..••••••.. 79
4.9.5 PHYSICAL SIGNIFICANCE OFAg ••••••••••••••.•.•.•• 79
4.9.6 RELATIONSHIP BETWEEN qo-q. AND Aqm .••••••.••.... 87
4.9.7 EFFECTS OF CHANGING VIBRATION FREQUENCy ••••••••• 90
4.9.8 RISE IN Aq AT HIGH STRAIN AMPLITUDES ••••••..•••• 90
4.9.9 THE ASSYMMETRY IN TIME-CURRENT VARIATION CURVE •• 94
5.0 CONCLUSIONS AND RECOMMENDATIONS ••••••••••••••••••••• 96
5. 1 CONCLUSIONS ••••••••••••••••••••••••.•••••.•.•••••••• 96
TABLE OF CONTENTS vi

5.2 RECOMMENDATIONS FOR FUTURE WORK ..•.••..••••.•..•.... 99
BIBLIOGRAPHY 100
CtJR,R,IctJI.tJM VITAE •••••••••••••••••••••••••••••..••...••• 103
TABLE OF CONTENTS vii
LIST OF ILLUSTRATIONS
Figure 1. Equivalent RC circuit in the contact region of carbon aggregates. (From ref.17) ••••••••. 10
Figure 2. Frequency dependence of E and P in the equivalent circuit of Fig.1. (From ref.17) ••• 12
Figure 3. Frequency dependence of resistivity of rubber loaded with 50 phr carbon black •••••••••••.•• 13
Figure 4. Frequency dependence of dielectric constant of rubber loaded with 50 phr carbon black •••••.• 14
Figure 5. A typical hysteresis loop ( SBR with 40 phr, 8% double strain amplitude in compression under 15% static strain, 1Hz) ••.•••••••••••.••••..• 19
Figure 6. Qualitative interpretation of strain amplitude dependence of E t (From ref. 4) ••••..••••..•••. 21
Figure 7. Frequency dependence of dielectric constant of rubbers loaded with different amounts of carbon black. .•••.•••••.••.•••••.•••••..•.•... 31
Figure 8. The dielectric constant of carbon black filled rubber as a function of carbon black loading (frequency = 10 lCHz). •••••••••••••••••.•••.•• 32
Figure 9. Frequency dependence of dielectric loss of rubbers loaded with different amounts of carbon black. ••••••••••••••••••••••••••••.••• 34
Figure 10. The dielectric loss of carbon black filled rubber as a function of carbon black loading (frequency = 10 lCHz). •••••••••••.•••••.••.•.. 35
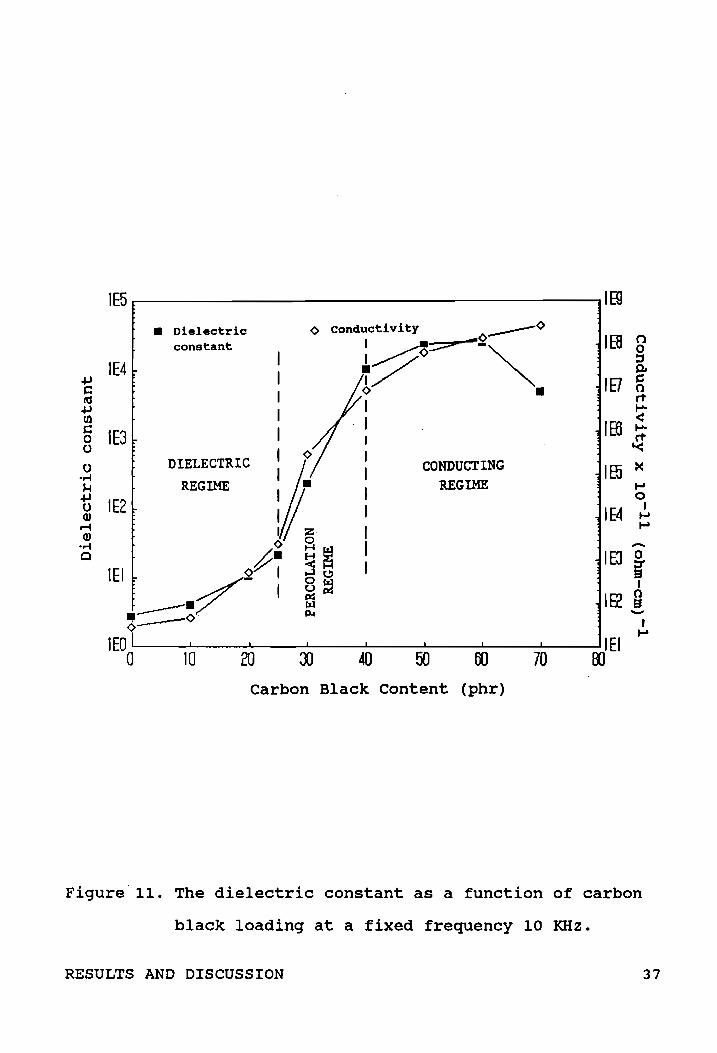
Figure 11. The dielectric constant as a function of carbon black loading at a fixed frequency 10 lCHz ••••••••••••••••••••••••••••••••••••••• 37
Figure 12. The dispersion of dielectric constant of compounds with carbon black loading falling in the conducting regime ••••••••..•..••••...• 38
Figure 13. The dispersion of dielectric loss of compounds with carbon black loading falling in the conducting regime. ••.••••.••••••..••••••••••• 39
LIST OF ILLUSTRATIONS viii

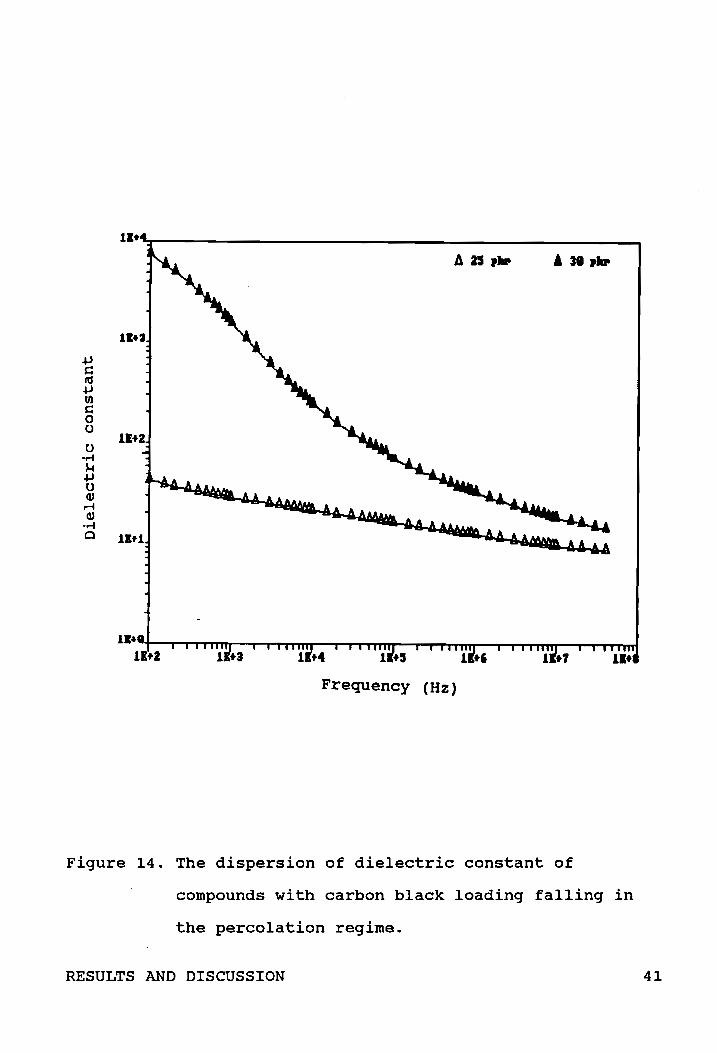
Figure 14. The dispersion of dielectric constant of compounds with car~on black loading falling in the percolaton reg~me ••••••.•••••••.••••••••• 41
Figure 15. The dispersion of dielectric loss of compounds with carbon black loading falling in the percolation regime •••••••••••••••••••.••••••• 42
Figure 16. The dispersion of dielectric constant of compounds with carbon black loading falling in the dielectric regime ••••••••••••••••••••• 45
Figure 17. The dispersion of dielectric loss of compounds with carbon black loading falling in the dielectric regime ••••••••••••••••.••••••...• 46
Figure 18. Frequency dependence of conductivity of rubbers loaded with different amounts of carbon black. ....................................... 47
Figure 19. Frequency dependence of conductivity of rubbers with carbon black loading falling in the dielectric regime. • •• 0. . . . • • . . . . . . . . . . . . . . . .. 49
Figure 20. Frequency dependence of conductivity of rubbers with carbon black loading falling in the percolation regime ••••••••••••••••••••••..•.• 50
Figure 21. Frequency dependence of conductivity of rubbers with carbon black loading falling in the conducting regime •••••••.••••••••..•••••• 52
Figure 22. strain amplitude dependence of phase angle 6 at 1 Hz for rubbers loaded with different amounts of carbon black •••••••••••••••••.•••• 53
Figure 23. The dependence of phase angle 5 upon carbon black loading at a given double strain amplitude of 10% and at a given double stress amplitude of 200 lb. during compressive cycl ing at 1 Hz. ••••••••••••••••.•••••••.•••• 55
Figure 24. The dependence of loss modulus E" upon carbon black loading at a given double strain amplitude of 10% and at a given double stress amplitude of 200 lb. during compressive cycling at 1 Hz •••••••••.•••••••..••••••••••• 56
Figure 25. The dependence of double strain amplitude upon carbon black loading at a given stress amplitude of 200 lb. at 1 Hz •••••••••••..•••• 58
LIST OF ILLUSTRATIONS ix

Figure 26. The dependence of hysteresis loop area upon carbon black loading at a given strain amplitude of 10% and at a given stress amplitude of 200 lb. at 1 Hz ••••••••••••••••• 59
Figure 27. The dependence of Eft x (strain amplitude) 2 upon carbon black loading at a given strain amplitude of 10% and at a given stress amplitude of 200 lb. at 1 Hz •••••••••••••••.• 61
Figure 28. Temperature at the center of specimens of different carbon black content at double strain amplitude of 10%, at 10 Hz •.•••••••••• 62
Figure 29. Temperature at the center of specimens of different carbon black content at double stress amplitude of 200 lb. and at 10 Hz. 63
Figure 30. Dependence of temperature rise on hysteresis loop area at a strain amplitude of 10%, at 10 Hz. ••••••••••••••••••••••••••••••••••••••• 64
Figure 31. Dependence of temperature rise on hysteresis loop area at stress amplitude of 200 lb. at 10 Hz. •••••••••••••••••••••••••••••••••••• 65
Figure 32. Current (top) " and strain vs. time curve at a strain amplitude of 0.02 for specimen of 50 phr carbon black loading at vibration frequency 0 f 1 Hz. ••••••••••••••••••••••••••• 67
Figure 33. Conductivity vs. double strain amplitude at 0.25 Hz for specimen of 40 phr carbon black loading. ••••••••••••••••••••.•••••••••••••••. 68
Figure 34. Conductivity vs. double strain amplitude at 0.25 Hz for specimen of 50 phr carbon black loading. ..••••••••••••••••.••.•••••••••....•• 69
Figure 35. Conductivity vs. double strain amplitude at 0.25 Hz for specimen of 60 phr carbon black loading. •••••••••••••••••••••...••...•.••••.• 70
Figure 36. Conductivity vs. double strain amplitude at 0.25 Hz for specimen of 70 phr carbon black loading. .••.••••••••••.••••••••••.•••••••••.• 71
Figure 37. Carbon black loading dependence of go-~' go' <3C.' and 4gm• •••••••••••••••••••••••••••••.••. 77
LIST OF ILLUSTRATIONS x
Figure 38. Current vs. time curves at increasing amplitudes for specimen of 50 phr carbon black loading at 1 Hz. Upper curve is current; lower curve is strain. Double strain amplitudes (DSA) are given next to figure •••••••.••••••.••••••.••• 80
Figure 39. Normalized conductivity Z as a function of strain amplitude. • ••••••••••••••.•.••••.•...• 88
Figure 40. Variation of Agm with go-~ .•...•••••.....•... 89
Figure 41. Conductivity bandwidth (Ag) vs. DSA for specimen of 40 phr carbon black loading at 0.25 and 1 Hz, respectively .••.•..•.•..•••••• 91
Figure 42. Conductivity bandwidth (4g) vs. DSA for specimen of 50 phr carbon black loading at 0.25 and 1 HZ, respectively •••••••..••••.•.•• 92
Figure 43. Conductivity bandwidth (Ag) vs. DSA for specimen of 70 phr carbon black loading at 0.25 and 1 Hz, respectively •••••.••••••••••.. 93
LIST OF ILLUSTRATIONS xi
LIST OF TABLES
Table 1. Akron sample compositions ••••••.•••.•••..••.••• 25
Table 2. (go-g~~/~~ at different carbon black composl.tl.ons •.••.••.••••••.••..••.••••.•••••••• 78
LIST OF TABLES xii

1.0 INTRODUCTION
Tracked military vehicles such as tanks, armored
personnel carriers and self-propelled artillery make use of
rubber pads on their tracks to damp vibrations and to
prevent unnecessary damage to the road surfaces. These
rubber pads generally consist of a synthetic elastomer, e.g.
styrene-butadiene rubber (SBR), using sulfur as a
crosslinking agent, zinc oxide as an accelerator ,and other
processing aids. Such elastomers must be reinforced by the
addition of fillers such as carbon black.
The united states Army's Tank and Automotive Command
(TACOM) is currently conducting an in-depth study for
improving the field-service life of these tank track
materials. The scope of the work described in this thesis
is designed to assist TACOM in the study of electrical and
dynamic properties of tank track rubber pads. The
objectives are:
1. to determine if AC electrical measurements can be used to
explore the internal structures of carbon black network
within such compounds;
2. to examine the dynamic properties of such compounds by
means of electrical measurements, with carbon black
content as a major variable;
INTRODUCTION 1
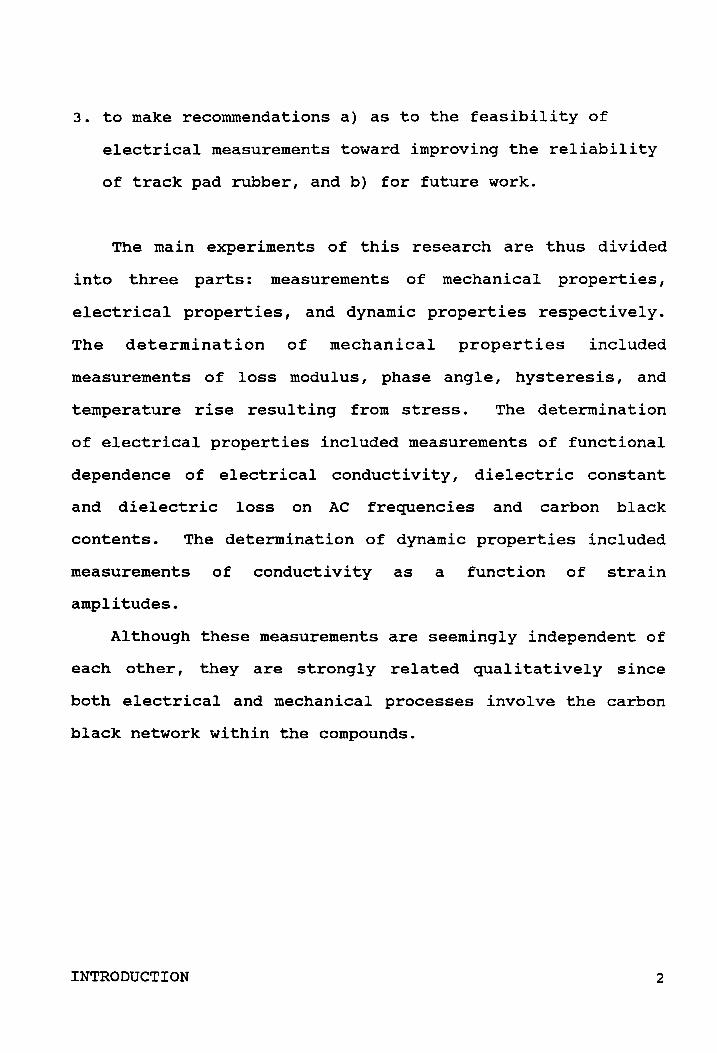
3. to make recommendations a) as to the feasibility of
electrical measurements toward improving the reliability
of track pad rubber, and b) for future work.
The main experiments of this research are thus divided
into three parts: measurements of mechanical properties,
electrical properties, and dynamic properties respectively.
The determination of mechanical properties included
measurements of loss modulus, phase angle, hysteresis, and
temperature rise resulting from stress. The determination
of electrical properties included measurements of functional
dependence of electrical conductivity, dielectric constant
and dielectric loss on AC frequencies and carbon black
contents. The determination of dynamic properties included
measurements of conductivity as a function of strain
amplitudes.
Although these measurements are seemingly independent of
each other, they are strongly related qualitatively since
both electrical and mechanical processes involve the carbon
black network within the compounds.
INTRODUCTION 2

2.0 LITERATURE REVIEW
Polymer-carbon black compounds, such as carbon black
filled rubber, are some of the most extensively studied
systems because of their wide use in the automotive
industry. Carbon black has long been used as a reinforcing
agent in elastomers due to its low cost, ready availability,
and reinforcing abilityl. The original purpose of creating
such a compound was to increase the strength and durability
of an elastomer while still retaining sufficient elastomeric
behavior. Rubber tires, for example, are made of a carbon
rubber mixture which gives enhanced wear resistance over
that of rubber alone.
Most of the studies reported in the past were mainly
focussed on mechanical aspects of the compounds, such as
stress and strain relaxations2 ,3, dynamic properties4- 8
etc •• Research related to electrical properties of the
compounds has been focused on the conductivity as a function
of carbon black 10ading9- 12 , conduction mechanisms13- 16 , and
AC electrical properties17 ,18. However, there are
insufficient studies on the correlation between mechanical
and electrical properties of rubber-carbon black compounds.
LITERATURE REVIEW 3
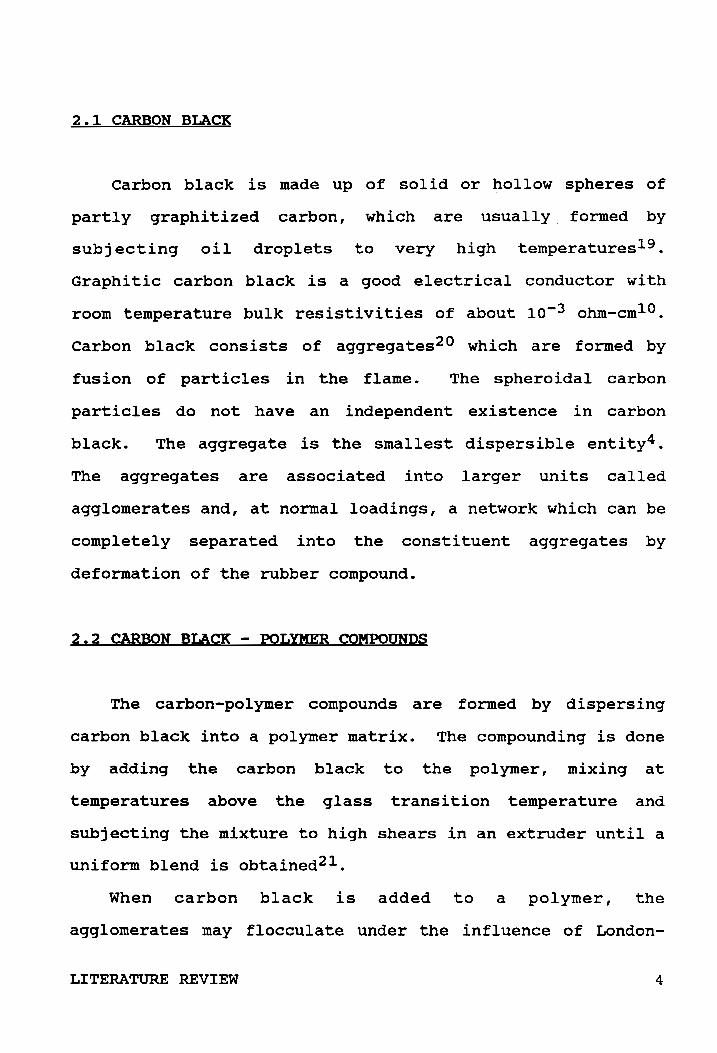
2.1 CARBON BLACK
Carbon black is made up of solid or hollow spheres of
partly graphitized carbon, which are usually formed by
subjecting oil droplets to very high temperatures19 .
Graphitic carbon black is a good electrical conductor with
room temperature bulk resistivities of about 10-3 ohm-cm10 .
Carbon black consists of aggregates20 which are formed by
fusion of particles in the flame. The spheroidal carbon
particles do not have an independent existence in carbon
black. The aggregate is the smallest dispersible entity4.
The aggregates are associated into larger units called
agglomerates and, at normal loadings, a network which can be
completely separated into the constituent aggregates by
deformation of the rubber compound.
2.2 CARBON BLACK - POLYMER COMPOUNDS
The carbon-polymer compounds are formed by dispersing
carbon black into a polymer matrix. The compounding is done
by adding the carbon black to the polymer, mixing at
temperatures above the glass transition temperature and
subjecting the mixture to high shears in an extruder until a
uniform blend is obtained21 •
When carbon black is added to a polymer, the
agglomerates may flocculate under the influence of London-
LITERATURE REVIEW 4

Van der Waals force4 ,22. The tendency of carbon to cluster,
resulting in "structure", depends on the type of carbon
black. For example, hollow carbon spheres form highly
structured compounds, while solid carbon spheres show much
less of a tendency to agglomerate11 • And a network of
interconnected carbon black aggregates can be formed. The
physical properties of carbon-ploymer compounds are affected
mainly by the amount, distribution, and the structure of the
carbon black.
2.3 EFFECT OF COMPOUND MORPHOLOGY ON ELECTRICAL CONDUCTIVITY
The exact morphology of the compound has a profound
effect on the electrical properties. The dependence of the
conductivity on carbon black loading is widely documented11 .
At very low carbon black loading, the conductivity of the
compound is low, characteristic of the polymer. Addition of
carbon black increases the conductivity until a critical
carbon concentration, called "percolation threshold", is
reached at which the conductivity of the compound increases
many orders of magnitude for a small increase in the amount
of carbon black10,11. When more carbon black is added, the
conductivity ultimately saturates at a value characteristic
of the graphitic carbon itself.
The effective medium theory23 predicts a percolation
threshold which depends on particle shape, and occurs at
LITERATURE REVIEW 5

about 33 per cent by volume for spherical conducting
particles. A theoretical discussion of the percolation
problem may be found in the article by Kirkpatrick24 •
The percolation threshold depends on the structure of
the carbon dispersion. It has been shown11 that a compound
made of hollow carbon black spheres has a lower percolation
threshold than a compound made of solid carbon spheres.
This is because these agglomerates can have the same
external dimensions, which are critical for network
formation, at a lower density, due to their porosity.
2.4 CONDUCTION MECHANISMS
Most rubbers have long been appreciated as good
electrical insulators with resistivities in the range of
1013 _1016 ohm-cm25 . Carbon black would be classified as a
moderately good conductor with resistivities in the range of
1-103 ohm-cm. Carbon-polymer compounds are a class of
materials whose electrical properties can cover the range
from insulators to conductors by varying the amount of
carbon black present.
Electrical conductivity of carbon-polymer compounds does
not increase linearly with the volume amount of carbon black
present. The electrical behavior can be divided into three
regimes26 : the dielectric regime, the transition or
percolation regime, and the conducting or metallic regime.
LITERATURE REVIEW 6

The conduction mechanisms in each regime are different.
Considerable experimental efforts have been devoted over
several decades to electrical studies of the mechanisms.
Three distinct physical processes are proposed to control
electron transport in conductor-filled systems. These are
1. Percolative transport27 ;
2. Electron tunneling10 ,15,16,27;
3. Electron hopping1S ,27,2S.
Microscopic conduction within the conductor-filler
particles is controlled principally by ohmic conduction;
between them, it is dominated by quantum mechanical
tunneling or conduction through the polymer. Long-range
macroscopic effects, however, are governed by percolation
phenomena.
Percolation theory27 predicts a filler concentration
threshold where the compound makes a transition between
tunneling (or polymer transport) and conductor-filler ohmic
conduction. When the concentration of the carbon is beyond
this percolation point, the carbon chains form a continuous
network, and the resulting conductivity is graphitic in
nature. As the concentration is decreased to below the
percolation point, conduction depends on electron tunneling
through the insulating polymer-filled gaps between carbon
aggregates. The tunneling may be either of the normal
quantum mechanical type or of a novel sort introduced by
sheng10 • The latter mechanism incorporates the former, but
LITERATURE REVIEW 7

the energy of a tunneling electron is augmented, i.e., the
tunneling barriers between aggregates are lowered and
narrowed by thermally activated voltage fluctuations across
the gaps. The gaps between carbon aggregates actually
control the conductivity rather than the black itself.
Hopping electrons are characterized by the fact that
they spend most of the time in localized sites but can make
a thermally-assisted hopping transition over a potential
barrier to neighboring localized sites28 . The probability
of electron hopping transition is dependent upon the
combined effect of the distance between two aggregates and
the potential barrier height which has to be overcome. It
was shown26 that, when the distance is greater than looA,
electron tunneling becomes negligible and the electron
hopping mechanism is dominant; when less than IOOA, the
fluctuation-induced tunneling is the dominant conduction
mechanism at room temperature, which requires negligible
activation energy. In general, at normal loadings and
normal temperatures, the dominant mechanism of DC conduction
is either tunneling through the gap, assisted by thermal
fluctuations, or thermal activation of electrons over the
potential barrier of the gap. These two mechanisms may be
experimentally indistinguishablel8 •
LITERATURE REVIEW 8

2.5 AC CONDUCTION
The carbon black aggregates are dispersed in the rubber
so that a conductive network is formed. Electrically, the
carbon black filled rubber is a network of a large number of
RC circuits randomly interconnected with each other.
However, for simplicity we assume that the whole body of the
filled rubber can be represented by a single RC circuit
shown in Figure 117. Kawamot017 showed that this simple RC
circuit can be used in modelling the results of AC
measurements. It will be shown later that this model can
only be successfully applied when the loading of conductive
fillers is near or above the percolation threshold.
According to Kawamoto's model17 , "there are two
electrical current components competing with each other in a
contact region between carbon aggregates: one is a
conduction current through an internal contact resistance
Rc; the other is a displacement current through a contact
capacitance Cc. RA represents the resistance within the
carbon aggregates." The contact resistance in this model is
due to a tunneling effect, or an ohmic contact effect, or to
other sources.
At low frequencies, the net resistance is equal to
RA+RC; at high frequencies, the net resistance is equal to
RA since the impedance of Cc at high frequencies is
considered to be negligibly small compared to RC and RA.
LITERATURE REVIEW 9

CARBON AGGREGATE
.-- ....... .JIII". ,
/' , CCNTACT I REGION .-.-1 RC
\
CARBON AGGREGATE
cc } Rubber I Medium
Figure' 1. Equivalent RC circuit in the contact region of
carbon aggregates. (From ref.17)
LITERATURE REVIEW 10

Based on this model, a theoretically estimated curve is
drawn in Figure 2, showing the dependence of resistivity and
dielectric constant upon frequency. The resistivity
saturates at PL(=PA+fL) at low frequencies, decreases with
frequency, and stays at FH(=fA) at high frequencies. The
dielectric constant stays at a high plateau at low
frequencies, and drops by a factor of w2 at high
frequencies, where w is the angular frequency. Figures 3
and 4 show the experimental results of the variation of
resistivity and dielectric constant, respectively, with
frequency at the loading of 50 . parts per hundred rubber
(phr), both of which are quite consistent with the picture
given above except that the dielectric constant drops at
high frequencies by a factor of w1 . 2 rather than w2 .
2.6 DIELECTRIC PROPERTIES29
According to Maxwell's equations, the current in the
frequency domain can be defined in terms of direct
conduction current and displacement current:
I (w) = UoECw) + iwD(w)
= { Uo + iWEo[E' (w) -iE"(w)]}E(w)
= { Uo + EoWE"(W) + iWEoE' (w) } E (w) (2.1)
in-phase out-of-phase
The E'(W) gives the component of displacement current, which
LITERATURE REVIEW 11

r .C CC
'cL= (1 + RAlRC)2
~ ~ .IJ .IJ -,... -,... PL fA + Pc > > = • .-4 .,... .IJ .IJ
fH fA fJl +J = -.-4 -,... fJl ~ OJ ~ OJ
Slt (lIRA) 2
w2cc
Frequency, w
Figure" 2. Frequency dependence of Eand f in the
equivalent circuit of Fig.l. (From ref.17)
LITERATURE REVIEW 12

-a o I S .d o -
lEt4~ ________________________________________________ -,
• 59 phI'
~ lI+3 .~
> .~
+J til .~
til OJ ~
lE.2+-____ ~~~~~~--~~nn~~~nn~_r~Tnnr_._r~ntl 1£+2
(Hz)
Figure" 3. Frequency dependence of resistivity of rubber
loaded with 50 phr carbon black.
LITERATURE REVIEW 13

• 51, ..
Frequency (Hz)
Figure'4. Frequency dependence of dielectric constant of
rubber loaded with 50 phr carbon black.
LITERATURE REVIEW 14

is out-of-phase with the driving field, and therefore does
not contribute to power loss, while the E" (w) gives the
component of current in-phase with the driving field, and
therefore contributes to power loss. For this reason we
refer to E"(W) as the "dielectric loss".
The frequency-domain dielectric induction Dew) can thus
be expressed as
D(w) = EoE*(W)E(W) = Eo[E'(W) -iE"(W)]E(w) (2.2)
where E* (w) is the complex dielectric constant. The real
part of D(w) represents the component of the total induced
charge at the electrodes which is in phase with the driving
field E(w) at the frequency w, and this component includes
the free space contribution since there is no loss
associated with free space. The imaginary part of Dew),
E"(W), gives the component of the total induced charge which
is out of phase with the driving field E(w).
Since dielectric measurements are concerned with the
movement of charge, i.e., with the electric current, it
follows from eqn.(l) that the DC conductivity uo must appear
in the result. It was shown that no instrument can
distinguish between true dielectric response which does not
include Uo and the effective dielectric response which does.
If we take into account this effective dielectric response,
eqn.(l) can be written as
LITERATURE REVIEW 15

lew) = iWEoE*(W)E(W) (2.3)
where E* (w) denotes the effective dielectric constant as
measured by the instrument and is expressed as
E* (w) = E I (w) - i{E" (w) + [Uo/W]} (2.4)
As can be seen from this equation, the DC conductivity makes
a contribution to the apparent dielectric loss, which
diverges towards zero frequency, while it does not
contribute to the real part of complex dielectric constant.
A behavior in which E" (w) 0( l/w while E' (w) ......,. constant as w
-+0 is, therefore, conclusive evidence that the dominant
process is direct current conduction in the material in
question in the relevant frequency range.
2.7 CHARGE CARRIERS IN DIELECTRIC MATERIALS30
The dielectric effects of free charge carriers only
become significant at frequencies of the order of the
reciprocal collision time, which fall in the 10-100 GHz
range. Thus the dielectric effects of free charge carriers
are negligible in the frequency range in which we are
predominantly concerned with (100Hz-40MHz). However, these
free charge carriers may give rise to such a high DC
LITERATURE REVIEW 16
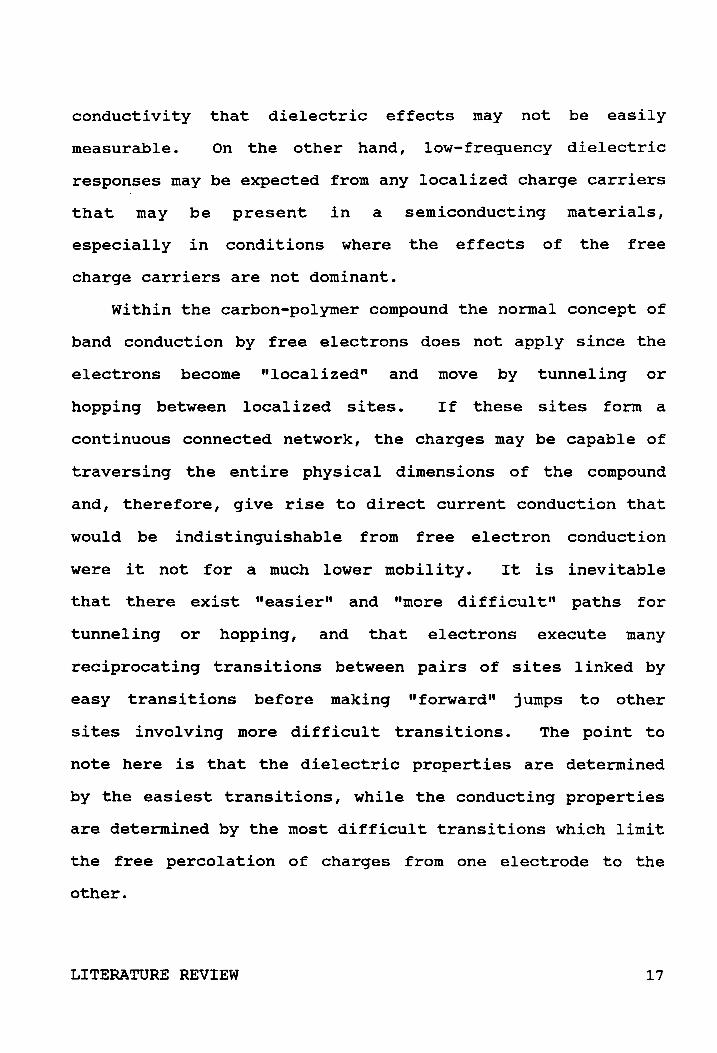
conductivity that dielectric effects may not be easily
measurable. On the other hand, low-frequency dielectric
responses may be expected from any localized charge carriers
that may be present in a semiconducting materials,
especially in conditions where the effects of the free
charge carriers are not dominant.
Within the carbon-polymer compound the normal concept of
band conduction by free electrons does not apply since the
electrons become "localized" and move by tunneling or
hopping between localized sites. If these sites form a
continuous connected network, the charges may be capable of
traversing the entire physical dimensions of the compound
and, therefore, give rise to direct current conduction that
would be indistinguishable from free electron conduction
were it not for a much lower mobility. It is inevitable
that there exist "easier" and "more difficult" paths for
tunneling or hopping, and that electrons execute many
reciprocating transitions between pairs of sites linked by
easy transitions before making "forward" jumps to other
sites involving more difficult transitions. The point to
note here is that the dielectric properties are determined
by the easiest transitions, while the conducting properties
are determined by the most difficult transitions which limit
the free percolation of charges from one electrode to the
other.
LITERATURE REVIEW 17

2.8 DYNAMIC PROPERTIES OF RUBBERS
The term. "dynamic properties" as applied to elastomers
refers to the response to periodic or transient forces which
do not cause failure or appreciable fatigue during the
investigation. The dynamic properties of rubber are altered
tremendously by the addition of a filler, e.g. carbon black.
The dynamic properties of rubber are best visualized in
terms of a specimen undergoing uniform sinusoidal
deformation. It is convenient to consider the dynamic
properties of rubbers in terms of their elastic and viscous
moduli. A useful description4 of the dynamic properties is
given by
where E* = E' = E" =
It is also
angle, by
E* = E' + iE"
dynamic, or
elastic, or
viscous, or
convenient
tanS =
complex, modulus
in-phase, modulus
out-of-phase, loss modulus.
to define the phase angle,
Elt E'
(2.5)
or loss
(2.6)
If the stress is plotted against strain, rather than time, a
hysteresis loop is obtained, as shown in Figure 5, for a
Fort Belvoir sample. The maximum strain and stress,
LITERATURE REVIEW 18

STRAIN
Figure 5. A typical hysteresis loop (SBR with 40 phr, 8%
double strain amplitude in compression under 15%
static strain, 1Hz)
LITERATURE REVIEW 19

represented by segments BF and AB, can be measured and
converted to dynamic parameters by definition
and
= AB/An, BF/Lo
CD sinS =_ ........ -AB
where Ao = area of the hysteresis loop
and Lo = thickness of the specimen.
(2.7)
(2.8)
The area inside the loop represents the mechanical work
which is not recovered as such during a cycle but instead is
converted to heat. For sinusoidal deformation, the heat H
generated by hysteresis is given by H = 11' e 2E", which is
proportional to the area of the hysteresis loop, where E is
the strain amplitude and E" is the loss modulus.
2 .9 EFFECT OF CARBON BLACK ON DYNAMIC PROPERTIES
The principal effects of carbon black on the dynamic
properties of rubber have long been established4 : (a) an
increase in elastic modulus E' (over the pure gum value);
(b) an increase in phase angle; (c) dependence of E' on
strain amplitude (not found with pure gum).
The elastic modulus curves are represented in idealized
form in Figure 6. The idealized curve is shown as leveling
off at a value ~ at high amplitude, and at G~ at low
amplitude. PayneS attributed the effect of carbon black at
the high amplitude to a combination of a hydrodynamic effect
LITERATURE REVIEW 20

REGION DUE TO INTERAGGREGATE' INTERACTION
ADDITIONAL CROSS LINKAGE DUE TO FILLER RUBBER LINKAGES
HYDRODYNAMIC EFFECT DUE TO CARBON BLACK
PURE GUM MODULUS
LOG SHEAR STRAIN
Figure" 6. Qualitative interpretation of strain amplitude
dependence of G' (From ref.4)
LITERATURE REVIEW 21

and additional effective crosslinks due to rubber-filler
bonds. The difference between Go' and G~', which we will
call AG', was attributed to the "structure" of the carbon
black, which results from the interaggregate association by
physical (van der Waals type) forces.
At normal loadings, carbon black aggregates interact to
form a network. The contribution of carbon black to
augmentation of elastic modulus, at any level of strain
amplitude, is due to the remaining throughgoing network,
whose presence appears to be SUbstantiated by electrical
measurement. The network is rigid at very low strain
amplitudes but breaks down completely at extremes of
oscillation, at high amplitudes. The transition from a
network to isolated aggregates is continuous. This accounts
for the amplitude effect, in which the interaggregate
interaction appears to be responsible for in dynamic
measurements. During strain cycling, the aggregate-to
aggregate transient structures are continually being broken
down and reformed. This is a dissipative process which
accounts for hysteresis.
The dynamic properties of carbon black-rubber systems
are mainly ascribed to8 : (a) the structure which results in
the stiffness of the compounds at the lower end of the
strain range; (2) the hydrodynamic effects of the carbon
black particles embedded in the viscoelastic medium, and (3)
adhesion between carbon black and rubber, which is
LITERATURE REVIEW 22

increasingly important at larger strains. These factors are
clearly interrelated. The amplitude effect on E' was shown
to increase with increasing loading of a given black and
with increasing reinforcing character of the black.
2. 10 EFFECTS OF CARBON BLACK ON HYSTERESIS
Rubber hysteresis is the mechanical energy that is lost
or dissipated as heat during deformation of the material.
It is also an important factor in determining the strength
of carbon black-rubber compounds31 • It has been shown4 that
carbon black type and loading have a pronounced effect on
rubber hysteresis in a wide variety of vulcanized rubber
systems.
Addition of carbon black to the rubber increases the
hysteresis32 • Because carbon black is much stiffer than the
rubber itself, the deformation of a filled compound occurs
essentially only in the rubber phase. The strain in the
rubber phase is thus larger than the overall strain. This
is termed "strain magnification"32 • Hysteresis increases
with increasing deformation; in other words, the strain
amplification by carbon black acts to increase hysteresis.
On the other hand, the carbon black also reduces the volume
of deformable material, in which at least part of the
hysteresis occurs I and in this respect acts to reduce the
hysteresis.
LITERATURE REVIEW 23
3.0 EXPERIMENTAL METHODS AND MATERIALS
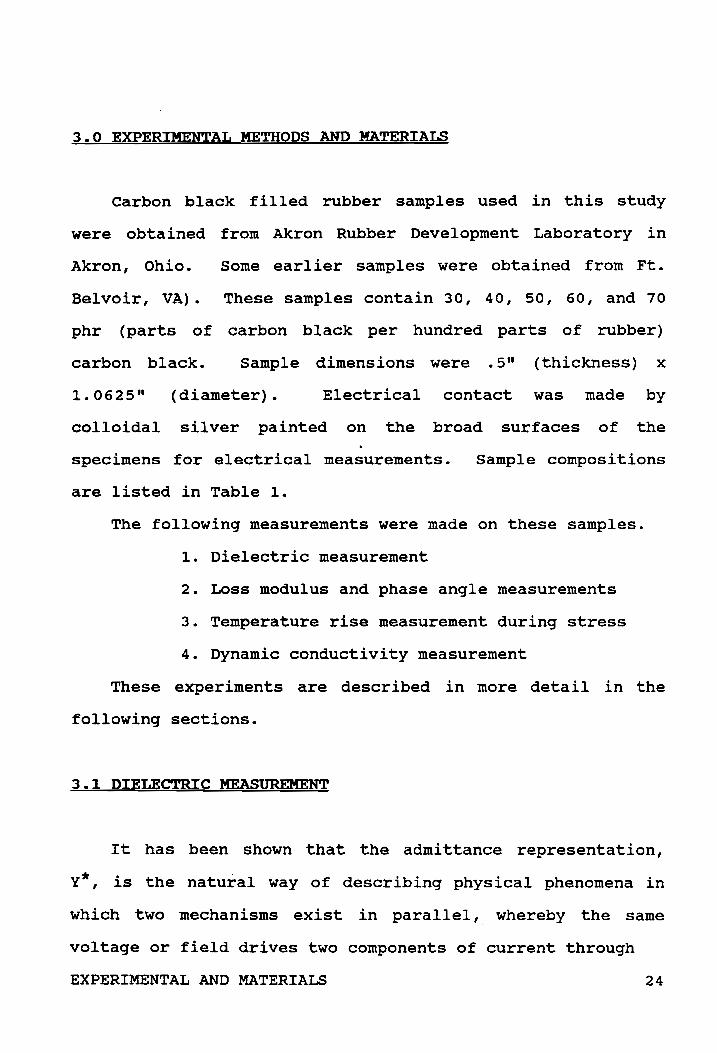
Carbon black filled rubber samples used in this study
were obtained from Akron Rubber Development Laboratory in
Akron, Ohio. Some earlier samples were obtained from Ft.
Belvoir, VA). These samples contain 30, 40, 50, 60, and 70
phr (parts of carbon black per hundred parts of rubber)
carbon black. Sample dimensions were .5" (thickness) x
1.0625" (diameter). Electrical contact was made by
colloidal silver painted on the broad surfaces of the
specimens for electrical measurements. Sample compositions
are listed in Table 1.
The following measurements were made on these samples.
1. Dielectric measurement
2. Loss modulus and phase angle measurements
3. Temperature rise measurement during stress
4. Dynamic conductivity measurement
These experiments are described in more detail in the
following sections.
3.1 DIELECTRIC MEASUREMENT
It has been shown that the admittance representation,
y*, is the natural way of describing physical phenomena in
which two mechanisms exist in parallel, whereby the same
voltage or field drives two components of current through
EXPERIMENTAL AND MATERIALS 24
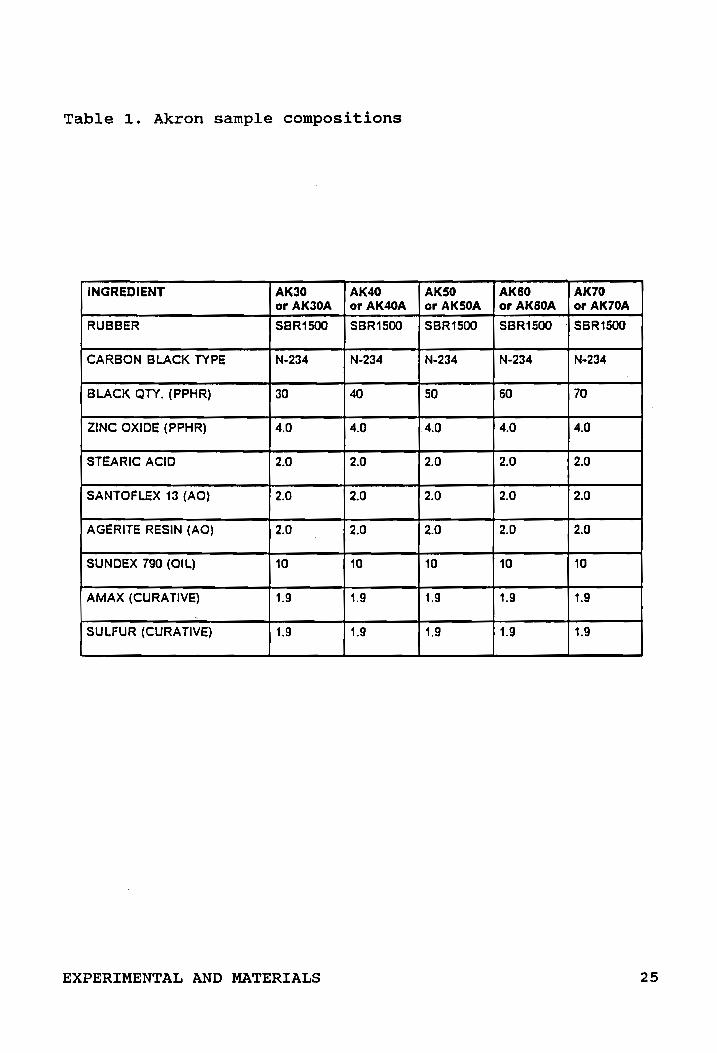
Table 1. Akron sample compositions
INGREDIENT AK30 AK40 AK50 AKSO AK70 or AK30A or AK40A or AK50A or AK60A or AK70A
RUBBER SBR1500 SBR1500 SBR1500 SBR1500 . SBR1500
CARBON BLACK TYPE N .. 234 N .. 234 N .. 234 N-234 N-234
BLACK QTY. (PPHR) 30 40 50 60 70
ZINC OXIDE (PPHR) 4.0 4.0 .4.0 4.0 4.0
STEARIC ACID 2.0 2.0 2.0 2.0 2.0
SANTOFLEX 13 (AO) 2.0 2.0 2.0 2.0 2.0
AGERITE RESIN (AO) 2.0 2.0 2.0 2.0 2.0
SUNDEX 790 (OIL) 10 10 10 10 10
AMAX (CURATIVE) 1.9 1.9 1.9 1.9 1.9
-SULFUR (CURATIVE) 1.9 1.9 1.9 1.9 1.9
EXPERIMENTAL AND MATERIALS 25

the system33 • A typical example is the presence of a finite
DC conduction mechanism in parallel with the dielectric
polarization which is inevitably present in all materials.
Since the equivalent circuit of the carbon black-rubber
compounds has been assumed to be a resistance in series with
a parallel R-C combination, the admittance is chosen to be
the measured quantity so that the other dielectric functions
(dielectric constant and loss, AC conductivities etc.) can
subsequently be determined by calculation.
The admittance Y* (w) is defined as the ratio of the
current to the voltage, i.e. I(w)/V(w), and can be written
as
Y*(w) = G(w) + iB(w)
= G (w) + i wc' (w)
where G(w) = effective conductance
B(w) = effective susceptance
C· (w) = effective capacitance
w = angular frequency.
The conductivity U(w), dielectric constant
(3.1a)
(3.1b)
E' (w) I and
dielectric loss E" (w) can then be determined through the
measured quantities G and B according to the relationships
given below:
G(w) = U(w) A d
EXPERIMENTAL METHODS AND MATERIALS
(3.2)
26

B(w) w
G(w) w
= C I (w) = E I (w) ~ (3.3)
A = C" (W) = E" (w) cr- (3.4)
where A is the area of the broad surface of the sample, d is
the thickness of the sample, and C"(w) is the imaginary part
of the effetive capacitance.
A Hewlett Packard 4194A Impedance Analyzer was used to
measure the admittance of all samples in the frequency range
of 100Hz to 40MHz.
3 • 2 LOSS MODULUS AND PHASE ANGLE MEASUREMENTS
The dynamic modulus measurements of carbon black-filled
rubber were carried out using the INSTRON 1331 Dynamic
Material Testing Machine. This testing system is capable of
applying loads to the test sample in the range of a few
pounds to ±1000 lb .• Test specimens can be cycled from very
low frequency (0.001 Hz) to frequencies as high as 200 Hz,
and displacement amplitudes range from micro-inches to ±O.S
inches.
A sinusoidal displacement in compression was applied for
all the testings. The testings are two-fold: the
cylindrical specimens of different carbon black contents
were first precompressed to a constant strain of 15% and
allowed to relax for 20 minutes before starting the
EXPERIMENTAL METHODS AND MATERIALS 27

compressive strain cycling of 1 HZ, first at very low strain
amplitude and then at successively increasing amplitudes;
or, similarly, they were first precompressed to a constant
stress of 200 lb prior to a constant stress amplitude (200
lb) cycling of 1 Hz. Dynamic strains and stresses referred
to throughout this thesis are peak-to-peak. In each case, a
hysteresis loop at each amplitude for each sample was
recorded with an X-Y recorder 1 minute after starting. Data
measured were stress and strain. Appropriate geometrical
measurements were then made by ruler on each chart and the
desired calculations were performed by computer in order to
determine the out-of-phase loss modulus E" and phase angle
s.
3.3 TEMPERATURE RISE MEASUREMENT
Temperature increase due to heat generation inside the
sample under cyclic compression was also measured, during
which the vibration frequency was fixed at 10 Hz to simUlate
road conditions. The temperature was measured by a
thermocouple inserted in the center of the specimen. The
tip of the thermocouple was bare, and the output of the
thermocouple was made by a digital readout. Heat radiation
from the surface of the specimen was minimized by inserting
a bakelite plate, 1" diameter and 0.1" thick, on the loading
surface and wrapping glass wool around the side surface of
EXPERIMENTAL METHODS AND MATERIALS 28
the specimen. The temperature rise was measured at 23 0 C and
at two testing conditions: 10% dynamic strain at 10 Hz; and
200 lb. dynamic stress amplitude at 10 Hz.
3.4 DYNAMIC CONDUCTIVITY MEASUREMENT
For dynamic conductivity measurement (as a function of
strain amplitude), a sinusoidal displacement in compression
was applied using the INSTRON at room temperature. The
cylindrical specimens of different carbon black compositions
were first precompressed to 15% strain and then allowed to
relax for 20 minutes prior to a compressive cycling of 0.25
Hz. A KEITHLEY 485 Picoammeter was used to measure the
current flow at a constant voltage across the specimens.
Variation of the current with time at different strain
amplitudes was recorded by a chart recorder, first at the
lowest compressive strain cycling (Double strain Amplitude,
DSA = 0.001). Measurements continued with progressively
increasing strain cyclings until DSA=0.2 was reached. Only
the maximum and minimum current values at each strain
amplitude were taken every 5 minutes after each cycling.
These current values were then converted into conductivities
by calculation according to the applied voltage and the
sample geometry.
EXPERIMENTAL METHODS AND MATERIALS 29
4.0 RESULTS AND DISCUSSION
4.1 DIELECTRIC CONSTANT MEASUREMENT
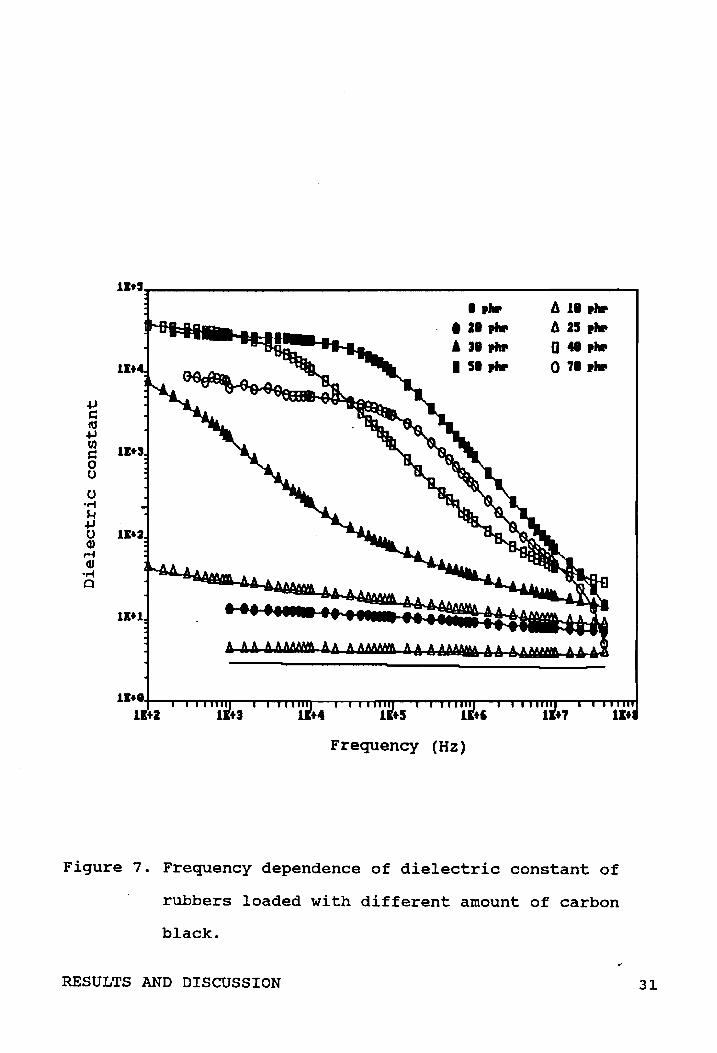
Figure 7 is a plot of dielectric constant as a function
of frequency, showing that dielectric constant decreases
with increasing frequency for all compounds, and that the
dispersion becomes more and more pronounced with carbon
black loading. However, as can be seen in Figure 8, the
dielectric constant first. increases with carbon black
loading up to 60 phr, and then decreases with still higher
loading, indicating that the carbon black aggregates are
already well connected in the form of a large number of
conductive paths throughout the composite after carbon black
loading of 60 phr. Since the dielectric constant represents
the ability of storing polarized charges, as the number of
conductive paths builds up, this charge storage ability is
expected to decrease with carbon black loading as a result
of metal-like conduction behavior throughout the solid.
The increase in dielectric constant during dielectric
and percolation regimes can be understood as due to the
reduction in distance between aggregates which serve as the
electrodes of a capacitor, since capacitance increases as
the distance between electrodes decreases. After carbon
black loading reaches the percolation threshold (at about 25
phr), a pronounced increase in dielectric constant follows
RESULTS AND DISCUSSION 30
..., s:: tU ..., f/) s:: o u u .~
J..f ..., U QJ ,.... QJ .~
C
11+
.... t 1 •• _
A 3 .. .. • 5 .. ...
A 11._ A 15._ o •• IIP o 7 •• _
lE •• I+-----~~--~~~~ __ ~Mnw__r~nT~--~~nnr_,_rTnmm 11+a
Frequency (Hz)
Figure 7. Frequency dependence of dielectric constant of
rubbers loaded with different amount of carbon
black.
RESULTS AND DISCUSSION 31

lE5
- at 10KHz .~ lE4 ~--+J • s::
R:J +J til
lE3 s:: 0 0
0 -..... ~
1E2 / +J 0 OJ .-t OJ .....
/-Cl lEI /'-
-------lEO
0 10 ro :xl 40 00 00 70 Carbon Black Content (phr)
Figure 8. The dielectric constant of carbon black-filled
rubber as a function of carbon black loading
(frequency = 10KHz).
RESULTS AND DISCUSSION 32
due to the combination of two major effects: one is the
increase in the number of "capacitors" within the compound
(i.e. number of contacts between aggregates); the other is
the reduction in distance between aggregates. This simple
geometrical model of dielectric response can be applied to
carbon black-rubber compounds falling in dielectric and
percolation regimes, while the "true" dielectric response
will not be easily measurable for compounds in metallic
regime owing to the presence of high direct current
conduction, which will be discussed later. An electrical
percolation can be observed in Figure 7 at the loading of 25
phr, below which the dielectric constant only shows slight,
nearly frequency-independent, dispersion with frequency.
4.2 DIELECTRIC LOSS MEASUREMENT
The frequency dependence of dielectric loss of all
compounds is plotted in Figure 9, showing that the
dielectric loss is nearly frequency-independent for
compounds of low carbon black loading «25 phr), with only a
tiny loss peak observed in the frequency range 10-100KHz.
However, the dispersion becomes more and more pronounced
with increasing carbon black loading (>25 phr).
Figure 10 shows that the dielectric loss increases with
carbon black loading and an electrical percolation can also
be observed at a loading of 25 phr carbon black.
RESULTS AND DISCUSSION 33

.... I Z .... A 31 ... I 5 ....
A 11 ... A Z5", o 41._ o ., ....
ll-a+--r~~~--~~~~-r~~~~~~nn~~~Tn~~~~nm 11+2
Frequency (Hz)
Figure 9. Frequency dependence of dielectric loss of
rubbers loaded with different amount of carbon
black.
RESULTS AND DISCUSSION 34

lE6~-------------------------------------
lE5 - at 10KHz
!!! lE4 /-v, lE3
:0; lE2, /-lEI ..
QJ ...... /-.~ lEO _
Q IE-I __ ./
-lE-2
~.
~. -----.
lE-3~-----~-------~I-------~----------~----~I-------~I~-----~I----~ o 10 40 50 70 00 Carbon Black Content (phr)
Figure 10. The dielectric loss of carbon black-filled
rubber as a function of carbon black loading
(frequency = 10 KHz).
RESULTS AND DISCUSSION 35

4 • 3 THREE REGIMES OF DIELECTRIC RESPONSE
The existence of an electrical threshold in the above
measurements suggests35 that different physical mechanisms
of dielectric response are involved below and above the
threshold, which will be discussed later. Therefore,
according to Figure 7, three different regimes are defined26
and replotted in Figure 11: these are the dielectric regime,
percolation regime, and conducting regime.
4.3 • 1 CONDUCTING REGIME
In this regime the volume fraction of carbon black is so
large(>40 phr) that the carbon black aggregates touch each
other and a continuous conductive network is formed, in
which the electrons move freely along conductive paths as in
a metal. The dielectric dispersion of compounds with
different carbon black loading falling in the conducting
regime is plotted in Figures 12 and 13, respectively. As
can be seen in these figures, no loss peaks are observable
within the whole measuring frequency range and instead, the
dielectric loss rises towards low frequencies steeply,
following a power law relation, eqn (2.4), with n = 1, while
the dielectric constant approaches a constant value towards
low frequencies. This phenomenon is due to the presence of
DC conductivity, which gives a contribution of the form
RESULTS AND DISCUSSION 36
lE5 IEQ
• Dielectric <> conductivity .,.-----<> lEa n constant ~7~:;> -2~ 0
lE4 I :s I
g, +J 1E7 ~ r:: I <> • 0 CO I rt +J I
..... ttl I lEa < r:: I ..... 0 lE3 rt 0
:~: '<
0 DIELECTRIC CONDUCTING 1E5 >C 0.-1 $..4 REGIME REGIME .... +J lE2 ;f~
0 0 1&1
I Q) ....
I""'i .... Q)
OM ~<> H~ -Q • H 1E3 0
lEI 2~1 ~ ~ ::r Ef I
-/ I ~ 1E2 0
~:::::~. ~ Ef -I <> .... tEO IEl
0 10 ro 3J 40 50 00 70 00
Carbon Black Content (phr)
Figure 11. The dielectric constant as a function of carbon
black loading at a fixed frequency 10 KHz.
RESULTS AND DISCUSSION 37

o 41,_ I 5.'_ 07. , ..
11.1+---------____ ~~~~~""W_~~~mT~~TTnnr_~rTnm~ 11+2
Frequency (Hz)
Figure 12. The dispersion of dielectric constant of
compounds with carbon black loading falling in
the conducting regime.
RESULTS AND DISCUSSION 38

lit
D .... I 5 •• _
0.,1.-
11+1+-~~~~--~~~~-r"~mr~~~nnr-~TTTnnr~-rTTnm lit a
Frequency (Hz)
Figure 13. The dispersion of dielectric loss of compounds
with carbon black loading falling in the
conducting regime.
RESULTS AND DISCUSSION 39
uo/w, from eqn (2.4),to the dielectric loss, while making no
contribution to the dielectric constant.
Since a large number of conductive paths exist between
electrodes in this regime, most electrons are considered as
free charge carriers, which gives rise to high DC
conductivity and makes the dielectric effect not measurable.
It was shown30 that the dielectric effect of free electrons
will only become significant at frequencies of the order of
the reciprocal collision time, which fall in the 10-100GHz
range, far beyond our measuring frequency range «100MHz).
4.3.2 PERCOLATION REGIME
within this regime, the inversion between conducting and
dielectric structures takes place, where some of the carbon
black aggregates begin to touch each other and a few
conductive paths are formed. Most of the aggregates remain
separated from each other but the gap width is greatly
reduced.
As can be seen in Figures 14 and 15, the dispersions of
both dielectric constant and dielectric loss rise towards
low frequencies. This simultaneous presence of strong low
frequency dispersions of both dielectric constant and loss
is a result of "genuine" dielectric phenomena. Since most
electrons are localized within carbon aggregates in this
regime, the effects of free electrons, causing high DC
RESULTS AND DISCUSSION 40
..JJ s:: ItS ..JJ OJ s:: o o o ..... ,.... ..JJ o Q) M Q) ..... o
1 •• ~ ____________________________________________________ ~
It, 2S ... , 31 ...
Frequency (Hz)
Figure 14. The dispersion of dielectric constant of
compounds with carbon black loading falling in
the percolation regime.
RESULTS AND DISCUSSION 41

Frequency (Hz)
A as •• A 31 ...
Figure 15. The disp~rsion of dielectric loss of compounds
with carbon black loading falling in the
percolation regime.
RESULTS AND DISCUSSION 42

conductivity, are not dominant, so that the dielectric
effect of localized electrons may be measurable.
Fluctuation-induced electron tunneling10 ,15,16 has been
shown to be the dominant conduction mechanism in the
percolation regime where the average gap width (the distance
between aggregates) is not too large. Since this tunneling
current is strongly gap width-dependent, and the gap width
varies within the compounds, the probability of tunneling
transitions between aggregates thus varies, resulting in
both easy paths and more difficult ones for tunneling.
Under the applied AC electric field, the fluctuation-induced
tunneling transitions between carbon black aggregates will
be executed through the easiest paths many times in both
directions, while the more difficult transition paths will
be traversed less frequently 30. Therefore, these tunneling
electrons show both a "dielectric" property and
simultaneously a "conducting" property. The dielectric
effect is determined by the dipole-like motion with
tunneling electrons jumping back and forth between carbon
aggregates, while the conducting effect is determined by the
free electron-like behavior with tunneling electrons
traversing over many aggregates. The DC conducting property
will not be dominant until the conducting regime is reached,
where the free percolation between electrodes takes place.
RESULTS AND DISCUSSION 43
4.3.3 DIELECTRIC REGIME
The structure of carbon black aggregates in this regime
is an inversion of that of the conducting regime, in which
the small, isolated carbon black aggregates are well
dispersed in the rubber continuum. The gap width between
two aggregates is so large that the dominant conduction
mechanism is considered to be electron hopping transition
between aggregates (i. e. thermally activated transport of
electrons over a potential barrier) rather than electron
tunneling.
As can be seen in Figures 16 and 17, the dispersions of
both dielectric constant and dielectric loss are nearly
frequency-independent, which is usually found experimentally
in very low loss materials.
4.4 AC CONDUCTIVITY MEASUR.EMENT
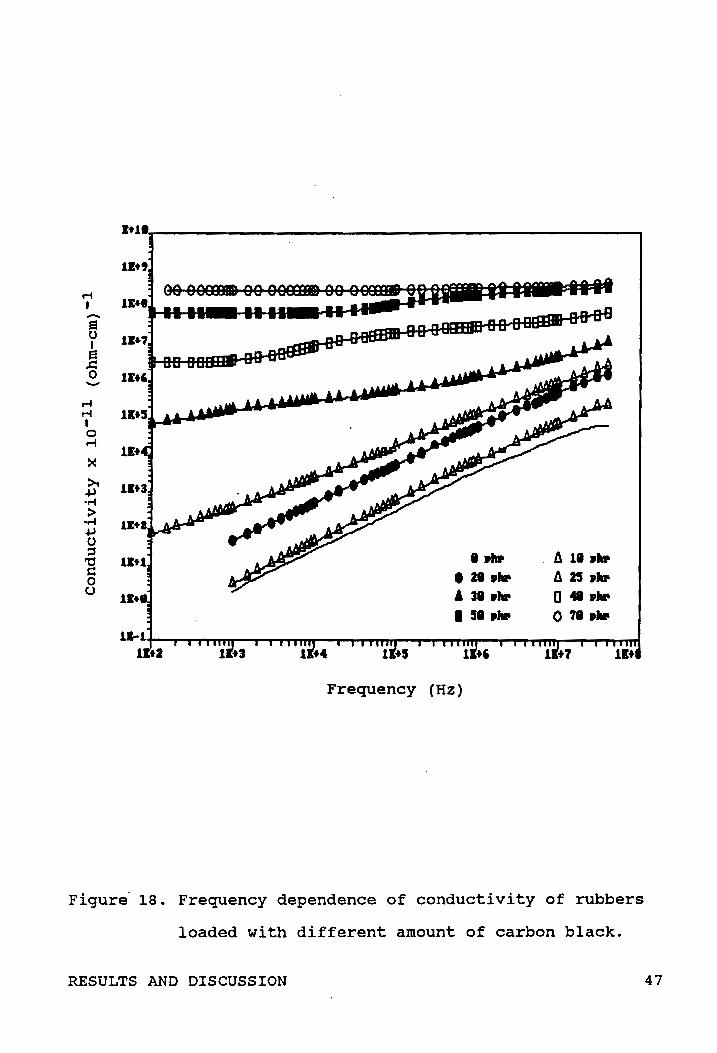
Figure 18 is a plot of the frequency dependence of
conductivity of all compounds, showing that the conductivity
generally increases with increasing frequency. However, the
extent of dispersion is different for each compound,
decreasing with increasing carbon black loading. An
electrical threshold is observable from this figure,
occurring at approximately the weight fraction of 25 phr
carbon black, below which the variation of conductivity with
RESULTS AND DISCUSSION 44

1 •• 1 __ ------------------------------------------------~
• I •••. ... II •.•••
.... Illl'_ I Z ....
... "· ... u ...... ........
---
Frequency (Hz)
Figure 16. The dispersion of dielectric constant of
compounds with carbon black loading falling in
the dielectric regime.
RESULTS AND DISCUSSION 45

til til
S o ..... .... +J o Q) ,..... Q) ..... c
lE.l~ ______________________________________________ ~
11:.
.... 4 II p_ I 21 ,hit
II ..... II •• un •••• 111. II Ill. . ....
Frequency (Hz)
Figure 17. The dispersion of dielectric loss of compounds
with carbon black loading falling in the
dielectric regime.
RESULTS AND DISCUSSION 46
-~ I
~ o -
.... • 21 P_ A 31 ... • 51 Phi'
Frequency (Hz)
A 1 .... A 25 Phi' 0 .... 07 ....
Figure" 18. Frequency dependence of conductivity of rubbers
loaded with different amount of carbon black.
RESULTS AND DISCUSSION 47
with frequency goes approximately as wn , with n=l (as shown
in Figure 19). This can be expressed as
(4.1)
where U(w) = AC conductivity at frequency w
w = angular frequency of alternating electric field
Uo = conductivity at zero frequency, i.e. DC
conductivity
It has been shown36 that, when the exponent n falls in
the range 0.6<n<1, the above power law relation implies the
presence of hopping conduction by electrons in the
dielectric regime. Furthermore, it was shown37 that this
power law relation with exponent n ~lose to or equal to 1
implies the frequency independence of dielectric loss, which
is quite consistent with the results for compounds of low
carbon black loading as can be seen in Figure 17, where all
show a tiny shallow loss peak superimposed on an almost
constant background extending over many decades of
frequency.
However, for compounds with carbon black loading falling
in the percolation regime, a flattening of the frequency
dependence of the AC conductivity towards the lower end of
the frequency range begins to be discernible, as can be seen
in Figure 20, but complete saturation of the low-frequency
conductivity is absent in this figure.
RESULTS AND DISCUSSION 48

r-4 I -a o I
~ o ........
.... A II, .. • ZI ...
Frequency (Hz)
Figure 19. Frequency dependence of conductivity of rubbers
with carbon black loading falling in the
dielectric regime.
RESULTS AND DISCUSSION 49

A 25 ,b .& 3 ....
r-f I -~ 0 I ~
..c:: 0 -
r-f r-f I 0 r-f
>< >. .IJ of""4
> of""4 .IJ 0 ::s "0 c 0 U
1 ..
Frequency (Hz)
Figure 20. Frequency dependence of conductivity of rubbers
with carbon black loading falling in the
percolation regime.
RESULTS AND DISCUSSION 50

As shown in Figure 21, the low-frequency conductivity in
the conducting regime becomes more and more slowly varying
with increasing carbon black loading and finally saturates
to a nearly frequency independent DC conductivity, where the
final value depends on the amount of loading. The power law
relation of eqn (4.1) becomes more difficult to define when
DC conductivity is dominant. Since the frequency dependence
of conductivity in the conducting regime is fairly weak, the
dielectric loss of corresponding compound will show strong
frequency dependence within the entire frequency range,
which is evident from Figures 21 and 13. In another words,
once DC conduction is the dominant process in the material,
the dielectric loss diverges towards zero frequency, while
leaving the dielectric constant almost independent of
frequency.
4.5 PHASE ANGLE AND LOSS MODULUS MEASUREMENT
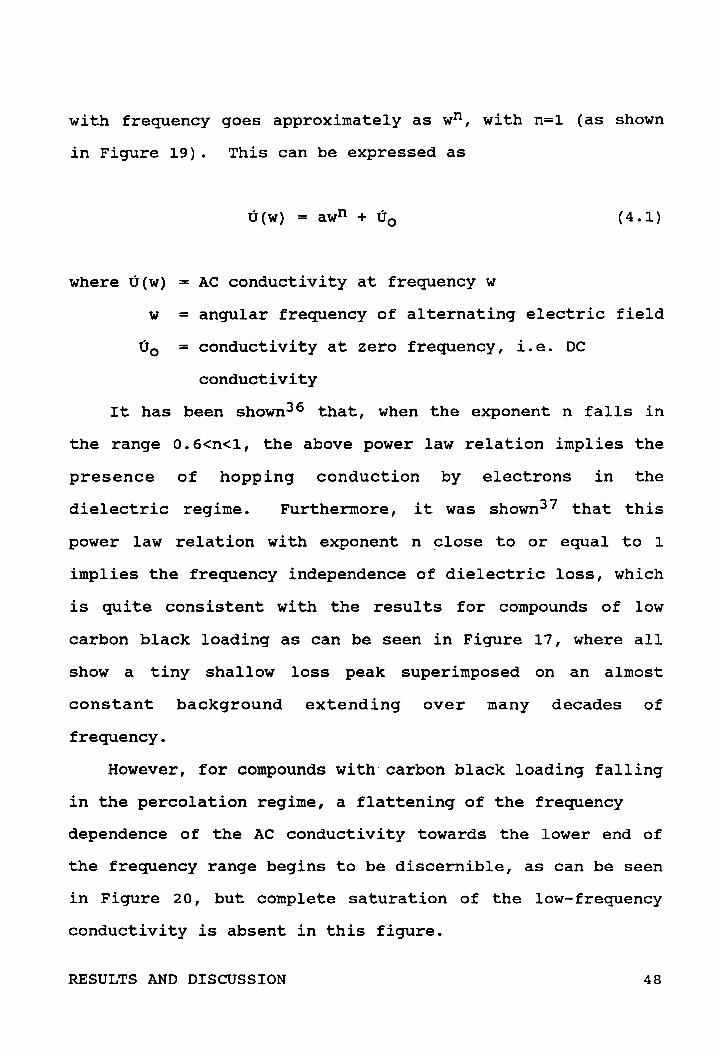
Figure 22 shows the dependence of phase angle 5 on
strain amplitude for rubbers of different carbon black
contents. The phase angle increases with increasing strain
and passes through a maximum, and then decreases somewhat at
still higher amplitudes. However, at the highest amplitude,
5' generally remains considerably higher than its value at
very low amplitudes, and in fact may not be much below its
maximum value.
RESULTS AND DISCUSSION 51

-a o I a .!: o -
I+&~r-------------------------------------------------~ D.p. I 5 •• 11P 07. ,lIP
Frequency (HZ)
Figure 21. Frequency dependence of conductivity of rubbers
with carbon black loading falling in the
conducting regime.
RESULTS AND DISCUSSION 52
z • 31 ..... I ..... A 51 ,b,
16 o 'I.b A 71 .....
-OJ Q) Q)
~ tTt OJ
'tS 1 ....... Q)
r-I tl' s:: < Q) OJ «:S ,
..c: flt
Double strain Amplitude
Figure 22. strain amplitude dependence of phase angle
at 1 Hz for rubbers loaded with different amount
of carbon black.
RESULTS AND DISCUSSION 53

At constant strain cycling, sin6 (or 6) is a direct
measure of the hysteresis (mechanical work which is not
recovered as such during a cycle but instead is converted to
heat). It is assumed that hysteresis results from breakdown
and reformation of interaggregate bonds8 • At low amplitudes
there is little breakdown of interaggregate bonds, therefore
small 6' results. At intermediate amplitudes considerable
breakdown and reformation of bonds takes place; thus 5 is
high. At high amplitudes, less reformation of
interaggregate bonds takes place than at intermediate
amplitudes because the structure, or network, is broken down
so extensively that reformation of the structure is less
complete over the cycle time.
Figure 23 shows the phase angle plotted against the
carbon black content at double strain amplitude of 10%, and
double stress amplitude of 200 lb., respectively. It can be
seen that during compressive cycling, the greater the
concentration of carbon black, the greater the phase angle
at a given strain.
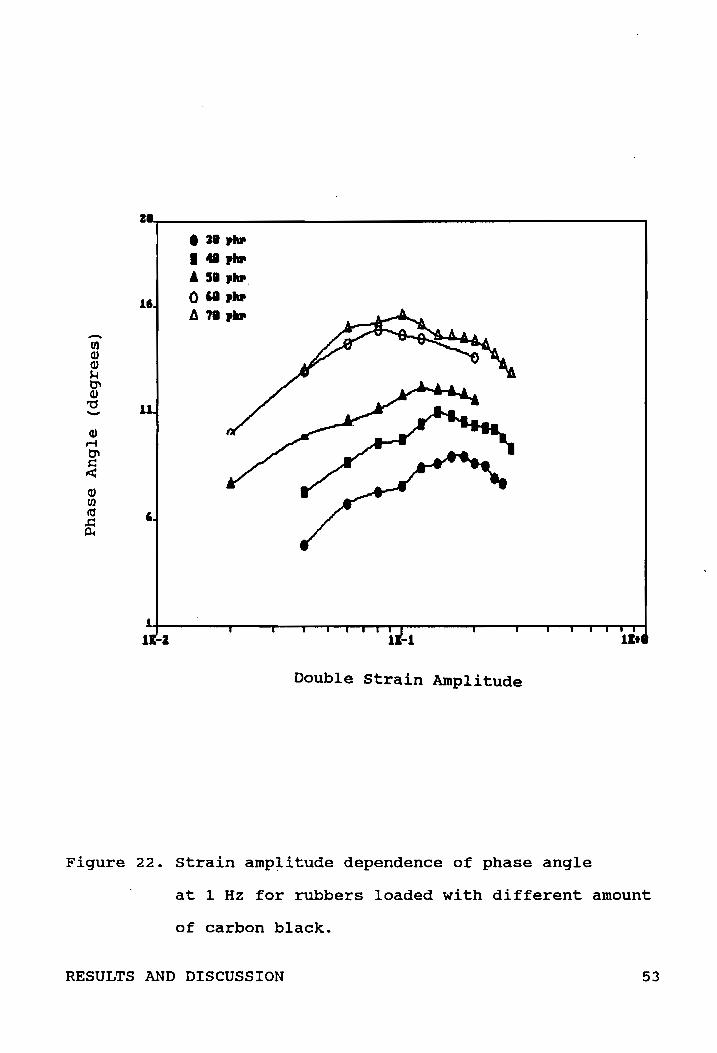
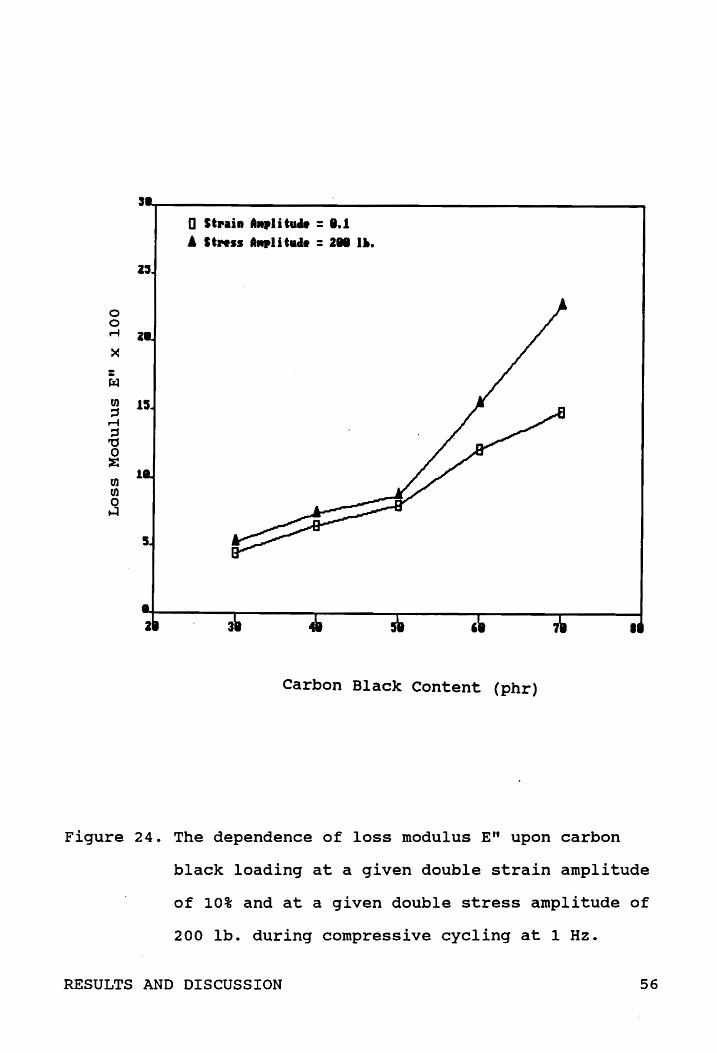
Figure 24 shows the loss modulus E" plotted against
carbon black content at double strain amplitude of 0.1 and
at double stress amplitude of 200 lb., respectively. These
will hereafter be referred to simply as "strain amplitude"
and "stress amplitude" respectively. Both curves show that
the loss modulus E" increases with increasing carbon black
RESULTS AND DISCUSSION 54

I;~------------------~-------------------------------, • Stp.i ..... 11t ... = 1.1 [J StN.. _I i t.... = 2. 1 ••
-Ul Q) '1~ Q) J.4 t:l' Q) 't1 -Q)
...-i t:l' ~ < Q) 1 Ul n:s .t: Cot
s+--------r------~~------~------_r--------~------; 2
Carbon Black Content (phr)
Figure 23. The dependence of phase angle' upon carbon black
loading at a given double strain amplitude of 10%
and at a given double stress amplitude of 200 lb.
during compressive cycling at 1 Hz.
RESULTS AND DISCUSSION 55
D St •• i. 1.,litu" = 1.1 .. ItN55 1.,lit ... = 2. I ••
z:s
Carbon Black Content (phr)
Figure 24. The dependence of loss modulus En upon carbon
black loading at a given double strain amplitude
of 10% and at a given double stress amplitude of
200 lb. during compressive cycling at 1 Hz.
RESULTS AND DISCUSSION 56

content. since hysteresis is produced by internal friction
under compressive cycling, the addition of carbon black to a
rubber increases the internal friction, or hysteresis, by an
amount depending on the loading of carbon black.
4.6 HYSTERESIS MEASUREMENT
Figure 25 shows the strain amplitude decreasing with
increasing carbon black content at stress amplitude of 200
lb., which can be understood by the fact that the greater
the concentration of carbon black, the harder is the filled
rubber. According to H = 1r € 2E", the hysteresis is
proportional to the product of loss modulus En times the
square of strain amplitude,
area of the hysteresis loop.
which is proportional to the
Figure 26 shows the results of
such area measurement plotted against carbon black content
at the strain amplitude of 0.1 and at stress amplitude of
200 lb., respectively. For strain ampl i tude of o. 1, loop
area increases with increasing carbon black content while,
for stress amplitude of 200 lb., it is almost independent of
the carbon black content. This could be because of the
mutual cancellation between the increase in E" and
corresponding decrease in E at constant stress cycling. E"
plotted against carbon black content at strain amplitude of
RESULTS AND DISCUSSION 57

·M;~ __________________________________________________ -,
• 5 tftSS .'" Ii tad. = 211 lit .
• 117 Q) 'tj ~ .JJ or-i r-f .11 a. S ~
$:! 0r-i
.15 «1 }..f +J (I)
Q) r-f ..Q ~ 0 0
.83
.• +-------~--------~------_r--------r_------_r------_, 5 ,
Carbon Black Content (phr)
Figure 25. The dependence of double strain amplitude upon
carbon black loading at a given stress amplitude
of 200 lb. at 1 Hz.
RESULTS AND DISCUSSION 58

lZ~ ____________________________________________________ ~
• St •• in AM,litude = 1.1 , StNSS A..,litad. = 211 1 ••
to •• ev ~
Ie:(
s::l. 0 0 ~
(/) ·M til ev ~ ev 4J (J]
>t ::z::
Carbon Black Content (phr)
Figure 26. The dependence of hysteresis loop area upon
carbon black loading at a given strain amplitude
of 10% and at a given stress amplitude of 200 lb.
at 1 Hz.
RESULTS AND DISCUSSION 59

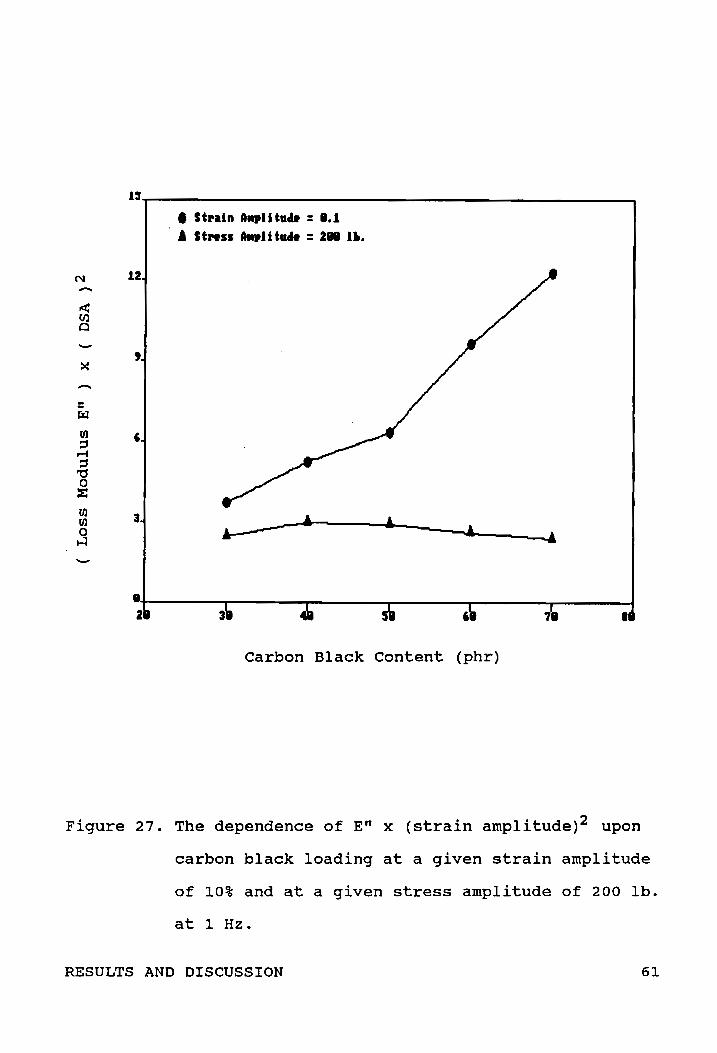
0.1 and at stress amplitude of 200 lb. is shown in Figure
27. The trend is generally the same as that seen in Figure
26.
4. 7 TEMPERATURE RISE MEASUREMENT
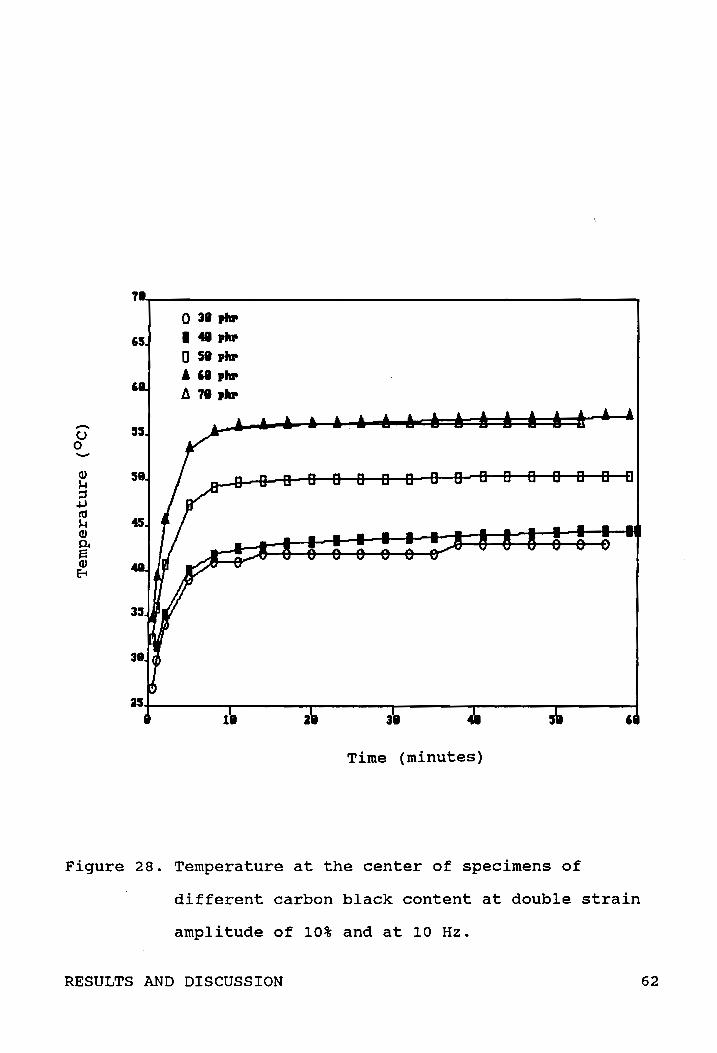
Figure 28 shows the temperature at the center of the
specimens of different carbon black contents, with strain
amplitude of 10% at a frequency of 10 Hz. As can be
expected from Figures 26 and 27, the temperature rise is
higher in rubbers of high carbon black loading than in those
of low carbon black loading at a given strain amplitude.
Figure 29 shows the temperature at the center of the
specimens of different carbon black contents, with stress
amplitude of 200 lb. and a frequency of 10 Hz. The
temperature rise in these specimens is about the same, which
can be explained by the nearly equal areas of the hysteresis
loops of specimens of different carbon black contents, as
also seen in Figures 26 and 27.
According to Figures 28 and 29, the temperature rise is
proportional to the time for several minutes (5 to 10
minutes) after starting, while the nearly adiabatic
condition is maintained at the initial stage. Temperature
then remains constant due to the balance between internal
heat generation and heat radiation.
Figures 30 and 31 show the temperature rise plotted
RESULTS AND DISCUSSION 60
l' • St •• in AMPlit ... = 1.1 .& St .. ss AMPlita.e = 2. 1 ••
N 12 -,c( til Q
- , ><
--riI
Ul , ::1
.....t ::1 ttj 0 ~
Ul 3 , -' Ul 0 ~ -'
""' ...::I
-
Carbon Black Content (phr)
Figure 27. The dependence of E" x (strain amplitude)2 upon
carbon black loading at a given strain amplitude
of 10% and at a given stress amplitude of 200 lb.
at 1 Hz.
RESULTS AND DISCUSSION 61
-() o -
T~ __________________________________________________ ~
o 31'. 141,. rJ 51 ,lIP "I,. IJ. 71 ,lIP
Time (minutes)
Figure 28. Temperature at the center of specimens of
different carbon black content at double strain
amplitude of 10% and at 10 Hz.
RESULTS AND DISCUSSION 62

-CJ 0 -
Q) J..t ::s +J ctS J..t Q)
~ Q) 8
41
o 31.hI' • 41.hI' (] 5 •• hI' .. 6 •• hI' Il 7 •• hI'
Time (minutes)
Figure 29. Temperature at the center of specimens of
different carbon black content at double stress
amplitude of 200 lb. and at 10 Hz.
RESULTS AND DISCUSSION 63

41
, 31 ,hi' [] 41 ,hi' • 51 ,hi'
35. o 'I, .. I 7. 'hP 0 • -U
0 -8 3e. -CI OJ Ul • • .-4 ~
OJ 15. J..f ::J +J (tj
J..f OJ D 0.. ~ Z8 OJ 8
lS+---------~--------_r--------_,----------r_------__; I 31 6 ,. 121 151
Hysteresis Loop Area
Figure 30. Dependence of temperature rise on hysteresis
loop area at a strain amplitude of 10% and at
10 Hz.
RESULTS AND DISCUSSION 64

Z8
, 31, .. o 41 p. I 51 p. o '1'_
IS I 71' .. -CJ 0 -E-t
I .cf OJ ••• D Ul 1. 0 ...... ~
OJ J...f ::1 +J CU J...f OJ p.. ,. J:t OJ
E-t
I+------------T------------T-----------~----------__; • 1\1 ZI 31
Hysteresis Loop Area
Figure 31. Dependence of temperature rise on hysteresis
loop area at stress amplitude of 200 lb. and at
10 Hz.
RESULTS AND DISCUSSION 65

against the corresponding hysteresis loop area for rubbers
of different carbon black contents at strain amplitude of
0.1 and stress amplitude of 200 lb. respectively. Under
constant strain cycling, hysteresis is only a function of
loss modulus, which increases with increasing carbon black
content, as shown in Figure 24. Since heat generation is
proportional to hysteresis, temperature rise within the
specimen is therefore expected to increase with increasing
carbon black content, which can be confirmed from Figure 30.
However, under constant stress cycling, hysteresis is shown
to be nearly independent of carbon black content. (Figure
26) • Thus, the temperature rise in rubbers of different
carbon black contents at a given stress amplitude is
expected to be nearly constant, at 11±10 C in this case, as
shown in Figure 31.
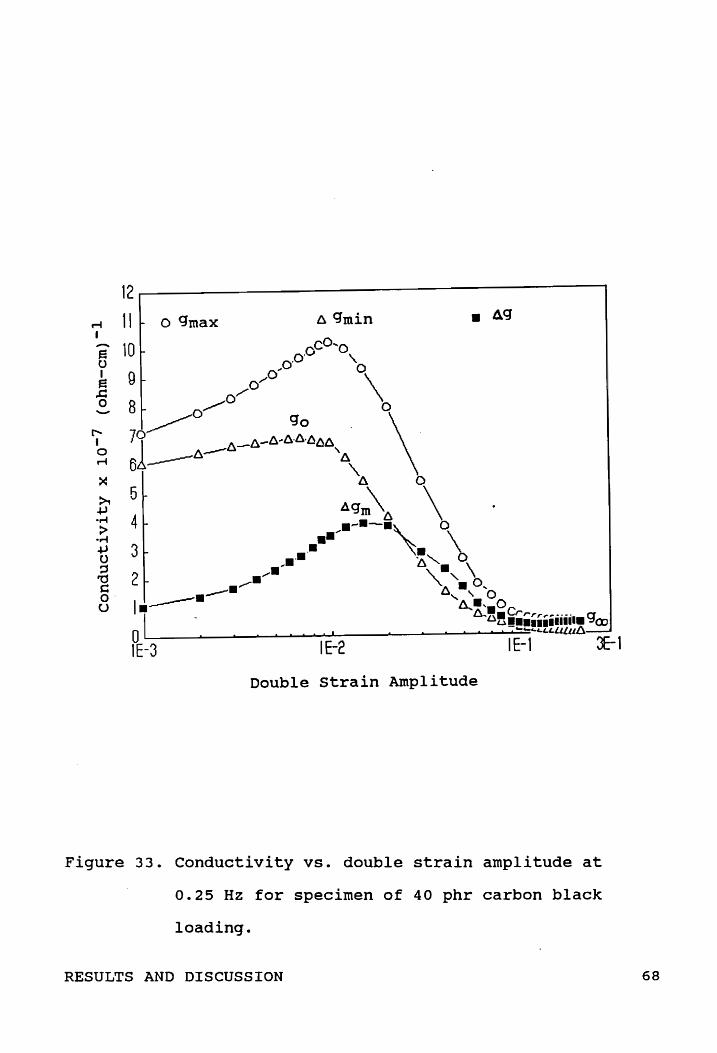
4.8 DYNAMIC CONDUCTIVITY MEASUREMENT
For each single sinusoidal cycle, a minimum
conductivity, gmin' was observed at the lowest strain, and a
maximum, gmax, was observed at the highest strain, as
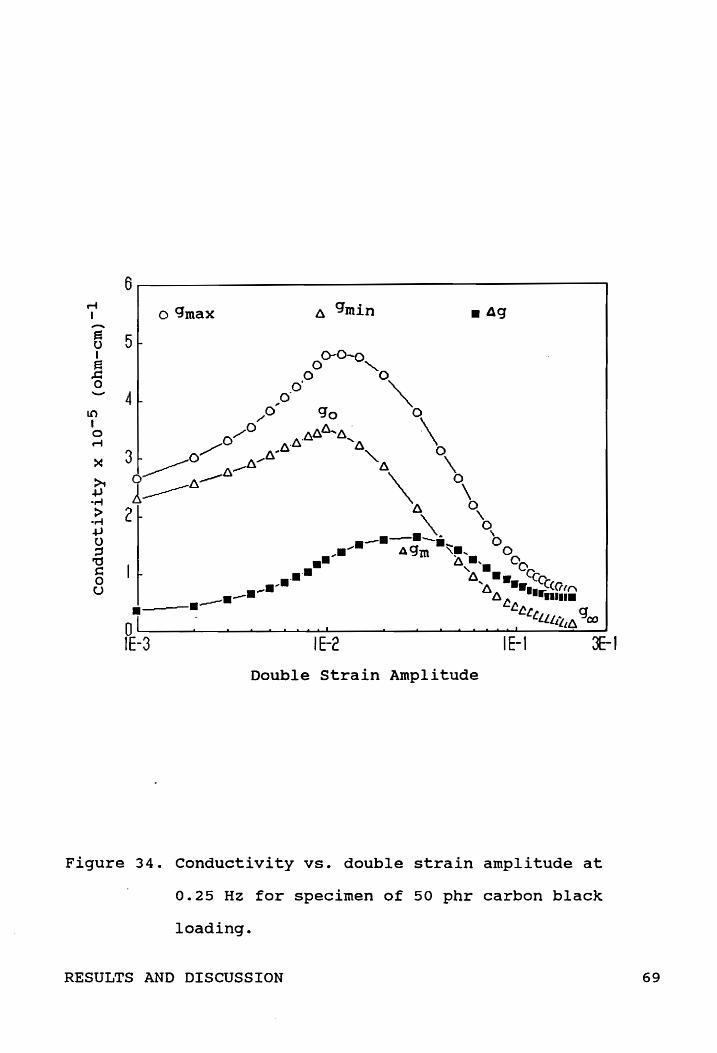
defined in Figure 32. Figures 33-36 show the dependence of
gmax and the gmin upon strain amplitude for specimens of
different carbon black contents, measured at progressively
increasing amplitudes up to 0.2 DSA. In the strain
amplitude range observed (DSA = 0.001-0.2), gmax and gmin
RESULTS AND DISCUSSION 66

It t
I
t
I mi "-.",t' I
one cycle time
Current
Figure 32. Current (top), and strain vs. time curve at a
strain amplitude of 0.02 for specimen of 50 phr
carbon black loading at vibration frequency of
1 Hz.
RESULTS AND DISCUSSION 67
12~------------------------------~
..... 11 I
'ii 10 o I a ..c: o -
r-I o ..... ~
>t ..... -..-4 >
-..-4 ..... U ::s '0 c o· u
9
o gmax 6 gmin • 49
Double strain Amplitude
Figure 33. Conductivity vs. double strain amplitude at
0.25 Hz for specimen of 40 phr carbon black
loading.
RESULTS AND DISCUSSION 68
r-t I -~ I
.E o -
to I o r-t
6~-----------------------------------------,
o gmax .4g
5
Double strain Amplitude
Figure 34. Conductivity vs. double strain amplitude at
0.25 Hz for specimen of 50 phr carbon black
loading.
RESULTS AND DISCUSSION 69

2.5---------------------------------------------.
-5 2.0 I J::
.J:: o -~ I o r-I
1.5
o gmax Il. gmin • Ag
Figure 35. Conductivity vs. double strain amplitude at
0.25 Hz for specimen of 60 phr carbon black
loading.
RESULTS AND DISCUSSION 70

8~---------------------------------.
r-4 7 I
o gmax II gmin • .o.g
-a o I a
..c: o -oe::t' I o r-4
OL---~~~~--~~--~--~--~--~~--~~ 1 E -3 I E-2 f E-l 3E-l
Double strain Amplitude
Figure 36. Conductivity vs. double strain amplitude at
0.25 Hz for specimen of 70 phr carbon black
loading.
RESULTS AND DISCUSSION 71
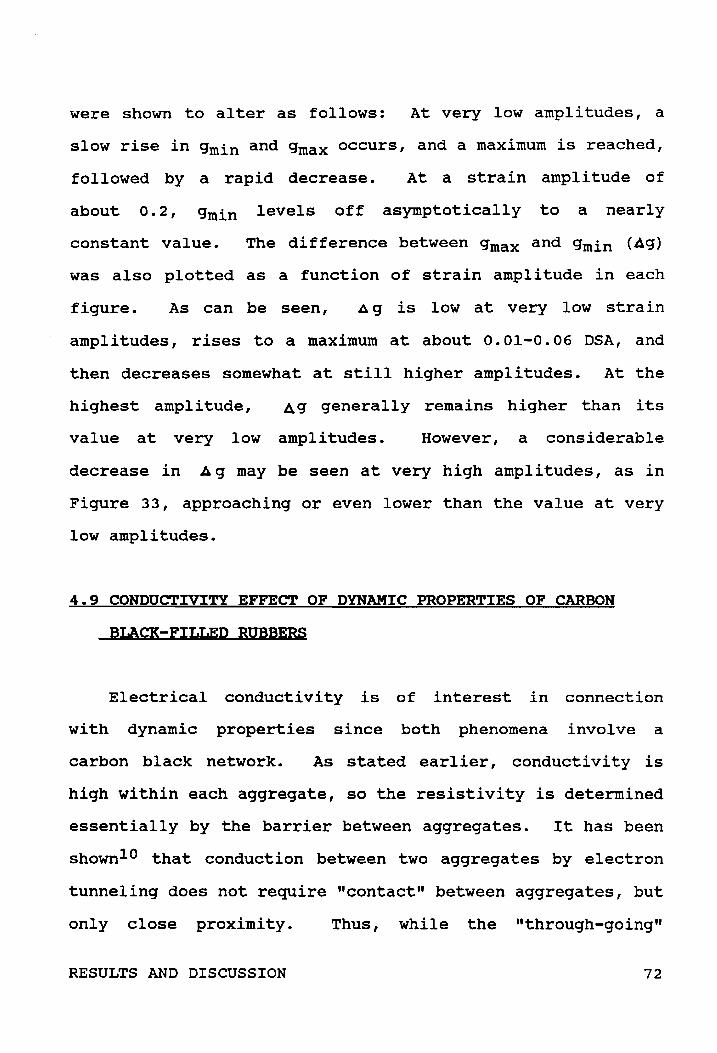
were shown to alter as follows: At very low amplitudes, a
slow rise in gmin and gmax occurs, and a maximum is reached,
followed by a rapid decrease. At a strain amplitude of
about 0.2, gmin levels off asymptotically to a nearly
constant value. The difference between gmax and gmin (Ag)
was also plotted as a function of strain amplitude in each
figure. As can be seen, A g is low at very low strain
amplitudes, rises to a maximum at about 0.01-0.06 DSA, and
then decreases somewhat at still higher amplitudes. At the
highest amplitude, Ag generally remains higher than its
value at very low amplitudes. However, a considerable
decrease in Ag may be seen at very high amplitudes, as in
Figure 33, approaching or even lower than the value at very
low amplitudes.
4.9 CONDUCTIVITY EFFECT OF DYNAMIC PROPERTIES OF CARBON
BLACK-FILLED RUBBERS
Electrical conductivity is of interest in connection
with dynamic properties since both phenomena involve a
carbon black network. As stated earlier, conductivity is
high within each aggregate, so the resistivity is determined
essentially by the barrier between aggregates. It has been
shown10 that conduction between two aggregates by electron
tunneling does not require "contact" between aggregates, but
only close proximity. Thus, while the "through-going"
RESULTS AND DISCUSSION 72

conductive paths responsible for conductivity of the
specimen may be equivalent to the network which contributes
to the augmentation of dynamic modulus, the gap width
between aggregates may have a quantitatively different
effect on tunneling versus interaggregate attractive
forces4 • Voet and Cook38 showed that the dynamic modulus is
a higher order function of interaggregate distance and is
more responsive to small chain breakdown than electrical
conductivity. In addition, due to hydrodynamic effects plus
other smaller contributions, the augmentation of the dynamic
modulus may be brought about by isolated aggregates which do
not contribute to conductivity4.
4.9.1 CORRESPONDENCE BETWEEN CONDUCTIVITY AND MODULUS
CHANGES
It has been shown4- 7 ,39 that gmin varies with DSA in
roughly the same manner as elastic modulus E'. However, the
onset of the decrease in gmin with increasing DSA has been
shown to occur at somewhat higher DSA than that of EI, and
that of gmax at still higher DSA, since the conductivity
might not be as sensitive to gap distance as E'.
Also, the A g and loss modulus E" have been shown to
vary in a roughly similar way with increasing DSA38 ,39. ~g
passes through a maximum at about the same DSA as the
maximum of E", where gmin is changing most rapidly, as can
RESULTS AND DISCUSSION 73

be seen in Figures 33-36.
Since there is a correspondence between conductivity
changes and modulus changes with the strain amplitude of
oscillation, Figures 33-36 can be used to determine the
amplitude dependence of dynamic properties of carbon black
filled rubbers.
4.9.2 EFFECTS OF PERSISTENT AND TRANSIENT STRUCTURES ON
CONDUCTIVITY DURING A CYCLE
It was suggested40 that "there are two distinctly
different physical bases for the formation of the ensemble
of particle chains and networks in dispersed carbon blacks,
commonly referred to as structure. The transient,
reversible structure is formed by interaggregate contacts
caused by a van der Waals type of attraction, while the
persistent, irreversible structure is due to strong
reticulate particle aggregates which appear to be "fused"
together in the formative stage of the carbon black, at
extremely high temperatures in the furnace."
As can be seen in Figure 32, in a specimen subjected to
compressive oscillation about a midpoint, the transient
structure is broken down in a nearly equal amount in the
lower and upper halves of a strain cycle, the extent of
which depends on the applied strain amplitude. The
persistent aggregates which become separated from each other
RESULTS AND DISCUSSION 74
at the lower half of a cycle, however, will be brought into
proximity with each other in the upper half of a cycle, with
the opportunity of reforming interaggregate contacts,
resulting in the formation of new transient structure.
since the closer proximity between persistent aggregates in
the upper half of a cycle makes the reformation process more
rapid and easier, more reformation is expected at the upper
half of a strain cycle than at the lower half of the strain
cycle. As will be explained later, this reformation process
is more significant at low and intermediate DSA ranges than
at high DSA ranges. Thus, it becomes obvious that
conductivity is higher in the upper half of a cycle than in
the lower half of a cycle.
4.9.3 PHYSICAL SIGNIFICANCE OF gmin
gmin can therefore be used to represent the remaining
carbon black conductive network, which is a combination of
the persistent structure and the remaining transient
structure. From Figures 33-36, the maximum value of gmin
(gO> at low strain amplitudes, and the limiting value of
gmin (g~) at high strain amplitudes, can be determined6 ,39.
Because all the curves exhibit a maximum at low strain
amplitudes, this maximum value of gmin was used to represent
go-
~ represents the minimum conductivity of one cycle, at
RESULTS AND DISCUSSION 75

very high DSA, caused by the conduction between persistent
aggregates after all the transient structure has been
completely broken down by vibrations. It was shown40 that
extreme amplitudes of oscillation do not give rise to
destruction of persistent carbon black aggregates. Only the
distance between persistent aggregates will be sinusoidally
changed in a single cycle, which will not alter the average
conductivity greatly, but only the minimun and maximum
values of the cycle38 • Since electron tunneling dominates
the conduction mechanism between aggregates, it is obvious
that gmin will approach a limiting value at high strain
amplitudes. With further increase in DSA, the distance
between persistent aggregates will become so large, with no
transient structure connected in-between, that the electron
tunneling effect becomes less and less sensitive to further
changes of interaggregate distance at the lower half of a
strain cycle. However, for the transient structure
breakdown process, the average conductivity is greatly
influenced, decreasing rapidly with strain amplitudes within
the intermediate strain range, until all the transient
structure is broken down.
The difference between go and g~ (i.e., go-g~)
represents the maximum contribution of the transient
structure4 ,6,38,39. Figure 37 shows that go, gee' go-g(t) , and
the maximum of ~g (Agm) all increase rapidly with increasing
carbon black loading, indicating that the amount of both
RESULTS AND DISCUSSION 76
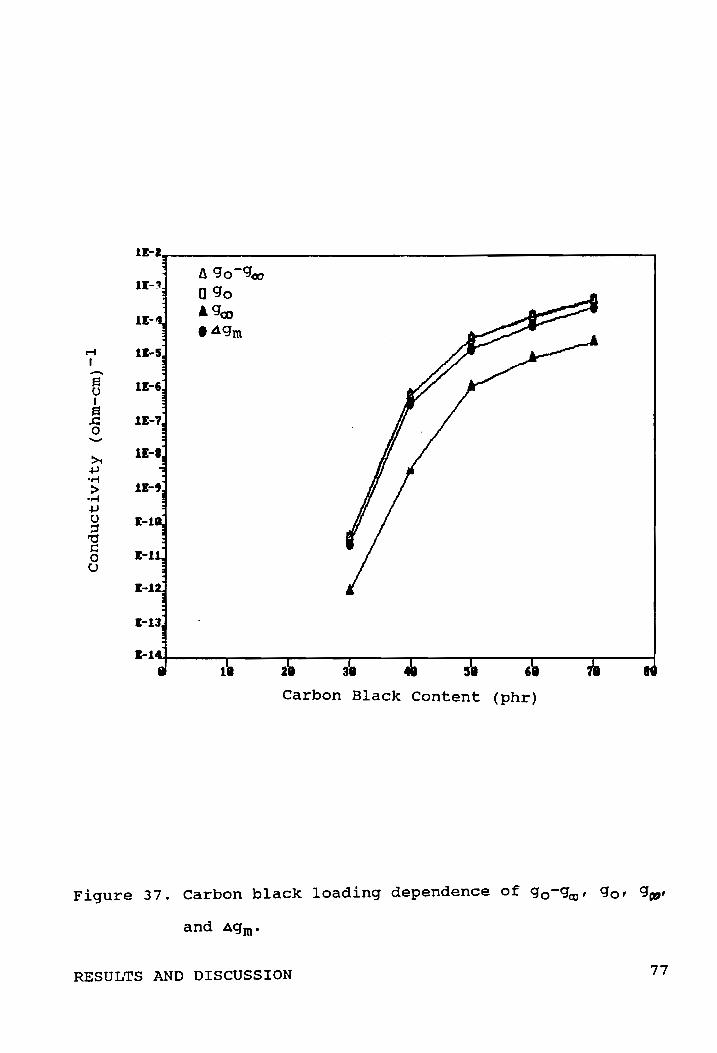
-a o I a .c: o -
11-
f:J go-g«1 [] go A. gQ) 1 4 gm
~1'r-----'------r-----~-----r----~------r-----------~
Carbon Black Content (phr)
Figure 37. Carbon black loading dependence of go-goo' go' g~,
and Agm•
RESULTS AND DISCUSSION 77

transient and persistent structure greatly increases with
carbon black loading. In addition, go is shown to be around
one to two orders of magnitude greater than gO) for all
specimens. As can be seen in Table 2, the ratio of gO-gm to
gm is decreasing with increasing carbon black loading within
the 40-70 phr range, reflecting that the ratio of the
maximum transient structure to the persistent structure
within a specimen decreases with carbon black loading.
This decrease in go-gcc/9'cc indicates the vast existence of
through-going conductive paths of a persistent nature (i.e.,
with no interaggregate contacts in-between), the number of
which increases rapidly with carbon black loading, thus
reducing the relative amount of transient structure.
Table 2. go-~/~ at different carbon black compositions
carbon black content(phr)
go-9o,/gcc
RESULTS AND DISCUSSION
30 40 50
44.56 167.1 29.3
60
18.7
70
18.3
78

4.9.4 CONDUCTIVITY RELAXATION AT LOW STRAIN AMPLITUDES
At very low strain amplitudes «0.01 DSA), the
reformation is so rapid and easy that a slight breakdown of
the transient structure can be readily mended even at the
lower half of a strain cycle, with a possibility of
connecting a few isolated aggregates to the conductive
network and therefore building more conductive paths. This
"conductivity relaxation" phenomenon results in a slow rise
in conductivity at low strain amplitudes. However, after a
critical DSA (about 0.01) is reached, the rate of
reformation is no longer effective enough to fully mend the
destroyed transient structure, and, thus, conductivity
starts to decrease rapidly with further increase in strain
amplitude.
4.9.5 PHYSICAL SIGNIFICANCE OF 4q
Because of its similarity to the loss modulus E", .4.g
is, likewise, strongly related to the reformation and
breakdown of the carbon black network during each strain
cycle, and may be treated as the electrical equivalent of
the mechanical loss modulus, or hysteresis. Figure 38 shows
a series of pictures of the variation of current with
sinusoidal cycling at increasing strain amplitudes, taken
for a specimen of 50 phr carbon black loading.
RESULTS AND DISCUSSION 79
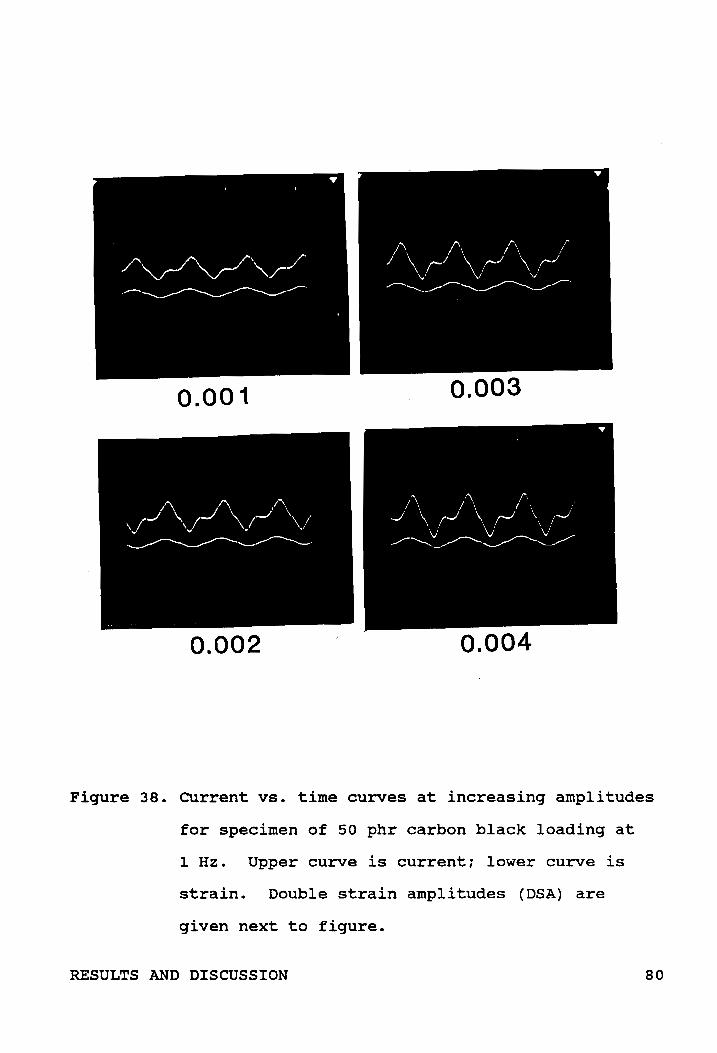
0.001
0.002 0.004
Figure 38. CUrrent vs. time curves at increasing amplitudes
for specimen of 50 phr carbon black loading at
1 Hz. Upper curve is current; lower curve is
strain. Double strain amplitudes (DSA) are
given next to figure.
RESULTS AND DISCUSSION 80

0.005 0.008
0.006 0.009
0.007 0.01
Figure 38 (cont.)
RESULTS AND DISCUSSION 81

0.012 0.03
0.015 0.04
0.02 0.05
Figure 38 (cont.)
RESULTS AND DISCUSSION 82

0.06 0.09
0.07 0.1
0.08 0.11
Figure 38 (cont.)
RESULTS AND DISCUSSION 83

0.12 0.15
1~'J'f~/'-,,/,. (\ r (\ I I I I
I \J \ J \ I
J \ \ I \. I I IV V
~~'v~J'n-I /1 II /1 \ / \ I \ ! \ I \ I \
I \ I \ / \ \ I \ I \ I \ I \ \ . \ , \j ~! \...1
0.13 0.16
0.14 0.17
Figure 38 (cont.)
RESULTS AND DISCUSSION 84

0.18 0.19
Figure 38 (cent.)
RESULTS AND DISCUSSION 85
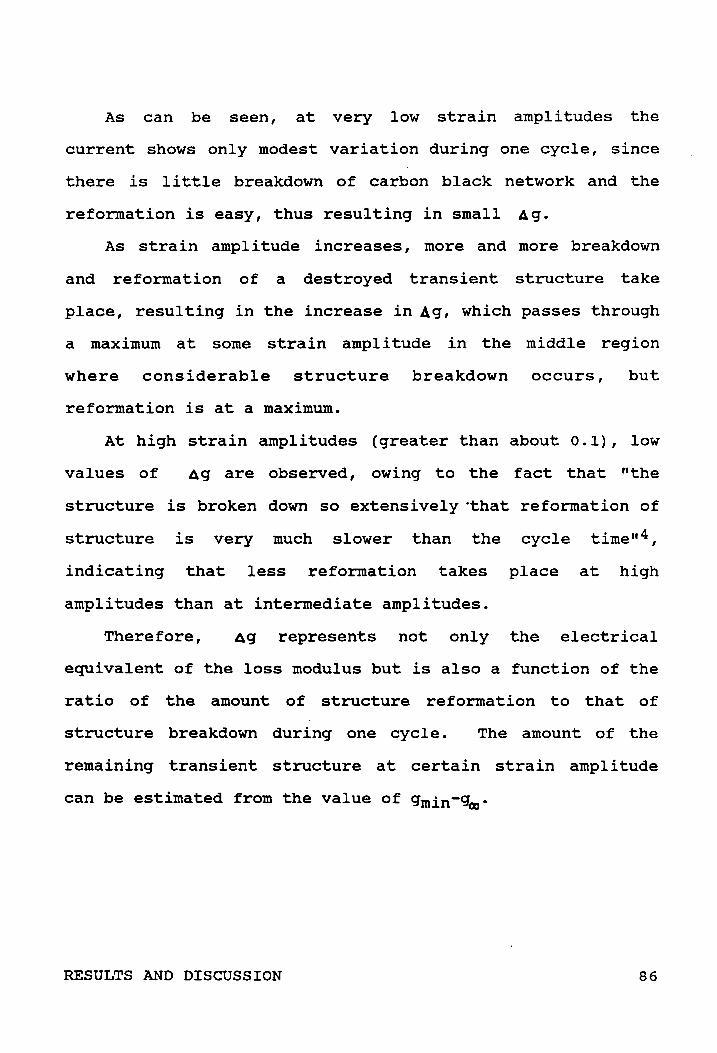
As can be seen, at very low strain amplitudes the
current shows only modest variation during one cycle, since
there is little breakdown of carbon black network and the
reformation is easy, thus resulting in small Ag.
As strain amplitude increases, more and more breakdown
and reformation of a destroyed transient structure take
place, resulting in the increase in Ag, which passes through
a maximum at some strain amplitude in the middle region
where considerable structure breakdown occurs, but
reformation is at a maximum.
At high strain amplitudes (greater than about 0.1), low
values of Ag are observed, owing to the fact that "the
structure is broken down so extensively "that reformation of
structure is very much slower than the cycle time,,4,
indicating that less reformation takes place at high
amplitudes than at intermediate amplitudes.
Therefore, Ag represents not only the electrical
equivalent of the loss modulus but is also a function of the
ratio of the amount of structure reformation to that of
structure breakdown during one cycle. The amount of the
remaining transient structure at certain strain amplitude
can be estimated from the value of gmin-~.
RESULTS AND DISCUSSION 86
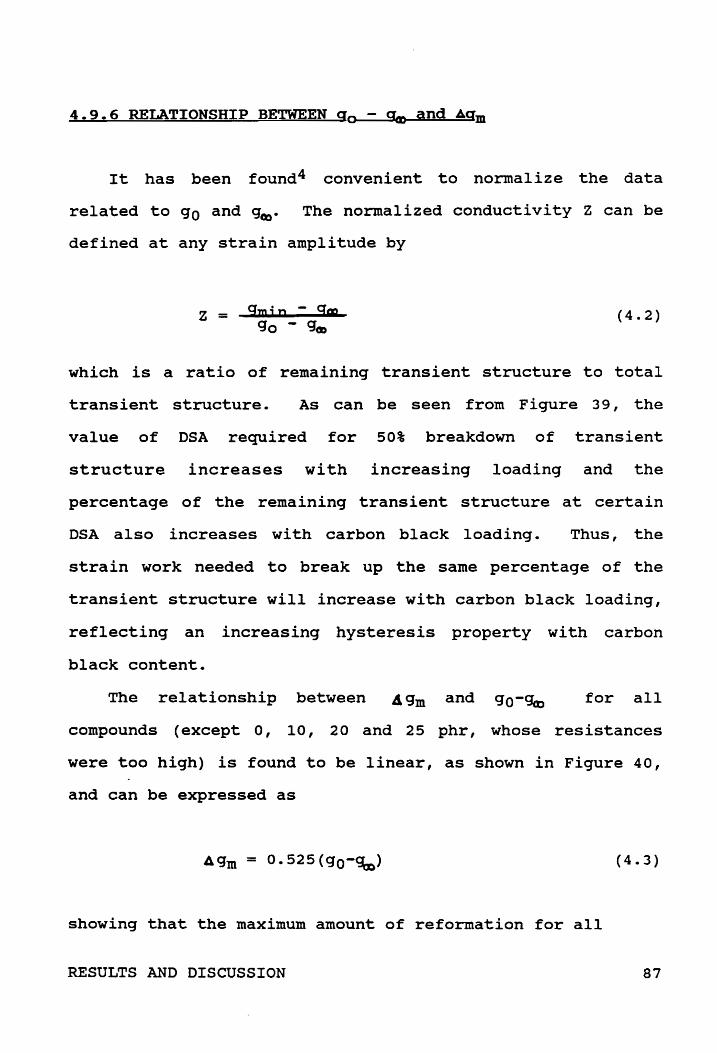
4.9.6 RELATIONSHIP BETWEEN go - qm and Agm
It has been found4 convenient to normalize the data
related to go and g~. The normalized conductivity Z can be
defined at any strain amplitude by
Z = 9Jni n - q", go - gG)
(4.2)
which is a ratio of remaining transient structure to total
transient structure. As can be seen from Figure 39, the
value of DSA required for 50% breakdown of transient
structure increases with increasing loading and the
percentage of the remaining transient structure at certain
DSA also increases wi th carbon black loading. Thus, the
strain work needed to break up the same percentage of the
transient structure will increase with carbon black loading,
reflecting an increasing hysteresis property with carbon
black content.
The relationship between 4gm and go-~ for all
compounds (except 0, 10, 20 and 25 phr, whose resistances
were too high) is found to be linear, as shown in Figure 40,
and can be expressed as
(4.3)
showing that the maximum amount of reformation for all
RESULTS AND DISCUSSION 87
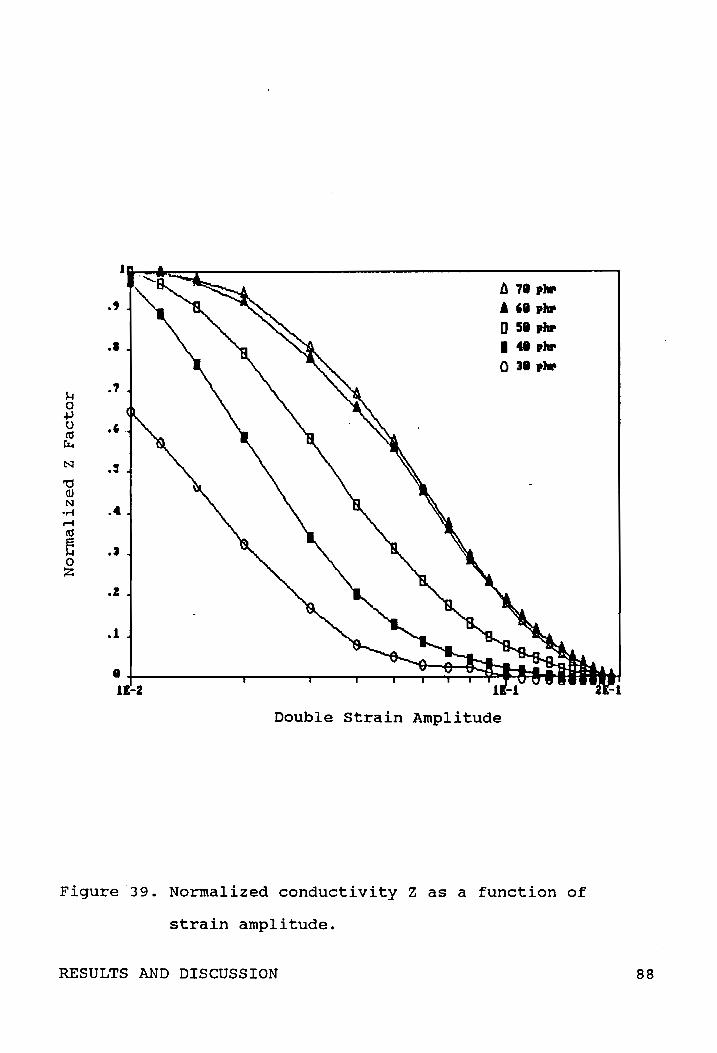
1
Il 71 ,I.--, A 'I, .. Il 51 ,lIP
.1 I 41 ,lIP o 31, ..
$-4 . 7
0 ...., 0 ., ,
«' r.. N .: "d Q) N
.4 • ....t
,.....j
ro e .3 0 Z
.1
.1
• 11-2
Double strain Amplitude
Figure 39. Normalized conductivity Z as a function of
strain amplitude.
RESULTS AND DISCUSSION 88

D at 1.25 Hs , 11 ... = 1.11
1-12r-rnmm~~~~~mw~Tnmr-rMmnr~~~~~N-~~'---~ 11-11
Figure 40. Variation of 4gm with go-g~·
RESULTS AND DISCUSSION 89

specimens occurs approximately when one half of the whole
transient structure is broken down, and the occurence of Ag
is, again, found to be almost entirely due to the breakdown
and reformation of transient structure.
4.9.7 EFFECTS OF CHANGING VIBRATION FREQUENCY
Figures 41-43 show the effect of changing the cycle time
(period) on Ag. As can be seen, the strain amplitude at
which the maximum value of A g occurs is shifted towards
lower values with increasing vibration frequency. This is
due to the fact that at lower cycle time (i. e., higher
frequency), less reformation takes place at the same strain
amplitude, resulting in lower strain amplitude at which the
structure breakdown and reformation is at a maximum.
4.9.8 RISE IN q AT HIGH STRAIN AMPLITUDES
It can be seen from Figure 36 that, at strain amplitude
higher than 0.13, an increase in
mainly caused by the increase
approaching a limiting value.
Ag is observed, which is
in gmax' while gmin is
This phenomenon is mostly
observed in specimens of high carbon black loading, in which
a large number of isolated aggregates can be brought into
close proximity at the upper half of a strain cycle after a
critical DSA (here, 0.13) is reached (where most of the
RESULTS AND DISCUSSION 90

r-I I -~ U I
.a o -
['. I o r-I
5----------------------------------------------~ o at 1 Hz • at 0.25 Hz
4
3
3E-l Double strain Amplitude
Figure 41. Conductivity bandwidth (Ag) vs. DSA for specimen
of 40 phr carbon black loading at 0.25 and 1 Hz,
respectively •
.. RESULTS AND DISCUSSION 91
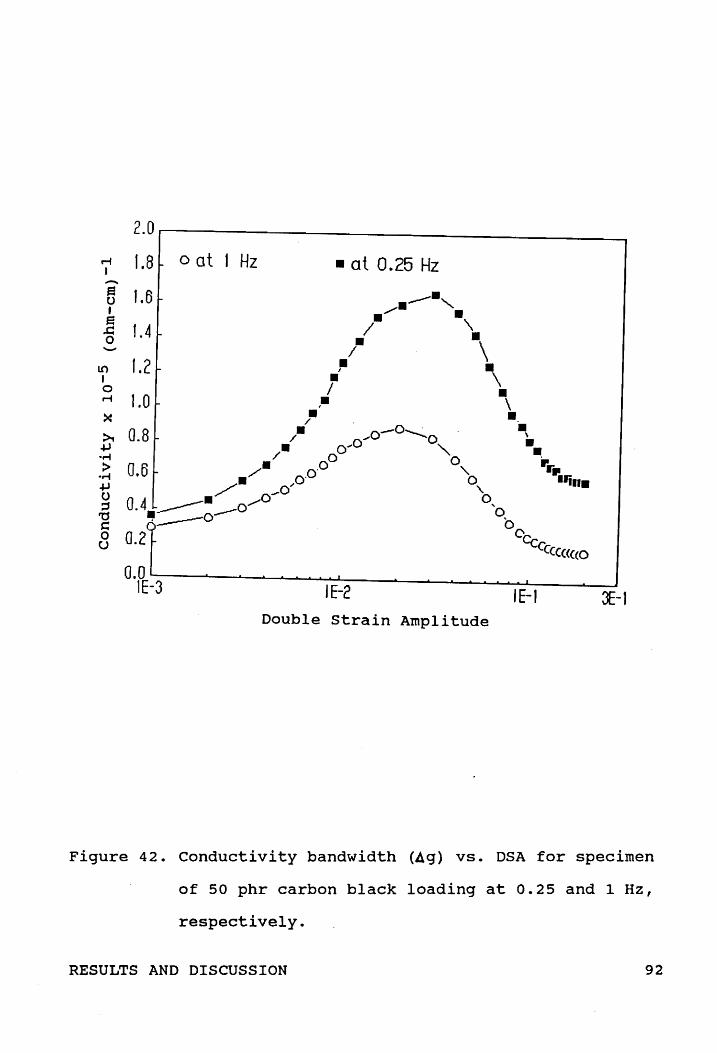
2.0r------------------M t.8 ~ 0 at 1 Hz I -6 1.6 t
.a o -
to I o
1.4 ~
1.2
M 1.0
• at 0.25 Hz
Double strain Amplitude
Figure 42. conductivity bandwidth (A9) vs. DSA for specimen
of 50 phr carbon black loading at 0.25 and 1 Hz,
respectively.
RESULTS AND DISCUSSION 92

4.0 ------------------,
.-i
~ 3.5 o at 1 Hz • at 0.25 Hz
U • .E 3.0 o - 2.5
(.0
1.5
1.0
Double strain Amplitude
Figure 43. Conductivity bandwidth (4g) vs. DSA for specimen
of 70 phr carbon black loading at 0.25 and 1 Hz,
respectively.
RESULTS AND DISCUSSION 93

transient structure has been broken down). Because the
number of these isolated aggregates is qualitatively
proportional to carbon black loading,
amplitude at which the increase in
the highest strain
gmax starts thus
decreases with increasing carbon black loading. Since the
distance between persistent aggregates is decreasing with
increasing DSA(>0.13), and more isolated aggregates are
brought into close proximity and connected to the conductive
paths, a significant increase in gmax is therefore expected
at high DSA.
4.9.9 THE ASSYMMETRY IN TIME-CURRENT VARIATION CURVE
Also observed from Figures 32 and 38 is a subpeak in the
current-time variation curve. According to Voet and cook38 ,
the observed assymmetry may be caused by a superposition of
longitudinal compression waves(4-second cycle) and shear
waves (2-second cycle) which unavoidably accompany the
longitudinal compression waves through any specimen of
finite thickness, especially for specimens of high loadings
of high structure black. It is expected that the
compression wave simply influences the interaggregate
distance, exactly following the dynamic strain, while the
shear wave mainly causes the transient structure breakdown.
As can be seen, even at the lowest amplitude of 0.001 DSA,
the influence of the 2-second shear wave cycle on the
RESULTS AND DISCUSSION 94

current is discernible, and is superimposed on the 4-second
compression cycle, resulting in the assymmetry. The extent
of the influence of the shear wave increases with increasing
DSA.
RESULTS AND DISCUSSION 95

5.0 CONCLUSIONS AND RECOMMENDATIONS
5.1 CONCLUSIONS
(1) The electrical percolation was clearly evident from
both dielectric constant and AC conductivity measurements,
reflecting that there exist different conduction mechanisms
below and above this percolation threshold: when the carbon
black loading is well below the threshold (i. e. in the
dielectric regime), the hopping transition is believed to be
the dominant conduction mechanism; when the carbon black
loading is in the percolation regime, the fluctuation
induced electron tunneling is dominant; when the carbon
black loading is in the conducting regime, DC conduction
between two electrodes becomes dominant.
(2) Since different types of dielectric response are
characterized for rubbers with carbon black loading falling
in the dielectric, percolation and conducting regimes, the
AC conductivity and dielectric constant measurements thus
provide a nondestructive method to investigate the carbon
black network that exists in filled rubbers.
In the dielectric regime, both dielectric constant and
dielectric loss show only slight dispersion with frequency,
while the AC conductivity shows very strong dispersion with
frequencies. In percolation regime, both the dielectric
constant and dielectric loss rise towards low frequencies,
CONCLUSIONS AND RECOMMENDATIONS 96

while a saturation of the frequency dependence of the AC
conductivity towards the lower end of frequency range
becomes discernible. In conducting regime, the dielectic
loss shows strong dispersion in our measuring frequency
range with dielectric constant approaching a constant value
towards low frequencies, while the AC conductivity shows
only very weak dispersion with frequency.
(3) Both loss modulus and phase angle are related to
hysteresis properties of the carbon black-rubber compounds
and are shown to increase with increasing carbon black
content either at a given strain amplitude or at a stress
amplitude. Hysteresis loop area at a given strain amplitude
increases with increasing carbon black content, while that
at a given stress amplitude is nearly independent of carbon
black content. Temperature rise measurements show that the
larger the area of the hysteresis loop, the higher the
temperature rise. Since the temperature rise of a filled
rubber under compressive cycling is directly related to the
hysteresis loop area, the temperature rise is, therefore,
independent of the amount of carbon loading when the
compounds are subjected to a compressive cycling at a given
stress amplitude.
(4) The effect of vibration frequency on g was also
investigated, showing that the strain amplitude at which the
maximum Ag occurs is shifted toward lower values with
increasing vibration frequency.
CONCLUSIONS AND RECOMMENDATIONS 97
(5) A rise in Ag at high strain amplitude is observed
for rubbers with high carbon black loading, owing to the
incorporation of many isolated aggregates into the
conductive network and the closer proximity of persistent
aggregates at high strain amplitudes. The highest strain
amplitude at which the increase in Ag starts is expected to
decrease with increasing carbon black loading.
(6) Although the amount of both transient structure and
persistent structure increases rapidly with carbon black
loading, the ratio of the maximum transient structure to
persistent structure, (go-gm)/g~, decreases with increasing
carbon loading, due to the large number of through-going
conductive paths of persistent nature.
(7) The maximum 4g follows a linear relationship with
go-g~ for all carbon black-rubber compounds, reflecting that
the breakdown and reformation of the transient structure is
the only mechanism responsible for the occurrence of 4 g.
(8) Owing to its experimental accuracy and its great
sensitivity to carbon black network changes, the dynamic
conductivity measurement (as a function of dynamic strain
amplitude) can be successfully applied, in preference to
traditional modulus measurements, to determine the dynamic
properties of carbon black-filled rubbers.
CONCLUSIONS AND RECOMMENDATIONS 98
5.2 RECOMMENDATIONS FOR FUTURE WORK
(1) The determination of both electrical and mechanical
properties of carbon black-filled rubbers is recommended to
be carried out over a wide temperature range between -30°C
and 50oC.
(2) Appropriate comparisons should be made between the
actual tank track pads with field history and the virgin as
received samples, in their dynamic properties and electrical
properties.
CONCLUSIONS AND RECOMMENDATIONS 99

BIBLIOGRAPHY
1. J.A. Manson and L.H. Sperling. Polymer Blends and Composites, chap.10, Plenum Press, N. Y. , (1976) .
2. G.R. Cotten and B.B. Boonstra, J. Appl. Polym. Sci. , vol.9, 3395 (1965).
3. G.B. McKenna and L.J. Zapas, Rubber Chern. Technol. , 54, 718 (1981).
4. A.I. Medalia, Rubber Chem. Technol., 51, 437 (1978).
5. A. Voet and F.R. Cook, Rubber Chem. Technol., 41, 1215, (1968).
6. A.K. Sircar and T.G. Lamond, Rubber Chem. Technol., 48, 79 (1975).
7. A.K. Sircar and T.G. Lamond, Rubber Chem. Technol., 48, 89 (1975).
8. A.R. Payne, in "Reinforcement of Elastomers", G. Kraus, Ed., Interscience Publishers, New York, 1965, Ch.3.
9. M. Amin and H.H. Hasen, J. Polym. Sci., 12, 2651 (1974).
10. E.K. Sichel, J.I. Gittleman and P. Sheng, J. Electron. Mater., 11, 699 (1982).
11. W.F. Verhelst, K.G. Wolthuis, A. Voet, P. Ehrburger, and J.B. Donnet, Rubber Chem. Technol., 50, 735 (1977).
12. E.M. Cashell, J.M.D. Coey, G.E. Wardell, V.J. McBrierty, and D.C. Douglass, J. Appl. Phys. 52(3), 1542 (1981).
13. J. Meyer, Polym. Eng. Sci., 13, 462 (1973).
14. J. Meyer, Polym. Eng. Sci., 14, 706 (1974).
15. P. Sheng, E.K. Sichel, and J.I. Gittleman, Phys. Rev. Lett., 40, 1197 (1978).
16. E.K. Sichel, J.I. Gittleman and P. Sheng, Phys. Rev. Lett., B18, 5712 (1978).
17. H. Kawamoto, in "Carbon Black-Polymer Composites", E.K. Sichel, Ed., Marrel Dekker, New York, 1982, Ch.5.
BIBLIOGRAPHY 100

18. A.I. Medalia, Rubber Chem. Technol., 59,432 (1986).
19. J.B. Donnet and A. Voet, "Carbon Black", Marrel Dekker, N.Y., (1976).
20. A.I. Medalia, Rubber Chem. Technol., 47, 411 (1974).
21. R.H. Norman, "Conductive Rubbers And Plastics", Elsevier publishing Co., Ltd., New York, 1970, Ch.3.
22. A. voet, Rubber Chem. Technol., 54, 42 (1981).
23. M.R. Wertheimer, L. Paquin, and H.P. Schreiber, J. Appl. Polym. Sci., 20, 2675 (1976).
24. S. Kirkpatrick, Rev. of Mod. Phys., 45, 574 (1973).
25. K. Evans, "Materials and Design", 5, 43 (1984).
26. B. Abeles, P. Sheng, M.D. Coutts, and Y. Arie, Adv. Phys., 24, 407 (1975).
27. R.D. Sherman, L.M. Middleman, and S.M. Jacobs, Polym. Eng. SCi., 23, 36 (1983).
28. A.K. Jonscher, "Dielectric Relaxation in Solids", Chelsea Dielectrics Press Ltd., London, 1983, Ch.2 and Ch.4.
29. A.K. Jonscher, "Dielectric Relaxation in Solids", Chelsea Dielectrics Press Ltd., London, 1983, pp. 45-47.
30. A.K. Jonscher, "Dielectric Relaxation in Solids", Chelsea Dielectrics Press Ltd., London, 1983, pp. 209-213.
31. J.D. Ulmer, W.M. Hess, and V.E. Chirico, Rubber Chem. Technol., 47, 729 (1974).
32. J.D. Ulmer, V.E. Chirico, and E.S. Dizon, Rubber Chem. Technol., 48, 592 (1975) •.
33. A.X. Jonscher, "Dielectric Relaxation in Solids", Chelsea Dielectrics Press Ltd., London, 1983, pp. 63-67.
34. A.K. Jonscher, "Dielectric Relaxation in Solids", Chelsea Dielectrics Press Ltd., London, 1983, p. 87.
35. K.T. Chung, A. Sabo, and A.P. Pica, J. Appl. Phys., 53, 6867 (1982).
BIBLIOGRAPHY 101

36. A.K. Jonscher, "Dielectric Relaxation in Solids", Chelsea Dielectrics Press Ltd., London, 1983, pp. 224-234.
37. A.K. Jonscher, "Dielectric Relaxation in Solids", Chelsea Dielectrics Press Ltd., London, 1983, pp. 235-241.
38. A. Voet and E.R. Cook, Rubber Chem. Technol., 41, 1207 (1968).
39. A.R. Payne and R.E. Whittaker, Rubber Chem. Technol., 44, 440 (1971).
40. A. Voet and F.R. Cook, Rubber Chem. Technol., 40, 1364 (1967).
BIBLIOGRAPHY 102

CURRICULUM VITAE
Yawlin Hwang was born in Taipei, Taiwan, R.O.C. on April
12, 1960. He received his BS degree in Materials Science
and Engineering from National Tsing Hua University in Hsing
Chu, Taiwan in June of 1982. He spent two years on ROTC
program in Taiwan as an Executive Officer in a Coast Guard
Company and was discharged in May of 1984. He then worked
one year in Institute of Materials Science and Engineering,
National Sun Yat-sen University in Kaohsiung, Taiwan, as a
STEM technician. He began work toward his MS degree in
Materials Engineering in Virginia Tech in september of 1986.
103