dynamic combinatorial chemistry || analytical applications of dynamic combinatorial chemistry
TRANSCRIPT
169
7 Analytical Applications of Dynamic Combinatorial Chemistry Kay Severin
7.1 Introduction
The basic concepts of selection experiments with dynamic combinatorial libraries ( DCL s) were articulated more than 10 years ago (see Chapter 1 ). Since then, a number of applications have emerged. This includes the discovery new enzyme inhibitors, receptors, and catalysts, as well as the synthesis of novel materials such as responsive gels and polymers (see Chapters 2 – 5 ). A recent addition to the list of applications is the utilization of dynamic combinatorial chemistry ( DCC ) for analytical purposes. This chapter summarizes the main ideas and results in this area.
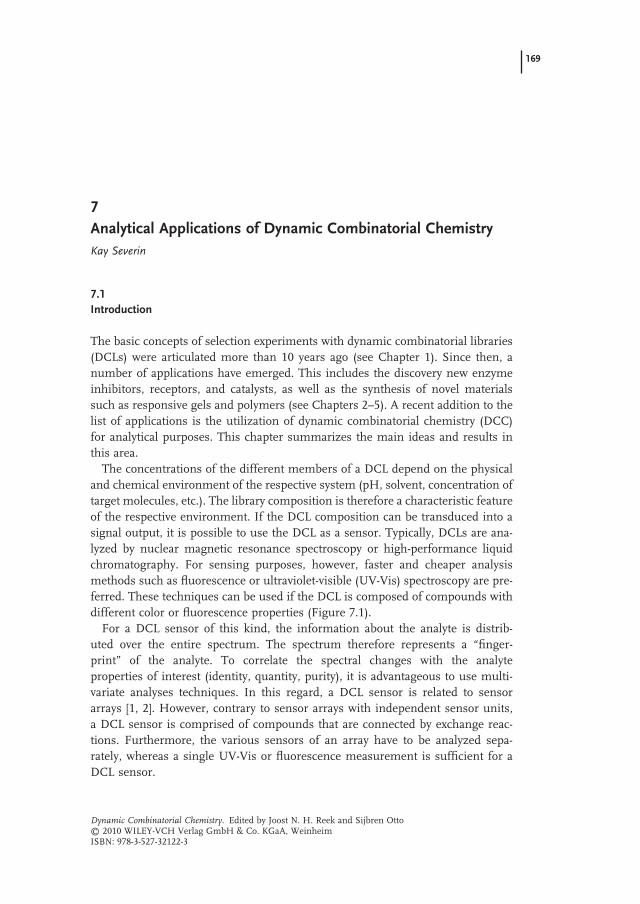
The concentrations of the different members of a DCL depend on the physical and chemical environment of the respective system (pH, solvent, concentration of target molecules, etc.). The library composition is therefore a characteristic feature of the respective environment. If the DCL composition can be transduced into a signal output, it is possible to use the DCL as a sensor. Typically, DCLs are ana-lyzed by nuclear magnetic resonance spectroscopy or high - performance liquid chromatography. For sensing purposes, however, faster and cheaper analysis methods such as fl uorescence or ultraviolet - visible ( UV - Vis ) spectroscopy are pre-ferred. These techniques can be used if the DCL is composed of compounds with different color or fl uorescence properties (Figure 7.1 ).
For a DCL sensor of this kind, the information about the analyte is distrib-uted over the entire spectrum. The spectrum therefore represents a “ fi nger-print ” of the analyte. To correlate the spectral changes with the analyte properties of interest (identity, quantity, purity), it is advantageous to use multi-variate analyses techniques. In this regard, a DCL sensor is related to sensor arrays [1, 2] . However, contrary to sensor arrays with independent sensor units, a DCL sensor is comprised of compounds that are connected by exchange reac-tions. Furthermore, the various sensors of an array have to be analyzed sepa-rately, whereas a single UV - Vis or fl uorescence measurement is suffi cient for a DCL sensor.
Dynamic Combinatorial Chemistry. Edited by Joost N. H. Reek and Sijbren Otto© 2010 WILEY-VCH Verlag GmbH & Co. KGaA, WeinheimISBN: 978-3-527-32122-3
170 7 Analytical Applications of Dynamic Combinatorial Chemistry
7.2 Fluorescent Sensors
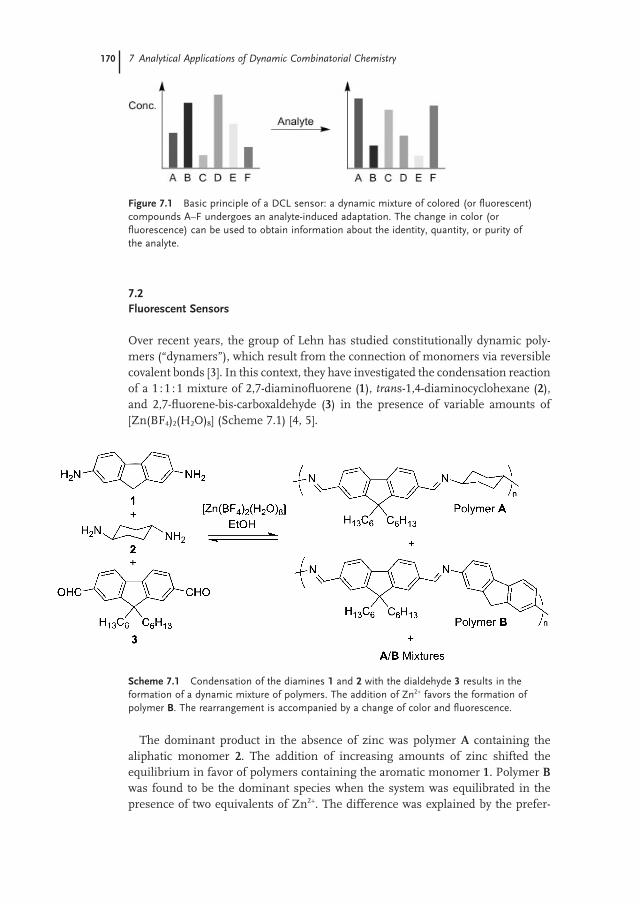
Over recent years, the group of Lehn has studied constitutionally dynamic poly-mers ( “ dynamers ” ), which result from the connection of monomers via reversible covalent bonds [3] . In this context, they have investigated the condensation reaction of a 1 : 1 : 1 mixture of 2,7 - diaminofl uorene ( 1 ), tran s - 1,4 - diaminocyclohexane ( 2 ), and 2,7 - fl uorene - bis - carboxaldehyde ( 3 ) in the presence of variable amounts of [Zn(BF 4 ) 2 (H 2 O) 8 ] (Scheme 7.1 ) [4, 5] .
Scheme 7.1 Condensation of the diamines 1 and 2 with the dialdehyde 3 results in the formation of a dynamic mixture of polymers. The addition of Zn 2+ favors the formation of polymer B . The rearrangement is accompanied by a change of color and fl uorescence.
Figure 7.1 Basic principle of a DCL sensor: a dynamic mixture of colored (or fl uorescent) compounds A – F undergoes an analyte - induced adaptation. The change in color (or fl uorescence) can be used to obtain information about the identity, quantity, or purity of the analyte.
The dominant product in the absence of zinc was polymer A containing the aliphatic monomer 2 . The addition of increasing amounts of zinc shifted the equilibrium in favor of polymers containing the aromatic monomer 1 . Polymer B was found to be the dominant species when the system was equilibrated in the presence of two equivalents of Zn 2+ . The difference was explained by the prefer-
7.3 Colorimetric Sensors 171
ential complexation of Zn 2+ to the more nucleophilic diamine 2 . Polymers A and B show different absorption spectra. The zinc - induced change in polymer compo-sition therefore resulted in a change in color. Similarly, the fl uorescence emission maximum was shifted from 370 to 493 nm with a concomitant increase in inten-sity. The dynamic polymer can therefore be regarded as a system that is able to sense Zn 2+ due to an analyte - induced constitutional rearrangement.
More recently, the Lehn group has reported the synthesis of dynamic polymers with oligosaccharides grafted to the main - chain [6] . These “ glycodynamers ” were found to be strongly fl uorescent. The emission properties were affected by exchange processes. Since oligosaccharides are involved in numerous molecular recognition events, it is conceivable that glycodynamers may fi nd applications in biosensing.
So far, there are only few reports about fl uorescent oligomers that change their constitution upon addition of an analyte. In contrast, there are many examples of fl uorescent molecules that undergo a conformational change upon addition of certain analytes (e.g., “ molecular beacons ” [7] ). Although conformationally dynamic receptors are sometimes discussed in the context of DCC [8] , these systems will not be described in more detail in the present chapter.
7.3 Colorimetric Sensors
Artifi cial receptors can be converted into sensors by covalent attachment of a sig-naling unit such as a fl uorescent dye. An interesting alternative are so - called indicator displacement assay s ( IDA s) [9] . These assays are based on receptors that are bound to dyes (or fl uorescent ligands) via noncovalent interactions. Upon addi-tion of an analyte, the dyes are displaced, which results in a change of their optical properties. These changes can be used to identify and/or quantify the analyte.
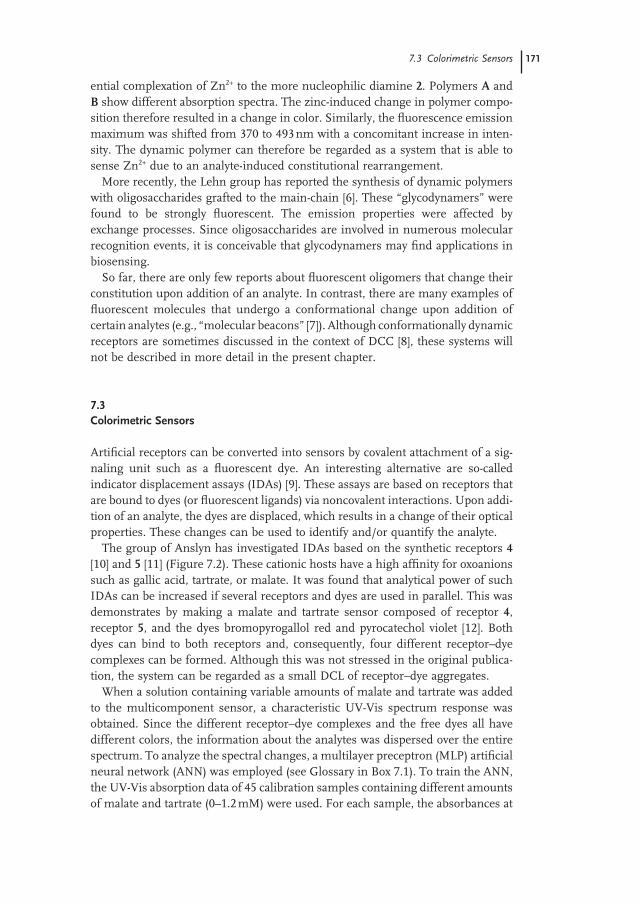
The group of Anslyn has investigated IDAs based on the synthetic receptors 4 [10] and 5 [11] (Figure 7.2 ). These cationic hosts have a high affi nity for oxoanions such as gallic acid, tartrate, or malate. It was found that analytical power of such IDAs can be increased if several receptors and dyes are used in parallel. This was demonstrates by making a malate and tartrate sensor composed of receptor 4 , receptor 5 , and the dyes bromopyrogallol red and pyrocatechol violet [12] . Both dyes can bind to both receptors and, consequently, four different receptor – dye complexes can be formed. Although this was not stressed in the original publica-tion, the system can be regarded as a small DCL of receptor – dye aggregates.
When a solution containing variable amounts of malate and tartrate was added to the multicomponent sensor, a characteristic UV - Vis spectrum response was obtained. Since the different receptor – dye complexes and the free dyes all have different colors, the information about the analytes was dispersed over the entire spectrum. To analyze the spectral changes, a multilayer preceptron ( MLP ) artifi cial neural network ( ANN ) was employed (see Glossary in Box 7.1 ). To train the ANN, the UV - Vis absorption data of 45 calibration samples containing different amounts of malate and tartrate (0 – 1.2 mM) were used. For each sample, the absorbances at
172 7 Analytical Applications of Dynamic Combinatorial Chemistry
Figure 7.2 Dynamic mixture of the receptors 4 , 5 , and the dyes bromopyrogallol red and pyrocatechol violet can be used to determine simultaneously low millimolar concentration of malate and tartrate.
27 wavelengths between 375 and 675 nm were taken as the data input. The training consisted of correlating the input (UV - Vis data) with the output (concentration of the analytes malate and tartrate). The predictive power of the trained network was then evaluated with four validation samples. The absolute errors of the predictions were found to be between 1 and 6%. After further training with new calibration samples, the error was consistently lower than 2%. These results show that a dynamic mixture of receptor – dye complexes can be used as a powerful sensor.
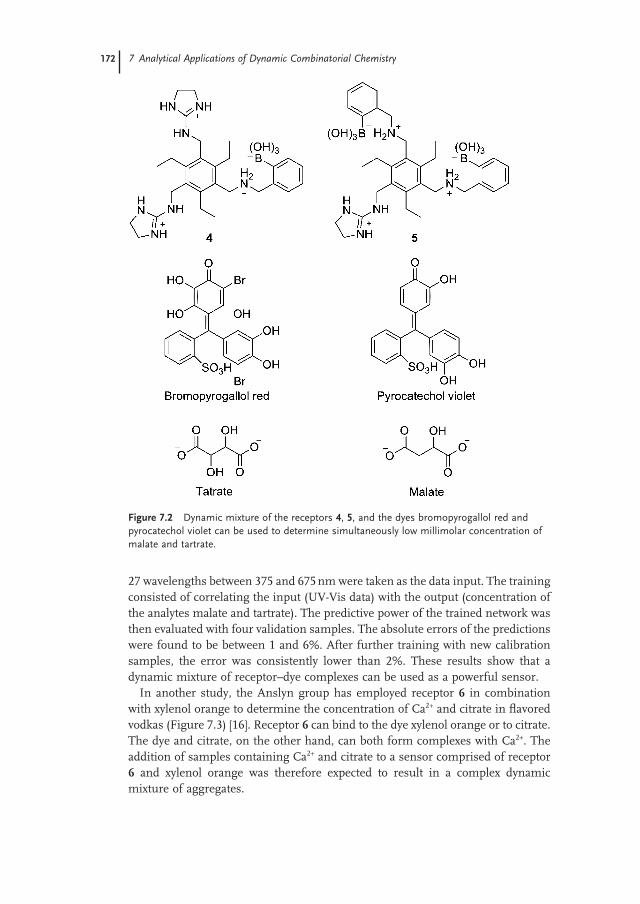
In another study, the Anslyn group has employed receptor 6 in combination with xylenol orange to determine the concentration of Ca 2+ and citrate in fl avored vodkas (Figure 7.3 ) [16] . Receptor 6 can bind to the dye xylenol orange or to citrate. The dye and citrate, on the other hand, can both form complexes with Ca 2+ . The addition of samples containing Ca 2+ and citrate to a sensor comprised of receptor 6 and xylenol orange was therefore expected to result in a complex dynamic mixture of aggregates.
7.3 Colorimetric Sensors 173
Box 7.1 Glossary: Multivariate Analysis.
Principal component analysis (PCA)
A PCA is a statistical tool that allows us to reduce a multidimensional data set to lower dimensions [13] . PCA is mathematically defi ned as an orthogonal linear transformation that converts the data to a new coordinate system such that the highest degree of variance of the data comes to lie on the fi rst coordinate (called the fi rst principal component) and other principal components follow in the order of decreasing variance. PCA is a nonsupervised method that does not use the information of what data belongs to which class (e.g., an analyte).
Linear discriminant analysis (LDA)
Similar to a PCA, a LDA is able to reduce the dimensionality of a dataset [13] . However, contrary to PCA, it is a supervised method that uses the information of which data point belongs to which class. The discriminants are linear combinations of the measured variables (e.g., sensor response). A discriminant function is found that maximizes the ratio of between - class variance to within - class variance.
Cross - validation A cross - validation procedure partitions the dataset into training and validation data. The analysis is performed on the training data and the validation data is used to confi rm the analysis. A leave - one - out cross - validation uses a single observation from the original sample as the validation data and the remaining observations as the training data. This is repeated until each observation in the sample is used once as the validation data.
Artifi cial neural networks (ANN)
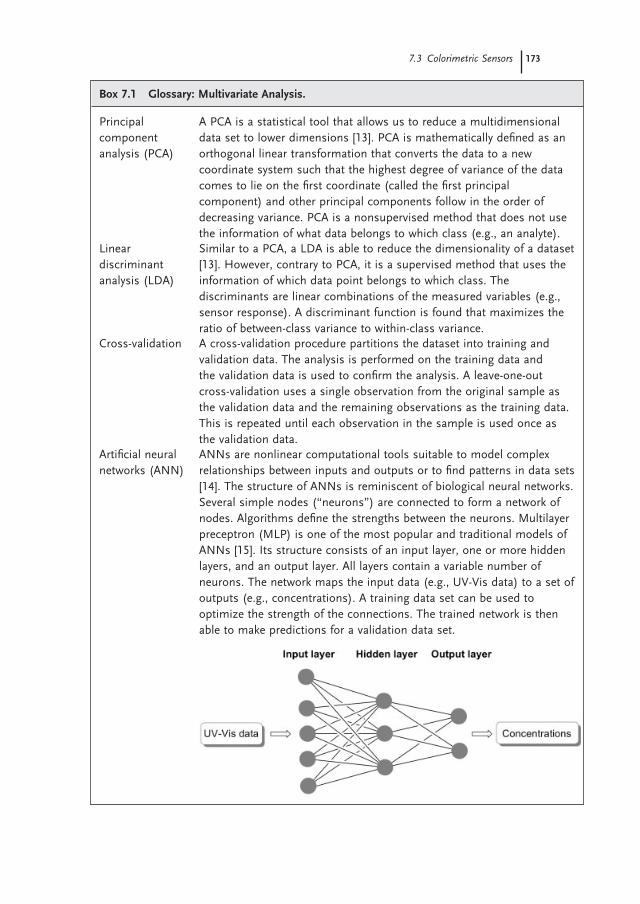
ANNs are nonlinear computational tools suitable to model complex relationships between inputs and outputs or to fi nd patterns in data sets [14] . The structure of ANNs is reminiscent of biological neural networks. Several simple nodes ( “ neurons ” ) are connected to form a network of nodes. Algorithms defi ne the strengths between the neurons. Multilayer preceptron (MLP) is one of the most popular and traditional models of ANNs [15] . Its structure consists of an input layer, one or more hidden layers, and an output layer. All layers contain a variable number of neurons. The network maps the input data (e.g., UV - Vis data) to a set of outputs (e.g., concentrations). A training data set can be used to optimize the strength of the connections. The trained network is then able to make predictions for a validation data set.
174 7 Analytical Applications of Dynamic Combinatorial Chemistry
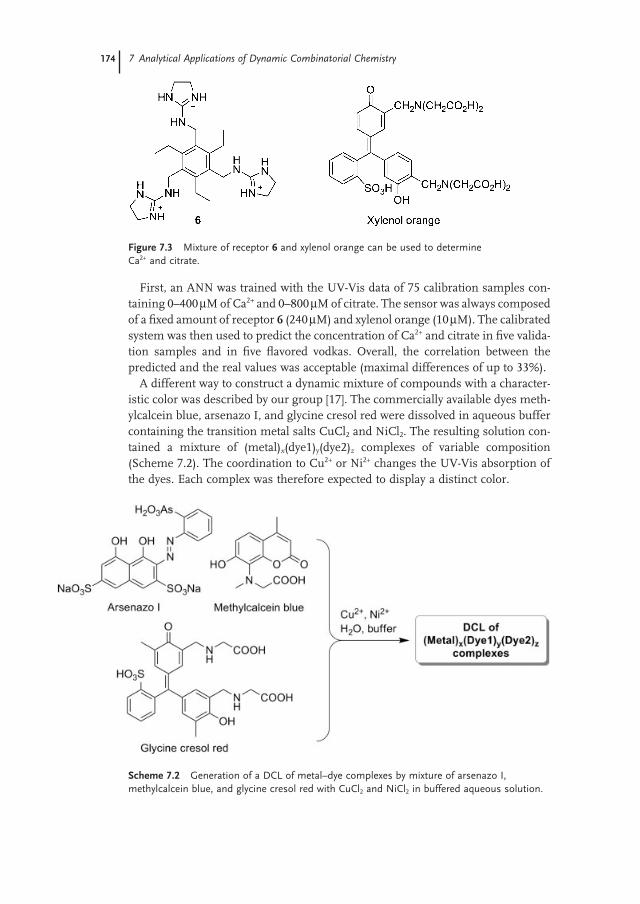
Figure 7.3 Mixture of receptor 6 and xylenol orange can be used to determine Ca 2+ and citrate.
Scheme 7.2 Generation of a DCL of metal – dye complexes by mixture of arsenazo I, methylcalcein blue, and glycine cresol red with CuCl 2 and NiCl 2 in buffered aqueous solution.
First, an ANN was trained with the UV - Vis data of 75 calibration samples con-taining 0 – 400 µ M of Ca 2+ and 0 – 800 µ M of citrate. The sensor was always composed of a fi xed amount of receptor 6 (240 µ M) and xylenol orange (10 µ M). The calibrated system was then used to predict the concentration of Ca 2+ and citrate in fi ve valida-tion samples and in fi ve fl avored vodkas. Overall, the correlation between the predicted and the real values was acceptable (maximal differences of up to 33%).
A different way to construct a dynamic mixture of compounds with a character-istic color was described by our group [17] . The commercially available dyes meth-ylcalcein blue, arsenazo I, and glycine cresol red were dissolved in aqueous buffer containing the transition metal salts CuCl 2 and NiCl 2 . The resulting solution con-tained a mixture of (metal) x (dye1) y (dye2) z complexes of variable composition (Scheme 7.2 ). The coordination to Cu 2+ or Ni 2+ changes the UV - Vis absorption of the dyes. Each complex was therefore expected to display a distinct color.
7.3 Colorimetric Sensors 175
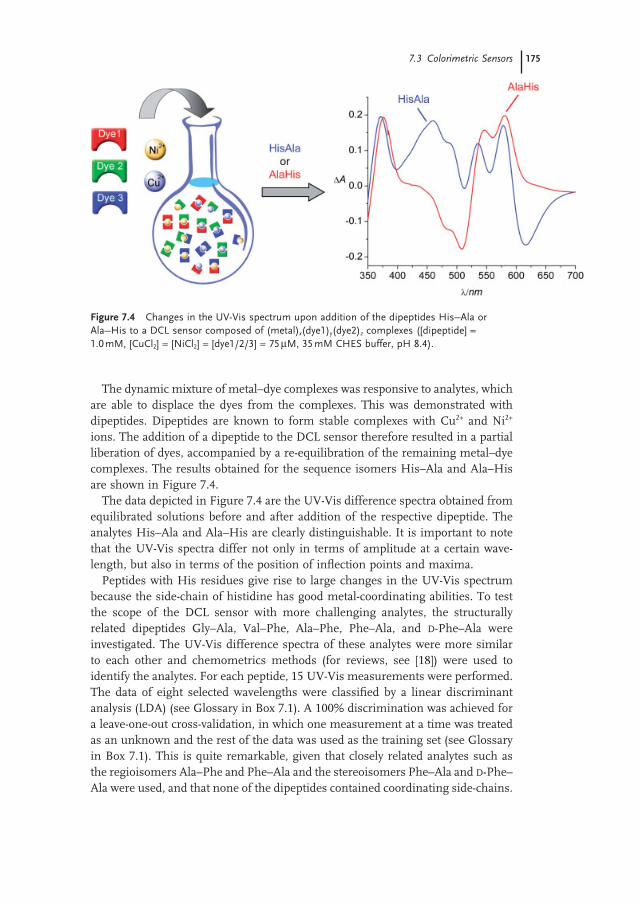
The dynamic mixture of metal – dye complexes was responsive to analytes, which are able to displace the dyes from the complexes. This was demonstrated with dipeptides. Dipeptides are known to form stable complexes with Cu 2+ and Ni 2+ ions. The addition of a dipeptide to the DCL sensor therefore resulted in a partial liberation of dyes, accompanied by a re - equilibration of the remaining metal – dye complexes. The results obtained for the sequence isomers His – Ala and Ala – His are shown in Figure 7.4 .
The data depicted in Figure 7.4 are the UV - Vis difference spectra obtained from equilibrated solutions before and after addition of the respective dipeptide. The analytes His – Ala and Ala – His are clearly distinguishable. It is important to note that the UV - Vis spectra differ not only in terms of amplitude at a certain wave-length, but also in terms of the position of infl ection points and maxima.
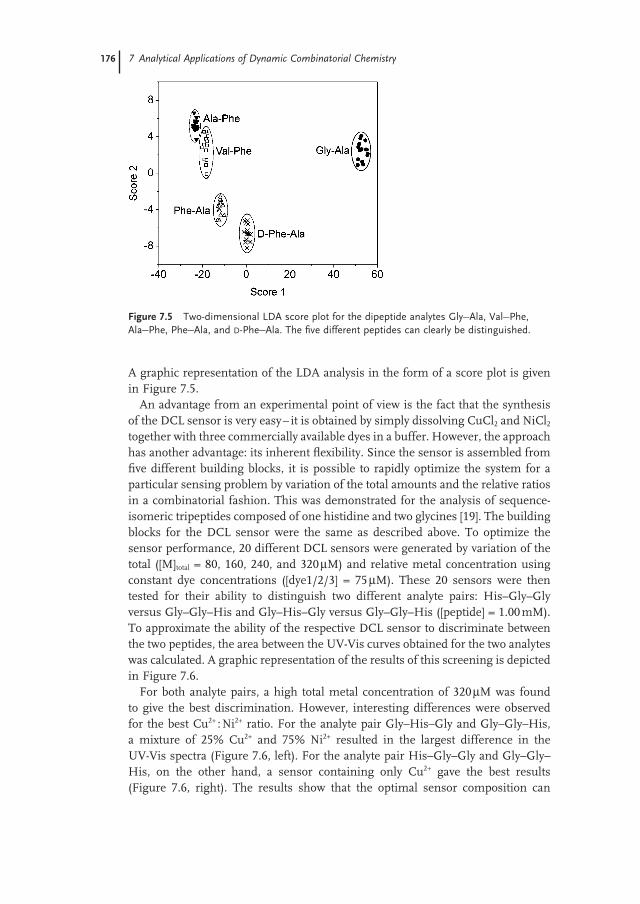
Peptides with His residues give rise to large changes in the UV - Vis spectrum because the side - chain of histidine has good metal - coordinating abilities. To test the scope of the DCL sensor with more challenging analytes, the structurally related dipeptides Gly – Ala, Val – Phe, Ala – Phe, Phe – Ala, and D - Phe – Ala were investigated. The UV - Vis difference spectra of these analytes were more similar to each other and chemometrics methods (for reviews, see [18] ) were used to identify the analytes. For each peptide, 15 UV - Vis measurements were performed. The data of eight selected wavelengths were classifi ed by a linear discriminant analysis ( LDA ) (see Glossary in Box 7.1 ). A 100% discrimination was achieved for a leave - one - out cross - validation, in which one measurement at a time was treated as an unknown and the rest of the data was used as the training set (see Glossary in Box 7.1 ). This is quite remarkable, given that closely related analytes such as the regioisomers Ala – Phe and Phe – Ala and the stereoisomers Phe – Ala and D - Phe – Ala were used, and that none of the dipeptides contained coordinating side - chains.
Figure 7.4 Changes in the UV - Vis spectrum upon addition of the dipeptides His – Ala or Ala – His to a DCL sensor composed of (metal) x (dye1) y (dye2) z complexes ([dipeptide] = 1.0 mM, [CuCl 2 ] = [NiCl 2 ] = [dye1/2/3] = 75 µ M, 35 mM CHES buffer, pH 8.4).
176 7 Analytical Applications of Dynamic Combinatorial Chemistry
A graphic representation of the LDA analysis in the form of a score plot is given in Figure 7.5 .
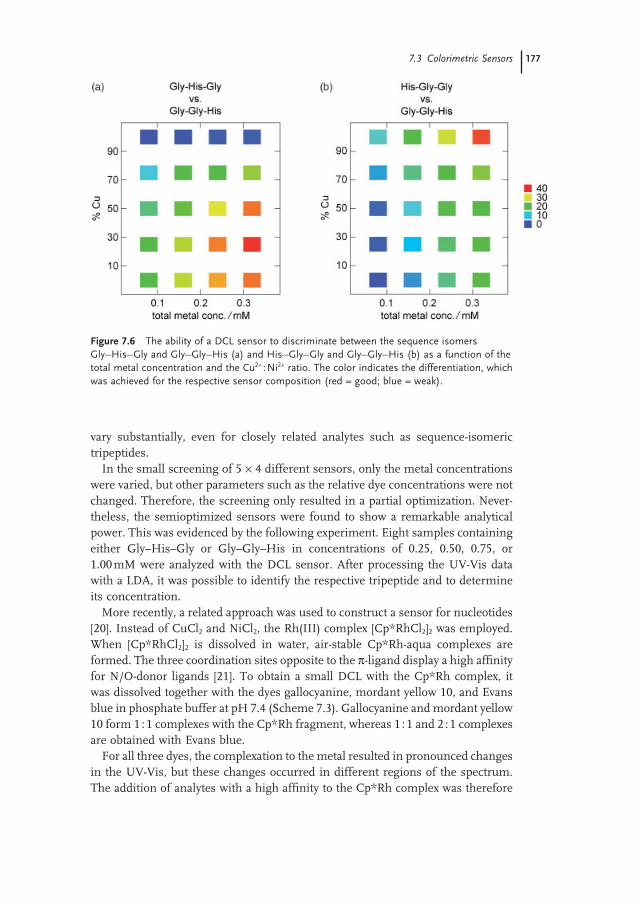
An advantage from an experimental point of view is the fact that the synthesis of the DCL sensor is very easy – it is obtained by simply dissolving CuCl 2 and NiCl 2 together with three commercially available dyes in a buffer. However, the approach has another advantage: its inherent fl exibility. Since the sensor is assembled from fi ve different building blocks, it is possible to rapidly optimize the system for a particular sensing problem by variation of the total amounts and the relative ratios in a combinatorial fashion. This was demonstrated for the analysis of sequence - isomeric tripeptides composed of one histidine and two glycines [19] . The building blocks for the DCL sensor were the same as described above. To optimize the sensor performance, 20 different DCL sensors were generated by variation of the total ([M] total = 80, 160, 240, and 320 µ M) and relative metal concentration using constant dye concentrations ([dye1/2/3] = 75 µ M). These 20 sensors were then tested for their ability to distinguish two different analyte pairs: His – Gly – Gly versus Gly – Gly – His and Gly – His – Gly versus Gly – Gly – His ([peptide] = 1.00 mM). To approximate the ability of the respective DCL sensor to discriminate between the two peptides, the area between the UV - Vis curves obtained for the two analytes was calculated. A graphic representation of the results of this screening is depicted in Figure 7.6 .
For both analyte pairs, a high total metal concentration of 320 µ M was found to give the best discrimination. However, interesting differences were observed for the best Cu 2+ : Ni 2+ ratio. For the analyte pair Gly – His – Gly and Gly – Gly – His, a mixture of 25% Cu 2+ and 75% Ni 2+ resulted in the largest difference in the UV - Vis spectra (Figure 7.6 , left). For the analyte pair His – Gly – Gly and Gly – Gly – His, on the other hand, a sensor containing only Cu 2+ gave the best results (Figure 7.6 , right). The results show that the optimal sensor composition can
Figure 7.5 Two - dimensional LDA score plot for the dipeptide analytes Gly – Ala, Val – Phe, Ala – Phe, Phe – Ala, and D - Phe– Ala. The fi ve different peptides can clearly be distinguished.
7.3 Colorimetric Sensors 177
vary substantially, even for closely related analytes such as sequence - isomeric tripeptides.
In the small screening of 5 × 4 different sensors, only the metal concentrations were varied, but other parameters such as the relative dye concentrations were not changed. Therefore, the screening only resulted in a partial optimization. Never-theless, the semioptimized sensors were found to show a remarkable analytical power. This was evidenced by the following experiment. Eight samples containing either Gly – His – Gly or Gly – Gly – His in concentrations of 0.25, 0.50, 0.75, or 1.00 mM were analyzed with the DCL sensor. After processing the UV - Vis data with a LDA, it was possible to identify the respective tripeptide and to determine its concentration.
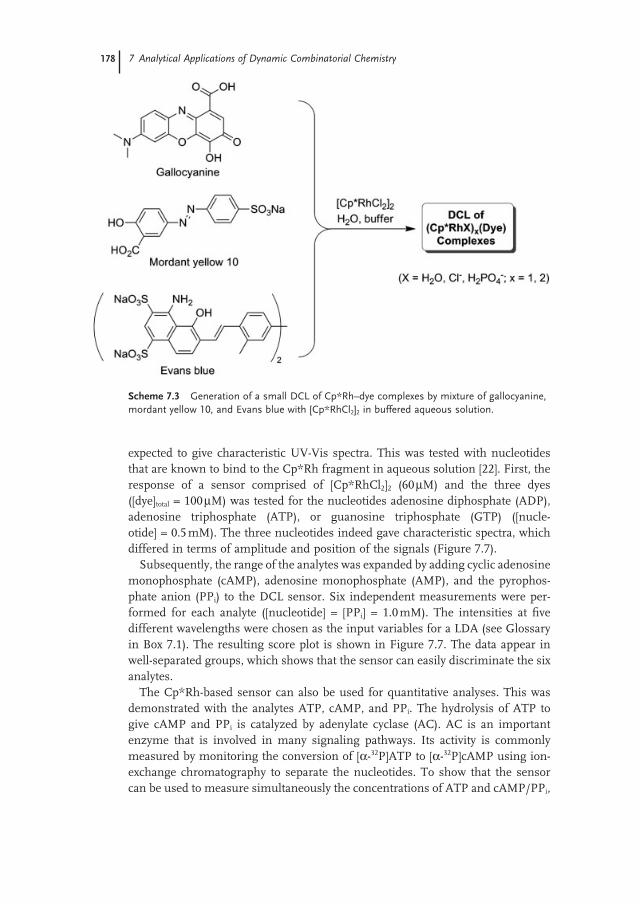
More recently, a related approach was used to construct a sensor for nucleotides [20] . Instead of CuCl 2 and NiCl 2 , the Rh(III) complex [Cp * RhCl 2 ] 2 was employed. When [Cp * RhCl 2 ] 2 is dissolved in water, air - stable Cp * Rh - aqua complexes are formed. The three coordination sites opposite to the π - ligand display a high affi nity for N/O - donor ligands [21] . To obtain a small DCL with the Cp * Rh complex, it was dissolved together with the dyes gallocyanine, mordant yellow 10, and Evans blue in phosphate buffer at pH 7.4 (Scheme 7.3 ). Gallocyanine and mordant yellow 10 form 1 : 1 complexes with the Cp * Rh fragment, whereas 1 : 1 and 2 : 1 complexes are obtained with Evans blue.
For all three dyes, the complexation to the metal resulted in pronounced changes in the UV - Vis, but these changes occurred in different regions of the spectrum. The addition of analytes with a high affi nity to the Cp * Rh complex was therefore
Figure 7.6 The ability of a DCL sensor to discriminate between the sequence isomers Gly – His – Gly and Gly – Gly – His (a) and His – Gly – Gly and Gly – Gly – His (b) as a function of the total metal concentration and the Cu 2+ : Ni 2+ ratio. The color indicates the differentiation, which was achieved for the respective sensor composition (red = good; blue = weak).
178 7 Analytical Applications of Dynamic Combinatorial Chemistry
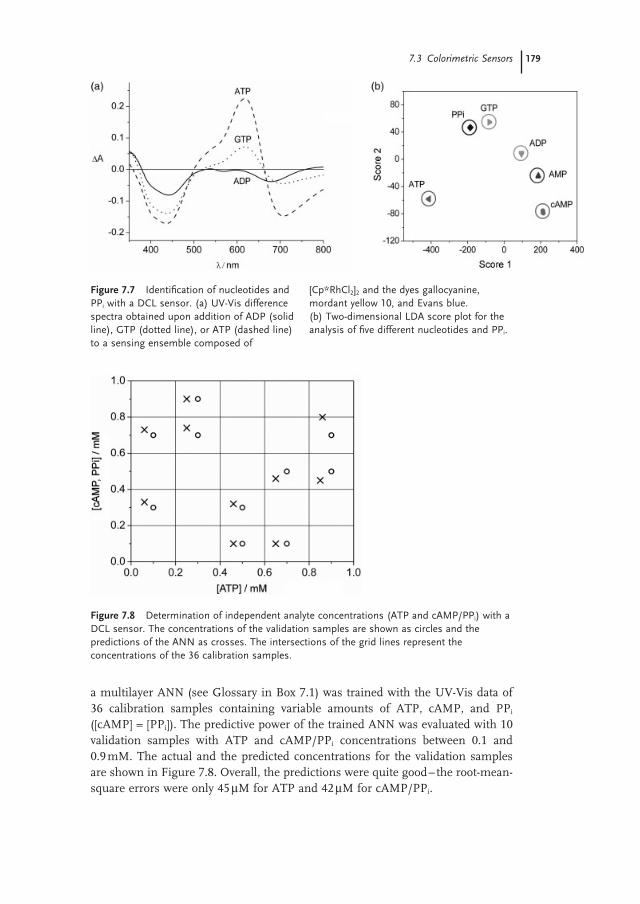
expected to give characteristic UV - Vis spectra. This was tested with nucleotides that are known to bind to the Cp * Rh fragment in aqueous solution [22] . First, the response of a sensor comprised of [Cp * RhCl 2 ] 2 (60 µ M) and the three dyes ([dye] total = 100 µ M) was tested for the nucleotides adenosine diphosphate ( ADP ), adenosine triphosphate ( ATP ), or guanosine triphosphate ( GTP ) ([nucle-otide] = 0.5 mM). The three nucleotides indeed gave characteristic spectra, which differed in terms of amplitude and position of the signals (Figure 7.7 ).
Subsequently, the range of the analytes was expanded by adding cyclic adenosine monophosphate ( cAMP ), adenosine monophosphate ( AMP ), and the pyrophos-phate anion ( PP i ) to the DCL sensor. Six independent measurements were per-formed for each analyte ([nucleotide] = [PP i ] = 1.0 mM). The intensities at fi ve different wavelengths were chosen as the input variables for a LDA (see Glossary in Box 7.1 ). The resulting score plot is shown in Figure 7.7 . The data appear in well - separated groups, which shows that the sensor can easily discriminate the six analytes.
The Cp * Rh - based sensor can also be used for quantitative analyses. This was demonstrated with the analytes ATP, cAMP, and PP i . The hydrolysis of ATP to give cAMP and PP i is catalyzed by adenylate cyclase ( AC ). AC is an important enzyme that is involved in many signaling pathways. Its activity is commonly measured by monitoring the conversion of [ α - 32 P]ATP to [ α - 32 P]cAMP using ion - exchange chromatography to separate the nucleotides. To show that the sensor can be used to measure simultaneously the concentrations of ATP and cAMP/PP i ,
Scheme 7.3 Generation of a small DCL of Cp * Rh – dye complexes by mixture of gallocyanine, mordant yellow 10, and Evans blue with [Cp * RhCl 2 ] 2 in buffered aqueous solution.
7.3 Colorimetric Sensors 179
Figure 7.8 Determination of independent analyte concentrations (ATP and cAMP/PP i ) with a DCL sensor. The concentrations of the validation samples are shown as circles and the predictions of the ANN as crosses. The intersections of the grid lines represent the concentrations of the 36 calibration samples.
a multilayer ANN (see Glossary in Box 7.1 ) was trained with the UV - Vis data of 36 calibration samples containing variable amounts of ATP, cAMP, and PP i ([cAMP] = [PP i ]). The predictive power of the trained ANN was evaluated with 10 validation samples with ATP and cAMP/PP i concentrations between 0.1 and 0.9 mM. The actual and the predicted concentrations for the validation samples are shown in Figure 7.8 . Overall, the predictions were quite good – the root - mean - square errors were only 45 µ M for ATP and 42 µ M for cAMP/PP i .
Figure 7.7 Identifi cation of nucleotides and PP i with a DCL sensor. (a) UV - Vis difference spectra obtained upon addition of ADP (solid line), GTP (dotted line), or ATP (dashed line) to a sensing ensemble composed of
[Cp * RhCl 2 ] 2 and the dyes gallocyanine, mordant yellow 10, and Evans blue. (b) Two - dimensional LDA score plot for the analysis of fi ve different nucleotides and PP i .
180 7 Analytical Applications of Dynamic Combinatorial Chemistry
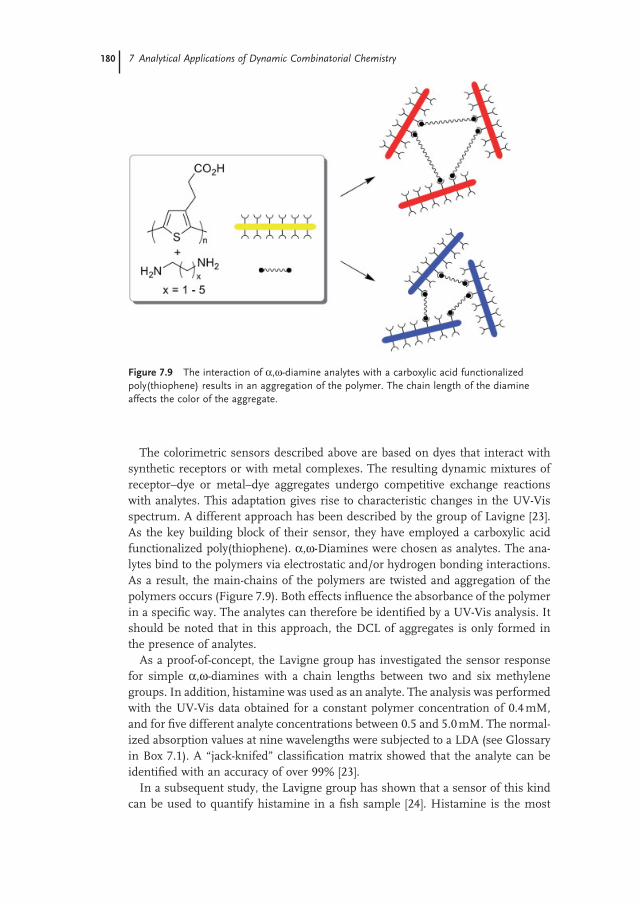
The colorimetric sensors described above are based on dyes that interact with synthetic receptors or with metal complexes. The resulting dynamic mixtures of receptor – dye or metal – dye aggregates undergo competitive exchange reactions with analytes. This adaptation gives rise to characteristic changes in the UV - Vis spectrum. A different approach has been described by the group of Lavigne [23] . As the key building block of their sensor, they have employed a carboxylic acid functionalized poly(thiophene). α , ω - Diamines were chosen as analytes. The ana-lytes bind to the polymers via electrostatic and/or hydrogen bonding interactions. As a result, the main - chains of the polymers are twisted and aggregation of the polymers occurs (Figure 7.9 ). Both effects infl uence the absorbance of the polymer in a specifi c way. The analytes can therefore be identifi ed by a UV - Vis analysis. It should be noted that in this approach, the DCL of aggregates is only formed in the presence of analytes.
As a proof - of - concept, the Lavigne group has investigated the sensor response for simple α , ω - diamines with a chain lengths between two and six methylene groups. In addition, histamine was used as an analyte. The analysis was performed with the UV - Vis data obtained for a constant polymer concentration of 0.4 mM, and for fi ve different analyte concentrations between 0.5 and 5.0 mM. The normal-ized absorption values at nine wavelengths were subjected to a LDA (see Glossary in Box 7.1 ). A “ jack - knifed ” classifi cation matrix showed that the analyte can be identifi ed with an accuracy of over 99% [23] .
In a subsequent study, the Lavigne group has shown that a sensor of this kind can be used to quantify histamine in a fi sh sample [24] . Histamine is the most
Figure 7.9 The interaction of α , ω - diamine analytes with a carboxylic acid functionalized poly(thiophene) results in an aggregation of the polymer. The chain length of the diamine affects the color of the aggregate.
7.4 Molecular Timers 181
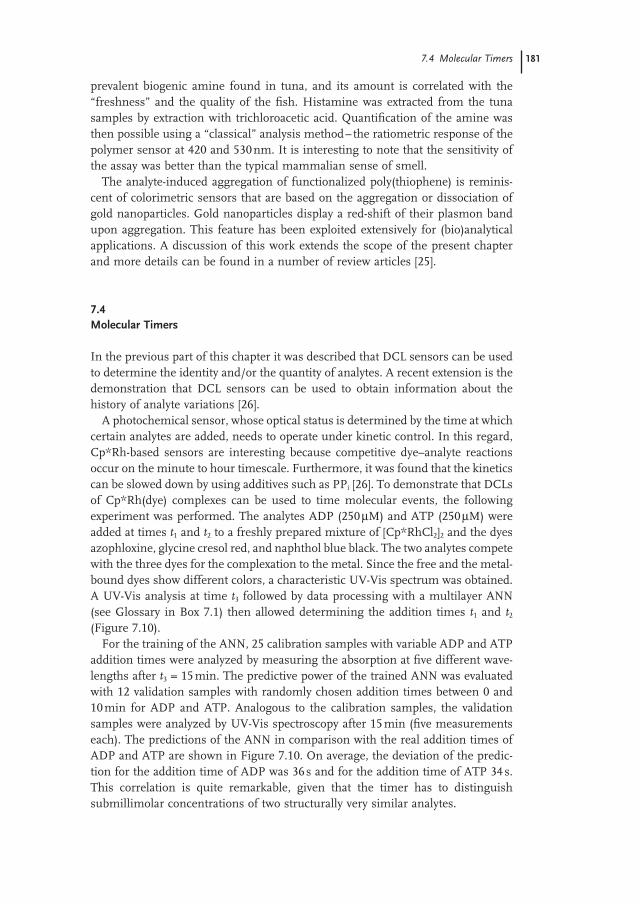
prevalent biogenic amine found in tuna, and its amount is correlated with the “ freshness ” and the quality of the fi sh. Histamine was extracted from the tuna samples by extraction with trichloroacetic acid. Quantifi cation of the amine was then possible using a “ classical ” analysis method – the ratiometric response of the polymer sensor at 420 and 530 nm. It is interesting to note that the sensitivity of the assay was better than the typical mammalian sense of smell.
The analyte - induced aggregation of functionalized poly(thiophene) is reminis-cent of colorimetric sensors that are based on the aggregation or dissociation of gold nanoparticles. Gold nanoparticles display a red - shift of their plasmon band upon aggregation. This feature has been exploited extensively for (bio)analytical applications. A discussion of this work extends the scope of the present chapter and more details can be found in a number of review articles [25] .
7.4 Molecular Timers
In the previous part of this chapter it was described that DCL sensors can be used to determine the identity and/or the quantity of analytes. A recent extension is the demonstration that DCL sensors can be used to obtain information about the history of analyte variations [26] .
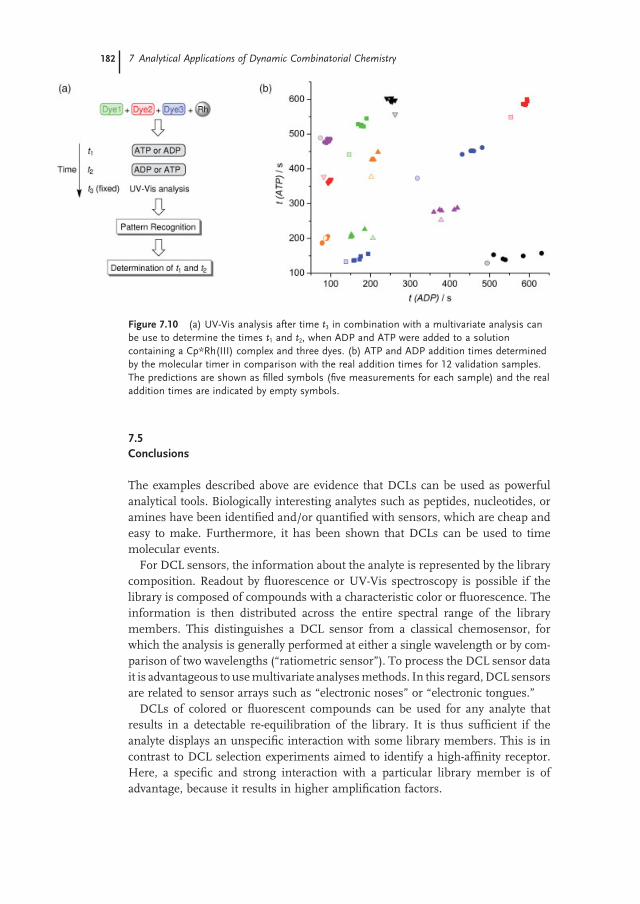
A photochemical sensor, whose optical status is determined by the time at which certain analytes are added, needs to operate under kinetic control. In this regard, Cp * Rh - based sensors are interesting because competitive dye – analyte reactions occur on the minute to hour timescale. Furthermore, it was found that the kinetics can be slowed down by using additives such as PP i [26] . To demonstrate that DCLs of Cp * Rh(dye) complexes can be used to time molecular events, the following experiment was performed. The analytes ADP (250 µ M) and ATP (250 µ M) were added at times t 1 and t 2 to a freshly prepared mixture of [Cp * RhCl 2 ] 2 and the dyes azophloxine, glycine cresol red, and naphthol blue black. The two analytes compete with the three dyes for the complexation to the metal. Since the free and the metal - bound dyes show different colors, a characteristic UV - Vis spectrum was obtained. A UV - Vis analysis at time t 3 followed by data processing with a multilayer ANN (see Glossary in Box 7.1 ) then allowed determining the addition times t 1 and t 2 (Figure 7.10 ).
For the training of the ANN, 25 calibration samples with variable ADP and ATP addition times were analyzed by measuring the absorption at fi ve different wave-lengths after t 3 = 15 min. The predictive power of the trained ANN was evaluated with 12 validation samples with randomly chosen addition times between 0 and 10 min for ADP and ATP. Analogous to the calibration samples, the validation samples were analyzed by UV - Vis spectroscopy after 15 min (fi ve measurements each). The predictions of the ANN in comparison with the real addition times of ADP and ATP are shown in Figure 7.10 . On average, the deviation of the predic-tion for the addition time of ADP was 36 s and for the addition time of ATP 34 s. This correlation is quite remarkable, given that the timer has to distinguish submillimolar concentrations of two structurally very similar analytes.
182 7 Analytical Applications of Dynamic Combinatorial Chemistry
7.5 Conclusions
The examples described above are evidence that DCLs can be used as powerful analytical tools. Biologically interesting analytes such as peptides, nucleotides, or amines have been identifi ed and/or quantifi ed with sensors, which are cheap and easy to make. Furthermore, it has been shown that DCLs can be used to time molecular events.
For DCL sensors, the information about the analyte is represented by the library composition. Readout by fl uorescence or UV - Vis spectroscopy is possible if the library is composed of compounds with a characteristic color or fl uorescence. The information is then distributed across the entire spectral range of the library members. This distinguishes a DCL sensor from a classical chemosensor, for which the analysis is generally performed at either a single wavelength or by com-parison of two wavelengths ( “ ratiometric sensor ” ). To process the DCL sensor data it is advantageous to use multivariate analyses methods. In this regard, DCL sensors are related to sensor arrays such as “ electronic noses ” or “ electronic tongues. ”
DCLs of colored or fl uorescent compounds can be used for any analyte that results in a detectable re - equilibration of the library. It is thus suffi cient if the analyte displays an unspecifi c interaction with some library members. This is in contrast to DCL selection experiments aimed to identify a high - affi nity receptor. Here, a specifi c and strong interaction with a particular library member is of advantage, because it results in higher amplifi cation factors.
Figure 7.10 (a) UV - Vis analysis after time t 3 in combination with a multivariate analysis can be use to determine the times t 1 and t 2 , when ADP and ATP were added to a solution containing a Cp * Rh(III) complex and three dyes. (b) ATP and ADP addition times determined by the molecular timer in comparison with the real addition times for 12 validation samples. The predictions are shown as fi lled symbols (fi ve measurements for each sample) and the real addition times are indicated by empty symbols.
References 183
From an experimental point of view, DCL sensors have two key advantages. (i) The generation of a DCL sensor is very simple – all that is required is to mix the respective building blocks. This is exemplifi ed by the colorimetric DCL sensor for dipeptides, which was obtained by mixing CuCl 2 , NiCl 2 , and three commercially available dyes. (ii) DCL sensors can easily be modifi ed – and thus optimized – by variation of the nature, amounts, and relative ratios of the constituent building blocks. This fl exibility is not found for classical chemosensors, which are based on receptors with covalently attached signaling units. Here, structural modifi ca-tions may require substantial synthetic efforts.
The utilization of DCLs for analytical purposes is a recent addition to the con-stantly growing list of applications of DCC. So far, there are few publications in this area, most of which are summarized in this chapter. However, in view of the advantages outline above, it is likely that interesting new developments and appli-cations will be reported in the near future.
References
1 Wright , A.T. and Anslyn , E.V. ( 2006 ) Chem. Soc. Rev. , 35 , 14 – 28 .
2 Albert , K.L. , Lewis , N.S. , Schauer , C.L. , Sotzing , G.A. , Stizel , S.E. , Vaid , T.P. , and Walt , D.R. ( 2000 ) Chem. Rev. , 100 , 2595 – 2626 .
3 Lehn , J.M. ( 2005 ) Prog. Polym. Sci. , 30 , 814 – 831 .
4 Guiseppone , N. and Lehn , J.M. ( 2004 ) J.
Am. Chem. Soc. , 126 , 11448 – 11449 . 5 Guiseppone , N. , Fuks , G. , and Lehn ,
J.M. ( 2006 ) Chem. Eur. J. , 12 , 1723 – 1735 . 6 Ruff , Y. and Lehn , J.M. ( 2008 ) Angew.
Chem. Int. Ed. , 47 , 3556 – 3559 . 7 Tan , W. , Wang , K. , and Drake , T.J. ( 2004 )
Curr. Opin. Chem. Biol. , 8 , 547 – 553 . 8 Eliseev , A.V. and Nelen , M.I. ( 1997 ) J.
Am. Chem. Soc. , 119 , 1147 – 1148 . 9 (a) Nguyen , B.T. and Anslyn , E.V. ( 2006 )
Coord. Chem. Rev. , 250 , 3118 – 3127 . (b) Fabbrizzi , L. , Licchelli , M. , and Taglietti , A. ( 2003 ) Dalton Trans. , 3471 – 3479 .
10 Lavigne , J.J. and Anslyn , E.V. ( 1999 ) Angew. Chem. Int. Ed. , 38 , 3666 – 3669 .
11 Wiskur , S.L. and Anslyn , E.V. ( 2001 ) J.
Am. Chem. Soc. , 123 , 10109 – 10110 . 12 Wiskur , S.L. , Floriano , P.N. , Anslyn ,
E.V. , and McDevitt , J.T. ( 2003 ) Angew.
Chem. Int. Ed. , 42 , 2070 – 2972 . 13 Jurs , P.C. , Bakken , G.A. , and McClelland ,
H.E. ( 2000 ) Chem. Rev. , 100 , 2649 – 2678 .
14 Marini , F. , Bucci , R. , Magr ì , A.L. , and Magr ì , A.D. ( 2008 ) Microchem. J. , 88 , 178 – 185 .
15 Cherkassky , V. and Mullier , F. ( 1998 ) Learning from Data: Concepts, Theory,
and Method , John Wiley & Sons, Inc. , New York .
16 McCleskey , S.C. , Floriano , P.N. , Wiskur , S.L. , Anslyn , E.V. , and McDevitt , J.T. ( 2003 ) Tetrahedron , 59 , 10089 – 10092 .
17 Buryak , A. and Severin , K. ( 2005 ) Angew.
Chem. Int. Ed. , 44 , 7935 – 7938 . 18 (a) Lavine , B. and Workman , J. ( 2008 )
Anal. Chem. , 80 , 4519 – 4531 . (b) Lavine , B. and Workman , J. ( 2006 ) Anal. Chem. , 78 , 4137 – 4145 . (c) Geladi , P. , Sethson , B. , Nystr ö m , J. , Lillhonga , T. , Lestander , T. , and Burger , J. ( 2004 ) Spectrochim.
Acta , B 59 , 1347 – 1357 . 19 Buryak , A. and Severin , K. ( 2006 ) J.
Comb. Chem. , 8 , 540 – 543 . 20 Buryak , A. , Pozdnoukhov , A. , and
Severin , K. ( 2007 ) Chem. Commun. , 2366 – 2368 .
21 (a) Zaubitzer , F. , Buryak , A. , and Severin , K. ( 2006 ) Chem. Eur. J. , 12 , 3928 – 3934 . (b) Buryak , A. and Severin , K. ( 2005 ) J.
Am. Chem. Soc. , 127 , 3700 – 3701 . (c) Buryak , A. and Severin , K. ( 2004 ) Angew. Chem. Int. Ed. , 43 , 4771 – 4774 .
184 7 Analytical Applications of Dynamic Combinatorial Chemistry
22 Fish , R.H. ( 1999 ) Coord. Chem. Rev. , 185 - 186 , 569 – 584 .
23 Nelson , T.L. , O ' Sullivan , C. , Greene , N.T. , Maynor , M.S. , and Lavigne , J.J. ( 2006 ) J. Am. Chem. Soc. , 128 , 5640 – 5641 .
24 Maynor , M.S. , Nelson , T.L. , O ' Sullivan , C. , and Lavigne , J.J. ( 2007 ) Org. Lett. , 9 , 3217 – 3220 .
25 (a) Baron , R. , Willner , B. , and Willner , I. ( 2007 ) Chem. Commun. , 323 – 332 . (b) Lu , Y. and Liu , J. ( 2006 ) Curr. Opin. Chem.
Biol. , 17 , 580 – 588 . (c) Rosi , N.L. and Mirkin , C.A. ( 2005 ) Chem. Rev. , 105 , 1547 – 1562 .
26 Buryak , A. , Zaubitzer , F. , Pozdnoukhov , A. , and Severin , K. ( 2008 ) J. Am. Chem.
Soc. , 130 , 11260 – 11261 .