dynamic behavior of magnetic latex particles and
TRANSCRIPT
Louisiana State UniversityLSU Digital Commons
LSU Historical Dissertations and Theses Graduate School
1994
Dynamic Behavior of Magnetic Latex Particles andPolyelectrolytes.Daewon SohnLouisiana State University and Agricultural & Mechanical College
Follow this and additional works at: https://digitalcommons.lsu.edu/gradschool_disstheses
This Dissertation is brought to you for free and open access by the Graduate School at LSU Digital Commons. It has been accepted for inclusion inLSU Historical Dissertations and Theses by an authorized administrator of LSU Digital Commons. For more information, please [email protected].
Recommended CitationSohn, Daewon, "Dynamic Behavior of Magnetic Latex Particles and Polyelectrolytes." (1994). LSU Historical Dissertations and Theses.5905.https://digitalcommons.lsu.edu/gradschool_disstheses/5905
INFORMATION TO USERS
This manuscript has been reproduced from the microfilm master. UMI films the text directly from the original or copy submitted. Thus, some thesis and dissertation copies are in typewriter face, while others may be from any type of computer printer.
H ie quality of this reproduction is dependent upon the quality of the copy submitted. Broken or indistinct print, colored or poor quality illustrations and photographs, print bleedthrough, substandard margins, and improper alignment can adversely affect reproduction.
In the unlikely event that the author did not send UMI a complete manuscript and there are missing pages, these will be noted. Also, if unauthorized copyright material had to be removed, a note will indicate the deletion.
Oversize materials (e.g., maps, drawings, charts) are reproduced by sectioning the original, beginning at the upper left-hand comer and continuing from left to right in equal sections with small overlaps. Each original is also photographed in one exposure and is included in reduced form at the back of the book.
Photographs included in the original manuscript have been reproduced xerographically in this copy. Higher quality 6” x 9" black and white photographic prints are available for any photographs or illustrations appearing in this copy for an additional charge. Contact UMI directly to order.
A Bell & Howell Information Company 300 North Z eeb Road. Ann Arbor. Ml 48106-1346 USA
313/761-4700 800/521-0600

DYNAMIC BEHAVIOR OF MAGNETIC LATEX PARTICLES AND POLYELECTROLYTES
A Dissertation
Submitted to the Graduate Faculty o f the Louisiana State University and
Agricultural and Mechanical College in partial fulfillment o f the
requirements for the degree o f D octor o f Philosophy
in
The Department o f Chemistry
byDaewon Sohn
M .S., Hanyang University, Seoul, Korea, 1986 B.S., Hanyang University, Seoul, Korea, 1984
December 1994
UMI Number: 9524485
OMI Microform Edition 9524485 Copyright 1995, by UMI Company. All rights reserved.
This microform edition is protected against unauthorized copying under Title 17, United States Code.
UMI300 North Zeeb Road Ann Arbor, MI 48103

To
MiRang and DongWon
ii
ACKNOWLEDGMENTS
First I would like to especially extend my gratitude to Dr. Paul S. Russo, for his
invaluable support, thoughtfulness, guidance, and constructive criticism. Special
thanks are also extended to Drs. W. H. Daly, J. R. Collier, R. W. Hall, and A. R. P.
Rau for being my committee members. I sincerely appreciate their enthusiasm and
encouragement.
I wish to thank Dr. S. Lee, he advised me during my first year in Baton Rouge.
I am also grateful to Dr. Tahir Jamil and Russo's group members; Debbie, Zimei,
Keunok, Steve, Lucille, and Mike. Thanks are also given to Dr. Russo's family: Mrs.
Mary Russo, Michael, and Amy. I f they didn't invite me, I could have a couple o f
hungry Thanksgivings. Debbie, Steve, M ark, and Lucille, whom I consider the "Real
Macoy," helped me to correct the mistakes o f my English in this work. I would also
like to acknowledge Cindy Henk in the EM lab who took EM pictures, Dr. M. L.
Mclaughlin and Mr. A. Davila who labeled the polymer for the FPR experiment, Dr. D.
S. Poche' who measured the molecular weight o f NaPSS, and Dr. L. G. Butler and Mr.
Y. Lee who helped me to make the Helmholtz coil for the field induced study.
I am also indebted to Louisiana State University and NSF for their financial
support o f my graduate studies and researches.
To my parents, it would be hard to repay for your endless faith and support.
Likewise, I will always be indebted to my brother and sister. M y final sentence should
give to my wife, MiRang, who got married, had a baby, and prayed for me every single
day. For her incessant patience, love, and support I am forever thankful.
TABLE OF CONTENTS
DEDICATION.............................................................................................................................ii
ACKNOW LEDGM ENTS....................................................................................................... iii
LIST OF TA BLES................................................................................................................... vii
LIST OF FIG U R E S................................................................................................................viii
LIST OF SY M B O LS............................................................................................................. xiv
LIST OF A B BR EV IA TIO N S..............................................................................................xix
A B STR A C T............................................................................................................................. xxi
CHAPTER 1IN TRO D U CTIO N......................................................................................................................1
1.1 PROBE DIFFUSION STU DIES......................................................................... 21.1.1 GENERAL CONCEPTS............................................................................21.1.2 TECHNIQUE FOR PROBE DIFFUSION STUDIES........................ 4
1.2 CHARGED INTERACTIO N................................................................................51.2.1 COLLOID...................................................................................................... 51.2.2 POLYELECTROLY TES...........................................................................6
1.3 GENERAL CHARACTERISTICS OF M AGNETIC LATEX PA RTICLES............................................................................................................. 7
1.4 PROPERTIES OF MAGNETIC LATEX PA R TIC LE S................................91.4.1 SURFACE C H A R G E .................................................................................91.4.2 M AGNETIC SUSCEPTIBILITY.......................................................... 131.4.3 OPTICAL ANISOTROPY...................................................................... 14
1.5 REFEREN CES...................................................................................................... 17
CHAPTER 2PROBE DIFFUSION OF M AGNETIC LATEX PA RTICLES.................................... 20
2.1 BA CK G RO U N D .................................................................................................. 212.2 EX PERIM EN T......................................................................................................252.3 RESULTS AND DISCUSSION........................................................................ 26
2.3.1 IN DILUTE BINARY SO LU TIO N ..................................................... 262.3.2 IN PRESENCE OF POLY(STYRENESULFONATE)....................29
2.4 SU M M A R Y ...........................................................................................................312.5 REFEREN CES...................................................................................................... 37
CHAPTER 3INTERACTION BETW EEN POLYELECTROLYTES AND M AGNETICLATEX PA R TIC LE S............................................................................................................. 38
3.1 IN TR O D U CTIO N ............................................................................................... 39
3.1.1 COLLOID AND POLYM ER IN TER A C TIO N S.............................. 403.1.2 STATIC AND DYNAMIC LIGHT SCA TTERIN G ........................ 41
3.2 EX PERIM EN T...................................................................................................... 443.3 RESULTS AND DISCUSSIO N........................................................................ 48
3.3.1 INTERPARTICLE INTERACTIONS IN SALTCO N D ITIO N ............................................................................................48
3.3.1.1 PARTICLE CHARACTERIZATION IN PURE W ATER ... 483.3.1.2 INTERPARTICLE INTERACTIONS: NO ADDED
PO LYM ER.......................................................................................... 553.3.1.3 EFFECT OF PO LYELECTROLY TE......................................... 59
3.3.2 FLUORESCENCE PHOTOBLEACHING R E C O V ER Y ...............6 8
3.3.2.1 LABELING THE POLYSTYRENESULFONATE SODIUM SA L T .................................................................................6 8
3.3.2.2 CHARACTERIZATION OF LABELED PSS (L P S S ) 703.3.2 3 FLUORESCENCE PHOTOBLEACHING RECOVERY
M EASUREM ENT............................................................................. 723.3.2.4 STABILIZATION M EC H A N ISM .............................................. 73
3.4 SU M M A R Y ........................................................................................................... 763.5 R EFEREN CES.......................................................................................................79
CHAPTER 4KINETIC STUDIES OF M AGNETIC LATEX PARTICLES’ SELF ASSEM BLY UNDER APPLIED M AGNETIC FIELD ..................................................82
4.1 IN TR O D U CTIO N ................................................................................................ 834.2 KINETIC M ECHANISM AND THEORY..................................................... 84
4.2.1 M ECHANICAL C O N C EPTS................................................................ 844.2.2 PHASE TRANSITION C O N C E PT S...................................................854.2.3 KINETIC CONSIDERATIONS.............................................................8 6
4.3 VIDEO M IC R O SC O PY ......................................................................................8 8
4.3.1 GENERAL IN TR O D U CTIO N ..............................................................8 8
4.3.2 CELL GEOM ETRY AND M AGNETIC F IE L D ...............................8 8
4.3.3 SAMPLE PREPARATION.....................................................................904.3.4 IMAGE PR O C E SSIN G ...........................................................................914.3.5 RESULTS AND DISCUSSIO N.............................................................93
4.4 VIDEO SMALL ANGLE LIGHT SCATTERING..................................... 1004.4.1 GENERAL IN TR O D U CTIO N ............................................................1004.4.2 EXPERIM ENTAL SE T U P................................................................... 1014.4.3 DATA HANDLING AND EXPERIM ENTAL R E SU L T S 103
4.5 SU M M A R Y ......................................................................................................... 1104.6 REFEREN CES................................................................................................... 111
CHAPTER 5DYNAM IC BEHAVIOR OF A HIGH STRENGTH ROD-LIKEPOLYELECTROLYTE IN A STRONG ACID.............................................................. 114
5.1 IN TR O D U CTIO N ..............................................................................................115
v
5.2 EX PERIM ENTAL...............................................................................................1205.2.1 M A T E R IA L S...........................................................................................1205.2.2 M EA SU REM EN T.................................................................................. 121
5.3 R E S U L T S .............................................................................................................1225.3.1 SIGNAL CO N SID ERA TIO N .............................................................. 1225.3.2 SIMPLE AN A LY SIS..............................................................................128
5.3.2.1 POLARIZED M EA SU REM EN TS............................................ 1285.3.2.2 DEPOLARIZED M EA SU REM EN TS...................................... 1345.3.2.3 ANGULAR D EPEN D EN C E.......................................................134
5.3.3 CONTIN ANALYSIS W ITH M ULTIPLE R U N S........................ 1415.3.4 D ISCU SSIO N ...........................................................................................150
5.4 SU M M A R Y ......................................................................................................... 1535.5 R EFEREN CES.....................................................................................................154
CHAPTER 6
C O N C LU SIO N S.................................................................................................................... 156
APPENDIX A .......................................................................................................................... 159THE BEHAVIOR OF M AGNETIC LATEX PARTICLES IN CHEM ICALLYCROSS-LINKED G E L S....................................................................................................... 159
A .l IN TR O D U C TIO N ..............................................................................................160A. 2 EX PERIM EN TA L............................................................................................. 162
A.2.1 LATEX PA RTICLES............................................................................ 162A.2.2 SILICA G E L ............................................................................................ 163A.2.3 ACRYLAM IDE G EL............................................................................ 164A.2.4 M EA SU R EM EN T................................................................................. 164
A.3 RESULTS AND D ISC U SSIO N ..................................................................... 165A.3.1 ORDINARY LATEX PARTICLES IN SILICA G EL...................165A.3.2 M AGNETIC LATEX PARTICLES IN SILICA G E L ..................171A.3.3 M AGNETIC LATEX PARTICLES IN PAA G E L ...................... 171
A.3.3.1 TRANSLATIONAL D IFFU SIO N ............................................ 171A.3.3.2 ROTATIONAL D IFFU SIO N .....................................................176
A.4 SUM M ARY......................................................................................................... 176A. 5 R E FER E N C E S....................................................................................................179
APPENDIX B : UNITS FO R M AGNETIC PR O PER TIES.........................................181
APPENDIX C: COPYRIGHT PERM ISSIO N............................................................... 183
VITA 185
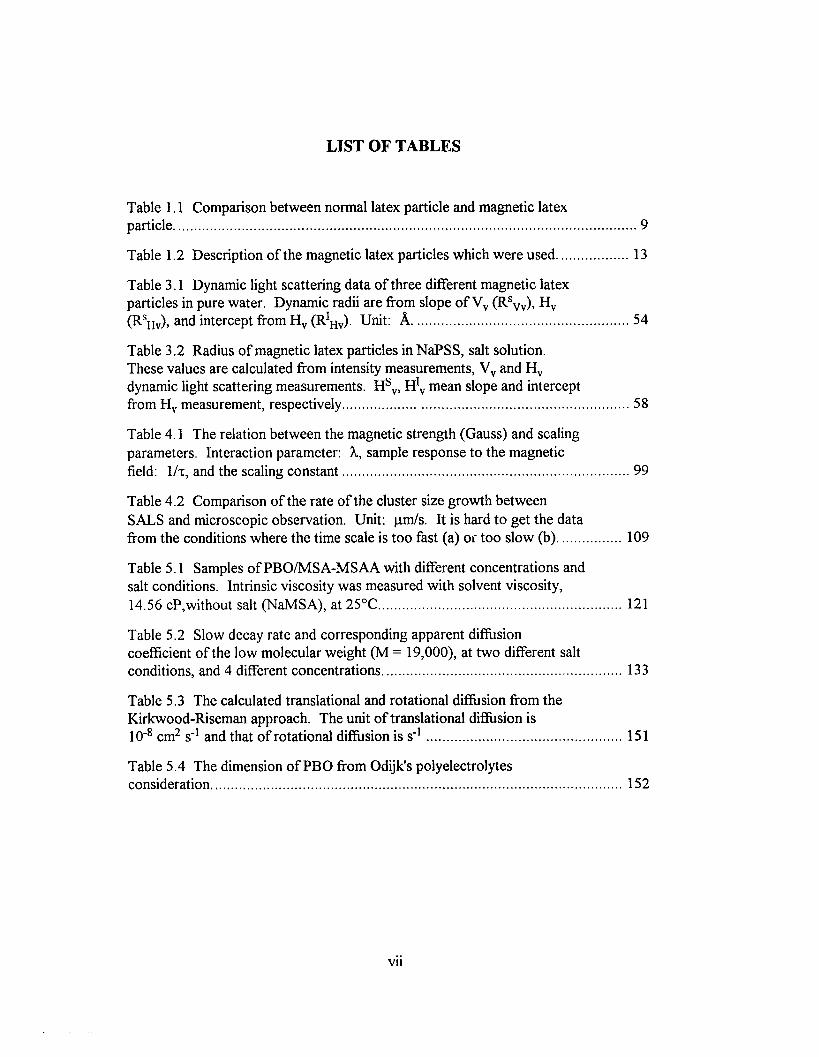
LIST OF TABLES
Table 1.1 Comparison between normal latex particle and magnetic latexparticle............................................................................................................................................ 9
Table 1.2 Description o f the magnetic latex particles which were used........................ 13
Table 3.1 Dynamic light scattering data o f three different magnetic latexparticles in pure water. Dynamic radii are from slope o f Vv (Rsw)> H v(RsHv), and intercept from H v (R1̂ ) . Unit: A...................................................................54
Table 3.2 Radius o f magnetic latex particles in NaPSS, salt solution.These values are calculated ffom intensity measurements, Vv and H vdynamic light scattering measurements. H sv, H!v mean slope and interceptfrom H v measurement, respectively....................................................................................... 58
Table 4.1 The relation between the magnetic strength (Gauss) and scalingparameters. Interaction parameter: X, sample response to the magneticfield: 1/t, and the scaling constan t....................................................................................... 99
Table 4.2 Comparison o f the rate o f the cluster size growth betweenSALS and microscopic observation. Unit: pm/s. It is hard to get the dataffom the conditions where the time scale is too fast (a) or too slow (b).....................109
Table 5.1 Samples o f PBO/M SA-M SAA with different concentrations and salt conditions. Intrinsic viscosity was measured with solvent viscosity,14.56 cP,without salt (NaMSA), at 25°C.......................................................................... 121
Table 5.2 Slow decay rate and corresponding apparent diffusion coefficient o f the low molecular weight (M = 19,000), at two different salt conditions, and 4 different concentrations......................................................................... 133
Table 5.3 The calculated translational and rotational diffusion ffom theKirkwood-Riseman approach. The unit o f translational diffusion is1 0 ' 8 cm2 s" 1 and that o f rotational diffusion is s" 1 ...........................................................151
Table 5.4 The dimension o f PBO ffom Odijk’s polyelectrolytesconsideration............................................................................................................................. 152
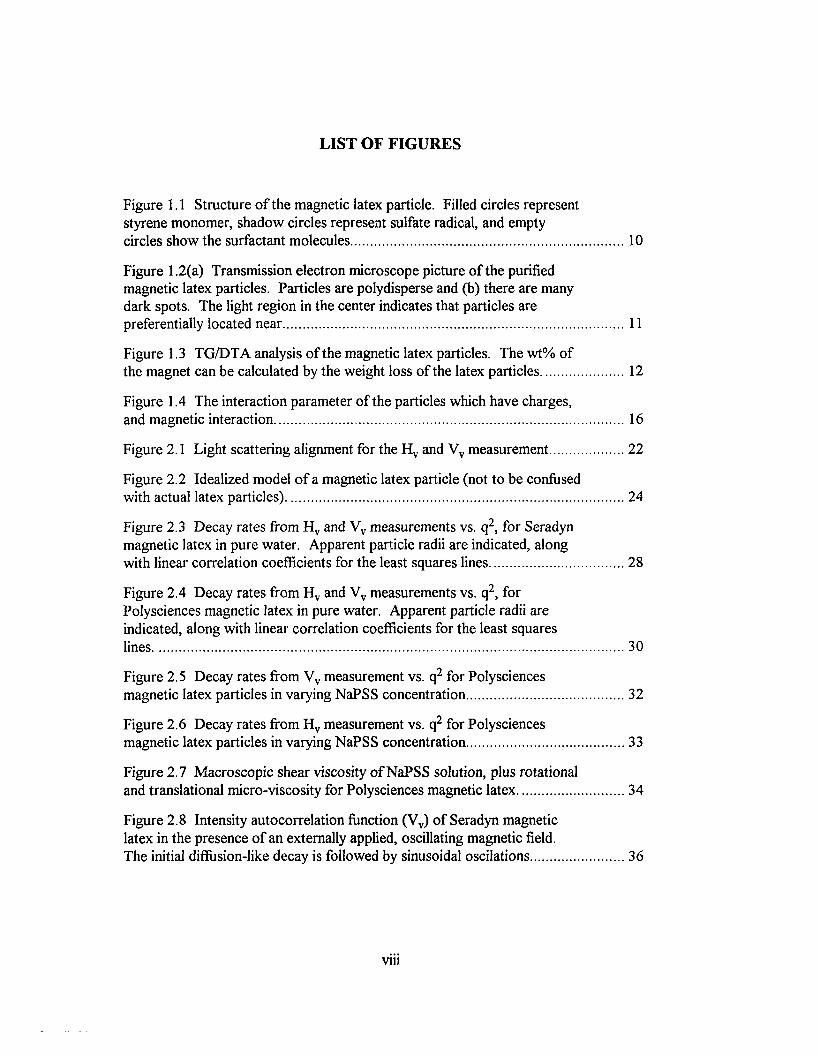
LIST OF FIGURES
Figure 1.1 Structure o f the magnetic latex particle. Filled circles representstyrene monomer, shadow circles represent sulfate radical, and emptycircles show the surfactant molecules................................................................................... 1 0
Figure 1.2(a) Transmission electron microscope picture o f the purified magnetic latex particles. Particles are polydisperse and (b) there are many dark spots. The light region in the center indicates that particles are preferentially located near........................................................................................................1 1
Figure 1.3 TG/DTA analysis o f the magnetic latex particles. The wt% o fthe magnet can be calculated by the weight loss o f the latex particles.......................... 1 2
Figure 1.4 The interaction parameter o f the particles which have charges,and magnetic interaction...........................................................................................................16
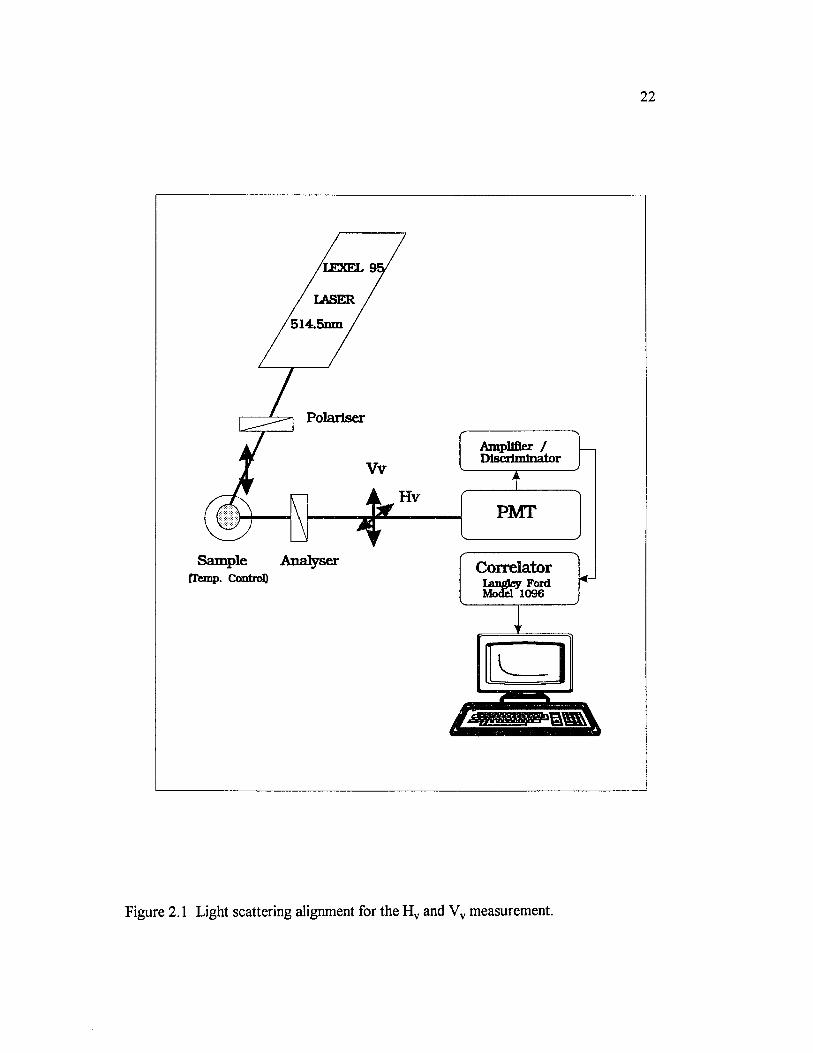
Figure 2.1 Light scattering alignment for the H v and Vv measurement....................... 22
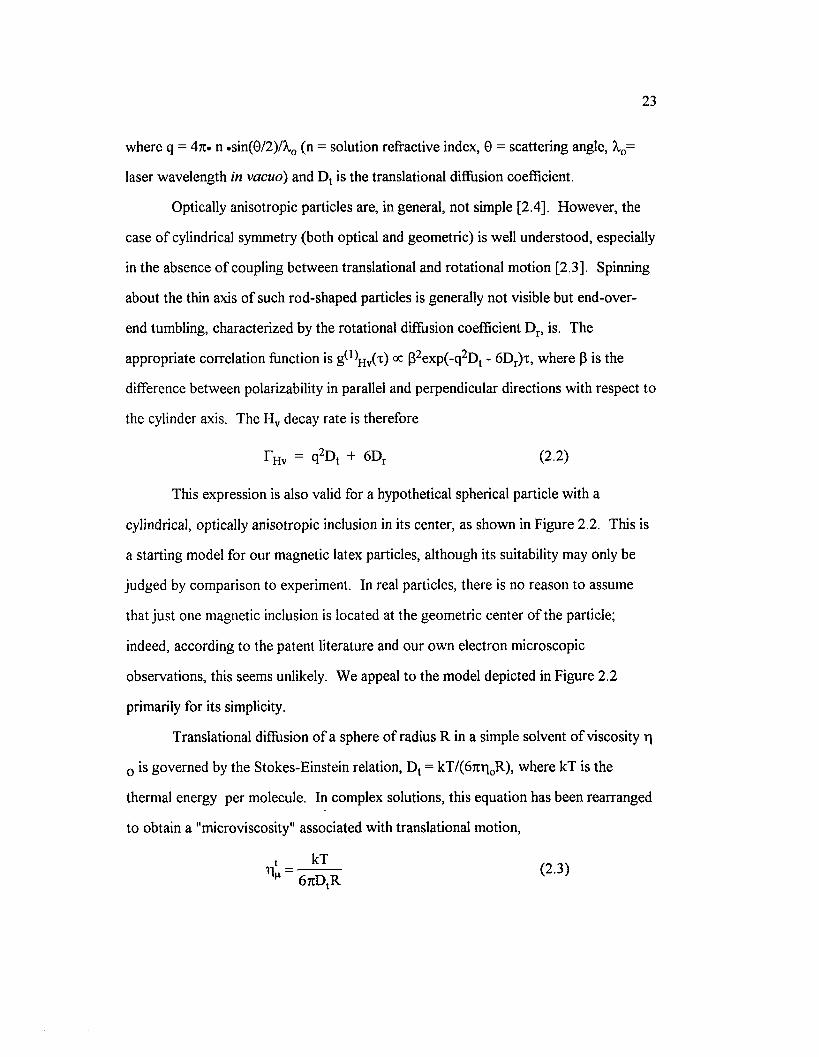
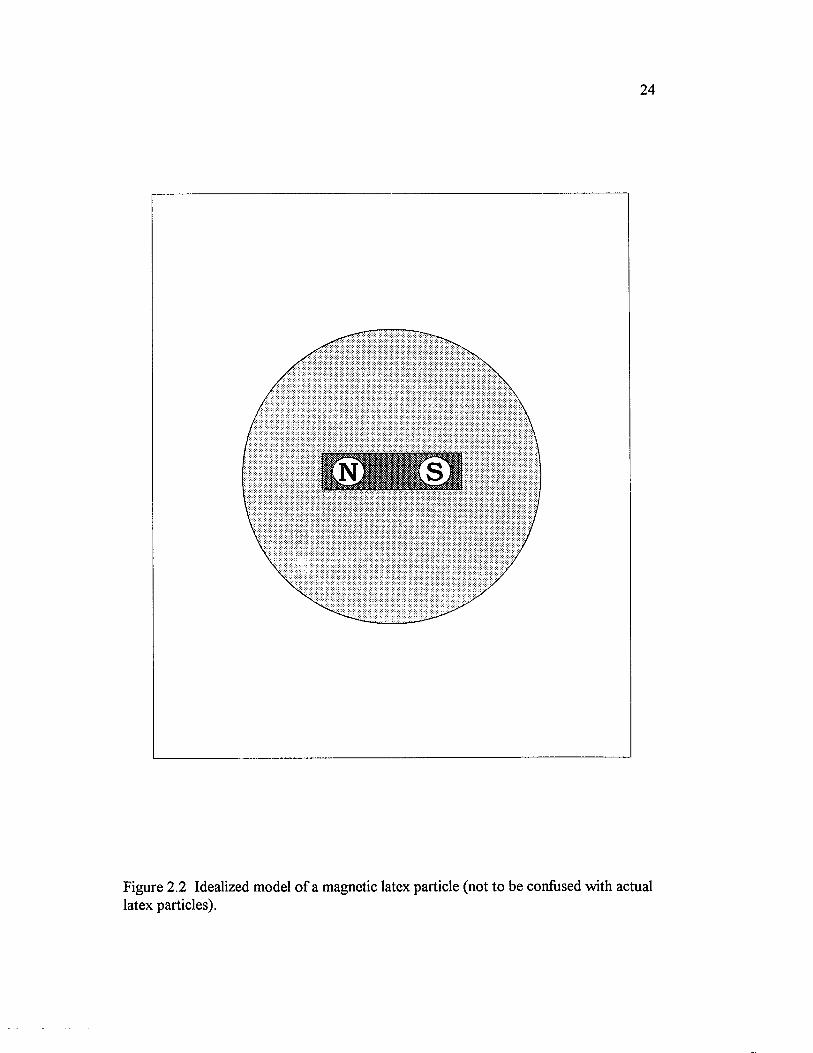
Figure 2.2 Idealized model o f a magnetic latex particle (not to be confusedwith actual latex particles).......................................................................................................24
Figure 2.3 Decay rates ffom H v and Vv measurements vs. q2, for Seradynmagnetic latex in pure water. Apparent particle radii are indicated, alongwith linear correlation coefficients for the least squares lines......................................... 28
Figure 2.4 Decay rates ffom H v and Vv measurements vs. q2, forPolysciences magnetic latex in pure water. Apparent particle radii areindicated, along with linear correlation coefficients for the least squareslines...............................................................................................................................................30
Figure 2.5 Decay rates ffom Vv measurement vs. q2 for Polysciencesmagnetic latex particles in varying NaPSS concentration................................................ 32
Figure 2.6 Decay rates ffom H v measurement vs. q2 for Polysciencesmagnetic latex particles in varying NaPSS concentration................................................ 33
Figure 2.7 M acroscopic shear viscosity o f NaPSS solution, plus rotationaland translational micro-viscosity for Polysciences magnetic latex................................. 34
Figure 2.8 Intensity autocorrelation function (Vv) o f Seradyn magnetic latex in the presence o f an externally applied, oscillating magnetic field.The initial diffusion-like decay is followed by sinusoidal oscilations............................. 36
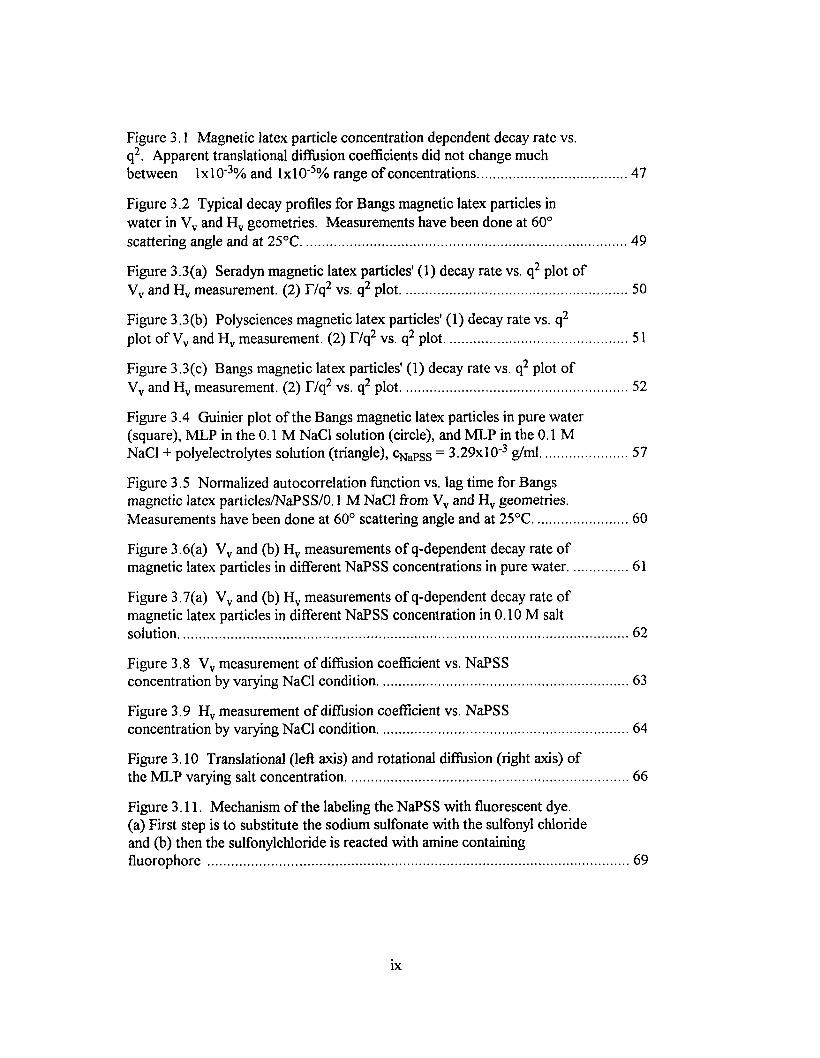
Figure 3.1 Magnetic latex particle concentration dependent decay rate vs.q2. Apparent translational diffusion coefficients did not change muchbetween lx lO '3% and lxlO"5% range o f concentrations..............................................47
Figure 3.2 Typical decay profiles for Bangs magnetic latex particles in w ater in V v and H v geometries. M easurements have been done at 60° scattering angle and at 25°C................................................................................................... 49
Figure 3.3(a) Seradyn magnetic latex particles' (1) decay rate vs. q2 plot o fVv and H v measurement. (2) T/q 2 vs. q2 plot......................................................................50
Figure 3.3(b) Polysciences magnetic latex particles' (1) decay rate vs. q2
plot o f Vv and H v measurement. (2) T/q2 vs. q2 p lo t........................................................ 51
Figure 3.3(c) Bangs magnetic latex particles' (1) decay rate vs. q2 plot o fVv and H v measurement. (2) T/q2 vs. q2 plot......................................................................52
Figure 3.4 Guinier plot o f the Bangs magnetic latex particles in pure water(square), MLP in the 0.1 M NaCl solution (circle), and M LP in the 0.1 MNaCl + polyelectrolytes solution (triangle), cNaPSS = 3 .29x l0 ‘3 g/ml............................57
Figure 3.5 Normalized autocorrelation function vs. lag time for Bangs magnetic latex particles/NaPSS/0.1 M NaCl ffom Vv and Hv geometries. M easurements have been done at 60° scattering angle and at 25°C..............................60
Figure 3.6(a) Vv and (b) H v measurements o f q-dependent decay rate o f magnetic latex particles in different NaPSS concentrations in pure w ater.....................61
Figure 3.7(a) Vv and (b) H v measurements o f q-dependent decay rate o fmagnetic latex particles in different NaPSS concentration in 0.10 M saltsolution........................................................................................................................................ 62
Figure 3.8 Vv measurement o f diffusion coefficient vs. NaPSSconcentration by varying NaCl condition.............................................................................63
Figure 3.9 H v measurement o f diffusion coefficient vs. NaPSSconcentration by varying NaCl condition.............................................................................64
Figure 3.10 Translational (left axis) and rotational diffusion (right axis) o fthe M LP varying salt concentration...................................................................................... 6 6
Figure 3.11. Mechanism o f the labeling the NaPSS with fluorescent dye.(a) First step is to substitute the sodium sulfonate with the sulfonyl chlorideand (b) then the sulfonylchloride is reacted with amine containingfluorophore ............................................................................................................................... 69
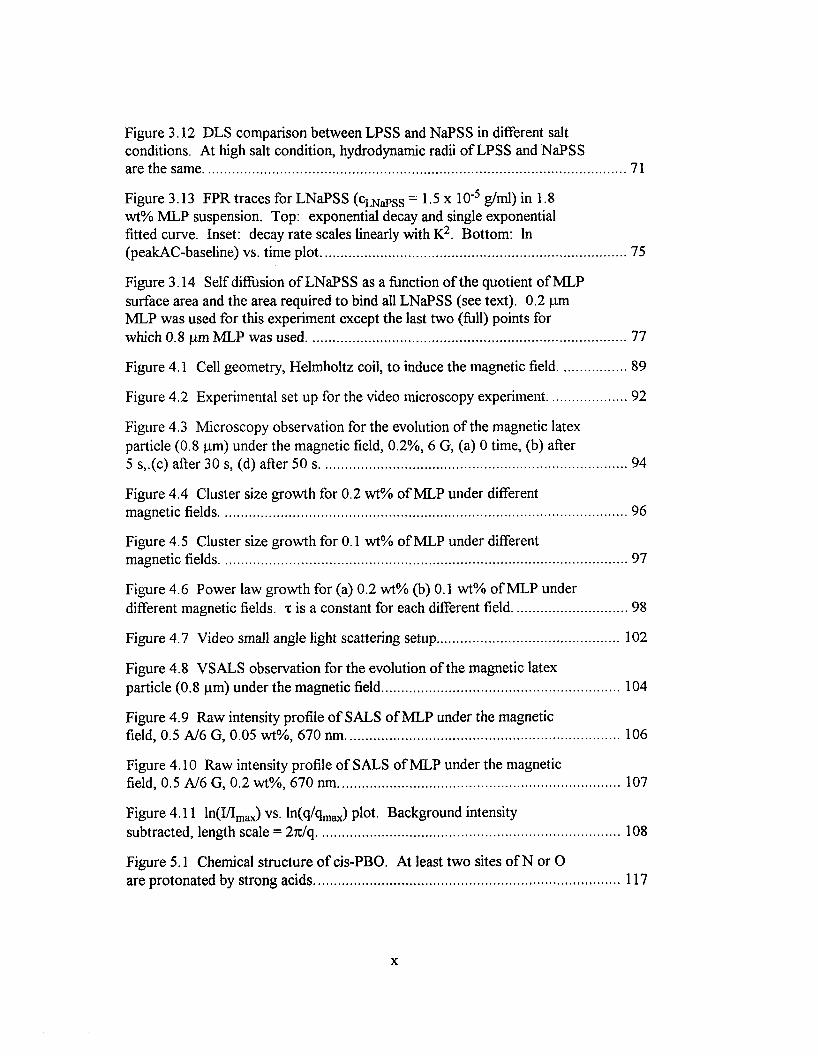
Figure 3.12 DLS comparison between LPSS and NaPSS in different saltconditions. At high salt condition, hydrodynamic radii o f LPSS and NaPSSare the same................................................................................................................................ 71
Figure3.13 FPR traces for LNaPSS (cLNaPSS = 1 .5x 10‘ 5 g/ml) in 1.8wt% M LP suspension. Top: exponential decay and single exponentialfitted curve. Inset: decay rate scales linearly with K2. Bottom: In(peakAC-baseline) vs. time p lot............................................................................................. 75
Figure 3.14 Self diffusion o f LNaPSS as a function o f the quotient o f MLPsurface area and the area required to bind all LNaPSS (see text). 0.2 pmM LP was used for this experiment except the last two (full) points forwhich 0.8 pm M LP was used..................................................................................................77
Figure 4.1 Cell geometry, Helmholtz coil, to induce the magnetic field...................... 89
Figure 4.2 Experimental set up for the video microscopy experiment......................... 92
Figure 4.3 M icroscopy observation for the evolution o f the magnetic latex particle (0.8 pm) under the magnetic field, 0.2%, 6 G, (a) 0 time, (b) after 5 s,.(c) after 30 s, (d) after 50 s..............................................................................................94
Figure 4.4 Cluster size growth for 0.2 wt% o f MLP under differentmagnetic fields............................................................................................................................96
Figure 4.5 Cluster size growth for 0.1 wt% o f MLP under differentmagnetic fields............................................................................................................................97
Figure 4.6 Pow er law grow th for (a) 0.2 w t% (b) 0.1 w t% o f MLP under different magnetic fields, x is a constant for each different field....................................98
Figure 4.7 Video small angle light scattering setup........................................................ 102
Figure 4.8 VSALS observation for the evolution o f the magnetic latexparticle (0.8 pm) under the magnetic field......................................................................... 104
Figure 4.9 Raw intensity profile o f SALS o f MLP under the magneticfield, 0.5 A/ 6 G, 0.05 wt% , 670 nm.................................................................................... 106
Figure 4.10 Raw intensity profile o f SALS o f MLP under the magneticfield, 0.5 A / 6 G, 0.2 wt% , 670 nm...................................................................................... 107
Figure 4.11 ln(I/Imax) vs. ln(q/qmax) plot. Background intensitysubtracted, length scale = 27t/q.............................................................................................108
Figure 5.1 Chemical structure o f cis-PBO. At least tw o sites o f N or Oare protonated by strong acids..............................................................................................117
x
Figure 5.2 Intrinsic viscosity o f PBO/M SA-M SAA as a function o f salt.D ata file is provided by Dr. D. B. Roitman at Dow's Walnut Creek group in California...............................................................................................................................118
Figure 5.3 Data handling with single short run and multiple runs. Single run has high frequency noise at short lag time, but multiple runs have quiet enough to measure a very rapid decay. Data was analyzed by the in house developed program ALVAN................................................................................................ 123
Figure 5.4(a) Correlation function for PBO/M SA-M SAA solution: M =19,000; Cone. = 4 x l0 ‘ 3 g/ml; cs = 0.4 M; Vv measurement; 90° scatteringangle; 488 nm wavelength; 800/200 pin-hole setting; 300 s acquisition timesingle run; 25°C. (b) corresponding semilog representation.........................................125
Figure 5.4(c) Correlation function with strongly scattered latex, 0.087 pm, solution under the same pin-hole setting (800/200), X0 = 488 nm. (d) corresponding semilog representation................................................................................ 126
Figure 5.5(a) Correlation function for low salt condition o f PBO/MSA- M SAA solution: M = 19,000; Cone. = 4 x l0 " 3 g/ml; cs = 0 M; Vv measurement; 90° scattering angle; 488 nm wavelength; 800/200 pin-hole settings; 1,000 s acquisition time single run; 25°C....... 127
Figure 5.6(a) Correlation functions for high molecular weight PBO/MSA- M SAA solution and their salt dependence: M = 78,000; Cone. = 4x10" 3
g/ml; Vv measurement; 90° scattering angle; 632.8 nm wavelength;1,000/100 pin-hole settings; 1500 s acquisition............................................................... 129
Figure 5.6(b) Corresponding semilog plot o f Figure 5.6(a) for 0.45 M salt solution, and (c) for 0 M salt solution................................................................................ 130
Figure 5.7(a) Autocorrelation functions for low molecular weight PBO/M SA-M SAA solution and their salt dependence: M = 19,000; Cone.= 4x10 ‘ 3 g/ml; Vv measurement; 90° scattering angle; 488 nm wavelength;800/200 pin-hole settings; 300 - 1,000 s ........................................................................... 131
Figure 5.7(b) Decay rate distributions corresponding to Figure 5.7(a), and amplitude x f(A ) 1 / 2 vs. decay rate plot............................................................................... 132
Figure 5.8(a) Correlation function o f depolarized measurement o f PBO/M SA-M SAA solution and their salt dependence: M = 19,000; Cone.= 4x10 ' 3 g/ml; H v measurement; 90° scattering angle; 488 nm wavelength;800/200 pin-hole settings; 1200 s acquisition tim e ......................................................... 135
Figure 5.8(b) Corresponding decay rate o f Figure 5.8(a) 136
Figure 5.9(a) Angular dependence o f the autocorrelation functions for the high molecular weight PBO/M SA-M SAA solution at high salt condition:M = 78,000; Cone. = 4 x l0 ‘ 3 g/ml; cs = 0.45 M; Vv measurement; 6
different angles; 632.8 nm w avelength.................................... 138
Figure 5.9(c) Angular dependence o f the autocorrelation functions for the high molecular weight PBO/M SA-M SAA solution at low salt condition:M = 78,000; Cone. = 4 x l0 ' 3 g/ml; cs = 0 M ; Vv measurement; 6 differentangles; 632.8 nm wavelength; 1 ,000/100........................................................................ 139
Figure 5.10 T vs. q2 plot (bottom) and T/q 2 vs. q2 plot (top) o f the thirdcumulant o f Vv autocorrelation functions. High molecular weight(78,000), high concentration 4x10 ' 3 g/ml and different salt conditions(0.01, 0.10, 0.45 M ), at 25°C............................................................................................... 140
Figure 5 .11(a) PRO CONTIN analysis o f low molecular weight PBO/M SA-M SAA solution at high salt condition: M = 19,000; Cone. =4 x l0 ' 3 g/ml; cs = 0.45 M; Vv measurement; 50° scattering angle; 514.5 nm wavelength; 600/100 pin-hole setting; 15,000 s...............................................................142
Figure 5 .11(b) PRO CONTIN analysis o f low molecular weight PBO/M SA-M SAA solution at high salt condition: M = 19,000; Cone. =4 x l0 ' 3 g/ml; cs = 0.45 M; Vv measurement; 60° scattering angle; 514.5 nm wavelength; 600/100 pin-hole setting; 15,000 s............................................................... 143
Figure 5 .11(c) PRO CONTIN analysis o f low molecular weight PBO/M SA-M SAA solution at low salt condition: M = 19,000; Cone. =4 x l0 ' 3 g/ml; cs = 0 M ; Vv measurement; 60° scattering angle; 514.5 nm wavelength; 800/200 pin-hole setting; 15,000 s acquisition..........................................144
Figure 5 .11(d) PRO CONTIN analysis o f depolarized scattering for low molecular weight PBO/M SA-M SAA solution at high salt condition: M =19,000; Cone. = 4 x l0 " 3 g/ml; cs = 0 M; H v measurement; 60° scatteringangle; 514.5 nm wavelength; 800/200 pin-hole............................................................... 145
Figure 5 .11(e) EXSAM P analysis o f low molecular weight PBO/MSA- M SAA solution at high salt condition: M = 19,000; Cone. = 4x10 ' 3 g/ml; cs = 0.45 M; Vv measurement; 60° scattering angle; 514.5 nm wavelength;600/100 pin-hole setting; 15,000 s acquisition................................................................ 146
Figure 5.12 Angular dependence o f the slow decay mode o f low molecular weight PBO/M SA-M SAA at high salt condition. M = 19,000; Cone. =4x10 ‘ 3 g/ml; cs = 0.45 M; Vv measurement; 6 different scattering angles;514.5 nm wavelength; 600/100 pin-hole settings.......................................................... 148
xii
Figure 5.13 Angular dependence o f the fast decay mode for low molecular weight PBO/MSA-MSAA. M = 19,000; Cone. = 4 x l0 ' 3 g/ml; cs = 0.45 M and 0 M; Vv and H v measurement; 4-5 different scattering angles; 514.5 nm wavelength; 600/100 pin-hole se ttings ....................................................................... 149
Figure A. 1 Diffusion coefficient change o f the silica sol-gel transition with time. Sample composition was 0.5 ml TEOS, 10 ml EtOH, catalyzed with NH 4 OH. Light scattering measurement was done at 25°C, 90° scattering angle............................................................................................................................................166
Figure A.2 Correlation function o f polystyrene latex particles, diameter =0.059 pm, in the silica gel network, compared to that in the water. Thecomposition o f the gel is 0.5 ml TEOS, 10 ml EtOH, catalyzed withNH 4 OH. M easurement was performed at 2 5 °C .............................................................168
Figure A.3 Correlation function o f the polystyrene latex particles, diameter = 0.059 pm, in different TEO S/EtO H ratio o f completed silica gel.TEO S/EtO H ratio are 0.5%, 10%, 12%, 15%, respectively......................................... 169
Figure A.4 Diffusion coefficient o f latex particles in silica gel decreasing by increasing the TEO S/EtO H molar ratio. D° = 7 .74xl0 ‘ 8 cm2/s ............................. 170
Figure A. 5 Autocorrelation function o f the magnetic latex particles during the silica sol-gel transition. There was no correlation function after 24 hours, which means the M LP are trapped in the gel. The gel condition was 0.5% T E O S ..............................................................................................................................172
Figure A . 6 The time averaged autocorrelation function from the 50 different spots o f the M LP/PAA gel system. The particles' autocorrelation function is coming from the polarized light scattering in 3 different concentration (2.5, 3.5, 4.5 w t% ) o f P A A ......................................................................174
Figure A. 7 The ensemble averaged autocorrelation function from the 50 different spots o f the M LP/PAA gel system. The particles' autocorrelation function is coming from the polarized light scattering in 3 different concentration (2.5, 3.5, 4.5 w t% )......................................................................................175
Figure A . 8 The depolarized autocorrelation function from the 50 different spots o f the M LP/PAA gel system. The particles' autocorrelation function is coming from the depolarized light scattering in 3 different concentration (2.5, 3.5, 4.5 wt% ) o f P A A .................................................................................................. 177

LIST OF SYMBOLS
a spacing between the particles
b distance between charges along the chain
B baseline o f the autocorrelation function
B magnetization
Be Bjerrum length
c D viscous drag coefficient
c concentration o f solution
Cs concentration o f salt
D app apparent diffusion coefficient
Db diffusion coefficients o f LNaPSS that are bound
Dc charge density
D° diffusion in pure solvent
D°t translational diffusion in the simple solvent
Df diffusion coefficients o f LNaPSS that are free
Dm mutual diffusion coefficient
Dp probe diffusion coefficient
Dr rotational diffusion coefficient
D s self diffusion coefficient
D s diffusion coefficient for clusters o f size s
D t translational diffusion coefficient
d particle diameter
d fringe spacing in forced Rayleigh scattering
deff effective electrostatic diameter surrounding the chain
df fractal dimension
xiv
dH electrostatic diameter o f charged rod-like polyelectrolytes
d 0 diameter o f uncharged rod
dt spacing between the tubing o f Helmholtz coil geometry
e charge o f an electron
Fm magnetic force
Fv viscous drag
f friction coefficient
fm mutual friction coefficient
ft friction factor associated with translational motion
f(A) instrumental param eter in autocorrelation function
f^A)max maximum value o f f(A)
f(q,x) dynamic structure factor
C^2\x ) intensity autocorrelation function
g(2 )(x) normalized autocorrelation function
g^)(x) normalized field autocorrelation function
H applied magnetic field
Ha Hamaker constant
H v detection o f horizontally polarized component o f scattered light withvertically polarized incident beam
I intensity o f scattered light
I ionic strength
/ electric current
IHv intensity o f H v measurement
IVv intensity o f V v measurement
K spatial frequency in fluorescence photobleaching recovery
Kp Porod constant
xv
K' bulk modulus
k Boltzmann constant
L striped pattern spacing in fluorescence photobleaching recovery
L contour length o f the polymer
M magnetization
M molecular weight
N number o f discrete time intervals in autocorrelation function
N number o f ions per cm 3
N a Avogadro's number
N (t) number o f clusters on a certain time scale
n solution refractive index
P parking area
Ps polymer bulk density
Q persistence length o f the polyelectrolytes
q scattering vector
R radius o f the particle
Rb radius o f gyration
R l Hv radius which is from intercept o fI7 q 2 plot with H v geometry
R s h v radius which is from slope o f r/q2 plot with H v geom etiy
>>P4 radius which is from slope o f r/q2 plot with Vv geometry
h the radius o f the tubing o f Helmholtz coil geometry
S surface charge density
s cluster sizes on a certain time scale
s(t) cluster size distribution function
T temperature
% aggregation time (scale)
xvi
coarsening time (scale)
potential energy
drift velocity
attractive energy
repulsive energy
vertically polarized component o f the scattered light for a vertically polarized incident beam
mole fractions o f LNaPSS that are bound
mole fractions o f LNaPSS that are free
exponent constant
ion valency
optical anisotropy
magnetic susceptibility
dielectric constant o f the solvent
van der W aals interaction
volume fraction o f the solute
polymer volume fraction
effective solid surface fraction
decay rate
rate at which the wave amplitude o f the fundamental component decays
decay rate o f rotational motion
decay rate o f translational motion
decay rate from H v geometry
decay rate from Vv geometry
Debye screening length
viscosity o f the solution
translational microviscosity
rotational microviscosity
magnetic interaction parameter
dipole-dipole interaction
laser wavelength in vacuo
dipole moment
shear modulus
magnetic permeability o f the vacuum
osmotic pressure
angle between the incident and scattered light
time delay (lag time) in dynamic light scattering
surface potential
linear charge density
correlation length, mesh size in the gel
zeta potential
number density
critical concentration where the rods start to overlap
osmotic compressibility
xviii
LIST OF ABBREVIATIONS
AA acrylamide, CH2 =CHCONH 2
AC(t) magnitude o f the ac signal
ALV CONTIN CONTIN analysis with ALV correlator
AP ammonium persulfate, (NH 4 )2 S2 0 8
BAA N, N,-methylene bisacrylamide, (H 2 C=CHCONH)2 CH 2
CC theory Manning's counterion condensation theory
CONTIN Laplace inversion algorithms
DLA diffusion limited aggregation
DLCA diffusion limited cluster aggregation
DLS dynamic light scattering
DLVO Deijaguin, Landau, Verwey & Overbeek theory (originators o f thetheory o f colloidal stability)
ER electrorheological (fluid)
EXSAM P Laplace inversion algorithms with first order smoothing
FPR fluorescence photobleaching recovery
FRS forced Rayleigh scattering
HPC hydroxypropyl cellulose
K R Kirkwood-Riseman (approach for transport)
LP latex particle
LS light scattering
MLP magnetic latex particle
MOS metal oxide semiconductor
M SA methanesulfonic acid, CH 3 S 0 3H
M SAA methanesulfonic acid anhydride, (CH 3 S 0 2)20

NaPSS sodium poly(styrene sulfonate)
NM R nuclear magnetic resonance
PB theory Poisson-Boltzman theory
PBO poly(p-phenylene cis-benzobisoxazole)
PBT poly(p-phenylene trans-benzobisthiazole)
PEO poly(ethyleneoxide)
PFA tetrafluoroethylene-perfluoroalkylvinylether copolymer
PM M A poly(methylmethacrylate)
PRO CONTIN CONTIN analysis originated from Provencher
PTFE poly(tetrafluoroethylene)
QELS quasi elastic light scattering
RLA reaction limited aggregation
RLCA reaction limited cluster aggregation
SALS small angle light scattering
SAXS small angle X-ray scattering
SIT silicon intensified target
SLS static light scattering
TEM transmission electron microscope
TEM ED N, N, N', N'-tetramethylethylenediamine, (C H ^^N C H ^C F^N C C H ^
TEOS tetraethoxysilane, Si(OC2 H 5 ) 4
TG/DTA thermal gravimetry/differential thermal analysis
THF tetrahydrofuran, C4 H80
VSALS video small angle light scattering
ZADS zero-angle depolarized light scattering
XX
ABSTRACT
The dynamic behavior o f magnetic latex particles has been explored. Polarized
and depolarized dynamic light scattering from binary and ternary systems o f these
particles have provided rotational and translational difliision coefficients. M icroscopic
views o f rotational and translational diffusion o f these particles are compared with
macroscopic viscosity from the Stokes-Einstein equation (Chapter 2).
The polymeric stabilization o f magnetic latex particles has also been
investigated by static and dynamic light scattering. Using the optical anisotropy o f
magnetic latex particles, the translational and rotational diffusion coefficients o f the
particles under various salt conditions were determined. The stability o f the
superparamagnetic latex particles depends on electrostatic repulsion and van der Waals
attraction. Translational and rotational diffusion o f the magnetic latex particles
decrease abruptly in the high salt condition, but are recovered upon addition o f a
polyelectrolyte polymer. Polystyrene sulfonate sodium salt stabilizes the flocculated
particles but restricts their motion. Self diffusion studies with fluorescence
photobleaching recovery have been done with labeled NaPSS to verify that the stability
arises from a mechanism other than conventional steric stabilization (Chapter 3).
Applied magnetic fields induce the end-to-end attachment o f the magnetic latex
particles. Kinetic growth o f these particles under a magnetic field has been studied by
optical microscopy and small angle light scattering. Average cluster sizes determined
from the microscopy images and the SALS patterns have been compared (Chapter 4).
The polyelectrolyte studies were extended to a high strength rod-like
polyelectrolyte system (PBO/M SA-M SAA). Slow polymer chain diffusion and very
rapidly decaying intensity autocorrelation functions were measured by depolarized and
polarized light scattering data (Chapter 5).
xxi
The dynamics o f trapped magnetic latex particles in porous silica gel and
acrylamide gel depend on the gel structure and its viscoelastic properties. The
translational and rotational diffusion o f the magnetic latex particles and the ordinary
latex particles inside the gel netw ork have been investigated preliminarily with dynamic
light scattering (Appendix A).
CHAPTER 1
INTRODUCTION
1

2
1.1 PROBE DIFFUSION STUDIES
1.1.1 GENERAL CONCEPTS
Probe diflusion means tracing probe molecules, normally in ternary (probe:
polymer matrix: solvent) systems. These studies produce much information about
configurational and conformational structures o f the diffusing polymers, their dynamics,
and the structure or morphology o f the matrix polymers. From the experimental point
o f view, probe molecules should have dominant scattered intensity compared to the
matrix polymer, or selective optical signal compared to the background molecules.
M any different probes and matrix polymers have been used. Polymer latex particles
[1.1], proteins [1.2], poly(tetrafluoroethylene) copolymer [1.3], and labeled molecules
[1.4] are reported as probes. Hydroxypropyl cellulose [1.5], poly(methylmethacrylate)
[1.6], poly(ethyleneoxide) [1.7], bovine serum albumin [1.8], dextran [1.9], and even
acrylamide gel are used as matrix polymers.
The probe diffusion coefficient, Dp> is a dynamic parameter o f probe molecules
in a solvent or through a matrix. There are tw o different diffusion coefficients. One,
which is called the mutual or cooperative diffusion coefficient, Dm, is based on the
concentration gradient and is usually measured by dynamic light scattering (DLS). The
self diffusion coefficient, Ds, reflects the random diffusion o f individual molecules in the
absence o f any gradient. Optical tracer methods such as forced Rayleigh scattering
(FRS) [ 1.10] or fluorescence photobleaching recovery (FPR) [ 1.11 ] are used for these
studies. Pulsed-field-gradient NM R [1.12] is another technique to determine the self
diffusion o f the molecule.
The mutual diffusion coefficient, Dm, is the hydrodynamic and thermodynamic
response o f a collection o f macromolecules to a concentration gradient, and is given by
( 1.1)
The osmotic compressibility, (—) , is the driving force for the polymer motion, fm is' dc* p j
the mutual friction coefficient, and <j> is the volume fraction o f the solute.
Hydrodynamic friction opposes the thermodynamic concentration gradient. At low
concentration this equation simplifies to the Einstein form D° = kT/f. Many
experimental results show the scaling relations between the probe diffusion coefficient,
Dm or Ds, and the diffusion coefficient at c = 0, D°. Some important results are
summarized in the following.
Mutual diffusion in binary solution f 1.131
D m = D 0(l + a J ) ) (1.2)
C V * 1.45
Self diffusion in binary solution \ 1 .141
D s = D0(l + a s<j>) (1.3)
a s « -1 .8 3
Probe diffusion in ternary system [1 .151
D p = D 0 e x p ( - a c v) (1.4)
v = 0.5 to 1.0
a ^ M 1, R 8 y: 0 .8-1.0,5: 0.0+0.2 (for large probes)
where o ^ , a s, v, y, and 5 are a constant, M is the molecular weight, and R is the radius
o f the polymer.
When matrix systems consist o f polyelectrolytes or polymer gel networks, the
probe diffusion studies are more complicated, and one should consider the stabilization
o f the probe molecules, charge interaction, viscoelastic modulus o f the gel network,
etc. A preliminary study o f particle motion in a gel [1.16] showed the following scaling
equation,

D p » e x p (-a R s) (1.5)
5 = 0.5 - 2 .0
1.1.2 TECHNIQUE FOR PROBE DIFFUSION STUDIES
M utual diffusion is commonly measured by dynamic light scattering. Brownian
motions o f polymer molecules cause phase and polarization changes o f scattered light,
and the scattered intensity will fluctuate with time, typically on a ps to ms time scale.
This intensity fluctuation gives information on the dynamic motions o f the molecules.
The intensity autocorrelation function, which describes how an intensity fluctuation
relaxes back to average intensity, is
G (2 )(x) = ( l( t) I ( t + x)}
= ^ : Z I ( t i)I(ti + x ) ( 1 .6 )N i=l
where N is the number o f samples (number o f discrete time intervals) and t is the time
delay or "lag time." At zero time delay, G ^ (x ) is the mean square intensity <I2 (t)>,
and at large time delay
lim ( l( t) I ( t + x)) = ( l ( t ) ) 2 (1.7)I - > o O
G ^ (x ) is maximal at x = 0 and decays toward large x. The normalized form o f the
Equation 1.6 is
The decay o f the autocorrelation function is related to the diffusion coefficient; further
relationships will be developed in Chapter 2.
Typical techniques to measure self diffusion are forced Rayleigh scattering
(FRS) and fluorescence photobleaching recovery (FPR). Both techniques usually need
labeled molecules such as photochromic or photobleachable polymers to trace the
diffusion o f the polymers. These labeled polymers are photoexcited by illuminating
samples with fringe patterns. In case o f FRS [1.17], these fringe patterns are made by
5
the interference o f tw o laser beams, which is produced by splitting the laser beam,
recombining, and varying the angle between the tw o beams, and by a Ronchi ruling
(coarse diffraction grating) in FPR. The periodic distribution o f bleached molecules
decays with time, and the relaxation time is given by
x = - ^ ~ : FRS (1.9a)4tc2 Ds
d. fringe spacing,
D s: self diffusion
IJx = —-5— : FPR (1.9b)
4ft DsL: striped pattern spacing
Other methods have been introduced for the self-diffusion studies such as spin
echo N M R [1.18], and electric field light scattering [1.19].
1.2 CHARGED INTERACTION
1.2.1 COLLOID
The stability o f the charged particles was first studied by two different groups in
1950's, Deijaguin and Landau o f the Soviet Union, and Verwey and Overbeek o f the
Netherlands. Their combined theory suggested that the stability o f colloid particles
depends on the balance between van der W aals attraction (VA) and electric repulsion
energies (VR).
The van der Waals repulsion between the colloidal particles is similar to a
London treatment o f the atoms. It was developed by Ham aker and the attraction
energy is given by
v * = i S ? ( U 0 )
where is the effective Hamaker constant and h is the distance between the particles.
The magnitude o f VA is o f order kT for the latex particles.
6
The electric repulsion energy between the charged sphere with radius R is
where e is the dielectric constant o f the solvent, vj/ 0 is the surface potential which is
normally substituted by the £ potential in aqueous systems. The actual potential
measured by electrophoretic mobility, and is proportional to the C, potential, C, =
(4 7 it i / e ) u where e is the dielectric constant and u is electrophoretic mobility (~ 10- 4
cm 2 /v.s) [1.20], The thickness o f the double layer, or Debye length, is
where N is number o f ions per cm3, z is the ion valence, and e is the electrostatic
charge.
1.2.2 POLYELECTROLYTES
The theory o f colloid stability is based on the sphere or plate model. However,
the charged interactions among real polymers are more complicated. One m odem
theory o f polyelectrolyte solutions is based on the model o f an infinitely long cylinder
with electric charge distributed uniformly along its surface (polyion). The solution also
contains salts such as sodium and magnesium which can neutralize the polyion by
condensation onto its surface. It also has uncondensed counterions as well as co-ions.
For this system, the counterion condensation (CC) theory is developed as a simple,
analytical alternative to the Poisson-Boltzman (PB) theory. Manning [1.21] proposed
that condensation on the polyion occurs until the net linear charge density o f the
polyion is reduced below a critical value. In this case the key parameter is the linear
charge density (£,), which is
( 1.12)
ekTb( 1.13)
7
where e is the electric charge, e the bulk dielectric constant, and b is the average
spacing between charges. The theory states that if E, is less than unity, the interaction
o f small ions with the polyions may be treated in the Debye-Hlickel approximation. I f E,
exceeds unity, sufficiently many counter-ions will condense on the polyion to lower the
net value o f the charge-density parameter E, to unity. The electrostatic component to
the persistence length o f the polyelectrolyte based on Manning's CC theory is given by
( U 4 )
where A is the segment length o f the polymer. This is the case o f A < Be, where Be is
the minimum distance between the condensed charges, called the Bjerrum length, wliich
is obtained by setting E, = 1 in Equation 1.13 and solving for b, i. e. B e = e2 /ekT. The
general relation for the persistence length o f polyelectrolytes given by Odijk and
Fixman [1.22], is
Q = W < U 5 )e2
where Be = ------ . The dimension o f the charged polymer is calculated by theseekT
equations. The electrostatic diameter o f a charged rod-like polyelectrolyte is [1.23]
d H = d 0 + K _1 In/ 47rB.
* ' + 0.077b k
(1.16)
where d0 is the diameter o f the uncharged rod.
1.3 GENERAL CHARACTERISTICS OF MAGNETIC LATEX PARTICLES
Latexes are aqueous suspensions o f polymer particles prepared by emulsion
polymerization [1.24], Latex particles are grown by the following steps: Micelle
Formation Step, where hydrophobic and hydrophilic end groups o f emulsifier
molecules make the micelle in the aqueous phase; Swollen Micelle Structure Step,
8
where the monomer (e.g. styrene) is dispersed and dissolved within the micelle
structure; Polymer Precursor Step, where a free radical initiator makes the polymer
precursor (oligomers); Polymer Latex Step, where monomers are polymerized and
form a swollen micelle (polymer particles). The size o f these particles is 0.05 ~ 10 pm.
The extraordinarily uniform shape allows them to be used as calibrated particles, and
they have well known industrial applications such as binders in paint, adhesives, paper
coatings, etc. The surfaces o f latex particles can be covered with various chemical
groups, mainly with sulfonate and carboxylate moieties. Particle interactions depend
on van der Waals attraction and electric charged repulsion.
M agnetic m icrospheres are composite particles made o f polystyrene and finely
divided magnetic iron oxide. Ideally, the magnetic pigment is evenly distributed
throughout each particle as fine crystals o f 1 0 - 2 0 0 A in diameter. M agnetic iron oxide,
which is organically dispersible, is finely dispersed throughout a monomer phase with a
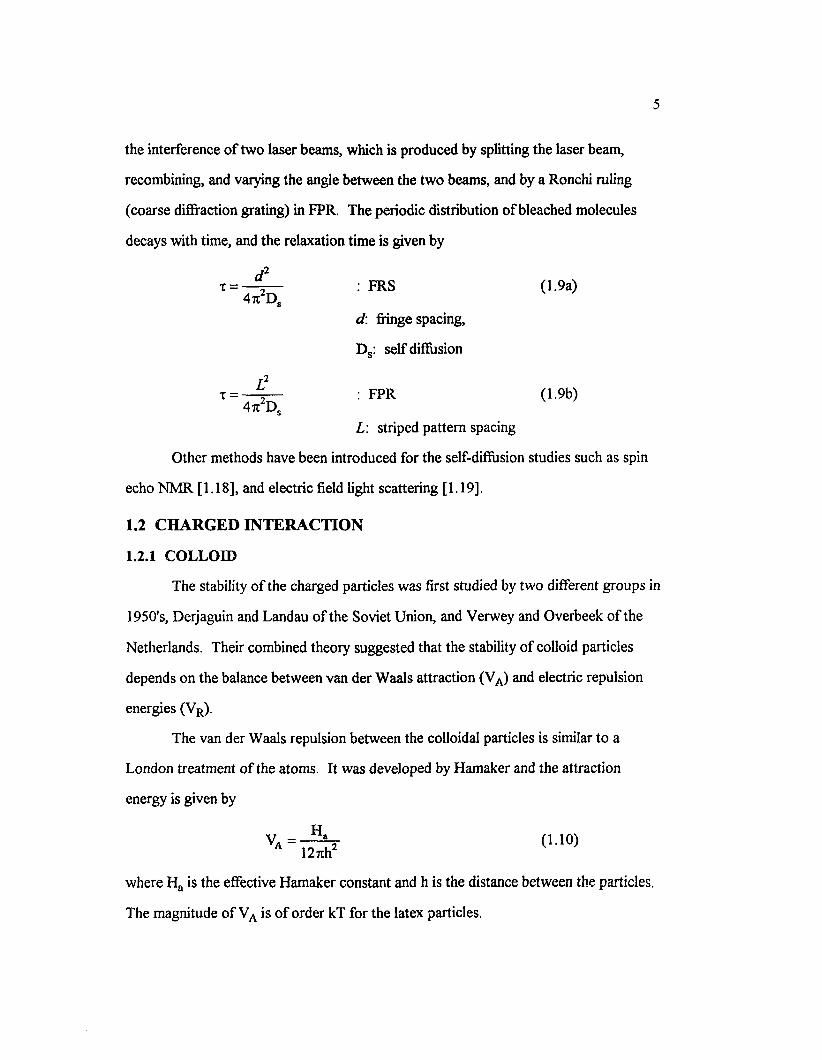
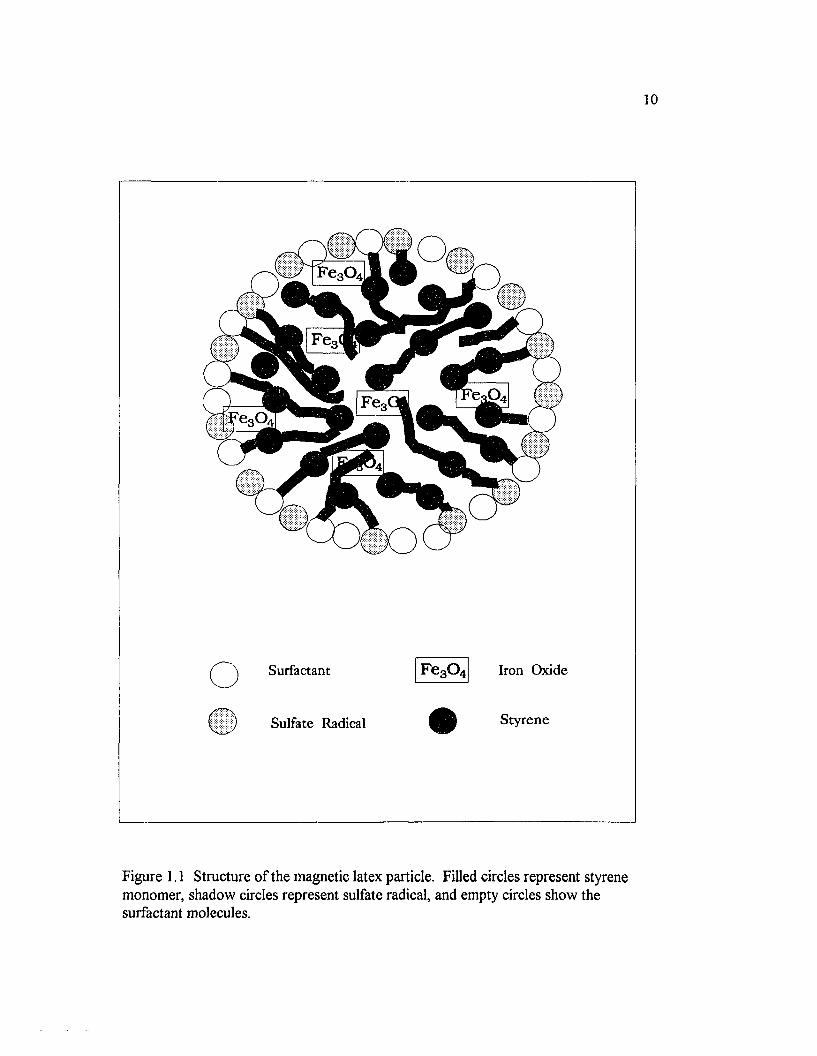
polymerization initiator added [1.25]. Figure 1.1 shows the structure o f the magnetic
latex particles, MLP. Even though the shape o f the MLP are geometrically isotropic,
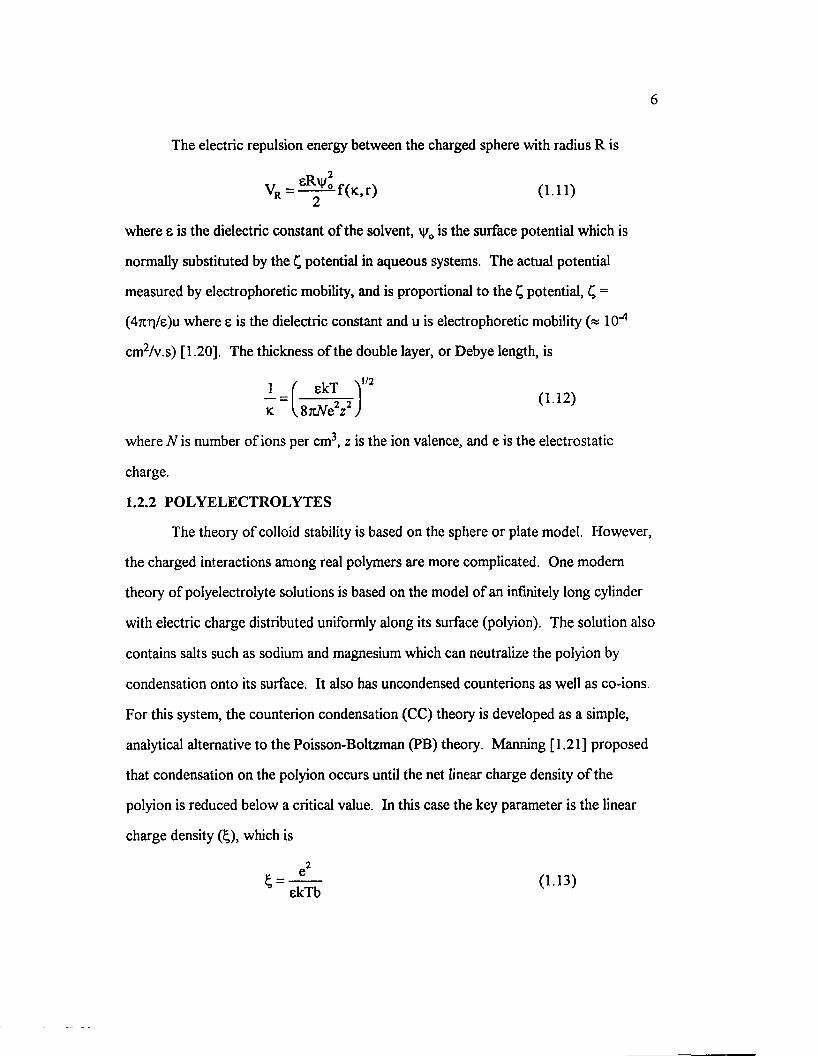
commercialized magnetic particles are not perfectly monodispersed (Figure 1.2).
M agnetite crystals imbedded in the latex structure are randomly distributed, but the
randomness o f the big particles is greater than that o f small particles. The magnetic
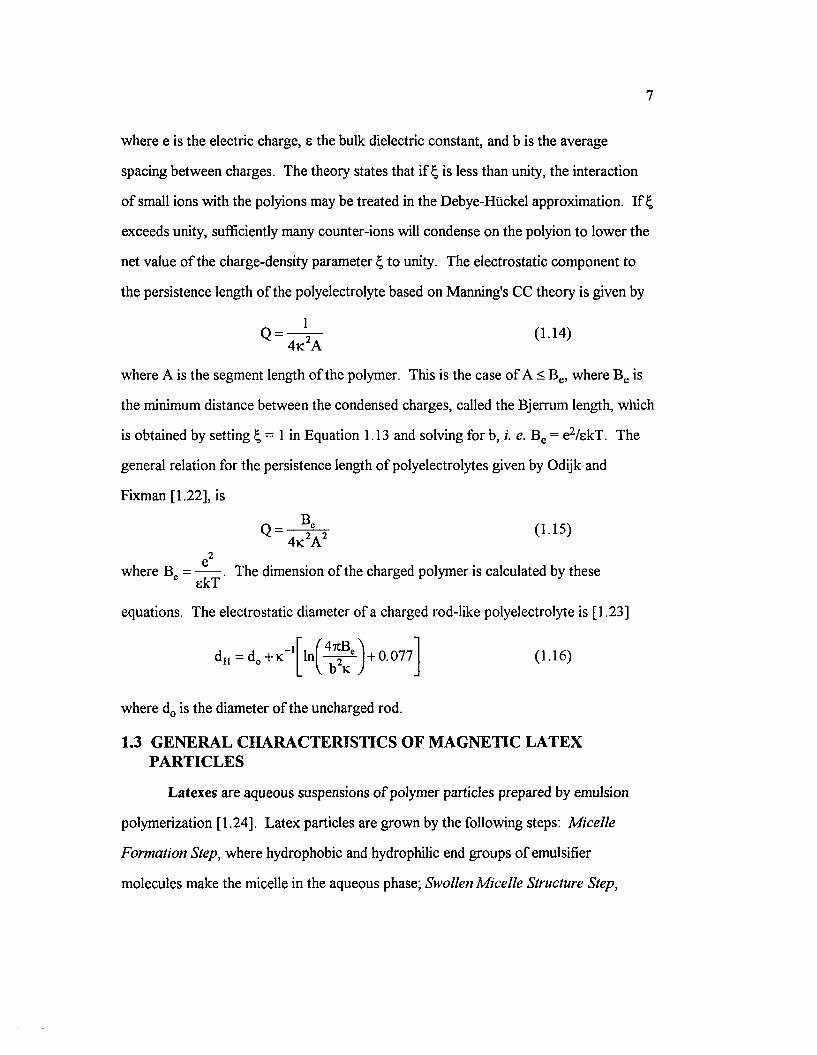
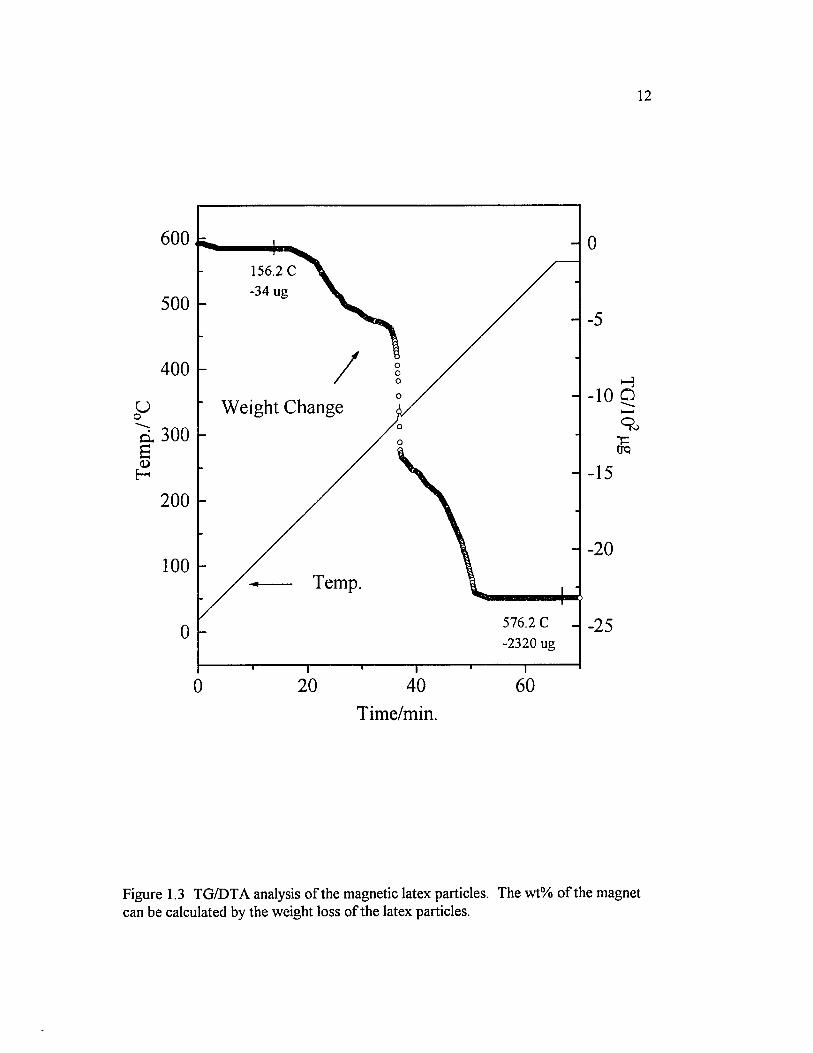
content o f the particles is determined by thermal gravimetry. After passing the
decomposition point o f polystyrene latex, only solid magnets remain on the TG/DTA
chamber, as shown in Figure 1.3. These particles exhibit superparamagnetic properties;
that is, magnetization, B, o f the particle increases with the applied magnetic field, H,
but falls back to zero if the field is removed. W hen the field is removed, the particles
demagnetize and redisperse perfectly. The superparamagnetic property o f the particles
is often used in biomedical separations. Proteins can be fixed on the surface either by
passive adsorption or, preferably, by covalent linkage. Then protein attached particles

9
are attracted by the magnetic field. Due to relative high density (1.2 -2.2 g/ml,
compared to ~ 1 . 1 g/ml for normal latex) o f the magnetic latex, the particle settles
rather quickly. The normal sedimentation velocity for 1 pm M LP is around 0.5 pm/s.
Magnetic latexes which w ere used in this experiment contain the surfactant (sodium
dodecyl sulfate at 5 g/1) to impart long-term storage stability.
Table 1.1 Comparison between normal latex particle and magnetic latex particle.
Size
(pm)
Density
(g/ml)
Surface
group
Color Uniformity Use
Latex 0 .0 2 - 1 0 0 1.05-1.5 - n h 2, - c o o h White MonodisperseCalibration
Standard
MagneticLatex
0.05-2.6 1 .5-2.0 - n h 2, - c o o h Brown Polydisperse Biomedical
Separation
1.4 PROPERTIES OF MAGNETIC LATEX PARTICLES
1.4.1 SURFACE CHARGE
The charge density o f each particle and the parking area, which is defined as the
micro particle surface area occupied by a single functional group, are useful to
determine the charged interactions o f the particle. The number o f ionized groups on
the surface can be determined by conductometric titration. Sodium hydroxide titrant is
added until an equivalence point is reached. The surface charge density and parking
area are defined as follows [1.26],
S = (1.004)DcdPs (1.17)
P = l / S (1.18)
10
Surfactant
m Sulfate Radical
F e30 4 Iron Oxide
Styrene
Figure 1.1 Structure o f the magnetic latex particle. Filled circles represent styrene monomer, shadow circles represent sulfate radical, and empty circles show the surfactant molecules.
(b)0 .2 pm
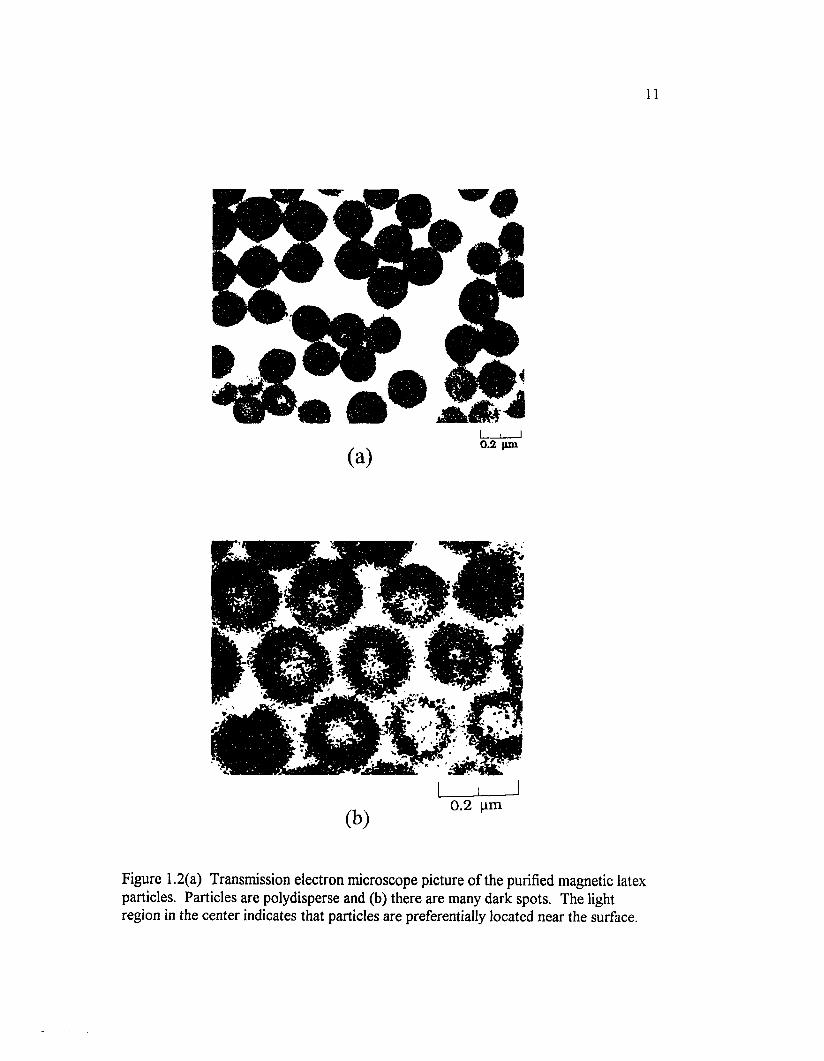
Figure 1.2(a) Transmission electron microscope picture o f the purified magnetic latex particles. Particles are polydisperse and (b) there are many dark spots. The light region in the center indicates that particles are preferentially located near the surface.
12
600
156.2 C -34 ug
500
400
-10W eight Changeuo
c i 300£<D
H
200-15
-20100
Temp.
576.2 C -2320 ug
-25
6020 400
Time/min.
Figure 1.3 TG/DTA analysis o f the magnetic latex particles. The wt% o f the magnet can be calculated by the weight loss o f the latex particles.
Sh £1
/01
13
where S is the surface charge density (charge group/A2), Dc is the charge density
(meq/gr), Ps is the polymer bulk density, d is the particle diameter, and P is the parking
area. A parking area o f 200 indicates that for every 200 A2, there is just one COOH
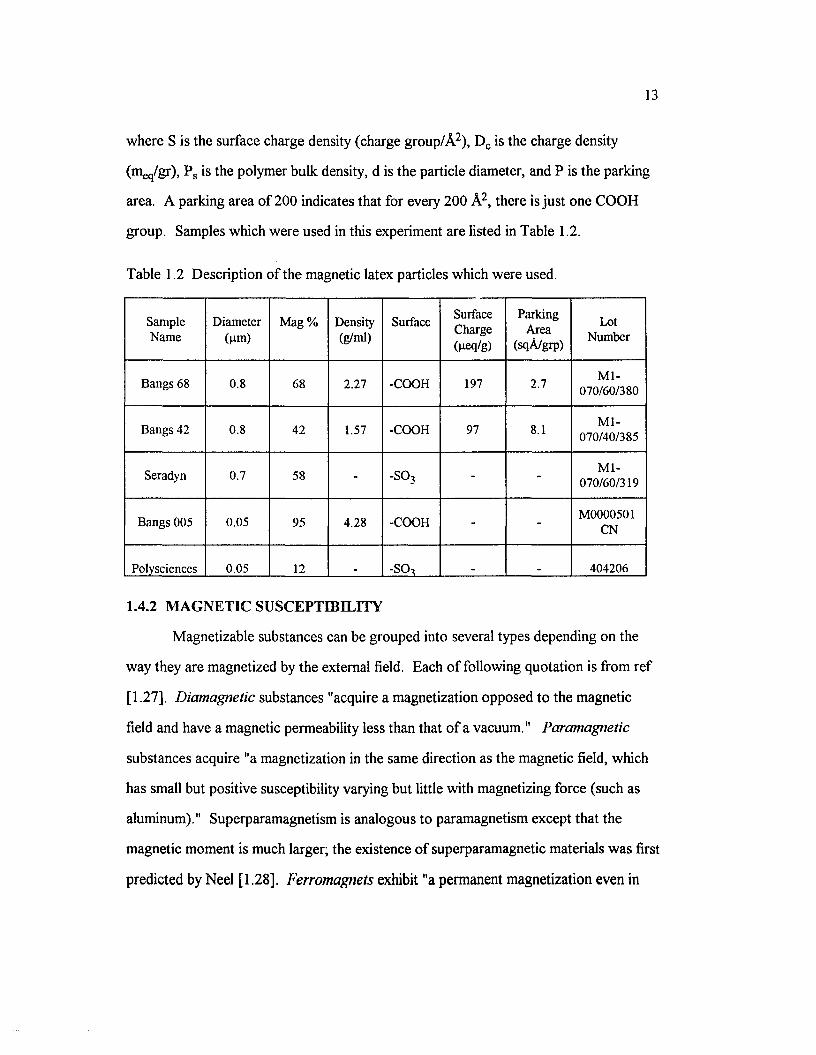
group. Samples which were used in this experiment are listed in Table 1.2.
Table 1.2 Description o f the magnetic latex particles which were used.
SampleName
Diameter(pm)
Mag % Density(g/ml)
SurfaceSurfaceCharge(lieq/g)
Parking Area
(sq A/grp)
LotNumber
Bangs 68 0.8 68 2.27 -COOH 197 2.7 M l-070/60/380
Bangs 42 0.8 42 1.57 -COOH 97 8.1 M l-070/40/385
Seradyn 0.7 58 - -S 03 - -M l-
070/60/319
Bangs 005 0.05 95 4.28 -COOH - -M0000501
CN
Polvsciences 0.05 12 -SO, . . 404206
1.4.2 MAGNETIC SUSCEPTIBILITY
Magnetizable substances can be grouped into several types depending on the
way they are magnetized by the external field. Each o f following quotation is from ref
[1.27], Diamagnetic substances "acquire a magnetization opposed to the magnetic
field and have a magnetic permeability less than that o f a vacuum." Paramagnetic
substances acquire "a magnetization in the same direction as the magnetic field, which
has small but positive susceptibility varying but little with magnetizing force (such as
aluminum)." Superparamagnetism is analogous to paramagnetism except that the
magnetic moment is much larger; the existence o f superparamagnetic materials was first
predicted by Neel [1.28]. Ferromagnets exhibit "a permanent magnetization even in
14
the absence o f an external magnetizing force." Antiferromagnets (such as manganese
monoxide) "give zero net magnetization because o f antielectronic spins and will not be
oriented by an external magnetizing field." Ferrimagnets give "net magnetization due
to atomic or ionic magnetic moments in the same direction," and acquire a resultant
moment in one direction, and a weak ferromagnetism appears [1.29].
The magnetizable particle will acquire a dipole proportional to the external field
H,
p = p 0 (^)7rR \ H (1.19)
where R is the sphere radius, % is magnetic susceptibility, and p 0 is magnetic
permeability o f the vacuum. Under low enough magnetic field, 104 A/m or less, their
magnetization is proportional to the external field M = %H. M agnetic susceptibility
describes the response o f a particle to an external magnetic field. It can be obtained by
a magnetophoresis experiment, "balancing the magnetic force Fm = p 0 |aV // with the
viscous drag
Fv = r|uC D, where ri is the viscosity o f the suspending liquid, u is the measured drift
velocity, and CD is a drag coefficient depending on the size and shape o f the particles.
[1.30]" The magnetic susceptibility o f the Bangs 6 8 sample which is the most heavily
used particle in this study is 1.66xl0 ' 2 emu/Oe cm 3
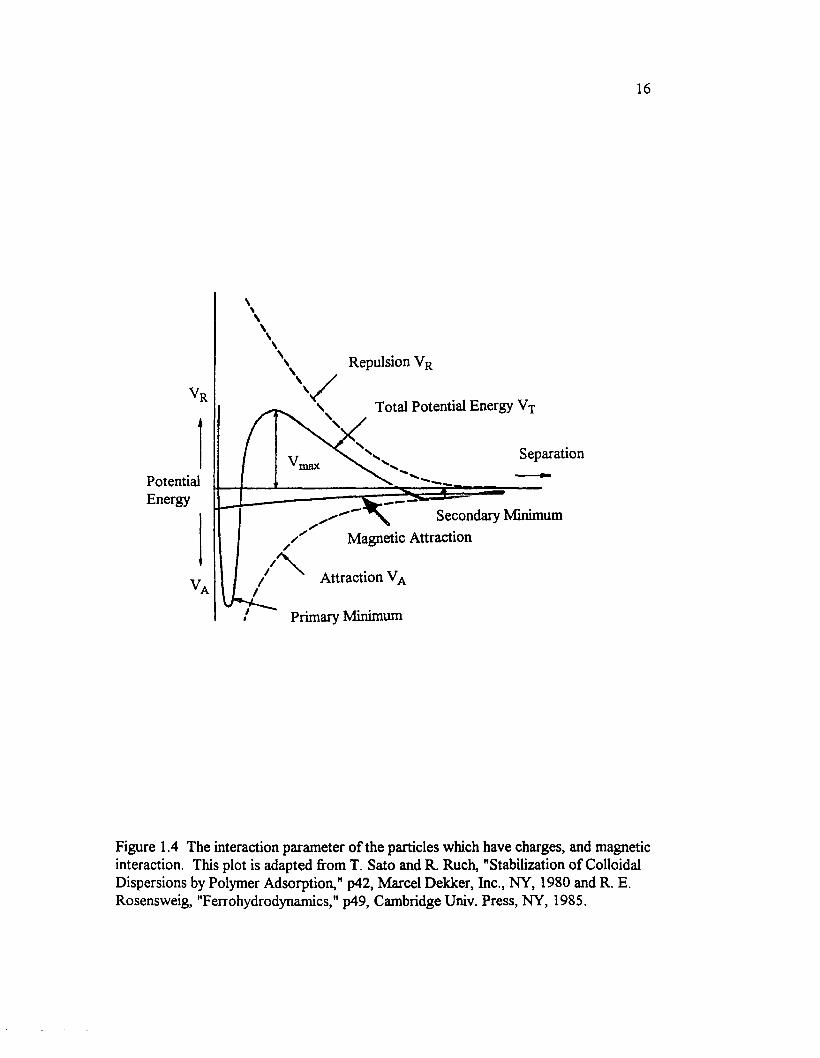
Interactions between particles are governed by magnetic interaction, van der
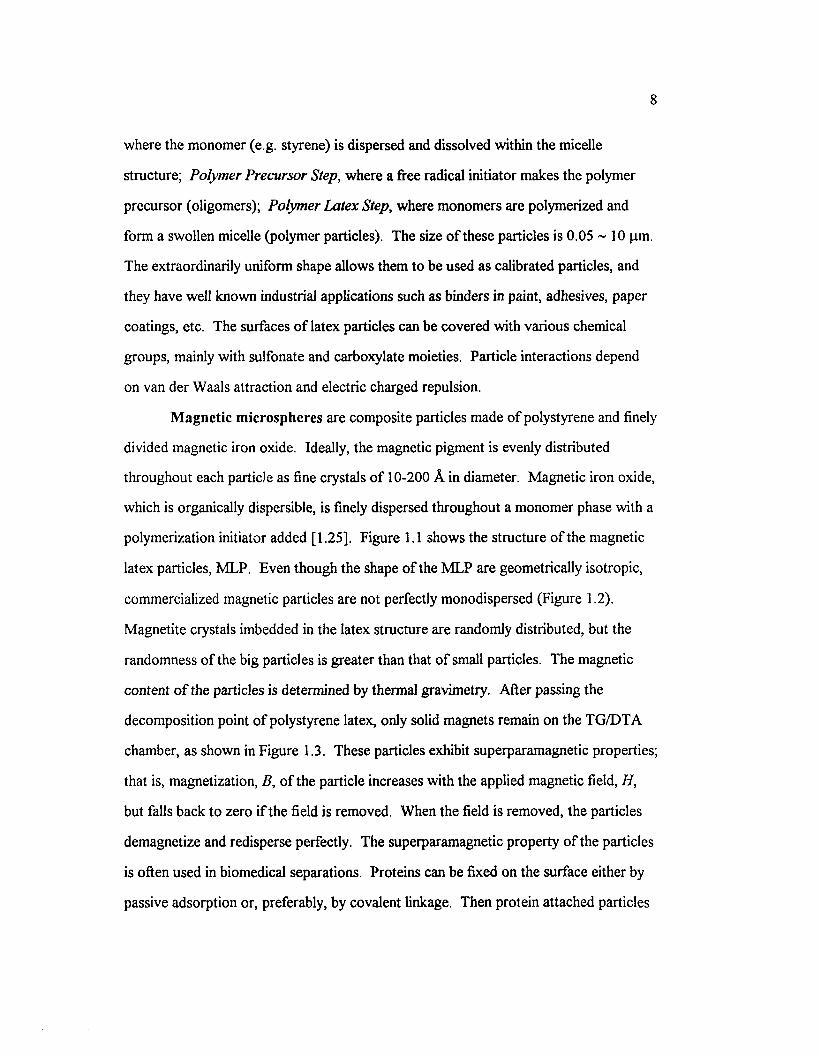
Waals attraction, electrostatic repulsion, and weak gravitational attraction. Figure 1.4
shows the potential energy versus surface-to-surface separation o f sterically protected
colloidal particles.
I.4.3 OPTICAL ANISOTROPY
Uniform latex particles are optically isotropic. However, magnetic latex
particles have a partial crystalline structure which changes the intrinsic polarizability o f
the particle and makes them optically anisotropic. The anisotropy o f the structural
15
units rotates the induced dipole moment away from the incident polarization direction
and leads to a depolarized light scattering signal. The depolarized scattered light from
the anisotropic properties is used to determine rotational motion o f the particles.
The time correlation function o f the depolarized intensity which has optical
anisotropy, p, is
G(2 )(x) = A + B|g(1)(x ) | 2 = A + B e x p [-2 (q 2 Dt + 6 D r)x)] (1.13)
where A is a constant, the constant B is proportional to P2, and Dt and Dr are the
translational and rotational contribution, respectively. For particles in the size range
considered here, the decay rate associated with rotational diffusion is normally faster
than that associated with translational diffusion, so experiments are sometimes difficult
to perform. Zero angle depolarized scattering experiment in which there is no
dependence on the translational diffusion (q2 Dt = 0), is sometimes performed to study
rotational motion [1.31]. Fabry-Perot interferometry is another choice for the fast
depolarized experiment.
Piazza et al. reported anisotropic properties o f the latex particle PFA
(tetrafluoroethylene-perfluoroalkylvinylether copolymer) which has a partially
crystalline internal structure [1.32]. His particles have electro-optical and non-linear
optical properties due to their crystallinity and optical anisotropy. Our lab has
performed the depolarized experiment with "Fluon" PTFE particles, and with magnetic
latex particles [1.33], The optical anisotropy o f the M LP is caused by the embedded
magnet crystallites. The focus o f our lab has been on simple particle sizing, while
Piazza and coworkers have been concerned with a number o f optical and physical
parameters.
16
Repulsion VR
VrTotal Potential Energy V-
Separationm ax
PotentialEnergy
Secondary Minimum
M agnetic Attraction
A ttraction V
Primary Minimum
Figure 1.4 The interaction param eter o f the particles which have charges, and magnetic interaction. This plot is adapted from T. Sato and R. Ruch, "Stabilization o f Colloidal Dispersions by Polymer Adsorption," p42, Marcel Dekker, Inc., NY, 1980 and R. E. Rosensweig, "Ferrohydrodynamics," p49, Cambridge Univ. Press, NY, 1985.
17
1.5 REFERENCES
1.1 T.-H., Lin and G. D. J. Phillies, J. Phys. Chem. 8 6 , 4073 (1982).
1.2 G. D. J. Phillies, Biopolymers 24, 379 (1989).
1.3 A. Vailati, D. Asnaghi, M. Giglio, and R. Piazza, Phys. Rev. E 48(4) (1993).
1.4 (a) F. Lanni, D. L. Taylor, and B. R. Ware, Biophysics J. 35, 351 (1981).
(b) T. Chang and H. Yu, Macromolecules 17, 115 (1984).
1.5 P. S. Russo, M. Mustafa, T. Cao, and L. K. Stephens, J. Coll. Inter. Sci. 122, 120 (1988).
1.6 W. Brown and R. Rymden, Macromolecules 21, 840 (1988).
1.7 G. S. Ullmann, K. Ullmann, R. M. Lindner, and G. D. J. Phillies, J. Phys. Chem. 89, 692 (1985).
1.8 K. Ullmann, G. S. Ullmann, and G. D. J. Phillies, J. Coll. Inter. Sci. 105, 315, (1985).
1.9 Z. Bu and P. S. Russo, Macromolecules 27, 1187 (1994).
1.10 (a) D. W. Pohl, S. E. Schwarz, and Imiger, Phy. Rev. Lett. 31, 32 (1973).
(b) L. Leger, H. Hervet, and F. Rondelez, Macromolecules 14, 1732 (1981).
(c) E. J. Amis, P. A. Janmey, J. D. Ferry, and H. Yu, Macromolecules 16, 441 (1983).
1.11 (a) F. Lanni and B. R. Ware, Rev. Sci. Instrum. 53(6), 905 (1982).
(b) M. R. W attenbarger and V. A. Bloomfield, Z. Bu, and P. S. Russo, Macromolecules 25, 5263 (1992).
(c) J. Davoust, P. F. Devaux, and L. Leger, The EMBOJ. 1(10), 1233 (1982).
(d) B. R. Ware, American Lab. 16, April (1984).
(e) B. A. Smith, Macromolecules 15, 463 (1982).
(f) K. Zero and B. R. Ware, J. Chem. Phys. 6 6 , 1610 (1984).
1.12 (a) T. L. James and G. G. M acDonard, J. Magn. Reson. 11, 58 (1973).
(b) W. Brown, P. Stilbs, and R. M. Johnsen, J. Poly. Sci., Poly. Phys. Ed. 20,1771 (1982).
18
1.13 D. N. Petsev and N. D. Denkov, J. Coll. Inter. Sci. 149(2), 329 (1992).
1.14 G. K. Batchelor, J. Fluid. Mech. 74, 1 (1976).
1.15 G. D. J. Phillies, G. S. Ullmann, K. Ullmann, and T. -H. Lin, J. Chem. Phys. 82, 5242 (1985).
1.16 (a) A. G. Ogston, B. N. Preston, and J. D. Wells, Proc. Royal Soc. London A.133, 297 (1973).
(b) A. R. Altenberger and M. Tirrell, J. Chem. Phys. 80, 2208 (1984).
1.17 L. Leger, H. Hervet, and F. Rondelez, Macromolecules 14, 1732 (1981).
1.18 (a) W. Brown, P. Stilbs, and R. M. Johnsen, J. Polym. Sci., Polym. Phys. Ed. 20,1771 (1982).
(b) E. O. Stejskal and J. E. Tanner, J. Chem. Phys. 42, 288 (1965).
1.19 (a) J. W. Klein and B. R. Ware, J. Chem. Phys. 80(3), 1334 (1984).
(b) B. R. Ware and W. H. Flygare, Chem. Phys. Lett. 12(1), 81 (1971).
1.20 R. J. Hunter, "Foundations o f Colloid Science," Vol. 1, Clarendon Press, 1987.
1.21 G. S. Manning, Biopolymers 11, 937 (1972).
1.22 (a) T. Odijk, Macromolecules 12, 6 8 8 (1979).
(b) J. Skolnick and M. Fixman, Macromolecules 10(5), 944 (1977).
1.23 D. B. Roitman, R. A. Wessling, and J. McAlister, Macromolecules 26, 5174 (1993).
1.24 (a) General Booklet o f Rhone-Poulenc "ESTAPOR microspheres," 1987.
(b) L. B. Bangs, "Uniform Latex Particles," Seradyn Inc., Indianapolis, IN 1984.
1.25 J. C. Diniel, J. L. Schuppiser, M. Tricot, U.S. Pat. 4358388, Eur. Pat Application 38730.
1.26 Seradyn Particle Technology newsletter Vol. 3, Spring 1992.
1.27 (a) McGraw-Hill Encyclopedia o f Science and Technology, Vol. 8 , 1977.
(b) W ebster's Third N ew International Dictionary, 1976.
1.28 A. H. Morrish, "The Physical Principles o f Magnetism," John Wiley & Sons, Inc, p361, 1965.
19
1.29 D. S. Parasnis, "Magnetism," Science Today Series, Harper & Brothers, New York, 1961.
1.30 M. Fermigier and A. P. Gast, J. Coll. Inter. Sci. 154(2), 522 (1992).
1.31 P. S. Russo, M. J. Saunders, and L. M. DeLong, Analytica ChimicaActa 189,69, (1986).
1.32 R. Piazza and V. Degiorgio, PhysicaA 182, 576 (1992).
1.33 D. Sohn, L. M. DeLong, and P. S. Russo, Mat. Res. Soc. Symp. Proc. 248, 247 (1992).
CHAPTER 2
PROBE DIFFUSION OF MAGNETIC LATEX PARTICLES
* Portions o f this chapter are taken with permission (Appendix C) from the Material Research Society Symposium Proceeding, Vol. 248, pp. 247-252 (1992). Copyright © 1992 by Materials Research Society.
20
21
2.1 BACKGROUND
Dynamic light scattering has been used for a long time to study the mobility o f
colloidal particles in complex polymeric solutions [2.1]. The most common probes are
uniform latex particles, which generally scatter much more than the polymer matrix.
W hen the probe particles are present at low concentrations and when they scatter much
more than their surroundings, the measured diffusion coefficient is that o f the probe
through the polymer matrix. A number o f issues regarding the translational motion o f
such probes, ranging from the connectivity and stiffness o f the polymer matrix to the
size and shape o f the particles, are still being pursued in this and other laboratories.
Departing somewhat from these concerns, the present report is a preliminary account
o f rotational motion o f spherical particles in a polymer matrix, as determined by
dynamic light scattering. This is only possible if the spherical particles possess optical
anisotropy. Commercially available magnetic latex particles [2 .2 ] are a suitable choice,
due to the crystalline nature o f their magnetite (Fe3 0 4) inclusions.
The light scattering measurements in this report were conducted in Vv and H v
geometries. The first letter refers to the polarization sense o f the detected light. The
second, smaller letter refers to the polarization sense o f the incident light. Horizontal,
H, refers to the light being polarized in the scattering plane defined by the incident and
detected rays. Vertical light is polarized perpendicular to the scattering plane (Figure
2 . 1).
The intensity-intensity autocorrelation function o f scattered light in the familiar
[2.3] homodyne experiment has the form, G ^ ( t ) = B(1 + f(A) | g ^ (t) |2), where g 1 (t)
is the electric field autocorrelation function. For optically isotropic, geometrically
spherical particles such as most latex spheres, g ^ 1 Vv ( 0 is an exponential with decay
rate
r V v = q 2 Dt (2.1)
22
J *n j r
Sam ple A nalyserfTemp. Control)
Amplifier / Dlscrlmlnalor
p m r
CorrelatorLangjey Ford Model 1096
Figure 2.1 Light scattering alignment for the H v and Vv measurement.
23
where q = 4 7 t. n .sin(0/2)/A,o (n = solution refractive index, 0 = scattering angle, X0=
laser wavelength in vacuo) and Dt is the translational diffusion coefficient.
Optically anisotropic particles are, in general, not simple [2.4], However, the
case o f cylindrical symmetry (both optical and geometric) is well understood, especially
in the absence o f coupling between translational and rotational motion [2.3], Spinning
about the thin axis o f such rod-shaped particles is generally not visible but end-over-
end tumbling, characterized by the rotational diffusion coefficient Dr, is. The
appropriate correlation function is g^HyOO QC P2 exp(-q 2 Dt - 6 D r)x, where 3 is the
difference between polarizability in parallel and perpendicular directions with respect to
the cylinder axis. The H v decay rate is therefore
This expression is also valid for a hypothetical spherical particle with a
cylindrical, optically anisotropic inclusion in its center, as shown in Figure 2.2. This is
a starting model for our magnetic latex particles, although its suitability may only be
judged by comparison to experiment. In real particles, there is no reason to assume
that just one magnetic inclusion is located at the geometric center o f the particle;
indeed, according to the patent literature and our own electron microscopic
observations, this seems unlikely. We appeal to the model depicted in Figure 2.2
primarily for its simplicity.
Translational diffusion o f a sphere o f radius R in a simple solvent o f viscosity r\
0 is governed by the Stokes-Einstein relation, Dt = kT/(6 7 tri0 R), where kT is the
thermal energy per molecule. In complex solutions, this equation has been rearranged
to obtain a "microviscosity" associated with translational motion,
r Hv = q2°t + 6 D r (2 .2)
1 —
^ ~ 67tD,R(2 .3)
24
Figure 2.2 Idealized model o f a magnetic latex particle (not to be confused with actual latex particles).
25
where R is usually measured from dilute binary solution in a simple solvent. In general,
there is no reason for to equal the macroscopic solution viscosity r\ because a small
particle can "slip between" polymer molecules that comprise the matrix without the
wholesale reorganizations that attend imposition o f a macroscopic shear gradient.
Intuitively, one might expect the microviscosity to lie between the solution and solvent
viscosities. In fact, large differences between t | and r)1̂ have been reported [2.5, 2.6].
Rotational diffusion o f a sphere in a simple solvent is given by
kTr 87CTIJ13
° r = ^ ^ 3 (2-4)
This can be adapted to yield a rotational microviscosity, representing the opposition
provided by the solution to rotation o f the probe
r kT ^Tin = „ ^ (2 5)
^ 87iDrR
We are not aware o f any other experimental measurements o f the retardation o f
rotational diffusion o f a submicron spheres by a polymer matrix.
2.2 EXPERIMENT
Latex particles o f advertised diameter 700 nm were purchased from Seradyn
Particle Technology Division. According to the manufacturer, they consist o f 58%
Fe30 4/42% polystyrene by weight; we confirmed this by thermogravimetric analysis.
Approximately 5 x 10 ' 5 g/ml Seradyn latex/water solution was prepared by adding dust-
free, 18M n-cm resistivity w ater from a Bamstead Nanopure purifier equipped with a
spiral wound ultrafilter to a stock solution prepared with dust free water, centrifuged to
remove very large particles, and passed through a well rinsed 600 nm diameter
polyester filter (Nuclepore). This effectively isolates the smaller particles in the sample
distribution.
26
A smaller magnetic latex, advertised diameter 54 nm, was obtained from
Polysciences Inc. Thermogravimetric analysis showed these particles to be 12%
Fe 3 0 4 /88% polystyrene by weight. Latex stock solution, 6.25X10"4 g/ml, was prepared
similarly to the Seradyn sample except that a 0.22 pm Durapore filter (Millipore) was
used. This does not significantly fractionate the particles, but only reduces the dust
level.
Polystyrene sulfonate, sodium salt (NaPSS: advertised molecular weight
500,000) was purchased from Scientific Polymer Products Inc. Stock solution was
prepared at 0.05 g/ml with dust-free water, and centrifuged 12 hours at 4700 g.
Dilutions were prepared by addition o f dust-free water and magnetic latex stock.
The light scattering device and the general procedures are detailed elsewhere
[2.4], The Seradyn sample was measured at 30 ± 0.1°C, X0 = 632.8 nm. Polysciences
magnetic latex and ternary systems (Magnetic latex/NaPSS/W ater) were obtained from
four different angles at 25 ± 0 .1°C and X0 = 488.0 nm.
The macroscopic viscosities o f ternary systems were measured on a Brookfield
LVTDCP cone and plate viscometer (range, 0.5 - 1,000 centipoise, cP). A t the low
concentrations and molecular weight o f NaPSS explored so far, shear thinning was
very minor in the available shear rate range (75 - 450 Hz); straightforward
extrapolation to zero shear rate was made.
2.3 RESULTS AND DISCUSSION
2.3.1 IN DILUTE BINARY SOLUTION
Figure 2.3 shows the q-dependence o f decay rate for Seradyn magnetic latex in
pure water. As expected, the slopes o f the H v and Vv plots are similar, and the H v plot
has a finite intercept. One may obtain three estimates o f the particle radius from this
plot. The most conventional one, R Sw (82.8 ± 0.5 nm), comes from the diffusion
coefficient obtained as the slope (hence, the superscripts) o f the V v plot, Eq. 2.1, plus
27
the Stokes-Einstein relation. RsHv (98 ± 4 nm) is similarly obtained, except the
difliision coefficient is the slope o f the H v plot; see Eq. 2.2. The final estimate, RTHv
(110 ±20 nm), comes from Eq. 2.4 where Dr is one-sixth the intercept (hence,
superscript I) o f the H v plot; see Eq. 2.2. The reasonable agreement among these three
values reflects the overall adequacy o f the simple model depicted in Figure 2.2 for this
sample. However, electron microscopy shows not one large magnetic inclusion located
in the center o f the particle, but many small inclusions distributed more or less
symmetrically about the center. This appears to be almost indistinguishable from the
model in Figure 2.2 by dynamic light scattering, and it seems that these particles rotate
with minimal friction about a polar axis, without the wobbling that would result if one
or more heavy magnetite inclusions were asymmetrically located, causing imbalance. It
is emphasized that particles "just out o f the bottle" do not yield such exemplary
behavior, filtration and centrifugation o f the suspension are first required to isolate the
small particles at the tail end o f what electron microscopy shows to be a wide size
distribution.
The Seradyn latex particles have most o f the characteristics desirable in
rotational probe diffusion experiments. However, the H v intercept is rather close to
zero, given realistic uncertainties o f 10 - 20%. The accuracy with which D r could be
determined would become poor as matrix polymer was added. Attem pts to make H v
measurements directly at zero scattering angle were complicated by a very slowly
decaying component, possibly due to weak aggregation o f the particles in the
geomagnetic field (as described below, large aggregates are very evident in an applied
magnetic field; presumably smaller aggregates induced by the Earth's field might
contribute strongly to the scattering at 0 = 0). So rather than pursue the Seradyn
spheres as probes, the smaller particles from Polysciences were tested for suitability in
conventional finite angle Vv and Hv experiments similar to those shown in Figure 2.3.
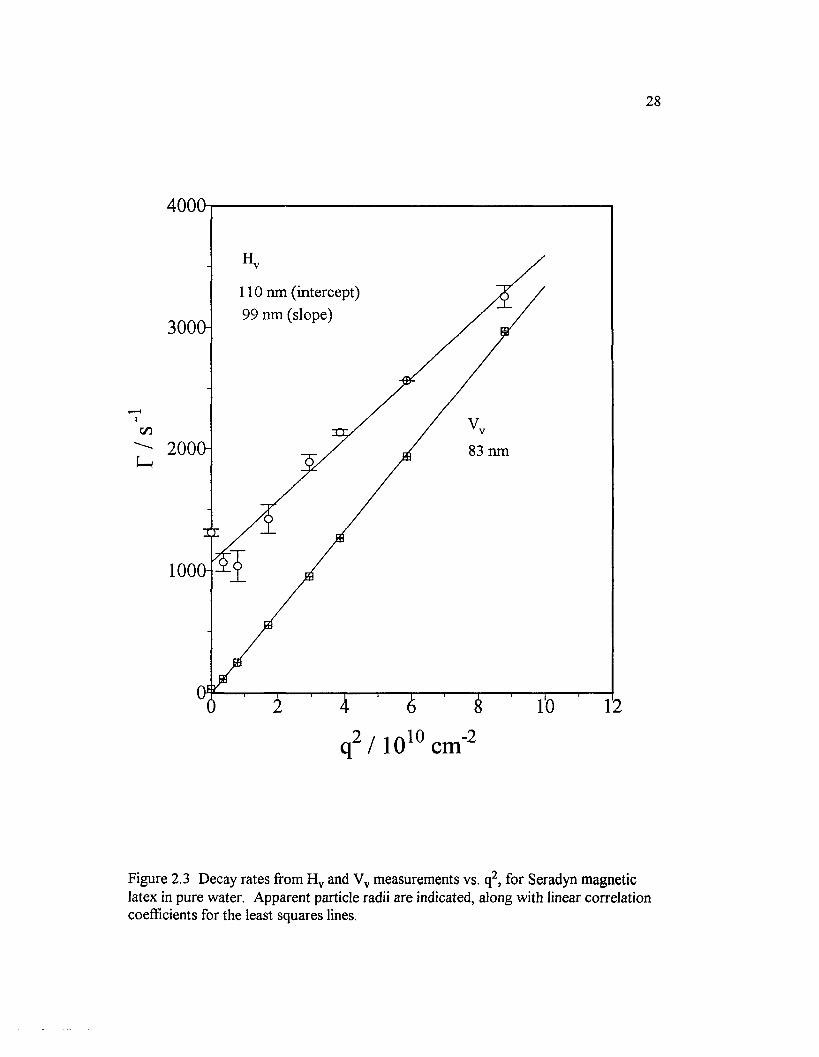
28
4 0 0 0
1 1 0 nm (in tercep t)
99 nm (slope)3000-
2000 - 83 nm
r e
1000
2 / 1010cm-2
Figure 2.3 Decay rates from H v and Vv measurements vs. q2, for Seradyn magnetic latex in pure water. Apparent particle radii are indicated, along with linear correlation coefficients for the least squares lines.

29
For the Polysciences spheres, agreement among the three available radii was
poor (RSvv = 23.6 ± 0.2 nm, in close agreement with the manufacturer's claim; RsHv =
134 ± 29 nm; R!Hv = 43 ± 1 nm). N ote that the H v radii are 2 and 6 times larger than
the Vv value (Figure 2.4).
Electron micrographs reveal some minor size heterogeneity. Perhaps the larger
particles exhibit greater depolarized scattering and are weighted more heavily in the H v
measurements. But the difference between the slope- and intercept-determined radii
from the same H v data set suggests other factors. The low magnetite content for the
Polysciences spheres, coupled with their small size, results in relatively few inclusions
per particle, favoring non-symmetric distribution. M agnetite particles appear as dark
spots in transmission electron micrographs, and do appear to be asymmetrically located
in the Polysciences spheres (typically, near the periphery as also noted in Ref. [2.2]).
The density o f magnetite, 5.2 g/cm [2.7], greatly exceeds that o f polystyrene (~ 1.05
g/cm 3 in latex form). So it is not unreasonable that rotation o f these particles resembles
more a "wobble" than a "spin". The friction associated with such motion should be
higher than for rotation o f a sphere about its midpoint, leading to high radius values
when Dr is interpreted via Eq. 2.4. M oreover, Eq. 2.2 from which Dr is measured is no
longer strictly correct if the optical and friction axes do not coincide. Nevertheless, we
shall continue to use it to obtain apparent Dr values which may approximately represent
"rotation" o f these unusual particles.
2.3.2 IN P R E SE N C E O F PO LY (STY R EN ESU LFO N A TE)
To date, only the Polysciences particles have been used in probe diffusion
measurements; despite possible imbalance and the resulting ambiguities, their small
average size results in a large H v decay rate in simple binary solution, making it easy to
observe rotational slowing as NaPSS is added.

30
20000
40 nm (intercept)
100 nm (slope)
1 5 0 0 0 -
I
10000 -
5 0 0 0 -24nm
10 126 80 2 4
q2/1010 cm"2
Figure 2.4 Decay rates from H v and Vv measurements vs. q2, for Polysciences magnetic latex in pure water. Apparent particle radii are indicated, along with linear correlation coefficients for the least squares lines.
31
However, the depolarized signal from the small particles is much weaker than the
Seradyn spheres, reflecting lower magnetic content.
Longer acquisition times can partially compensate for this; at each concentration, about
one day was required to obtain H v measurements at several angles. D t was obtained as
the slope o f rVv vs. q2 plots, and D r from the intercept o f rHv vs. q2 plots (Figure 2.5
and 2.6). Figure 2.7 shows the microviscosities, together with the macroscopic
solution viscosity; was computed using RsVv, while r)1̂ was computed using R rHv.
All viscosities increase with concentration, but the microviscosities are evidently
smaller than the macroscopic viscosity. This precludes strong specific interaction o f
the polymer and latex. Indeed, none is expected, since both contain mutually repulsive
negatively charged sulfate groups. It appears that treating the polymer solution as a
Stokes-Einstein continuum is invalid for either rotational or translational motion in this
case. Direct comparison between r^ a n d is not straightforward because o f the
possible imbalance o f the particles.
2 .4 S U M M A R Y
Dynamic light scattering is sensitive, but not extremely so, to structural
differences in magnetic latexes. Thus, the imbalance o f the Polysciences spheres was
clearly evident (well before confirmation by electron microscopy) while the Seradyn
magnetic spheres could be fitted to the model shown in Figure 2.2, even though
electron micrographs reveal many small, symmetrically located inclusions instead o f one
central magnet. The Seradyn latex would make a suitable probe o f rotational motion if
the intercept o f THv vs. q2 plots could be determined somewhat more reliably. It is
possible that improved uniformity, cancellation o f the geomagnetic field, or use o f latex
spheres with nonmagnetic, optically anisotropic inclusions, will prove useful. The
unbalanced nature o f the smaller Poly sciences magnetic latex spheres causes some
ambiguities in the interpretation.
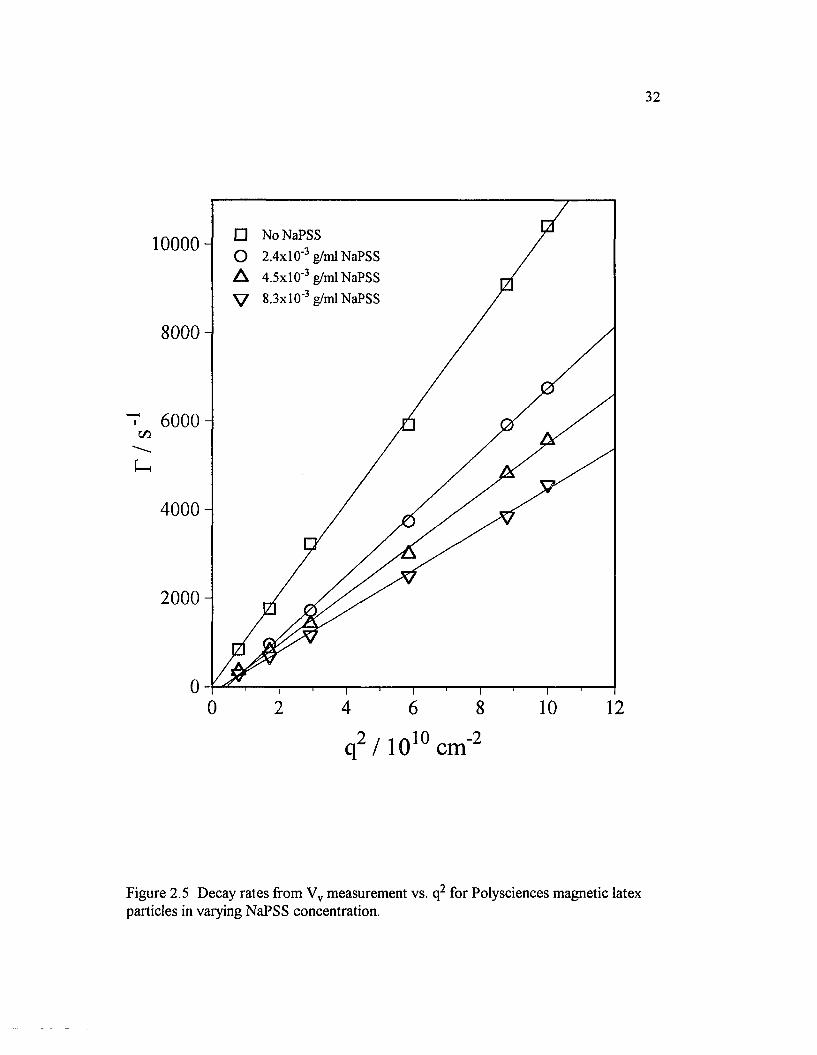
32
No NaPSS 2.4xl0 - 3 g/ml NaPSS 4.5xl0 ' 3 g/ml NaPSS 8.3x1 O' 3 g/ml NaPSS
10000
8000
6000
4000
2000
0
0 4 6 8 10 122
q2 / 1010 cm-2
Figure 2.5 Decay rates from Vv measurement vs. q2 for Polysciences magnetic latex particles in vaiying NaPSS concentration.

33
□ No NaPSS
O 2.4x10'3 g/ml NaPSSA 4.5x10 ' 3 g/ml NaPSS
V 8.3xl0‘3 g/ml NaPSS
20000 -
1 5 0 0 0 -
I
10000 -
5 0 0 0 -
0 2 4 6 8 10
q2 / 1010 cm"2
Figure 2.6 Decay rates from H v measurement vs. q2 for Polysciences magnetic latex particles in varying NaPSS concentration.
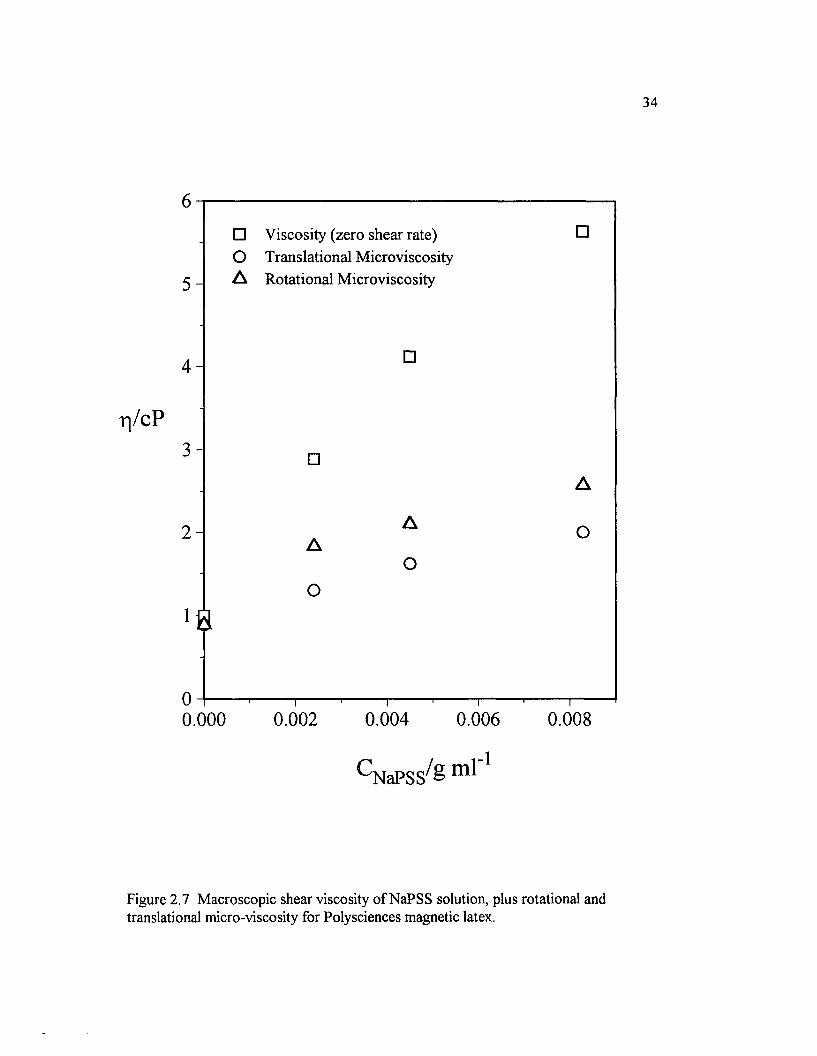
34
5
4
r)/ cP3
2
1
0
0 .
Figure 2.7 M acroscopic shear viscosity o f NaPSS solution, plus rotational and translational micro-viscosity for Polysciences magnetic latex.
□ V iscosity (zero shear rate) D
O T ransla tional M icroviscosity
A R otational M icroviscosity
□
a
□
A
o
A
O
A
O
1 1 1 1 1 1 1------------------ 1—
000 0 .002 0 .004 0.006 0.008
C N a P S S ^ 1
35
Analysis via expressions appropriate for the single encapsulated magnet model
produced rotational microviscosities similar to the translational values, in the range o f
NaPSS concentration explored so far.
I f a dilute solution containing magnetic latex is placed above a simple magnetic
stirring apparatus (but not in physical contact with it, to avoid vibrations) and
illuminated by a laser beam, one observes that the scattered light fluctuates according
to the position o f the rotating magnet. Autocorrelation experiments, such as the one
shown in Figure 2.8, confirm that the clearly visible intensity fluctuations at low
magnetic oscillation frequencies persist to much higher frequencies, even though they
are no longer visible to the naked eye. These fluctuations are due to reorientation, or
partial reorientation, o f chain like aggregates (easily observed in a microscope) o f the
particles induced by the magnetic field. This suggests that light scattering could be
used to measure the frequency response in reorientation for such chain-like structures.
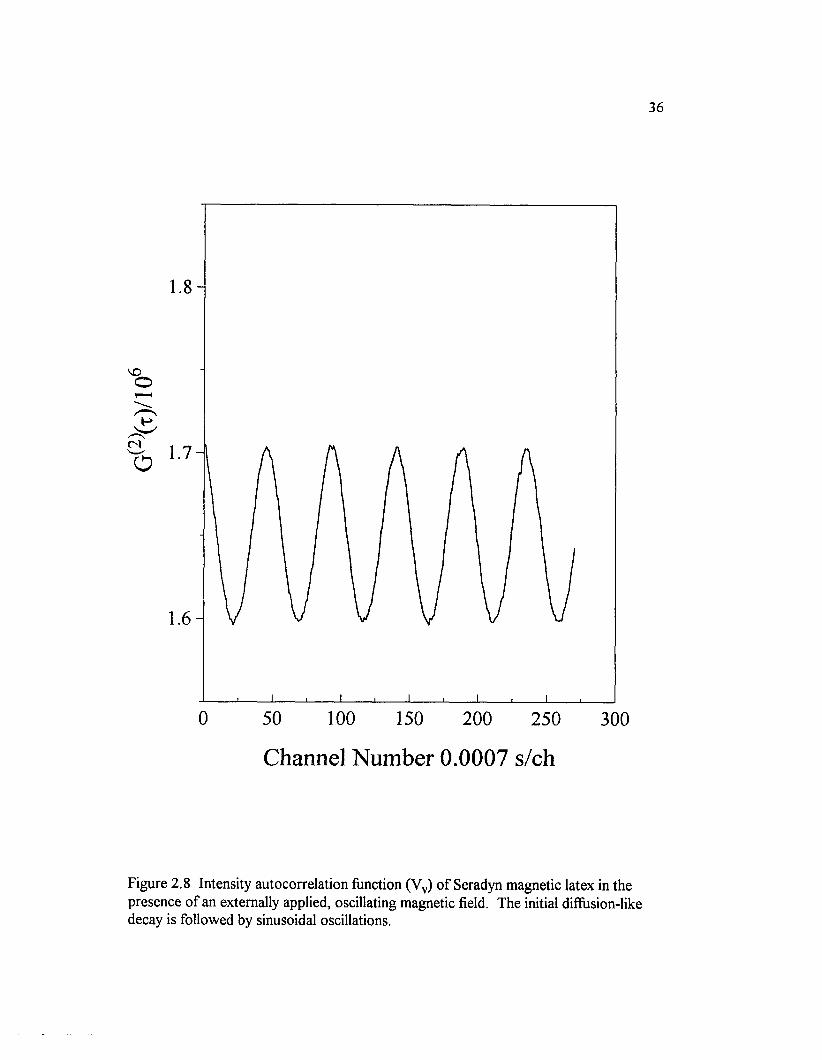
36
O
<N
" o
1.8
1.7
1.6
0 50 100 150 200 250 300
Channel Number 0.0007 s/ch
Figure 2.8 Intensity autocorrelation function (Vv) o f Seradyn magnetic latex in the presence o f an externally applied, oscillating magnetic field. The initial diffusion-like decay is followed by sinusoidal oscillations.
37
2.5 REFERENCES
2.1 (a) G. D. J. Phillies, J. Phys. Chem. 93, 5029 (1989).
(b) W. Brown and R. Rymden, Macromolecules 19(12), 2942 (1986).
(c) J. Newman, N. M roczka, and K. L. Schick, Biopolymers_28 , 655 (1989).
(d) P. S. Russo, M. Mustafa, T. Cao, and L. K. Stephens, J. Coll. Inter. Sci. 122(1), 120 (1988).
2.2 J. -C. Daniel, J. -L. Schuppiser and M. Tricot, U.S. Patent No. 4,358,388(4 Nov. 1982).
2.3 B. Berne and R. Pecora, "Dynamic Light Scattering," Wiley, N ew York, 1976.
2.4 P. S. Russo, M. J. Saunders, L. M. DeLong, S. K. Kuehl, K. H. Langley and R.W. Detenbeck, Anal. Chem. Acta 189, 69 (1986).
2.5 T.-L. Lin and G. D. J. Phillies, Macromolecules 17, 1686 (1984).
2.6 G. S. Ullmann, K. Ullmann, R. M. Lindner and G. D. J. Phillies, J. Phys.Chem 89,692 (1985).
2.7 M erck Index, Ed. 10, No. 3974, ferric oxide, M erck & Co. Inc., Rahway, NJ, 1983.
CHAPTER 3
INTERACTION BETWEEN POLYELECTROLYTES AND MAGNETIC LATEX PARTICLES*
* Portions o f this chapter are taken from a draft manuscript "Light Scattering Study o f Magnetic Latex Particles and Their Interaction with Polyelectrolytes" submitted 10/04/94 to Journal o f Colloids and Interface Science. The authors, in order, are: D. Sohn, P. S. Russo, A. Davila, D. S. Poche', and M. L. McLaughlin.
38
39
3.1 INTRODUCTION
Magnetic Latex Particles (or M LP) are commonly used in various bioseparation
techniques [3.1], Small, superparamagnetic crystallites o f magnetite give the particles
unique magnetic and optical properties. The magnetic interaction between the particles
is negligible in aqueous solution if there is no externally applied magnetic field. Even
though the optical properties, particularly the depolarization o f scattered light, differ
from those o f ordinary latex particles, the interparticle interaction is similar to that o f
common non-magnetic latex particles until a magnetic field is applied to align the spins
in the superparamagnetic inclusions. Then a strong dipolar interaction develops and the
M LP aggregate as chains that are readily pulled towards the magnet. This "chaining"
interaction, and indeed all effects o f an applied magnetic field [3.2], are beyond the
scope o f the present study.
Initial interest in the study o f optically anisotropic colloids such as the present
MLP was peaked by "probe diffusion" experiments [3.3] where the diffusion o f
colloidal particles is monitored in an attempt to learn the local structure o f some
complex polymeric matrix, such as an entangled solution or gel. These studies are
commonly performed by dynamic light scattering, however one o f the complexities o f
these systems is that the matrix may itself scatter. W ith an optically anisotropic probe,
matrix scattering would be almost completely excluded in depolarized light scattering
experiments, even in aqueous solutions where it is not possible to match [3.4] the index
o f refraction o f the solvent and matrix component. Although the M LP are fairly large
probes, their rotational m otion could provide information o f a new kind on a very local
scale. For example, non-continuum dynamical behavior might be observed in the
rotational motion, despite the relatively large size o f the M LP probes.
For the matrix, a polyelectrolyte with a negative charge was selected to prevent
the kind o f surface adsorption seen with nonionic polymers [3.5], It will be shown that
40
adsorption o f the polymer to the M LP is not significant. The extra complication o f a
polyelectrolyte matrix is, however, not trivial. Thus, while a preliminary investigation
[3.6] o f solutions without added salt quickly provided some o f the probe diffusion
information originally sought, including significant failure o f continuum hydrodynamic
relationships for translational and rotational diffusion, there are equally interesting
questions o f colloid stability and specific colloid-polymer interaction. The present
chapter is devoted primarily to these.
3.1.1 COLLOID AND POLYMER INTERACTIONS
The behavior o f charged particles has been studied by Pusey [3.7], Schaefer et
al. [3.8] by dynamic light scattering. The interaction between spherical charged
particles is commonly interpreted via the DLVO (Deijaguin and Landau, Verwey and
Overbeek) theory [3.9] which combines the electrostatic repulsion and van der Waals
attraction between the double layers. These electrical double layers are veiy sensitive
to the ionic strength o f the system. Increasing the ionic strength significantly
diminishes the thickness o f the double layer [3.10, 3.11], and the van der Waals
attraction becomes dominant. So, an electrostatically stabilized dispersion is
aggregated when the ionic strength o f the dispersion medium is raised sufficiently.
There continues to be serious disagreements as to the nature o f the interaction among
charged particles at very low ionic strengths [3.12], centered on the issue o f whether or
not there may exist an attractive interaction to counterbalance the electrostatic
repulsion.
The added polymer chains present in this study could, in principle, stabilize or
destabilize the colloidal particles [3.13, 3.14, 3.15], Colloid-polymer interactions can
be divided into "bound polymer" and "free polymer" types. Polymers bound to the
latex particle can impart stability through a steric mechanism (preventing the close
approach o f the latex particles) or induce aggregation by "bridging" tw o or more latex

41
particles. The best understood interaction between free polymers and colloidal
particles is depletion flocculation, first identified by Asakura and Oosawa [3.16], This
effect arises due to the osmotic force acting on two colloidal particles as a result o f the
exclusion o f polymeric material from the zone between them when they are separated
by a small distance. That is, when two particles are separated by a distance comparable
to the radius o f the added polymer, there is insufficient space for the polymer, so it
evacuates the region leaving only solvent in the depletion layer. Then the osmotic force
o f the polymers on the outer surfaces o f the colloidal pair drives the particles closer
together. Feigin and N apper [3.17] proposed a depletion stabilization mechanism by
considering two particles at a somewhat greater distance. As long as the colloidal
particles are separated by a distance greater than the polymer diameter, such that the
polymer can still exist between them without serious loss o f configurational entropy,
the bulk solution will resist exclusion o f polymer from that region, thereby providing a
degree o f stabilization. This resistance is based on polymer-polymer repulsions
(excluded volume or electrostatic) and increases with bulk concentration for polymers
in a good solvent. Polyelectrolytes [3.18], especially NaPSS, in salt solution have been
studied by Koene & Mandel [3.19] and Drifford & Dalbiez [3.20], It would be
expected that, in general, polyelectrolytes would impart stability by a combination o f
electrostatic and steric mechanisms [3.21], Buscall [3.22] developed a qualitative
approach to the steric stabilization with polyelectrolytes in a colloid system.
3.1.2 STATIC AND DYNAMIC LIGHT SCATTERING
Static light scattering can reveal the presence o f clusters or aggregates. The
angular dependent intensity obeys I(q)/I(0) « 1 - q2 Rg2/3 + ■■• where I is the scattering
intensity at a given scattering vector, whose magnitude is q = 4 7 r.n.sin(0 / 2 )A o (n =
refractive index; 0 = scattering angle; \ Q - incident light wavelength in vacuo). It is
easily seen that the radius o f gyration, Rg, is obtained in the limit o f low q as:
42
Rg = (3<flnl(q)/rfq2 ) 1 /2 (3.1)
This Guinier relationship [3.23] is valid at suitably low concentrations.
Dynamic light scattering measurements were conducted in V v and H v
geometries. The first letter refers to the polarization sense o f the detected light. The
second, smaller letter refers to the polarization sense o f the incident light. Horizontal,
H, refers to the light being polarized in the scattering plane defined by the incident and
detected rays. Vertical light is polarized perpendicular to the scattering plane.
The intensity autocorrelation function o f scattered light in the familiar [3.24]
homodyne experiment has the form, ( t) = B(1 + f(A) | g^'l (x) |2), where g ^ ( T) is
the electric field autocorrelation function. For monodisperse, optically isotropic,
geometrically spherical particles such as most latex spheres, g ^ 1 Vv (x) ' s an exponential
with decay rate
where Dt is the translational diffusion coefficient. For polydisperse scatterers or
scatterers that exhibit internal relaxation modes, including rotation o f nonspherical
particles, r Vv often increases a little faster than q2. In these cases, D t is more
The dynamic light scattering from optically anisotropic particles is, in general,
not simple [3.25], However, the case o f cylindrical symmetry (both optical and
geometric) is well understood, especially in the absence o f coupling between
translational and rotational motion. Spinning about the thin axis o f such rod-shaped
particles is generally not visible but end-over-end tumbling, characterized by the
rotational diffusion coefficient Dr, is. The appropriate correlation function is g*-1 Vv(T)
oc p 2 [exp(-q2 D t - 6 Dr)x], where p is the difference between polarizability in parallel and
r Vv = q2 Dt (3.2)
accurately obtained as the zero-q limit o f Dapp = r Vv/q2-
(3.3)

43
perpendicular directions with respect to the cylinder axis. The H v decay rate is
therefore:
THv = q 2 Dt + 6 Dr (3.4)
Equation 3.4 will be appropriate for anisotropic inclusions in a spherical particle if they
are uniformly distributed and isotropically arranged.
Translational diffusion o f a sphere o f radius R in a simple solvent is governed by
the Stokes-Einstein equation,
D t = kT / 6 7 ir |0R (3.5)
where r | 0 is the solvent viscosity, k is Boltzmann's constant, and T is the absolute
temperature. In complex solutions, Equation 3.5 has been rearranged [3.26] to obtain
a "microviscosity" associated with translational motion,
= kT / 67iDtR = ft/(67tR) (3.6)
where R is usually measured from dilute binary solution in a simple solvent and ft is the
friction factor associated with translational motion (we assume zero probe
concentration, so there is no difference between self and mutual friction factors). In
general, there is no reason for q 1̂ to equal the macroscopic solution shear viscosity q
because a small particle can "slip between" polymer molecules that comprise the matrix
without the wholesale reorganizations that attend imposition o f a macroscopic shear
gradient. Intuitively, one might expect the microviscosity to lie between the solution
and solvent viscosities. In fact, large differences between q and q 1̂ have been reported
[3.27] though there is some disagreements exist as to the magnitude, even in similar
systems.
The rotational diffusion o f a sphere in a simple solvent is given by
Dr = kT / 87tq0 R 3 (3.7)
W e can obtain from the foregoing equations various radii o f the particles.
R sVv = kT /e itrioD t (3.8)
44
R*Hv = ( k T /S T n ^ ) 1'3 (3.9)
R sHv = k T / e ^ i ^ (3.10)
where RVv is the radius from Vv measurements extrapolated to zero q, and R1̂ and
R sHv are radii from the intercept and initial slope o f H v measurements, respectively. It
is understood that D t in Equation 3.10 comes from the H v measurement, and may have
a different value than D t in Equation 3.8.
3.2 EXPERIMENT
W ater was obtained from a Bam stead Nanopure 5-stage purifier including a
spiral wound ultrafilter (50 A), which is in turn fed by a Millipore Milli-Q three-stage
system. The measured resistivity at the tap is 18 M Q-cm. The w ater is absolutely free
o f dust or other impurities, as determined by visual inspection o f the light scattered
from the water when illuminated by a tightly focused argon ion laser beam at lOOx
magnification using a custom made light scattering spectrometer. The light scattering
cells were treated with chlorotrimethylsilane, resulting in a hydrophobic, methylated
surface on the inside to facilitate rising, and tested for cleanliness by visual inspection
as just described for w ater testing.
Superparamagnetic latex particles have variable number o f magnetite (Fe3 0 4)
inclusions approximately 1-20 nm in size. Three samples were purchased from
different sources; they are referred to by the vendor name. Steps were taken to clean
the particles and reduce size polydispersity. Seradyn latex particles o f advertised
diameter 0.7 pm were purchased from Seradyn Particle Technology Division.
According to the manufacturer, they contain 58% Fe3 0 4 / 4 2 % polystyrene by weight;
this was confirmed by thermogravimetric analysis. Approximately 5 x l0 ’ 5 g/ml Seradyn
latex/water solution was prepared by adding dust-free water. The sample was
centrifuged to remove very large particles, and passed through a well rinsed 0 . 6 pm
45
diameter polyester filter (Nuclepore). This effectively isolates the smaller particles in
the sample distribution.
A smaller magnetic latex, advertised diameter 0.054 pm, was obtained from
Polysciences Inc. By thermogravimetric analysis, these particles contained 12%
Fe3 0 4 / 8 8 % polystyrene by weight. Latex stock solution, 6.25X10⁻⁴ g/ml, was prepared
similarly to the Seradyn sample except that a 0.22 pm Durapore filter (Millipore) was
used. This does not significantly fractionate the particles, but only reduces the dust
level.
The third magnetic latex particle containing 6 8 % iron oxide by weight was
purchased as a 2% suspension from Bangs Laboratories, Inc. The surface sites o f these
particles are carboxyl groups (advertised surface charge 197 peq/g and parking area
2.7 A2/COOH group). The advertised radius was 0.4 pm. A 0.055 wt% solution was
prepared and filtered with a well-rinsed Millipore 0.45 pm Millipore H A membrane to
make a stock solution containing particles with average radius 0.10 pm. This is a
convenient size; smaller magnetic latex particles often have such a w eak depolarized
signal that very long acquisition times are needed to collect data o f high quality, while
larger latex particles rotate too slowly for convenient measurement on the linearly
spaced, 4-bit Langley-Ford 1096 autocorrelator that was used.
Polystyrene sulfonate sodium salt (NaPSS; advertised M = 70,000) was
purchased from Scientific Polymer Products Inc. This NaPSS is not the narrow
distribution standard material, but GPC light scattering in 0.01 M NaCl shows the
polydispersity is not excessive: M^/Mj, < 1 .6 and Mw = 70,000 as claimed by the
supplier. O f special importance to the present study is that elemental analysis (by
Oneida Reseach Service, Inc.) shows that the sample is «100% sulfonated. A stock
solution at 0.0428 g/ml NaPSS/HzO was prepared and filtered with a Millipore 0.1 pm
M illex -W filter. Salt solutions at 0.01 M, 0.05 M, and 0.1 M NaCl solution were
46
prepared with GR grade (EM Science) NaCl and filtered with a 0.1 pm M illex -W
Millipore filter.
To make the ternary M LP/NaPSS/H20 solution, 1 ml o f H20 was put into each
o f 4 silanated cells, and 0.01 ml, 0.05 ml, 0.1 ml, and 0 . 2 ml NaPSS stock solution
were added to the 4 cells, respectively. Then, 0.2 ml o f magnetic latex stock solution
was added to each o f the cells. The final latex concentration was 1,4x lO^/o; apparent
translational diffusion coefficients ranged from 2.7-2 .82xl0 '8 cm " 2 sec" 1 between
lx l0 '3% and lx l0 '5% range o f concentrations. Figure 3.1 shows the magnetic latex
particle concentration dependent T vs. q2 plot. These concentrations are a little lower
than ideal. Low concentrations can enhance the significance o f number fluctuations
[3.28] relative to the desired diffusive decay o f the correlation function. Optical
settings in the detector had to be adjusted to measure a somewhat larger volume than
normally used to keep the number fluctuation problem at bay. The above procedure
results in a 2 0 % spread o f the final latex concentration, which is insignificant at the low
total latex content used. The final NaPSS concentration o f each cell was 0, 7.016x1c4,
3 .292xl0 '3, and 6 .114xl0‘3 g/ml. The quaternary solutions M LP/NaPSS/H 2 0/N aC l
solutions at 0.01 M, 0.05 M, and 0.1 M NaCl were prepared by the same process
except for changing the water to sodium salt solution. The quoted salt concentrations
refer to added salt. At zero added salt, the conductivity at the highest NaPSS
concentration was the same as that o f a 0.004 M NaCl solution. Dialysis reduced this
by half, so we estimate the residual salt concentration as < 0.002 M.
The custom-built light scattering spectrometer uses a Lexel Model 95 argon ion
laser capable o f producing about 1 W at 488.0 nm. The laser beam was approximately
vertically polarized, so a Glan-Thomson polarizer o f low-power rating (Karl Lambrecht
M GT3E5; 1W cm"2) was sufficient to eliminate the small horizontal component.
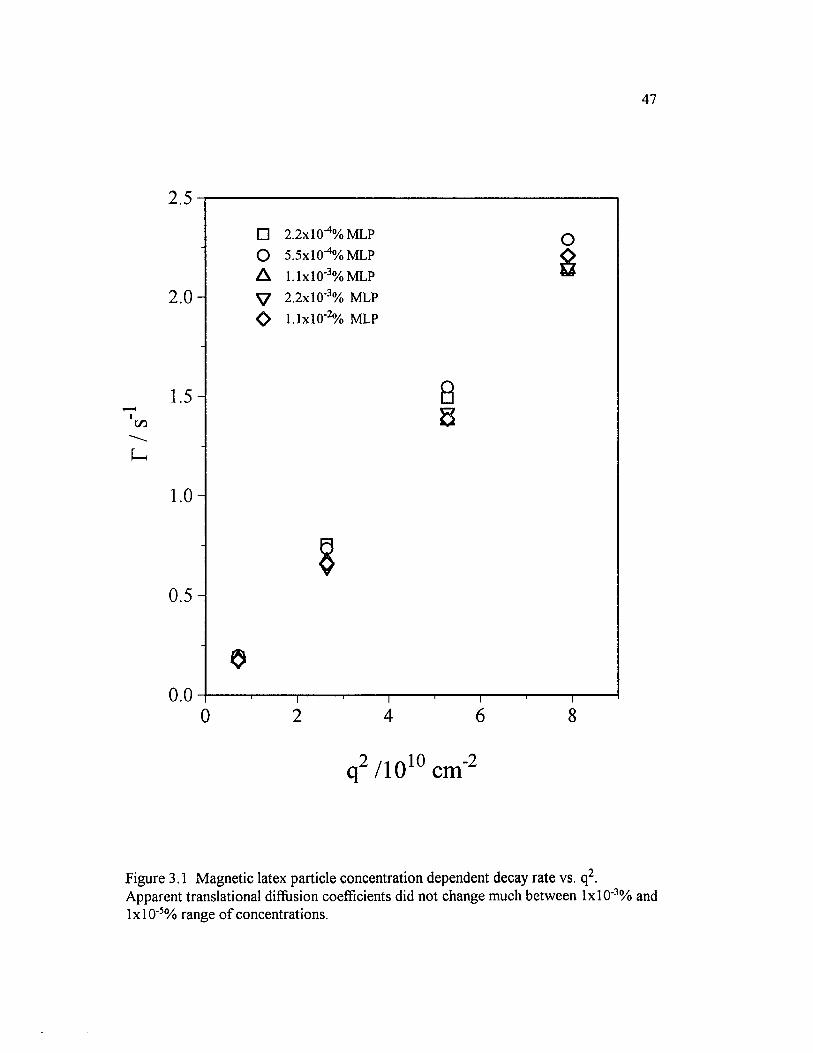
47
2.5
□ 2.2x10^% MLP
O 5.5x10"4% MLP
A 1.1x10'3%MLP
V 2.2x10'3% MLP
O I.IxKTVo MLP2 .0 -
0 .5 -
0.06 80 2 4
q2 /1010 cm’2
Figure 3.1 M agnetic latex particle concentration dependent decay rate vs. q2.Apparent translational diffusion coefficients did not change much between lx l0 '3% and l x l 0 '5% range o f concentrations.
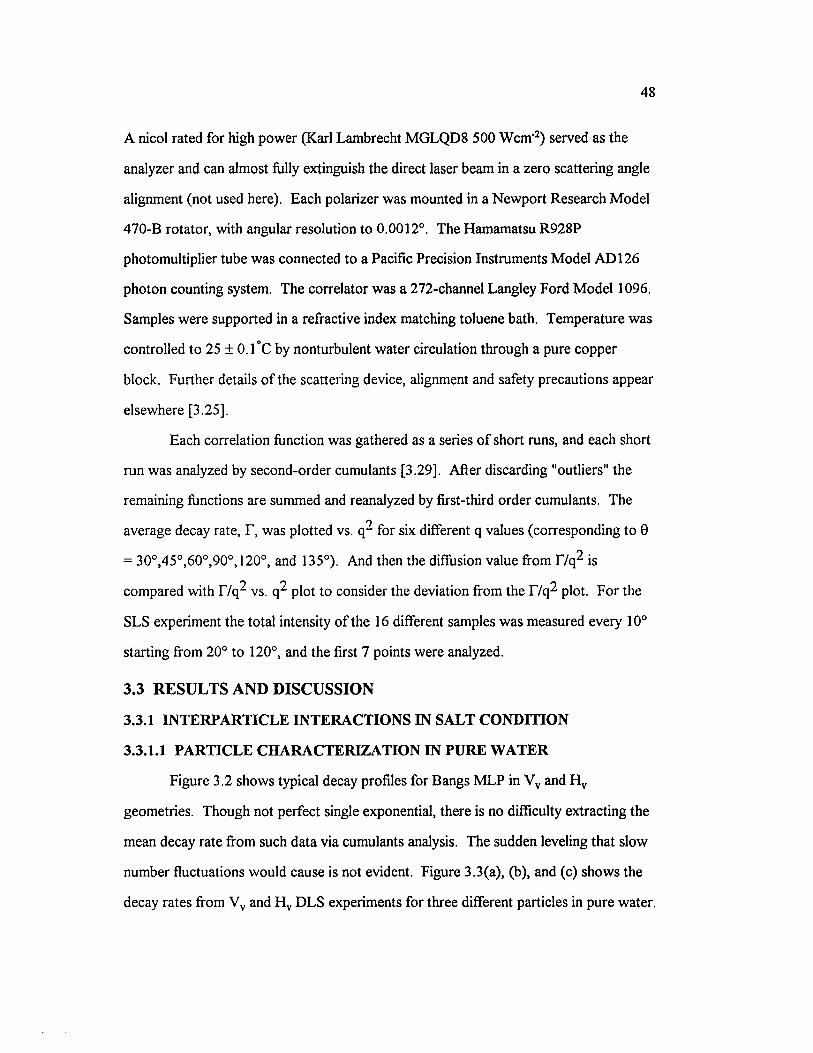
48
A nicol rated for high power (Karl Lambrecht M GLQD 8 500 Wcm"2) served as the
analyzer and can almost fully extinguish the direct laser beam in a zero scattering angle
alignment (not used here). Each polarizer was mounted in a New port Research Model
470-B rotator, with angular resolution to 0.0012°. The Hamamatsu R928P
photomultiplier tube was connected to a Pacific Precision Instruments Model AD 126
photon counting system. The correlator was a 272-channel Langley Ford Model 1096.
Samples were supported in a refractive index matching toluene bath. Temperature was
controlled to 25 ± 0.1 °C by nonturbulent water circulation through a pure copper
block. Further details o f the scattering device, alignment and safety precautions appear
elsewhere [3.25],
Each correlation function was gathered as a series o f short runs, and each short
run was analyzed by second-order cumulants [3.29], After discarding "outliers" the
remaining functions are summed and reanalyzed by first-third order cumulants. Thefj
average decay rate, T, was plotted vs. q~ for six different q values (corresponding to 0
= 30°,45°,60°,90°, 120°, and 135°). And then the diffusion value from 17q^ is
compared with T/q^ vs. q^ plot to consider the deviation from the 17q^ plot. For the
SLS experiment the total intensity o f the 16 different samples was measured every 10°
starting from 20° to 120°, and the first 7 points were analyzed.
3.3 RESULTS AND DISCUSSION
3.3.1 INTERPARTICLE INTERACTIONS IN SALT CONDITION
3.3.1.1 PARTICLE CHARACTERIZATION IN PURE WATER
Figure 3.2 shows typical decay profiles for Bangs MLP in Vv and H v
geometries. Though not perfect single exponential, there is no difficulty extracting the
mean decay rate from such data via cumulants analysis. The sudden leveling that slow
number fluctuations would cause is not evident. Figure 3.3(a), (b), and (c) shows the
decay rates from Vv and H v DLS experiments for three different particles in pure water.
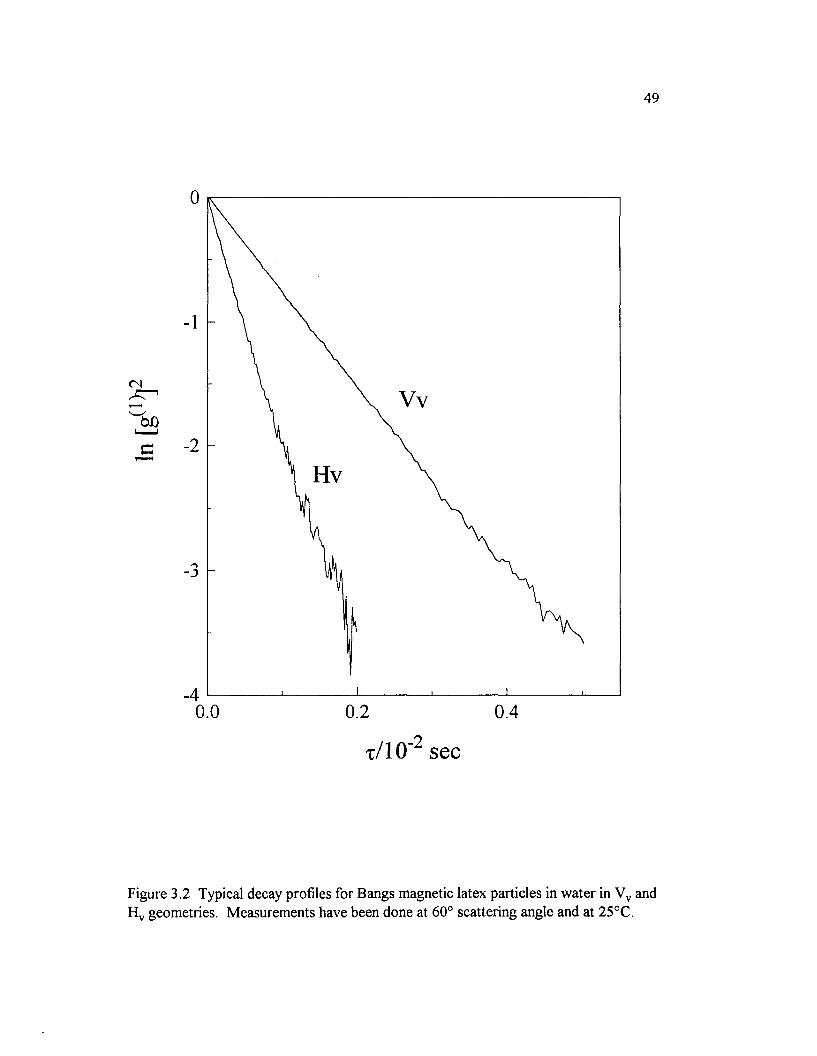
49
0
1
Vv
■2Hv
3
•40.0 0.2 0.4
t / 1 0 " 2 sec
Figure 3.2 Typical decay profiles for Bangs magnetic latex particles in w ater in Vv and H v geometries. Measurements have been done at 60° scattering angle and at 25°C.
50
Vv
S eradyn M L P
3.0
t—h
oxx.
I-H Vvi r
i2 / 1 0 1 0 c m ' 2
Figure 3.3(a) Seradyn magnetic latex particles' (1) decay rate vs. q2 plot o f Vv and H v measurement. (2 ) T/q2 vs. q2 plot.
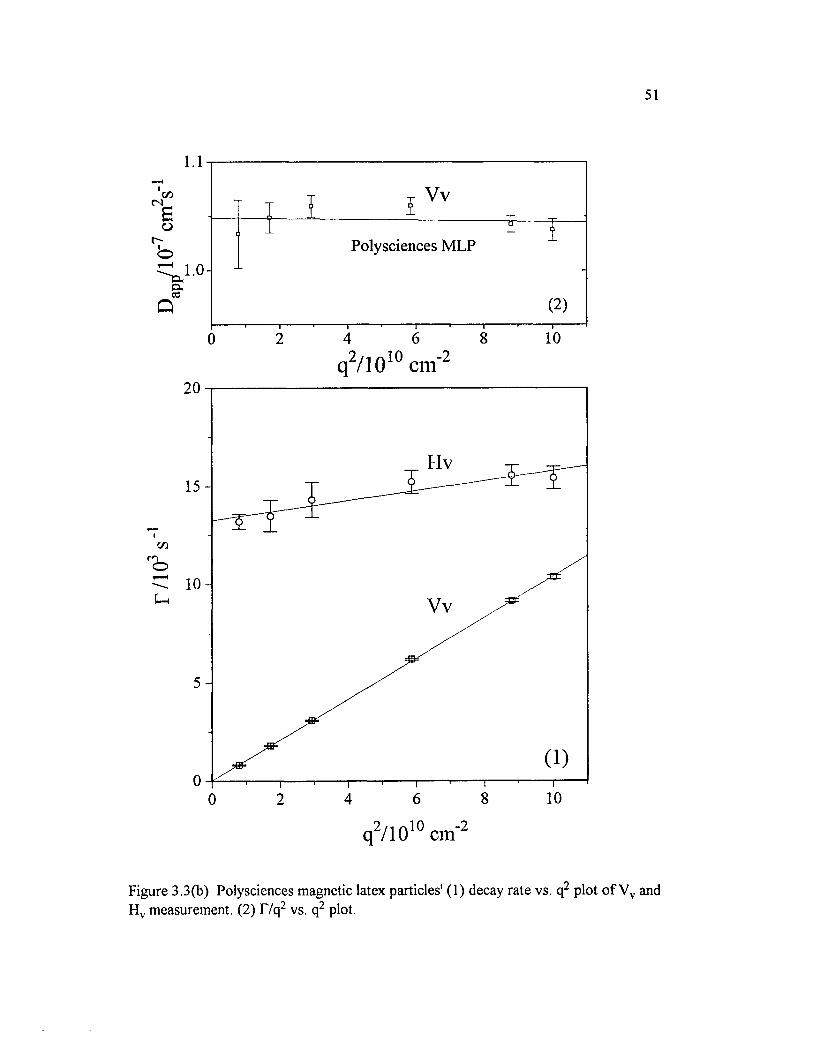
51
P olysciences M L P
q2/1 0 10 cm'2
Hv1 5 -
Vv
108640 2
q2/1010 cm'2
Figure 3.3(b) Polysciences magnetic latex particles' (1) decay rate vs. q2 plot o f Vv and H v measurement. (2) I7q 2 vs. q2 plot.
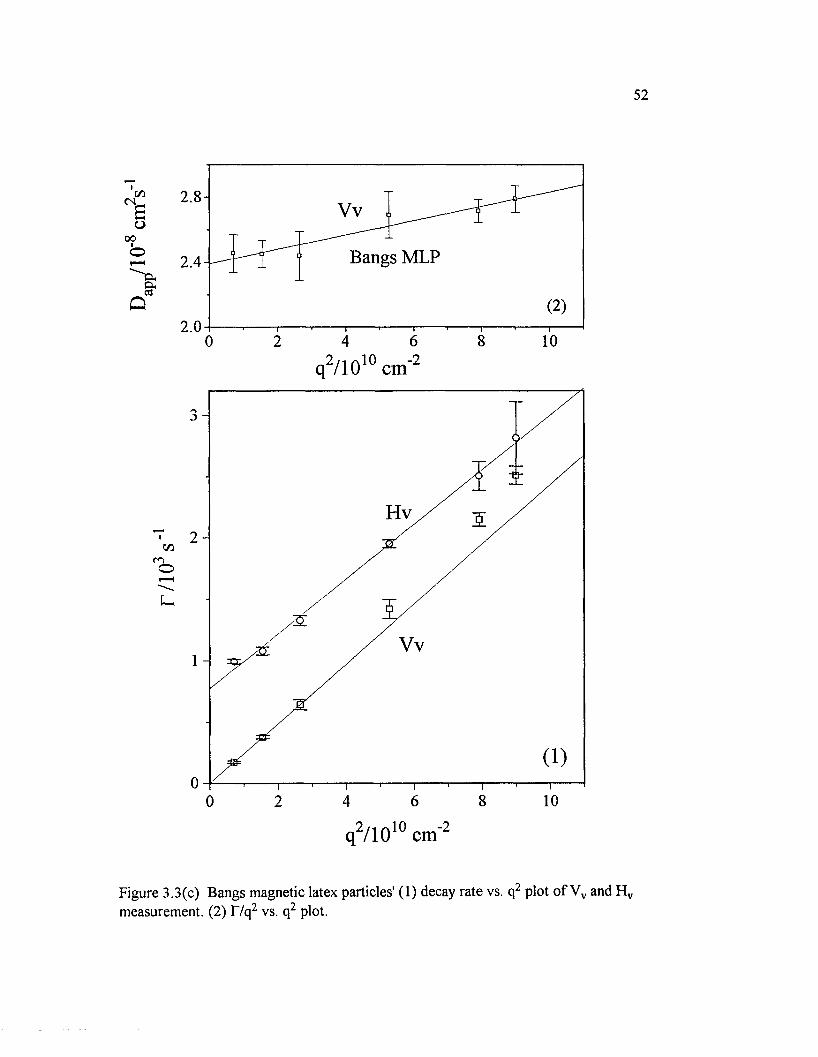
52
cn
1=0
oo1O
2 . 8 -
Vv
Bangs MLP2.4-
&Q
2.04 6 8 100 2
q2/1010 cm'2
Hv
Vv-21
6 8 100 2 4
q2/ 1010 cm-2
Figure 3.3(c) Bangs magnetic latex particles' (1) decay rate vs. q2 plot o f Vv and H v measurement. (2 ) T/q2 vs. q2 plot.
53
The decay rate was determined by 3rd cumulant fitting except for the small MLP o f
Figure 3.3(b). In this case, a single exponential nonlinear least squares fit with floating
baseline was used to reduce the effects o f baseline uncertainty. For the Seradyn MLP,
the slopes o f the H v and Vv plots are similar, and the H v plot has a finite intercept.
Closer inspection does reveal some upward curvature in the Vv plot, probably due to
polydispersity (as the scattering angle is increased, scattering from the larger particles
decreases). The upward curvature is reflected in a positive slope for the D app vs. q2
plot (Figure 3.3(a)). Using Equations 3.8-10, one may obtain three estimates o f the
particle radius from the combined H v and Vv dynamic light scattering; these radii
appear in Table 3.1. The reasonable agreement among the three values for the Seradyn
M LP reflects the overall adequacy o f a simple model which has one magnetite inclusion
located symmetrically in the center o f the latex. However, electron micrographs
(Figure 1.2) shows not one large magnetic inclusion located in the center o f the
particle, but many small inclusions distributed more or less symmetrically about the
center and predominantly near the particle surface, in agreement with Daniel et al.
[3.30], A structure with many inclusions symmetrically located near the surface
appears to be almost indistinguishable by dynamic light scattering from the simple,
single symmetric inclusion model. It is emphasized that particles "just out o f the bottle"
do not yield such exemplary behavior; the filtration and centrifugation steps described
above are required to isolate the small particles at the tail end o f what electron
microscopy shows to be a wide size distribution.
For the Poly sciences spheres, agreement among the three available radii was
poor (Table 3.1 and Figure 3.3(b), R sVv = 23.6 ± 0.2 nm, RsHv = 134 ± 29 nm; R 1̂ = 43
± 1 nm). The H v radii are 2 and 6 times larger than the Vv value. Electron
micrographs reveal some minor size heterogeneity.
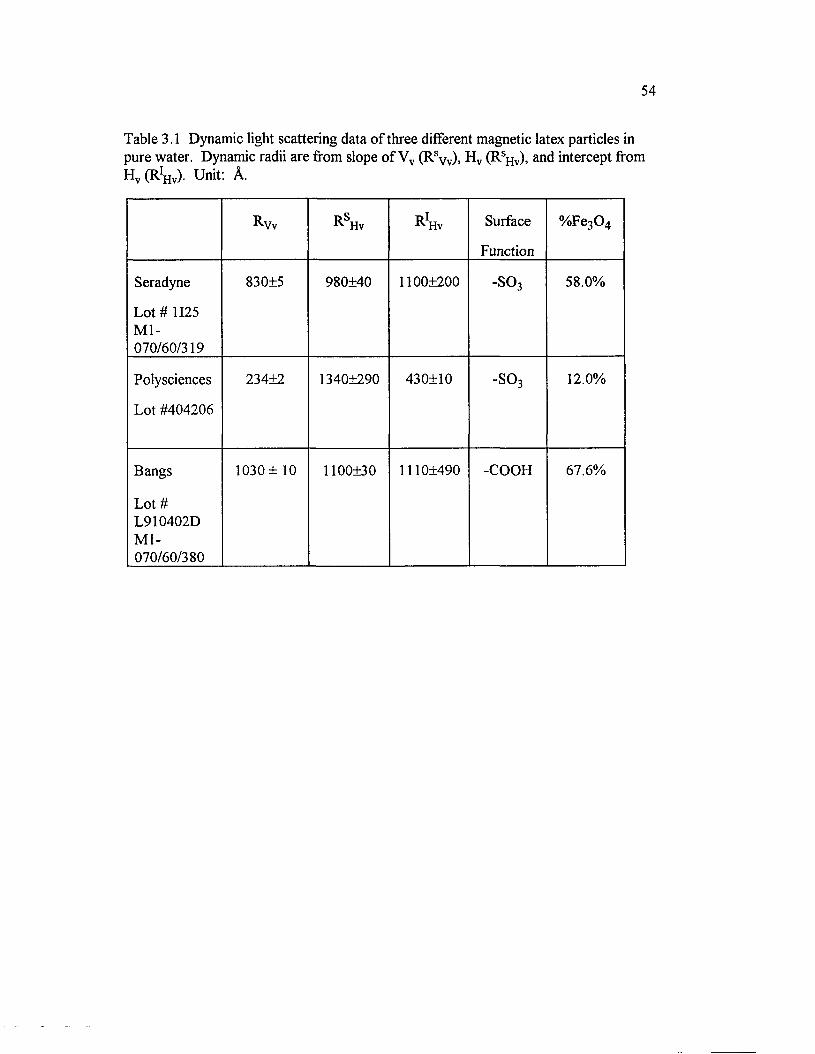
54
Table 3.1 Dynamic light scattering data o f three different magnetic latex particles in pure water. Dynamic radii are from slope o f Vv (RsVv), H v ( R sh v) . and intercept from H v (R!Hv). Unit: A.
R Vv r SH v r IH v Surface
Function
% Fe3 0 4
Seradyne
Lot # 1125 M l-070/60/319
830±5 980±40 1 1 0 0 + 2 0 0 -so3 58.0%
Polysciences
Lot #404206
234±2 1340+290 430±10 -so3 1 2 .0 %
Bangs
Lot #L910402DM l-070/60/380
1030± 10 1100+30 1110±490 -COOH 67.6%
55
Perhaps the larger particles exhibit greater depolarized scattering and are weighted
more heavily in the H v measurements, but the difference between the slope- and
intercept-determined radii from the same H v data set suggests other factors. The low
magnetite content for the Polysciences spheres, coupled with their small size, results in
relatively few inclusions per particle, favoring non-symmetric distribution. M agnetite
particles appear as dark spots in transmission electron micrographs (Figure 1.2) and do
appear to be asymmetrically located in the Polysciences spheres. The density o f
magnetite, 5.2 g/cm, greatly exceeds that o f polystyrene (~ 1.05 g/cm 3 in latex form).
So we originally thought that rotation o f these particles resembles more o f a "wobble"
than a "spin." We reasoned that the friction associated with such motion should be
higher than for rotation o f a sphere about its midpoint, leading to high radius values
when Dr is interpreted via Equation 3.7. This was the assessment that appeared in our
preliminary report [3.6], It has since been pointed out [3.31] that such "wobbling"
effects are ballistic in nature. Strongly damped rotational Brownian motion should not
reflect such short-time effects. M oreover, as we pointed out originally, Eq. 3.7 from
which Dr is measured is no longer strictly correct if the optical and friction axes do not
coincide. The discrepancies in the Vv and tw o H v results are not well understood.
The refined Bangs particles were comparable in size to those in the Seradyn
sample. The slopes o f the H v and Vv plots were similar (Figure 3.3(c)) and , as for the
Seradyn sample, the three radii are in reasonably good agreement (Table 3.1).
3.3.1.2 INTERPARTICLE INTERACTIONS: NO ADDED POLYMER
The Bangs particles were selected for more detailed study. Their estimated
hydrodynamic radius ranges from 1030 A (Vv measurement) to 1 1 0 0 A (Hv
measurement). For uniform, monodisperse, spherical particles the expected radius o f
gyration would be a factor o f (3/5 ) 1 / 2 smaller—i.e., 800-850 A. In the absence o f added
salt, Guinier plots (Figure 3.4) gave radii o f gyration (Table 3.2) that are about 10%
56
larger than expected. The extra size may be attributed to heavy, strongly scattering
magnetite clusters located near the surface; the "halo" observed in TEM (Figure 1.2)
confirms that magnetite particles are located preferentially near the surface. Added salt
in the absence o f polyelectrolyte caused the magnetic latex to aggregate, leading to
steeper slopes in the Guinier plots. The aggregation was also evident from polarized
and depolarized DLS. The radii from Equation 3.1, 3.8, and 3.9 under various salt and
polyelectrolyte conditions are given in Table 3.2. The hydrodynamic values are
computed using the solvent viscosity.
Concentrating for the moment on the upper section o f the table, describing the case
where no polyelectrolyte has been added, and reading from left to right, it is observed
that all the various radii increase as salt is added.
The stability o f the magnetic latex particles in solutions that do not contain
polymer is determined by the magnetic attraction, van der Waals attraction and
electrical double layer repulsion. Magnetic latex particles have superparamagnetic
behavior; the magnetization is proportional to the external field, and none was applied.
The behavior o f superparamagnetic particles under applied magnetic fields was recently
reported by Fermigier and coworkers [3.32], Recently, this work was extended to non
steady fields [3.33], In the present case, the particles' magnetic attraction energy is
smaller than that o f the van der Waals attraction [3.34] and sedimentation o f the M LP's
is a more serious problem than the magnetic interaction, though even this was
unimportant on the time scale o f several weeks due to the low concentration and small
particle size. The aggregation o f the M LP is understood simply as a result o f screening
the electrical repulsions.
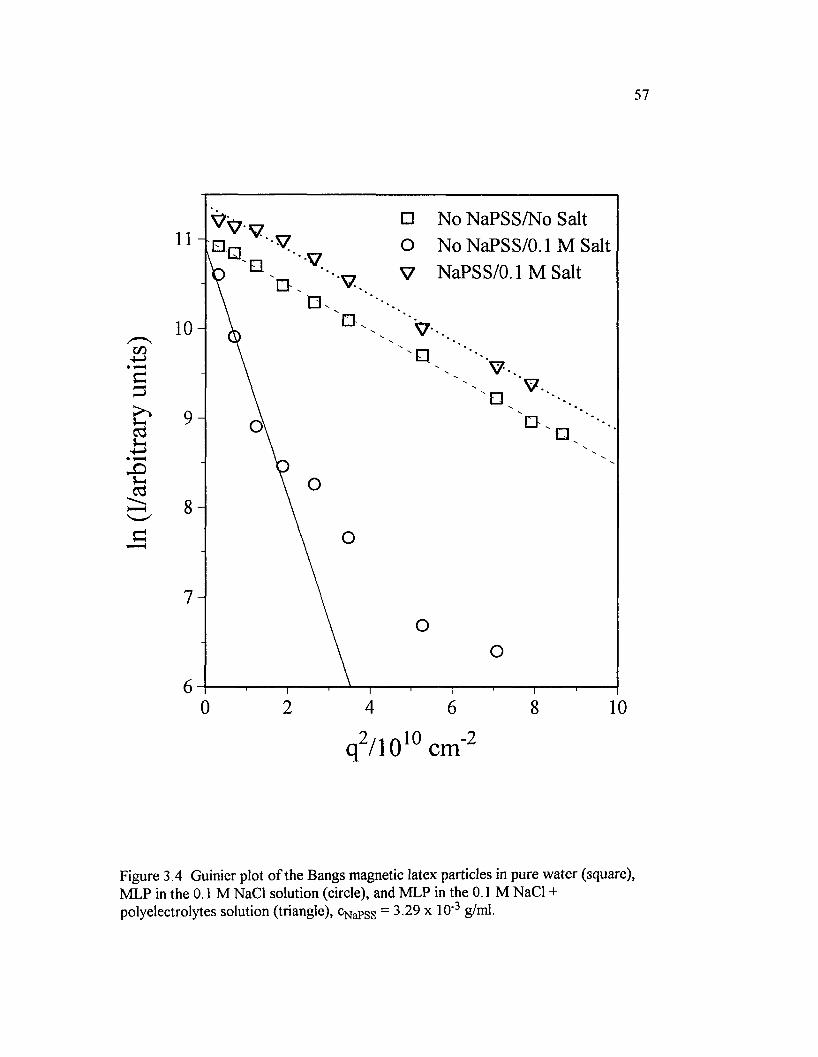
In (I/
arbi
trar
y un
its)
57
□ No NaPSS/No Salt O No NaPSS/0.1 M Salt V NaPSS/0.1 M Salt
V
1 0 -
40 2 6 8 10
q2/1010 cm"2
Figure 3.4 Guinier plot o f the Bangs magnetic latex particles in pure w ater (square), MLP in the 0.1 M NaCl solution (circle), and MLP in the 0.1 M NaCl + polyelectrolytes solution (triangle), cNaPSS = 3.29 x 10" 3 g/ml.
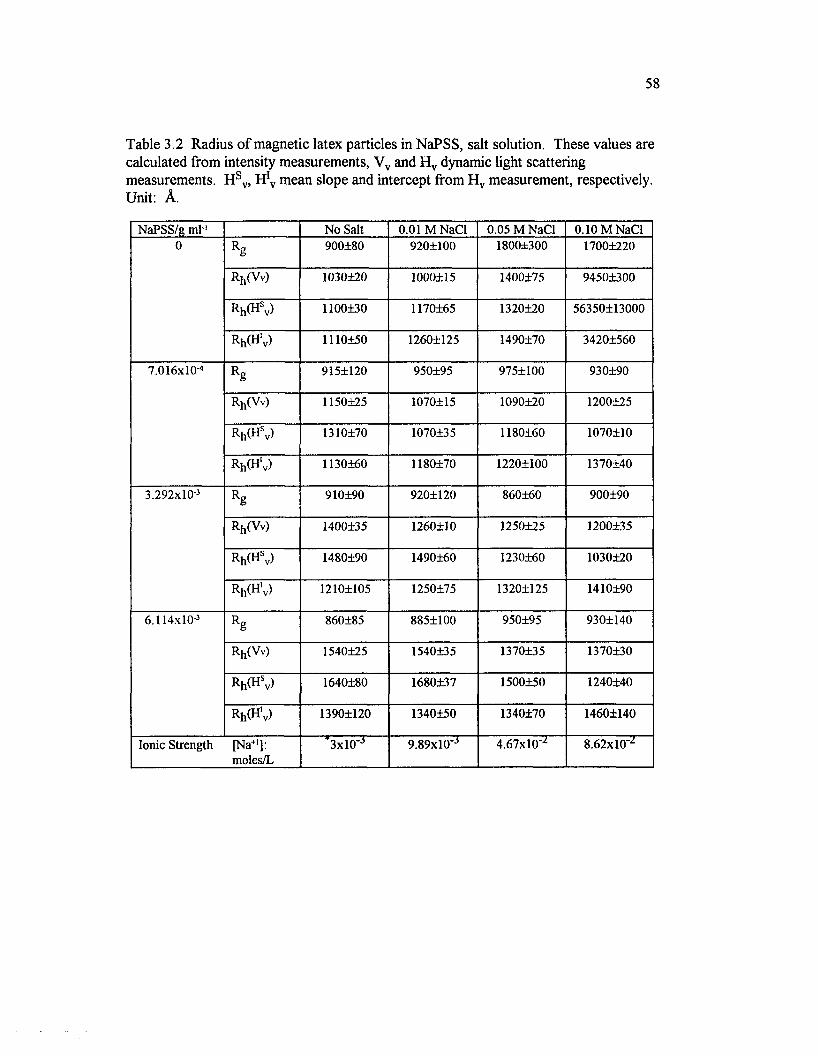
58
Table 3.2 Radius o f magnetic latex particles in NaPSS, salt solution. These values are calculated from intensity measurements, Vv and H v dynamic light scattering measurements. H sv, HJV mean slope and intercept from H v measurement, respectively. Unit: A.
NaPSS/g ml-' No Salt 0.01 M NaCl 0.05 M NaCl 0.10 M NaCl0 Rg 900±80 9201100 1800±300 17001220
Rh(Vv) 1030120 1000115 1400175 94501300
Rh(Hsv) 1100±30 1170165 1320120 56350113000
Rh(H'v) 1110±50 12601125 1490170 34201560
7.016xl0'4 Rg 915±120 950195 9751100 930190
Rh(Vv) 1150125 1070115 1090120 1200125
Rh(Hsv) 13I0±70 1070135 1180160 1070110
Rh(H'v) 1130±60 1180170 12201100 1370140
3.292xl0'3 Rg 910±90 9201120 860160 900190
Rh(Vv) 1400±35 1260110 1250125 1200135
Rh(Hsv) 1480±90 1490160 1230160 1030120
Rh(H’v) 1210±105 1250175 13201125 1410190
6.114xl0'3 Rg 860+85 8851100 950195 9301140
Rh(Vv) 1540±25 1540135 1370135 1370130
Rh(Hsv) 1640180 1680137 1500150 1240140
Rh(H'v) 13901120 1340150 1340170 14601140
Ionic Strength [Na+1]: moles/L
’3xlO*J 9.89xl0'J 4.67x10^ 8.62x10'^
59
3.3.1.3 EFFECT OF POLYELECTROLYTE
When polyelectrolyte was added to a salt-aggregated latex suspension, the
Guinier plots returned to a more gentle descent consistent with the size o f
unaggregated latex. The effect is demonstrated in Figure 3.4. It is important to
emphasize that the scattered intensity in these experiments is totally dominated by latex:
Iiatex^poiyeiectroiyte > 70. M ost H v and Vv correlation functions, as shown in Figure 3.5,
did not exhibit pronounced nonexponentiality. Figure 3.6 (a) and (b) shows the Vv and
H v measurements o f q-dependent decay rate (T) o f magnetic latex particle in different
NaPSS concentration in pure water. The average decay rates were satisfactorily linear
with q2 for both Hv and Vv correlation functions, enabling straightforward extraction o f
D t and Dr . Figure 3.7(a) and (b) show the Vv and H v measurement o f magnetic latex
particle-NaPSS solution with 0.10 M salt concentration at various polymer
concentrations. Added salt in the absence o f polyelectrolyte caused the magnetic latex
to aggregate, leading to steeper slopes in the Guinier plots. The aggregation was also
evident from polarized and depolarized DLS.
Figures 3.8 and 3.9 show the effect o f polyelectrolyte in a convenient form. In
solutions at 0.10 and 0.05 M NaCl the translational diffusion (Figure 3.8) o f the MLP
first increases with added NaPSS and then decreases. At lower salt contents, D t
decreases monotonically. This behavior is repeated for the rotational diffusion (Figure
3.9) except that the initial increase with added NaPSS is also seen for 0.01 M salt; only
at zero added salt does a monotonic decrease occur.
Following the initial increase in diffusion rate, the mobility o f the M LP is
reduced by the continued addition o f NaPSS. The SLS data show a particle radius o f
gyration consistent with unaggregated MLP. Thus, the NaPSS polymer matrix first
stabilizes the MLP in salt-containing solutions against aggregation and then slows their
motions.
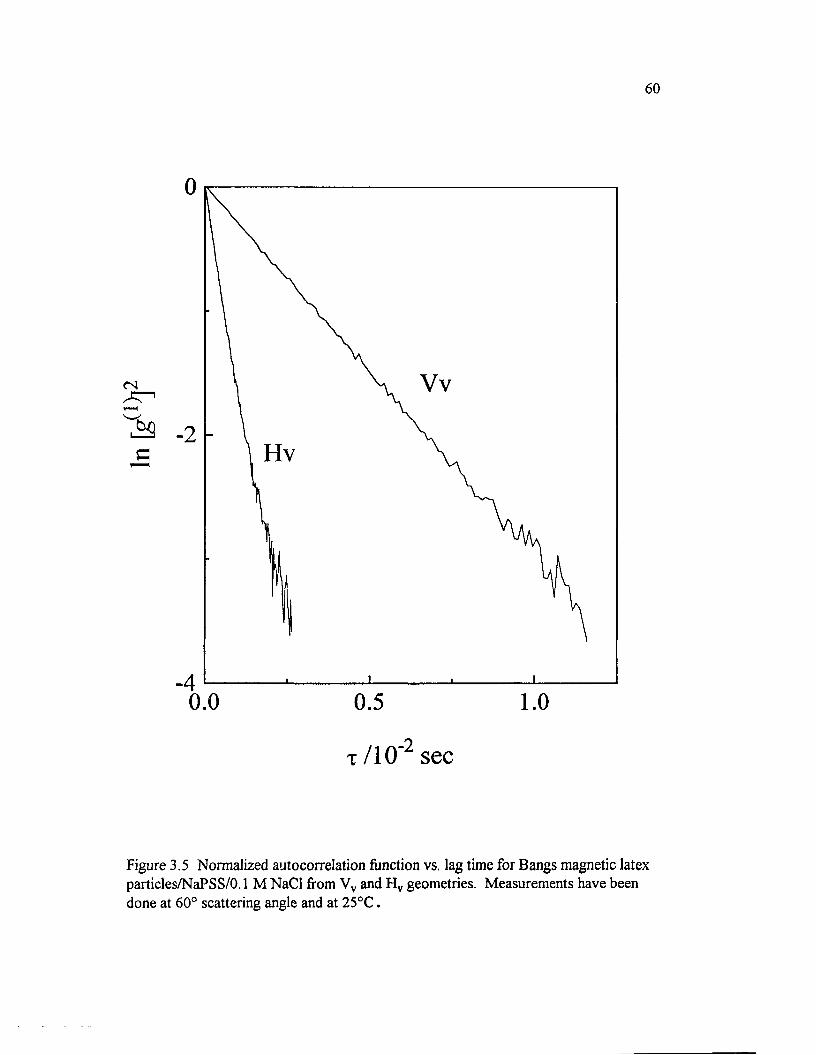
In \d
l)]
60
0
Vv
2Hv
4 ■— 0.0 0.5 1.0
t /10"2 sec
Figure 3.5 Normalized autocorrelation function vs. lag time for Bangs magnetic latex particles/NaPSS/0.1 M NaCl from Vv and H v geometries. M easurements have been done at 60° scattering angle and at 25°C .
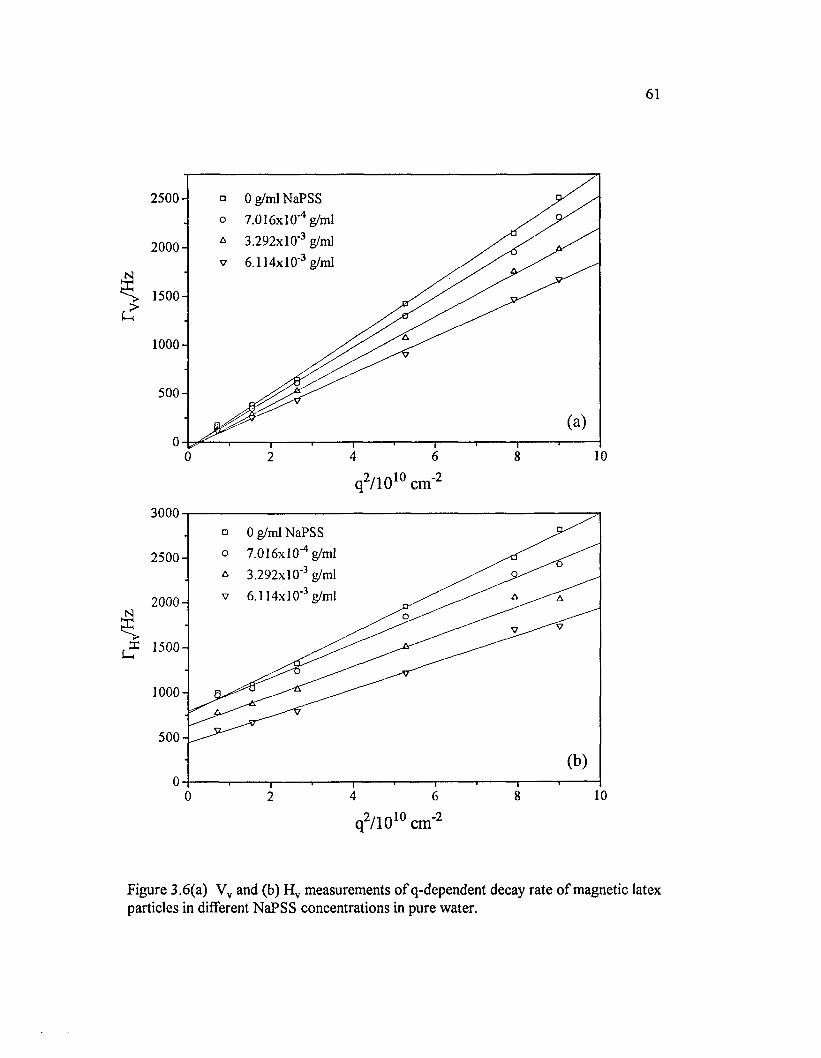
r^./
Hz
^
61
2500- Og/ml NaPSS 7.016x10^1111 3.292xl0'3 g/ml 6.114xl0‘3 g/ml
2000 -
1500-
1000 -
500-
1064 80 2
q2/1010 cm'2
30000 g/ml NaPSS 7.016x1 O' 4 g/ml 3.292x1 O’ 3 g/ml 6.114x1 O' 3 g/ml
2500-
2 0 0 0 -
1500-
1000 -
500-
104 6 80
q2/1010 cm’2
Figure 3.6(a) Vv and (b) H v measurements o f q-dependent decay rate o f magnetic latex particles in different NaPSS concentrations in pure water.

62
3000
Og/ml NaPSS 7.016X10⁻⁴ g/ml 3.292xl0'3 g/ml 6.114x1 O’ 3 g/ml
2500-
2000 -
I '(_> 1500-
1000 -
500-
0 2 4 6 8 10
q2/1010 cm*2
2500-
2000 -
1000 -
500-
0 6 82 4 10
q2/1010 cm'2
Figure 3.7(a) Vv and (b) H v measurements o f q-dependent decay rate o f magnetic latex particles in different NaPSS concentration in 0.10 M salt solution.
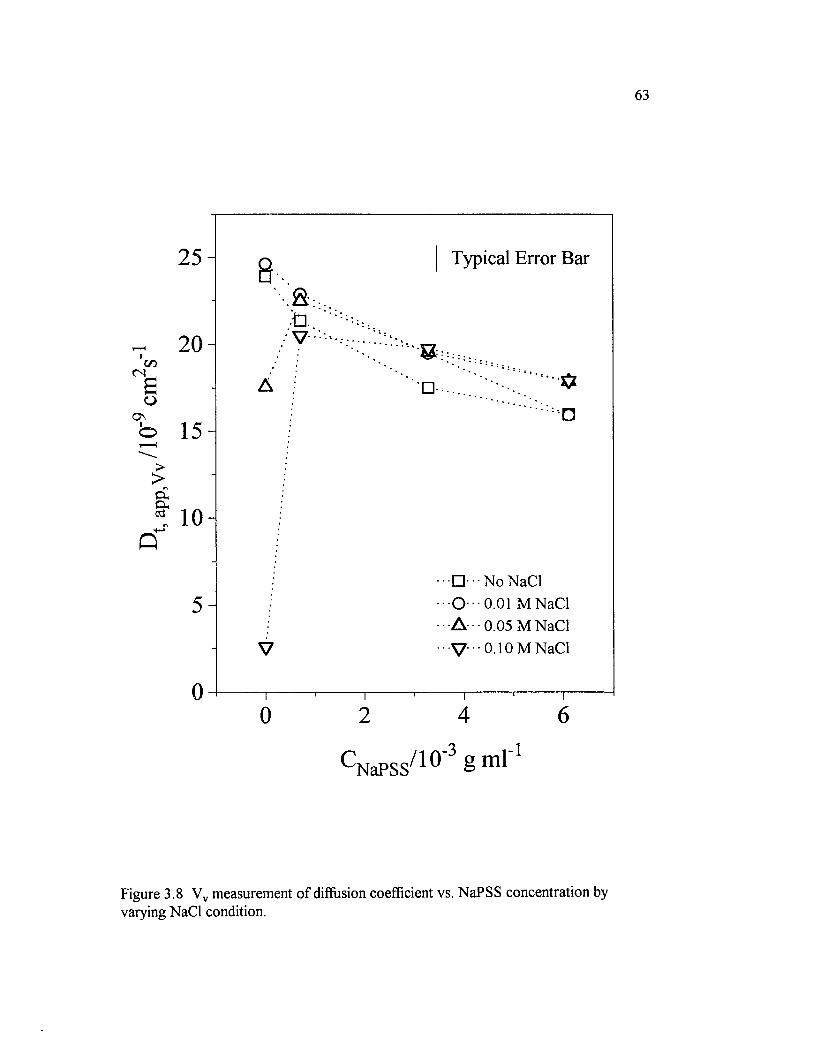
63
25-
20 -
cn
1=0
ON1o 15>>CL,Cu* 10
5-
0
8Typical Error Bar
L-I *
•O.
.......
A :
•
"""■•'■a
••••□••■No N aC l
••-O---0.01 M N aC l
•A - 0.05 M N a C l
V • • V' • ■ 0 .10 M N aC l
0 2 4 6
^ N a P S S ^ S m l
Figure 3.8 Vv measurement o f diffusion coefficient vs. NaPSS concentration by varying NaCl condition.
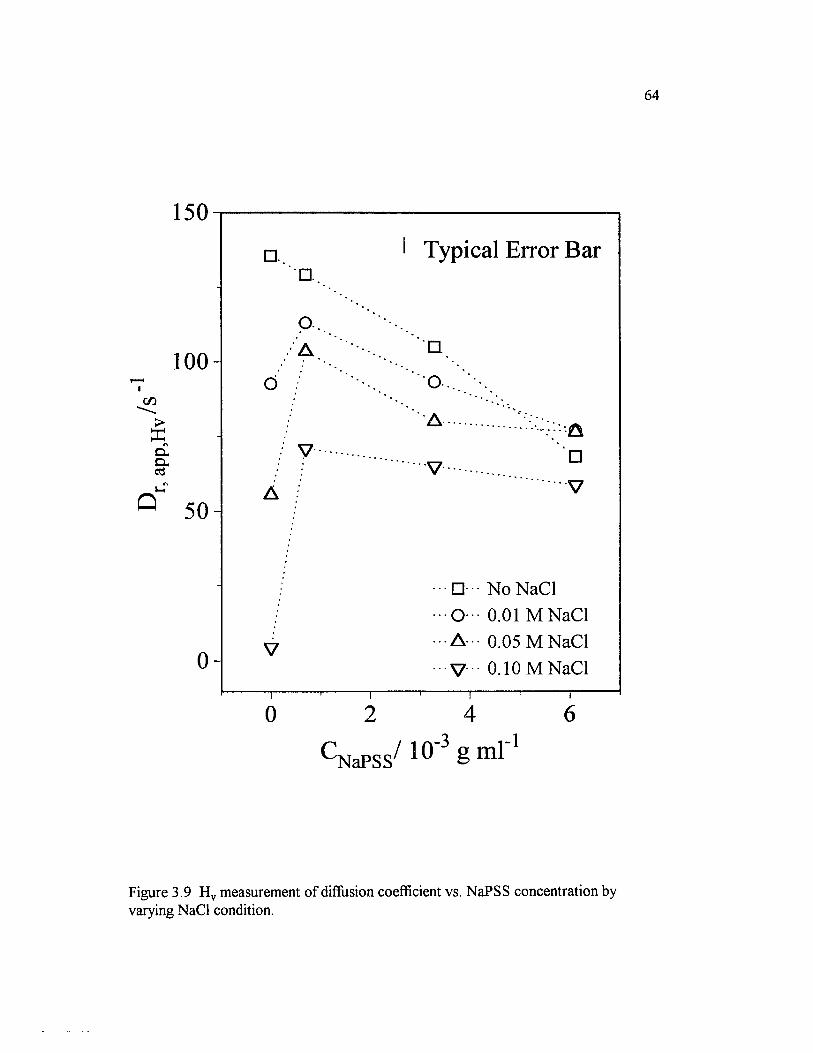
64
150
100—< i
>Eexc ied
Q 50
0
Figure 3.9 H v measurement o f diffusion coefficient vs. NaPSS concentration by varying NaCl condition.
□ .1 Typical Error Bar
p...A . Q
o
V
A
□V
A V
N o NaCl
O 0.01 M N aC l
V A 0.05 M NaCl
v 0.10 M N aC l_ i ----------------------------,----------------------------(----------------------------1-----------1-----------1----------------------------r
0 2 4 6
^ N aP S S^ ^

65
For either translational or rotational motion, the retardation with added NaPSS is
greatest at no added salt. Translational motion is reduced by about 25% while
rotational diffusion is decreased by about 50% as cNaPSS is increased from 0 to
6 mg/ml. Thus, rotational diffusion appears to be more sensitive than translational to
increases in the matrix concentration at zero added salt—a surprising result which is
admittedly, established only over a small range o f cNaPSS.
Another interesting feature is the salt dependence o f the motions at a fixed,
nonzero NaPSS concentrations. Figure 3.10 shows the results. At the tw o highest
NaPSS concentrations (up and down triangles in the figure), Dt increases slightly with
added salt while Dr decreases overall. We tentatively interpret this behavior in terms o f
the ionic atmosphere surrounding the NaPSS and its effect on how closely the MLP
can approach the like-charged polyelectrolyte chains. As salt is added, the counterion
atmosphere surrounding the NaPSS shrinks. The expression given by Odijk [3.35] and
modified by Roitman [3.36], which is strictly intended for a charged cylinder, will be
used with the understanding that only the approximate significance o f ion atmosphere
effects is sought. The effective electrostatic diameter surrounding the chain, deg-, is
predicted to be:
Here b is the distance o f charge separation along the chain contour, d0 is the hard core
where N a is Avogadro's number, I is the ionic strength o f the solution, and B e is the
Bjerrum length,
(3.11)
diameter o f the chain, which deff will approach in the limit o f high salt, k ' 1 is the
Debye-Huckel electrostatic screening length given by
k ‘ 1 = (STrNaiBg/lOOO) ' ^ 2 (in centimeters) (3.12)
ekT(3.13)
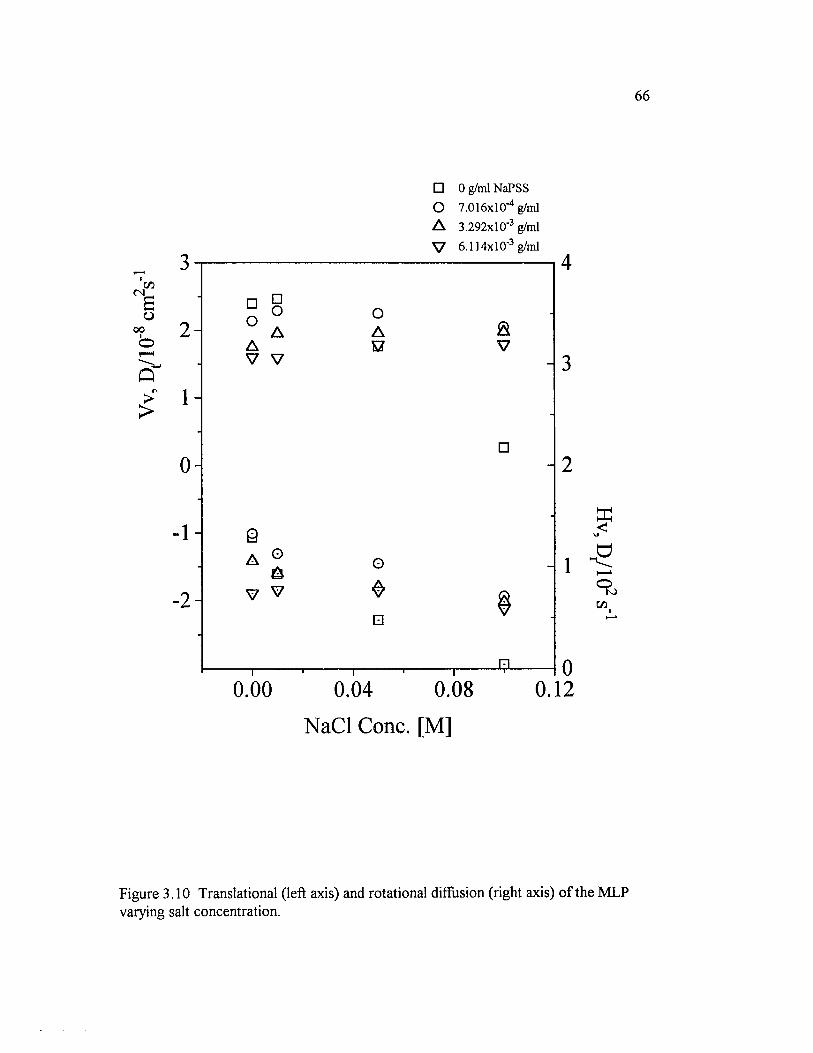
Vv,
D/1
0'8 c
m2s
'
66
□ 0 g/ml NaPSS O 7.016X10"4 g/ml A 3.292xl0'3 g/ml
- 2 -
0.120.080.00 0.04
£
C/3
NaCl Cone. [M]
Figure 3.10 Translational (left axis) and rotational diffusion (right axis) o f the MLP varying salt concentration.
67
where e is the charge o f an electron, 4.8 x 10' 1 0 esu, and e is the dielectric constant o f
the medium, 78 for water. This leads to Be = 7 A at T = 298 K. A reasonable interion
distance is b = 2.5 A [3.37] and the core diameter o f d0 = 1 2 A can be obtained,
approximately, from p 7ibd e f f 2 / 4 = M</N a where p is the polymer density (assuming p =
1 g/mL is adequate for the present purpose, as d0 is not a critical parameter) Mj, is the
monomer molecular weight, 183 g/mol for the fully ionized monomer. The effective
diameter increases from about 60 A to about 2 0 0 A as salt is decreased from 0 . 1 M to
0.01 M.
How significant is this increase, in terms o f diffusion o f the magnetic latex
probes? Many models have been devised to describe the reduction o f translational
diffusion due to space occupied by a polymeric matrix; for a sampling, see ref. [3.38],
A representative expression is Dt = D°t(l-(|)2 ) where <j)2 is the polymer volume fraction
and D°t is the translational diffusion in the simple solvent (4>2 = 0). In the case o f a
polyelectrolyte retarding the diffusion o f a like-charged probe, the polymer volume
fraction can be estimated as (j) 2 « (7ibd2 efI/ 4 )(c/M 0 )Na. When deff = d0 = 1 2 A this gives
<J)2 = c x 1 mL/g (d0 was effectively chosen to make this true). The five-fold increase to
deff = 60 A at 0 . 1 M NaCl causes a 25-fold increase in the effective value o f <}>2 while
the 16-fold increase to deff = 2 0 0 A leads to a 256-fold increase. At the maximum
concentration o f 0.006 g/mL, one finds <J>2 = 0.15 and 1.5 respectively. The latter value
is unphysical due to the many assumptions o f this oversimplified model. Nevertheless,
significant changes in D t due to changes in the effective electrostatic diameter o f the
polyelectrolyte should be expected. The effect as far as rotational diffusion goes
appears to be that the polyelectrolyte can approach the MLP more closely as salt is
added and therefore retard its rotational diffusion more effectively. Previous results on
the self diffusion o f negatively charged bovine serum albumen in the presence o f
68
negatively charged DNA also showed an increase in translational diffusion with added
salt [3.39], Rotational diffusion data were not obtained.
W e included the above section on ion atmosphere effects because o f the
difference in behavior for rotational and translational diffusion. The former is clearly a
decreasing function o f salt, while the latter depends weakly on salt, but increases
slightly at the highest cNapSS. Increasing translational diffusion with added salt could as
easily be explained by changes in the solution viscosity. Indeed, viscosity
measurements show that the increase in Dt with added salt would be larger than it is, if
viscosity were the controlling factor. The information provided by the rotational
diffusion behavior compels us to consider the ion atmosphere effects, which can explain
the decreasing rotational mobility as the result o f closer approach to the NaPSS chains.
The present work is ill-suited to test the validity o f the Stokes-Einstein relation
due to the limited range o fN aPSS concentrations. According to Equation 3.5 and 3,7,
the products Dtr| and Drr| are constants in simple fluids. Here we will comment only
that these products are not constants for M LP in the relatively dilute solution ofN aPSS
studies. M odest increases (ca. 15%) o fD tri and Drr| were observed as cNaPSS was
varied.
3.3.2 FLUORESCENCE PlIOTOBLEACHING RECOVERY
3.3.2.1 LABELING THE POLYSTYRENESULFONATE SODIUM SALT
To test for binding o fN aPSS to MLP, fluorescently tagged NaPSS was
prepared for optical tracer diffusion measurements by the fluorescence photobleaching
recovery method. Labelling had been done by Mr. A. Davila in Dr. M. L. Mclaughlin's
group in the chemistry department here at LSU. The attachment o f fluorescent dye to
NaPSS was a tw o step process [3.40], In the first step the sodium sulfonate was
substituted with the sulfonyl chloride. Next, the sulfonylchloride was reacted with an
amine containing fluorophore, fluoresceinamine isomer I (Aldrich) (Figure 3.11).
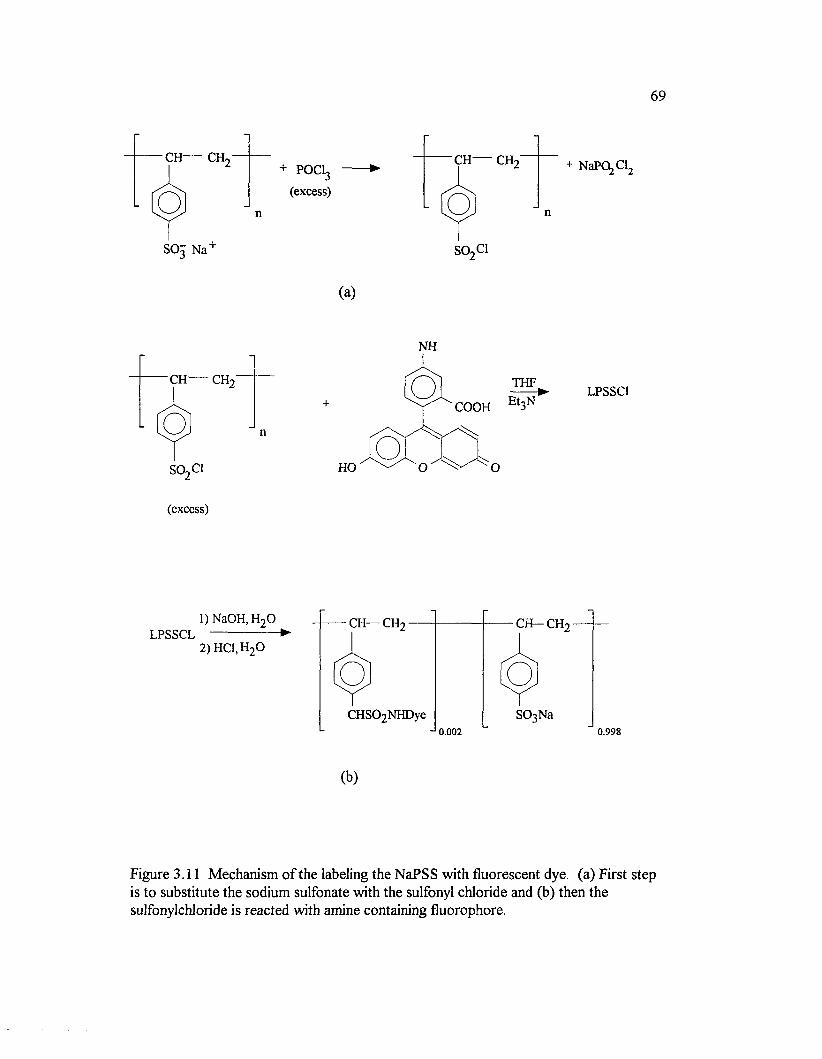
69
+ POCI3
(excess)
CH CH2"
;ojS02C1
(a)
NH
CH CH2"
s o 2 c i
+ COOH
HO
THFEt-iN
(excess)
LPSSCL1) NaOH, H20
----------------12) HC1,H20
CH— CH2 -
CHS02NHDye
- CH— CH2
SQ3Na0 . 0 0 2
(b)
NaPC^Clj
LPSSCI
0.998
Figure 3.11 Mechanism o f the labeling the NaPSS with fluorescent dye. (a) First step is to substitute the sodium sulfonate with the sulfonyl chloride and (b) then the sulfonylchloride is reacted with amine containing fluorophore.
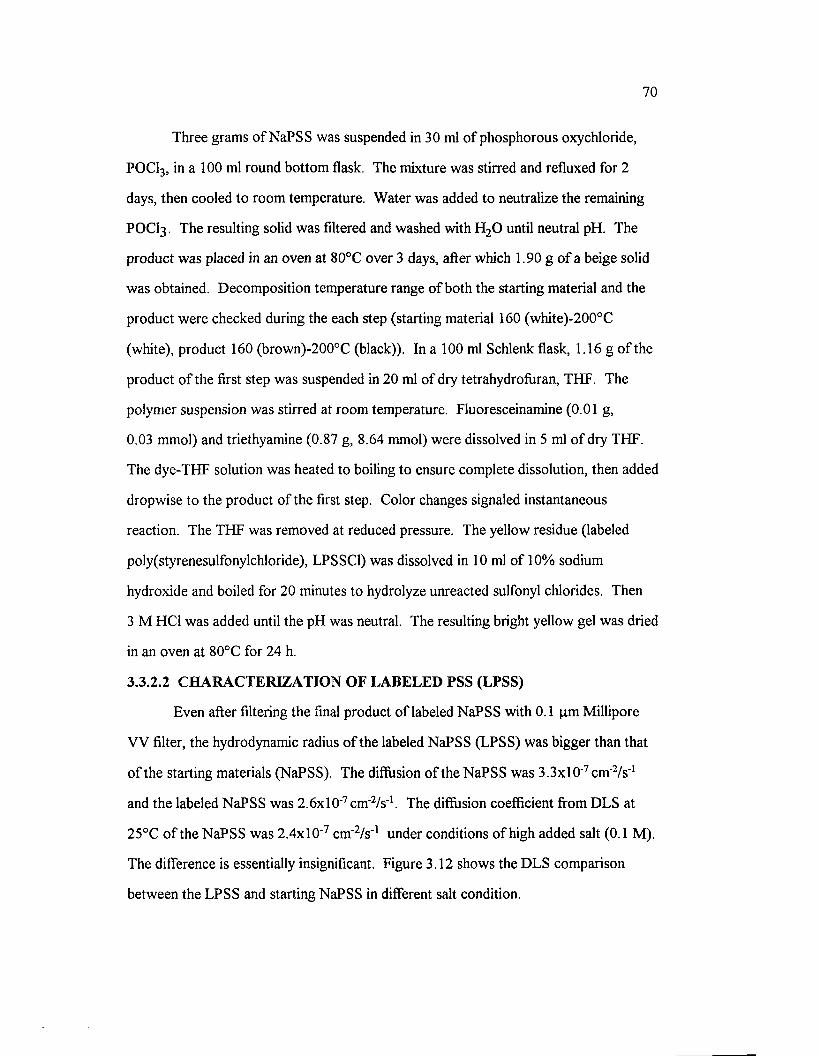
70
Three grams ofN aPSS was suspended in 30 ml o f phosphorous oxychloride,
POCI3 , in a 100 ml round bottom flask. The mixture was stirred and refluxed for 2
days, then cooled to room temperature. W ater was added to neutralize the remaining
POCI3 . The resulting solid was filtered and washed with H20 until neutral pH. The
product was placed in an oven at 80°C over 3 days, after which 1.90 g o f a beige solid
was obtained. Decomposition temperature range o f both the starting material and the
product were checked during the each step (starting material 160 (white)-200°C
(white), product 160 (brown)-200°C (black)). In a 100 ml Schlenk flask, 1.16 g o f the
product o f the first step was suspended in 20 ml o f dry tetrahydrofiiran, THF. The
polymer suspension was stirred at room temperature. Fluoresceinamine (0.01 g,
0.03 mmol) and triethyamine (0.87 g, 8.64 mmol) were dissolved in 5 ml o f dry THF.
The dye-THF solution was heated to boiling to ensure complete dissolution, then added
dropwise to the product o f the first step. Color changes signaled instantaneous
reaction. The THF was removed at reduced pressure. The yellow residue (labeled
poly(styrenesulfonylchloride), LPSSC1) was dissolved in 10 ml o f 10% sodium
hydroxide and boiled for 20 minutes to hydrolyze unreacted sulfonyl chlorides. Then
3 M HC1 was added until the pH was neutral. The resulting bright yellow gel was dried
in an oven at 80°C for 24 h.
3.3.2.2 CHARACTERIZATION OF LABELED PSS (LPSS)
Even after filtering the final product o f labeled NaPSS with 0.1 pm Millipore
VV filter, the hydrodynamic radius o f the labeled NaPSS (LPSS) was bigger than that
o f the starting materials (NaPSS). The diffusion o f the NaPSS was S Jx lO ^ cm ^ /s ' 1
and the labeled NaPSS was 2.6x1 O' 7 cm'2 /s_1. The diffusion coefficient from DLS at
25°C o f the NaPSS was 2 .4x l0 ' 7 cm ^/s ' 1 under conditions o f high added salt (0.1 M).
The difference is essentially insignificant. Figure 3.12 shows the DLS comparison
between the LPSS and starting NaPSS in different salt condition.
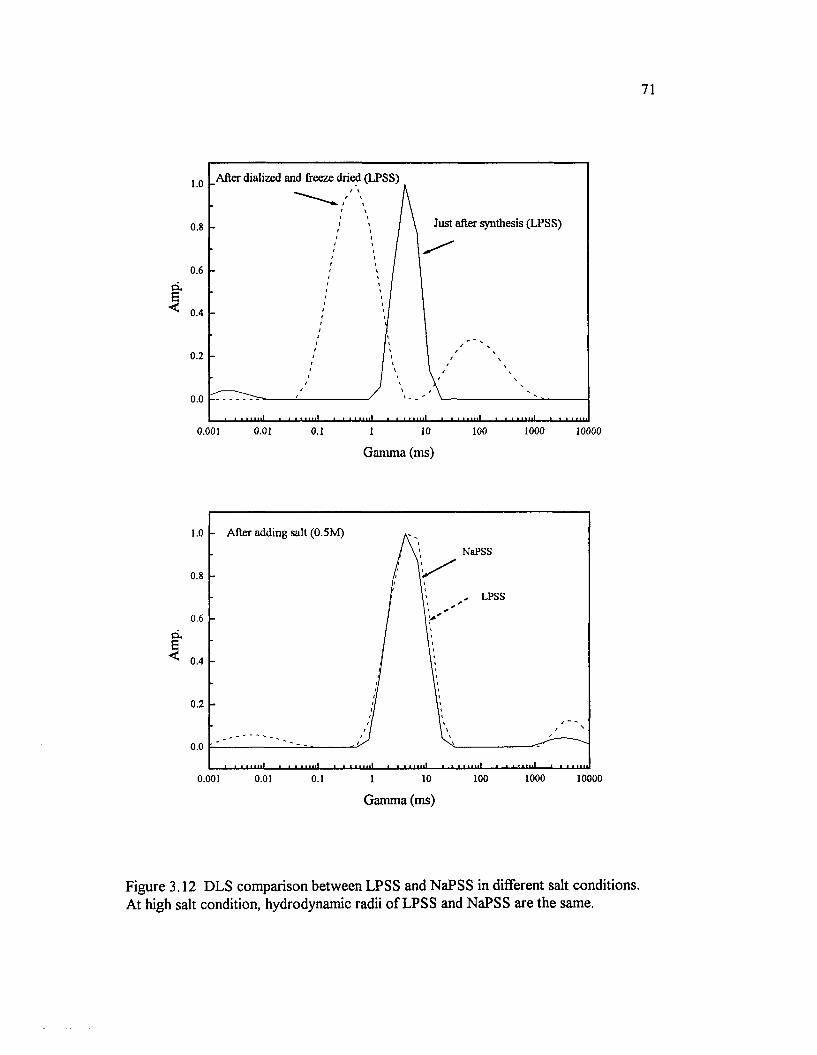
71
_After dialized and freeze dried (LPSS)1.0
Just after synthesis (LPSS)0.8
0.6
Q.|̂ 0.4
0.2
0.0
0.01 1000 100000.001 0.1 10 100
Gamma (ms)
A fte r a d d in g sa lt (0 .5 M )1.0
NaPSS
0.8
LPSS
0.6
O.
^ 0.4
0.2
0.0
1000 1000010 1000.001 0.01 0.1 1
Gamma (ms)
Figure 3.12 DLS comparison between LPSS and NaPSS in different salt conditions. At high salt condition, hydrodynamic radii o f LPSS and NaPSS are the same.
72
The visible absorption maximum o f the labeled polymer (497 nm) was close to that o f
fluorescein salt in water (491 nm). On the assumption that the absorption coefficient
was similarly unaffected, we estimate the efficiency o f dye labeling as 0.5 dyes attached
per polymer chain, corresponding to 0.24% o f monomer subunits labeled assuming a
labeled molecular weight o f 70,000. It is assumed that this low level o f dye will not
perturb the fairly structureless NaPSS random coils.
3.3.2.3 FLUORESCENCE PHOTOBLEACHING RECOVERY MEASUREMENT
The FPR instrument, conceptually similar to that o f Lanni and W are [3.41] has
been described recently [3.42], During measurement, an intense laser beam briefly
illuminates a coarse diffraction grating placed in the rear focal plane o f an
epifluorescence microscope to generate, by photobleaching, a square wave pattern o f
spacing L in the fluorescent sample. Then the grating is translated at a constant speed
and projected into the sample by a less intense beam. As its image falls into and out o f
coincidence with the bleached pattern, a weak ac signal is produced, on top o f a large
dc baseline from the unbleached fluorophores, at the anode o f a photomultiplier tube
that monitors the illuminated region. Initially, the ac signal resembles a triangle wave.
As bleached and unbleached diffusers move about, the contrast o f the bleached pattern
is reduced. The ac signal loses its sharp edges and approaches a sine wave. The wave
amplitude o f the fundamental component decays at a rate, T f, proportional to the
diffusion coefficient o f the fluorescent diffusers [3.41]: ac( t) = ac(0)exp(-rjt), with K
= 27i/L and T = DK2. The spatial frequency K may be varied by changing the coarse
diffraction grating or the microscope objective. Bleach depth (the percentage o f dyes
photobleached) was less than 25% for all the measurements, and this level o f
photobleaching was reached with exposure times less than 0 .1 5 P 1 The present
conditions will be adequate for our purposes. The decay rate T is obtained by fitting
73
the wave amplitude o f the fundamental to a single exponential with floating baseline,
using a M arquardt nonlinear least squares algorithm. LNaPSS was measured in water
at several K values, and T varied linearly with K2, indicating that chemical recovery o f
the dye and/or convection were insignificant. M ost experiments with LNaPSS in MLP
solutions were conducted at just one K value. All FPR measurements were at 25.0 ±
0.2°C.
3.3.2.4 STABILIZATION MECHANISM
The most intriguing aspect o f the combined SLS and DLS results is the
stabilization o f M LP against salt-induced aggregation that is effected by NaPSS. This
result is independent o f the order o f mixing: NaPSS will prevent salt-induced
aggregation o f M LP—or undo it if it has already occurred. It seems likely that the MLP
may have adsorbed surfactants or oligomers o f unknown composition in order to
prevent strong binding in the flocculated state. W e are aware o f just one other report
where dilute polymer caused salt-flocculated colloids (deliberately stabilized against
very tight binding) to be resuspended [3.43], In the present case (and probably also in
Ref. [3.43]) it is expected that this stabilization effect is due to free polymer. The
reasoning in the present case is that both M LP and NaPSS are negatively charged. It is
possible that poorly sulfonated zones could bind to weakly charged patches on the latex
particles o r displace some previously attached stabilizer, leading to a sort o f steric
stabilization. However, elemental analysis suggests that such poorly sulfonated zones
are virtually absent from this sample ofN aPSS. Also, the magnetic latex particles used
in this experiment have high charge density and tight parking area (« 3A2/COOH
group). Still, it was decided to test for possible binding by monitoring the diffusion o f
fluorescently labeled NaPSS (LNaPSS) in the presence o f the latex spheres using FPR.
74
Any LNaPSS that is permanently bound to the purified Bangs M LP would
diffuse some 10 times more slowly than free LNaPSS. In this case, the fluorescence
recovery would be characterized by tw o exponential signals:
A C (t) = xf exp"K2Dft+ xb exp-KDb‘ (3.14)
where AC(t) is the magnitude o f the ac signal produced by the modulation detector
(see experimental section) and xf and xb are mole fractions, and D f and D b the diffusion
coefficients, o f LNaPSS that are free and bound, respectively. It is assumed that the
fluorescence intensity and photobleaching efficiency are not modified by the binding
process. I f the LNaPSS undergoes rapid exchange with the M LP on the time scale o f
the FPR measurement, several tens o f seconds as performed here, then a single
exponential recovery profile will be observed, and an average diffusion coefficient will
be obtained: D avg = xbD b + X(Df.
Figure 3.13 shows an FPR trace from a solution containing LNaPSS and Bangs
MLP. The semilogarithmic representation demonstrates that the trace is effectively
single exponential. The inset shows a linear increase in recovery rate with K 2 and zero
intercept, characteristic o f pure diffiisional relaxation o f the pattern photobleaching.
The average diffusion coefficient is effectively that o f the free LNaPSS and this remains
true even at very low concentrations o f LNaPSS and high concentrations o f MLP.
Figure 3.14 shows the diffusion coefficient o f LNaPSS as a function o f the quotient o f
total particle surface area and the area required to bind all LNaPSS molecules to a
surface. The former area (per unit volume o f solution) is simply vMLP(4 7 rR2MLP),
where symbols v and R represent the number density and hydrodynamic radius,
respectively. The number density was computed using a density o f 2 g/ml for the M LP
(the actual density o f the unrefined Bangs particles is 2.27 g/ml).
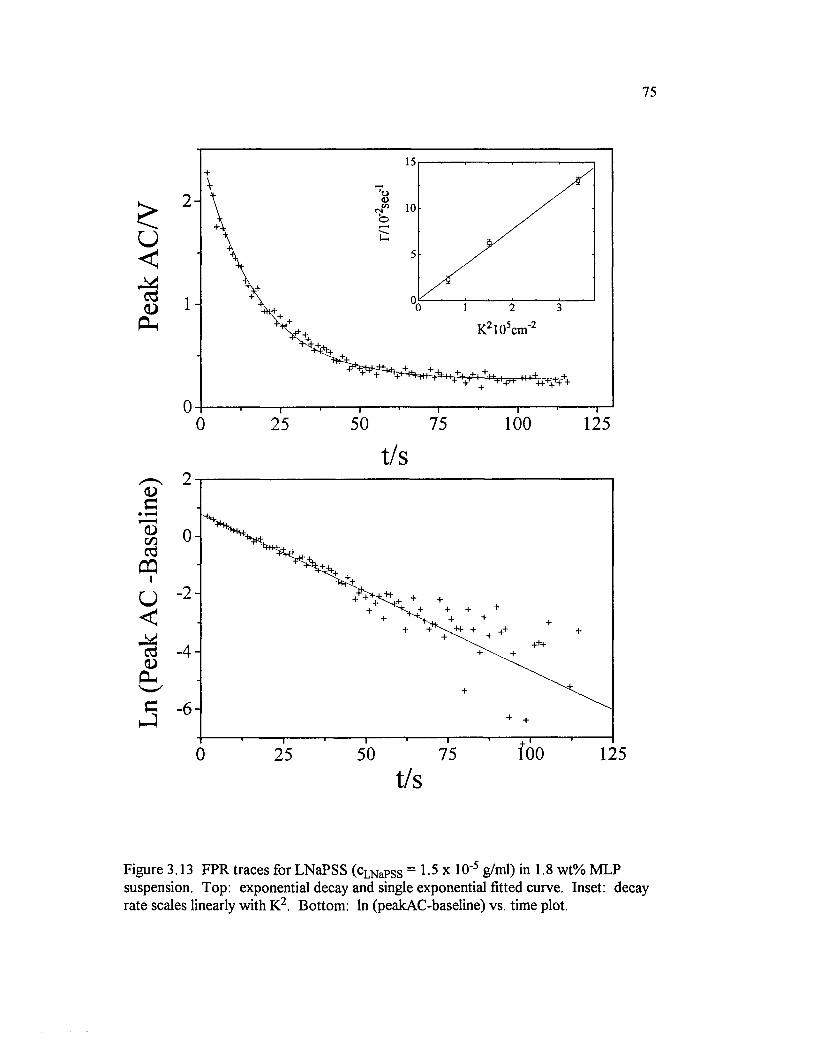
Ln (P
eak
AC
-Bas
eline
) Pe
ak
AC
/V
75
2
1
0
100 125500 25 75
t/s
- 2 -
■H* ++++-4-
- 6 -
100 125
Figure 3.13 FPR traces for LNaPSS (cLNapss = 15 x 10' 5 g/ml) in 1.8 wt% MLP suspension. Top: exponential decay and single exponential fitted curve. Inset: decay rate scales linearly with K2. Bottom: ln (peakAC-baseline) vs. time plot.
76
The area required to bind all the polymer was computed as vLNapSS(4 7 tR 2 LNapSS) and
the relation vLNaPSS = N a(cLNapSS/M w) where N a is Avogadro's number and M w is the
weight average polymer molecular weight, 70,000. Thus, the area covered by an
LNaPSS molecule is the projection o f the expanded LNaPSS chain in solution onto a
surface. It is understood that the actual area covered per chain may differ due to
conformational changes associated with binding and/or interpenetration o f chains.
Also, our simple model does not take into consideration polydispersity o f the LNaPSS,
surface roughness o f the M LP due to near-surface magnetite inclusions, or possible
curvature effects for the two MLP sizes used to generate Figure 3.14 (unrefined
0.8 pm Bangs latex spheres were used at the highest concentrations). In brief, the area
quotient o f Figure 3.14 is not absolute, but represents a fixed set o f assumptions.
However, those assumptions do give to surface-bound LNaPSS a generous area— and
still there is, at the highest M LP concentrations, more than enough area at the surface
o f the MLP to accommodate all LNaPSS chains. Yet there is no decrease in the
average diffusion coefficient to signal that any chains are bound, and no
nonexponentiality to indicate permanent binding. Specific binding o f LNaPSS to MLP,
either permanent or by rapid exchange, seems unlikely.
3.4 SUMMARY
The DLS and SLS results from the M LP/NaPSS system show : 1) translational
and rotational diffusion coefficients o f magnetic latex particles are decreased by
increasing the matrix concentration at the no salt condition; 2 ) the diffusion o f magnetic
latex particles in the no NaPSS condition is abruptly dropped by increasing the salt
concentration to 0.1 M, and static light scattering data shows aggregation o f the
particles in high salt conditions when there is no NaPSS; 3) aggregation o f the particles
can not be observed and diffusion increases with increasing NaPSS concentration in
high ionic strength systems.
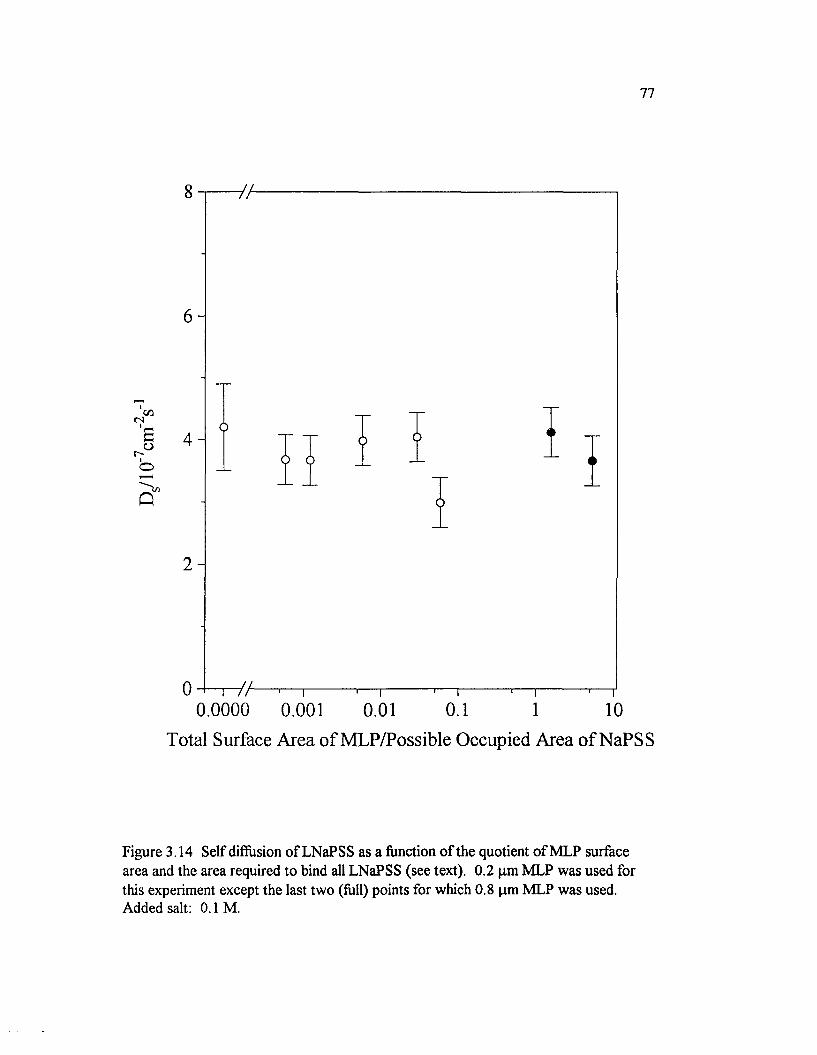
77
cs's0r-1o
£ r
8
6
4
2
0.0000 0.001 0.10.01 1 10Total Surface Area of MLP/Possible Occupied Area of NaPSS
Figure 3.14 Self diffusion o f LNaPSS as a function o f the quotient o f M LP surface area and the area required to bind all LNaPSS (see text). 0.2 pm M LP was used for this experiment except the last tw o (full) points for which 0.8 pm M LP was used. Added salt: 0 . 1 M.

78
These inter-particle interactions are caused by the der Waals attraction and the
electrical repulsion.
The polymer stabilization o f the particle flocculation in this experiment may be
governed by the electrically free polymer rather than the steric mechanism. Based on
the self diffusion coefficient o f the FPR measurement, the depletion stabilization o f the
M LP in the polyelectrolyte matrix has been proposed.
79
3.5 REFERENCES
3.1 (a) L. B. Bangs, "Uniform Latex Particles," Seradyn Inc., Indianapolis, IN 1984.
(b) General Booklet o f Rhone-Poulenc, "Estapor," 1987.
3.2 (a) M. Fermigier and A. P. Gast, J. Coll. Inter. Sci. 154, 552 (1992).
(b) M. Fermigier and A. P. Gast, J. Magnetism and Magnetic Materials 122, 46 (1993).
(c) D. W irtz and M. Fermigier, Phys. Rev. Lett. 72, 2294 (1994).
3.3 (a) G. D. J. Phillies, J. Phys. Chem. 93, 5029 (1989).
(b) P. S. Russo, M. Mustafa, T. Cao, and L. K. Stephens, J. Coll. Inter. Sci. 120,122(1988).
(c) S. Gorti and B. R. Ware, J. Chem. Phys. 83, 6449, (1985).
3.4 R. Piazza, J. Stavans, T. Bellini and V. Degiorgio, Optics Comm. 73, 263 (1989).
3.5 (a) M. M ustafa and P. S. Russo, J. Coll. Inter. Sci. 122, 120 (1988).
(b) T-H. Lin and G. D. J. Phillies, Macromolecules 17, 1686 (1984).
(c) W. Brown and R. Rymden, Macromolecules 19, 2942 (1986).
3.6 D. Sohn, M. L. DeLong, and P. S. Russo, Mat. Res. Soc. Sym. Proc. 248, 247(1992).
3.7 J. C. Brown, P. N. Pusey, J. W. Goodwin, and R. H. Ottewill, J. Phys. A: Math. Gen. 8(5), 664 (1975).
3.8 R. Krause, G. Nagele, D. Karren, J. Schneider, R. Klein, and R. W eber, PhysicaA 153, 400 (1988).
3.9 E. J. W. Verwey and J. T. G. Overbeek, "Theory o f the Stability o f Lyophobic Colloids," Elservier Publishing, NY, 1948.
3 .10 D. H. Napper, "Polymer Stabilization o f Colloidal Dispersion, Academic Press," London, 1983.
3.11 J. E. Johnson and E. Matijevic, Coll. Polym. Sci. 270, 364 (1992).
3.12 M. Sedlak and E. J. Amis, J. Chem. Phys. 96(1), 826 (1992)
3.13 J. M eadows, P. A. Williams, M. J. Garvey, and R. Harrop, J. Coll. Inter. Sci. 148(1), 160(1992).
80
3.14 K. Furusawa, Z. Shou, and N. Nagahashi, Coll. Polym. Sci. 270, 212 (1992).
3.15 H. Inoue, H. Fukke, and M. Katsumoto, J. Coll. Inter. Sci. 148(2), 533 (1992).
3.16 (a) S. Asakura and F. Oosawa, J. Chem. Phys. 22, 1255 (1954).
(b) S. Asakura and F. Oosawa, J. Poly. Sci. 33, 183 (1958).
(c) A. P. Gast, C. K. Hall, W. B. Russel, J. Coll. Inter. Sci. 96, 251 (1983).
3.17 R. I. Feigin and D. H. Napper, J. Coll. Inter. Sci. 75, 525, (1980).
3.18 (a) F. Oosawa, "Polyelectrolytes." Marcel Dekker Inc., N .Y ., 1971.
(b) N. A. Rotstein and T. P. Lodge, Alacromolecules 25, 1316 (1992).
(c) J. Newman and K. L. Schick, Biopolymer 28, 1969 (1989).
(d) R. Bansil, S. Pajevic, and C. Konak, Macromolecules 23, 3380 (1990).
3.19 (a) R. S. Koene and M. Mandel, Macromolecules 16, 220 (1983).
(b) R. S. Koene, H. W. J. Smit, and M. Mandel, Chem. Phys. Letters 74(1), 176 (1980).
3.20 (a) M. Drifford and J. -P. Dalbiez, Biopolymers 24, 1501 (1985).
(b) M. Drifford and J. -P. Dalbiez, J. Phys. Chem. 8 8 , 5368 (1984).
3.21 (a) W. B. Russel, "The Dynamics o f Colloidal Systems," Univ. o f WisconsinPress, WI, 1987.
(b) T. Sato and R. Ruch, "Stabilization o f Colloidal Dis persions by Polymer Adsorption," Marcel Dekker, Inc., N.Y., 1980.
3.22 R. Buscall, J. Chem. Soc. Faraday Trans. 1, 77, 909 (1981).
3.23 (a) A. Guinier and G. Foum et, "Small-Angle Scattering o f X-rays," John Wileyand Sons, NewYork, 1955.
(b) M. Kerker, "The Scattering o f Light and Other Electromagnetic Radiation," Academic Press, N ew York, Ch. 8 , 1969.
3.24 B. Berne and R. Pecora, "Dynamic Light Scattering." Wiley, N ew York, 1976.
3.25 P. S. Russo, M. J. Saunders, L. M. DeLong, S. K. Kuehl, K. H. Langley, and R. W. Detenbeck, Anal. Chem. Acta 189, 69 (1986).
3.26 C. Tanford, "Physical Chemistry o f Macromolecules," Wiley, N ew York, 323 (1961).
81
3.27 (a) T. -L. Lin and G. D. J. Phillies, Macromolecules 17, 1686 (1984).
(b) G. S. Ullmann, K. Ullmann, R. M. Lindner, and G. D. J. Phillies, J. Phys. Chem. 89, 692 (1985).
(c) P. S. Russo, L. K. Stephens, T. Cao, and M. Mustafa, J. Coll. Int. Sci. 122, 120 (1988).
3.28 B. Bem e and R. Pecora, "Dynamic Light Scattering." Wiley. New York, 1976.
3.29 D. E. Koppel., J. Chem. Phys. 57, 4814 (1972).
3.30 J. -C, Daniel, J. -L, Schuppiser, and M. Tricot, U. S. Patent, Nov. 9, 4,358,388 (1982).
3.31 Personal communication with S. R. S. Aragon at San Francisco State University.
3.32 a) M. Fermigier and A. P. Gast, J. Coll. Inter. Sci. 154, 552 (1992).
b) M. Fermigier and A. P. Gast, J. Magnetism and Magnetic Materials 122, 46 (1993).
3.33 D. W irtz and M. Fermigier, Phys Rev. Lett. 72, 2294 (1994).
3.34 R. E. Rosensweig, "Ferrohydrodynamics," Cambridge, N.Y., 49 (1985).
3.35 T. Odijk, Macromolecules 19, 2313 (1986).
3.36 D. B. Roitman, R. A. Wessling, and J. McAlister, Macromolecules 26, 5174(1993).
3.37 N. Borochov and H. Eisenberg, Macromolecules 27, 1440 (1994).
3.38 S. Pickup and F. D. Blum, Macromolecules 22, 3961 (1989).
3.39 M. R. W attenbarger, V. A. Bloomfield, Z. Bu, and P. S. Russo, Macromolecules 25, 5263 (1992).
3.40 Organic Synthesis I. 84.
3.41 F. Lanni and B. R. Ware, Rev. Sci. Instrum. 53(6), 905 (1982).
3.42 Z. Bu and P. S. Russo, Macromolecules 27, 1187 (1994).
3.43 J. E. Seebergh and J. C. Berg, Langmuir 10, 454 (1994).
CHAPTER 4
KINETIC STUDIES OF MAGNETIC LATEX PARTICLES' SELF ASSEMBLY UNDER APPLIED MAGNETIC FIELD
82
83
4.1 INTRODUCTION
The formation o f large clusters by the union o f many separate, small elements
includes a wide variety o f processes in polymer science, in colloidal physics, and in
materials science. These aggregation processes have been studied for a long time with
computer simulation using scaling and fractal concepts, or experimentally with optical
microscopy and scattering techniques. Kinetic studies o f these aggregation processes
mainly involve the determination o f the cluster sizes on a certain time scale, s(t), and
the cluster size distribution function, N(t). Based on the theoretical and experimental
methods, diffusion limited (DLA) and reaction limited (RLA) aggregation models have
been proposed [4.1]. Gelation and colloid aggregation are examples o f spontaneous
aggregation processes. An induced electric or magnetic field also changes the kinetics
o f the cluster growth.
Electric field induced kinetic studies have been performed mainly on
electrorheological (ER) fluids, which consist o f a suspension o f fine dielectric particles
in a liquid o f low dielectric constant and low viscosity [4.2], In a large electric field, a
few kV/mm, polarized particles first form chains along the field lines to form a one
dimensional solid, and these chains slowly aggregate to form columns. The apparent
viscosity o f the fluid increases dramatically in the presence o f an applied electric field.
These phenomena were first reported by Winslow in 1949, and so are referred to as the
"Winslow effect." In the past decade many industrial applications have been
implemented such as variable transmissions, shock absorbers, variable pumps, and so
on [4.3],
The dipole interactions o f polarizable and magnetizable particles are basically
identical when the particles are uniform spheres. In the presence o f an electric field,
induced dipole moment changes proportionally with the strength o f external field E
[4.4]

84
M- = e wRE p E w
ep + 2 ew(4.1)
where e^ ,, 8 p are the complex dielectric constants o f the solvent and the particle,
respectively, R is the radius o f the sphere, and E is the electric field.
In the case o f a magnetic field,
p = p 0 - j 7 d l V (4.2)
where % is the magnetic susceptibility, p 0 is the magnetic permeability o f the vacuum,
and H is the external field. For some magnetic fluids, for example ferrofluids, it has
been found that large agglomerates o f particles are formed in the presence o f a weak
magnetic field. The needle-like agglomerates appear when a field o f several Gauss is
applied. The needle-like structures disappear when the magnetic field is removed. This
is because o f the paramagnetism o f the particles. Many investigations o f aggregation in
ferro-fluids have been carried out using experimental and computational methods [4.5],
Two basic considerations o f the magnetic field studies and a general approach to the
cluster aggregation are dealt with in the next section.
4.2 KINETIC MECHANISM AND THEORY
4.2.1 M E C H A N IC A L C O N C EPTS
D e Gennes and Pincus applied mechanical considerations to identical spherical
ferromagnetic grains o f radius R (diameter d) suspended in a magnetically passive
liquid [4.6], W hen the particles do not carry any electrostatic charge, the dipole-dipole
interaction at distance a is defined through a dimensionless constant X. Neglecting
higher order interactions, tw o spheres with aligned identical dipole moments |i interact
through a potential energy at closest distance,
(j. = M(rca3 / 6 ), where M is magnetization, 0 is the angle between dipole moment and
center-to-center vector, and X is proportional to the volume per grain. From Equation
4.2 and 4.3,
where the magnetic susceptibility, x, can be determined by a magnetophoresis
experiment or data o f Bossis et al. [4.7], The mean number o f particles, s(t), in an
equilibrium chain depends on the dipole strength.
These concepts and theoretical considerations were extended by Jodan [4.8] and
Krueger [4.9], and their predictions have been supported by several experiments such
as light scattering [4.10], microscopy [4.11], and pulsed magnetization [4.12],
4.2.2 PH A SE TR A N SITIO N C O N C EPTS
K. Sano and M. Doi explained these phenomena with the concept o f the gas-
liquid phase transition, the gas phase o f magnetic particles is transformed to the liquid
phase by the magnetic field [4.13], They consider a) the dipole-dipole interaction (X'),
b) the dipole-field interaction (h = p/Z/kT), and c) the van der W aals interaction (e') and
discuss the phase boundary with following equation,
where oc = V/N is the volume per particle in the most closely packed state; v is the
coordination number; c = Np/N where N p is the number o f the particle in the system; m
= M tot/Npp, m = 1 is the state o f the magnetic moment if the particles are completely
aligned; N p is the number o f the particles in the system; M tot is the total magnetization;
^ U (a = 2R ,6 ~ 0) ftp 0 R V #3 2 r j 2
kT 9kT(4.4)
2 9
s ( t)= 1 - — 4>X exp(2X)-l
(4.5)
(4.6)
86
X is the dipole-dipole interaction parameter; and e is the van der Waals' contribution.
The phase separation o f the ferromagnetic fluid is described by the dipole-dipole
interaction (X'), and van der W aals interaction (s'). They predict that phase separation
occurs for finite magnetic field strength at very large values o f X.
4.2.3 KINETIC CONSIDERATIONS
In the DLCA model, clusters stick to each other irreversibly and immediately,
and the kinetics is limited by only the diffusion o f the cluster. The fractal dimension, df,
in this case is ~ 1.75±0.05. In the RLCA case, the sticking probability is much less than
unity, so many collisions will occur before two clusters link together. These dynamics
are much slower and df ~2.05±0.05. Fractal geometry is a natural description for
disordered objects ranging from macromolecules to the earth's surface [4.14],
Experimentally, colloid particles like gold clusters [4.15], sol-gel transitions with silica
aerogel [4.16], and magnetic particles like ferromagnetic particles have been considered
for the study o f tw o or three dimensional fractal structure. These kinetic theories are
extended to monomer-cluster and cluster-cluster processes.
The kinetics o f field induced cluster aggregation processes is based on the
diffusion limited model by M eakin [4.17] and Kolb et al. [4.18]. These m ethods are
developed for the cluster size distribution function, s(t), using the number o f cluster,
N(t), and size s at time t.
s(t) = Z N ( t ) s 2 octz (4.7)£ N ( t ) s
Two-dimensional simulation results show the mean cluster size, s(t), scales according
to time with the exponent z. For the actual fitting in the experiment, we use the
following equation.
s(t) = s(0)[l + ( t / T ) z ] (4.8)
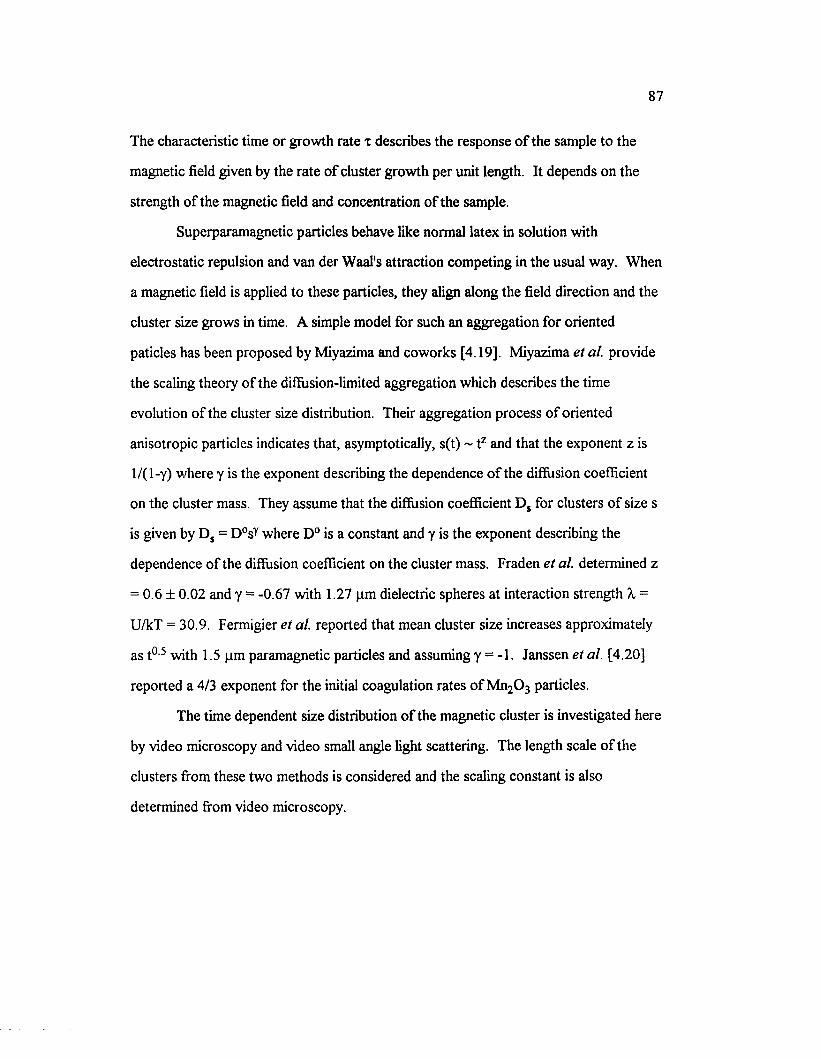
87
The characteristic time or growth rate x describes the response o f the sample to the
magnetic field given by the rate o f cluster growth per unit length. It depends on the
strength o f the magnetic field and concentration o f the sample.
Superparamagnetic particles behave like normal latex in solution with
electrostatic repulsion and van der Waal's attraction competing in the usual way. When
a magnetic field is applied to these particles, they align along the field direction and the
cluster size grows in time. A simple model for such an aggregation for oriented
paticles has been proposed by Miyazima and coworks [4.19]. Miyazima et al. provide
the scaling theory o f the diffusion-limited aggregation which describes the time
evolution o f the cluster size distribution. Their aggregation process o f oriented
anisotropic particles indicates that, asymptotically, s(t) ~ tz and that the exponent z is
1 / ( 1 -y) where y is the exponent describing the dependence o f the diffusion coefficient
on the cluster mass. They assume that the diffusion coefficient D , for clusters o f size s
is given by D s = D°sY where D° is a constant and y is the exponent describing the
dependence o f the diffusion coefficient on the cluster mass. Fraden et al. determined z
= 0.6 ± 0.02 and y = -0.67 with 1.27 pm dielectric spheres at interaction strength X =
U/kT = 30.9. Fermigier et al. reported that mean cluster size increases approximately
as t0 5 with 1.5 pm paramagnetic particles and assuming y = -1. Janssen et al. [4.20]
reported a 4/3 exponent for the initial coagulation rates o f Mn2 C> 3 particles.
The time dependent size distribution o f the magnetic cluster is investigated here
by video microscopy and video small angle light scattering. The length scale o f the
clusters from these two methods is considered and the scaling constant is also
determined from video microscopy.
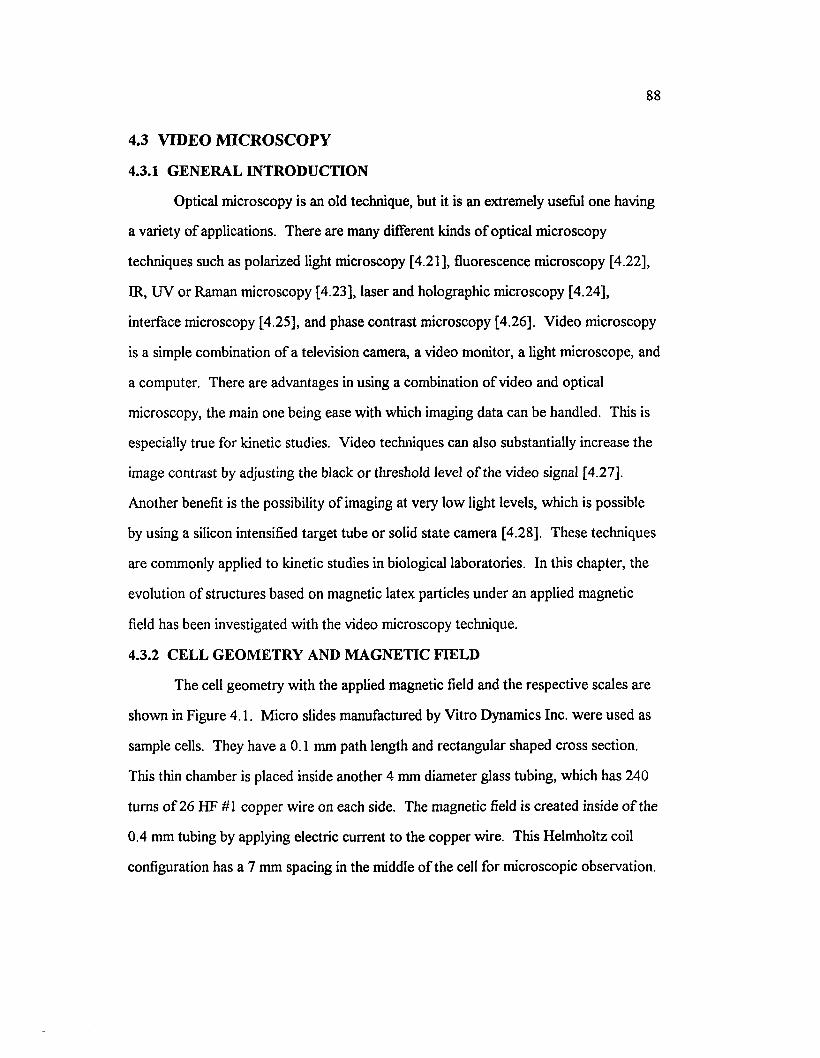
88
4.3 VIDEO MICROSCOPY
4.3.1 GENERAL INTRODUCTION
Optical microscopy is an old technique, but it is an extremely useful one having
a variety o f applications. There are many different kinds o f optical microscopy
techniques such as polarized light microscopy [4.21], fluorescence microscopy [4.22],
IR, U V or Raman microscopy [4.23], laser and holographic microscopy [4.24],
interface microscopy [4.25], and phase contrast microscopy [4.26]. Video microscopy
is a simple combination o f a television camera, a video monitor, a light microscope, and
a computer. There are advantages in using a combination o f video and optical
microscopy, the main one being ease with which imaging data can be handled. This is
especially true for kinetic studies. Video techniques can also substantially increase the
image contrast by adjusting the black or threshold level o f the video signal [4.27],
Another benefit is the possibility o f imaging at very low light levels, which is possible
by using a silicon intensified target tube or solid state camera [4.28], These techniques
are commonly applied to kinetic studies in biological laboratories. In this chapter, the
evolution o f structures based on magnetic latex particles under an applied magnetic
field has been investigated with the video microscopy technique.
4.3.2 CELL GEOMETRY AND MAGNETIC FIELD
The cell geometry with the applied magnetic field and the respective scales are
shown in Figure 4.1. M icro slides manufactured by Vitro Dynamics Inc. were used as
sample cells. They have a 0 . 1 mm path length and rectangular shaped cross section.
This thin chamber is placed inside another 4 mm diameter glass tubing, which has 240
turns o f 26 HF #1 copper wire on each side. The magnetic field is created inside o f the
0.4 mm tubing by applying electric current to the copper wire. This Helmholtz coil
configuration has a 7 mm spacing in the middle o f the cell for microscopic observation.

89
Microscopy Observation
7 mm
240 tu m s/3 8 mm
4 mm cylindrical tubing
0.1 mm x 2 mm Vitro Cell
SALS Laser Beam
Figure 4.1 Cell geometry, Helmholtz coil, to induce the magnetic field.
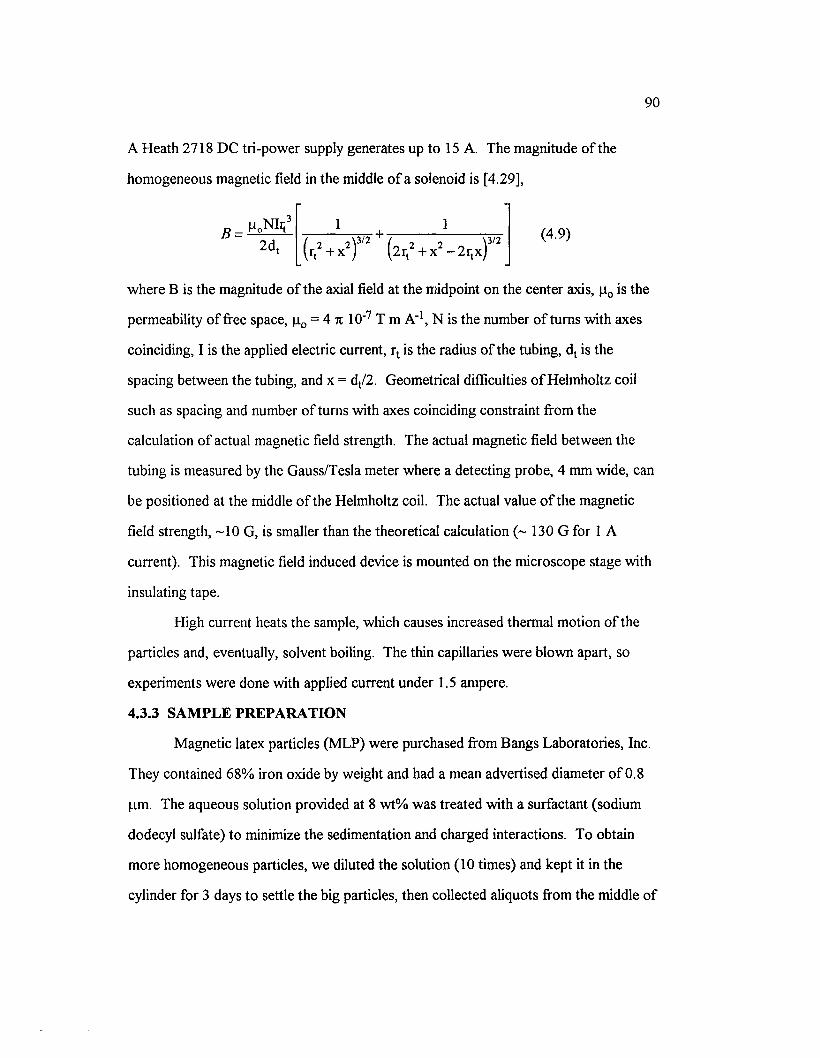
90
A Heath 2718 DC tri-power supply generates up to 15 A. The magnitude o f the
homogeneous magnetic field in the middle o f a solenoid is [4.29],
where B is the magnitude o f the axial field at the midpoint on the center axis, p 0 is the
permeability o f free space, p 0 = 4 % 10" 7 T m A"1, N is the number o f turns with axes
coinciding, I is the applied electric current, rt is the radius o f the tubing, dt is the
spacing between the tubing, and x = dt/2. Geometrical difficulties o f Helmholtz coil
such as spacing and number o f turns with axes coinciding constraint from the
calculation o f actual magnetic field strength. The actual magnetic field between the
tubing is measured by the Gauss/Tesla m eter where a detecting probe, 4 mm wide, can
be positioned at the middle o f the Helmholtz coil. The actual value o f the magnetic
field strength, ~10 G, is smaller than the theoretical calculation (~ 130 G for 1 A
current). This magnetic field induced device is mounted on the microscope stage with
insulating tape.
High current heats the sample, which causes increased thermal motion o f the
particles and, eventually, solvent boiling. The thin capillaries were blown apart, so
experiments were done with applied current under 1.5 ampere.
4.3.3 SA M PL E PR E PA R A T IO N
M agnetic latex particles (MLP) were purchased from Bangs Laboratories, Inc.
They contained 6 8 % iron oxide by weight and had a mean advertised diameter o f 0.8
pm. The aqueous solution provided at 8 w t% was treated with a surfactant (sodium
dodecyl sulfate) to minimize the sedimentation and charged interactions. To obtain
more homogeneous particles, we diluted the solution ( 1 0 times) and kept it in the
cylinder for 3 days to settle the big particles, then collected aliquots from the middle o f
B _2 d,
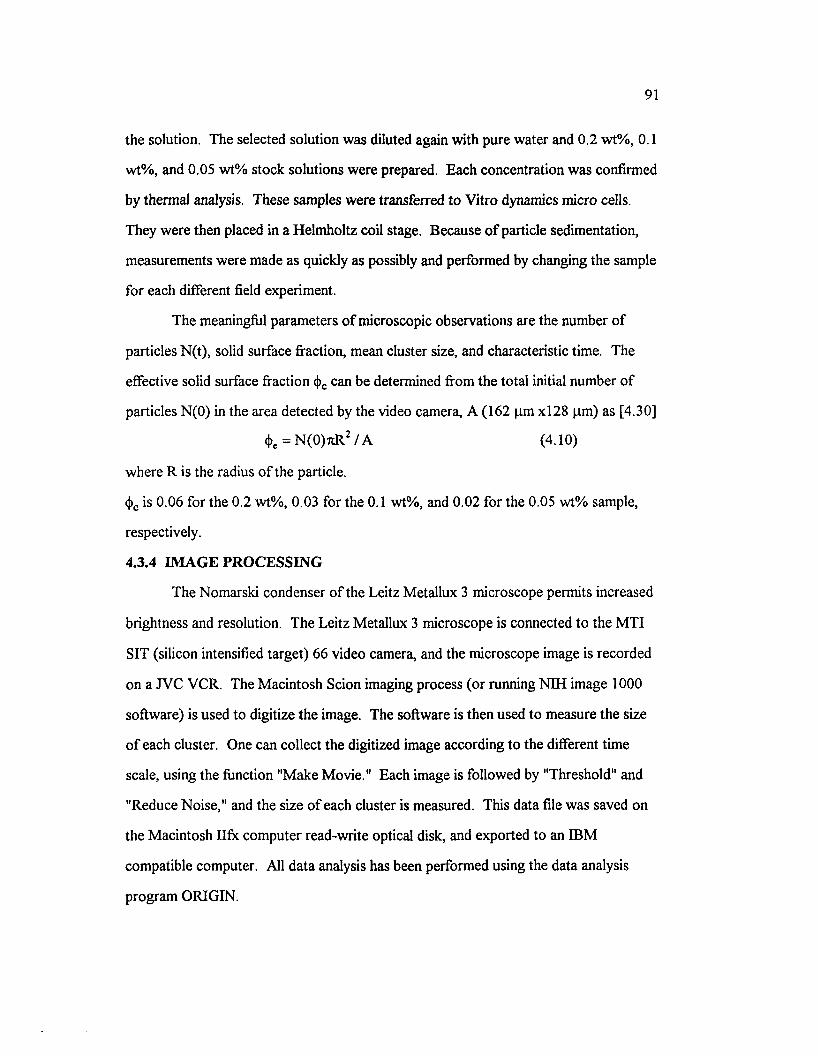
91
the solution. The selected solution was diluted again with pure water and 0.2 wt% , 0.1
wt% , and 0.05 wt% stock solutions were prepared. Each concentration was confirmed
by thermal analysis. These samples were transferred to Vitro dynamics micro cells.
They were then placed in a Helmholtz coil stage. Because o f particle sedimentation,
measurements were made as quickly as possibly and performed by changing the sample
for each different field experiment.
The meaningful parameters o f microscopic observations are the number o f
particles N(t), solid surface fraction, mean cluster size, and characteristic time. The
effective solid surface fraction <J)e can be determined from the total initial number o f
particles N(0) in the area detected by the video camera, A (162 pm x l2 8 pm ) as [4.30]
<j>e = N (0 ) tcR2 /A (4.10)
where R is the radius o f the particle.
4>e is 0.06 for the 0.2 wt% , 0.03 for the 0.1 wt%, and 0.02 for the 0.05 wt% sample,
respectively.
4.3.4 IM A G E PR O C E SSIN G
The Nomarski condenser o f the Leitz Metallux 3 microscope permits increased
brightness and resolution. The Leitz Metallux 3 microscope is connected to the M TI
SIT (silicon intensified target) 6 6 video camera, and the microscope image is recorded
on a JVC VCR. The M acintosh Scion imaging process (or running N IH image 1000
software) is used to digitize the image. The software is then used to measure the size
o f each cluster. One can collect the digitized image according to the different time
scale, using the function "Make Movie." Each image is followed by "Threshold" and
"Reduce Noise," and the size o f each cluster is measured. This data file was saved on
the M acintosh Ilfx com puter read-write optical disk, and exported to an IBM
compatible computer. All data analysis has been performed using the data analysis
program ORIGIN.
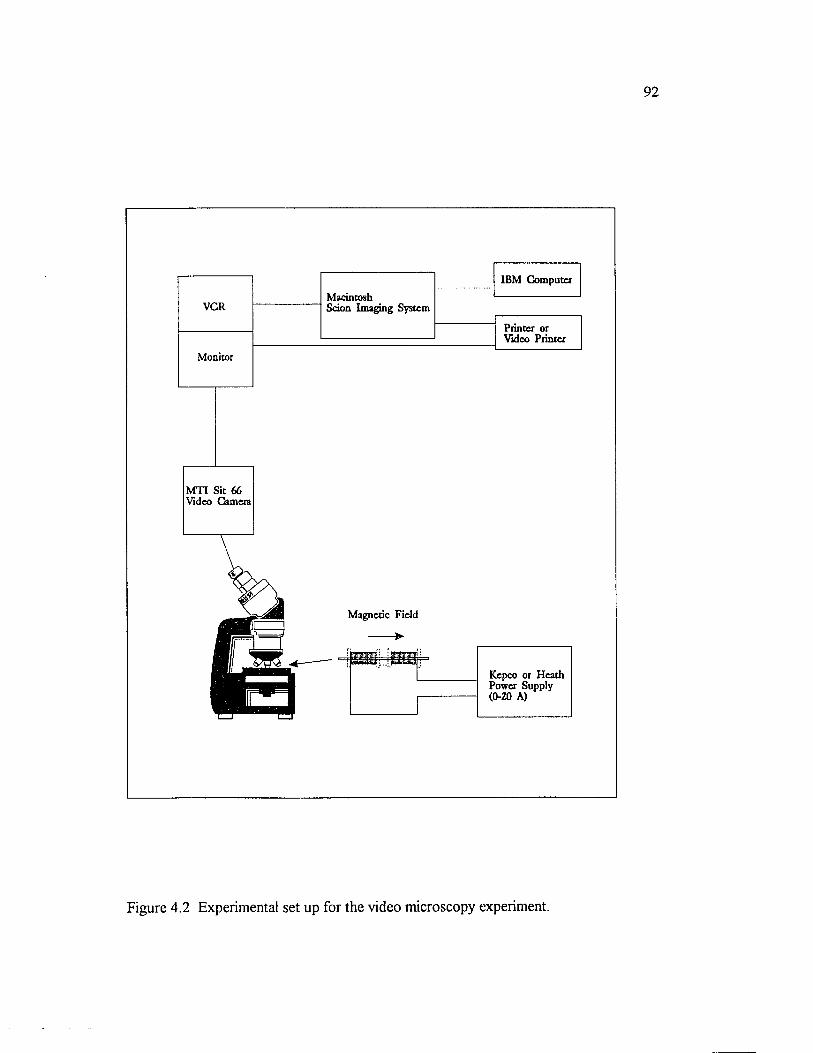
92
IBM Computer
Printer or Video Printer
M i l Sit 66 Video Camera
Kepco or Heath Power Supply (0-20 A)
Magnetic
VCRMacintoshScion Imaging System
Monitor
Figure 4.2 Experimental set up for the video microscopy experiment.
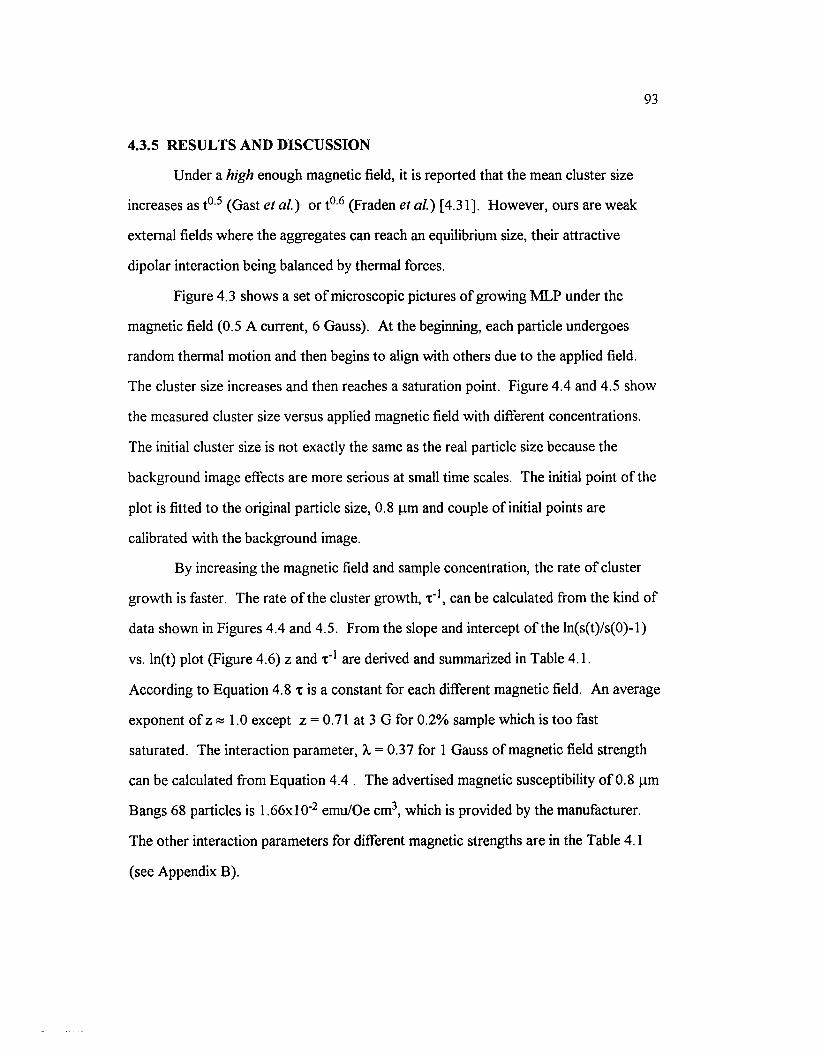
93
4.3.5 R E SU LT S AND D ISC U SSIO N
Under a high enough magnetic field, it is reported that the mean cluster size
increases as t0 5 (Gast et al.) or t° 6 (Fraden et al.) [4.31], However, ours are weak
external fields where the aggregates can reach an equilibrium size, their attractive
dipolar interaction being balanced by thermal forces.
Figure 4.3 shows a set o f microscopic pictures o f growing M LP under the
magnetic field (0.5 A current, 6 Gauss). At the beginning, each particle undergoes
random thermal motion and then begins to align with others due to the applied field.
The cluster size increases and then reaches a saturation point. Figure 4.4 and 4.5 show
the measured cluster size versus applied magnetic field with different concentrations.
The initial cluster size is not exactly the same as the real particle size because the
background image effects are more serious at small time scales. The initial point o f the
plot is fitted to the original particle size, 0 . 8 pm and couple o f initial points are
calibrated with the background image.
By increasing the magnetic field and sample concentration, the rate o f cluster
growth is faster. The rate o f the cluster growth, x '1, can be calculated from the kind o f
data shown in Figures 4.4 and 4.5. From the slope and intercept o f the ln(s(t)/s(0)-l)
vs. ln(t) plot (Figure 4.6) z and x ' 1 are derived and summarized in Table 4.1.
According to Equation 4.8 x is a constant for each different magnetic field. An average
exponent o f z « 1.0 except z = 0.71 at 3 G for 0.2% sample which is too fast
saturated. The interaction parameter, X = 0.37 for 1 Gauss o f magnetic field strength
can be calculated from Equation 4.4 . The advertised magnetic susceptibility o f 0.8 pm
Bangs 6 8 particles is 1.66x1 O' 2 emu/Oe cm3, which is provided by the manufacturer.
The other interaction parameters for different magnetic strengths are in the Table 4 . 1
(see Appendix B).
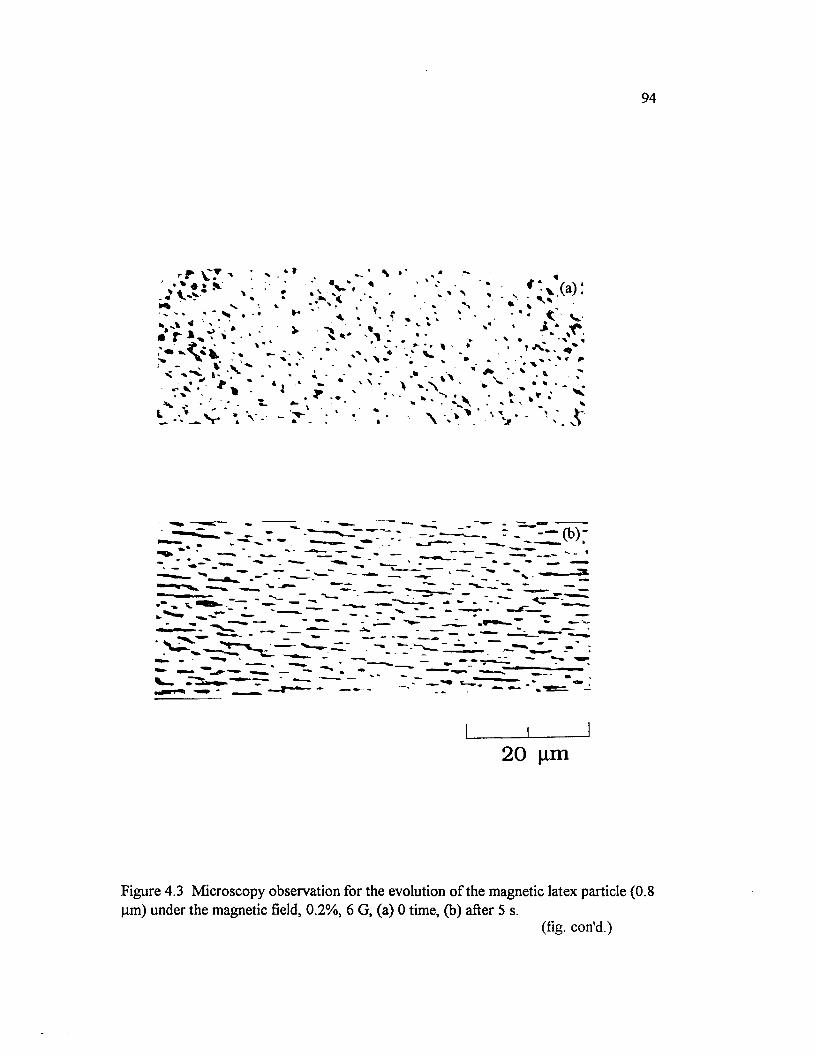
94
Figure 4.3 M icroscopy observation for the evolution o f the magnetic latex particle (0.8 pm ) under the magnetic field, 0.2%, 6 G, (a) 0 time, (b) after 5 s.
(fig. con'd.)
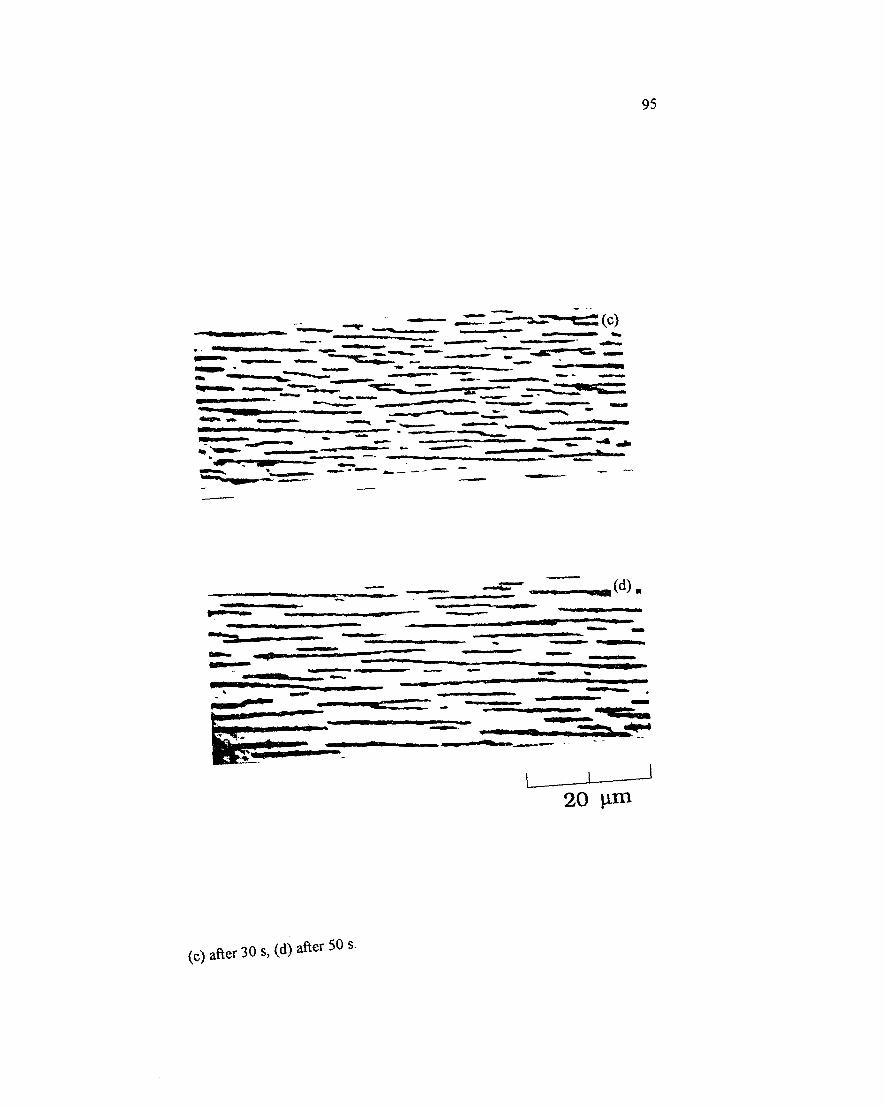
95
20 jJtm
(c) after 30 s, (d) after 50 s.
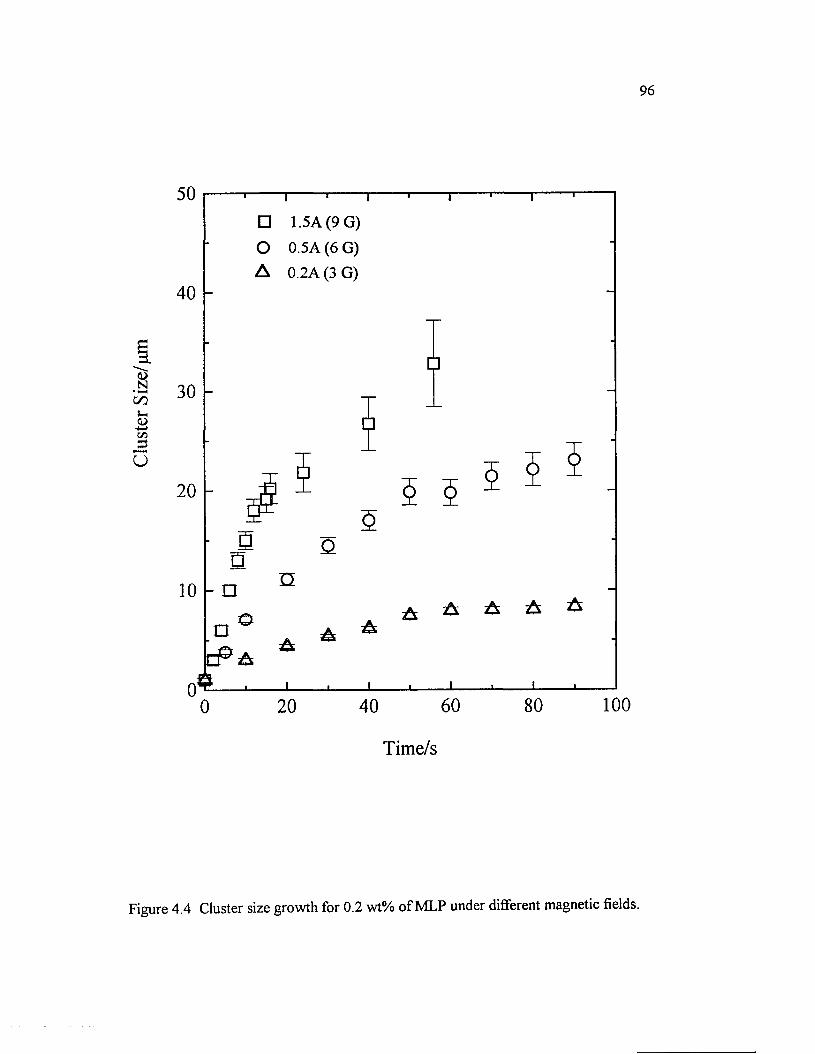
Clus
ter S
ize/
jam
96
5 0
40 -
□
O
A
i 1 r
1.5A (9 G)
0 .5A ( 6 G)
0 .2A (3 G)
30 -
□
2 0 - § §
10 - na o
o 4
o
n
A
2 0
A A A A A
j _____ i_
40 60 80 100
T im e /s
Figure 4.4 Cluster size growth for 0.2 wt% o f MLP under different magnetic fields.
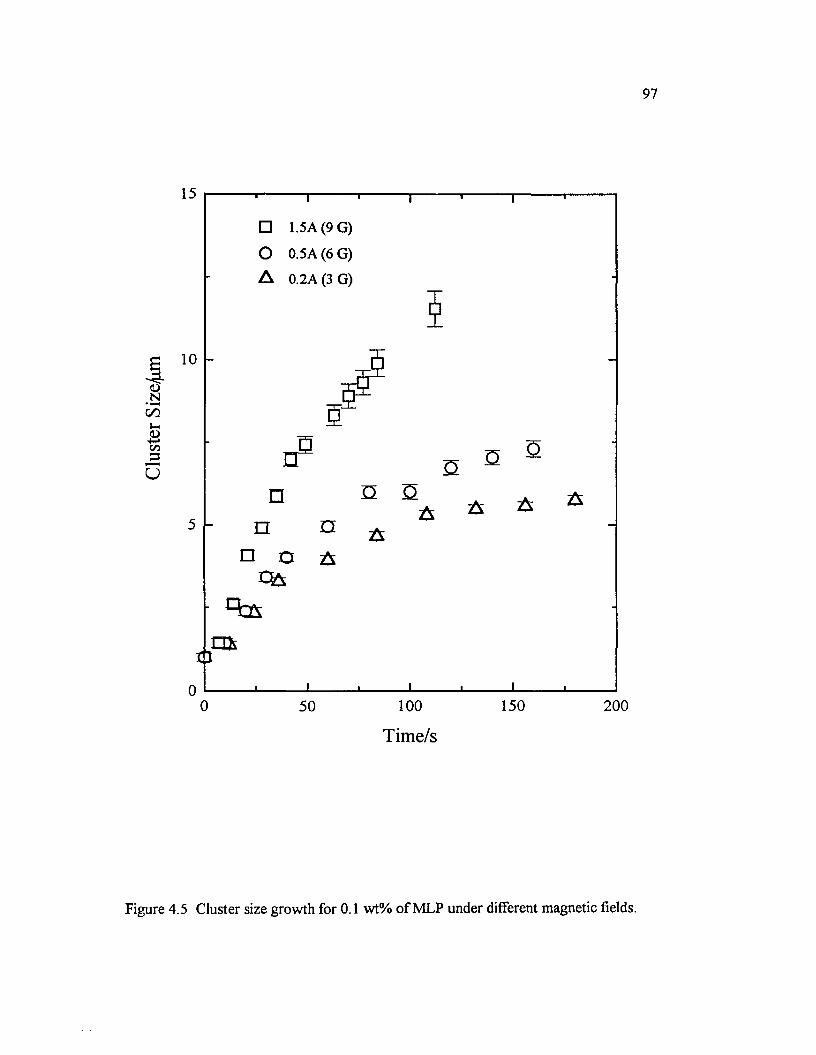
Clus
ter
Size
/jnm
97
15 T□ 1.5A (9 G)
O 0.5 A (6 G)
A 0 .2 A (3 G)
10
n n n
n o a
XJm
o
A
0 50 1 0 0
T im e /s
150
A
200
Figure 4.5 Cluster size growth for 0.1 wt% o f MLP under different magnetic fields.
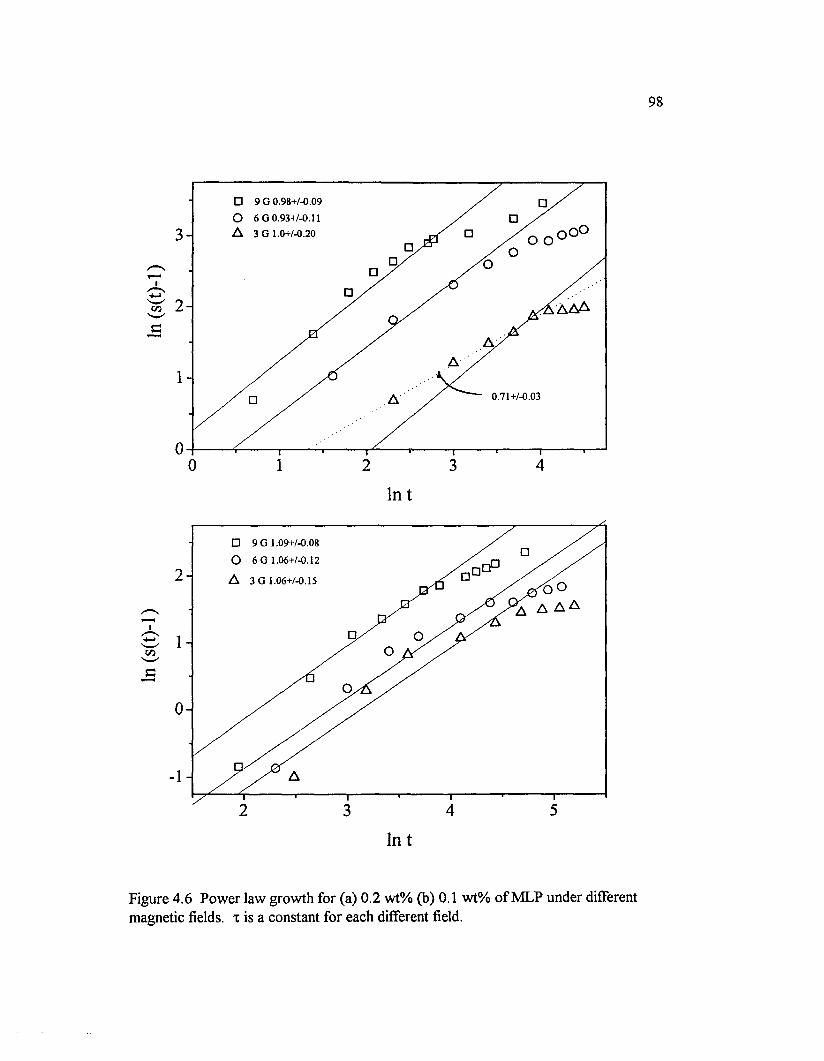
in (s
(t)-
l) In
(s(t
)-l)
98
9 G 0.98+/-0.09
6 G 0.93+/-0.11
3 G 1.0+/-0.203
2
1
0.71+/-0.03
0
0 1 2 3 4
In t
9 G 1.09+/-0.08
6 G 1.06+/-0.12
2 3 G I.06+/-O.I5
1
0
1
Figure 4.6 Pow er law growth for (a) 0.2 w t% (b) 0.1 w t% o f M LP under different magnetic fields, x is a constant for each different field.
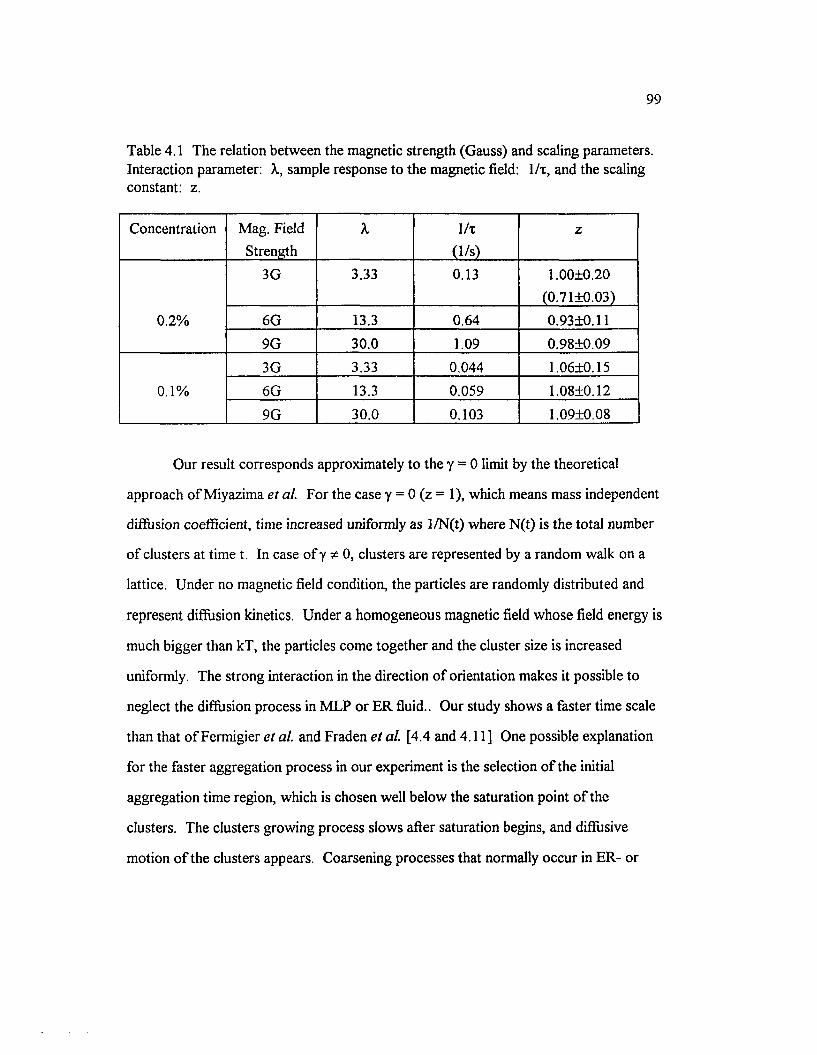
99
Table 4.1 The relation between the magnetic strength (Gauss) and scaling parameters. Interaction parameter: X, sample response to the magnetic field: 1/x, and the scaling constant: z.
Concentration Mag. Field
StrengthX 1 / t
( 1 /s)
z
3G 3.33 0.13 1 .0 0 ± 0 . 2 0
(0.71±0.03)
0 .2 % 6 G 13.3 0.64 0.93±0.11
9G 30.0 1.09 0.98±0.09
3G 3.33 0.044 1.06±0.15
0 . 1 % 6 G 13.3 0.059 1.08+0.12
9G 30.0 0.103 1.09+0.08
Our result corresponds approximately to the y = 0 limit by the theoretical
approach o f Miyazima et al. For the case y = 0 (z = 1), which means mass independent
diffusion coefficient, time increased uniformly as 1/N(t) where N (t) is the total number
o f clusters at time t. In case o f y ^ 0, clusters are represented by a random walk on a
lattice. Under no magnetic field condition, the particles are randomly distributed and
represent diffusion kinetics. Under a homogeneous magnetic field whose field energy is
much bigger than kT, the particles come together and the cluster size is increased
uniformly. The strong interaction in the direction o f orientation makes it possible to
neglect the diffusion process in M LP or ER fluid.. Our study shows a faster time scale
than that o f Fermigier et al. and Fraden et al. [4.4 and 4.11] One possible explanation
for the faster aggregation process in our experiment is the selection o f the initial
aggregation time region, which is chosen well below the saturation point o f the
clusters. The clusters growing process slows after saturation begins, and diffusive
motion o f the clusters appears. Coarsening processes that normally occur in ER- or

100
ferro-fluid under the high field strength couldn't be observed with our experimental
conditions, A. < 30, and <{>e ~ 0.06.
4.4 VIDEO SMALL ANGLE LIGHT SCATTERING
4.4.1 GENERAL INTRODUCTION
Video small angle light scattering (VSALS) uses linearly polarized light to
illuminate the object under examination to produce a scattered intensity pattern on a
screen. The scattered pattern is normally at a small angle from the incident light, and
the image is recorded by the video camera and saved on video tape; it was recorded on
photographic plates before the ascendancy o f video technology [4.32], VSALS
patterns from specimens have been used to study the morphology o f crystalline
polymers in the solid state [4.33], which gives the size, shape and orientation o f
molecular axes in such crystalline micro structures [4.34] Typical SALS patterns, for
example clover shape lobes, have been explained by orientation fluctuations in
crystalline and semi-crystalline polymers. Stein et a l [4.33] provided the theoretical
approach based on the classical light scattering approximation and it was proved
experimentally.
Orientation fluctuations, arising from heterogeneity o f the local degree o f
crystallinity, are the origin o f the small angle scattering pattern. Several SALS
experiments have been attempted to follow the melting and crystallization o f the
polymer [4.35], VSALS had been used to investigate the electrorheological fluids in
1992 [4.36], After the application o f the electrical field to the ER fluid, the aligned
clusters altered the properties o f the solution. The aligned clusters caused the solution
to behave more like a solid. The small angle scattering pattern arose from orientation
and surface structure o f the ER fluid. Refractive index matching between the particle
and solvent is an important factor during a VSALS experiment, especially for the high
loading o f solids or for thick samples. However, multiple scattering was not a serious
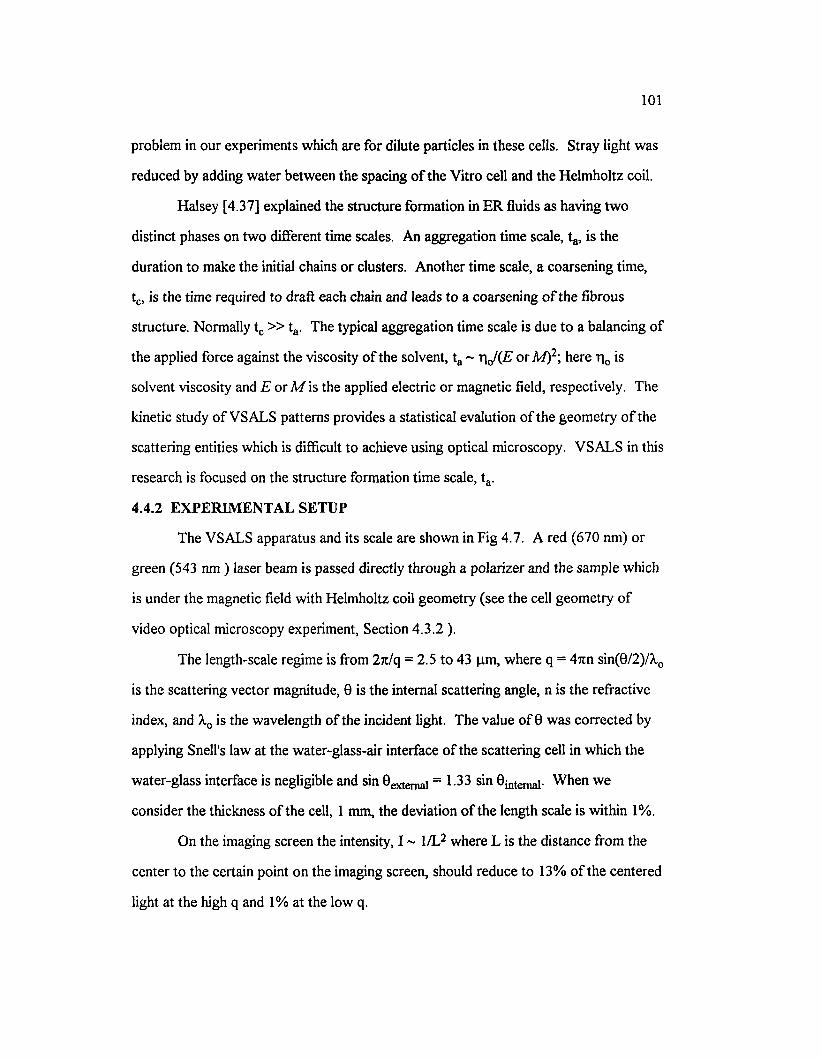
101
problem in our experiments which are for dilute particles in these cells. Stray light was
reduced by adding w ater between the spacing o f the Vitro cell and the Helmholtz coil.
Halsey [4.37] explained the structure formation in E R fluids as having two
distinct phases on two different time scales. An aggregation time scale, ta, is the
duration to make the initial chains or clusters. Another time scale, a coarsening time,
tc, is the time required to draft each chain and leads to a coarsening o f the fibrous
structure. Normally The typical aggregation time scale is due to a balancing o f
the applied force against the viscosity o f the solvent, ta ~ rj J(E o r M )2; here r | 0 is
solvent viscosity and E or M is the applied electric or magnetic field, respectively. The
kinetic study o f VSALS patterns provides a statistical evalution o f the geometry o f the
scattering entities which is difficult to achieve using optical microscopy. VSALS in this
research is focused on the structure formation time scale, ta.
4.4.2 EXPERIMENTAL SETUP
The VSALS apparatus and its scale are shown in Fig 4.7. A red (670 nm) or
green (543 n m ) laser beam is passed directly through a polarizer and the sample which
is under the magnetic field with Helmholtz coil geometry (see the cell geometry o f
video optical microscopy experiment, Section 4.3.2 ).
The length-scale regime is from 2k /q = 2.5 to 43 pm, where q = 4 7 in sin(0/2)/^o
is the scattering vector magnitude, 0 is the internal scattering angle, n is the refractive
index, and XQ is the wavelength o f the incident light. The value o f 0 was corrected by
applying Snell's law at the water-glass-air interface o f the scattering cell in which the
water-glass interface is negligible and sin ©external= 133 sin ©internal- W hen we
consider the thickness o f the cell, 1 mm, the deviation o f the length scale is within 1 %.
On the imaging screen the intensity, I ~ 1/L2 where L is the distance from the
center to the certain point on the imaging screen, should reduce to 13% o f the centered
light at the high q and 1 % at the low q.

102
\ Z 7VCR
TV
Mac.Imaging
A nalysis* Excel* Passage* Origin
Imaging Plate
Sam ple/M ag. Field
6.5 cm
0.15 cm
7.5 cm
Power Supply
Lens, Filter, or Polarizer
Laser[670, 543 nm]
Figure 4.7 Video small angle light scattering setup.
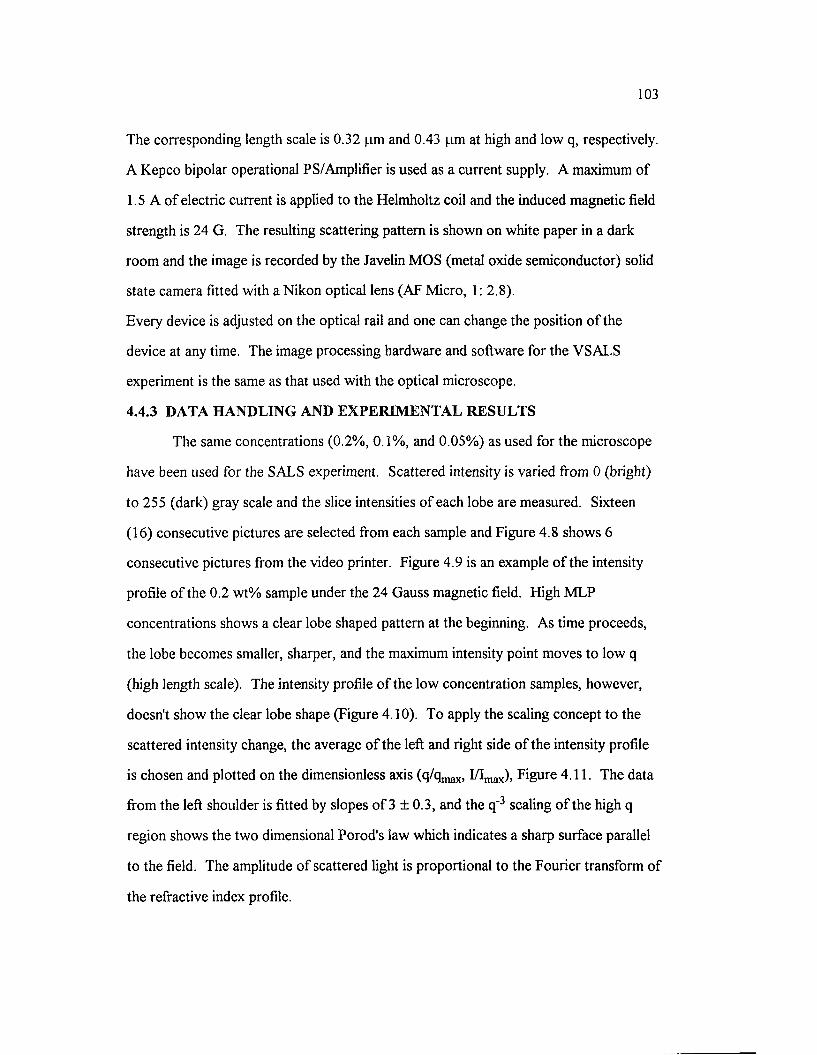
103
The corresponding length scale is 0.32 pm and 0.43 pm at high and low q, respectively.
A Kepco bipolar operational PS/Amplifier is used as a current supply. A maximum o f
1.5 A o f electric current is applied to the Helmholtz coil and the induced magnetic field
strength is 24 G. The resulting scattering pattern is shown on white paper in a dark
room and the image is recorded by the Javelin MOS (metal oxide semiconductor) solid
state camera fitted with a Nikon optical lens (AF Micro, 1: 2.8).
Every device is adjusted on the optical rail and one can change the position o f the
device at any time. The image processing hardware and software for the VSALS
experiment is the same as that used with the optical microscope.
4.4.3 DATA H A N D LIN G AND E X PE R IM E N T A L R ESU LTS
The same concentrations (0.2%, 0.1%, and 0.05%) as used for the microscope
have been used for the SALS experiment. Scattered intensity is varied from 0 (bright)
to 255 (dark) gray scale and the slice intensities o f each lobe are measured. Sixteen
(16) consecutive pictures are selected from each sample and Figure 4.8 shows 6
consecutive pictures from the video printer. Figure 4.9 is an example o f the intensity
profile o f the 0.2 wt% sample under the 24 Gauss magnetic field. High MLP
concentrations shows a clear lobe shaped pattern at the beginning. As time proceeds,
the lobe becomes smaller, sharper, and the maximum intensity point moves to low q
(high length scale). The intensity profile o f the low concentration samples, however,
doesn't show the clear lobe shape (Figure 4.10). To apply the scaling concept to the
scattered intensity change, the average o f the left and right side o f the intensity profile
is chosen and plotted on the dimensionless axis (q/qmax, I/Imax)> Figure 4.11. The data
from the left shoulder is fitted by slopes o f 3 + 0.3, and the q ' 3 scaling o f the high q
region shows the two dimensional Porod's law which indicates a sharp surface parallel
to the field. The amplitude o f scattered light is proportional to the Fourier transform o f
the refractive index profile.
104
Figure 4.8 VSALS observation for the evolution o f the magnetic latex particle (0.8 pm) under the magnetic field, 0.2%, 24 G, (a) background intensity (b) after 0.5 s (c) after 1 s
(fig. con'd.)
(d) after 4 s, (e) after 1 0 s (f) after 2 0 s.

Inte
nsity
In
tens
ity
Inte
nsity
In
tens
ity
106
250
200
150
100
0 sec
200 300 400 500 6000 100
250
200
150
100
2 0 sec
600300 400 5000 100 200
250
200
150
100
5040 sec
500 6000 200 300 400100
250
200
150
100
1 1 0 sec500 6000 300 400200100
Arbitrary Number
Figure 4.9 Raw intensity profile o f SALS o f MLP under the magnetic field, 0.5 A/ 6 G, 0.05 wt% , 670 nm.
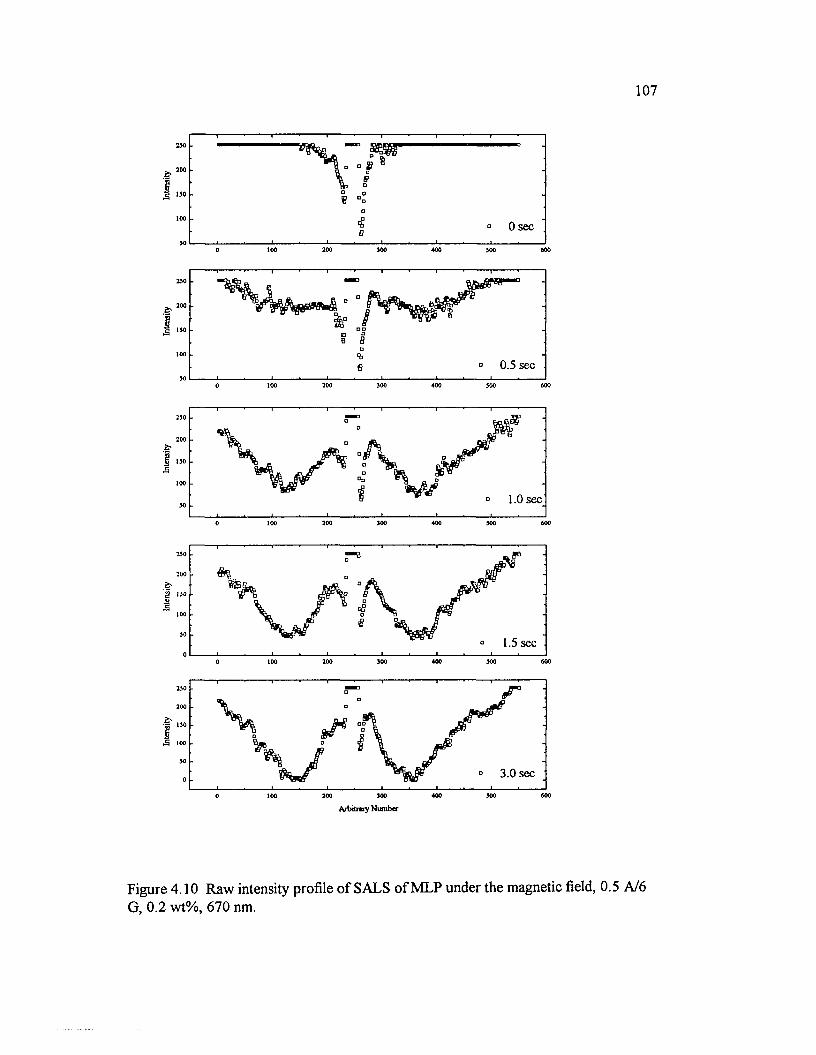
Inte
nsity
In
tens
ity
Inte
nsity
In
tensit
y In
tens
ity
107
130
0 sec
100 200 300 400 6000 300
230
200
130
100
0.5 sec30
200 400100 300 300 6000
100
1.0 sec
200 300 400 300 6000 100
200
130
100
30
1.5 sec0
600200 300 400 3000 100
250
3.0 sec
600200 300 400 3000 100
Arbitrary Number
Figure 4.10 Raw intensity profile o f SALS o f MLP under the magnetic field, 0.5 A / 6
G, 0.2 wt% , 670 nm.
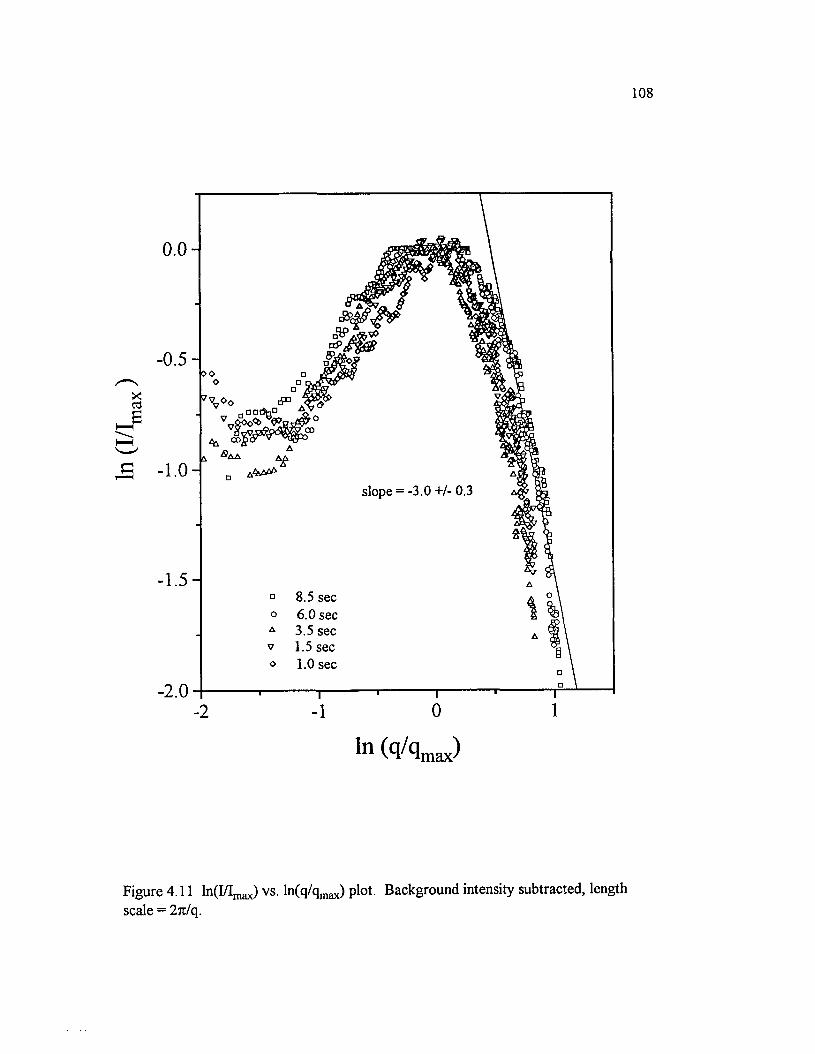
toO
/Im
ax
>
108
0.0-
<6
slope = -3.0 +/- 0.3
8.5 sec6 . 0 sec3.5 sec1.5 sec1 . 0 sec
ln W w
Figure 4.11 ln(I/Imax) vs. ln(q/qmax) plot. Background intensity subtracted, length scale = 27t/q.
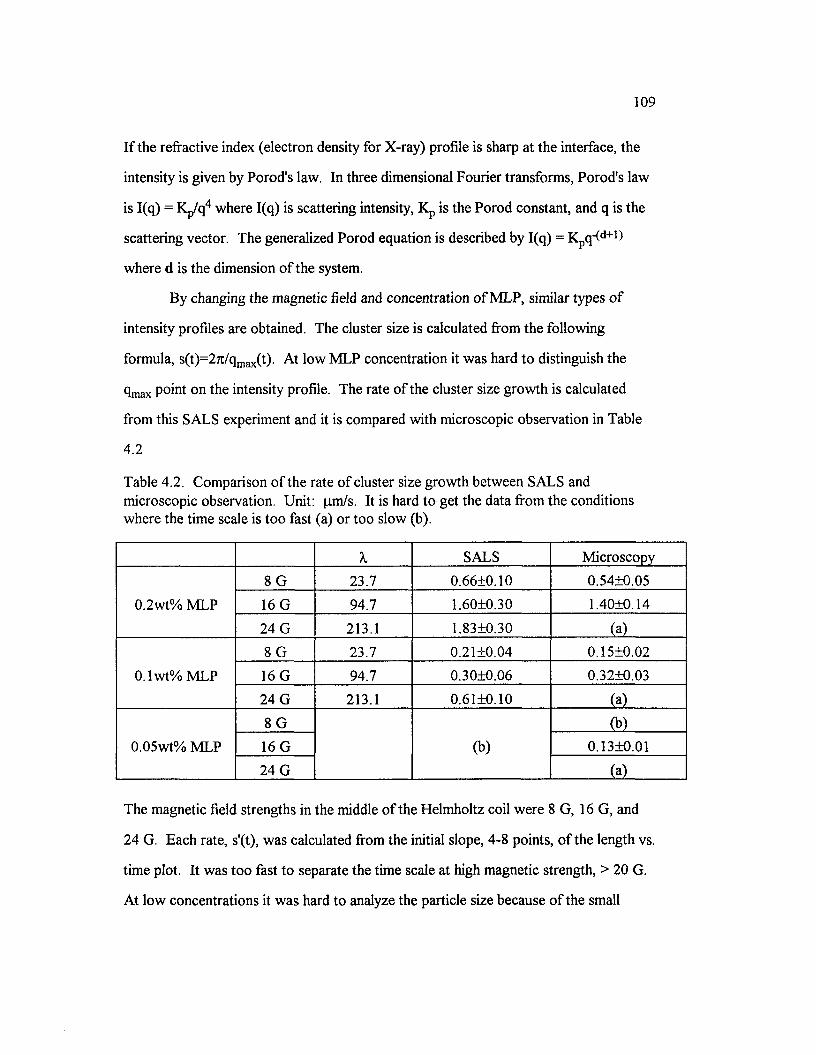
109
I f the refractive index (electron density for X-ray) profile is sharp at the interface, the
intensity is given by Porod's law. In three dimensional Fourier transforms, Porod's law
is I(q) = Kp/q4 where I(q) is scattering intensity, Kp is the Porod constant, and q is the
scattering vector. The generalized Porod equation is described by I(q) = Kpq-(d+1)
where d is the dimension o f the system.
By changing the magnetic field and concentration o f MLP, similar types o f
intensity profiles are obtained. The cluster size is calculated from the following
formula, s(t)=2^/qmax(t). At low MLP concentration it was hard to distinguish the
fimax P°*nt on the intensity profile. The rate o f the cluster size growth is calculated
from this SALS experiment and it is compared with microscopic observation in Table
4.2
Table 4.2. Comparison o f the rate o f cluster size growth between SALS and microscopic observation. Unit: pm/s. It is hard to get the data from the conditions where the time scale is too fast (a) or too slow (b).
X SALS M icroscopy
0.2wt% MLP
8 G 23.7 0 .6 6 +0 . 1 0 0.54±0.05
16 G 94.7 1.60+0.30 1.4010.14
24 G 213.1 1.83+0.30 (a)
0.1 wt% MLP
8 G 23.7 0.21+0.04 0.15+0.02
16 G 94.7 0.30+0.06 0.3210.03
24 G 213.1 0.61+0.10 (a)
0.05wt% MLP
8 G
(b)
(b)
16 G 0.1310.01
24 G (a)
The magnetic field strengths in the middle o f the Helmholtz coil were 8 G, 16 G, and
24 G. Each rate, s'(t), was calculated from the initial slope, 4-8 points, o f the length vs.
time plot. It was too fast to separate the time scale at high magnetic strength, > 20 G.
At low concentrations it was hard to analyze the particle size because o f the small
110
number o f particles and the large error bars. There is good agreement for the rate o f
cluster growth between these two methods.
4.5 SUMMARY
The applied field and concentration dependence o f the magnetic latex particles'
kinetic growth was traced by microscopy and small angle light scattering methods. The
high magnetic susceptibility o f the MLP explains why they align at very weak magnetic
fields. Scaling concepts were applied for this cluster size growth mechanism and their
rate o f cluster formation was compared with SALS and microscopy techniques. Good
agreement was obtained between the two methods, and s(t) ~ t 1 0 was observed during
the initial growth o f the cluster.
The aggregation kinetic is not fully discussed in this Chapter. However, the fast
cluster formation is experimentally investigated under the low magnetic field strength,
low X, where the aggregation is not disrupted by the saturation or the coarsening o f the
structure.
Ill
4.6 REFERENCES
4.1 P. Meakin, Physica Scripta 64, 295 (1992).
4.2 ER Fluid
(1) General
(a) R. Tao, "Electrorheological Fluids," Proc. Inter. Conf. on ER fluids, World Scientific, NJ, 1991.
(b) A. P. Gast and C. F. Zukoski, Advances in Colloid and Interface Sci. 30, 153, (1989)
(c) T. C. Halsey and J. E. Martin, Scientific American 58, Oct. (1993).
(d) T. C. Halsey, Science 258, 761, Oct.(1992).
(e) P. M. Adriani and A. P. Gast, Faraday Discuss. Chem. Soc. 90, 17 (1990).
(2) Properties
(a) H. Uejima, Japn. J. Appl. Phys. 11 (3), 319(1972).
(b) L. Marshall, C. F. Zukoski, J. W. Goodwin, J. Chem. Soc. Faraday Trans. I 85(9), 2785 (1989).
(c) W. S. Yen and P.J. Achom, J. Rheol. 35(7), 1375 (1991).
(d) J. C. Hill and T. H. van Steenkiste, J. Appl. Phys. 70(3), 1207 (1991).
(3) Applications
(a) D. L. Hartsock, R. F. Novak, and G. J. Chaundy, J. Rheol. 35(7), 1305 (1991).
(b) D. A. Brook, Devices Using ER Fluids, Proc. 2nd Conf. on ER Fluid, Raleigh, NC, Aug., 1989.
4.3 Conference on Electrorheological Fluids, Carbondale, EL, R. Tao, Ed., World Scientific, Singapore, 1992
4.4 S. Fraden, A. J. Hurd, and R. B. Meyer, Phys. Rev. Lett. 63(21), 2373 (1989).
4.5 (a) M. Ozaki, H. Suzuki, K. Takahashi, and E. Matijevic, J. Coll. Inter. Sci.113(1), 76(1986).
(b) P. C. Scholten and D. L. A. Tjaden, J. Coll. Inter. Sci. 73(1), 255 (1980).
(c) A. T. Skjeltorp, J. Appl. Phys. 57(1), 3285 (1985)
4.6 P. G. de Gennes and P. Pincus, Phys. Kondens. Mater. 11, 189 (1970).
112
4.7 G. Bossis, C. Mathis, Z. Mimouni, and C. Paparoditis, Europhys. Lett. 11, 133(1990).
4.8 P. C. Jordan, Molecular Phys. 25(4), 961 (1973).
4.9 D. A. Krueger, J. Coll. Inter. Sci. 70(3), 558 (1979).
4.10 C. F. Hayes and S. R. Hwang, J. Coll. Inter. Sci. 60, 443 (1977).
4.11 M. Fermigier and A. P. Gast, J. Coll. Inter. Sci. 154(2), 522 (1992).
4.12 H. Bogardus, D. A. Krueger, D. Thompson, J. Appl. Phys. 49, 3422 (1978).
4.13 K. Sano and M. Doi, J. Phys. Soc. Jpn. 52, 2810 (1983).
4.14 B. B. Mandelbrot, "The Fractal Geometry o f Nature, Freeman," San Francisco, 1982.
4.15 D. A. Weitz, M. Y. Lin, and C. J. Sandroff, Surface Science 158, 147 (1985).
4.16 D. W. Schaefer, Science 243, A1023 (1989).
4.17 P. Meakin, Phys. Rev. Lett. 51, 1119, (1983).
4.18 M. Kolb, R. Botet, and R. Jullien, Phys. Rev. Lett. 51, 1123 (1983).
4.19 S. Miyazima, P. Meakin, and F. Family, Physical Review A 36(3), 1421 (1987).
4.20 J. J. M. Janssen, J. J. M. Baltussen, A. P. van Gelder, and J. A. A. J. Perenboom, J. Phys. D: Appl. Phys. 23, 1447 (1990).
4.21 A. Watanabe, Y. Yamaoka, E. Akaho, K. Kuroda, T. Yokoyama, T. Umeda, Chem. Pham. Bull. 33(4), 1599608 (1985).
4.22 F. V. Geel, B. W. Smith, B. Nicolaissen, J. D. Winefordner, J. Microsc. 133(2), 141 (1984).
4.23 J. A. Manson, A. Ramirez, R. W. Hertzberg, Polym. Mater. Sci. Eng. 50, 106 (1984).
4.24 H. Ambar, Y. Aoki, N. Takai, and T. Asakura, Appl. Phys. B. 38, 71 (1985).
4.25 P. Prentice, S. Hashemi, J. Mat. Sci. 19(2), 518 (1984).
4.26 S. N. Jabr, Opt. Lett. 10(11), 526 (1985).
4.27 S. Inoue, J. Cell Biol. 89, 346 (1981).
4.28 D. L. Commare, American Lab. 20(12), 56 (1988).
4.29 J. D. Cutnell and K. W. Johnson, "Physics," John Wiley & Sons, 1989.
113
4.30 M. Fermigier and A. P. Gast, J. Coll. Inter. Sci. 154(2), 522 (1992).
4.31 S. Fraden, A. J. Hurd, R. B. Meyer, Phys. Rev. Lett. 63, 2373 (1989).
4.32 R. S. Stein and T. Hotta, J. Appl. Phys. 35, 7 (1964).
4.33 (a) R. S. Stein and M. B. Rhodes, J Applied Phys. 31(11), 1873 (1960).
(b) T. Takebe, T. Hashimoto, B. Ernst, P. Navard and R. S. Stein, J Chem. Phys. 92(2), 1386 (1990).
4.34 J. M. Haudin, "Optical Studies o f Polymers," Chapter 4, G. H. M eeten Ed., Elsevier, N. Y., 1986.
4.35 T. Kyu, K. Fujita, M. H. Cho, T. Kikutani, and J-S. Lin, Macromolecules 22, 2238 (1989).
4.36 J. E. Martin and J. Odinek, Phys. Rev. Lett. 69(10), 1524 (1992).
4.37 T. C. Halsey and W. Toor, Phys. Rev. Lett. 65(22), 2820 (1990).

CHAPTER 5
DYNAMIC BEHAVIOR OF A HIGH STRENGTH ROD-LIKE POLYELECTROLYTE IN A STRONG ACID
114
115
5.1 INTRODUCTION
The behavior o f polyelectrolyte solutions, which consist o f polyions (charged
polymer chains), counter ions, and coions, such as Na+, Cl", H+, is one o f the most
controversial issues o f polymer physical chemistry. Theoretical treatm ent based on the
Poisson-Boltzman equation o f electric potential leads to predicted phenomena like
small-ion polyion coupling modes [5.1], counterion condensation [5.2], electrolyte
dissipation [5.3], and scaling laws [5.4], Many different experimental techniques have
been applied to polyelectrolyte systems: static and dynamic light scattering [5.5], small
angle X-ray or neutron scattering [5.6], electrophoretic light scattering [5.7],
viscometry [5.8], NM R [5.9],
The dynamics o f polyelectrolytes are determined mostly by electrostatic forces
between the charges along the polymer chains and low molecular weight ions. At the
high salt condition, polyelectrolytes behave like normal, uncharged polymers. Unusual
and unexpected properties o f polyelectrolyte solutions have been reported at the low
salt condition. One o f them is "ordered structures." The notion o f ordered structures
is based on the SAXS data o f tRNA, BSA [5.10], and N aPSS[l 1] which have a single
diffuse "Bragg-like" peak. This peak disappears at the isoelectric point, which implies
the ordered structure is caused by electrostatic interactions. Another example is the
extraordinary-ordinary phase transition, "O-E or E -0 transition"', at a critical salt
concentration, the diffusion coefficient dropped catastrophically by over an order o f
magnitude. Lin et al. first reported the O-E transition o f poly(L-lysine)/KBr system
[5.12], Since then, many different polyelectrolytes have been found that exhibit the O-
E transition, including NaPSS [5.13], DNA [5.14], bovine serum albumin (BSA)
[5.15]. In the present study possible ordered structure and its relation to the O-E
transition have been investigated for the first time by dynamic light scattering with rigid
backbone polyelectrolytes. This type o f polymer emphasizes intermolecular interaction
116
rather than intramolecular interaction since the chains are thought to be almost fully
extended even at high salt content [5.16],
Synthetic rod-like polymers that have high strength and thermal stability are
increasingly being applied in polymer industries such as aerospace and electronics.
Poly(p-phenylene cis benzobisoxazole) (PBO: Figure 5.1) is one o f the rigid rod
polymers having a specific tensile strength 10 times that o f steel [5.17], It is only
soluble in strong acids such as sulfuric acid, methane sulfonic acid (MSA) and
chlorosulfonic acid. These acids protonate the nitrogen or oxygen sites o f the polymer
backbone and the polymers become polyelectrolytes [5.18], Thus, it is very important
to consider the presence o f salt and the ionic strength o f the solvent when we
investigate the solution properties o f PBO.
Berry and co-workers showed the rod-like nature [5.19] and electrostatic
effects [5.16] o f high strength polymers such as PBO and PPTA (poly 1,4 p-phenylene
terephthalamide). At low ionic strength, the polymer solutions had high viscosity ,
small translational diffusion coefficients, and decreased unpolarized scattering. They
proposed intermolecular ordering due to the electrostatic repulsion between protonated
polymer chains. Berry et al. believed these interactions had little effect on chain
conformation, owing to the large persistence length obtained at moderately high ionic
strength. Schmitz [5.20] discussed the possibility o f a O-E transition o f Berry's PBO,
comparable to that o f poly(L-lysine). H e argued that there was "temporal aggregation"
in the extraordinary regime. Berry et al. also have suggested the formation o f
paralleled dimers, trimers, etc. (aggregation) as intermolecular repulsions become
screened out by counterions when salt is added.
Fifteen years after the Berry studies, Roitman, working at Dow's W alnut Creek
facility, did static light scattering and viscosity measurements on PBO.
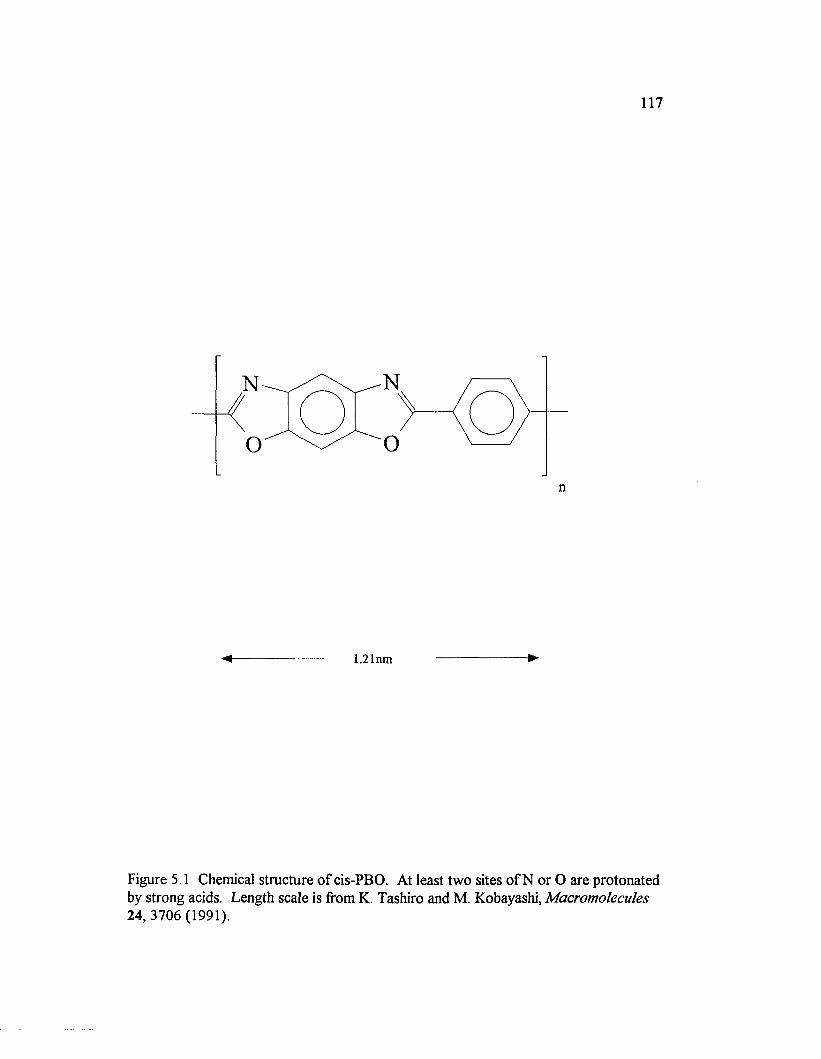
117
n
1.21nm
Figure 5.1 Chemical structure o f cis-PBO. At least tw o sites o f N or O are protonated by strong acids. Length scale is from K. Tashiro and M. Kobayashi, Macromolecules 2 4 ,3706(1991).
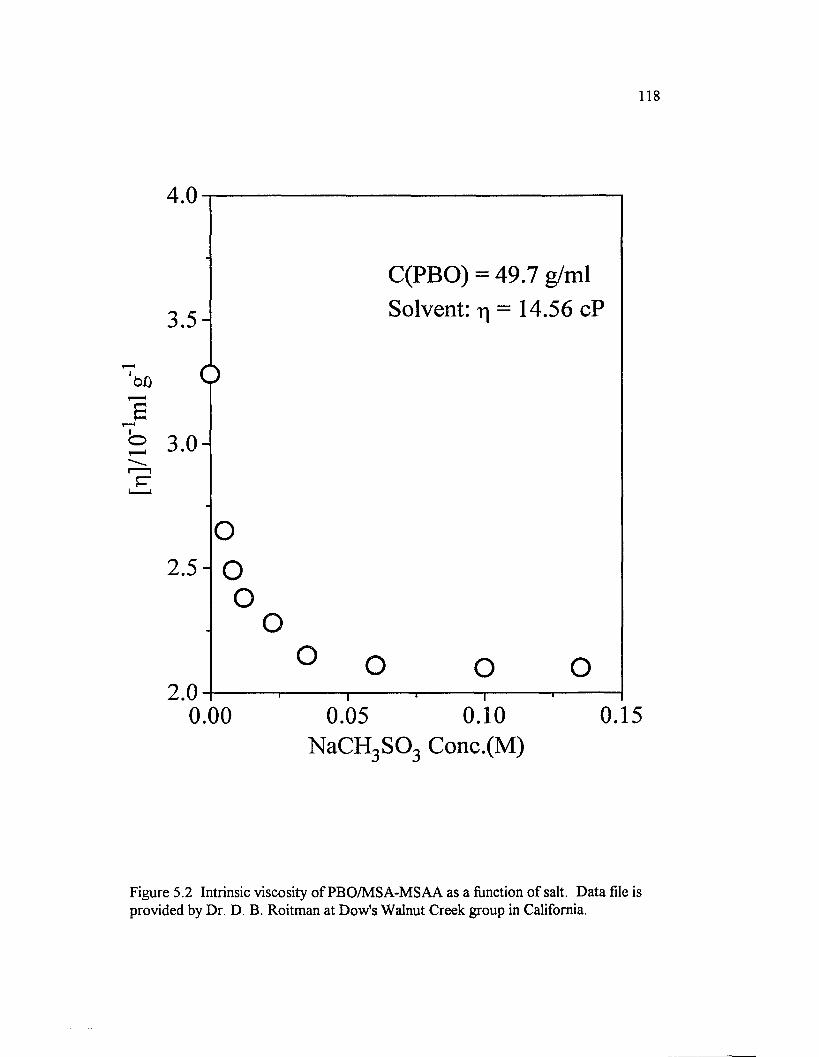
118
4.0
C(PBO) = 49.7 g/ml 2 g . Solvent: r| = 14.56 cP
o
o2.5-| O
o oo
2.0o o o
0.00 0.05 0.10 0.15NaCH3S 0 3 Conc.(M)
Figure 5.2 Intrinsic viscosity o f PBO/M SA-M SAA as a function o f salt. Data file is provided by Dr. D. B. Roitman at Dow's Walnut Creek group in California.
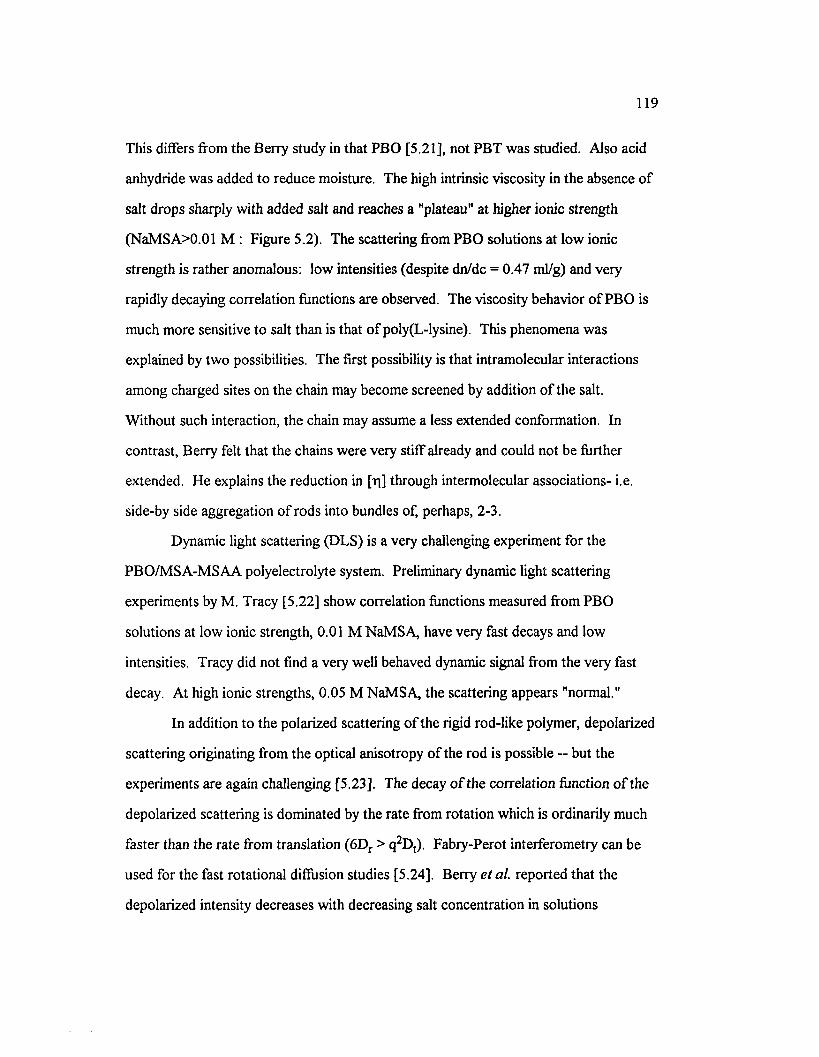
119
This differs from the Berry study in that PBO [5.21], not PBT was studied. Also acid
anhydride was added to reduce moisture. The high intrinsic viscosity in the absence o f
salt drops sharply with added salt and reaches a "plateau" at higher ionic strength
(NaMSA>0.01 M : Figure 5.2). The scattering from PBO solutions at low ionic
strength is rather anomalous: low intensities (despite dn/dc = 0.47 ml/g) and very
rapidly decaying correlation functions are observed. The viscosity behavior o f PBO is
much more sensitive to salt than is that o f poly(L-lysine). This phenomena was
explained by tw o possibilities. The first possibility is that intramolecular interactions
among charged sites on the chain may become screened by addition o f the salt.
W ithout such interaction, the chain may assume a less extended conformation. In
contrast, Berry felt that the chains were very stiff already and could not be further
extended. He explains the reduction in [r|] through intermolecular associations- i.e.
side-by side aggregation o f rods into bundles of, perhaps, 2-3.
Dynamic light scattering (DLS) is a very challenging experiment for the
PBO/M SA-M SAA polyelectrolyte system. Preliminary dynamic light scattering
experiments by M. Tracy [5.22] show correlation functions measured from PBO
solutions at low ionic strength, 0.01 M NaM SA, have very fast decays and low
intensities. Tracy did not find a very well behaved dynamic signal from the very fast
decay. At high ionic strengths, 0.05 M NaMSA, the scattering appears "normal."
In addition to the polarized scattering o f the rigid rod-like polymer, depolarized
scattering originating from the optical anisotropy o f the rod is possible -- but the
experiments are again challenging [5.23]. The decay o f the correlation function o f the
depolarized scattering is dominated by the rate from rotation which is ordinarily much
faster than the rate from translation ( 6 Dr > q2 D J. Fabry-Perot interferometry can be
used for the fast rotational diffusion studies [5.24], Berry et al. reported that the
depolarized intensity decreases with decreasing salt concentration in solutions
120
containing the PBT type rod. Depolarized scattering o f PBT also has been measured
by Crosby et al. Their point o f view was to characterize its conformation and to
estimate the polydispersity o f a polymer sample. Extensive measurements, in the
present work, have been conducted using the ALV-5000 correlator with several
different salt and concentration ranges. The ALV-5000 is a vastly superior correlator
to those o f the Berry [5.21] or Crosby [5.23] studies. Special emphasis is devoted to
the decay mode at low salt condition. Even though no definite interpretation is yet
available, there are several interesting observations, such as the absence o f the ordinary
O-E transition and the presence o f an undefined fast decay mode at low salt condition,
in both polarized and depolarized scattering.
5 .2 E X P E R IM E N T A L
5.2.1 M A TE R IA LS
The PBO were provided by Dow's Walnut Creek group in California, and each
solution was prepared by Dr. D. B. Roitman. The solvent and solutions were subjected
to N 2 bubbling before filtering, and were filtered under an N 2 blanket. A 0.2 pm PTFE
filter was used for filtering and the sample was saved in 1 0 mm clean test tubes, which
had been dedusted and tested at LSU and then sent to Dow for loading. Every sample
cell was sealed by a PTFE - faced screw cap, wrapped with aluminum foil and kept in a
desiccator with N 2 atmosphere before and after measurement to prevent oxidation and
photo-degradation. Table 5.1 summarizes the samples, which differ by molecular
weight, concentration, and salt condition o f PBO/MSA-MSAA. Commercial M SA
was distilled and standardized by saturating the M SA fractions with M SAA to control
the w ater content. The strongly corrosive nature o f solvent requires special handling
precautions and details appear elsewhere [5.25], Length scales o f the polyelectrolytes
also appear in the table. Relatively high molecular weight PBO samples (approximate
numbers M = 78,000, [r|] = 2,000 ml/g, L = 400 nm & L/Q = 13, where L is the
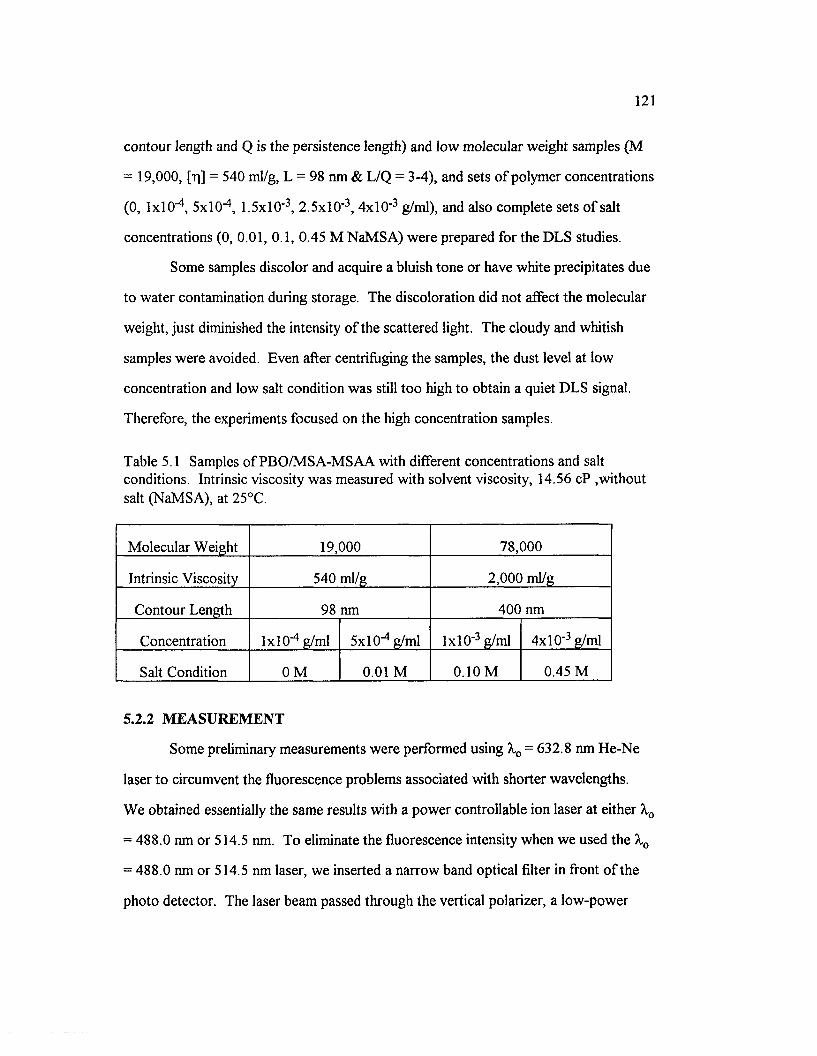
121
contour length and Q is the persistence length) and low molecular weight samples (M
= 19,000, [rj] = 540 ml/g, L = 98 nm & L/Q = 3-4), and sets o f polymer concentrations
(0, lx lO -4, 5x10^, 1.5xlO'3, 2 .5 x l0 '3, 4 x l0 " 3 g/ml), and also complete sets o f salt
concentrations (0, 0.01, 0.1, 0.45 M NaM SA) were prepared for the DLS studies.
Some samples discolor and acquire a bluish tone or have white precipitates due
to water contamination during storage. The discoloration did not affect the molecular
weight, just diminished the intensity o f the scattered light. The cloudy and whitish
samples were avoided. Even after centrifuging the samples, the dust level at low
concentration and low salt condition was still too high to obtain a quiet DLS signal.
Therefore, the experiments focused on the high concentration samples.
Table 5.1 Samples o f PBO/M SA-M SAA with different concentrations and salt conditions. Intrinsic viscosity was measured with solvent viscosity, 14.56 cP .without salt (NaMSA), at 25°C.
M olecular Weight 19,000 78,000
Intrinsic Viscosity 540 ml/g 2 , 0 0 0 ml/g
Contour Length 98 nm 400 nm
Concentration lxlO "4 g/ml 5x10"4 g/ml lxlO " 3 g/ml 4x10 ' 3 g/ml
Salt Condition 0 M 0.01 M 0.10 M 0.45 M
5.2.2 M EA SU R E M E N T
Some preliminary measurements were performed using X0 = 632.8 nm He-Ne
laser to circumvent the fluorescence problems associated with shorter wavelengths.
W e obtained essentially the same results with a pow er controllable ion laser at either X0
= 488.0 nm or 514.5 nm. To eliminate the fluorescence intensity when we used the X0
= 488.0 nm or 514.5 nm laser, we inserted a narrow band optical filter in front o f the
photo detector. The laser beam passed through the vertical polarizer, a low-power
122
Glan-Thomson polarizer (Karl Lambrecht MGT3E5; 1W cm"2), and was narrowed by
using a lOx microscope objective. The focused beam decreases the diameter o f the
scattering region which helps avoid dust and also increases the size o f the coherence
area. High coherence area allows one to maximize the power per coherence area. This
narrow beam illuminates the sample which was held in a refractive index matching bath
o f toluene. A neutral density filter is used to greatly reduce the back-reflected beam at
the air-glass interface o f the matching bath. The scattered light passed through an
analyzer and then through the optical filter having the same wavelength as the incident
light. Polarized and depolarized measurements were done by changing the angle o f the
polarizer and analyzer (details in Chapter 2). These signals were collected by a EM I-
9863a PM tube, passed through the amplifier/discriminator, and sent to the ALV-5000
correlator. Samples which had some dust were centrifuged several hours at 5,000 rpm
(4800 g, g is proportional to co2 r, where co is the angular speed and r is the radius, « 10
cm ). Several hundred runs were collected to increase the acquisition time and were
selectively averaged with new software called ALVAN. ALVAN is an in-house
developed program for correlation function analysis for data gathered from the ALV.
It enables cumulant fitting, multiple summing, non-ergodic analysis, etc. Figure 5.3
compares a single run and an average o f 50 runs. A single 30 s measurement exhibits
high frequency noise, but in the sum o f 50 runs, the high frequency portion has become
quiet enough to obtain accurate results.
5.3 RESULTS
5.3.1 SIG N A L C O N SID ER A TIO N
At high salt and high polymer concentration, the scattering signal is relatively
strong and the autocorrelation function is easily measured.
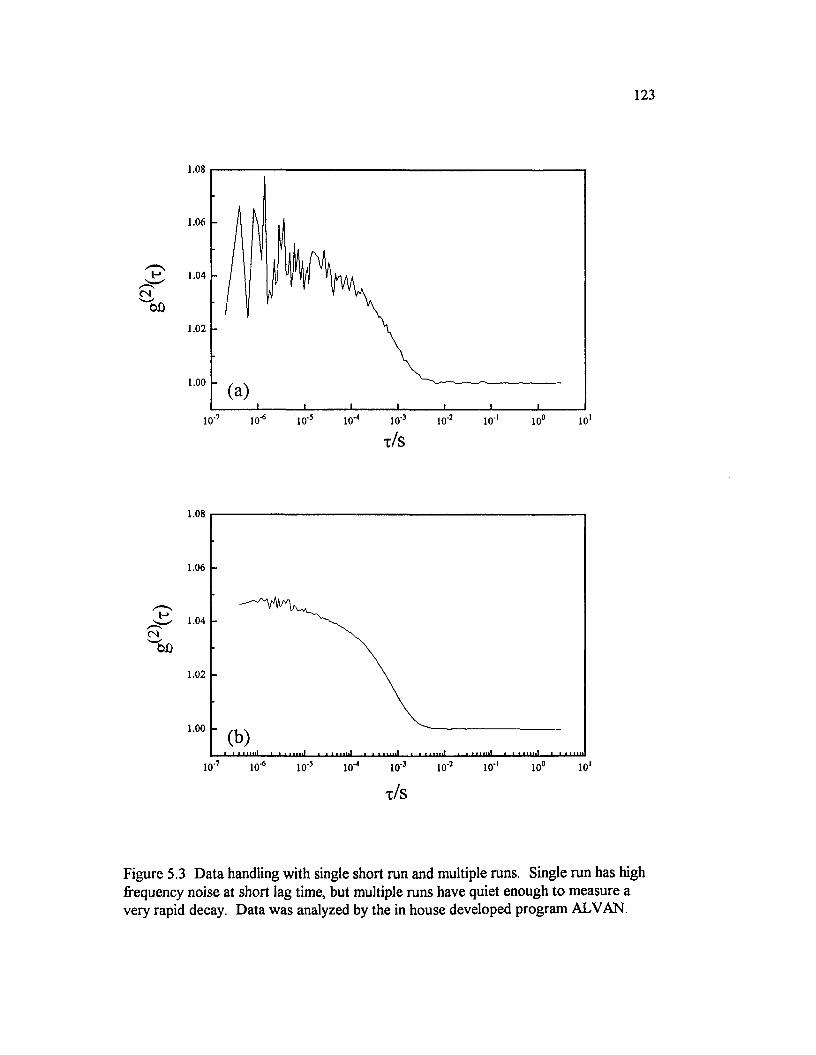
123
1.08
1.06
1.04
1.02
1.00
1 0 "* 1 0 1 1 0 ° 1 0 1
t / s
1.08
1.06
1.04CN
1.02
1.00
1 0 11 0 °
x /s
Figure 5.3 D ata handling with single short run and multiple runs. Single run has high frequency noise at short lag time, but multiple runs have quiet enough to measure a very rapid decay. Data was analyzed by the in house developed program ALVAN.
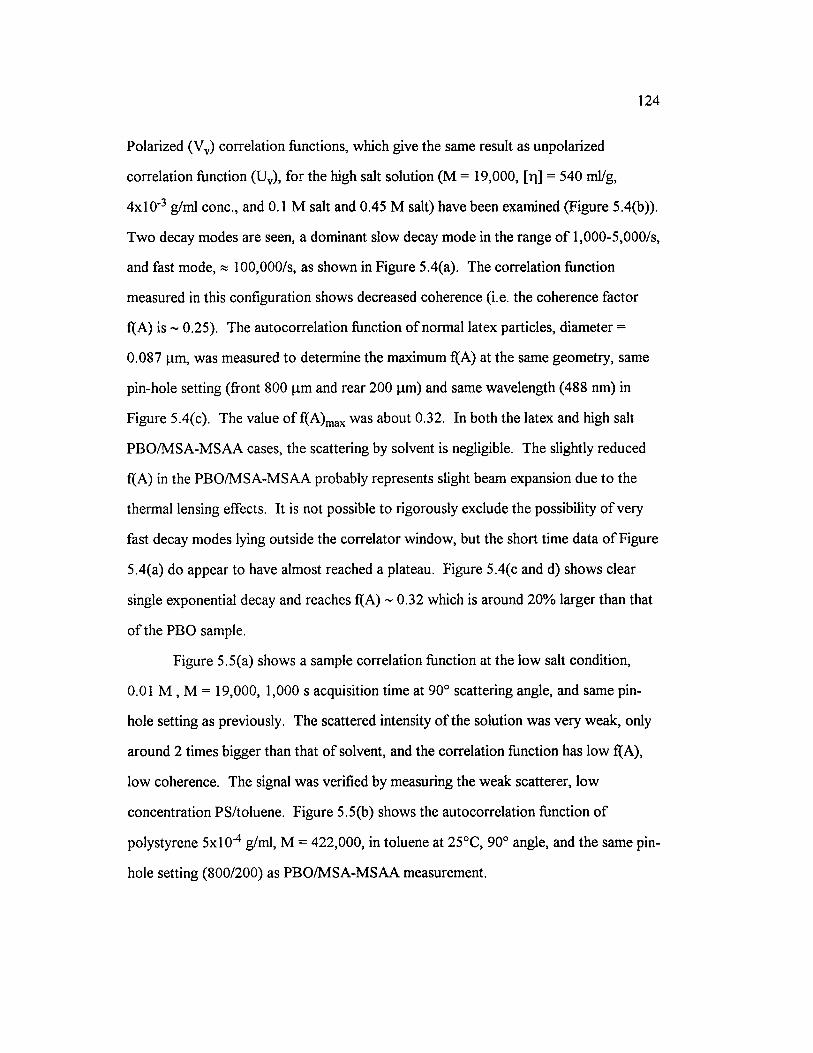
124
Polarized (Vv) correlation functions, which give the same result as unpolarized
correlation function (Uv), for the high salt solution (M = 19,000, [r|] = 540 ml/g,
4 x l0 ' 3 g/ml conc., and 0.1 M salt and 0.45 M salt) have been examined (Figure 5.4(b)).
Two decay modes are seen, a dominant slow decay mode in the range o f 1,000-5,000/s,
and fast mode, « 100,000/s, as shown in Figure 5.4(a). The correlation function
measured in this configuration shows decreased coherence (i.e. the coherence factor
f(A) is ~ 0.25). The autocorrelation function o f normal latex particles, diameter =
0.087 pm, was measured to determine the maximum f(A) at the same geometry, same
pin-hole setting (front 800 pm and rear 200 pm) and same wavelength (488 nm) in
Figure 5.4(c). The value o f f(A)max was about 0.32. In both the latex and high salt
PBO/M SA-M SAA cases, the scattering by solvent is negligible. The slightly reduced
f(A) in the PBO/M SA-M SAA probably represents slight beam expansion due to the
thermal lensing effects. It is not possible to rigorously exclude the possibility o f very
fast decay modes lying outside the correlator window, but the short time data o f Figure
5.4(a) do appear to have almost reached a plateau. Figure 5.4(c and d) shows clear
single exponential decay and reaches f(A) ~ 0.32 which is around 20% larger than that
o f the PBO sample.
Figure 5.5(a) shows a sample correlation function at the low salt condition,
0.01 M , M = 19,000, 1,000 s acquisition time at 90° scattering angle, and same pin
hole setting as previously. The scattered intensity o f the solution was very weak, only
around 2 times bigger than that o f solvent, and the correlation function has low f(A),
low coherence. The signal was verified by measuring the weak scatterer, low
concentration PS/toluene. Figure 5.5(b) shows the autocorrelation function o f
polystyrene 5x1 O' 4 g/ml, M = 422,000, in toluene at 25°C, 90° angle, and the same pin
hole setting (800/200) as PBO/M SA-M SAA measurement.
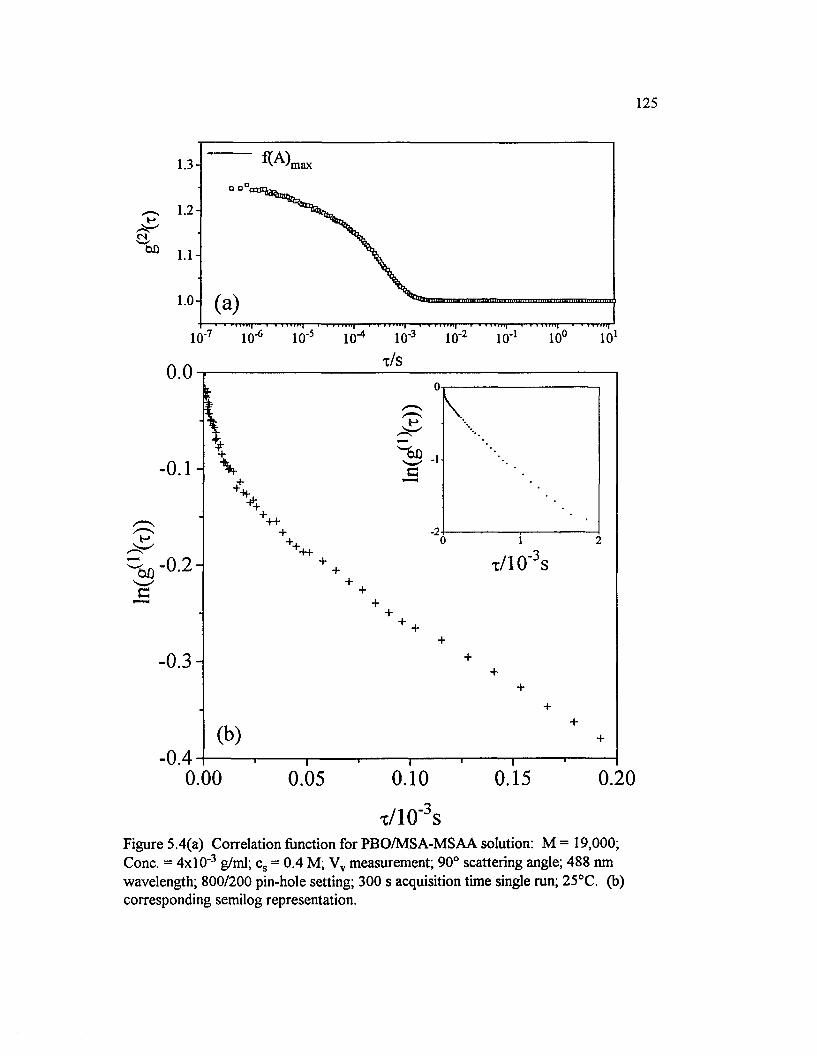
125
m ax
1. 0 -
TTTT
t / s0.0
-0 .1 -
-0.2 -
- 0 .3 -
-0 .40 .0 0 0 .0 5 0 .1 0 0 .1 5 0 .2 0
t/ 1 0 ' 3s
Figure 5.4(a) Correlation function for PBO/M SA-M SAA solution: M = 19,000; Cone. = 4x10 ' 3 g/ml; cs = 0.4 M; Vv measurement; 90° scattering angle; 488 nm wavelength; 800/200 pin-hole setting; 300 s acquisition time single run; 25°C. (b) corresponding semilog representation.
126
1 .2 -
cs'"on
1 .0 -
1 0 '
0 . 0
-i-
- 0 .2 -
-2 -
0.50 . 0
c -0.4-
- 0 . 6 -
0 . 0 0.40 . 2
t/ 1 0 ’3s
Figure 5.4(c) Correlation function with strongly scattered latex, 0.087 p.m, solution under the same pin-hole setting (800/200), X = 488 nm. (d) corresponding semilog representation.

127
csCd)
1.3-
1 .2 -
1 . 1 -
1 .0 -
-—
° □°u°Drf,o,
X.(a)
i i 11 m i f - T T 11 l in y
1 0,-7
1 0 H 1 0 -| i v rTivii| i i i ivvii | v i i i
1 0 " 1 0i-3
1 0r2
1 0-1
1 0 °
x/s1 0 1
CM
bD
f(A)1.3 max
1 . 2
1 . 1
1 . 0
1 0 °
x/s
Figure 5.5(a) Correlation function for low salt condition o f PBO/M SA-M SAA solution: M = 19,000; Cone. = 4x1 O' 3 g/ml; cs = 0 M; Vv measurement; 90° scattering angle; 488 nm wavelength; 800/200 pin-hole settings; 1,000 s acquisition time single run; 25°C. (b) The comparison o f correlation function with low f(A) polystyrene (M = 422,000) in toluene under the same pin-hole setting (800/200), 90° scattering angle; 488 nm wavelength.
128
The intensity ratio between PS and toluene is adjusted to be close to the same ratio as
PBO and MSA, Ips/toi^tol= IpBO^soivent ~ 2 which gives the similar f(A) value as the
low salt PBO sample. PS/toluene with low f(A), 0.2, gives a clear correlation function
plateau even despite the low coherence. As the low time value o f g(2M approaches
f(A)max> there is probably not too much rapidly decaying signal that has been missed in
the PBO/M SA low salt samples. However, future studies would benefit from a
correlator capable o f measuring at shorter decay times.
5.3.2 SIMPLE ANALYSIS
5.3.2.1 POLARIZED MEASUREMENTS
A series o f autocorrelation functions for high molecular weight (M = 78,000,
[r|] = 2,000 ml/g in 0.1 M NaM SA, 4 x l0 " 3 g/ml conc.) is shown in Figure 5.6(a). The
bimodal, or possibly more complex, nature o f the decay at high salt is clearly evident
from the semilogarithmic representation in Figure 5.6(b). As salt concentration
decreases, the dominant slower mode disappears while the fast mode remains in the
polarized scattering. The correlation function for the solvent itself was measured with
3,000 s sample time (400 runs @ 20 s, keeping « 40% o f the runs) and is shown in the
same plot. It is clear that the weak fast mode cannot be attributed to the complex
nature o f the solvent, or to afterpulsing or other common short-time artifacts. When
the concentration decreased from 4x10 ' 3 g/ml to IxlO ' 3 g/ml (not shown), trends o f the
slow and fast mode decay, slow and fast mode at high salt and only fast mode at low
salt condition, are the same.
Figure 5.7 is the same type o f plot as Figure 5.6 but for the low molecular
weight samples. The top plot has already appeared as Figure 5.4 (a). A slight
improvement in coherence over that in Figure 5.6 is due to the increased power o f the
laser and smaller pin-hole settings.
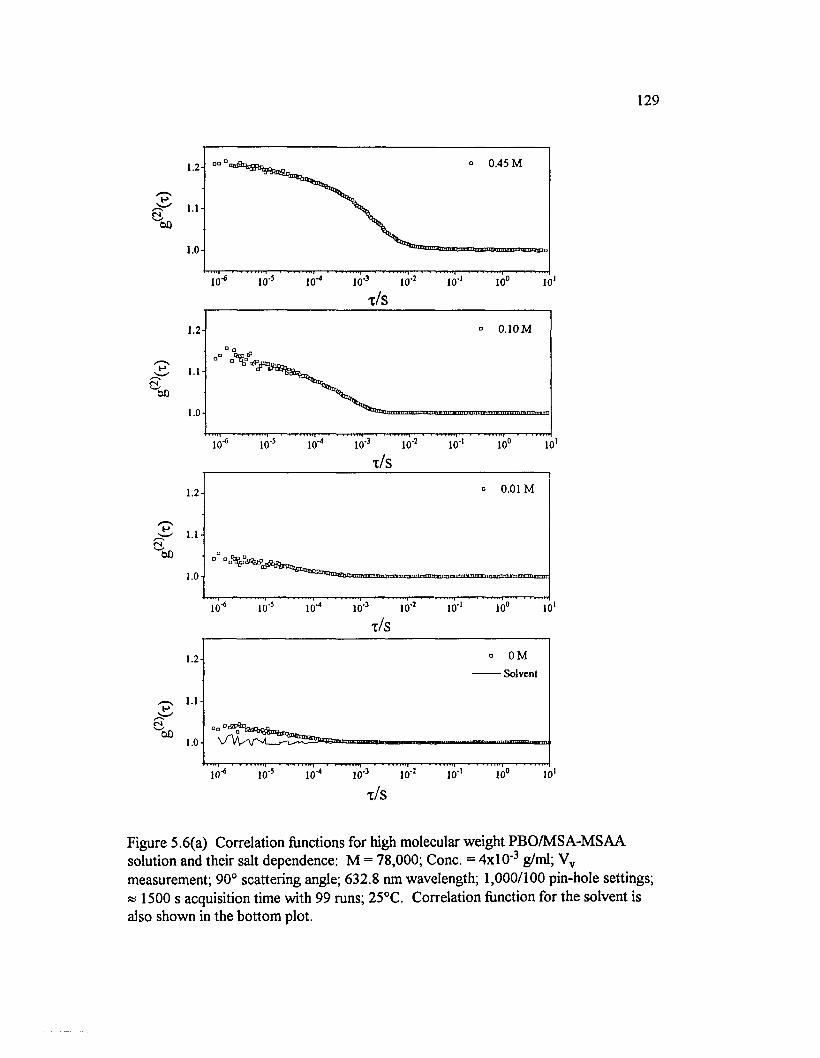
129
□□ Di1 .2 -
'"'00
x/s
0 0
° 0 .1 0 M1.2
1.1
1.0
x/s
1 .2 -
/w'1 .1 -<N
0 0
1 .0 -
0 0
1 .2 -
1 .1 -
1 .0 -
° 0.01 M
Solvent
1 0 -" 1 0
Figure 5.6(a) Correlation functions for high molecular weight PBO/M SA-M SAA solution and their salt dependence: M = 78,000; Cone. = 4 x l0 " 3 g/ml; Vv measurement; 90° scattering angle; 632.8 nm wavelength; 1,000/100 pin-hole settings; « 1500 s acquisition time with 99 runs; 25°C. Correlation function for the solvent is also shown in the bottom plot.
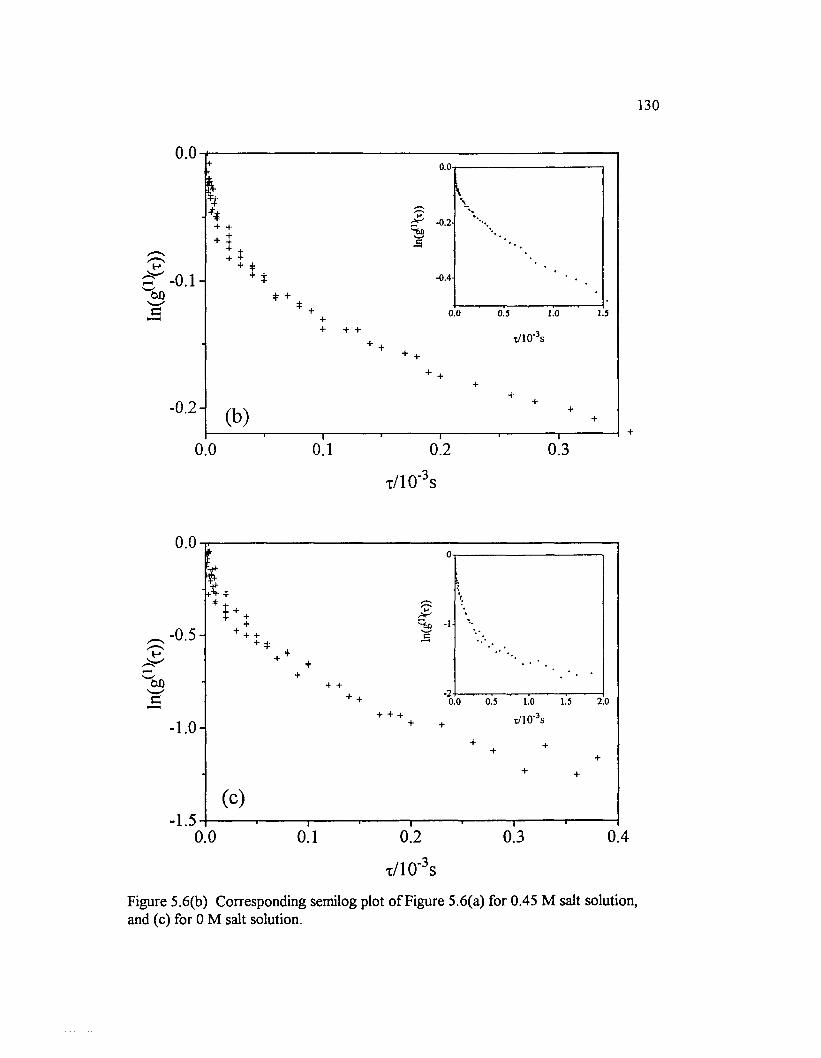
ln(g
(t))
ln(g
u;(x
))
130
0.0-
+ + + +
- 0 . 1 -* +
0.0
i r ' -o. 2v-6o£
-0.4
++ + +
0.0 0.5 1.0 1.5
t /1 0 ‘3S
- 0 .2 - (b)o .o
T0.1 0.2 0.3
t/ 1 0 ' 3 s
0 . 0
-0.5-
t
- 1.0
-1.5
+ ++ *
+ + +0.0 0.5 1.0 1.5 2.0
t / 1 0 ' 3s
(C )
0 .0 " o T 0.2
x/10"3s
0.3 0.4
Figure 5.6(b) Corresponding semilog plot o f Figure 5.6(a) for 0.45 M salt solution, and (c) for 0 M salt solution.
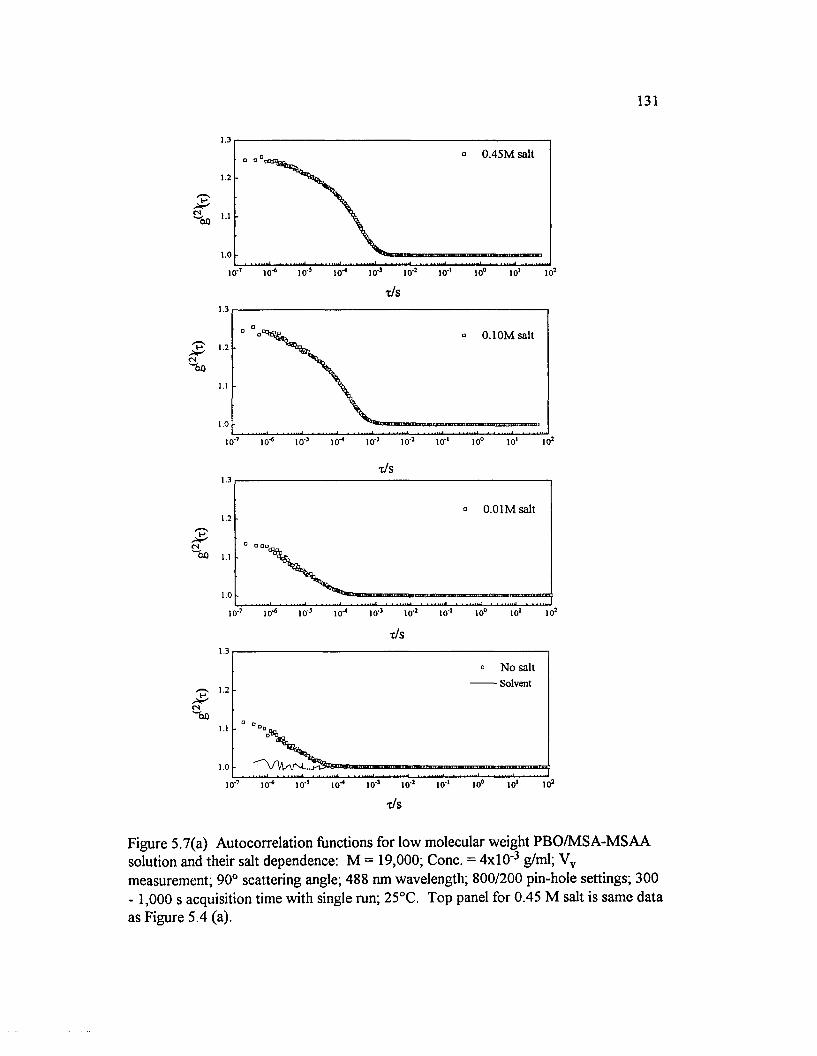
131
° 0.45M salt
1.0
1CT
1
° O.lOMsaltlH ,
1 0 '5 1 0 '2 1 0 '1
t / si
° O.OlMsaltl
iso l
t/ s
1
° No salt Solvent
Figure 5.7(a) Autocorrelation functions for low molecular weight PBO/M SA-M SAA solution and their salt dependence: M = 19,000; Cone. = 4 x l0 " 3 g/ml; Vv measurement; 90° scattering angle; 488 nm wavelength; 800/200 pin-hole settings; 300 - 1,000 s acquisition time with single run; 25°C. Top panel for 0.45 M salt is same data as Figure 5.4 (a).
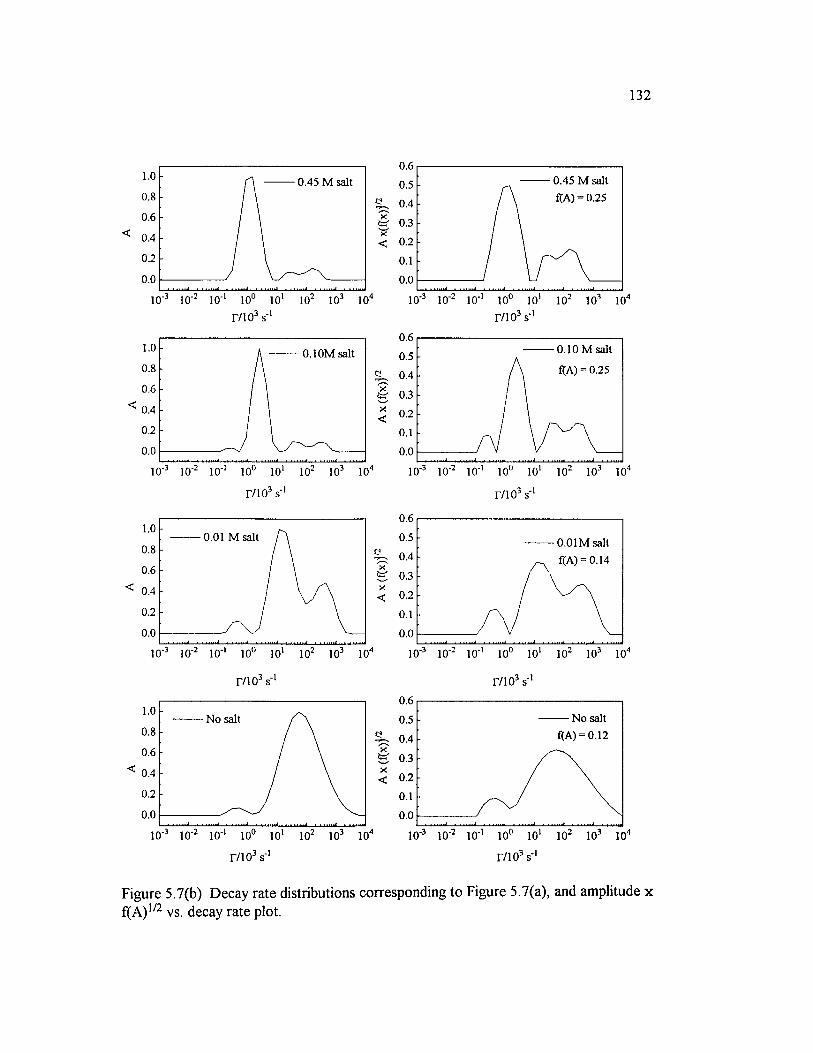
132
0.61.0 0.45 M salt 0.50.8 ^ 0.4
S 03 < 0.2
0.1
0.6
< 0.4
0.2
0.0 0.0
r / io V r/io 3 s'.3 „-l
0.61.0 0.10 M salt0.10M salt 0.50.8 f{A) = 0.250.40.6
< 0.40.3
< 0.2
0.10.2
0.0 0.0•3 ■2 ,0 |1 ,4 ■3 •2 .3 ,4,2 |3 ,0
r/ioJ s.3 r/io 3 s'3 „-l
0.61.0
0.01 M salt 0.50.8
7=: 0 40.6
< 0.4S 0.3 x< 0.2
0.2 0.1
0.0 0.0■3 •2 .0 ,0 |3,1 ,2 ,3 |4 |4
r/io 3 s,3 „-l r / io V0.6
1.0No salt 0.5
0.8 0.4/•—s
g 0.3 < 0.2
0.6
< 0.4
0 . 2 0.1
0.0 0.0•3 ■2 ,0 ,4 •3 •2 1 |0 ,2 ,3,2 ,3 |4
r/io 3 s',3 r/io 3 s-1
Figure 5.7(b) Decay rate distributions corresponding to Figure 5.7(a), and amplitude x f(A ) 1 / 2 vs. decay rate plot.
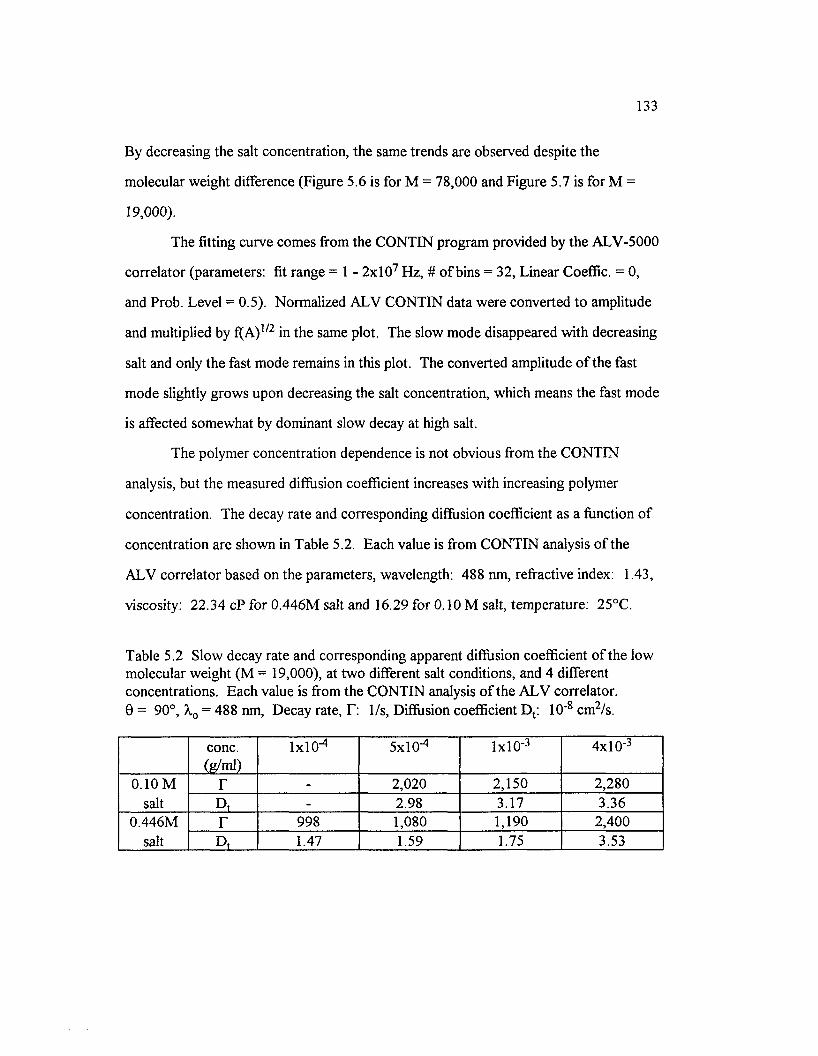
133
By decreasing the salt concentration, the same trends are observed despite the
molecular weight difference (Figure 5.6 is for M = 78,000 and Figure 5.7 is for M =
19,000).
The fitting curve comes from the CONTIN program provided by the ALV-5000
correlator (parameters: fit range = 1 - 2 x l0 7 Hz, # o f bins = 32, Linear Coeffic. = 0,
and Prob. Level = 0.5). Normalized ALV CONTIN data were converted to amplitude
and multiplied by f(A ) 1 / 2 in the same plot. The slow mode disappeared with decreasing
salt and only the fast mode remains in this plot. The converted amplitude o f the fast
mode slightly grows upon decreasing the salt concentration, which means the fast mode
is affected somewhat by dominant slow decay at high salt.
The polymer concentration dependence is not obvious from the CONTIN
analysis, but the measured diffusion coefficient increases with increasing polymer
concentration. The decay rate and corresponding diffusion coefficient as a function o f
concentration are shown in Table 5.2. Each value is from CONTIN analysis o f the
ALV correlator based on the parameters, wavelength: 488 nm, refractive index: 1.43,
viscosity: 22.34 cP for 0.446M salt and 16.29 for 0.10 M salt, temperature: 25°C.
Table 5.2 Slow decay rate and corresponding apparent diffusion coefficient o f the low molecular weight (M = 19,000), at tw o different salt conditions, and 4 different concentrations. Each value is from the CONTIN analysis o f the ALV correlator.0 = 90°, X0 = 488 nm, Decay rate, T : 1/s, Diffusion coefficient Dt: 10' 8 cm 2 /s.
conc.(g/ml)
1 x 1 0 ^ 5x1 O' 4 lx l 0 ’ 3 4x10 ’ 3
0.10 M salt
r - 2 , 0 2 0 2,150 2,280D, - 2.98 3.17 3.36
0.446Msalt
r 998 1,080 1,190 2,400D, 1.47 1.59 1.75 3.53
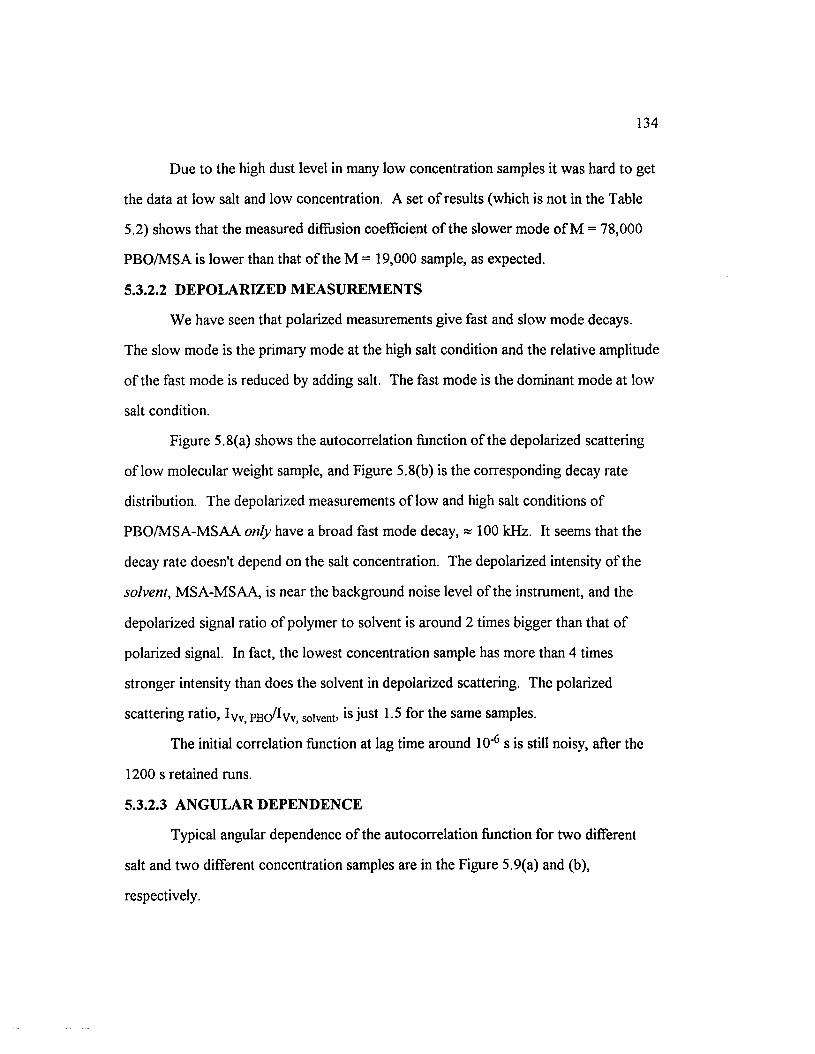
134
Due to the high dust level in many low concentration samples it was hard to get
the data at low salt and low concentration. A set o f results (which is not in the Table
5.2) shows that the measured diffusion coefficient o f the slower mode o f M = 78,000
PBO/M SA is lower than that o f the M = 19,000 sample, as expected.
5.3.2.2 DEPOLARIZED MEASUREMENTS
W e have seen that polarized measurements give fast and slow mode decays.
The slow mode is the primary mode at the high salt condition and the relative amplitude
o f the fast mode is reduced by adding salt. The fast mode is the dominant mode at low
salt condition.
Figure 5.8(a) shows the autocorrelation function o f the depolarized scattering
o f low molecular weight sample, and Figure 5.8(b) is the corresponding decay rate
distribution. The depolarized measurements o f low and high salt conditions o f
PBO/M SA-M SAA only have a broad fast mode decay, « 100 kHz. It seems that the
decay rate doesn't depend on the salt concentration. The depolarized intensity o f the
solvent, M SA-M SAA, is near the background noise level o f the instrument, and the
depolarized signal ratio o f polymer to solvent is around 2 times bigger than that o f
polarized signal. In fact, the lowest concentration sample has more than 4 times
stronger intensity than does the solvent in depolarized scattering. The polarized
scattering ratio, IVv pbc/^Vv, solvent- is just 1.5 for the same samples.
The initial correlation function at lag time around 10*6 s is still noisy, after the
1 2 0 0 s retained runs.
5.3.2.3 ANGULAR DEPENDENCE
Typical angular dependence o f the autocorrelation function for tw o different
salt and tw o different concentration samples are in the Figure 5.9(a) and (b),
respectively.

° No salt
1.4 oo
--------Solvent
<N"to
°n
1.2 ■
1.0 ... ........... .10'7 10-* 10's 10“* 10° 10'2 10'1 10° 101 10J
t/ s
Figure 5.8(a) Correlation function o f depolarized measurement o f PBO/M SA-M SAA solution and their salt dependence: M = 19,000; Cone. = 4 x l0 " 3 g/ml; H v measurement; 90° scattering angle; 488 nm wavelength; 800/200 pin-hole settings; 1 2 0 0 s acquisition time with single run; 25°C.
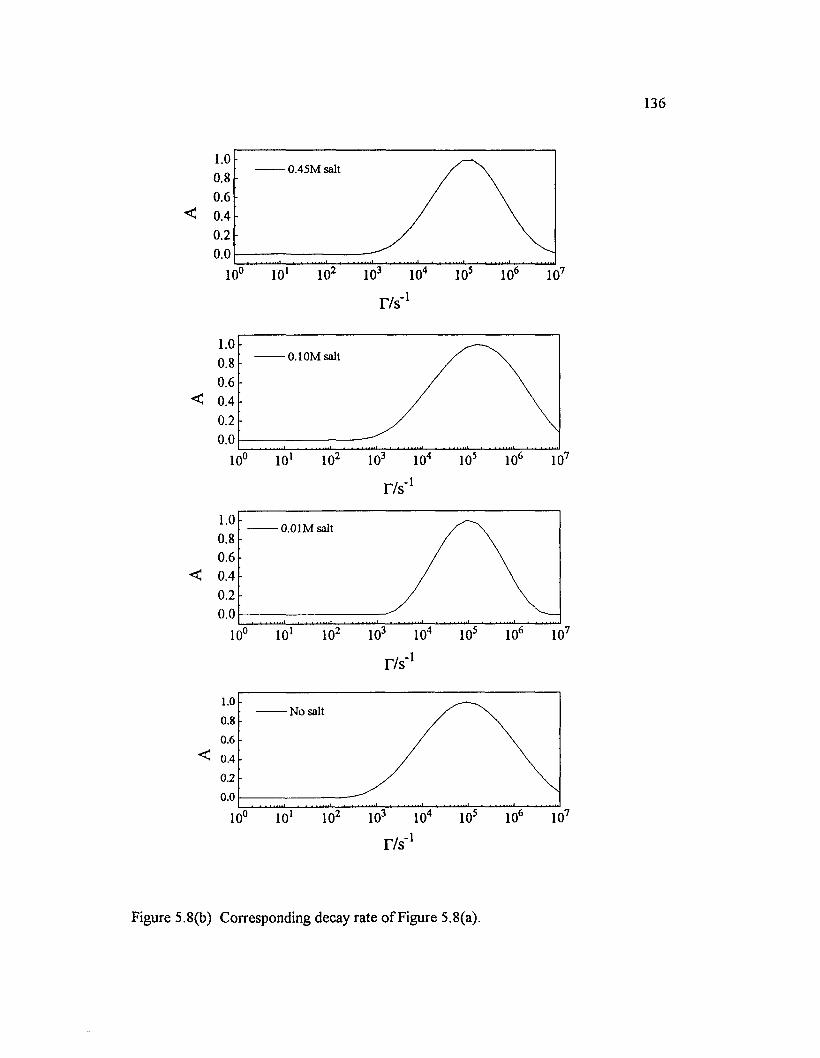
1 . 0
0 . 8
0 . 6
0.40 . 2
0 . 0
0.45M salt
>3a l4 ,5 ,6|0 ,1
T / s 1
1 . 0
0 . 8
0 . 6
< 0.40 . 2
0 . 0
0.10M salt
,3 >7|4 ,5,0 |21
r/s'1
1.00.80.6
0.01M salt
0.20.0
fi ,6 J,3 ,4,0 ,2
r/s'1
1.0No salt
0.80.6
^ 0.40.2
0.0
Figure 5.8(b) Corresponding decay rate o f Figure 5.8(a).

137
M easurement was performed at 6 different angles, 30°, 45°, 60°, 90°, 120°, and 135°
at 25°C, = 632.8 nm, using a single run for the high molecular weight (M = 78,000)
samples (Figure 5.9(a) and (c)). For the low molecular weight sample, A,0 = 514.5 nm,
5 different angles, and multiple runs were used (Figure 5.9(b) and (d)). The correlation
function for the scattering angle 90° and 120° in Figure 5.9(d) is not shown because we
changed the pin-hole settings and power o f the laser at this point.
Two data-fitting routines were applied in an attempt to identify decay rates T
and amplitudes A o f those correlation plots. Linear q2 dependence o f the 3rd cumulant
(channel selection = 3 - 128, weight 1) T o f the high molecular weight, M = 78,000,
high concentration (4 x l0 ' 3 g/ml), at various salt conditions, is shown in Figure 5.10.
The behavior in high salt is normal which means there is a zero intercept and finite
slope in the plot o f T vs. q2. The slopes, translational diffusion coefficients, in 0.45 M
and 0.1 M salt solutions are 3 .0 6 x l0 '8 cm2/s and 1.26xl0 '7 cm 2 /s, respectively.
However, the low salt sample shows a huge intercept and deviation from the linear
fitting line. The abnormal behavior at the low salt condition was re-analyzed by two
exponential decay and ALV-CONTIN analysis. When we analyze the data with
CONTIN in the ALV, there are two decay modes. The slow mode decay exhibits
typical diffusive behavior with a positive slope and zero intercept, but the fast mode has
a huge intercept and doesn't depend on the q vector.
A different concentration sample (0.4M NaM SA, 2x10 ' 3 g/ml), which is not
shown in the plot, also gives q-dependence o f the slow mode and q-independence o f
the fast mode. The fast mode in low salt seems q-independent. The angular
independence o f the fast mode is unclear except to note that the fast mode has a huge
intercept.
138
1.30
1 .2 5 -
v jw B1.2 0 -
1201351 .1 5 -
1.1 0 -
1 .0 5 -
1 .0 0 -
t / s
Figure 5.9(a) Angular dependence o f the autocorrelation functions for the high molecular weight PBO/M SA-M SAA solution at high salt condition: M = 78,000; Cone. = 4x10" 3 g/ml; cs = 0.45 M; Vv measurement; 6 different angles; 632.8 nm wavelength; 1,000/100 pin-hole setting; 30 s acquisition time with single run; 25°C, f(A)max = 0.40. (b) low molecular weight sample: M = 19,000; Cone. = 4x10 ' 3 g/ml; cs = 0.45 M; Vv measurement; 6 different angles; 514.5 nm wavelength; 600/100 pinhole settings; ~ 15,000 s acquisition time with multiple runs; 25°C, f(A)max = 0.70.
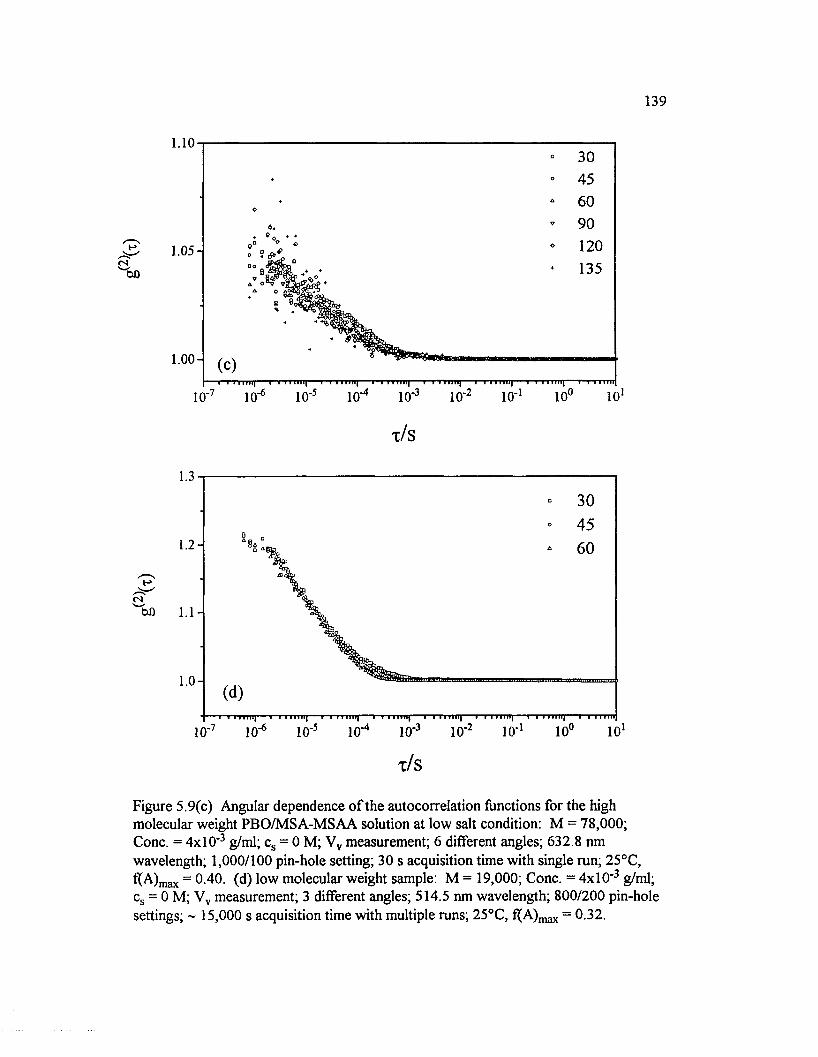
139
0 0
1.10
60
120135
1.05
1.0 0 -
t/ s
<N0 0
1 .0 -
x/s
Figure 5.9(c) Angular dependence o f the autocorrelation functions for the high molecular weight PBO/M SA-M SAA solution at low salt condition: M = 78,000; Cone. = 4x10 ‘ 3 g/ml; cs = 0 M; Vv measurement; 6 different angles; 632.8 nm wavelength; 1 ,0 0 0 / 1 0 0 pin-hole setting; 30 s acquisition time with single run; 25°C, f(A)max = 0.40. (d) low molecular weight sample: M = 19,000; Cone. = 4 x l0 ‘ 3 g/ml; cs = 0 M; Vv measurement; 3 different angles; 514.5 nm wavelength; 800/200 pin-hole settings; ~ 15,000 s acquisition time with multiple runs; 25°C, fl^A ),^ = 0.32.
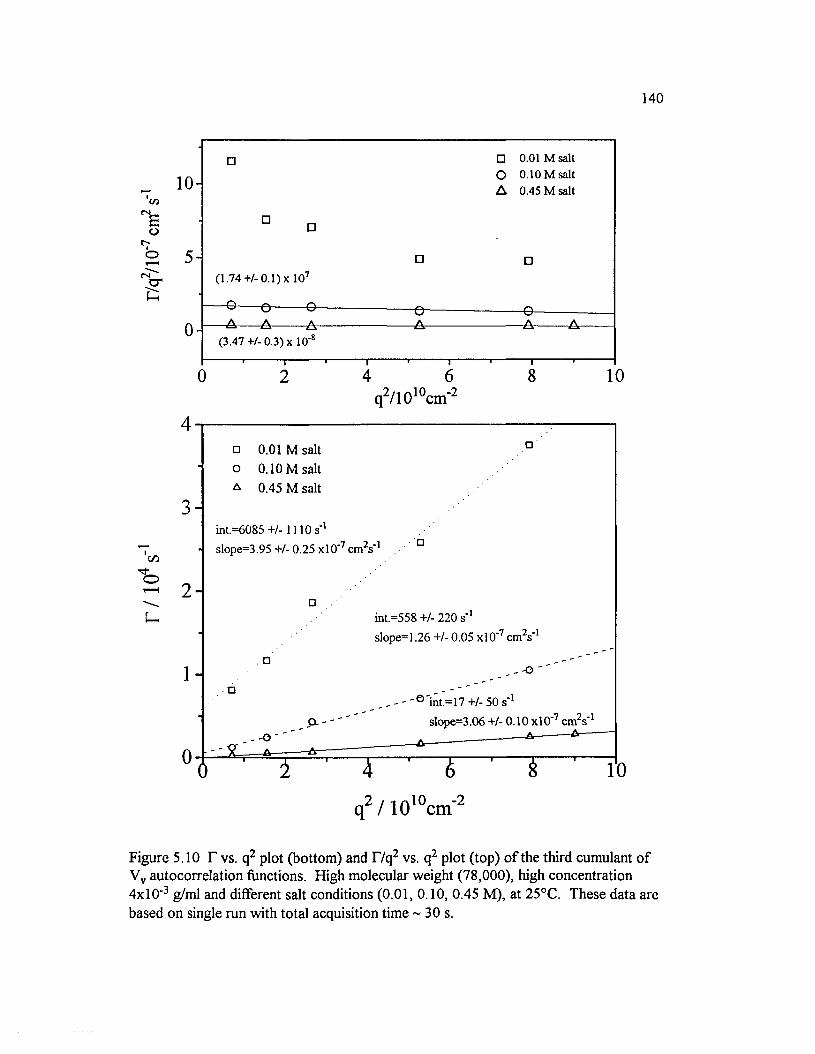
140
□
10-C/3
of 'o
i- 2
(1.74+/-0.1) x 107
0 - '
-©— ©--A A -(3.47 +/- 0.3) x 10'1
0
-A-
4 6q2/1010cm'2
□ 0.01 M saltO 0.10 M saltA 0.45 M salt
T "8 1 0
□ 0.01 M salto 0 . 1 0 M salta 0.45 M salt
co
int.=6085 +/- 1110 s'1 slope=3.95 +/- 0.25 xlO'7 c m V
1 -. o
int.=558 +/- 220 s'1slope=l .26 +/- 0.05 xlO"7 cm V 1
. , - ' ' e 'int^n+ASO s ' 1
slope=3.06 +/- 0.10 xlO"7 cm2s‘1
q /1 0 cm
Figure 5.10 T vs. q2 plot (bottom) and I7q 2 vs. q2 plot (top) o f the third cumulant o f Vv autocorrelation functions. High molecular weight (78,000), high concentration 4 x l0 ‘ 3 g/ml and different salt conditions (0.01, 0.10, 0.45 M), at 25°C. These data are based on single run with total acquisition time ~ 30 s.
141
The quiet data set o f Figure 5.9(b) and (d) shows the angular dependence o f the
slow mode and angular independence o f the fast mode. This quiet data set is used for
the further analysis.
5.3.3 CONTIN ANALYSIS WITH MULTIPLE RUNS
Previously, we have used CONTIN rather non-critically to provide a sketch o f
the decay profiles. We now take a closer look using CONTIN analysis with multiple
runs and multiple angles. The relation between normalized correlation function, g(x),
and distribution function, G(T), is a severely "ill-posed" problem. This means noise
contributions lead to a typically infinite set o f different distributions G(T) that are
consistent with the measured g(x). CONTIN is a package for inverting noisy linear
operator equations originated by S. Provencher. The basic principles o f ALV CONTIN
and the original CONTIN by Provencher, PRO CONTIN, are the same. However, the
tw o programs use a number o f different quadrature settings and different maximum bin
numbers (ALV's = 44, Povencher's = 6 6 as implemented in this laboratory). PRO
CONTIN analysis has been performed with a quiet data set.
To apply PRO CONTIN to the PBO/M SA polyelectrolyte system w e have
collected 50 to 200 runs and selected from these data files totaling more than 15,000 s
acquisition time. The correlation function was sufficiently quiet to perform the PRO-
CONTIN analysis. Figure 5.11 (a), (b), (c) and (d) show examples o f the PRO
CONTIN analysis o f high and low salt samples. One EXSAM P, which is a Laplace
inversion algorithm [5.26], fitting plot is also in Figure 5 .11(e).
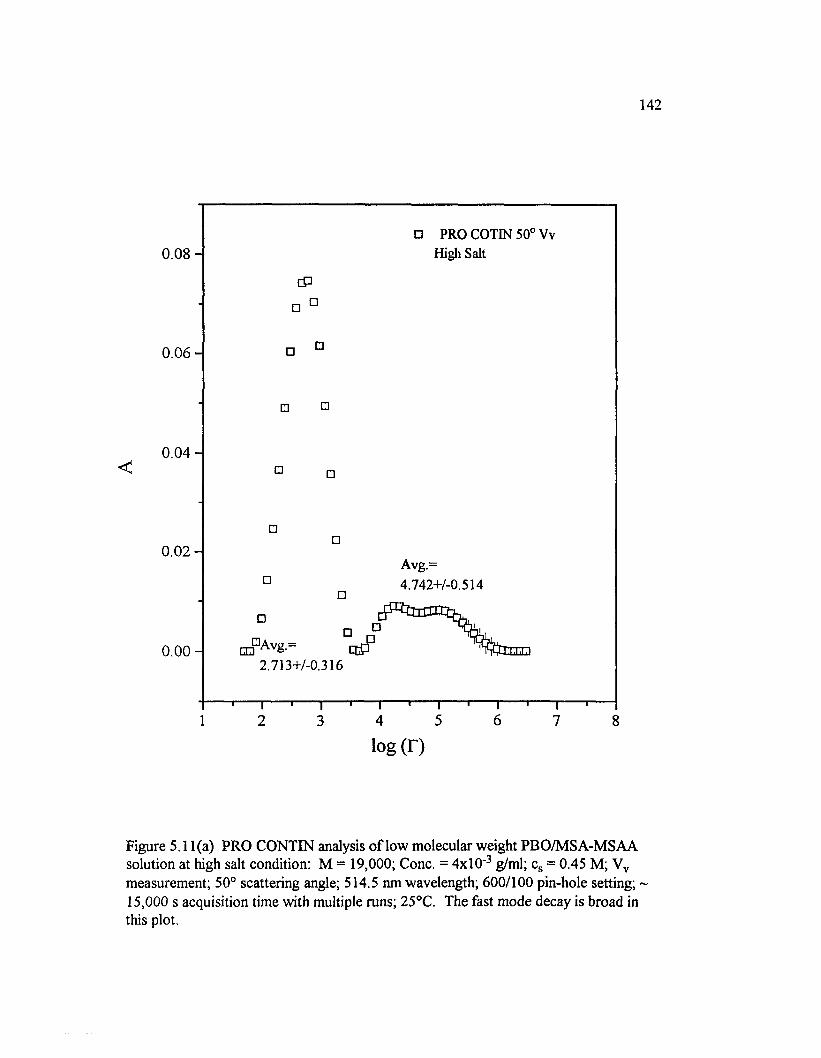
142
PRO COTIN 50° Vv High Salt0 .0 8 -
0 .0 6 -
0 .0 4 -<
0 .0 2 -Avg.=4.742+/-0.514
2.713+/-0.3160 .0 0 -
651 2 3 4 7 8
log (T)
Figure 5 .11(a) PRO CONTIN analysis o f low molecular weight PBO/M SA-M SAA solution at high salt condition: M = 19,000; Cone. = 4 x l0 ' 3 g/ml; cs = 0.45 M; Vv measurement; 50° scattering angle; 514.5 nm wavelength; 600/100 pin-hole setting; ~15,000 s acquisition time with multiple runs; 25°C. The fast mode decay is broad in this plot.
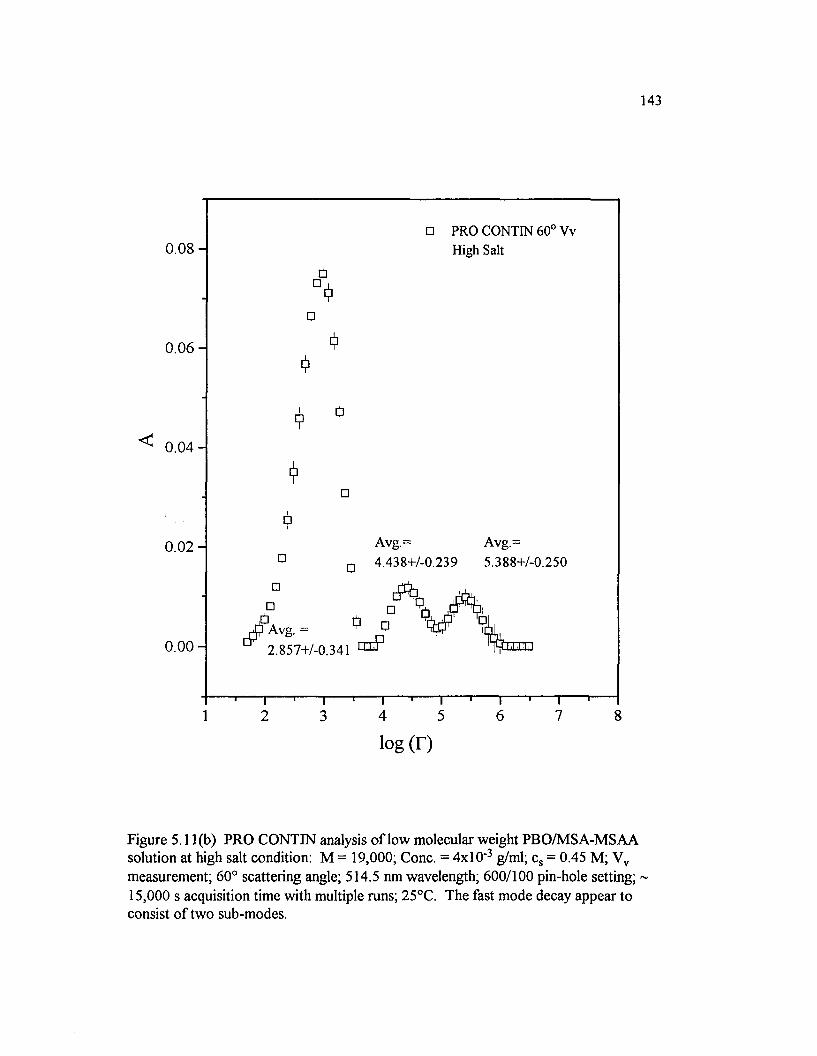
143
0 .0 8 -□ PRO CONTIN 60° Vv
High Salt
□$
0 .0 6 -
< 0 .0 4 -
0.0 2 -
0.0 0 -
$
*
□□
j p Ayg
□
Avg.= Avg.=4.438+/-0.239 5.388+/-0.250
2.857+/-0.341
0 0 ° raP a m
1------r— r2 3
1------'------T4 5
log (T)
T— '— r
Figure 5 .11(b) PRO CONTIN analysis o f low molecular weight PBO/M SA-M SAA solution at high salt condition: M = 19,000; Cone. = 4 x l0 ' 3 g/ml; cs = 0.45 M; Vv measurement; 60° scattering angle; 514.5 nm wavelength; 600/100 pin-hole setting; ~ 15,000 s acquisition time with multiple runs; 25°C. The fast mode decay appear to consist o f tw o sub-modes.

144
0.020 -
0 .0 1 5 -
< 0 .0 1 0 -
0.005 -
0 . 0 0 0 -
□ PRO CONTIN 60° Vv,, Low Salt
A0 □0 □
0 □□ D
•o-
□
□ -o-
□ ^
□ ^
□ 1̂
□ CT]_L
D 6
D 6□ ' h
□□
0□
0□ □
□ Avg. = n □
4.318+/-0.861 \
12
i3 4
log (r)
T5
Figure 5 .11(c) PRO CONTIN analysis o f low molecular weight PBO/M SA-M SAA solution at low salt condition: M = 19,000; Cone. = 4 x l0 ‘ 3 g/ml; cs = 0 M ; Vv measurement; 60° scattering angle; 514.5 nm wavelength; 800/200 pin-hole setting;~ 15,000 s acquisition time with multiple runs; 25°C. A broad fast mode decay is in the plot.
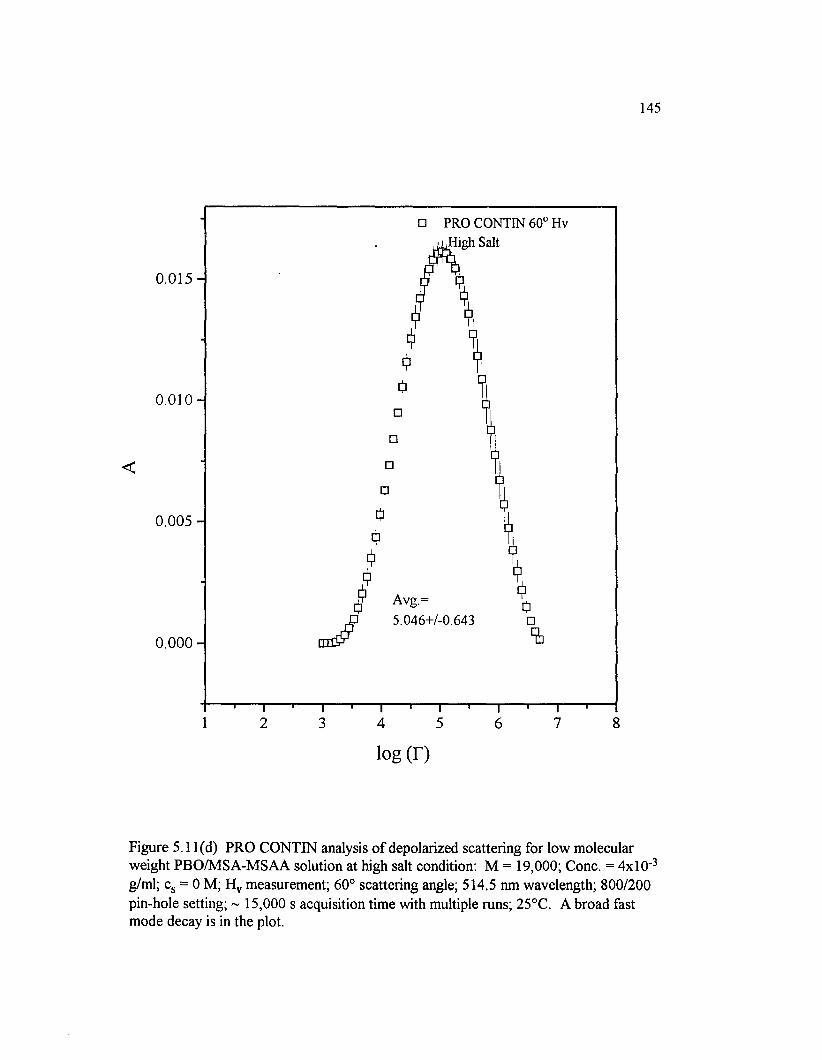
145
□ PRO CONTIN 60° Hv HjHigh Salt
0 .0 1 5 -
0 .0 1 0 -
0.005 -
Avg.=5.046+/-0.643
0 . 0 0 0 -
1 2 5 7 83 4 6
log (r)
Figure 5 .11(d) PRO CONTIN analysis o f depolarized scattering for low molecular weight PBO/M SA-M SAA solution at high salt condition: M = 19,000; Cone. = 4x10 ' 3
g/ml; cs = 0 M; H v measurement; 60° scattering angle; 514,5 nm wavelength; 800/200 pin-hole setting; ~ 15,000 s acquisition time with multiple runs; 25°C. A broad fast mode decay is in the plot.

146
□ EXSAMP Fitting0 . 4 -
0 . 3 -
Avg. = 5.50+/-0.25Avg. =
4.50+/-0.30
I Avg. = P C □ip 2.86+/-0.34 ^0 .0 -
1 2 3 4 6 85 7
log(r)
Figure 5 .11(e) EXSAM P analysis o f low molecular weight PBO/M SA-M SAA solution at high salt condition: M = 19,000; Cone. = 4 x l0 ‘ 3 g/ml; cs = 0.45 M; Vv measurement; 60° scattering angle; 514.5 nm wavelength; 600/100 pin-hole setting;~ 15,000 s acquisition time with multiple runs; 25°C. The fast mode decay appear to consist o f tw o sub-modes.
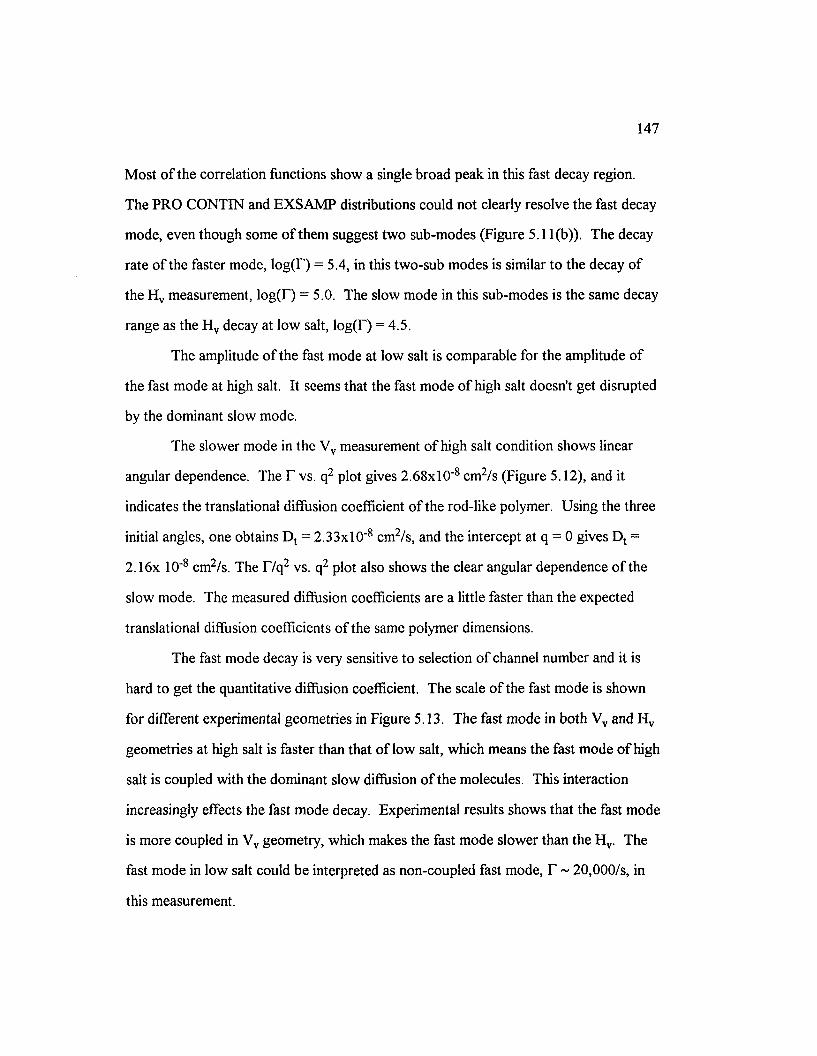
147
M ost o f the correlation functions show a single broad peak in this fast decay region.
The PRO CONTIN and EXSAM P distributions could not clearly resolve the fast decay
mode, even though some o f them suggest two sub-modes (Figure 5 .11(b)). The decay
rate o f the faster mode, log(F) = 5.4, in this two-sub modes is similar to the decay o f
the H v measurement, lo g (0 = 5.0. The slow mode in this sub-modes is the same decay
range as the H v decay at low salt, log(T) = 4.5.
The amplitude o f the fast mode at low salt is comparable for the amplitude o f
the fast mode at high salt. It seems that the fast mode o f high salt doesn't get disrupted
by the dominant slow mode.
The slower mode in the Vv measurement o f high salt condition shows linear
angular dependence. The T vs. q2 plot gives 2 .68x l0 " 8 cm2/s (Figure 5.12), and it
indicates the translational diffusion coefficient o f the rod-like polymer. Using the three
initial angles, one obtains D t = 2.33x1 O' 8 cm2 /s, and the intercept at q = 0 gives Dt =
2.16x 10~8 cm 2 /s. The T/q 2 vs. q2 plot also shows the clear angular dependence o f the
slow mode. The measured diffusion coefficients are a little faster than the expected
translational diffusion coefficients o f the same polymer dimensions.
The fast mode decay is very sensitive to selection o f channel number and it is
hard to get the quantitative diffusion coefficient. The scale o f the fast mode is shown
for different experimental geometries in Figure 5.13. The fast mode in both Vv and H v
geometries at high salt is faster than that o f low salt, which means the fast mode o f high
salt is coupled with the dominant slow diffusion o f the molecules. This interaction
increasingly effects the fast mode decay. Experimental results shows that the fast mode
is more coupled in Vv geometry, which makes the fast mode slower than the H v. The
fast mode in low salt could be interpreted as non-coupled fast mode, T ~ 2 0 ,0 0 0 /s, in
this measurement.
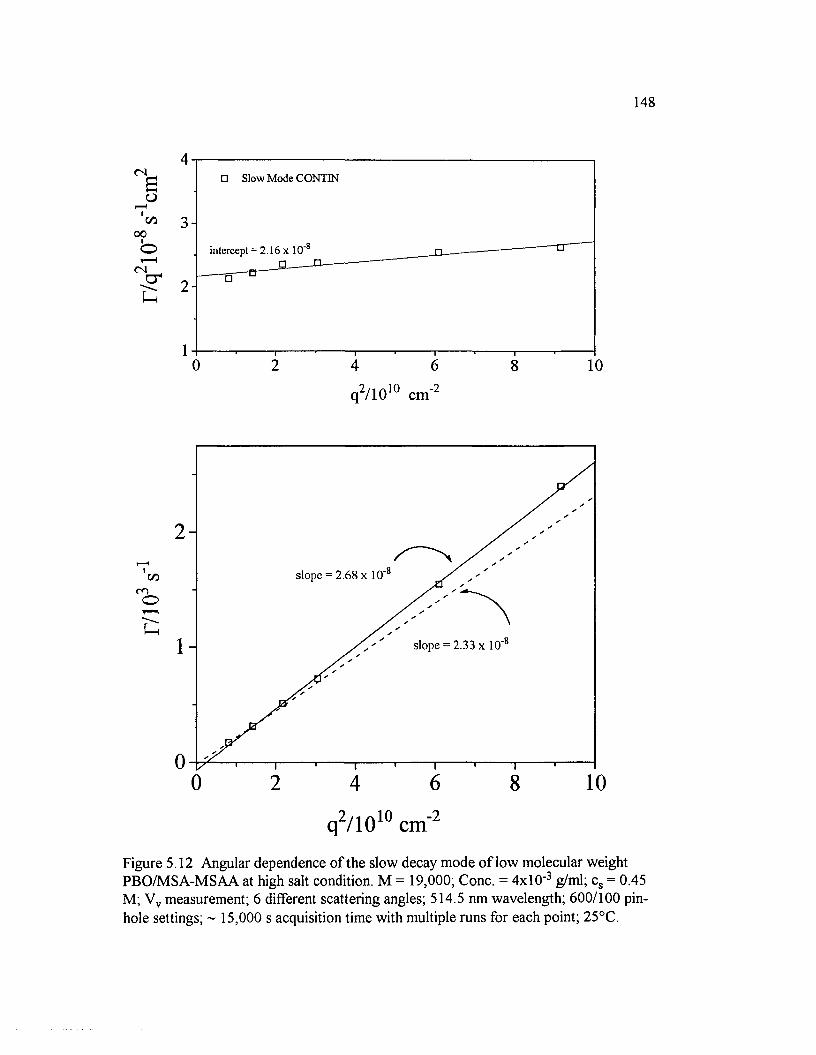
148
CN
C/3
00
O(N
a -
4□ Slow Mode CONTIN
3
intercept = 2.16 x 10'
2
1
q2/ 1010 cm'2
2 -
■C/3
<3oT“"-<
1 -
0
0 2 4 6 8 10
q2/1 0 10 cm-2
Figure 5.12 Angular dependence o f the slow decay mode o f low molecular weight PBO/M SA-M SAA at high salt condition. M = 19,000; Cone. = 4 x l0 ' 3 g/ml; cs = 0.45 M; Vv measurement; 6 different scattering angles; 514.5 nm wavelength; 600/100 pinhole settings; ~ 15,000 s acquisition time with multiple runs for each point; 25°C.
slope = 2.68 x 10'
slope = 2.33 x 10"

149
□ High salt fast Vv O High salt Hv
Low salt Vv
10 -
CO
'bu
1 . 1 1 1 1 1 1 1 1--------
0 2 4 6 8 10
q2/1 0 10 cm'2
Figure 5.13 Angular dependence o f the fast decay mode for low molecular weight PBO/MSA-M SAA. M = 19,000; Cone. = 4 x l0 ' 3 g/ml; cs = 0.45 M and 0 M; Vv and H v measurement; 4-5 different scattering angles; 514.5 nm wavelength; 600/100 pin-hole settings for Vv high salt, 800/200 for Vv low salt and H v; ~ 15,000 s acquisition time with multiple runs for each point; 25°C.
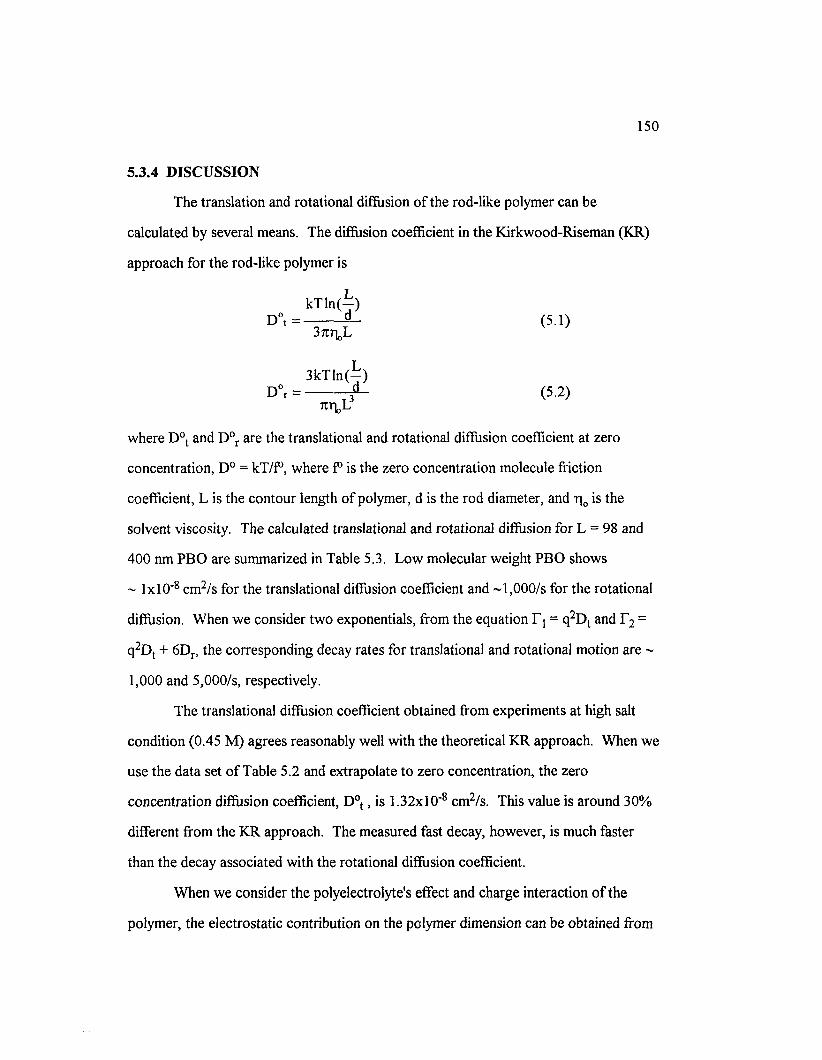
150
5.3.4 DISCUSSION
The translation and rotational diffusion o f the rod-like polymer can be
calculated by several means. The diffusion coefficient in the Kirkwood-Riseman (ICR)
approach for the rod-like polymer is
where D°t and D°r are the translational and rotational diffusion coefficient at zero
concentration, D° = kT/f°, where f° is the zero concentration molecule friction
coefficient, L is the contour length o f polymer, d is the rod diameter, and r | 0 is the
solvent viscosity. The calculated translational and rotational diffusion for L = 98 and
400 nm PBO are summarized in Table 5.3. Low molecular weight PBO shows
~ l x l 0 " 8 cm2/s for the translational diffusion coefficient and ~ 1 ,0 0 0 /s for the rotational
diffusion. W hen we consider two exponentials, from the equation T j = q2 Dt and r 2 =
q2 Dt + 6 Dr, the corresponding decay rates for translational and rotational motion are ~
1,000 and 5,000/s, respectively.
The translational diffusion coefficient obtained from experiments at high salt
condition (0.45 M ) agrees reasonably well with the theoretical KR approach. When we
use the data set o f Table 5.2 and extrapolate to zero concentration, the zero
concentration diffusion coefficient, D°t , is 1.32xl0"8 cm 2 /s. This value is around 30%
different from the K R approach. The measured fast decay, however, is much faster
than the decay associated with the rotational diffusion coefficient.
When we consider the polyelectrolyte's effect and charge interaction o f the
polymer, the electrostatic contribution on the polymer dimension can be obtained from
(5.1)3701^
3kT ln(—)(5.2)
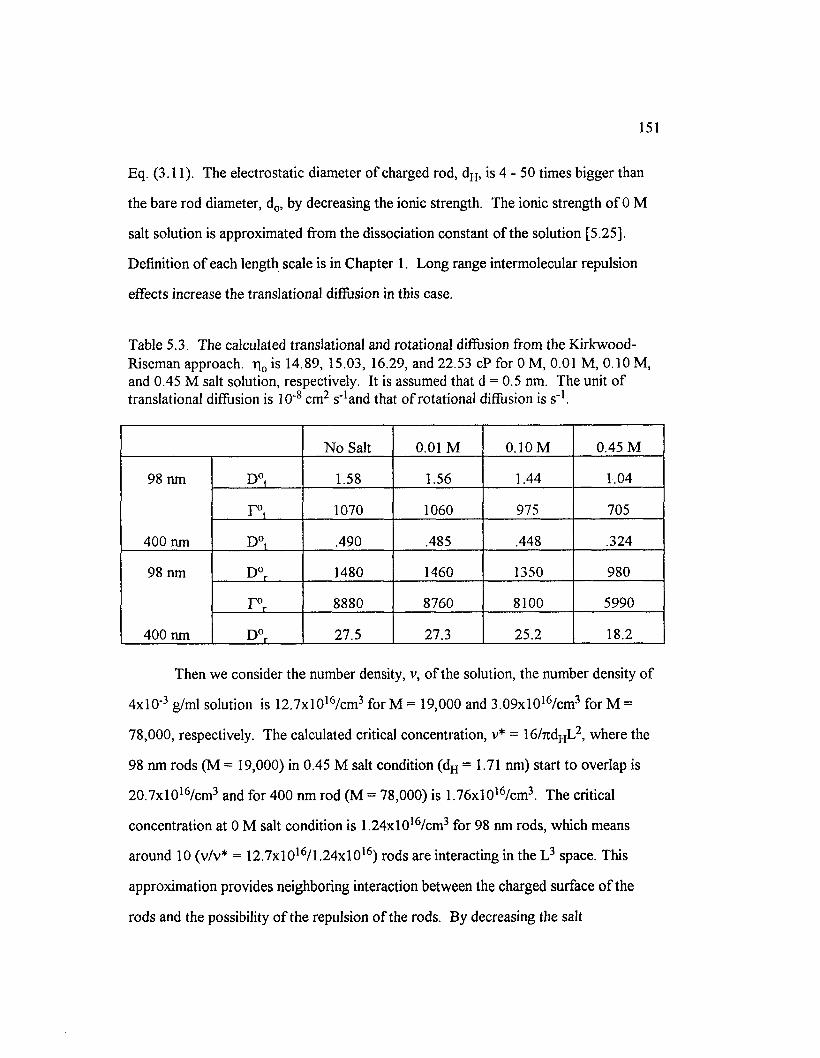
151
Eq. (3.11). The electrostatic diameter o f charged rod, dH, is 4 - 50 times bigger than
the bare rod diameter, d0, by decreasing the ionic strength. The ionic strength o f 0 M
salt solution is approximated from the dissociation constant o f the solution [5.25],
Definition o f each length scale is in Chapter 1. Long range intermolecular repulsion
effects increase the translational diffusion in this case.
Table 5.3. The calculated translational and rotational diffusion from the Kirkwood- Riseman approach. r | 0 is 14.89, 15.03, 16.29, and 22.53 cP for 0 M, 0.01 M, 0.10 M, and 0.45 M salt solution, respectively. It is assumed that d = 0.5 nm. The unit o f translational diffusion is 1 0 ‘ 8 cm2 s '!and that o f rotational diffusion is s '1.
N o Salt 0.01 M 0.10 M 0.45 M
98 nm
400 nm
D°t 1.58 1.56 1.44 1.04
F ° t 1070 1060 975 705
D°t .490 .485 .448 .324
98 nm
400 nm
D°r 1480 1460 1350 980
F ° r 8880 8760 8100 5990
D°r 27.5 27.3 25.2 18.2
Then we consider the number density, v, o f the solution, the number density o f
4 x l0 ' 3 g/ml solution is 12 .7x l0 1 6 /cm 3 for M = 19,000 and 3 .09x l016/cm3 for M =
78,000, respectively. The calculated critical concentration, v* = 16/7rdHL2, where the
98 nm rods (M = 19,000) in 0.45 M salt condition (dH = 1.71 nm) start to overlap is
20 .7 x l0 1 6 /cm 3 and for 400 nm rod (M = 78,000) is 1 .76xl016/cm3. The critical
concentration at 0 M salt condition is 1 .24xl016/cm3 for 98 nm rods, which means
around 10 (v/v* = 12 .7xl016/1 .2 4 x l0 16) rods are interacting in the L 3 space. This
approximation provides neighboring interaction between the charged surface o f the
rods and the possibility o f the repulsion o f the rods. By decreasing the salt
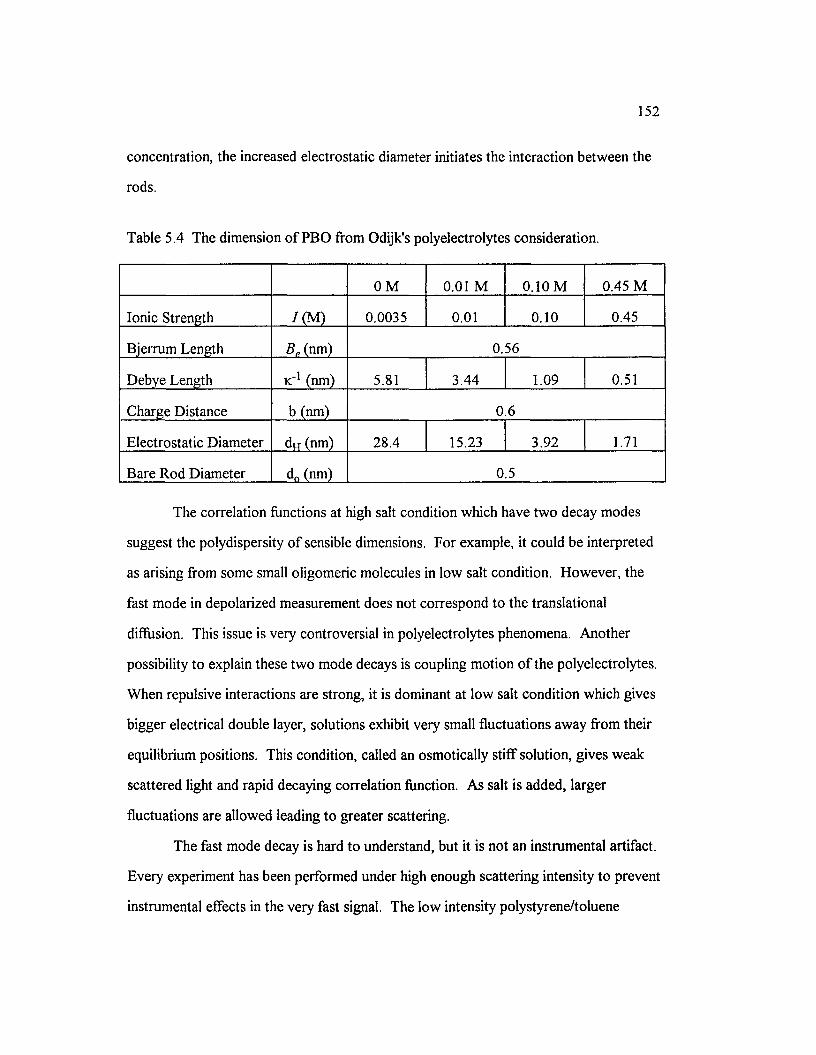
152
concentration, the increased electrostatic diameter initiates the interaction between the
rods.
Table 5.4 The dimension o f PBO from Odijk's polyelectrolytes consideration.
OM 0.01 M 0.10 M 0.45 M
Ionic Strength / ( M) 0.0035 0 . 0 1 0 . 1 0 0.45
Bjerrum Length ■S„(nm) 0.56
Debye Length k "1 (nm) 5.81 3.44 1.09 0.51
Charge Distance b (nm) 0 . 6
Electrostatic Diameter d„ (nm) 28.4 15.23 3.92 1.71
Bare Rod Diameter d0 (nm) 0.5
The correlation functions at high salt condition which have tw o decay modes
suggest the polydispersity o f sensible dimensions. For example, it could be interpreted
as arising from some small oligomeric molecules in low salt condition. However, the
fast mode in depolarized measurement does not correspond to the translational
diffusion. This issue is very controversial in polyelectrolytes phenomena. Another
possibility to explain these tw o mode decays is coupling motion o f the polyelectrolytes.
When repulsive interactions are strong, it is dominant at low salt condition which gives
bigger electrical double layer, solutions exhibit very small fluctuations away from their
equilibrium positions. This condition, called an osmotically stiff solution, gives weak
scattered light and rapid decaying correlation function. As salt is added, larger
fluctuations are allowed leading to greater scattering.
The fast mode decay is hard to understand, but it is not an instrumental artifact.
Every experiment has been performed under high enough scattering intensity to prevent
instrumental effects in the very fast signal. The low intensity polystyrene/toluene
153
system has a nice correlation function but it also has a low f(A) value. Even though the
fast mode could be a tail o f the even faster decay o f the correlation function, the LS
instrument can not reach that fast decay. This is not evidence o f the smaller particles'
motion because it doesn't have angular dependent behavior. These experimental results
suggest the fast decay mode does not trace the polymer translational mode, but the
rotating, bending or coupling motion o f the counterion surrounding the
polyelectrolytes.
5.4 SUMMARY
The synthetic rod-like polyelectrolytes show the normal polyelectrolyte
behavior, high coherence in high salt and low intensity at low salt condition. O-E
transition which has a very slow mode in low salt condition is one o f the interesting
features o f polyelectrolyte solutions, but we couldn't see any very slow decay ( 1 0 times
bigger than the normal polymer diffusion) motion except the dust interruption o f the
correlation function. The slow decay mode in this experiment shows the diffusion o f
the polymer backbone in the high salt condition. The fast mode is still hard to
understand, but it is not the translational contribution o f particle diffusion.
154
5.5 REFERENCES
5.1 (a) L. Belloni and M. Drifford, J. Phys. Lett. 46, LI 183 (1985).
(b) W. I. Lee and J. M. Schurr, J. Polym. Sci. 13, 873 (1975).
5.2 C. F. Anderson and M. T. Record Jr., Ann. Rev. Phys. Chem. 33, 191 (1982).
5.3 M. M -Noyola and A. V-Rendon, Phys. Rev. A. 32, 3596 (1985).
5.4 T. Odijk, Macromolecules 12, 688 (1979).
5.5 M. Drifford, L. Dalbiez, and A. K. Chattopadhya, J. Coll. Inter. Sci. 105, 587 (1985).
5.6 N. Ise, T. Okubo, K. Yamamoto, H. M atsuoka, H. Kawai, T. Hashimoto, and M. Fujimura, J. Chem. Phys. 78, 541 (1983).
5.7 B. R. Ware, Adv. Coll. Inter. Sci. 4, 1 (1974).
5.8 D. F. Hodgson and E. J. Amis, J. Chem. Phys. 91, 2635 (1989).
5.9 M. Levij, J. de Bleiser, and M. Leyte, Chem. Phys. Lett. 83, 183 (1981).
5.10 H. M atsuoka, N. Ise, T. Okubo, S. Kunugi, H. Tomilama, and Y. Yoshikawa, J. Chem. Phys. 83, 378 (1985).
5.11 N. Ise, T. Okubo, S. Kunugi, H. M atsuoka, K. Yamamoto, and Y. Ishii, J. Chem. Phys. 81, 3294 (1984).
5.12 S. -C. Lin and J. M. Shurr, Biopolymer 17, 425 (1978).
5.13 M. Drifford and J. -P. Dalbiez, Biopolymer 24, 1501 (1985).
5.14 M. Drifford and J. -P. Dalbiez, J. Physique Lett. 46, L 311 (1985).
5.15 K. S. Schmitz, L. Mei, and J. Gauntt, J. Chem. Phys. 78, 5059 (1983).
5.16 G. C. Berry, Contemp. Top. in Polym. Sci. 2, 55 (1977).
5.17 M. A. Tracy and R. Pecora, Annu. Rev. Phys. Chem. 43,525 (1992).
5.18 D. B. Roitman, J, McAlister, M. McAdon, E. M artin and R. A. Wessling, J. Polym. Sci. Polym. Phys. 32, 1157 (1994).
5.19 C.-P. W ong, H. Ohuma, and G. C. Berry, J. Poly. Sci., Poly. Sym. 65, 173 (1978).
5.20 K. Schmitz, "An Introduction to Dynamic Light Scattering by M acromolecules," Academic Press Inc., 1990.
155
5.21 P. M. Cotts and G. C. Berry, J. Polym. Sci., Polym. Phys. Ed. 21, 1255 (1983).
5.22 M. Tracy, Ph. D. Thesis in Stanford University, 1992.
5.23 C. R. Crosby, III, N. C. Ford, Jr., F. E. Karasz, and K. H. Langley, J. Chem. Phys. 75(9), 4298 (1981).
5.24 W. Eimer and R. Pecora, J. Chem. Phys. 94, 2324 (1991).
5.25 D. B. Roitman, R. A. Wessling, and J. McAlister, Macromolecules 26, 5174 (1993).
5.26 P. Russo, K. Guo, and L. DeLong, Soc. Plastics Eng., 46th Ann. Tech. Conf. Pro. 983 (1088).

CHAPTER 6
CONCLUSIONS
156
157
There are two aspects in this dissertation, one is about the probe particles and
the other is about the matrix polymers. Probe particles reveal superparamagnetic
properties and charged interaction, and the matrix polymer (polystyrene sulfonate
sodium salt: NaPSS) shows charged polyelectrolyte behavior. Chapter 2 and 3 are
concerned with the interaction between magnetic latex particles and the matrix polymer
under different salt conditions. One o f the issues was flocculation and stabilization
interactions between the particle and matrix polymer. Dynamic light scattering and
fluorescence photobleaching recovery have been used to trace the diffusion o f MLP
and NaPSS. A DLS study with varying salt concentrations shows the flocculation o f
the particles in the high salt condition and the stabilization o f MLP by adding matrix
polymer. DLVO theory explains the flocculation phenomena by decreasing the Debye
screening length in high salt and by increasing the attractive force between the particles.
The stabilization mechanism for the particles and matrix polymer has been suggested by
Feigin and Napper, but little experimental evidence has been reported. FPR
experimental results using labeled NaPSS suggested that the particles and matrix
polymers depleted each other and stabilized the particles' flocculation (depletion
stabilization).
A magnetic field induced study using superparamagnetic properties o f the probe
particles has been performed and presented in Chapter 4. When the magnetic field is
applied, superparamagnetic particles form linear chains (columns) parallel to the applied
field. The applied field and concentration dependence o f the magnetic latex particles'
kinetic growth was traced by microscopy and video small angle light scattering.. The
high magnetic susceptibility o f the MLP explains why they align at very weak magnetic
fields. A scaling concept is applied for this cluster size growth mechanism and the rate
o f cluster formation is compared with SALS and MS techniques. Good agreement was
158
obtained between the tw o methods, and s(t) ~ t 1 0 was observed in the initial growth o f
the cluster.
The polyelectrolytes studies were extended in Chapter 5. "O-E transition" and
"ordering" structure o f polyelectrolyte solutions which are controversial topics related
to polyelectrolyte solutions are considered to understand the DLS data o f a high
strength rod-like polyelectrolyte (PBO). The PBO/M SA-M SAA system shows the
normal polyelectrolyte behavior, high coherence in high salt and low intensity at low
salt condition. However, it does not show any very slow decay in DLS measurement
( 1 0 times bigger than the normal polymer diffusion) which has been typically observed
in several polyelectrolyte solutions. There are tw o decay modes in our DLS
experiment. The slower one presents the diffusion o f the polymer backbone in the high
salt condition and the fast mode is not related to. This is explained by the expanded
concept o f the osmotic stiffness.
The motion o f the magnetic particles in a chemically cross-linked gel has been
studied and summarized in Appendix A. It is a preliminary study o f the morphology o f
silica gel and acrylamide gel, and their affinity with the magnetic latex particles and
ordinary latex particles. It should lead to a future study to explain the magnetic
particles' aggregation in silica gel, to perform the angular dependence o f the probe
particles in the gel, and to trap the stacked magnetic particles' in the gel structure.
APPENDIX A
THE BEHAVIOR OF MAGNETIC LATEX PARTICLES IN CHEMICALLY CROSS-LINKED GELS
159
160
A.l INTRODUCTION
A gel is a fluid-filled cross-linked polymer network. Depending on the methods
o f cross linkage o f the polymer, chemical and physical gels are classified. The structure
o f chemically and physically cross-linked gels has been studied by techniques such as
cold-stage electron microscopy, video-optical microscopy, etc. [A.1] Dynamics such
as diffusion in or viscoelasticity o f the gel network have been extensively studied by
light scattering [A.2] and rheo-optical techniques [A.3],
There are tw o approaches to the DLS technique as applied to gel dynamics; one
is the viscoelastic approach based on Tanaka's 1973 paper [A.4], and the other is the
non-ergodic approach o f Pusey et al.[A.5]
In 1973, Tanaka et al. studied polyacrylamide gels and proposed that the
autocorrelation function o f scattered light was due to thermally excited density
fluctuations in fiber-network. The gel was considered to be a uniform continuous
medium that undergoes spontaneous thermal fluctuation, modifies the dielectric
permittivity, and hence scatters light [A. 6 ], The thermally excited displacement o f the
gel network with ( t t ) or against ( t 4 ) the gel liquid are characterized by the (a)
elastic constant o f the fiber network, and (b) the friction factor connecting the gel
network and the gel liquid. They derive the time correlation function o f the scattered
light from the gel and give the decay constant T = 1/t =
where K' and p' are the bulk and shear moduli, respectively, q is the wave vector o f the
fluctuation and f is the frictional constant. The macroscopic measurement o f the
frictional (f) and elastic constant (K1, p') were within the 1% experimental error o f the
dynamic light scattering analysis. M ost DLS studies with gels had been based on this
polarized (A.1)
( 2 p '/ f ) q 2 : depolarized (A.2)
161
viscoelastic continuum picture o f the gel network until Pusey et al.' s non-ergodic
framework was developed.
In a DLS experiment the normalized time correlation function g<2 )(q,x) o f the
scattered intensity is given by
g(2 )(q ,x ) = < I(q ,0 )I(q ,T ))/ ( l(q ,0 ) ) 2 (A.3)
= l + f(A )|g (1)(q ,x ) | 2
The angular brackets imply an ensemble average, but it can be replaced with a time
average based on the ergodicity theorem in most DLS experiments. In a gel the total
scattered field may be written [A. 5] as the sum o f the fluctuating component Ep(q,t)
and a time independent component E c (q)
E(q,t) = EF(q,t) + E c (q) (A.4)
The time-average o f the total scattered intensity can be expressed as
( l ( q » T = ( |E (q ,x |2)T
= (IF(q ))T + I c (q) (A .5 )
Time-average intensity correlation function is a mixture o f a Gaussian and a constant
field, and leads to
(l(q> 0 )I(q , x))T - ( l(q , 0 ) ) 2
= (i(q))E [g(NE(q»'c) -g N E (q .Q0) f ,(A. 6 )
+2Ic (q )( l(q ))E[g & (q ,x )-g $ s (q ,o o )]
The first term on the right side is the homodyne contribution and the second term is the
heterodyne part o f the total intensity correlation. The mixed homodyne-heterodyne
case is treated by Chu [A.7] and previously applied in our lab (details in [A.8 ]).
The characterization o f the probe particles in polymer gels gives very unique
information about the structure and morphology o f the gel. The diffusion o f the probe
162
particles in a polymer gel depends on the diameter o f the probe, d, and the correlation
length, £ o f the network. I f d » £ we can predict that since the particles are bigger
than the gel structure, there is no long-range motion o f the particles. I f the particles are
smaller than the gel network, d « £ there is finite diffusion o f the particles. The
diffusion o f the particles inside o f the solid cage is a very unusual experiment. Drifford
et al. [A. 9] did the diffusion studies with calibrated particles during the formation o f a
gel, and the mesh size £ at the end o f the chemical reaction is lower than d. Konak et
al. [A. 10] reported a QELS study o f polystyrene latex particles in polyacrylamide gel
to determine the static gel structure. These studies predate the non-ergodic
developments. Joosten et al. [A. 11] investigated the Brownian particles trapping in
polyacrylamide gel and used non-ergodic concepts.
Some polymer gels themselves give a strong polarized signal (e.g. PAA gel),
but their depolarized signals are almost negligible. Therefore, the polarized signal o f a
probe particle inside the gel is overlaid by the scattering from the gel network, but the
depolarized signal is independent. Here we investigate tw o different types o f chemical
gels. PAA gels have pronounced viscoelastic properties and produces a strong
polarized signal, silica gels have plastic-like properties and do not produce any
polarized signal. And tw o different particles, normal latex and magnetic latex particles,
are used as a probe for the translational and rotational studies.
A.2 EXPERIMENTAL
A.2.1 LATEX PARTICLES
The probe particles used in this experiment are small (diameter ~ 0.05 pm)
polystyrene latex and magnetic latex particles that are commercially available (Details
o f the magnetic latex particles are in Chapter 2 and 3.) Each type o f particle was
purchased from Polysciences or Bangs Laboratories as 2.5 w t% o f solids solutions.
Polysciences particles are based on styrene monomer with a sulfonated charge on the
163
surface, and Bangs particles are carboxylated charged. Magnetic contents o f the MLP
is w 10% o f the total latex weight. It creates a weak depolarized signal, but enough to
measure. Bangs magnetic latex particles are filtered with 0 . 1 pm Millipore filter before
mixing with the gel precursor solution. Each particle is well dispersed in the water
solution by the surfactant, and gives a single exponential decay.
A.2.2 SILIC A G E L
Silica gels are the precursors o f aerogels [A. 12] which are low density porous
solids dried without shrinking. The no-shrinking condition can be achieved by the
hypercritical extraction or drying in which no surface tension exists between the liquid
surface and the air. So far, porosities o f 99.8% (0.2% polymer) have been reported
and many researcher's are involved in finding applications for these materials. The
most popular applications are as insulators due to their high heat capacity, and as
catalysts for organic synthesis.
The silica gel preparation consists o f 2 steps: a) preparation o f a sol-gel stock
solution by acid catalyzed esterification; and, b) gelation by basic catalyzed and aging
(polycondensation). To make a stock solution, 30 ml TEOS, 30 ml ethanol, and 2.5 ml
deionized water were mixed in a round bottom flask. As a catalyst, 0.1 ml o f 1 M HC1
was added. The molar ratios among the TEOS, EtOH, and water were 1:4: 1. The
mixed solution was stirred for 1.5 hours at 60°C. Then the sample was cooled down to
room temperature. This was the precursor (stock solution) for the silica gel. In the
next step, 0.2 ml 0.1 M NH4OH was added to the 2 ml o f stock solution, followed by
filtration with 0.1 pm Millipore M illex® -W filter, in a cylindrical light scattering cell.
The gelation time was varied by the ratio o f TEOS/EtOH/H20 and mostly by the
amount o f the added base. Typical gelation time was 15 min. to 3 hrs. Different molar
ratios o f TEOS/EtOH (1/80, 1/40, 1/33, 1/27, 1/20, 1/10, 1/5, 1/4) have been made by
164
the same method. Normal o r magnetic latex particles 0.05 ml are added to the pregel
mixture prior to the initiation o f the gelation by ammonium hydroxide catalyst.
A.2.3 ACRYLAMIDE GEL
Acrylamide gel is well known because o f its biochemical applications, especially
in electrophoretic separations [A. 13]. Polyacrylamide gels or solutions are made by
copolymerizing acrylamide (AA) and N, N-methylene bisacrylamide (BAA) using
ammonium persulfate (AP) as an initiator and N, N, N*, N’-tetramethylethylenediamine
(TEM ED) as the activator. In 10 ml o f clean water, O.Olg (6.48x1 O' 3 moles) BAA
(Aldrich) and 0.24 g (0.34 moles) AA (Aldrich) were dissolved. This was a stock
solution o f 2.5 wt% and 4% BAA/AA ratio. The various concentration (0.25 g, 0.30
g, 0.35 g, 0.45 g) and BAA/AA ratio (1% - 40%) stock solution were made by the
same method. The stock solution was dedusted using 0.1 pm Milipore W type filter.
Stock solution 1 ml was put into the LS cell, and added 2.5% 0.05 ml normal or 0.2%
0.05 ml magnetic latex particles. Final ordinary latex and M LP concentrations are
0.13% and 0.01%, respectively. TEM ED (Aldrich, 99% ) 3 pi and 5 pi o f 0.5 M
ammonium persulfate were added to initiate the gelation. The cells was flushed with
argon and sealed.
A.2.4 M E A SU R E M E N T
The light scattering instrument was described in previous chapter. It consists o f
a He-Ne laser o f 632.8 nm for the polarized measurements and ion laser (514.5 nm) for
the depolarized experiments, focusing lens, vertical polarizer, the sample holder which
is connected with the ro tor to change the position o f the speckle o f the non-ergodic
samples, horizontal or vertical analyzer, and receiving lens, pin-hole, and EM I 9863
photomultiplier tube. An ALV-5000 digital autocorrelator is used to measure the
correlation function with multiple runs. Temperature during the measurement was
maintained at 25±0.1°C.
165
A.3 RESULTS AND DISCUSSION
A.3.1 ORDINARY LATEX PARTICLES IN SILICA GEL
As the goal o f this study is to m onitor the probe particles in the silica gel, we
chose the fast gelation process. The gelation (sol-gel transition) process o f the silica
gel is a good example o f the structure growth o f a fractal [A. 14], To monitor the
kinetic growth o f the silica cluster, DLS is used to determine the diffusion coefficient
and the hydrodynamic radius. The gelation process is relatively fast, tge] = 10 min. to 3
hr s.
Figure A. 1 shows an example o f the gelation o f the silica gel used in this
experiment, time dependent D app. Our gelation process is much faster than that o f the
diffusion limited aggregation o f Martin et. al. [A. 15] Since we are concerned with the
motion o f the particles in the gel network, we chose the fast gelation process. After the
gelation process is completed, the viscosity o f the gel rises abruptly and elastic
response to stress appears. The viscosity o f inorganic gels was reported ~ 101 2 Pa s
and the elastic shear modulus is « 107 Pa [A. 16], This is not viscoelastic behavior, but
near perfect plasticity or linear hardening. DLS experiments show no correlation after
the gelation process is completed. When the polystyrene latex particles are in the sol
state o f the silica precursor, the scattered intensity o f the latex particles is much larger
than that o f the growing clusters. There is a competition between the latex particles
and growing clusters, so it is too hard to separate the decay rate o f each different
species during the gelation process.
However, the latex particles' decay is evident in the completed gel structure
where there is no correlation o f the gel network itself. It is hard to compare the
intensity ratio between the latex particles and the gel network because o f the non-
ergodic properties, but the averaged ratio Iiatex in gei/Igei ~ 3.
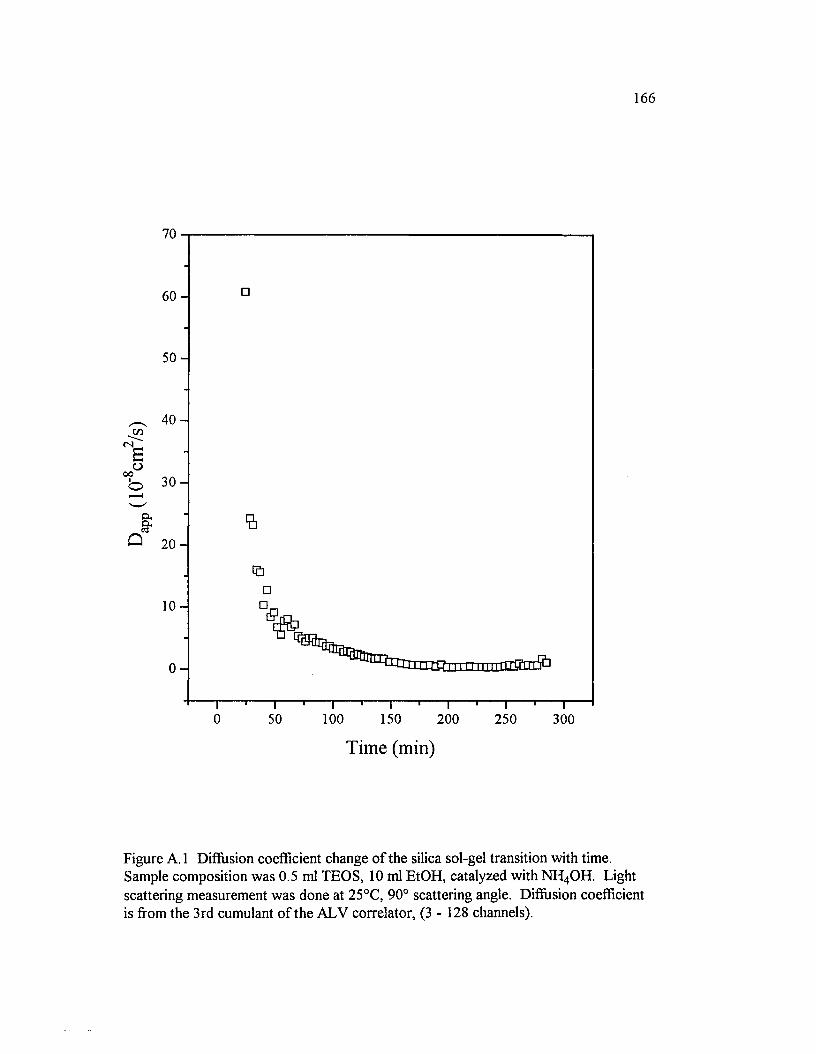
166
6 0 -
5 0 -
CL,
Q 2 0 -
1 0 -
0 50 100 150 250 300200
Time (min)
Figure A. 1 Diffusion coefficient change o f the silica sol-gel transition with time. Sample composition was 0.5 ml TEOS, 10 ml EtOH, catalyzed with NH 4 OH. Light scattering measurement was done at 25°C, 90° scattering angle. Diffusion coefficient is from the 3rd cumulant o f the ALV correlator, (3 - 128 channels).
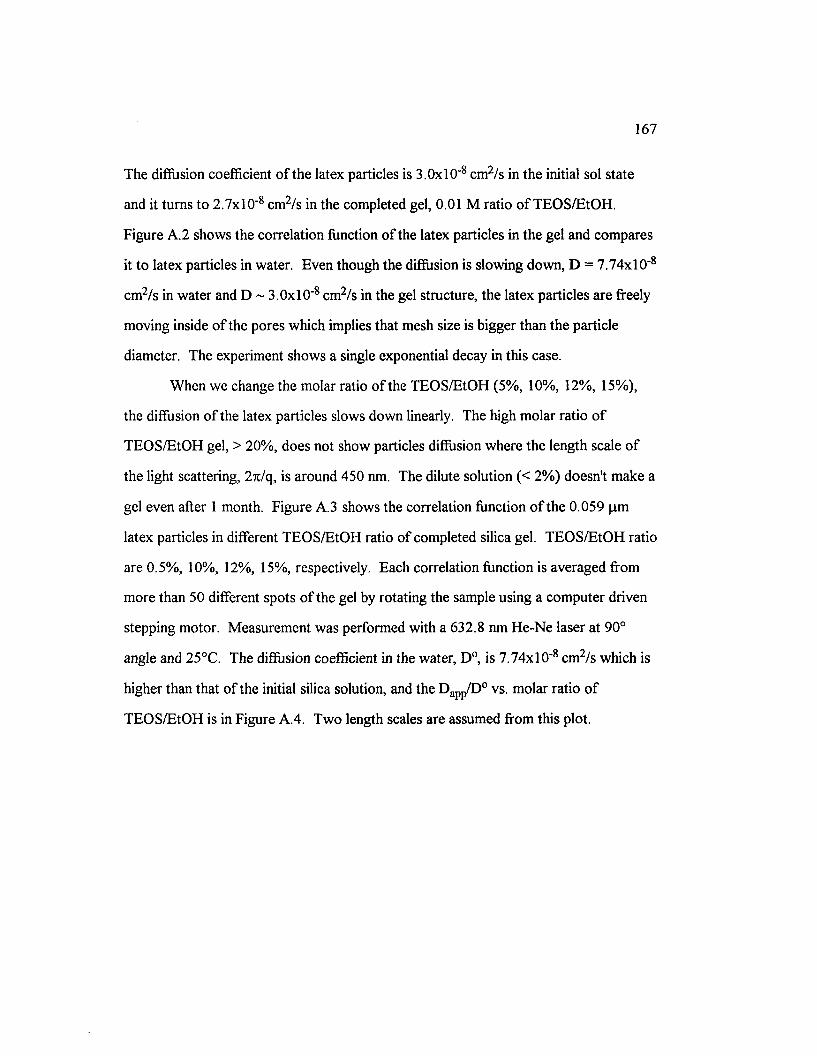
167
The diffusion coefficient o f the latex particles is 3.0x1 O' 8 cm2/s in the initial sol state
and it turns to 2 .7x l0 " 8 cm2/s in the completed gel, 0.01 M ratio o f TEOS/EtOH.
Figure A.2 shows the correlation function o f the latex particles in the gel and compares
it to latex particles in water. Even though the diffusion is slowing down, D = 7 .74x l0 ‘ 8
cm2/s in water and D ~ 3.0x10" 8 cm2/s in the gel structure, the latex particles are freely
moving inside o f the pores which implies that mesh size is bigger than the particle
diameter. The experiment shows a single exponential decay in this case.
When we change the molar ratio o f the TEOS/EtOH (5%, 10%, 12%, 15%),
the diffusion o f the latex particles slows down linearly. The high molar ratio o f
TEOS/EtOH gel, > 20%, does not show particles diffusion where the length scale o f
the light scattering, 27t/q, is around 450 nm. The dilute solution (< 2% ) doesn't make a
gel even after 1 month. Figure A.3 shows the correlation function o f the 0.059 pm
latex particles in different TEOS/EtOH ratio o f completed silica gel. TEO S/EtO H ratio
are 0.5%, 10%, 12%, 15%, respectively. Each correlation function is averaged from
m ore than 50 different spots o f the gel by rotating the sample using a com puter driven
stepping motor. M easurement was performed with a 632.8 nm He-Ne laser at 90°
angle and 25°C. The diffusion coefficient in the water, D°, is 7 .74x l0 ' 8 cm2/s which is
higher than that o f the initial silica solution, and the Dapp/D 0 vs. molar ratio o f
TEO S/EtO H is in Figure A.4. Two length scales are assumed from this plot.
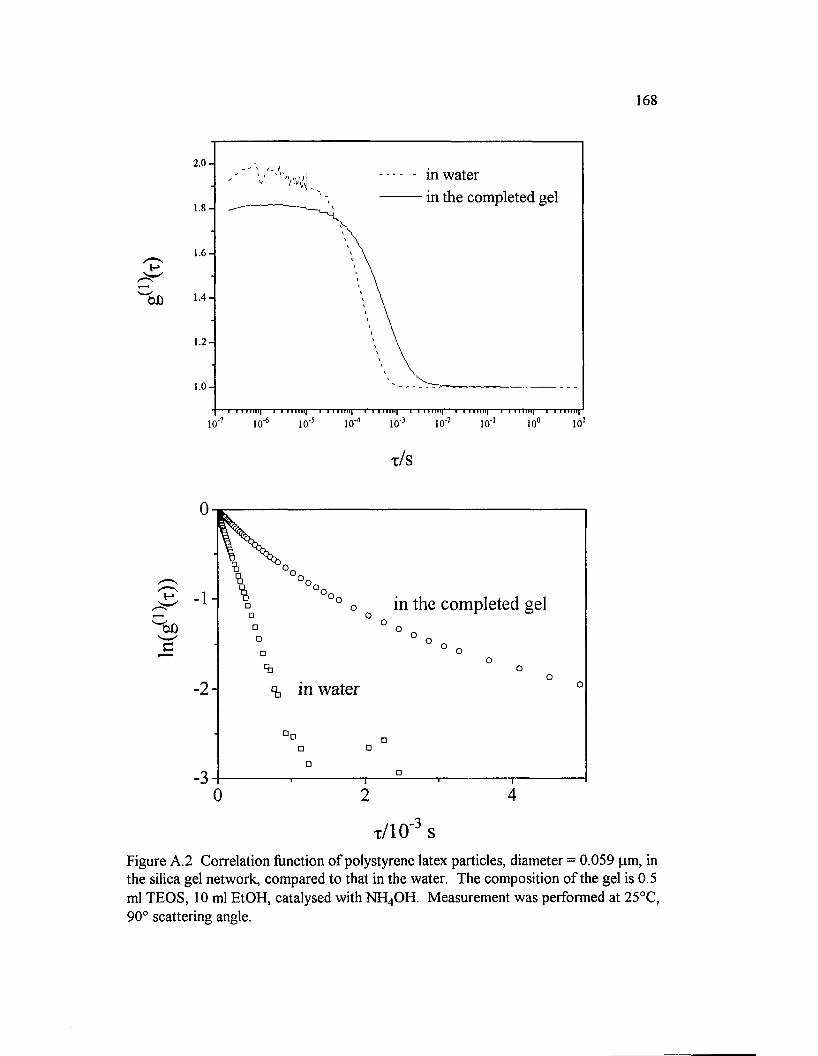
168
2.0 -m waterin the completed gel
1.8 -
1.6 -
1 .4-
1.2 -
io'10°
t / s
in the completed gel
- 2 - in water
40 2
x / 1 0 ' 3 s
Figure A.2 Correlation function o f polystyrene latex particles, diameter = 0.059 pm, in the silica gel network, compared to that in the water. The composition o f the gel is 0.5 ml TEOS, 10 ml EtOH, catalysed with NH 4 OH. Measurement was performed at 25°C, 90° scattering angle.
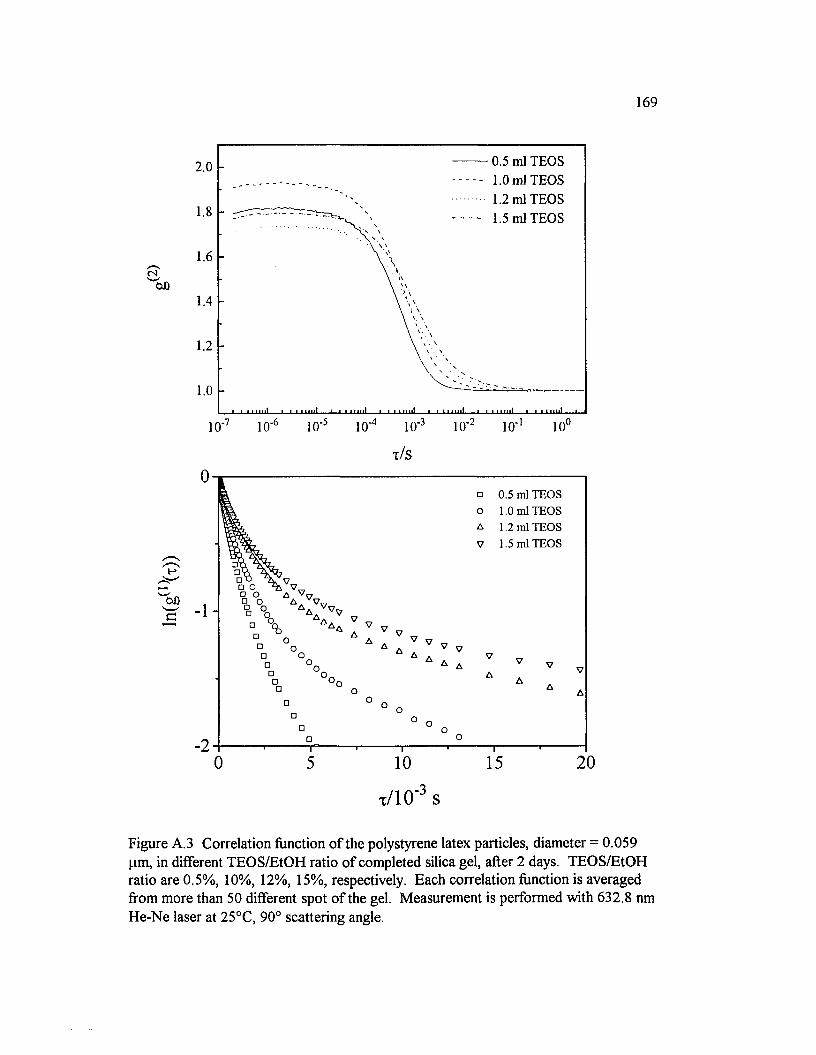
169
0.5 ml TEOS 1.0 ml TEOS 1.2 ml TEOS 1.5 ml TEOS
2.0
10°
t/ s
0
□ 0.5 ml TEOSo 1.0 ml TEOS A 1.2 ml TEOS v 1.5 ml TEOS
1
•2200 10 155
t / 1 0 '3 s
Figure A.3 Correlation function o f the polystyrene latex particles, diameter = 0.059 pm, in different TEOS/EtOH ratio o f completed silica gel, after 2 days. TEOS/EtOH ratio are 0.5%, 10%, 12%, 15%, respectively. Each correlation function is averaged from more than 50 different spot o f the gel. Measurement is performed with 632.8 nm He-Ne laser at 25°C, 90° scattering angle.
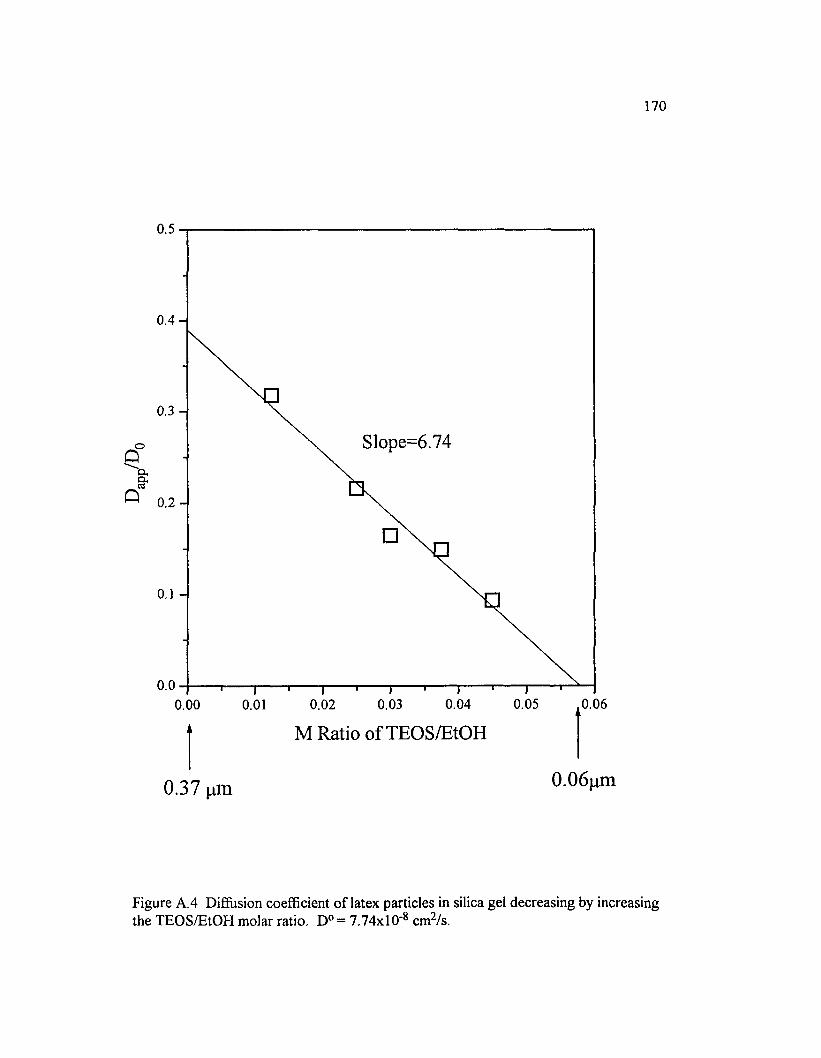
app
170
0.5
0.4
0.3
Slope=6.74o
0.2
0.00.04 0.05 0.060.030.02
M Ratio o f TEOS/EtOH
0.00 0.01
0 .3 7 pm 0 .0 6 p m
Figure A. 4 Diffusion coefficient o f latex particles in silica gel decreasing by increasing the TEOS/EtOH molar ratio. D° = 7.74x10 ‘ 8 cm 2 /s.
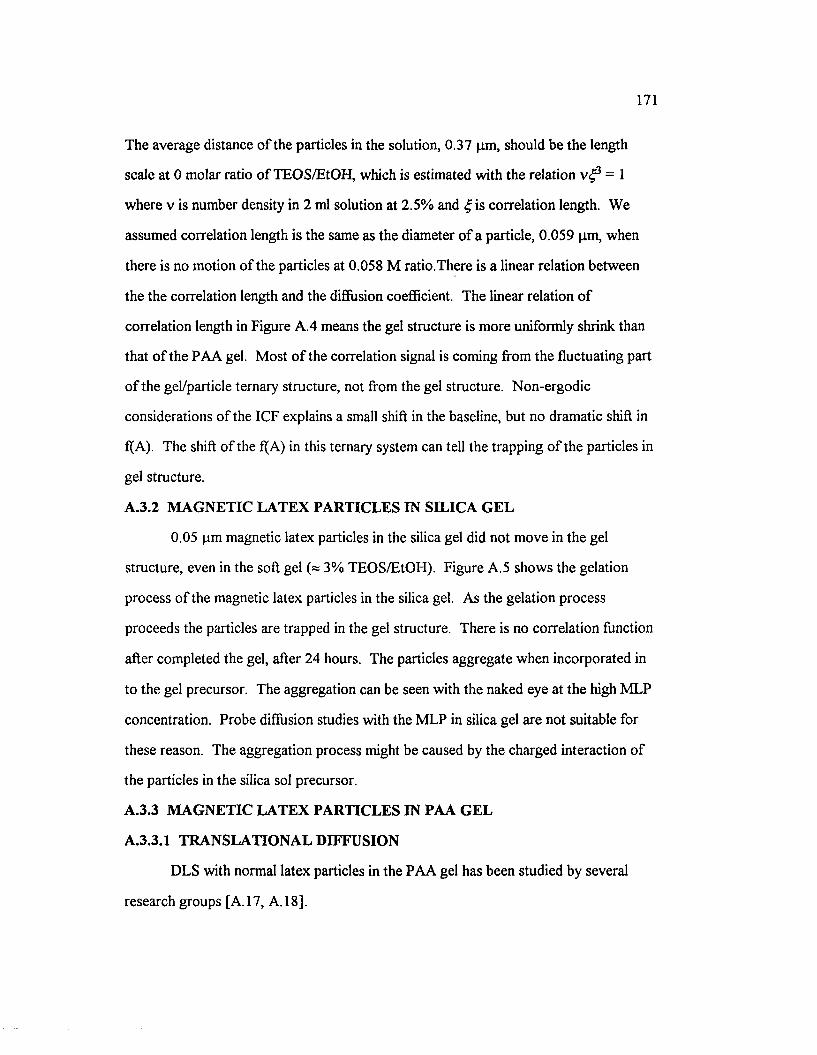
171
The average distance o f the particles in the solution, 0.37 pm, should be the length
scale at 0 molar ratio o f TEOS/EtOH, which is estimated with the relation v ^ 3 = 1
where v is number density in 2 ml solution at 2.5% and £ is correlation length. W e
assumed correlation length is the same as the diameter o f a particle, 0.059 pm, when
there is no motion o f the particles at 0.058 M ratio.There is a linear relation between
the the correlation length and the diffusion coefficient. The linear relation o f
correlation length in Figure A.4 means the gel structure is more uniformly shrink than
that o f the PAA gel. M ost o f the correlation signal is coming from the fluctuating part
o f the gel/particle ternary structure, not from the gel structure. Non-ergodic
considerations o f the ICF explains a small shift in the baseline, but no dramatic shift in
ftA). The shift o f the f(A) in this ternary system can tell the trapping o f the particles in
gel structure.
A.3.2 MAGNETIC LATEX PARTICLES IN SILICA GEL
0.05 pm magnetic latex particles in the silica gel did not move in the gel
structure, even in the soft gel (« 3% TEOS/EtOH). Figure A .5 shows the gelation
process o f the magnetic latex particles in the silica gel. As the gelation process
proceeds the particles are trapped in the gel structure. There is no correlation function
after completed the gel, after 24 hours. The particles aggregate when incorporated in
to the gel precursor. The aggregation can be seen with the naked eye at the high M LP
concentration. Probe diffusion studies with the M LP in silica gel are not suitable for
these reason. The aggregation process might be caused by the charged interaction o f
the particles in the silica sol precursor.
A.3.3 MAGNETIC LATEX PARTICLES IN PAA GEL
A.3.3.1 TRANSLATIONAL DIFFUSION
DLS with normal latex particles in the PAA gel has been studied by several
research groups [A. 17, A. 18],
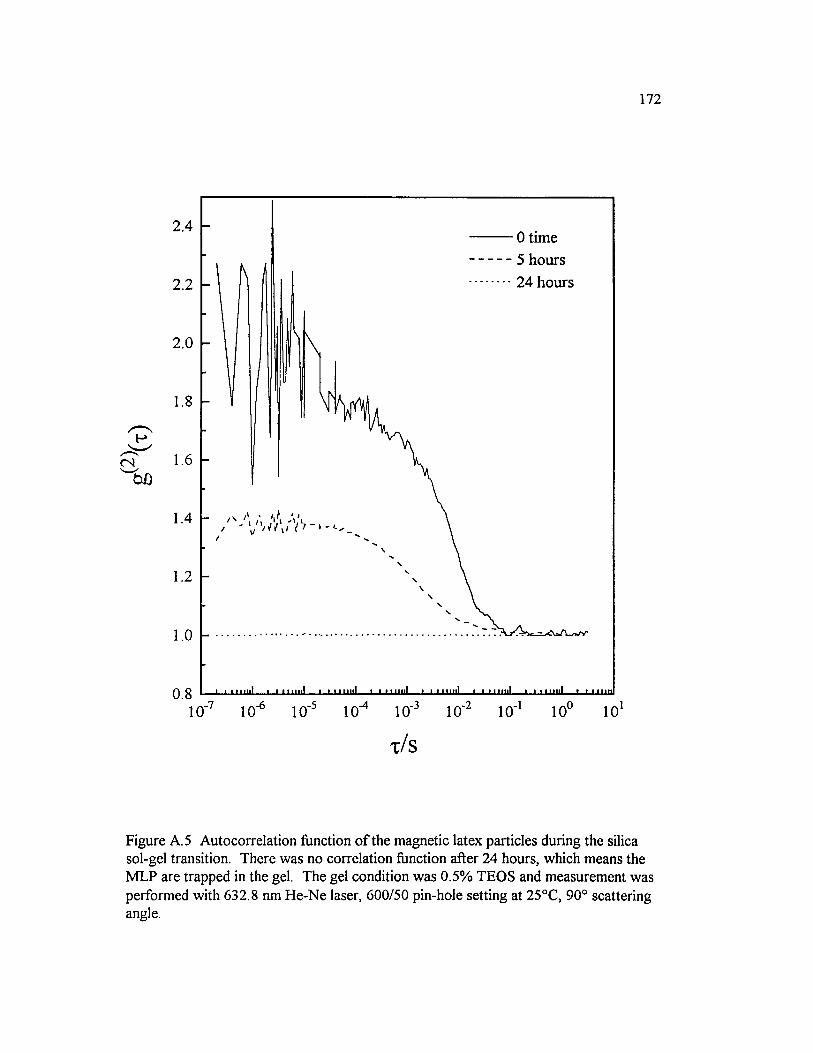
172
2.40 time 5 hours 24 hours2.2
2.0
0.810'7 10"6 10’5 10-4 10'3 10'2 10'1 1 0 °
t / s
Figure A. 5 Autocorrelation function o f the magnetic latex particles during the silica sol-gel transition. There was no correlation function after 24 hours, which means the M LP are trapped in the gel. The gel condition was 0.5% TEOS and measurement was performed with 632.8 nm He-Ne laser, 600/50 pin-hole setting at 25°C, 90° scattering angle.
173
Their observations show a complex dynamical behavior ranging from the purely
translational diffusion o f latex particles in the medium to a relaxational (slowing
down) behavior associated with local movement o f probes in the gel. M ore detailed
consideration o f the PAA gel will be discussed later.
M agnetic latex particle doesn't show any serious aggregation in the PA A gel
structure, and their correlation function decays like that o f normal latex particles in the
gel. By increasing the (BAA+AA)/water ratio up to 5 wt% , 0.5 g/10 ml water, and the
ratio (BAA/AA) up to 20 %, PAA gel becomes too turbid to measure the scattered
intensity. Vv (actually Uv, but it is the same in all measurements) and H v measurement
are measured before the onset o f turbidity. The particle's autocorrelation function from
the polarized light scattering in 3 different concentration (2.5, 3.5, 4.5% PAA) o f PAA
gel (BAA/AA = 0.04) is shown in Figure A.6 . This is the sum o f at least 50 different
ICFs (intensity correlation functions) o f different speckle patterns. One feature is
obvious from this plot: f(A) is decreasing with increasing gel concentration (weight %
o f BAA+AA) which indicates partial heterodyning due to the emergence o f strongly
scattering and stationary clusters. During the sample time scale, 60 s, which is enough
to get a reasonably clean ICF, the correlation function is not shifted from the baseline.
Non-ergodic considerations using Eq (A. 7) are shown in the Figure A. 7. These two
plots make it clear that the trapped particles act as local oscillators which cause partial
heterodyning. By decreasing the correlation length, £, the correlation function shifts to
the low time scale in case o f the silica gel, but the f(A) and baseline shift in the
acrylamide gel. In the AA gel the finite value o f f(A), fluctuating component, is coming
from the diffusion o f the particles in the gel, and the baseline shift, stationary
component, is due to the gel heterodyning. In each case the ratio between the
fluctuating and stationary component is 0.89, 0.49, and 0.19 for 2.5%, 3.5%, and 4.5%
PAA gel, respectively.
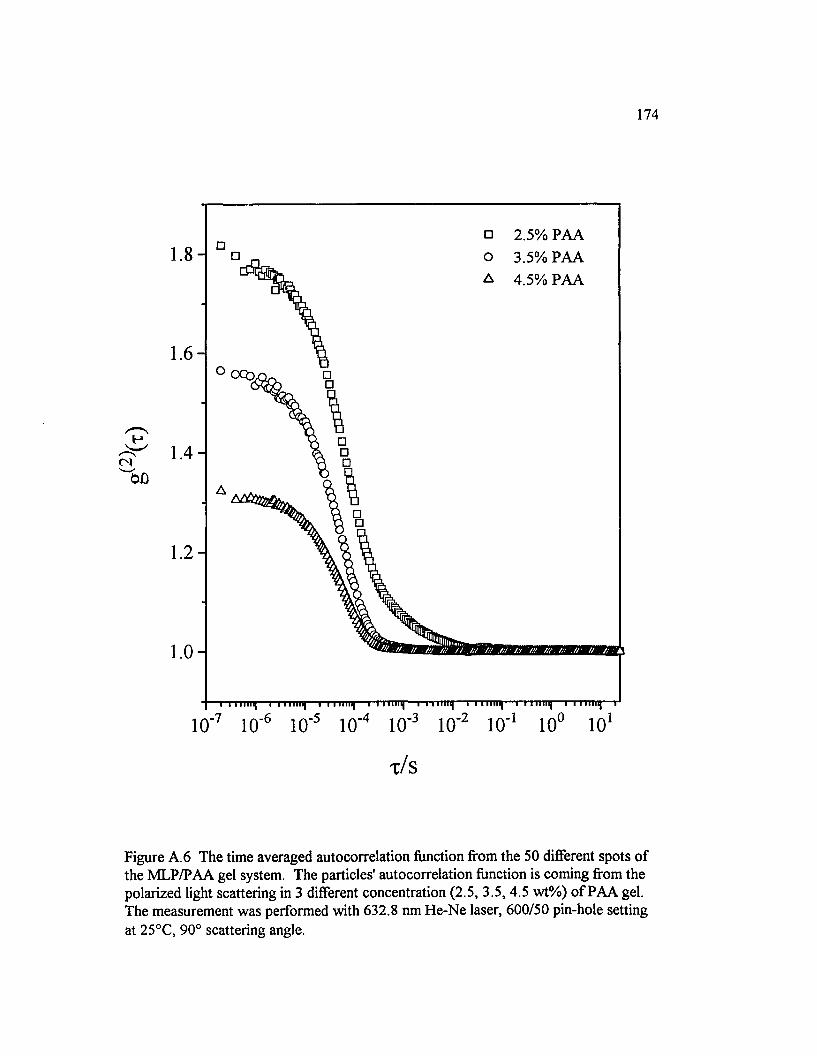
174
1.8 -
1.6 -
CN 1 . 4 -bJ)
1.2 -
1.0 -
□ □ 2.5% PA A
□
A
//• ■'/// /// // /// /// ,M •/-/ ///. ///. /it .//' //• // . ,
■I i » u u q— i 11 iiibh ‘ ■ i i m m)— i 1 111114— 1 1 m m il)— 1 1 m i i q — r i 'iT in n — 1 1 m i l l ) 1
10‘7 10'6 10'5 10‘4 10'3 10'2 10’1 10° 101
t / s
Figure A. 6 The time averaged autocorrelation function from the 50 different spots o f the M LP/PAA gel system. The particles' autocorrelation function is coming from the polarized light scattering in 3 different concentration (2.5, 3.5, 4.5 wt% ) o f PAA gel. The measurement was performed with 632.8 nm He-Ne laser, 600/50 pin-hole setting at 25°C, 90° scattering angle.
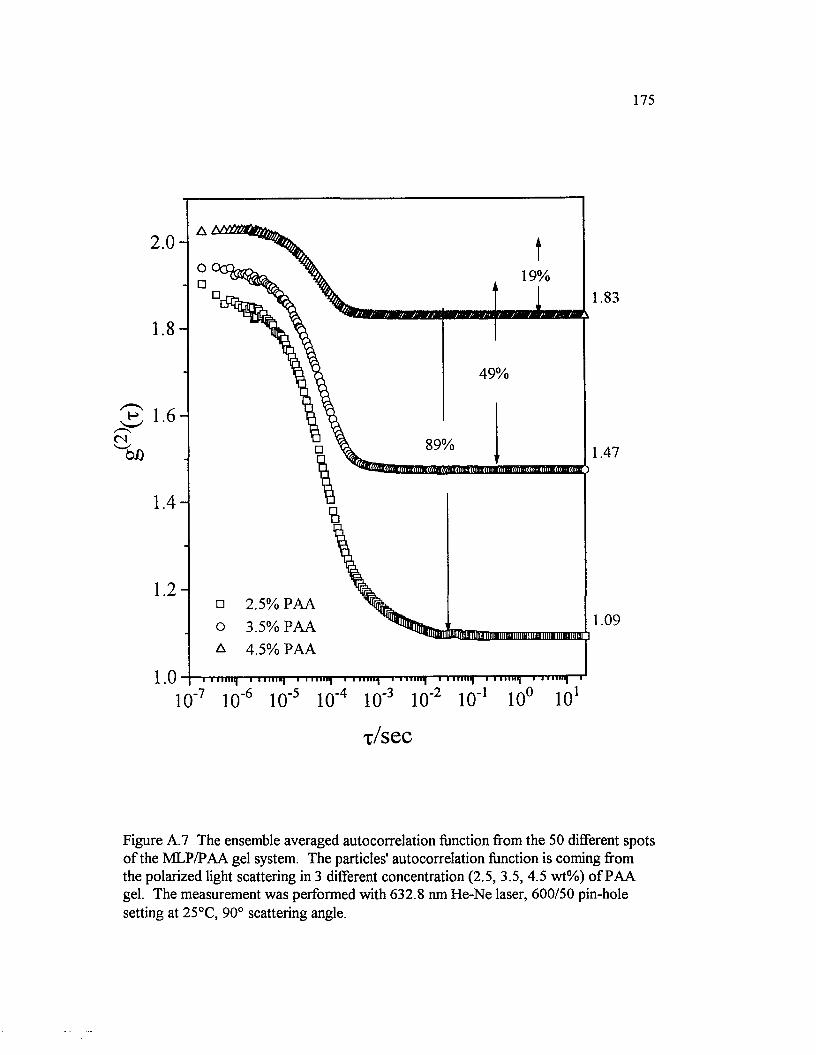
175
2 .0 -
19%1.83
49%
CN 89% 1.47
2.5% PA A
3.5% PA A
4.5% PA A
1.09iSIffieiniiiiiiiBMuiiMuiittJHiiimuiBiiimnnfflr
x/sec
Figure A.7 The ensemble averaged autocorrelation function from the 50 different spots o f the M LP/PAA gel system. The particles' autocorrelation function is coming from the polarized light scattering in 3 different concentration (2.5, 3.5, 4.5 wt% ) o f PAA gel. The measurement was performed with 632.8 nm He-Ne laser, 600/50 pin-hole setting at 25°C, 90° scattering angle.
176
A.3.3.2 ROTATIONAL DIFFUSION
Even though scattering intensity o f the particles is much greater than that o f the
PAA gel, the acrylamide gel has a decaying ICF in these concentration range (« 4
wt% ). The polarized scattering from the gel originates from the thermal fluctuation in
the gel network. The depolarized scattering o f the PAA gel is small and no one has
observed the depolarized spectrum from these gels. So, depolarized scattering with
optically anisotropic particles could be a very powerful technique. In our lab zero
angle depolarized scattering have been done for the gel system using the geometrically
and optically anisotropic PTFE particles [A.8 ], Magnetic latex particles are the other
challenge for depolarized probe diffusion studies with the gel. Although the
commercially available small magnetic particles have relatively low magnetite contents,
11 wt% o f total latex weight, there is some depolarized signal. The ion laser (514.5
nm), ~ 750 mW maximum intensity, is used and the power o f the laser is carefully
adjusted to give the depolarized signal and not to give the thermal agitation o f the gel
structure («0.5 mW). The concentration o f the MLP is increased to give a usable
depolarized signal and to have no concentration drift within the small detecting volume.
The depolarized experiment is performed at a constant temperature o f 25° at a
scattering angle o f 30°. Figure A . 8 shows the measured ICF, represented by the
decaying curve o f the depolarized scattering with ergodic and non-ergodic summing
from the ALVAN. Correlation function has low f(A) and more than 3% o f PAA gel
shows baseline shift.
A .4 S U M M A R Y
Probe diffusion with magnetic latex particles in tw o different types o f
chemically cross linked gel, silica gel and acrylamide gel, has been studied. MLP are
stable in the PAA gel, but tend to aggregate during the gelation o f the silica gel.

177
1.3
Aro
1 . 2 -
<NW)
1.1 -
1.0 -
a 3.0% PAA v 3.5% PAA o 4.0% PAA
_ l i m■ "I ■ ■ ■ ill ■_■ " ’I ■ ■ ml ■ ■ i ill J I I I I ! I L JU 11_]__■ m l
10'7 10'6 10'5 10'4 10'3 10'2 10’1 10° 101 102
t/ s
Figure A . 8 The depolarized autocorrelation function from the 50 different spots o f the M LP/PAA gel system. The particles' autocorrelation function is coming from the depolarized light scattering in 3 different concentration (2.5, 3.5, 4.5 w t% ) o f PAA gel. The measurement was performed with 514.5 nm He-Ne laser, 800/200 pin-hole setting at 25°C, 30° scattering angle, non-ergodic sum.
178
The diffusion o f particles in inorganic silica gel is decreased by decreasing the gel
correlation length, but the particles' diffusion in the viscoelastic (acrylamide) gel still
shows the heterogeneity o f the gel. By increasing the contents o f the gel network, the
silica gel makes a m ore homogeneous and compact structure than that o f the PA A gel
which has partial heterodyning. QELS study with probe particles in tw o different gels
w as successful to reveal the heterogenity o f the gel network.
In addition to the translational diffusion o f the particle, M LP are used as probes
for the depolarized scattering experiment. Rotational motion in the gel also support the
data for translational diffusion with regard to non-ergodic concepts.

179
A.5 REFERENCES
A .l R. D. Allen, Scientific American 256(2), 42 (1987).
A.2 R. Pecora, "Dynamic Light Scattering," Pleum, NY, 1985.
A. 3 B. Chung and A. -E. Zachariades, "Reversible polymeric Gels and Related Systems," P. S. Russo Ed., p22, 1986.
A.4 T. Tanaka, L. O. Hocker, and G. B. Benedek, J. Chem. Phys. 59, 5151 (1973).
A.5 P. N. Pusey and W. van Megen, PhysicaA. 157, 705 (1989).
A . 6 E. Geissler, "Dynamic Light Scattering," W. Brown, Chapter 11, p470, 1993.
A.7 B. Chu, "Laser Light Scattering," Academic Press, N ew York, 1991.
A . 8 B. Camins and P. S. Russo, Langmuir, in press.
A.9 C. Allain, M. Drifford, and B. G.-Manuel, Polymer Communication 27, 177 (1986).
A. 10 C. Konak, R. Bansil, and J. C. Reina, Polymer 31, 2333 (1990).
A l l J. G. H. Joosten, E. T. F. Gelade, P. N. Pusey, Phys. Rev. A. 42(4), 2161 (1990).
A. 12 Aerogel
(1) General
(a) C. J. Brinker and G. W. Scherer, "Sol-Gel Science," Academic Press, 1990.
(b) M RS Bulletin, XV(12), Dec. 1990.
(c) H. D. Gesser and C. Goswami, Chem. Rev. 89, 765 (1989).
(d) S. J. Teichnex, Chem tech, 372, June (1991).
(2) Preparation
(a) T. M. Tillotson and L. W. Hrubesh, J. Non-Cryst. Solids 145, 44 (1992).
(b) J. Phalippou, T. Woignier, and M. Prassas, J. Mat. Sci. 25, 3111 (1990).
(c) G. W. Scherer, J. Non-Cryst. Solids 147, 365 (1992).
(3) Properties and Applications
(a) A. M. Buckley and M. Greenblatt, J. Non-Crystals Solids 143, 1 (1992).
(b) D. W. Schaefer, B. J. Oliver, C. S. Ashley, D. Richter, B. Farago, B. Frick, L. Hrubesh, M. J. van Bommel, G. Long, and S. Krueger, J. Non-Cryst. Solids 145, 105 (1992).
(c) J. Fricke, J. Non-Cryst. Solids 147, 356 (1992).
(d) G. Poelz, "Preparation o f Silica Aerogel for Cerenkov Counter," DESY 81-055 DESY, Hamburg, 1981.
A. 13 J. Baselga, I. H-. Fuentes, I. F. Pierola, M. A. Llorente, Macromolecules 20, 3060 (1987).
A. 14 F. Family and D. P. Landau, "Kinetics o f Aggregation and Gelation," North- Holland, GA, USA, 1984.
A. 15 (a) J. E. Martin and J. P. Wilcoxon, Phys. Rev. A 39(1), 252 (1988).
(b) J. E. M artin and J. P. Wilcoxon, Phys. Rev. Lett. 61(3), 373 (1988).
A. 16 T. Tanaka, Encycropidia o f Polymer Science and Engineering, 2nd Ed. H. F. M ark et al. Ed., Wiley, New York, Vol. 7, p514, 1986.
A. 17 (a) I. Nishio, J. C. Reina, R. Bansil, Phys. Rev. Lett. 59, 684 (1987).
(b) S. Pajevic, R. Bansil, and C. Konak, Macromolecules 26, 305 (1993).
(c) J. C. Reina, R. Bansil, C. Konak, Polymer 31, 1038 (1990).
A. 18 L. Fang and W. Brown, Macromolecules 25, 6897 (1992).
APPENDIX B: UNITS FOR MAGNETIC PROPERTIES
181
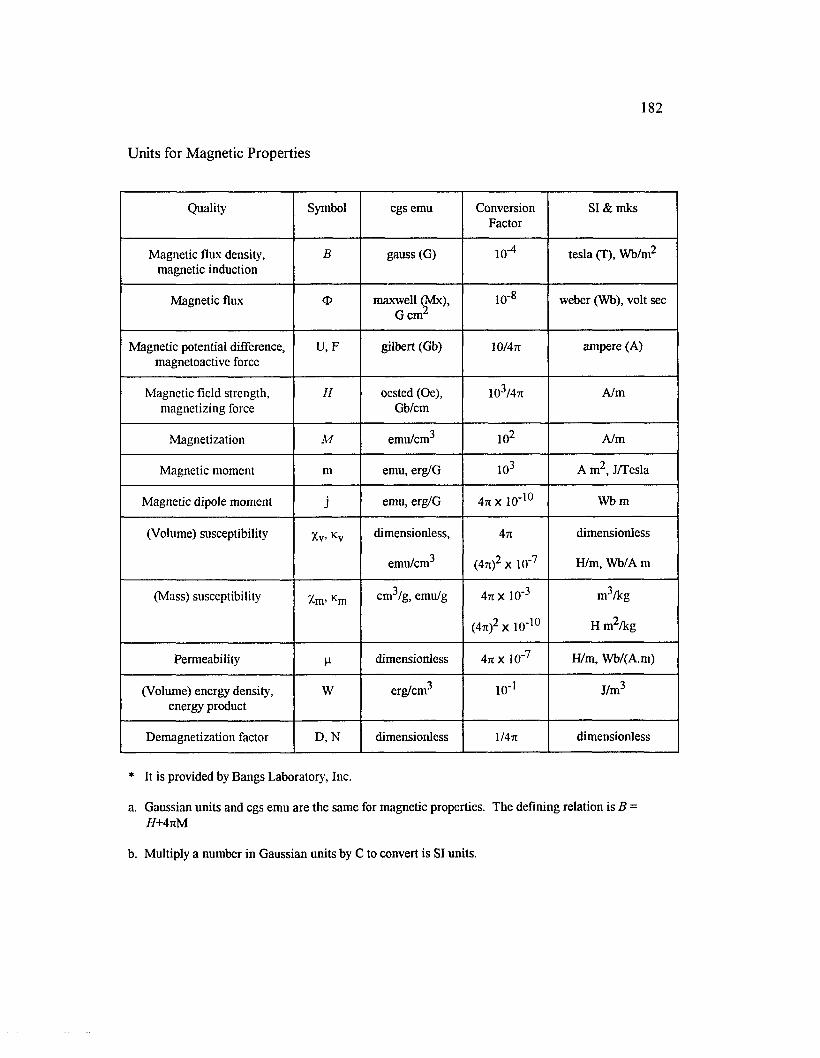
182
Units for M agnetic Properties
Quality Symbol cgs emu ConversionFactor
SI & mks
Magnetic flux density, magnetic induction
B gauss(G) 10-4 tesla (T), Wb/m2
Magnetic flux <t> maxwell (Mx), G cm
10'8 weber (Wb), volt sec
Magnetic potential difference, magnetoactive force
U ,F gilbert (Gb) 10/47t ampere (A)
Magnetic field strength, magnetizing force
H oested (Oe), Gb/cm
103/47t A/m
Magnetization M emu/cm 102 A/m
Magnetic moment m emu, erg/G 103 A m2, J/Tesla
Magnetic dipole moment j emu, erg/G 4tcX 10 '10 Wb m
(Volume) susceptibility Xv Kv dimensionless,
emu/cm
471
(47c)2 x 10'7
dimensionless
H/m, Wb/A m
(Mass) susceptibility Xm’ Km cm3/g, emu/g 4tcX 10'3
(4tc)2 X 10‘10
m3/kg
H m2/kg
Permeability P dimensionless 4tcX 10'7 H/m, Wb/(A.m)
(Volume) energy density, energy product
W erg/cm 10"1 J/m3
Demagnetization factor D ,N dimensionless 1/471 dimensionless
* It is provided by Bangs Laboratoiy, Inc.
a. Gaussian units and cgs emu are the same for magnetic properties. The defining relation is B = H+AnM
b. Multiply a number in Gaussian units by C to convert is SI units.
APPENDIX C: COPYRIGHT PERMISSION
183
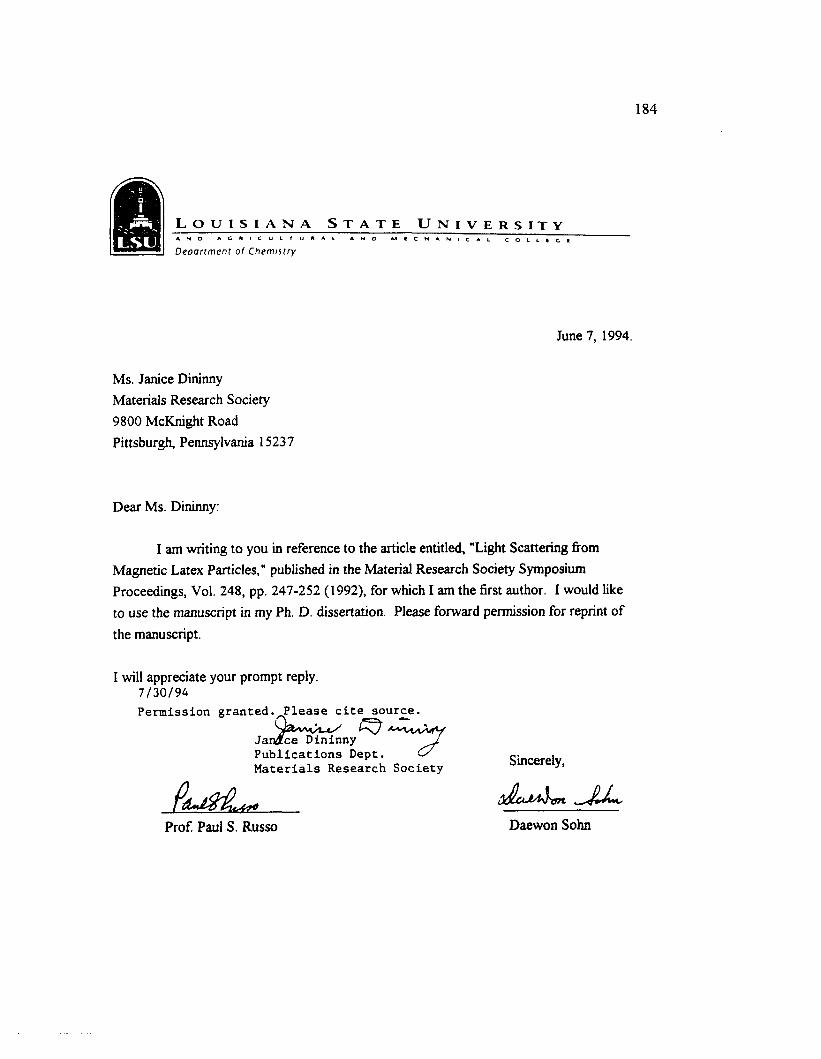
184
L S UL o u i s i a n a S t a t e U n i v e r s i t yA N D A G R I C U L T U R A L A N O M C C H A N l C
D e p a r t m e n t o f C h e m i s t r yC O L L l C I
June 7, 1994.
Ms. Janice Dininny Materials Research Society 9800 McKnight Road Pittsburgh, Pennsylvania 15237
Dear Ms. Dininny:
I am writing to you in reference to the article entitled, "Light Scattering from Magnetic Latex Particles," published in the Material Research Society Symposium Proceedings, Vol. 248, pp. 247-252 (1992), for which I am the first author. I would like to use the manuscript in my Ph. D. dissertation. Please forward permission for reprint of
the manuscript.
I will appreciate your prompt reply.7 / 3 0 / 9 4Permission granted. Please cite source.
mjce DininnyJarPublications Dept. Materials Research Society
Prof. Paul S. Russo
Sincerely,
odlcU Vtktn.
Daewon Sohn
VITA
The author, Daewon Sohn, was bom in Seoul, Korea on September 12, 1961
(by lunar calendar). He received his bachelor degree in chemistry from Hanyang
University in Korea in 1984. He obtained a master degree in chemistry in 1986 with a
thesis, "A New Flow Equation for the Thixotropic System." He then joined the Korean
Army for six months as a second lieutenant. Before he came to the United States, he
worked as a researcher for Cheil Synthetic, Inc. where he was participated in
developing a photographic film technique. He joined LSU in the fall o f 1989 and
received his Ph. D. in macromolecular chemistry in December o f 1994. His major
professor was Dr. Paul S. Russo.
185
DOCTORAL EXAMINATION AND DISSERTATION REPORT
Candidate: Daewon Sohn
Major Field: Chemistry
Title of Dissertation: Dynamic Behavior of Magnetic Latex Particles andP o lye lectro ly tes
Approved:
Major Professor and Chairman
/ Dean o: le Graduate School
EXAMINING COMMITTEE:
t-u__
Date of Examination:
1 0/27/94