dynamic and thermodynamic examination of a two- stroke
TRANSCRIPT
Politeknik Dergisi, 2016; 19 (2) : 141-154 Journal of Polytechnic, 2016; 19 (2) : 141-154
141
* Sorumlu Yazar (Corresponding Author)
e-posta:[email protected] Digital Object Identifier (DOI) : 10.2339/2016.19.2 141-154
Dynamic and Thermodynamic Examination of a Two-
Stroke Internal Combustion Engine
Duygu İPCİ*, Halit KARABULUTa
aGazi University Technology Faculty Automotive Engineering Department
(Geliş / Received : 27.06.2015 ; Kabul / Accepted : 24.07.2015)
ABSTRACT In this study the combined dynamic and thermodynamic analysis of a two-stroke internal combustion engine was carried out. The
variation of the heat, given to the working fluid during the heating process of the thermodynamic cycle, was modeled with the
Gaussian function. The dynamic model of the piston driving mechanism was established by means of nine equations, five of
them are motion equations and four of them are kinematic relations. Equations are solved by using a numerical method based on
the Taylor series. By means of introducing practical specific values, the dynamic and thermodynamic behaviors of the engine
were examined. Variations of several engine performance parameters with engine speed and charging pressure were examined.
The brake thermal efficiency, cooling loss, friction loss and exhaust loss of the engine were predicted as about 37%, 28%, 4%,
and 31% respectively for 3000 rpm engine speed and 1 bar charging pressure. Speed fluctuation was found to be 3% for 3000
rpm engine speed and 45 Nm torque.
Keywords: Two stroke engine, thermodynamic analysis, dynamic analysis, power and torque estimation, speed
fluctuations.
ÖZ
Bu araştırmada iki zamanlı bir içten yanmalı motorun dinamik ve termodinamik birleşik analizi yapılmıştır. Termodinamik
çevrimin yanma süresince çalışma akışkanına verilen ısının değişimi Gauss fonksiyonu ile modellenmiştir. Piston hareket
mekanizmasının dinamik modeli dokuz denklemle modellenmiş olup bunlardan beşi hareket denklemi, dördü kinematik ilişkidir.
Dinamik ve termodinamik modeli oluşturan denklemler Taylor serisine dayanan bir yöntemle çözülmüştür. Gerçekçi spesifik
değerler kullanılmak suretiyle motorun dinamik ve termodinamik davranışları incelenmiştir. Muhtelif motor performans
parametrelerinin motor hızı ve şarj basıncı ile değişimi incelenmiştir. 3000 rpm motor hızı ve 1 bar dolgu basıncı için termik fren
verimi, soğutma kayıpları, sürtünme kayıpları ve egzoz kayıpları sırası ile %37, %28, %4 ve %31 olarak belirlenmiştir. 3000 rpm
motor hızı ve 45 Nm tork için hız dalgalanmaları %3 olarak belirlenmiştir.
Anahtar Kelimeler: İki zamanlı motor, termodinamik analiz, dinamik analiz, güç ve tork tahmini, hız dalgalanmaları
1. INTRODUCTION
In piston engines the thermodynamic cycle is
accomplished either by two or four reciprocating
motions of the piston. The engines accomplishing a
cycle by two reciprocating motions of the piston are
named as two-stroke engines. The upward motion of the
piston is a compression process while the downward
motion is an expansion process. The discharge of
burned gases and recharge of the fresh air, or air-fuel
mixture, into the cylinder is performed towards the end
of expansion process [1]. It is generally accepted that
the two-stroke internal combustion engine was invented
by Sir Dugold Clerk in Britain at the end of the 19th
Century [1]. For the current situation the two-stroke
internal combustion engines are used in a large variety
of light and heavy duties.
In comparison with four stroke engines, the two-stroke
engines have some advantages, such as simple structure,
lower cost, lighter weight, higher specific power, higher
speed, simple maintenance, capability of working at
different positions, capability of being designed at very
small scales and so on. It has also some disadvantages,
such as relatively lower thermodynamic efficiency,
higher HC and CO emissions as well as toxic pollutants
[2-5], lower life time, specific lubricant requirement,
wastage of some fuel through the exhaust port, specific
crank case configuration requirement and so on. Both
gasoline and Diesel fueled engines are able to be
designed as a two-stroke engine [6].
Two-stroke engines are able to be designed with and
without a valve mechanism. In engines having no valve
mechanism, recharging of the fresh air into the cylinder
and discharging of the exhaust gases out of the cylinder
is accomplished by ports taking part on the cylinder
wall. The opening and closing of the ports are
performed by the piston motion [6]. The engines
involving a valve mechanism are structurally
complicated as four stroke engines but, via the valve
mechanism, the rate of fresh air charged into the
cylinder is increased as well as avoiding piston failures.
In two-stroke engines, the work generation, discharging
of the burned gases and recharging of the fresh air into
the cylinder take part in the same stroke. Therefore,
fresh air requires a pre-compression process into a pre-
compression camber. Pre-compression may be
performed by using a stepped-piston, a displacer, a
blower, a pump or a compressor [6]. Beside these, the
volume variation in the crankcase, due to the
reciprocating motion of the piston, creates an adequate
amount of pressure if the crankcase is properly

Duygu İPCİ, Halit KARABULUT / POLİTEKNİK DERGİSİ, Politeknik Dergisi, 2016; 19 (2) : 141-154
142
designed. In most of the two-stroke light-duty engines
charging of the fresh air into the cylinder is performed
by crankcase pressure. Obviously, in these types of
engines the crankcase performs as a pre-compression
chamber. In these engines, the flow of the fresh air into
the crankcase may be performed by natural inspiration
or by forced flow called as supercharging. Charging of
fresh air into the cylinder via pre-compression process is
an irreversible process and reduces the thermodynamic
efficiency of the two-stroke engines except the case
where the pre-compression is performed via a
turbocharger. The two-stroke engines charged with
crankcase pressure may have at most 1.5 times the
power of four-stroke engines having the same cylinder
volume if the flow of air into the crankcase is a natural
inspiration. In the case of supercharging, the power of a
two stroke engine approaches to a value of almost 2
times the power of four stroke engines.
The two-stroke engines charged with crankcase
compression are simplest in structure. The crankcase
compression is applicable only to the two-stroke
gasoline engines. In these engines the exhaust port is
located at somewhere before the bottom dead center of
the cylinder. Discharging of exhaust gases starts when
the upper piston ring coincides with the upper end of the
exhaust port. Discharge of exhaust gases is a transient
flow in the form of a pulse. Determination of
discharging period of exhaust gases is a comprehensive
fluid mechanic problem [7,8]. The intake port is located
at somewhere a little lower than the exhaust port. After
pulsing of exhaust gases, the intake port is disclosed by
the piston top. For a certain time interval, both the
exhaust port and intake port remains open. In terms of
crankshaft angle, this period is called as scavenging
angle [1]. The flow of fresh air from the crankcase to
the cylinder is also a transient flow in the form of a
pulse. In two-stroke engines the increase of the engine
speed reduces the pulsing period of both exhaust gases
and fresh air and reduces the efficiency of the charging.
To address this problem, the high speed engines are
designed with a larger crankcase compression ratio as
well as designing ports that opens relatively earlier [1].
In two-stroke engines both of these design alterations
have reducing effects on the engine thermal efficiency.
In engines with moderate speeds, the statistical value of
the crankcase compression ratio is about 1.4-1.5 [1]. In
terms of the crank angle, the opening time of the
exhaust port is about 50o-70
o before the bottom dead
center of the cylinder [1,6,9]. In two-stroke engines
charged with crankcase compression, the flow of fresh
air into the crankcase is performed through a piston
controlled valve or a pressure controlled check-valve
named as reed valve. In the engines with crankcase
compression the crankcase cannot be used as a lubricant
reservoir [10]. Therefore, the lubrication of sliding
surfaces of the piston driving mechanism is performed
via mixing some lubricant into the gasoline. The
lubricant mixed into the gasoline reduces the octane
number of the gasoline and, therefore, the compression
ratio of the two-stroke engines is lower than that of
four-stroke engines. The crankcase compression engines
are not very useful for heavy duties. Heavy duty engines
are mostly designed with pressurized lubrication and
they use the crankcase as lubricant reservoir.
Some of the experimental investigations conducted in
recent years on the internal combustion engines are
concentrated on the heat release processes. According to
the standard thermodynamic cycle of Otto engines, the
total heat is given to the working fluid at the top dead
center of the cylinder at a constant volume and the
pressure of the working fluid increases a few times
while the volume was constant. In practice however,
this is a harmful phenomenon named as combustion
knock. Combustion knock occurs in both Otto and
Diesel engines. If the release of the heat is performed
along a certain time interval, the knocking is avoided.
Experimental investigations indicates that if the heat
release period takes part in 5 and 25 of crankshaft
angle around the top dead center, the combustion knock
is avoided and the highest thermal efficiency is obtained
[1,4,9,11,12]. The heat release interval of ( 5 )-(+ 25) is appropriate for both Otto and Diesel engines. As
known, the cetane and octane numbers are criterions
indicating knocking resistance of Diesel fuel and
gasoline respectively. The compression ratio of the Otto
engines is restricted to 11 by knocking.
Piston driving mechanism of the two-stroke engines is
consisted of a piston, a connecting rod and a crankshaft.
For the design of a pre-balanced crankshaft, a complete
dynamic analysis of the piston driving mechanism is
needed. In a dynamic analysis the gas pressure exerting
onto the piston is an initially known function. The gas
pressure may be obtained from an existing engine by
measurement [13], or it may be determined by a
thermodynamic analysis. The numerical data obtained
by measurement is not useful to use in a dynamic
analysis directly and require fitting with a Fourier series
[13-15]. When it is fitted with a Fourier series, due to
the nature of the Fourier series, the originality of the gas
pressure is lost. Because of this the combined
thermodynamic-dynamic analysis is seen more useful.
In combined thermodynamic-dynamic analysis the gas
force exerting onto the piston is calculated
simultaneously with the other forces and moments
involved by the analysis. For the calculation of gas force
the first low of the thermodynamic given for closed
systems is used [16].
A combined thermodynamic-dynamic analysis can be
used for estimating the gas pressure, gas temperature,
engine power, thermal efficiency, port timing values,
speed-tork and speed-power characteristics of the
engine, the transient and steady behaviors of the engine,
mechanical design criterions such as strains, stresses,
moments, forces and frictions, crankshaft speed
fluctuations etc. The combined thermodynamic-
dynamic analysis also enables the optimization of the

DYNAMIC AND THERMODYNAMIC EXAMİNATION OF A TWO-STROKE INTERNAL CO … Politeknik Dergisi, 2016; 19 (2) :141-154
143
engine components from the weight or volume point of
view.
In a dynamic system each component under force may
have flexibility. Between sliding surfaces there may be
working clearances as well. If the all of these
flexibilities are taken into account, the degree of
freedom of the dynamic model may become too large
and too much time and effort is needed. To avoid this
difficulty, dynamic analyses are restricted to examine
the specific aspects of the dynamic systems. Similarly
the components of piston driving mechanism and its
different aspects are investigated by preparing specific
dynamic models [17-20].
In four stroke engines having a valve mechanism, the
friction losses are estimated as about 15% of indicated
power [21,22]. In two-stroke engines, having no valve
mechanism, the friction losses are significantly lower
than that of four stroke engines [23]. In engines
equipped with roll-bearings, the friction losses are
further decreased. For two-stroke engines charged with
crankcase compression, all of the friction losses are
estimated to be (5-10)% of the indicated work.
In two-stroke engines charged with crankcase
compression the highest frictional loss appears at the
piston-cylinder liner interface. The total friction force
exerted on a piston is mainly caused by skirt friction and
ring-pack friction. The piston skirt and ring-pack
comprise both hydrodynamic and boundary frictions
(asperity friction). The simplest approximation used for
calculating the hydrodynamic friction between piston
skirt and liner is the Couette approximation. Ring-pack
friction depends on many physical factors such as gas
pressure, secondary motion of the piston, static and
dynamic distortions on the cylinder bore, starvation of
the lubricant around the ring contact surface, the non-
axisymmetrical form of rings in the cylinder bore and so
on[24-27]. About the top and bottom dead centers of
the piston stroke, the tilting motion of the piston causes
a higher asperity friction. At mid regions of the piston
stroke, the hydrodynamic friction is dominant. The
experimental measurement conducted without the
working gas pressure indicates that the sum of asperity
friction and hydrodynamic friction could be accepted as
constant [18,26].
In two-stroke engines charged by the crankcase
compression, the connection of the crankshaft with the
conrod and the engine body, or the crankcase, is made
with roll bearings. In very small engines the ball type, in
relatively large engines needle type roll bearings are
used. To calculate the roll bearing friction, 5 different
approximation models were developed, such as rotary
coulomb friction model, bearing/seal viscous model,
Palmgren model, ATEC bearing model and SKF
bearing model [28]. However these are not the only
approximations found in the whole of the roll bearing
literature. In a roll bearing sources of the friction are:
elastic hysteresis in rolling, sliding due to deformation
of contacting elements and/or bearing geometry,
spinning of rolling elements, gyroscopic pivotal motion
of rolling elements, sliding between cage and rolling
elements and between cage and bearing rings, viscous
friction due to lubricant motion and seal friction. The
hydrodynamic friction is related to the speed of the shaft
and in some cases it may become 98% of the total
friction. The variation of the other components of
friction with speed may be negligible [29]. The friction
caused by sliding due to deformation of contacting
elements and/or bearing geometry has a strong
dependency on normal forces [30,31].
In most of the theoretical studies related to the piston
driving mechanism dynamic, conducted so far, the
conrod mass is divided into two parts and one of them is
added to the piston as the other is added to the
crankshaft mass [26,32,33,34]. There are also a few
numbers of studies treating the conrod as a separate part
of the dynamic system [35]. In these studies the conrod
motion was described by three equations which are
translational x and y momentum equations and angular
momentum equation around the gudgeon pin. This
model provides more precise prediction of the mass of
counter balance weights and their positions.
One of the important aspects of the thermodynamic-
dynamic analysis is the inclusion of heat transfer
between the working gas and cylinder walls. The largest
amount of the heat transfer occurs around the
combustion chamber. The determination of the heat
transfer coefficient in the engine cylinders is a
comprehensive study field including theoretical and
experimental analysis. The correlation given by
Eichelberg and Nusselt are most recommended
approximation for engine heat transfer calculations
[16,36].
This analysis is intended to estimate the thermodynamic
performance characteristics and the optimization of
mechanical quantities of a two-stroke gasoline engine
charged with crankcase compression. The dynamic
model has one degree of freedom and involves 5 motion
equations as well as kinematic relations. The present
analysis involves three different novelties. In some of
previous analysis the gas pressure was obtained from an
empirical relation which is Fourier expansion of
experimental data obtained from a test engine. Also,
some of previous analysis uses theoretical data
generated from standard ideal gas cycles. In the present
analysis the gas pressure have been obtained from a
relation derived from the first law of the thermodynamic
which involves the heat release rate and heat transfer to
the surrounding walls. Another novelty is the use of a
heat release rate profile to provide heat for the
thermodynamic cycle involved by the present analysis.
The heat release rate profile used in the analysis has
been established by means of resembling the
experimental heat release rate profiles presented in
some latest experimental works [3,4]. The third novelty
is that in the present analysis the conrod motion was
modeled by means of three motion equations differently
from previous analysis where the conrod was split into
Duygu İPCİ, Halit KARABULUT / POLİTEKNİK DERGİSİ, Politeknik Dergisi, 2016; 19 (2) : 141-154
144
two parts and parts were added to crankpin and piston
masses. The analysis presented here will enable the
design of pre-balanced crankshafts.
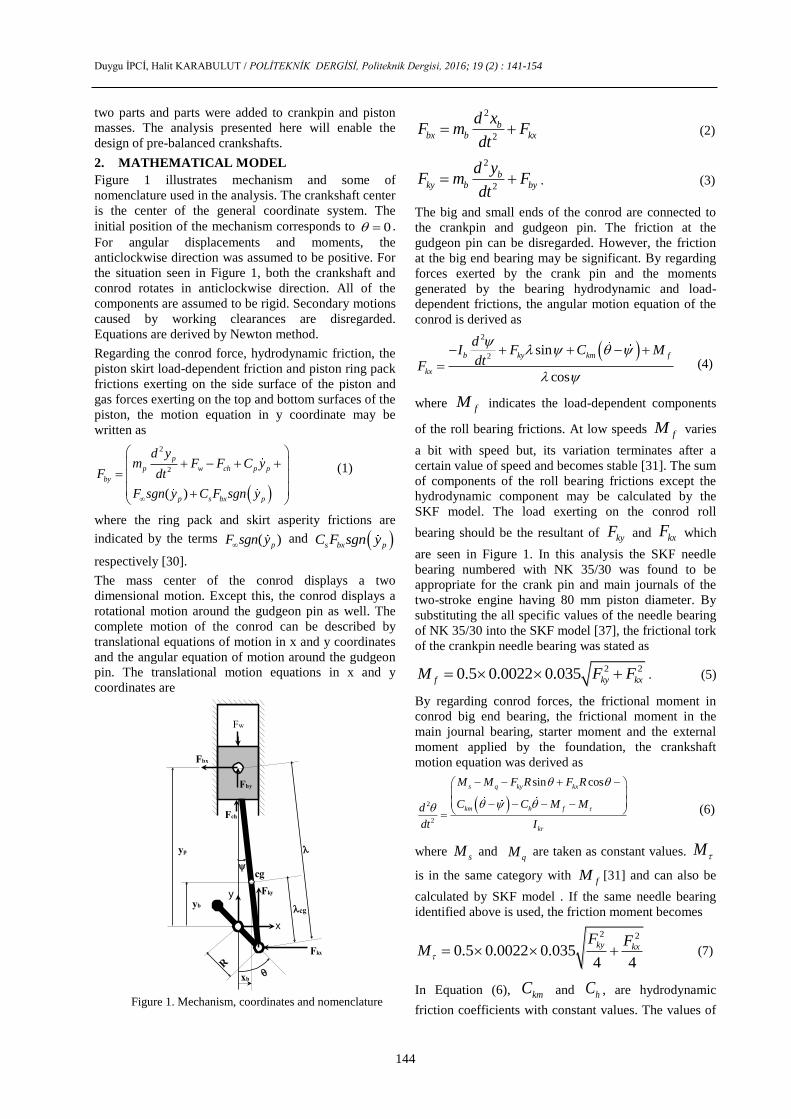
2. MATHEMATICAL MODEL
Figure 1 illustrates mechanism and some of
nomenclature used in the analysis. The crankshaft center
is the center of the general coordinate system. The
initial position of the mechanism corresponds to 0 .
For angular displacements and moments, the
anticlockwise direction was assumed to be positive. For
the situation seen in Figure 1, both the crankshaft and
conrod rotates in anticlockwise direction. All of the
components are assumed to be rigid. Secondary motions
caused by working clearances are disregarded.
Equations are derived by Newton method.
Regarding the conrod force, hydrodynamic friction, the
piston skirt load-dependent friction and piston ring pack
frictions exerting on the side surface of the piston and
gas forces exerting on the top and bottom surfaces of the
piston, the motion equation in y coordinate may be
written as
2
2
( )
p
p w ch p p
by
p s bx p
d ym F F C y
dtF
F sgn y C F sgn y
(1)
where the ring pack and skirt asperity frictions are
indicated by the terms ( )pF sgn y and s bx pC F sgn y
respectively [30].
The mass center of the conrod displays a two
dimensional motion. Except this, the conrod displays a
rotational motion around the gudgeon pin as well. The
complete motion of the conrod can be described by
translational equations of motion in x and y coordinates
and the angular equation of motion around the gudgeon
pin. The translational motion equations in x and y
coordinates are
Figure 1. Mechanism, coordinates and nomenclature
2
2
bbx b kx
d xF m F
dt (2)
2
2
bky b by
d yF m F
dt . (3)
The big and small ends of the conrod are connected to
the crankpin and gudgeon pin. The friction at the
gudgeon pin can be disregarded. However, the friction
at the big end bearing may be significant. By regarding
forces exerted by the crank pin and the moments
generated by the bearing hydrodynamic and load-
dependent frictions, the angular motion equation of the
conrod is derived as
2
2sin
cos
b ky km f
kx
dI F C M
dtF
(4)
where fM indicates the load-dependent components
of the roll bearing frictions. At low speeds fM varies
a bit with speed but, its variation terminates after a
certain value of speed and becomes stable [31]. The sum
of components of the roll bearing frictions except the
hydrodynamic component may be calculated by the
SKF model. The load exerting on the conrod roll
bearing should be the resultant of kyF and kxF which
are seen in Figure 1. In this analysis the SKF needle
bearing numbered with NK 35/30 was found to be
appropriate for the crank pin and main journals of the
two-stroke engine having 80 mm piston diameter. By
substituting the all specific values of the needle bearing
of NK 35/30 into the SKF model [37], the frictional tork
of the crankpin needle bearing was stated as
2 20.5 0.0022 0.035f ky kxM F F . (5)
By regarding conrod forces, the frictional moment in
conrod big end bearing, the frictional moment in the
main journal bearing, starter moment and the external
moment applied by the foundation, the crankshaft
motion equation was derived as
2
2
sin coss q ky kx
km h f
kr
M M F R F R
C C M Md
dt I
(6)
where sM and
qM are taken as constant values. M
is in the same category with fM [31] and can also be
calculated by SKF model . If the same needle bearing
identified above is used, the friction moment becomes
2 2
0.5 0.0022 0.0354 4
ky kxF F
M (7)
In Equation (6), kmC and hC , are hydrodynamic
friction coefficients with constant values. The values of
x
y
Fch
Fw
Fky
Fkx
cg
cg
Fby
Fbx
yb
yp
xb
R

DYNAMIC AND THERMODYNAMIC EXAMİNATION OF A TWO-STROKE INTERNAL CO … Politeknik Dergisi, 2016; 19 (2) :141-154
145
kmC and hC can be determined by using the SKF
friction model as well.
The kinematic relations used for the calculation of; the
angle between the conrod and cylinder axis, the vertical
distance between the crank center and piston top, the
vertical distance between the crank center and the
conrod mass center and the horizontal distance between
the crank center and conrod mass center are
arcsin sinR
(8)
cos cosp py R h (9)
cos cosb cgy R (10)
( )sinb cgx . (11)
For the calculation of the in-cylinder pressure, an
equation was derived from the first law of the
thermodynamic. For the systems with constant mass, the
first law of the thermodynamic is given as
dq du pdv . (12)
The perfect gas law is given as
1
dT d pv
. (13)
Equation (12) may be rearranged as
1 1
dq dp k dv
T k p k v
. (14)
In last equation q indicates the net heat calculated as
p wq q q , where pq is the heat generated by the
combustion and wq is the heat loss via the heat transfer
between the gas and walls surrounding the gas.
Equation (14) can be arranged as
1p wd q qdp dv
k kp v pv
. (15)
When the last equation is integrated between two
thermodynamic states of the gas, 1i and i
2 2
1 11 1
1 1
p w
i i i i
dq dqk k kp v p vi i
i k
i
p vp e
v
(16)
is obtained. The last equation can be rearranged as
below, by assuming that the gas in the cylinder is not 1
kg and, between states 1i and i , its thermodynamic
values change at a differential order,
1 1
1 1p w
i i i i
k kk Q Qp V p Vi i
i k
i
p Vp e
V
. (17)
Via the cooling law of Newton, last equation can be
rearranged as
1 1
11 1
wp i
i i i i
Tkk Q k hA dt
p V m p Vi ii k
i
p Vp e
V
(18)
In the last equation if ip on the right is replaced with
1ip , the equation transforms to a more useful form.
The error caused by this perturbation is too small to
influence the accuracy of the pressure.
In this study, the heat produced during a differential
rotation of the engine was correlated with Gauss
function as
2
( 1)2n
PQ C e t
. (19)
In this equation , and C are constants qualifying
the location of maximum heat production, the duration
of heat production and the amount of heat production. n
is an integer indicating the number of strokes. If the last
equation is integrated over a cyclic period, the relation: 2( ) /PC Q is obtained which indicates that C
and are interrelated.
For the calculation of heat transferred from the gas to
the wall, the Eichelberg and Nusselt relations
77.9
10000P
pTh V , (20)
44
4 1/3 2/3 100 1005,388 10 (1 1,24 ) 0,421
w
p
w
TT
h V T pT T
(21)
were used [16,36]. In these equations PV is the average
speed of the piston and initially not known. In last two
equations if PV is replaced with 0.64R , equations
becomes more eligible to use in a simulation program.
Due to the high speed motion of crankshaft and other
components, the air in the crankcase has a large enough
circulation velocity. Because of this velocity, the heat
transfer coefficient between the crankcase wall and the
air is large enough. Therefore the pre-compression in
the crankcase may be assumed as an isothermal process.
Regarding this situation the pressure in the crankcase
may be defined by a piecewise function as
5
1 1
10 , 0
2i i i
i
p p V
V
(22)
If the opening and closing times of the intake and
exhaust ports are taken into account, the last equation is
not a precise definition of the crankcase pressure
however; for the sake of simplicity of simulation
program, the last equation is preferred.
If the forces exerting on the engine body are minimized,
the vibration of the engine body is minimized. The
Duygu İPCİ, Halit KARABULUT / POLİTEKNİK DERGİSİ, Politeknik Dergisi, 2016; 19 (2) : 141-154
146
resultant of forces exerting on engine body may be
determined via setting static balance equations in y and
x directions. The external forces exerting on the engine
body are the external support forces, gas forces in
crankcase and working volumes, friction forces inside
the engine block and forces conducted to the engine
block via the crankshaft and piston contact surfaces.
The static balance equations of the engine body in y and
x direction may be written as
( )
0
zy w ch p p p
s bx p ky
F F F C y F sgn y
C F sgn y F
(23)
0zx kx bxF F F . (24)
By combining Equations (23),(3) and (1)
22
2 2
pbzy b p
d yd yF m m
dt dt (25)
is obtained. By combining Equations (24) and (2)
2
2
bzx b
d xF m
dt (26)
is obtained. Last two equations indicate that, the
resultant forces exerting on the engine body are inertia
forces only. The forces described by the last two
equations work to vibrate the engine block. In order to
balance these forces, counter weights are used. A
counterweight generates a centrifugal force in the
positive radial direction. If the counter weight is situated
opposite to the crank pin, the centrifugal force generated
by the counterweight balances the force generated by
piston and conrod. The vertical and horizontal
components of the centrifugal force generated by
counter weight may be defined as
2 cosdy d dF m R (27)
2 sindx d dF m R (28)
where dm and
dR are the mass and radial distance of
the counter weight. From the numerical solution point
of view, equations derived above are an initial value
problem. The boundary conditions of crankshaft angle
and gas pressure are
0, 0, 0t (29)
0, 1t p bar . (30)
The boundary conditions of the other variables are
derived easily from the kinematic and dynamic relations
given above. Numerical solution of equations is
performed by a method based on Taylor series
expansion [15,32]. The solution of the dynamic model is
progressed as same as the operation of an internal
combustion engine. At first, the crankshaft is
accelerated by the starter moment and the whole of the
dynamic system gains momentum. Up to a certain value
of the crankshaft angle the starter moment is kept active
and the system is let to perform the first expansion
process. After the expansion process, system gains
adequate momentum and keeps running.
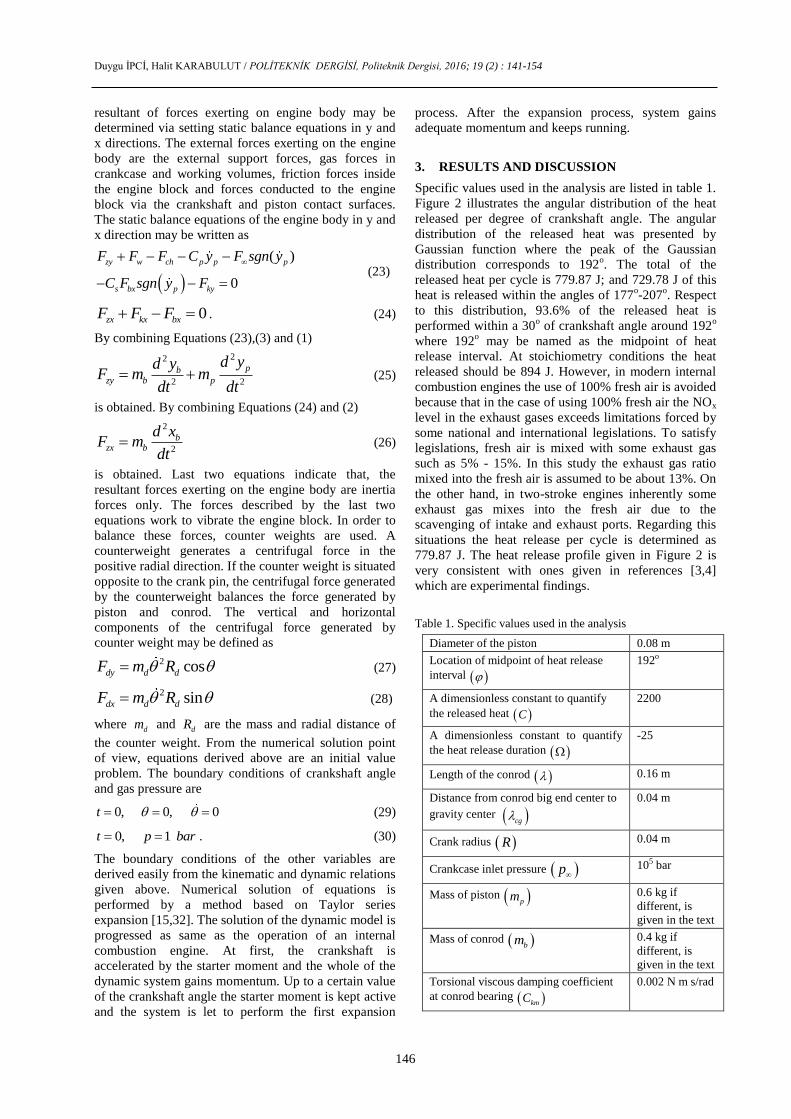
3. RESULTS AND DISCUSSION
Specific values used in the analysis are listed in table 1.
Figure 2 illustrates the angular distribution of the heat
released per degree of crankshaft angle. The angular
distribution of the released heat was presented by
Gaussian function where the peak of the Gaussian
distribution corresponds to 192o. The total of the
released heat per cycle is 779.87 J; and 729.78 J of this
heat is released within the angles of 177o-207
o. Respect
to this distribution, 93.6% of the released heat is
performed within a 30o of crankshaft angle around 192
o
where 192o may be named as the midpoint of heat
release interval. At stoichiometry conditions the heat
released should be 894 J. However, in modern internal
combustion engines the use of 100% fresh air is avoided
because that in the case of using 100% fresh air the NOx
level in the exhaust gases exceeds limitations forced by
some national and international legislations. To satisfy
legislations, fresh air is mixed with some exhaust gas
such as 5% - 15%. In this study the exhaust gas ratio
mixed into the fresh air is assumed to be about 13%. On
the other hand, in two-stroke engines inherently some
exhaust gas mixes into the fresh air due to the
scavenging of intake and exhaust ports. Regarding this
situations the heat release per cycle is determined as
779.87 J. The heat release profile given in Figure 2 is
very consistent with ones given in references [3,4]
which are experimental findings.
Table 1. Specific values used in the analysis
Diameter of the piston 0.08 m
Location of midpoint of heat release
interval
192o
A dimensionless constant to quantify
the released heat C
2200
A dimensionless constant to quantify
the heat release duration
-25
Length of the conrod 0.16 m
Distance from conrod big end center to
gravity center cg
0.04 m
Crank radius R 0.04 m
Crankcase inlet pressure p 105 bar
Mass of piston pm 0.6 kg if
different, is
given in the text
Mass of conrod bm 0.4 kg if
different, is
given in the text
Torsional viscous damping coefficient
at conrod bearing kmC
0.002 N m s/rad

DYNAMIC AND THERMODYNAMIC EXAMİNATION OF A TWO-STROKE INTERNAL CO … Politeknik Dergisi, 2016; 19 (2) :141-154
147
Torsional viscous damping coefficient
at main bearing hC
0.006 N m s/rad
Dimensionless friction coefficient at
piston side surface sC
0.05
Lateral viscous damping coefficient at
piston side surface pC
2.0 N s/m
Ring pack friction F 20 N
Gas constant of air 288.0 J kg−1 K−1
Specific heat at constant
pressure/Specific heat at constant
volume k
1.35
Inlet temperature of the fresh air into
the cylinder inT
350 K
Average wall temperature of cylinder
wT
400 K
Lower heating value of fuel 42000 kJ
Distance between piston top and
gudgeon pin center ph
0.05 m
Volume of crankcase corresponding to
0
10-3 m3
Volume of combustion chamber 44x10-3 m3
Crankshaft mass inertia moment krI 0.0567 m2kg
Conrod mass inertia moment bI 0.0025 m2kg
Radial distance of counter weight from
the crankshaft center dR
0.05 m
Starter motor moment sM 60 Nm
Figure 2. Heat releases during a cycle.
In a thermodynamic-dynamic analysis, the highest error
may be imposed by the used heat transfer relations. In
this analysis the heat transfer from gas to the wall was
calculated via two relations given by Nusselt and
Eichelberg. Figure 3 illustrates cumulative of the heat
release, the indicated work generation, the cooling loss
(heat transfer to the walls) and the exhaust loss over a
period of 43 cycles. Data used in Figure 3 were obtained
by using Nusselt relation in the simulation program
[16,36]. As seen from the figure the cumulative heat
release, the indicated work generation, the cooling loss
and the exhaust loss are varying linearly with time. In
each of subsequent cycles, an equal amount of heat
release, work generation, cooling loss and exhaust loss
are observed. This is due to that all of these quantities
are not varying from cycle to cycle. The curve
indicating the heat release increases step by step like
stairs. This is due to that in a cyclic period, the heat
release occurs within a 50o of crank angle and in the
remaining of the cycle the heat release is zero.
Data used in Figure 3 for cooling loss, indicated work
and heat release were determined directly by the
analysis. The exhaust loss was calculated by balancing
the cooling loss, the indicated work and the heat release.
The heat release, the cooling loss, the work generation
and the exhaust loss over a period of 43 cycle are
33536.27, 9622.62, 13731.66 and 10182 J respectively.
According to these results, 40.94% of the released heat
is converted to the work, 28.69% is transferred to the
wall and 30.36% is lost through the exhaust. These
proportions are consistent with practical measurements.
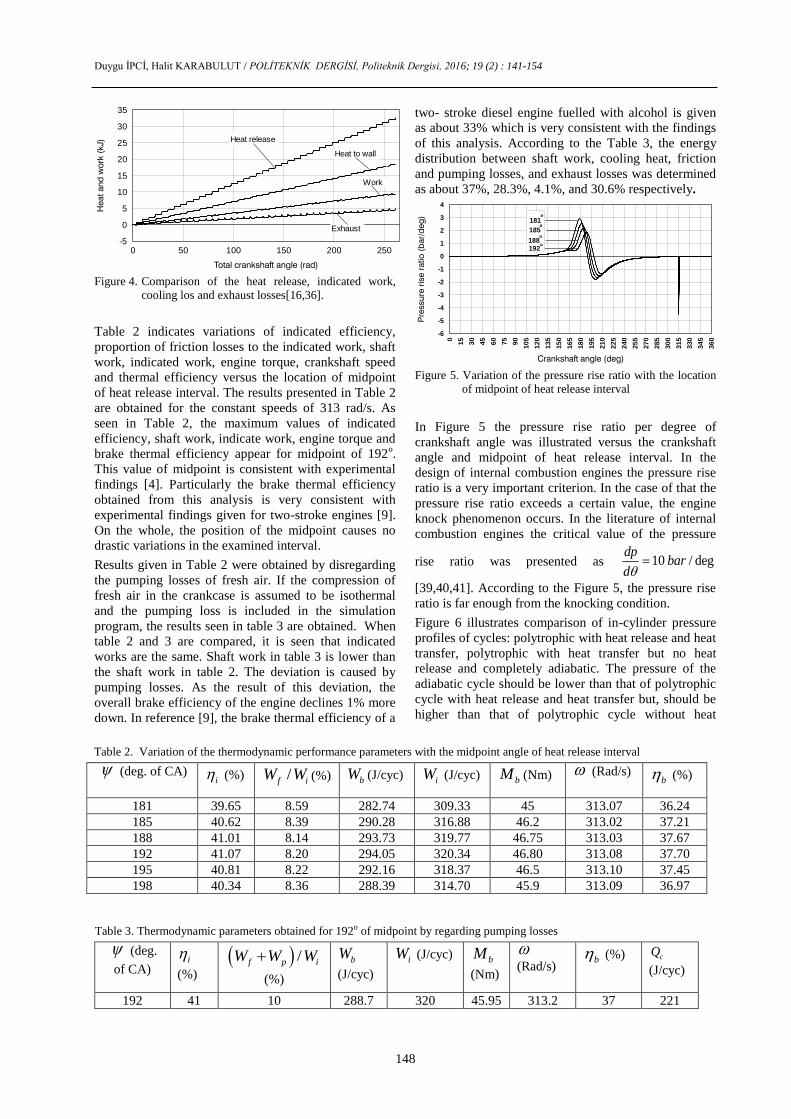
Figure 3. Comparison of the heat release, indicated work,
cooling loss and exhaust loss
In simulation program if the Eichelberg relation is used
instead of Nusselt relation, the results presented in
Figure 4 were obtained. The heat released during 41
cycles is 31977 J. The cooling loss, the work generation
and the exhaust loss are 18246, 9369.02 and 4361 J
respectively. According to these results, 29.3% of the
released heat is converted to the work. 57.05% is
transferred to the wall. 13.63% is taken away by the
exhaust gases. These proportions are inconsistent with
practical measurements. As the result, the heat transfer
relation given by Eichelberg was found to be not
appropriate to use in this analysis. The numerical result
used in the remaining of this analysis was obtained by
the Nusselt relation.
010
20
30
40
50
60
70
80
90
100
110
120
130
140
150
160
170
180
190
200
210
220
230
240
250
260
270
280
290
300
310
320
330
340
350
360
0
5
10
15
20
25
30
35
40
0 50 100 150 200 250
0
5
10
15
20
25
30
35
-5
Heat release
Work
Exhaust
Heat to wall
Duygu İPCİ, Halit KARABULUT / POLİTEKNİK DERGİSİ, Politeknik Dergisi, 2016; 19 (2) : 141-154
148
Figure 4. Comparison of the heat release, indicated work,
cooling los and exhaust losses[16,36].
Table 2 indicates variations of indicated efficiency,
proportion of friction losses to the indicated work, shaft
work, indicated work, engine torque, crankshaft speed
and thermal efficiency versus the location of midpoint
of heat release interval. The results presented in Table 2
are obtained for the constant speeds of 313 rad/s. As
seen in Table 2, the maximum values of indicated
efficiency, shaft work, indicate work, engine torque and
brake thermal efficiency appear for midpoint of 192o.
This value of midpoint is consistent with experimental
findings [4]. Particularly the brake thermal efficiency
obtained from this analysis is very consistent with
experimental findings given for two-stroke engines [9].
On the whole, the position of the midpoint causes no
drastic variations in the examined interval.
Results given in Table 2 were obtained by disregarding
the pumping losses of fresh air. If the compression of
fresh air in the crankcase is assumed to be isothermal
and the pumping loss is included in the simulation
program, the results seen in table 3 are obtained. When
table 2 and 3 are compared, it is seen that indicated
works are the same. Shaft work in table 3 is lower than
the shaft work in table 2. The deviation is caused by
pumping losses. As the result of this deviation, the
overall brake efficiency of the engine declines 1% more
down. In reference [9], the brake thermal efficiency of a
two- stroke diesel engine fuelled with alcohol is given
as about 33% which is very consistent with the findings
of this analysis. According to the Table 3, the energy
distribution between shaft work, cooling heat, friction
and pumping losses, and exhaust losses was determined
as about 37%, 28.3%, 4.1%, and 30.6% respectively.
Figure 5. Variation of the pressure rise ratio with the location
of midpoint of heat release interval
In Figure 5 the pressure rise ratio per degree of
crankshaft angle was illustrated versus the crankshaft
angle and midpoint of heat release interval. In the
design of internal combustion engines the pressure rise
ratio is a very important criterion. In the case of that the
pressure rise ratio exceeds a certain value, the engine
knock phenomenon occurs. In the literature of internal
combustion engines the critical value of the pressure
rise ratio was presented as 10 / degdp
bard
[39,40,41]. According to the Figure 5, the pressure rise
ratio is far enough from the knocking condition.
Figure 6 illustrates comparison of in-cylinder pressure
profiles of cycles: polytrophic with heat release and heat
transfer, polytrophic with heat transfer but no heat
release and completely adiabatic. The pressure of the
adiabatic cycle should be lower than that of polytrophic
cycle with heat release and heat transfer but, should be
higher than that of polytrophic cycle without heat
0 50 100 150 200 250
0
5
10
15
20
25
30
35
-5
Work
Heat to wall
Heat release
Exhaust
0
15
30
45
60
75
90
105
120
135
150
165
180
195
210
225
240
255
270
285
300
315
330
345
360
0
1
2
3
4
-1
-2
-3
-4
-5
-6
181
185
188192
Table 2. Variation of the thermodynamic performance parameters with the midpoint angle of heat release interval
(deg. of CA)
i (%) /f iW W (%) bW (J/cyc) iW (J/cyc) bM (Nm) (Rad/s)
b (%)
181 39.65 8.59 282.74 309.33 45 313.07 36.24
185 40.62 8.39 290.28 316.88 46.2 313.02 37.21
188 41.01 8.14 293.73 319.77 46.75 313.03 37.67
192 41.07 8.20 294.05 320.34 46.80 313.08 37.70
195 40.81 8.22 292.16 318.37 46.5 313.10 37.45
198 40.34 8.36 288.39 314.70 45.9 313.09 36.97
Table 3. Thermodynamic parameters obtained for 192o of midpoint by regarding pumping losses
(deg.
of CA)
i
(%)
/f p iW W W
(%)
bW
(J/cyc)
iW (J/cyc) bM
(Nm)
(Rad/s) b (%) cQ
(J/cyc)
192 41 10 288.7 320 45.95 313.2 37 221

DYNAMIC AND THERMODYNAMIC EXAMİNATION OF A TWO-STROKE INTERNAL CO … Politeknik Dergisi, 2016; 19 (2) :141-154
149
release. As seen from Figure 6, profiles are consistent
with expectations. The difference between the adiabatic
curve and polytrophic curve with heat transfer is an
indication of the rate of heat transfer to the wall.
The pressure profile of the polytrophic cycle with heat
release and heat transfer was obtained using the heat-
release profile seen in Figure 2 where the midpoint is
192o of crank angle. The ratio of the peak pressure of
the polytrophic cycle to the other peak values is 2.022
and 1.85. These values are very consistent with practical
results [9]. The peak value of the gas pressure of the
polytrophic cycle with heat release and heat transfer
appears at 198o of crankshaft angle.
Figure 6. Comparison of pressure profiles obtained for
polytrophic cycle with heat release and heat transfer,
polytrophic cycle with heat transfer but no heat
release and adiabatic cycle.
Figure 7 illustrates the temperature profile of the
working gas of the engine comparatively with that of
adiabatic and polytrophic cycles having no heat release.
The temperature of the fresh air was assumed to be 350
K. The temperature profile of the engine was obtained
for the heat release depicted in Figure 2. During the heat
release period the increase of the temperature is about
2.73 times the after-compression temperature of gas.
The exhaust gas temperature of the engine before the
pulsation is 1265 K or 992oC which is very consistent
with practical findings [3]. According to Figure 6, when
the exhaust port is on the position of disclosing, the
pressure of the gas is 3.06 bars. By assuming that the
pulsation of the exhaust gases is an isentropic process,
the after pulsation temperature of the exhaust gas was
calculated as 919.73 K or 646.73 oC.
Figure 7. Variation of the gas temperature during a cycle
Figure 8 illustrates the P-V diagram of the engine. The
effective compression ratio is determined as 9.037. The
appearance of the P-V diagram is consistent with
practical Otto cycle. In this engine 25% of piston stroke
is devoted to discharging and recharging of the working
fluid. As seen from Figure 8, the work loss due to this
period is not very significant.
Figure 8. P-V diagram
In Table 4 and Figure 9, thermodynamic values
0
15
30
45
60
75
90
10
5
12
0
13
5
15
0
16
5
18
0
19
5
21
0
22
5
24
0
25
5
27
0
28
5
30
0
31
5
33
0
34
5
36
0
0
5
10
15
20
25
30
35
40
45
50With heat release
and heat transfer
Adiabatic
With heat transfer
but no heat release
0
15
30
45
60
75
90
105
120
135
150
165
180
195
210
225
240
255
270
285
300
315
330
345
360
0
250
500
750
1000
1250
1500
1750
2000
2250
2500
2750
3000
Adiabatic
With heat transfer
but no heat release
With heat release
and heat transfer
Table 4. Thermodynamic values obtained from the analysis for 1.146 , 313 /rad s , 192 and 0.5 1p bar
Crankcase
pressure
(bar)
i (%)
b (%) Wb (J/cyc) Wi(J/cyc)
Wf+Wp
𝑊𝑖 (%) Mb (Nm)
Qp (J/cyc)
Q=1(J/cyc)
1.0 41.08 36.73 286.51 320.45 10.59 45.6 779.91 893.83
0.9 40.73 36.26 254.47 285.83 10.97 40.5 701.62 804.45
0.8 40. 39 35.56 221.79 251.88 11.95 35.3 623.62 715.07
0.7 39.99 34.71 189.44 218.26 13.20 30.15 545.74 625.68
0.6 39.49 33.58 157.08 184.72 14.96 25.0 467.75 536.3
0.5 38.93 31.99 124.72 151.79 17.83 19.85 389.86 446.91
0 50 100 150 200 250 300 350 400 450 500
0
10
20
30
40
50
Volume (cm )3

Duygu İPCİ, Halit KARABULUT / POLİTEKNİK DERGİSİ, Politeknik Dergisi, 2016; 19 (2) : 141-154
150
obtained for 1.146 , 313 /rad s , 192 and
0.5 1p bar were presented. This examination
corresponds to a constant speed testing of the engine. In
experimental investigations the air used by the engine is
quantified by the throttle valve position. In this study
instead of throttle valve position, the crankcase inlet
pressure has been used. As seen in Figure 9, while the
crankcase inlet pressure decreases, the brake torque,
heat input and indicated work decreases linearly.
Indicated thermal efficiency and brake thermal
efficiency displays accelerating decreases but, until 0.5
bar, the decrease of thermal efficiencies is not a drastic
variation. From practical point of view, this is an
advantageous aspect of this engine. The ratio of
( ) /friction loss pumping loss indicated work
displays an accelerating increase. Acceleration of
( ) /friction loss pumping loss indicated work
is caused by that both the nominator and denominator of
the fraction decreases but the decrease of the
denominator is larger than the decrease of nominator.
At full throttle the engine analyzed here seems to be
able to generate 14.27 kW power. The specific power of
the engine per liter will be about 32 kW.
Figure 9. Variation of torque, thermal efficiencies, heat input,
indicated work and ratio of losses to indicated work
Figure 10 illustrates a speed profile obtained from a
case study. The engine is put in motion via a starter
having 60 Nm torque. Before the starter begins to rotate
the engine, the piston is at the bottom dead center. If the
starter moment is applied during an initial motion of 7
radians, then the engine gains adequate momentum and
continues to run by its own. Within the first two
revolution of the crankshaft, via the starter moment, the
crankshaft speed displays a rapid increase. Until the
crankshaft rotates 100 radians, the external moment
(load) is not applied. During this period, the crankshaft
displays a decelerating increase. The deceleration is
caused by the friction which is increasing with speed.
After 100 radians, a critical external moment is applied
so as to keep the average speed of the engine constant.
The critical value of the external moment was obtained
by trial and error. Over the stable running domain
beyond 100 radians, the average speed of the crankshaft,
corresponding to a 45 Nm critical torque, is 416 rad/s.
The maximum and minimum values of the speed are
421.12 and 410.91 rad/s. The ratio of fluctuation to
average speed is 2.40%. In four-stroke engines having a
similar crankshaft mass-inertia-moment, the speed
fluctuation is more than two times the calculated value
here [13,32]. Lower fluctuation is an advantage of the
two-stroke engines. The kinetic energy variation of the
crankshaft caused by speed fluctuation is roughly 290 J.
The exaggerated view appended to Figure 10 shows the
cyclic variation of the crankshaft speed at steady stead
running conditions. The period 0 is a
compression process. The second part, 2 , is
an expansion process. During the first part, the net
energy transferred to the reciprocating elements is zero
because of that the initial and final speeds of the
reciprocating elements are the same. During the first
part, the decrease of crankshaft speed is about 10
radians. The kinetic energy variation of the crankshaft is
about 241 J. The energy transferred from the crankshaft
to the gas and foundation is about 141 J. The difference
between these two values is frictional losses and
compression work.
Figure 10. Crankshaft speed fluctuations
Figure 11 illustrates variation of the crankshaft speed
with external load. In practice this operation is called
speed testing. All of the speed profiles seen in Figure 11
were obtained at 100% throttle openness. While the
speed increases, the external load applicable to the
engine decreases. This is caused by the increase of
frictional losses. In practical speed testing of real
engines, the decrease of the torque is caused mainly by
two factors such as natural throttling of the intake air
due to viscous flow losses and frictional losses of the
engine. This analysis does not involve natural throttling
of the intake air. Therefore the speed profiles obtained
here differs from the practical ones. In real engines,
after a certain value of crankshaft speed, engine tork
may decline. As seen from Figure 11, while the mean
speed increases, the fluctuation decreases. The relation
between the mean speed and fluctuation seems to be
linear. While the mean speed increases the brake torque
displays a decelerating decrease.
1 0,9 0,8 0,7 0,6 0,5
0
10
20
30
40
50
0
200
400
600
800
1000
Brake torque Brake thermal efficiency
Heat input Indicated work
Friction + pumping/indicated work Indicated thermal efficiency
0 50 100 150 200 250 300 3500
100
200
300
400
500
0
0,78
54
1,57
08
2,35
62
3,14
16
3,92
7
4,71
24
5,49
78
6,28
32
Crankshaft angle (rad)
405
410
415
420
425
Cra
nks
haf
t sp
eed
(rad
/s)

DYNAMIC AND THERMODYNAMIC EXAMİNATION OF A TWO-STROKE INTERNAL CO … Politeknik Dergisi, 2016; 19 (2) :141-154
151
Figure 11. Variation of crankshaft speed with external load
Figure 12 illustrates vertical components of the piston
and conrod force and the counter weight force obtained
from a case study. The case study was conducted for
4000 rpm engine speed. In this case study, both the
piston and conrod masses were taken to be 500 g and
the mass of the counter weight was predicted as 600 g.
The crankshaft used here is assumed to be statically pre-
balanced without conrod and piston. As seen from
Figure 12, peak values of vertical force generated by the
piston and conrod is about 4265 N. The peak value of
the vertical force generated by a counter weight is about
2766N. The difference of vertical forces generated by
piston and conrod, and counter weight is 1500 N. So,
the vertical unbalance is reduced from 4265N to 1500N.
Figure 13 illustrates horizontal components of the piston
and conrod force and the counter weight force obtained
from the same case study mentioned in Figure 12. As
seen from Figure 13, peak values of vertical force
generated by the piston and conrod is about 1500 N.
The peak value of the vertical force generated by a
counter weight is about 3000 N. The difference of
horizontal forces generated by piston and conrod, and
counter weight is 1500 N. So, the horizontal unbalance
is not reduced. The counter weight has no reducing
effect on the horizontal unbalance. On the contrary, the
counter weight increases the horizontal unbalance as
much as that it reduces the vertical unbalance. In some
applications the vertical unbalance may be harmless; in
such a case counter weight may be completely
unnecessary, or vice versa. From this case study we
observe that the mass of the piston and conrod should be
as small as possible.
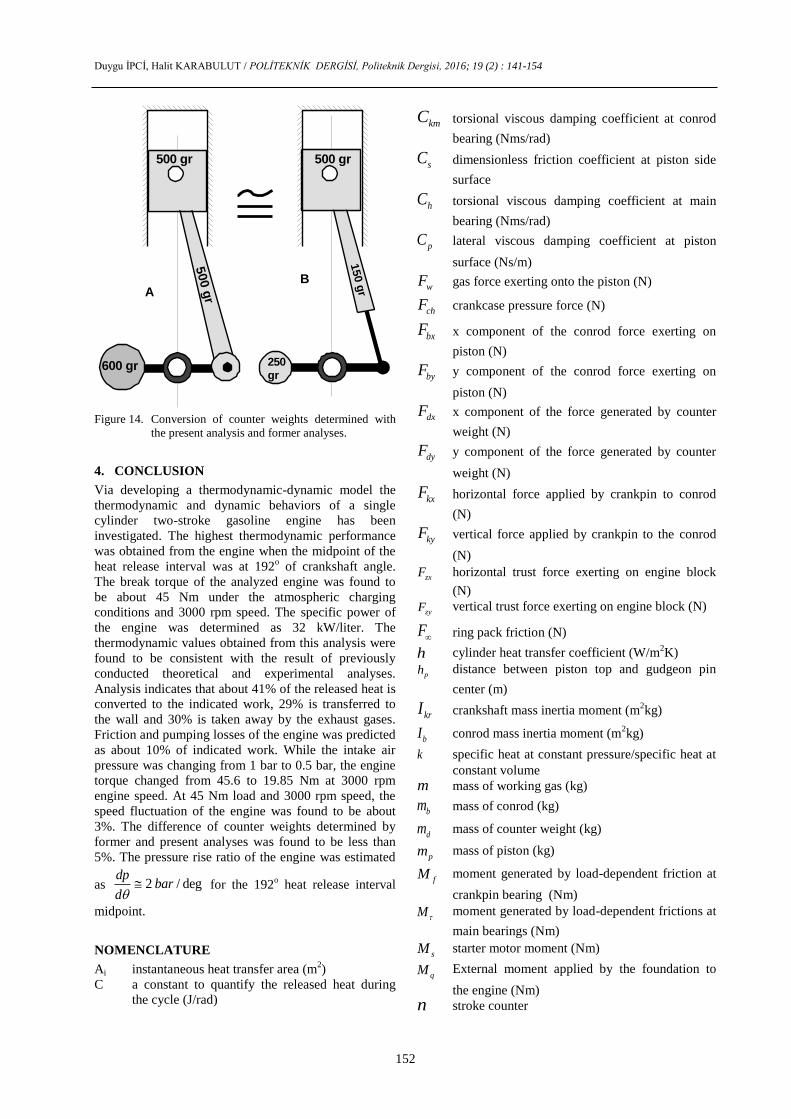
Figure 14 illustrates comparison of the counter weights
obtained from the present study and former studies. In
former analysis the conrod mass was split into two parts
as 30 /100bm and 70 /100bm . The part 30 /100bm was
added to the piston mass while the other was added to
the crankshaft mass. The static balancing of the
crankshaft is thought to be performed after addition of
the part 70 /100bm . Therefore, in previous studies, the
unbalance struggling to vibrate the engine is generated
by the piston mass and 30% of the conrod mass.
According to the previous studies the mass of the
counter weight may be predicted via the correlation,
300.5
100d p b
d
Rm m m
R
(31)
which was obtained by correlating numerical results
[32]. Into this correlation, by substituting 0,5pm kg ,
0,5bm kg , 0,04R m and 0.05dR m , the mass of
counter weight is predicted as 0.26 kg. In Figure 14A
the mass of the piston and conrod as well as the mass of
the counter weight predicted from the present study
were indicated. If masses taking part on the both sides
of the crankshaft were reduced as seen in Figure 14B,
we may not expect a drastic variation in its dynamic
equilibrium because of that the part cut off from the
conrod behaves, more likely, as a part of crankshaft. As
seen in Figure 14B, the counter weight is 250 g which is
balancing the piston mass and 30% of the conrod mass.
So, Figure 14B is a presentation of balancing of
crankshaft according to the previous studies. The
counterweight seen in Figure 14B is 250 g however; the
one predicted via Equation (31) is 260 g. There is only
10 g difference between the present and former analyses
which may generate at most 4% deviation.
Figure 12. Vertical force and unbalances
Figure 13. Horizontal force and unbalances
Duygu İPCİ, Halit KARABULUT / POLİTEKNİK DERGİSİ, Politeknik Dergisi, 2016; 19 (2) : 141-154
152
Figure 14. Conversion of counter weights determined with
the present analysis and former analyses.
4. CONCLUSION
Via developing a thermodynamic-dynamic model the
thermodynamic and dynamic behaviors of a single
cylinder two-stroke gasoline engine has been
investigated. The highest thermodynamic performance
was obtained from the engine when the midpoint of the
heat release interval was at 192o of crankshaft angle.
The break torque of the analyzed engine was found to
be about 45 Nm under the atmospheric charging
conditions and 3000 rpm speed. The specific power of
the engine was determined as 32 kW/liter. The
thermodynamic values obtained from this analysis were
found to be consistent with the result of previously
conducted theoretical and experimental analyses.
Analysis indicates that about 41% of the released heat is
converted to the indicated work, 29% is transferred to
the wall and 30% is taken away by the exhaust gases.
Friction and pumping losses of the engine was predicted
as about 10% of indicated work. While the intake air
pressure was changing from 1 bar to 0.5 bar, the engine
torque changed from 45.6 to 19.85 Nm at 3000 rpm
engine speed. At 45 Nm load and 3000 rpm speed, the
speed fluctuation of the engine was found to be about
3%. The difference of counter weights determined by
former and present analyses was found to be less than
5%. The pressure rise ratio of the engine was estimated
as 2 / degdp
bard
for the 192o heat release interval
midpoint.
NOMENCLATURE
Ai instantaneous heat transfer area (m2)
C a constant to quantify the released heat during
the cycle (J/rad)
kmC torsional viscous damping coefficient at conrod
bearing (Nms/rad)
sC dimensionless friction coefficient at piston side
surface
hC torsional viscous damping coefficient at main
bearing (Nms/rad)
pC lateral viscous damping coefficient at piston
surface (Ns/m)
wF gas force exerting onto the piston (N)
chF crankcase pressure force (N)
bxF x component of the conrod force exerting on
piston (N)
byF y component of the conrod force exerting on
piston (N)
dxF x component of the force generated by counter
weight (N)
dyF y component of the force generated by counter
weight (N)
kxF horizontal force applied by crankpin to conrod
(N)
kyF vertical force applied by crankpin to the conrod
(N)
zxF horizontal trust force exerting on engine block
(N)
zyF vertical trust force exerting on engine block (N)
F ring pack friction (N)
h cylinder heat transfer coefficient (W/m2K)
ph distance between piston top and gudgeon pin
center (m)
krI crankshaft mass inertia moment (m2kg)
bI conrod mass inertia moment (m2kg)
k specific heat at constant pressure/specific heat at
constant volume
m mass of working gas (kg)
bm mass of conrod (kg)
dm mass of counter weight (kg)
pm mass of piston (kg)
fM moment generated by load-dependent friction at
crankpin bearing (Nm)
M moment generated by load-dependent frictions at
main bearings (Nm)
sM starter motor moment (Nm)
qM External moment applied by the foundation to
the engine (Nm)
n stroke counter
500 g
r
600 gr
500 gr
AB
500 gr
150 g
r
250 gr

DYNAMIC AND THERMODYNAMIC EXAMİNATION OF A TWO-STROKE INTERNAL CO … Politeknik Dergisi, 2016; 19 (2) :141-154
153
p pressure (Pa)
wp gas pressure exerting on piston top (Pa)
chp gas force exerting on piston bottom (Pa)
1ip pressure corresponding to any 1i
ip pressure corresponding to i
q heat per kg of air (J/kg)
pQ heat released during the cycle (J)
pq heat released per kg of air during the cycle
(J/kg/cycle)
wQ heat transferred to the wall during the cycle (J)
wq heat transferred to the wall per kg of air during
the cycle (J/kg/cycle)
R crank radius (m)
dR radial distance of counter weight from the
crankshaft center (m)
gas constant (J/Kg K)
T temperature (K)
wT wall temperature (K)
t time (s)
u internal energy per kg of air (J/kg)
v specific volume of air (m3/kg)
V volume of the gas (m3)
1iV volume corresponding to 1i
iV volume corresponding to i
pV average velocity of the piston during a stroke
(m/s)
iW indicated work per cycle (J)
pW pumping work per cycle (J)
fW friction work per cycle (J)
bW shaft work per cycle or brake work per cycle (J)
x coordinate element (m)
bx conrod gravity center location in x (m)
y coordinate element (m)
py piston top location in y (m)
by conrod gravity center location in y (m)
angular position of the crankshaft respect to the
initial position, Fig. 1, (rad)
angular speed of the crankshaft (rad/s)
angular acceleration of the crankshaft (rad/s2)
engine speed , , (rad/s)
a dimensionless constant to quantify the heat
release duration conrod angle with cylinder axis (rad)
a dimensionless constant to indicate the location
of maximum heat release
conrod length (m)
cg distance from conrod big end center to gravity
center (m)
i indicated thermal efficiency
b brake thermal efficiency
REFERENCES
1. Blair G. P., “Design and Simulation of Two-Stroke
Engines”, U.S.A: Society of Automotive Engineers, Inc.,
(1996)
2. Gabele P. A. and Pyle S. M., “Emissions from Two
Outboard Engines Operating on Reformulated Gasoline
Containing MTBE”, Environ. Science Technology, 34:
368-372, (2000)
3. Amin M. A., Azhar A. A., MohdF. M. S., Zulkarnain A.
L., “An experimental study on the influence of EGR rate
and fuel octane number on the combustion characteristics
of a CAI two-stroke cycle engine”, Applied Thermal
Engineering, 71: 248-258, (2014)
4. Pradeep V., Bakshi S., Ramesh A., “Scavenging port
based injection strategies for an LPG fuelled two-stroke
spark-ignition engine”, Applied Thermal Engineering,
67: 80-88, (2014)
5. Volckens J., Olson D. A., Hays M. D., “Carbonaceous
species emitted from hand held two-stroke engines”,
Energy Procedia, 45: 739 – 748, (2014)
6. Cantore G., Mattarelli E., Rinaldini C.A., “ A new design
concept for 2-Stroke aircraft Diesel engines”, Energy
Procedia, 45: 739–748, (2014)
7. Chehroudi B., Schuh D., “Intake-port flow behavior in a
motored and fired two-stroke research engine”,
Experimental Thermal and Fluid Science, 10:86-100,
(1995)
8. Semin N.M.I.N. Ibrahim Rosli A. Bakar and Abdul R. I.,
“In-cylinder flow through piston-port engines modeling
using dynamic mesh”, Journal of Applied Sciences
Research, 4(1): 58-64, (2008)
9. Li X., Zhang L., Fanga J., Huang Z., Xi H., “ Combustion
and emission characteristics of a two-stroke diesel engine
operating on alcohol”, Renewable Energy, 30: 2075–
2084, (2005)
10. Mattarelli E., Cantore G., and Rinaldini C.A., “Advances
in the design of two-stroke, high speed, compression
ignition engines”, Advances in Internal Combustion
Engines and Fuel Technologies, Chapter 5 DOI:
10.5772/54204, (2013)
11. Uyumaz A., Solmaz H., Yılmaz E., Yamık H., Polat S.,
“Experimental examination of the effects of military
aviation fuel JP-8 and biodiesel fuel blends on the engine
performance, exhaust emissions and combustion in a
direct injection engine”, Fuel Processing Technology,
128: 158–165, (2014)
Duygu İPCİ, Halit KARABULUT / POLİTEKNİK DERGİSİ, Politeknik Dergisi, 2016; 19 (2) : 141-154
154
12. Ismail H.M., Ng H.K., Gan, S., Lucchini, T.,
“Computational study of biodiesel–diesel fuel blends on
emission characteristics for a light-duty diesel engine
using open FOAM”, Applied Energy, 111: 827–841,
(2013)
13. Karabulut H., Ersoy H., “Dynamic Behaviors of a Two-
Cylinder Four-Stroke Internal combustion Engine”, Gazi
University Journal of Science, 25(2):519-532, (2012)
14. Awrejcewicz J., Kudra G., “The piston-connecting rod-
crankshaft system as a triple physical pendulum with
impact”, International Journal of Bifurcation and
Chaos, 15(7): 2207-2226, (2005)
15. Karabulut H., Öztürk E., Çinar C., “Tek silindirli bir dizel
motorunun dinamik ve titreşim analizleri”, Journal of the
Faculty of Engineering and Architecture of Gazi
University 27(3): 491-500, (2012)
16. Quintero H.F., Romero C. A., Useche L. V. V.,
“Thermodynamic and dynamic of an internal combustion
engine with a noncircular-gear based modified crank-
slider mechanism”, 12th IFToMM World Congress,
Besançon (France) 1-6, (2007)
17. Tan Y-C, Ripin Z. M., “Technique to determine
instantaneous piston skirt friction during piston slap”,
Tribology International, 74:145-153, (2014)
18. Tan Y. C., Ripin Z. M., “ Analysis of Piston Secondary
Motion”, Journal of Sound and Vibration, 332: 5162-
5176, (2013)
19. Reis,V. L., Daniel G. B., Cavalca K. L., “Dynamic
analysis of a lubricated planar slider–crank mechanism
considering friction and Hertz contact effects”,
Mechanism and Machine Theory, 74: 257–273, (2014)
20. Livanos G. A., Kyrtatos N. P., “Friction model of a marine
diesel engine piston assembly”. Tribology International,
40: 1441–1453, (2007)
21. Rahnejat H., “Tribology and dynamics of engine and
powertrain: fundamentals, applications and future trends”,
New Delhi: Woodhead Publishing Limited, (2010)
22. Perera, M. S. M., Theodossiades S. and Rahnejat H.,
“Elasto-multi-body dynamics of internal combustion
engines with tribological conjunctions”, Proc IMechE
Part K: J Multi-Body Dynamics, 224: 261–277, (2010)
23. Allmaier H., Sander D.E., Reich F.M., “Simulating
friction power losses in automotive journal bearings”,
Procedia Engineering, 68: 49 – 55, (2013)
24. Hu, Y., Cheng, H.S., Arai, T., et al., “Numerical
simulation of piston ring in mixed lubrication – a non-
axisymmetrical analysis”, Journal of Tribology, 116:
470–478, (1994)
25. Bedajangam S. K., Jadhav N. P., “Friction losses
between piston ring-liner assembly of internal combustion
engine: a review”, International Journal of Scientific and
Research Publications, 3( 6):1-3, (2013)
26. Guzzomi A. L., Hesterman D. C., Stone B. J., “The effect
of piston friction on engine block dynamics”, Proc
IMechE Part K: J Multi-Body Dynamics, 221: 277–289,
(2007).
27. Balakrishnan, S., Howell-Smith, S. and Rahnejat, H.,
“Investigation of reciprocating conformal contact of piston
skirt-to-surface modified cylinder liner in piston skirt-to-
surface modified cylinder liner”, Proc IMechE Part C:
Journal of Mechanical Engineering Science, 219(11):
1235-1247, (2005)
28. Croes J., Iqbal S., “Literature survey: bearing losses”, EC
- 7th Framework Programme - Theme ICT, (2009)
29. Bălan M. R. D., Stamate V. C., Houpert L., Olaru D. N.,
“The influence of the lubricant viscosity on the rolling
friction torque”, Tribology International, 72:1–12. (2014)
30. Andersson S., Soderberg A., Bjorklund S., “Friction
models for sliding dry, boundary and mixed lubricated
contacts”, Tribology International, 40: 580–587, (2007)
31. Söndgen S., Predki W., “Power loss and axial load
carrying capacity of radial cylindrical roller bearing”,
Power Transmission Engineering, 42-47, (2013)
32. Karabulut H., “Dynamic model of a two-cylinder four-
stroke internal combustion engine and vibration
treatment”, International Journal of Engine Research,
0(0):1-12, (2012)
33. Metallidis P., Natsiavas S., “Linear and nonlinear
dynamics of reciprocating engines”, Internatioal Journal
of Non-linear mechanics, 38: 723-738, (2003)
34. Pasricha M. S., Hashim F. M., “ Effects of the
reciprocating mass of slider-crank mechanism on
torsional vibration of diesel engine system”, Asean
Journal on Science and Technology for Development,
23(1): 71-81, (2006)
35. Giakoumis E. G., Rakopoulos C. D., Dimaratos A. M.,
“Study of crankshaft torsional deformation under steady-
state and transient operation of turbocharged diesel
engines”, Proc. IMechE Part K: J. Multi-body Dynamic,
(222):17-30, (2008)
36. Spitsov O., “Heat transfer inside internal combustion
engine: modeling and comparison with experimental
data”, Master Thesis; Lappeenranta University of
Technology, (2013)
37. SKF group, SKF rolling bearings catalogue, (2013)
38. Storakers B., Elaguine D., “Hertz contact at finite friction
and arbitrary profiles”, Journal of the Mechanics and
Physics of Solids, 53:1422–1447, (2005)
39. Mavropoulos G.C., “Experimental study of the
interactions between long and short term unsteady heat
transfer responses on the in-cylinder and exhaust manifold
diesel engine surfaces”, Applied Energy, 88:867-881,
(2011)
40. Yap D., Karlovsky J., Megaritis A., Wyszynski M. L., Xu
H., “An investigation into propane homogeneous charge
compression ignition (HCCI) engine operation with
residual gas trapping”, Fuel, 84: 2372–2379, (2005)
41. Megaritis A., Yap D., Wyszynski M.L., “Effect of water
blending on bioethanol HCCI combustion with forced
induction and residual gas trapping”, Energy, 32:2396–
2400, (2007)