dynamic analysis of ferry vessels on wingwall … · structures with wood plastic composite rubbing...
TRANSCRIPT

DYNAMIC ANALYSIS OF FERRY VESSELS ON WINGWALL STRUCTURES WITH WOOD PLASTIC
COMPOSITE RUBBING BLOCKS
By
YUEFEI WU
A dissertation/thesis submitted in partial fulfillment of the requirements for the degree of
MASTER OF SCIENCE IN CIVIL ENGINEERING
WASHINGTON STATE UNIVERSITY Department of Civil and Environmental Engineering
DECEMBER 2005

To the Faculty of Washington State University:
The members of the Committee appointed to examine the dissertation/thesis of YUEFEI WU find it satisfactory and recommend that it be accepted.
___________________________________ Chair ___________________________________ ___________________________________
ii

ACKNOWLEDGEMENT
First, I would like to thank my advisor Dr. McDaniel for his guidance through my
graduate study and research. His patience was a great encouragement for me. I would
also like to thank my other committee members, Dr. Cofer and Dr. Wolcott. Dr. Cofer’s
finite element classes prepared me well for the research. On many occasions he helped me
to improve the analytical models. Dr. Wolcott’s wood plastic composite (WPC) class
provided me the opportunity to learn more about WPC’s. Without the WPC funding, this
research would not have been conducted.
Many other teachers, students and researchers from WSU were very helpful during
my study and research. I appreciate Tom Weber’s assistance with solving computer related
problems.
Finally, I would like to thank my parents and my wife for their encouragement.
Their hearts are always together with me wherever I am.
iii

DYNAMIC ANALYSIS OF FERRY VESSELS ON WINGWALL STRUCTURES WITH WOOD PLASTIC
COMPOSITE RUBBING BLOCKS
Abstract
By Yuefei Wu, M. S.
Washington State University December 2005
Chair: Cole C. McDaniel
This research focused on investigating wood plastic composite (WPC) applications in
waterfront structures, specifically as a replacement for preservative-treated timber rubbing
blocks in wingwall structures. Currently, timber members serve as the contact interface in
wingwall structures for ferry vessel berthing in the Washington State Ferry (WSF) system.
Due to environmental concerns with preservative-treated timber and the lifespan of timbers
in marine environments, WPC alternatives are being sought by the Washington State
Department of Transportation (WSDOT). In order to investigate the structural demands of
ferries berthing into wingwall structures, specifically the demand on existing timber rubbing
blocks as well as potential WPC replacement members, dynamic Finite Element analyses
using ADINA were performed. The largest vessel in the WSF fleet and the Friday Harbor
Ferry Terminal in the Puget Sound of Washington State were the focus of this research. A
2.5ft/sec berthing velocity was specified by WSDOT.
Due to the relatively long impact duration, the contact forces from the global
dynamic analyses of the wingwalls were also applied statically to global models of the
iv

wingwalls that included increased detailing of the WPC member sections to investigate the
stress distribution on the hollow WPC members. In both the dynamic and static analyses,
the ferry vessel berthing demand exceeded the rubbing block design capacities.
Since the rubbing blocks have performed well over time, WSDOT does not require
that the design capacity of the blocks exceed demands based on a berthing velocity for the
largest vessel in the WSF fleet of 2.5ft/sec2. This under design of the rubbing blocks has an
implicit benefit of allowing the rubbing blocks to serve as structural fuses for the rest of the
wingwall, failing under excessive berthing loads, and thereby, protecting the rest of the
structure from significant damage.
This research showed that the WPC members can serve as alternatives for the
preservative-treated timber rubbing blocks in ferry landing wingwall structures. Based on
dynamic analysis of the ferry vessel berthing with the wingwall structures, WPC rubbing
blocks experienced similar demand/capacity ratios to those of the timber rubbing blocks
while offering both environmental and service life advantages.
v

TABLE OF CONTENTS Page ACKNOWLEDGEMENTS................................................................................................ iii ABSTRACT.........................................................................................................................iv LISTOF FIGURES ........................................................................................................... viii LIST OF TABLES ................................................................................................................x CHAPTER 1 INTRODUCTION ..........................................................................................1
1.1 Overview and Background .........................................................................................1 1.2 Research Objectives....................................................................................................4
CHAPTER 2 BACKGROUND ............................................................................................5
2.1 Previous Ferry Vessel/Marine Fender Impact Research .............................................6
2.2 ADINA Contact Analysis............................................................................................9 CHAPTER 3 WINGWALL/ FERRY VESSEL FINITE ELEMENT ANALYSIS MODELING...................................................................................................11
3.1 Introduction...............................................................................................................11
3.2 Finite Element Modeling of the Wingwall and Ferry Vessel Impact ........................14
3.2.1 ADINA Finite Elements .........................................................................................................14
3.2.2 I-beams...................................................................................................................................15
3.2.3 Piles........................................................................................................................................17
3.2.4 Bolts (Bolts between I-beams and rubbing timbers) ..............................................................18
3.2.5 Treated rubbing timbers and WPC alternatives......................................................................19 3.2.6 Chains.....................................................................................................................................24
vi

3.2.7 Marine fenders .......................................................................................................................24
3.2.8 HSS members.........................................................................................................................27
3.2.9 Vessel .....................................................................................................................................27
3.2.10 Damping...............................................................................................................................29 CHAPTER 4 WINGWALL/ FERRY VESSEL FINITE ELMENT ANALYSIS RESULTS .......................................................................................................31
4.1 45 Degrees Contact Angle Case Dynamic Analysis .................................................31
4.2 Variation of Vessel Berthing Angles and Locations of Vessel/Wingwall Impact ......41
4.3 Check of Additional Wingwall Members .................................................................51
4.4 Static Analysis of Rubbing Block Model with Hollow Section Rubbing Blocks.....55 4.5 Mass and Berthing Velocity Variation Study ............................................................62 4.6 Assessment of WPC Rubbing Block.........................................................................64
CHAPTER 5 EXPERIMENTAL TEST PROTOCOL........................................................66 CHAPTER 6 CONCLUSION AND RECOMMENDATION ............................................71 REFERENCES ...................................................................................................................74
vii

LIST OF FIGURES
Figure 1.1 Ferry Landing Wingwall Structure ......................................................................1
Figure 1.2 Damaged Timber Rubbing Block........................................................................2
Figure 2.1 Ribbed Box Sections Composed of a Wood-poly (vinyl chloride) Composite
Developed by Washington State University for Pier Decking for the US Navy...................6
Figure 3.1 Plan View of a Typical WSF Fender System (Jahren, 1993).............................11
Figure 3.2 Plan View of the Wingwall Structure ................................................................12
Figure 3.3 Elevation of the First Row of Wingwall............................................................13
Figure 3.4 Elevation of the Second Row of the Wingwall .................................................14
Figure 3.5 First Row Vertical and Horizontal W-Sections..................................................16
Figure 3.6 First Row Vertical and Horizontal W-Sections Model ......................................16
Figure 3.7 Wingwall Pile Model with Soil Springs ............................................................18
Figure 3.8 Timber Rubbing Block Bolt Detail....................................................................19
Figure 3.9 Model of Timber and WPC Rubbing Blocks Used in Dynamic Analyses ........21
Figure 3.10 1/3 of the Wood Plastic Composite Cross Section ..........................................21
Figure 3.11 Wood Plastic Composite Cross Section...........................................................22
Figure 3.12 WPC Cross Section Models ............................................................................22
Figure 3.13 Meshed WPC Cross Section Model ................................................................23
Figure 3.14 Beam/Solid Elements Hybrid Model...............................................................23
Figure 3.15 Rasmussen Stud Link Chain............................................................................24
Figure 3.16 Fender Axial Reaction and Absorbed Energy versus Deflection Curves of
1250 1000MV × B Marine Fenders.....................................................................................25
Figure 3.17 Data for Rubber Fender Response...................................................................26
Figure 3.18 Simplified Axial and Shear Reactions versus Deflection Curve .....................26
Figure 3.19 Marine Fender Springs and HSS Members .....................................................27
viii

Figure 3.20 Vessel Model....................................................................................................29
Figure 4.1 Plan View of Vessel Approaching the Wingwall ...............................................31
Figure 4.2 Distribution of Stress during Ferry Vessel Impact with the Wingwall ..............34
Figure 4.3 Vessel Rotations during Impact with the Wingwall...........................................34
Figure 4.4 Total Rubbing Block Contact Forces Time Histories ........................................35
Figure 4.5 Individual Contact Forces Time Histories of the Rubbing Block
with the Maximum Demands ............................................................................................38
Figure 4.6 Contact Locations..............................................................................................42
Figure 4.7 Total Rubbing Block Contact Forces Time Histories ........................................43
Figure 4.8 Individual Contact Forces Time Histories of the Rubbing Block
with the Maximum Demands..............................................................................................47
Figure 4.9 Static Analysis Finite Element Model ...............................................................56
Figure 4.10 Effective Stress Distributions for Douglas Fir Rubbing Block .......................57
Figure 4.11 Effective Stress Distributions for PVC Rubbing Blocks .................................57
Figure 4.12 Effective Stress Distributions for PP870 Rubbing Blocks ..............................58
Figure 4.13 Bending Stress Distributions for Douglas Fir Rubbing Blocks.......................59
Figure 4.14 Bending Stress Distributions for PVC Rubbing Blocks..................................59
Figure 4.15 Bending Stress Distributions for PP870 Rubbing Blocks ...............................60
Figure 4.16 Front Third of Section that is Contacted by the Vessel and the
Remainder of the Cross Section..........................................................................................61
Figure 5.1 Bending Moment Diagram of the Member with Maximum Demand...............68
Figure 5.2 Rubbing Block Displacement Profile................................................................69
Figure 5.3 Rubbing Block Test Setup .................................................................................70
ix

LIST OF TABLES
Table 4.1 Mechanical Properties of the Five Rubbing Blocks Materials............................32
Table 4.2 Maximum Contact Forces (CFX, CFY), Effective Stresses (Estress)
and Bending Stress in Z Direction on Individual Rubbing Blocks.....................................40
Table 4.3 Maximum Contact Forces (CFX, CFY), Effective Stresses (Estress) and
Bending Stress (Bstress) in Z Direction on Individual Rubbing Block for
Different Locations .............................................................................................................51
Table 4.4 Wingwall Member Properties .............................................................................52
Table 4.5 Bending Demands on the Wingwall Structure for Location1 .............................53
Table 4.6 Bending Demands on the Wingwall Structure for Location2 .............................53
Table 4.7 Bending Demands on the Wingwall Structure for Location3 .............................54
Table 4.8 Bending Demands on the Wingwall Structure for Location4 .............................54
Table 4.9 Comparison of Static Displacements with Dynamic Displacements ..................55
Table 4.10 Maximum Effective and Bending Stresses from Dynamic
Analyses and the Average Stresses for the Front Third Section of
the Rubbing Blocks from Static Analysis ...........................................................................62
Table 4.11 Wingwall Demands Due to Velocity Variation..................................................63
Table 4.12 Wingwall Demands Due to Mass Variation ......................................................63
Table 4.13 Berthing Velocities to Maintain Elastic Response of the Rubbing
Blocks (ft/sec) .....................................................................................................................64
Table 5.1 Moment and Displacement Values of Nodes 1-5 Marked in Figure 5.1 (a) .......69
x

CHAPTER 1
INTRODUCTION
1.1 Overview and Background
Use of preservative-treated wood products in harbors is under both regulatory and
public scrutiny. With the listing of salmon as an endangered species in the Puget Sound, the
continued installation of treated wood products in existing or new facilities has become
difficult. However, the unique combination of stiffness, wear, frictional, and economic
properties for timber has kept it as the material of choice for wear surfaces in both new and
existing facilities. Preservative-treated timbers serve as rubbing blocks in marine fender
systems where the substructure is principally composed of steel. The rubbing blocks are
the first point of contact between the vessels and the wingwalls. The wing wall system is a
critical structure in ferry terminals that positions the vessel bow through impact during the
approach for berthing (see Figure 1.1).
Figure 1.1 Ferry Landing Wingwall Structure.
1

These wearing surface elements function to dissipate berthing energy of the vessel through
elastic beam deflections. In the case of overloads, the elements act as a structural fuse to
prevent damage to both the vessel and the steel substructure (see Figure 1.2).
Figure 1.2 Damaged Timber Rubbing Block.
2

The timber rubbing blocks have performed as intended, with periodic replacement
required due to vessel overloading or connection deterioration. However, as a result of
environmental concerns with preservative-treated timbers and structural concerns with
degrading timber members, often in the connection regions, alternative structural members
are being sought. Consequently, research to develop environmentally friendly and durable
wood plastic composite (WPC) members to replace timber members in marine structures has
been ongoing at Washington State University (WSU) in coordination with the Washington
State Department of Transportation (WSDOT). These WPC materials have been developed
for the US Navy to use in docks and piers where vessels berth laterally. WPC materials
provide a cost effective alternative to timber while maintaining desirable weathering and
energy absorption characteristics.
In order to assess the wingwall response to ferry vessel berthing, dynamic Finite
Element analyses were performed using ADINA (2001) to determine and compare demands
on timber and WPC rubbing blocks. Research presented in this thesis is based on berthing
demands at the Friday Harbor Ferry Terminal in the Puget Sound of Washington State. The
analyses were conducted with the largest vessel in the ferry fleet, assuming a berthing
velocity of 2.5 ft/sec, specified by WSDOT.
The interaction between the vessel and the wingwall is complicated. As soon as the
vessel impacts upon the wingwall, the vessel begins to slide and rotate. Meanwhile, the
wingwall is pushed forward and rebounds back as the vessel berths. This berthing process
depends on many factors. Each time the vessel lands, the berthing angle, impact location,
and velocity changes. Consequently, many contact locations were investigated. Five
3

materials, one timber and four WPC’s were modeled in this research: [1] Structural Select
Douglas Fir, [2] Polyvinyl Chloride (PVC), [3] Polypropylene (Elastic Modulus, E=870ksi)
(PP870), [4] Polypropylene (E=507ksi) (PP507), and [5] High-Density Polyethylene
(HDPE).
1.2 Research Objectives
The overall objective of this research was to determine and compare the response of
wingwall structure timber rubbing blocks and WPC rubbing block alternatives under ferry
berthing loads. The specific objectives were as follows:
1. Perform dynamic Finite Element analysis of the largest vessel (6184 long tons) in
the WSF fleet berthing into the Friday Harbor Ferry Terminal wingwall structure;
2. Replace timber rubbing blocks with WPC rubbing blocks and assess the viability of
replacing timber rubbing blocks with WPC rubbing blocks;
3. Prepare a loading protocol representing the ferry berthing contact forces and outline
a test setup for future full scale experimental testing of the WPC rubbing blocks.
4

CHAPTER 2
BACKGROUND
The use of wood-based composites in structural applications has dated back to the
early 1900’s with glulam (glued laminated) beams. Today, engineered wood composites have
diversified to include highly engineered and resource efficient materials like composite
strand lumbers and wood I-sections. These materials have always been developed to expand
the product form for wood members (e.g. flat plates, curved arches, etc.) but the materials
functioned primarily like wood in most applications. Essentially, these materials mimic
solid wood performance with specific improvements in costs and product form.
Recently, a new class of wood composites has emerged that combines wood with
synthetic materials. Specifically, these materials are aimed at improving moisture or
processing characteristics to produce a material that handles like wood but performs in other
ways like synthetics. The addition of wood to commodity thermoplastics (e.g. polyethylene
and polypropylene) improves mechanical properties, UV resistance, thermal stability, and
working properties. In turn, the thermoplastic improves the moisture resistance and allows
the wood material to be extruded into structural shapes like those composed of steel. New
wood plastic composites (WPC) have afforded highly detailed cross-sections from improved
extrusion processes (see Figure 2.1).
5

Figure 2.1 Ribbed Box Sections Composed of a Wood-poly (vinyl chloride) Composite
Developed by Washington State University for Pier Decking for the US Navy.
One distinct advantage that WPC’s have over other types of wood-based materials is
the ability to control both material properties and product form. Complicated structural
shapes can be produced from a variety of material formulations. The relative quantities of
wood and thermoplastic in the composite can strongly influence material stiffness, strength,
and ductility. Also, small quantities of additives like co-polymers acting as interfacial
coupling agents between the dissimilar materials can strongly influence material strength,
while having much less influence over stiffness properties. These material advantages have
been used to design new composite components that have been demonstrated in decking and
fendering system applications for US Navy piers (WSU, 1999).
2.1 Previous Ferry Vessel/Marine Fender Impact Research
Current marine fender systems are designed based on empirical criteria. Dr. Jahren
et al. (1993) studied the berthing of vessels into wingwall structures to develop
rationally-based design criteria. A main focus of the research was directed at determining
accurate vessel berthing velocities. A Closed Circuit Television (CCTV) System and a
6

video recorder were used to analyze 568 berthing events at WSF’s Edmonds Ferry Terminal.
The data were used to find the distribution of berthing velocities. The approach velocity
ranged from zero to 1.28 ft/sec with an average of 0.58 ft/sec. The average and maximum
perpendicular velocity component were 0.44 ft/sec and 1.00 ft/sec, respectively. The 95th
percentile velocity for the total velocity and the perpendicular velocity component were 0.91
ft/sec and 0.75 ft/sec, respectively. From 102 high deflection berthings, the highest velocity
was 2.0 ft/sec and the average velocity was 0.85 ft/sec. The research also found that the
berthing velocity decreased as the weight of vessel increased.
Berthing energy (Es) was estimated from field deflection measurements for 18
berthing events. The berthing coefficient, Cest, was also estimated by comparing berthing
energy (Es) from field measurements and the calculated kinetic energy (Ev).
vsest EEC /=
where,
2)/(2/1 perpv VgwE =
∫==max
0max )(|)(
s
ss dssgshE
w =weight of berthing vessel;
perpV =perpendicular velocity component with respect to the plane of the wing wall;
)(sh =energy vs. deflection relationship of wing wall;
)(sg =force vs. deflection relationship of wing wall.
The berthing coefficient was highly dispersed with a 0.6 upper bound. The dispersion was a
result of three possible issues:
[1] Thrust of the propulsion system may have absorbed a part of the berthing energy;
7

however, it is hard to tell how much the propulsions were used during berthing;
[2] Difficulties in obtaining accurate measurement of wingwall deflections;
[3] Uncertainties in developing the energy vs. deflection relationship of a wingwall.
Three performance levels were defined based on the berthing demand: [1] A fender system
should perform well for most berthing events for its entire service life with repairs limited to
normal maintenance; [2] A fender system can be damaged by some special berthing events
with repairs limited to a portion of the fender system; [3] A fender system and its supporting
structures can be damaged during a catastrophic berthing event.
Fender system research has been performed by Dr Cofer et al. (1999) at Washington
State University for minesweeper vessels with a side berthing. Research was initiated to
replace the timber wale members in the fender system. The existing system was composed
of timber piles, chocks, wales and camels. The horizontal timber camel was used as the
contact interface with the berthing vessel. Both dynamic and static finite element models
were used to investigate the structure demands. The static analysis was based on the
Military Handbook 1025/1 (NAVFAC, 1987) to provide verification for the dynamic analysis.
Dynamic analyses were then performed with WPC members replacing the timber members.
The results from the static analysis matched well with the dynamic analysis results.
Dr. Consolazio et al (2003) from the University of Florida conducted similar research
for bridge piers. Finite element analysis was used for modeling of barge and bridge pier
impact. The piers were modeled with 3-D solid elements for a crush investigation. In Dr.
Consolazio’s research, the damage of the vessel itself was also a concern due to the severe
impact with the bridge pier. The finite element code ADINA was also used in this research.
8

The analyses were performed as pseudo-static problems. This is because static or implicit
dynamic analysis will be more effective than explicit methods for crush simulations as long
as the time step is not very small compared with the impact duration. The bridge pier
model nodes were assigned with a displacement time history to bring the pier into contact
with barge hull. Based on analysis results, both pier shapes and sizes influence the impact
load magnitude. In addition, the impact load can not be uniquely correlated with maximum
crush deformation.
2.2 ADINA Contact Analysis
The finite element code ADINA was selected for the ferry berthing analyses. The
code has successfully been used to simulate complex barge crushing problems (Consolazio,
2003). In order to model the vessel impact with the wingwall structures, the finite element
code needs to be able to detect the contact by itself because the contact locations and motions
of the contactors are unknown in advance. The initial velocity and relative position of the
vessel with respect to the wingwalls are known. After the analysis begins, the vessel model
moves with a specified initial velocity and direction. Though the finite element code has
the ability to detect the contact locations, the potential surfaces of contact need to be defined
by the user prior to running the analysis. For each contact analysis, at least one contact pair
composed of a contactor surface and a target surface must be defined. In the contact
analysis definition, the user should define a liberal contact area since the berthing location of
the vessel along the wing walls is not known ahead of time. This eliminates the possibility
that the vessel will contact a portion of the wingwall where a contact pair is not defined.
9

Key rules for defining the contactor surface and the target surface include: [1] Only
the target surface can be a rigid surface; [2] No degrees of freedom on the contactor surface
can be fixed; [3] The target surface can overlap the contactor surface while the contactor
surface cannot overlap the target surfaces. In the vessel model, prescribed displacements
should be used to ensure the vessel motions remain in the vessel plane. Contact surfaces
on the vessel should be defined as the target surface. Though it is recommended to define
one contact surface as rigid when it is much stiffer than the other contact surface, the contact
surfaces on the vessel were not defined as rigid in this research because this would restrict
the vessel from moving.
10

CHAPTER 3
WINGWALL/FERRY VESSEL FINITE ELEMENT ANALYSIS MODELING
3.1 Introduction
Fender systems serve to guide vessels into the landing position and absorb the impact
from berthing without causing damage to the vessel itself. A plan view of a typical fender
system is shown in Figure 3.1. Wingwalls are widely used in the WSF system. In
addition to the wingwalls, pile dolphins help to guide the vessel berthing and keep the vessel
in alignment against cross currents and winds.
Figure 3.1 Plan View of a Typical WSF Fender System (Jahren, 1993).
This research was based on the Friday Harbor Ferry Terminal using the largest vessel
in the WSF fleet. Dynamic analysis of the ferry vessels berthing into wingwalls was
performed using the Transient Dynamics Module in the finite element code ADINA. The
impact between the vessel and wingwall structure was simulated by nonlinear dynamic
11

contact analysis. Due to different contact locations, contact angles and water elevations,
numerous cases were modeled and analyzed.
Fender systems typically consist of a pair of wingwalls. Here only one of the
wingwalls was modeled due to the size and complexity of the model. Figure 3.2 shows a
plan view of the wingwall structure and Figure 3.3 and Figure 3.4 show the elevations of the
first and second rows of the wingwall, respectively. The third row of the wingwall is
similar to the second row except that there are only three piles in the third row. Details of
the vessel and wingwall modeling are presented below.
Figure 3.2 Plan View of the Wingwall Structure.
12

Figure 3.3 Elevation of the First Row of the Wingwall.
13

Figure 3.4 Elevation of the Second Row of the Wingwall.
3.2 Finite Element Modeling of the Wingwall and Ferry Vessel Impact
3.2.1 ADINA Finite Elements
Beam, spring, shell and solid elements were used in the finite element models. The
2-node Hermitian beam and beam-column elements were used to model the majority of the
wingwall structures. An elastic-isotopic material model was used assuming large
displacement/rotation can occur while element strain is small. The isoparametric MITC4
14

shell element was used for modeling of the vessel rub rail. The MITC4 element has five
degrees of freedom at each node, without a rotational degree of freedom normal to the shell
midsurface. The element is not susceptible to locking and can represent rigid body motion
and geometric nonlinearity appropriately. The three-dimensional solid elements were 8 and
10-node isoparametric elements. The incompatible mode was selected in ADINA to
improve the bending behavior of the 8-node solid elements. Since the 3-D solid elements
are computationally expensive, the solid elements were only used to model the rubbing
blocks.
3.2.2 I-beams
There are two types of steel W-sections used in the wingwalls; sections
are used for all horizontal I-beams in the wingwall, and
36 160W ×
14 68W × sections are used for
vertical I-beams in the first row of the wingwall. Figure 3.5 shows the locations of both the
horizontal and vertical I-beams in the first row. Horizontal I-beams are welded to the piles
and vertical I-beams are welded to the horizontal I-beams in the first row. Figure 3.6 shows
the I-beam model of the first row of the wingwall without the skew part.
15

Figure 3.5 First Row Vertical and Horizontal W-Sections.
Figure 3.6 First Row Vertical and Horizontal W-Section Model.
16

3.2.3 Piles
Two types of piles are used in the wingwalls, 30 '' 1''× (Diameter and thickness) piles
in the first row and piles in the second and third rows. 294 linear springs were
placed along the piles to model the soil-structure interaction. Springs represented lateral
soil stiffness in both the global x and y directions (see Figure 3.7). More springs were used
for the top one-third of the pile section below mud line since soil in this region has the most
influence on the pile behavior. Moduli of subgrade reaction provided by WSDOT for the
Friday Harbor Ferry Terminal refurbishment project were used for calculation of the soil
spring stiffnesses.
36 '' 1''×
The length of the piles under the mud line in the first row is 20ft. From 0ft (depth
below mud line) to 7ft, springs were placed every foot. From 7ft to 17ft, springs were
placed every two feet. Finally, one spring was used at the pile tip. The length of piles
below the mud line in the second and third rows is 30ft. From 0ft to 7ft, springs were
placed every one foot. From 7ft to 15ft, springs were placed every two feet. From 15ft to
30ft, springs were placed every three feet. The stiffness of the springs was calculated based
on the formulas below: (Bowles, 1996)
1 11 ,(2 )
6 s i s iB LK k k −= + , 1
2 22 ,(2 )
6 s i s iB LK k k += + , 1
1 2K K K= +
Where,
1K =Stiffness of the soil segment above the node;
2K = Stiffness of the soil segment below the node;
17

B =Diameter of the pile;
L =Length of the pile segment;
, 1s ik − =Modulus of subgrade reaction of the soil above node;
, 1s ik + =Modulus of subgrade reaction of the soil node below;
,s ik =Modulus of subgrade reaction of the soil at the node;
K =Spring stiffness at the node.
Figure 3.7 Wingwall Pile Model with Soil Springs.
3.2.4 Bolts (Bolts between I-beams and rubbing timbers)
A307, 3/4’’diameter, counter bore bolts connect the rubbing blocks to the flanges of
the W36x160 sections. There are six bolted connections for each rubbing block. Since
demand on the bolt itself was not the focus of this research, constraint equations were used to
18

model the bolted connections. The nodes corresponding to the bolt locations in the I-beam
elements served as master nodes, whiles nodes corresponding to the bolt location in the 3-D
solid elements acted as slave nodes. All degrees of freedom were constrained. The 3in.
offsets of the bolt from the web and 2in. counterbore were ignored.
Figure 3.8 Timber Rubbing Block Bolt Detail.
3.2.5 Treated rubbing timbers and WPC alternatives
Structural Select Douglas Fir preservative-treated timber rubbing blocks are used as
the direct contact elements in WSF wingwalls. "24"11"25.1 ×× (Thickness by width by
length) UHMW Polyethylene sheets are attached to each timber rubbing block to decrease
the friction between the vessel and rubbing blocks. A 0.4 Coulomb friction coefficient,
based on previous research (Cofer, 1999), was used to account for the friction as the vessel
19

slid along the rubbing timber blocks. A close up of a rubbing block model is shown in
Figure 3.9.
The WPC rubbing block cross section was composed of three cross sections melt
bonded together (see Figure 3.10-3.11). The cross sections were connected to the wingwall
structure by 3/4’’ diameter bolts in the same locations as the timber rubbing block
connections. The WPC cross section model was created with ADINA-M as shown in
Figures 3.12-3.14. Due to the voids within the cross section, 10-node 3-D solid elements
were used for the WPC rubbing blocks. A very detailed mesh density was needed in order
to obtain an acceptable mesh. This resulted in very large finite element models. As a
result, dynamic analysis using the WPC cross section with the voids included was not
performed due to computer computation limitations. Therefore, dynamic analyses were
performed using a solid WPC cross section as shown in Figure 3.9. Static analyses of the
wingwall structure using loads based on the dynamic analysis results were performed in
which the WPC cross sections with the voids were included. In order to make it possible
to perform the static analyses, only the portion of the rubbing block with the maximum
demands during the dynamic analyses was modeled with 3-D elements. The rest of the
rubbing blocks were modeled with beam elements (see Figure 3.14).
20

Figure 3.9 Model of Timber and WPC Rubbing Blocks Used in Dynamic Analyses.
Figure 3.10 1/3 of the Wood Plastic Composite Cross Section.
21

Figure 3.11 Wood Plastic Composite Cross Section.
Figure 3.12 WPC Cross Section Models.
22

Figure 3.13 Meshed WPC Cross Section Model.
Figure 3.14 Beam/Solid Elements Hybrid Model.
23

3.2.6 Chains
Rasmussen stud link chains are used as tension members between the first and the
second rows of piles in the wingwall structure. The chains were approximated as truss
members with tension capacity only. The chain demand was checked with the maximum
load capacity after each analysis. In all cases the chain capacity was not exceeded.
Figure 3.15 Rasmussen Stud Link Chain.
3.2.7 Marine fenders
The fender units are designed to assist in absorbing the vessel berthing energy in
wingwall systems through reaction and deformation of the fenders. The fenders used in the
Friday Harbor wing wall structure are Trellex BMV 10001250× fender elements. This
element is a buckling-type fender which has a reaction vs. deflection curve represented by
Figure 3.16. The behavior of the marine fenders was modeled with linear and nonlinear
springs. For each fender unit, two springs were used to account for the stiffness in three
directions. The axial and shear response was modeled with one nonlinear spring oriented at
an angle of 17.2 degrees (Multiply the axial force by and deflection
by ).
)2.17cos(/1 o
)2.17cos( o
24

Figure 3.16 Fender Axial Reaction and Absorbed Energy versus Deflection Curves of
1250 1000MV × B Marine Fenders.
The axial and shear responses are shown in Figure 3.17. Figure 3.18 shows a simplified
reaction/deflection curve used to model the curve in Figure 3.16. Another linear spring
was used to account for the transverse stiffness. The stiffness of the linear spring was
5.47 kips/in, based on guidelines from WSDOT. The six members between row 1 and
row 2 in Figure 3.19 show the marine fender springs.
25

Figure 3.17 Data for Rubber Fender Response.
Figure 3.18 Simplified Axial and Shear Reactions versus Deflection Curve.
26

Figure 3.19 Marine Fender Springs and HSS Members.
3.2.8 HSS members
12 12 5 / 8HSS × × members between row 2 and row 3 were modeled with large
displacement elastic beam elements. A rectangular hollow section was defined for each
beam element. The eighteen members between row 2 and row 3 in Figure 3.19 represent
the HSS members in the model.
3.2.9 Vessel
In modeling of the ferry vessel, it was assumed that the vessel would not undergo any
permanent damage and was rigid compared with the wingwall structure during berthing.
Reaction of the vessel hull and internal members was not a major concern. For accurate
results, proper modeling of mass distribution of the vessel is important. Mass distribution
was based on detailed mass distribution information from WSDOT. A concentrated mass
27

was used to model the vessel, with the total mass and the mass moment of inertia of the
whole mass the same as the WSDOT values. In addition, the center of gravity was set in
the geometric center of the vessel. The vessel geometry was defined according to a
contractor drawing. Proper modeling of the curve of the vessel, particularly for the region
where contact might occur was very important. The curve was accurately represented
based on AutoCAD files of the vessel geometry provided by WSDOT.
The entire vessel was not modeled. Instead, the vessel was represented by the rub
rail. The rub rail is about 1 foot in height and directly contacts with the wingwall when
impact occurs. Four node shell elements were used for modeling of the rub rail.
Generally, there are only five degrees of freedom for a shell element. Here, another
rotational degree of freedom was added to all the nodes to account for the rotation of the
vessel when impact occurs. Because only the 1-foot high rub rail was modeled, the vessel
might become unstable upon contact with the wingwall. Therefore, prescribed
displacements were used to restrict the out-of-plane motions of the vessel. This is a
reasonable approximation, because in reality the vessel is very heavy and stable, and these
motions would be very small. The mesh density used for the shell elements were quite
similar to the mesh density of timber rubbing blocks due to requirements in ADINA. As
the vessel slides on the wingwall, friction between the two contact surfaces was considered
with a Coulomb friction coefficient. Figure 3.20 shows the vessel model. The lighter
portion in the lower left hand corner was defined to include the contact surfaces.
28

Figure 3.20 Vessel Model.
3.2.10 Damping
In order to proceed with the dynamic analysis, damping was considered for both the
vessel and wingwall. For the vessel, both hydrodynamic forces and viscous damping forces
act on the hull. Viscous damping was ignored here due to its small effect on the short
period impact. Added mass was used to account for the hydrodynamic force from the water
that moves with the vessel as it berths. According to Headland, design values for added
mass for the vessel typically range from 1.2 to 2.0. The value is influenced by factors which
include: [1] Hull shape; [2] Berthing velocity; [3] Dynamic characteristics of the fendering
29

system; [4] Water depth, underkeel clearance, distance to obstacles, and configuration of the
wharf. The added mass factor used here was 1.1, a value recommended by WSDOT. The
added mass was applied by multiplying the total mass of the vessel by 1.1. For the
wingwall, most of the structure lies in the water. Thus a 25% Rayleigh damping was
applied to wingwall as recommended by Cofer et al. (1999) A model without the vessel was
also created and frequency analyses were performed to obtain the natural frequencies of the
wingwall structure. The Rayleigh damping matrix has the form of [ ] [ ] [ ]kmc βα += . The
two coefficients α and β can be solved with equations:
⎥⎥⎦
⎤
⎢⎢⎣
⎡
−
−= 222
ji
jiijji ωω
ωξωξωωα
⎥⎥⎦
⎤
⎢⎢⎣
⎡
−
−= 222
ji
jjii
ωωωξωξ
β
Here two boundary natural frequencies were selected. For the smaller one, the fundamental
natural frequency of the wingwall structure was selected. For the larger one, many different
values were tried to determine the influence. The analysis results were not influenced
significantly with variation of the larger boundary frequencies. Finally, half of the total
modes were included for the analysis and corresponding α and β values were assigned
to all element groups used for defining the wingwall structure in ADINA.
30

CHAPTER 4
WINGWALL/FERRY VESSEL FINITE ELEMENT ANALYSIS RESULTS
4.1 45 Degrees Contact Angle Case Dynamic Analysis
The ferry vessel was oriented for a 45 degrees contact angle with respect to the plane
of the wingwall structure. The elevation of the vessel rub rail was 22.4 feet above the water
line and the first point of contact was with the fourth timber rubbing block from right to left
on the wingwall. Figure 4.1 shows a plan view of the vessel approaching the wingwall at
45 degrees.
Figure 4.1: Plan View of Vessel Approaching the Wingwall.
31

Initially, the wingwall was modeled and analyzed with timber rubbing blocks
(Structural Select Douglas Fir). Next, four WPC members were investigated as replacements
for the timbers; Polyvinyl Chloride (PVC), two Polypropylene (PP) formulations and a
High-Density Polyethylene (HDPE) material. The orthotropic material properties of the
timber and WPC materials are listed in Table 4.1. An axis system was defined and assigned
to the blocks to set up a local coordinate system a, b and c corresponding to the global axes x
(perpendicular to the plane of the wingwall), y (along the plane of the wingwall) and z
(vertical), respectively.
Table 4.1 Mechanical Properties of the Five Rubbing Blocks Materials
Ea psi Eb psi Ec psi Gab psi Gac psi Gbc psi υab υac υbc
Douglas Fir 129200 95000 1600000 13300 121600 148200 0.39 0.036 0.029 HDPE 29000 29000 340000 17000 17000 17000 0.3 0.3 0 PVC 63500 63500 754000 37700 37700 37700 0.3 0.3 0 PP(870) 73300 73300 870000 43500 43500 43500 0.3 0.3 0 PP(507) 42700 42700 507000 25400 25400 25400 0.3 0.3 0
Note: E: Modulus of elasticity G: Modulus of rigidity υ: Poisson’s ratio
During the impact process, the contact forces increased as the wingwall deflection
increased. Therefore, the maximum contact forces did not occur on the first rubbing block
impacted by the vessel. Depending on the initial contact location, either the second or third
rubbing block impacted by the vessel experienced the highest demand. Figure 4.2 displays
a typical distribution of contact effective stresses on the rubbing blocks. After contacting
32

the initial rubbing block the vessel slid along the wingwall and began to rotate. Figure 4.3
shows the vessel rotation from 0 seconds to 9 seconds of the analysis with timber rubbing
blocks.
The time history plots of the total contact force for the timber and WPC rubbing
blocks are shown in Figure 4.4. The impacts lasted between 2 – 3 seconds with peak
demands approximately half way through the impact. The contact forces decreased as the
rubbing blocks began to rebound. Due to the flexibility of the wingwall structure, the
vessel impact loading time history curves are not very sharp, except for the initial part of the
total contact force time history. This spike in the curves is potentially a result of the corner of
the rubbing blocks being the first point of contact with the vessel. As the vessel begins to
rotate and slide, contacting a larger portion of the rubbing block, the demand reaches a peak
and then begins to reduce. The stress distribution plots (Figure 4.2) illustrate that the
stresses on the rubbing blocks are highly localized. The contact usually occurs along the
bow of the vessel, which has a high curvature. As the 1 foot high rubbing rail of the vessel
contacts and slides on the rubbing blocks, the areas which will come into contact are small
compared to the size of the vessel and the wingwall.
The time history plots of the contact forces on the individual rubbing blocks with the
maximum berthing demand are shown in Figure 4.5. The individual member impacts lasted
approximately 1.5 seconds. Table 4.2 lists the maximum individual rubbing block member
perpendicular contact force (CFX), parallel contact force (CFY), effective stress (Estress)
and bending stress in z direction (Bstress) for each material investigated.
33

Figure 4.2 Distribution of Effective Stress during Ferry Vessel Impact with the Wingwall.
Figure 4.3 Vessel Rotations during Impact with the Wingwall.
34

0
100
200
300
400
4 6 8
Time (sec)
Forc
e (k
ips)
Timber (L1)– perpendicular berthing force
0
100
200
300
400
4 6 8
Time (sec)
Forc
e (k
ips)
Timber(L1) – parallel berthing force
0
100
200
300
400
4 6 8
Time (sec)
Forc
e (k
ips)
PP870 (L1)– perpendicular berthing force
0
100
200
300
400
4 6 8
Time (sec)
Forc
e (k
ips)
PP870 (L1) – parallel berthing force
0
100
200
300
400
4 6 8
Time (sec)
Forc
e (k
ips)
PVC (L1)– perpendicular berthing force
0
100
200
300
400
4 6 8
Time (sec)
Forc
e (k
ips)
PVC (L1) – parallel berthing force
Figure 4.4-1 Total Rubbing Block Contact Forces Time Histories.
(L1=Contact Location 1, See Figure 4.6)
35

0
100
200
300
400
4 6 8
Time (sec)
Forc
e (k
ips)
PP507 (L1)– perpendicular berthing force
0
100
200
300
400
4 6 8
Time (sec)
Forc
e (k
ips)
PP507 (L1) – parallel berthing force
0
100
200
300
400
4 6 8
Time (sec)
Forc
e (k
ips)
HDPE (L1)– perpendicular berthing force
0
100
200
300
400
4 6 8
Time (sec)
Forc
e (k
ips)
HDPE (L1) – parallel berthing force
Figure 4.4-2 Total Rubbing Block Contact Forces Time Histories.
(L1=Contact Location 1, See Figure 4.6)
36

0
50
100
150
200
4.8 4.9 5 5.1 5.2
Time (sec)
Forc
e (k
ips)
0
100
200
300
400
4 6 8
Time (sec)
Forc
e (k
ips)
(a) perpendicular berthing force (b) perpendicular spike force
Figure 4.4-3 Perpendicular Berthing Force Spike Time Histories.
In order to ensure that the spike in berthing force time histories was not due to
numerical sensitivity, the spike region was analyzed with more time steps. Figure 4.4-3 is
based on the timber rubbing block model perpendicular force at contact Location 1. Figure
4.4-3 (b) shows the spike region analyzed with more time steps. The formation of spike is
not due to a numerical problem and can not be eliminated with more time steps. The peak
force of the spike varies depending on the number of time steps used in the spike region.
But the peak force in the spike region does not affect the peak berthing force. Due to
computing limitations, it is necessary to ensure the peak berthing force is accurate rather than
using more time steps to model the spike more accurately. The spike in the berthing contact
force is potentially due to the vessel contacting the corner of the rubbing block first, before
sliding across the face of the rubbing block.
37

0
100
200
300
400
4 6 8
Time (sec)
Forc
e (k
ips)
Timber (L1)– perpendicular berthing force
0
100
200
300
400
4 6 8
Time (sec)
Forc
e (k
ips)
Timber(L1) – parallel berthing force
0100200300400
4 6 8
Time (sec)
Forc
e (k
ips)
PP870 (L1)– perpendicular berthing force
0100
200300
400
4 6 8
Time (sec)
Forc
e (k
ips)
PP870 (L1) – parallel berthing force
0100200300400
4 6 8
Time (sec)
Forc
e (k
ips)
PVC (L1)– perpendicular berthing force
0
100200
300
400
4 6 8
Time (sec)
Forc
e (k
ips)
PVC (L1) – parallel berthing force
Figure 4.5-1 Individual Contact Forces Time Histories of the Rubbing Block with the
Maximum Demands. (L1=Contact Location 1, See Figure 4.6)
38

0100200300400
4 6 8
Time (sec)
Forc
e (k
ips)
PP507 (L1)– perpendicular berthing force
0
100200
300
400
4 6 8
Time (sec)
Forc
e (k
ips)
PP507 (L1) – parallel berthing force
0100200300400
4 6 8
Time (sec)
Forc
e (k
ips)
HDPE (L1)– perpendicular berthing force
0100
200300
400
4 6 8
Time (sec)
Forc
e (k
ips)
HDPE (L1) – parallel berthing force
Figure 4.5-2 Individual Contact Forces Time Histories of the Rubbing Block with the
Maximum Demands. (L1=Contact Location 1, See Figure 4.6)
39

Table 4.2 Maximum Contact Forces (CFX, CFY), Effective Stresses (Estress) and Bending Stress (Bstress) in Z Direction on Individual Rubbing Blocks
CFX kips
CFY kips
Estress ksi
Bstress ksi
Allowable Bending Stress ksi
Demand/CapacityRatio
Douglas Fir 343 145 15.8 19.1 1.6 11.9 PP(870ksi) 273 115 10.5 12.8 1.1 11.9 PVC 258 108 9.9 12.1 1.5 7.8 PP(507ksi) 227 93 8.5 10.3 N/A N/A HDPE 193 81 7.3 8.9 N/A N/A
Note: CFX: Maximum perpendicular contact force on one rubbing block; CFY: Maximum parallel contact force on one rubbing block; Estress: Maximum effective stress on one rubbing block; Bstress: Maximum bending stress in z direction on one rubbing block;
The contact force and stress demands varied depending on the material mechanical
properties. The allowable stresses also varied from one material to another. In all cases
the demands on the rubbing blocks exceeded the allowable design values. Since the
rubbing blocks have performed well over time, WSDOT has not required the rubbing blocks
to be designed to resist the demands based on the 2.5 ft/sec berthing velocity of the largest
vessel in the ferry fleet. This inadequacy of the rubbing blocks has an implicit benefit of
allowing the rubbing blocks to serve as structural fuses for the rest of the wingwall, failing
under excessive berthing loads, and thereby, protecting the rest of the structure from
permanent deformation. However, as a result, the large safety factors used in the design of
timber members, the rubbing blocks are capable of resisting demands above the allowable
design stress levels listed in Table 4.2. Visual inspections of rubbing blocks along
wingwalls throughout the WSF system verify that the rubbing blocks are performing as
intended. In a few cases, rubbing blocks have been damaged under large berthing loads,
40
thereby protecting the rest of the structure. In addition, damage has also resulted from
deterioration of the connection regions due to the marine environment.
4.2 Variation of Vessel Berthing Angles and Locations of Vessel/Wingwall Impact
In order to investigate the variation of vessel impact locations, numerous contact
locations were analyzed. Four of these additional contact locations are presented here for
Douglas Fir and PP870 rubbing blocks. The contact angle was kept as 45 degrees. The
initial location of the vessel was changed in each analysis for the vessel to contact with the
wingwall at different locations. The contact locations are identified in Figure 4.6 by the
first point of contact. L1 marks the contact location used in the research described up to
this point, L2-L5 mark the additional contact locations.
For contact location 1 through 4, the contact point was in the middle of a rubbing
block span between horizontal I-beams. Location 5 was used to investigate the impact of
the vessel on the rubbing block connections to the horizontal I-beams. In addition, the
contact angle for location 1 was changed to 60 degrees with respect to the plane of the
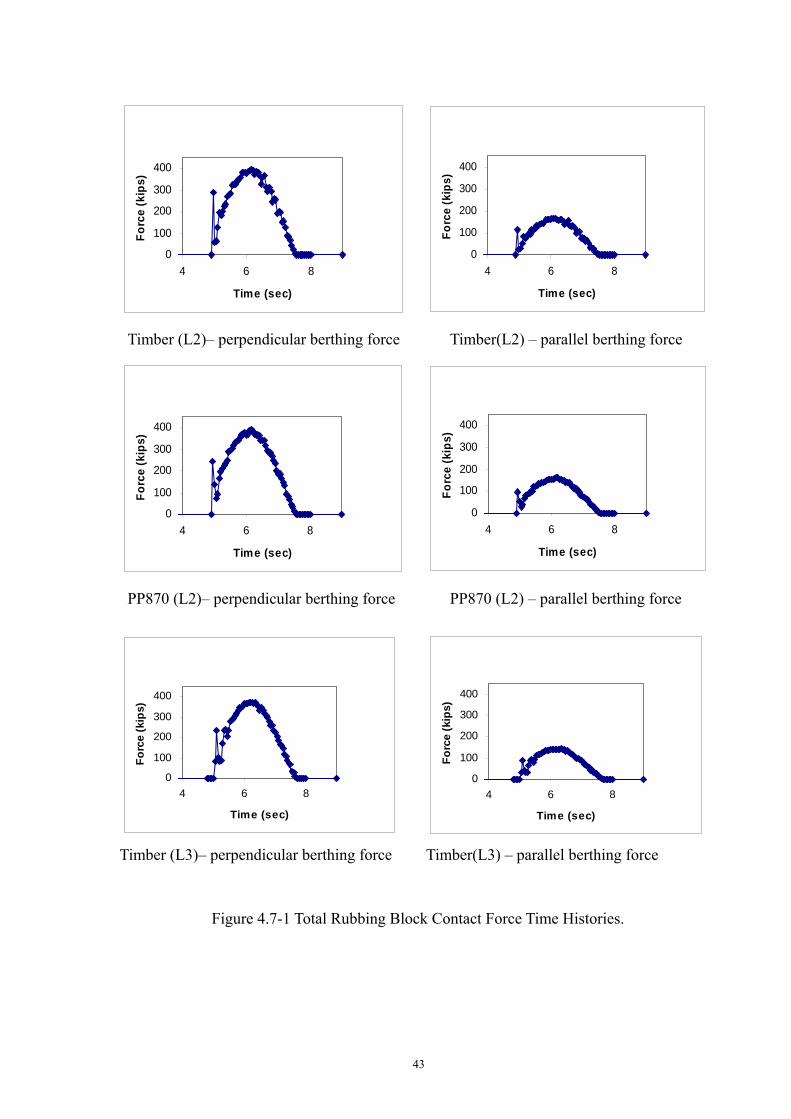
wingwall to check the berthing demand under a larger vessel approach angle. The time
history plots of the total contact force for the timber and WPC rubbing blocks are shown in
Figure 4.7. The time history plots of the contact forces on the individual rubbing blocks
(timber and PP870) with the maximum demand are shown in Figure 4.8. Table 4.3 lists the
maximum contact force and stress demands on the individual rubbing blocks.
41

Figure 4.6 Contact Locations.
42
0
100
200
300
400
4 6 8
Time (sec)
Forc
e (k
ips)
Timber (L2)– perpendicular berthing force
0
100
200
300
400
4 6 8
Time (sec)
Forc
e (k
ips)
Timber(L2) – parallel berthing force
0
100
200
300
400
4 6 8
Time (sec)
Forc
e (k
ips)
PP870 (L2)– perpendicular berthing force
0
100
200
300
400
4 6 8
Time (sec)
Forc
e (k
ips)
PP870 (L2) – parallel berthing force
0
100
200
300
400
4 6 8
Time (sec)
Forc
e (k
ips)
Timber (L3)– perpendicular berthing force
0
100
200
300
400
4 6 8
Time (sec)
Forc
e (k
ips)
Timber(L3) – parallel berthing force
Figure 4.7-1 Total Rubbing Block Contact Force Time Histories.
43

0
100
200
300
400
4 6 8
Time (sec)
Forc
e (k
ips)
PP870 (L3)– perpendicular berthing force
0
100
200
300
400
4 6 8
Time (sec)
Forc
e (k
ips)
PP870 (L3) – parallel berthing force
0
100
200
300
400
4 6 8
Time (sec)
Forc
e (k
ips)
Timber (L4)– perpendicular berthing force
0
100
200
300
400
4 6 8
Time (sec)
Forc
e (k
ips)
Timber(L4) – parallel berthing force
0
100
200
300
400
4 6 8
Time (sec)
Forc
e (k
ips)
PP870 (L4)– perpendicular berthing force
0
100
200
300
400
4 6 8
Time (sec)
Forc
e (k
ips)
PP870 (L4) – parallel berthing force
Figure 4.7-2 Total Rubbing Block Contact Force Time Histories.
44

0
100
200
300
400
4 6 8
Time (sec)
Forc
e (k
ips)
Timber (L5)– perpendicular berthing force
0
100
200
300
400
4 6 8
Time (sec)
Forc
e (k
ips)
Timber(L5) – parallel berthing force
0
100
200
300
400
4 6 8
Time (sec)
Forc
e (k
ips)
PP870 (L5)– perpendicular berthing force
0
100
200
300
400
4 6 8
Time (sec)
Forc
e (k
ips)
PP870 (L5) – parallel berthing force
Figure 4.7-3 Total Rubbing Block Contact Force Time Histories.
45

0100200300400500600700
4 5 6 7 8 9
Time (sec)
Forc
e (k
ips)
Timber (60)– perpendicular berthing force
0100200300400
4 6 8
Time (sec)
Forc
e (k
ips)
Timber (60) – parallel berthing force
0100200300400500600700
4 5 6 7 8 9
Time (sec)
Forc
e (k
ips)
PP870 (60)– perpendicular berthing force
0
100
200
300
400
4 6 8
Time (sec)
Forc
e (k
ips)
PP870 (60) – parallel berthing force
Figure 4.7-4 Total Rubbing Block Contact Force Time Histories.
46

0100200300400
4 6 8
Time (sec)
Forc
e (k
ips)
Timber (L2)– perpendicular berthing force
0100
200300
400
4 6 8
Time (sec)
Forc
e (k
ips)
Timber(L2) – parallel berthing force
0100200300400
4 6 8
Time (sec)
Forc
e (k
ips)
PP870 (L2)– perpendicular berthing force
0
100200
300
400
4 6 8
Time (sec)
Forc
e (k
ips)
PP870 (L2) – parallel berthing force
0
100
200
300
400
4 6 8
Time (sec)
Forc
e (k
ips)
Timber (L3)– perpendicular berthing force
0
100
200
300
400
4 6 8
Time (sec)
Forc
e (k
ips)
Timber(L3) – parallel berthing force
Figure 4.8-1 Individual Contact Forces Time Histories of the Rubbing Block
with the Maximum Demands.
47

0100200300400
4 6 8
Time (sec)
Forc
e (k
ips)
PP870 (L3)– perpendicular berthing force
0100
200300
400
4 6 8
Time (sec)
Forc
e (k
ips)
PP870 (L3) – parallel berthing force
0
100
200
300
400
4 6 8
Time (sec)
Forc
e (k
ips)
Timber (L4)– perpendicular berthing force
0
100200
300
400
4 6 8
Time (sec)
Forc
e (k
ips)
Timber(L4) – parallel berthing force
0100200300400
4 6 8
Time (sec)
Forc
e (k
ips)
PP870 (L4)– perpendicular berthing force
0
100200
300
400
4 6 8
Time (sec)
Forc
e (k
ips)
PP870 (L4) – parallel berthing force
Figure 4.8-2 Individual Contact Forces Time Histories of the Rubbing Block
with the Maximum Demands.
48

0100200300400
4 6 8
Time (sec)
Forc
e (k
ips)
Timber (L5)– perpendicular berthing force
0100200
300400
4 6 8
Time (sec)
Forc
e (k
ips)
Timber(L5) – parallel berthing force
0100200300400
4 6 8
Time (sec)
Forc
e (k
ips)
PP870 (L5)– perpendicular berthing force
0100200
300400
4 6 8
Time (sec)
Forc
e (k
ips)
PP870 (L5) – parallel berthing force
Figure 4.8-3 Individual Contact Forces Time Histories of the Rubbing Block
with the Maximum Demands.
49

0100200300400500600700
4 5 6 7 8 9
Time (sec)
Forc
e (k
ips)
Timber (60)– perpendicular berthing force
0
100200
300
400
4 6 8
Time (sec)
Forc
e (k
ips)
Timber (60) – parallel berthing force
0100200300400500600700
4 5 6 7 8 9
Time (sec)
Forc
e (k
ips)
PP870 (60)– perpendicular berthing force
0100
200300
400
4 6 8
Time (sec)
Forc
e (k
ips)
PP870 (60) – parallel berthing force
Figure 4.8-4 Individual Contact Forces Time Histories of the Rubbing Block
with the Maximum Demands.
50

Table 4.3 Maximum Contact Forces (CFX, CFY), Effective Stresses (Estress) and Bending Stress (Bstress) in Z Direction on Individual Rubbing Block for Different Locations
Impact Location
Material CFX kips
CFY kips
Estress ksi
Bstress ksi
Bstress Demand/ Capacity
Timber 343 145 15.8 19.1 11.9 L1
PP870 273 115 10.5 12.8 11.6 Timber 356 150 14.7 18 11.3
L2 PP870 284 119 10.6 12.9 11.7 Timber 338 131 14.4 15.7 9.4
L3 PP870 262 102 9.6 11.3 10.3 Timber 362 142 15.3 17.3 10.8
L4 PP870 295 116 9.58 11.3 10.3
For contact locations 1 and 2, the maximum contact forces were developed on the
second member to the left of the initial member contacted; for contact location 3 and 4, the
maximum contact forces were developed on the first member to the left of the initial member
contacted. As mentioned earlier, the contact forces increased as the wingwall deflection
increased, therefore, the initial rubbing block contacted did not experience the highest
individual rubbing block berthing demand. The contact forces for locations 2 and 4 were
higher than those for locations 1 and 3, respectively. Contact locations 2 and 4 were more
rigid than locations 1 and 3 due to the lower elevation, and therefore attracted higher
demands. As the contact location was varied along the length of the wingwall the contact
force demand did not vary significantly.
4.3 Check of Additional Wingwall Members
Although the timber rubbing blocks were not designed by WSDOT to resist the
51

vessel impact demands, the rest of the wingwall structure was designed by WSDOT. From
a check of the wingwall member demand and capacity, all the members were capable of
resisting the vessel berthing demands without exceeding the design capacity values except
for the HSS members in the corner of the wingwall and the 30” pipes in two cases. The
wingwall member demand/capacity check was made at four contact locations along the
wingwall, based on the timber rubbing member demands. The cross section properties of
the wingwall members are listed in Table 4.4.
Table 4.4 Wingwall Member Properties
Members Sx in^3 Sy in^3 A in^2 W36x160 542 49.1 47 HSS12x12x5/8 91.4 91.4 25.7 Truss 1.767 36 -IN PIPE 639.26 639.26 91.11 30 -IN PIPE 936.15 936.15 109.96
Sx: Elastic Section Modulus along the major axis; Sy: Elastic Section Modulus along the minor axis; A: Area of member cross section.
52

Table 4.5 Bending Demands on the Wingwall Structure for Location1
Location 1 Force-R Moment S
Moment T
Stress Demand
Stress Capacity
Element group 2 Lbs lbs-in lbs-in ksi ksi 36 -IN PIPE 4.68E+05 7.99E+06 2.91E+06 15.9 50 30 -IN PIPE 1.18E+05 8.18E+06 1.60E+06 16.6 50 30 -IN PIPE 1.64E+05 1.98E+07 6.63E+06 43.2 50 30 -IN PIPE 1.89E+05 1.98E+07 8.65E+06 46.6 50 Element group 3 W36x160 9.36E+04 1.63E+06 1.32E+06 31.9 46 HSS12x12x5/8 5.63E+04 6.26E+04 3.76E+06 43.0 46 W36x160 2.90E+04 3.91E+06 2.33E+05 12.6 46 HSS12x12x5/8 2.97E+04 2.32E+04 6.14E+06 68.0 46 Element group 8 Truss 3.65E+04 20.7 36
Table 4.6 Bending Demands on the Wingwall Structure for Location2
Location 2 Force-R Moment S
Moment T Demand
Stress Capacity
Element group 2 Lbs lbs-in lbs-in ksi ksi 36 -IN PIPE 4.61E+05 7.91E+06 2.90E+06 15.7 50 30 -IN PIPE 6.19E+04 8.74E+06 1.41E+06 16.6 50 30 -IN PIPE 7.29E+04 2.50E+07 1.00E+07 55.7 50 30 -IN PIPE 7.03E+04 1.68E+07 1.01E+07 42.8 50 Element group 3 W36x160 9.30E+04 1.62E+06 1.31E+06 31.7 46 HSS12x12x5/8 5.60E+04 6.27E+04 3.69E+06 42.2 46 W36x160 4.20E+04 5.42E+06 2.86E+05 16.7 46 HSS12x12x5/8 3.08E+04 2.51E+04 6.06E+06 67.3 46 Element group 8 Truss 3.95E+04 22.4 36
53

Table 4.7 Bending Demands on the Wingwall Structure for Location3
Location 3 Force-R Moment S
Moment T Demand
Stress Capacity
Element group 2 lbs lbs-in lbs-in ksi ksi 36 -IN PIPE 4.72E+05 8.59E+06 2.10E+06 15.7 50 30 -IN PIPE 1.25E+05 7.24E+06 1.88E+06 15.6 50 30 -IN PIPE 1.23E+05 1.69E+07 5.25E+06 36.1 50 30 -IN PIPE 1.89E+05 1.62E+07 9.78E+06 42.8 50 Element group 3 W36x160 9.52E+04 2.44E+06 1.23E+06 31.6 46 HSS12x12x5/8 5.50E+04 1.16E+05 4.33E+06 49.8 46 W36x160 5.33E+04 4.15E+06 3.30E+05 15.5 46 HSS12x12x5/8 2.32E+04 7.42E+04 6.17E+06 68.8 46 Element group 8 Truss 1.30E+04 7.4 36
Table 4.8 Bending Demands on the Wingwall Structure for Location4
Location 4 Force-R Moment S
Moment T Demand
Stress Capacity
Element group 2 lbs lbs-in lbs-in ksi ksi 36 -IN PIPE 4.87E+05 8.87E+06 2.31E+06 16.4 50 30 -IN PIPE 7.32E+04 9.35E+06 1.17E+06 17.3 50 30 -IN PIPE 9.78E+04 2.21E+07 8.55E+06 49.0 50 30 -IN PIPE 8.35E+04 2.07E+07 1.15E+07 51.4 50 Element group 3 W36x160 9.94E+04 2.52E+06 1.33E+06 33.8 46 HSS12x12x5/8 5.75E+04 1.11E+05 4.40E+06 50.6 46 W36x160 4.82E+04 6.79E+06 2.83E+05 19.3 46 HSS12x12x5/8 2.60E+04 7.15E+04 6.40E+06 71.3 46 Element group 8 Truss 1.19E+04 6.8 36
Note:
Force-R: Axial force of the member; Moment-S: Moment along the member major axis; Moment-T: Moment along the member minor axis.
54

4.4 Static Analysis of Rubbing Block Model with Hollow Section Rubbing Blocks
In order to refine the rubbing block model, static analyses were performed. A static
model was needed since the computer was not capable of performing a dynamic analysis on
the wingwall structure that included the detailed cross section of the hollow WPC members.
The vessel model was deleted and the Transient Dynamics Module was switched to the
Statics Module. Contact locations 1 to 5 were used with the timber and WPC rubbing blocks
for the static analysis. The maximum rubbing block contact forces from the dynamic
analyses were applied to the individual rubbing block with the largest demand. The loads
in both the perpendicular and parallel directions were distributed onto 12” x 11.94” area of
the rubbing blocks based on the 12” high dimension of the rub rail and the 11.94” dimension
of the rubbing block width. The maximum displacements from the static analysis are listed
in Table 4.9 and compared with the maximum displacements from the dynamic analysis.
Table 4.9 Comparison of Static Displacements With Dynamic Displacements
TCFX TCFY X-DIS D Y-DIS D X-DIS S Y-DIS S kips kips in in in in Location 1 385 162 17.93 6.32 20.53 6.15 Location 2 397 166 17.12 6.14 19.63 5.79 Location 3 373 144 16.22 6.98 16.08 6.82 Location 4 412 159 15.87 7.09 16.42 7.15
Note: TCFX: Total perpendicular contact forces TCFY: Total parallel contact forces X-DIS D: Maximum perpendicular displacement form dynamic analysis Y-DIS D: Maximum parallel displacement form dynamic analysis X-DIS S: Maximum perpendicular displacement form static analysis Y-DIS S: Maximum parallel displacement form static analysis
55

The static displacements were similar to the dynamic displacements. Depending on
the contact location, the static and dynamic analyses agreement varied. Overall, the results
show that the dynamic analysis could be approximately represented by the static analysis
using the loads from the dynamic analysis. The time history plot of contact forces was
spread over several seconds, therefore, the static analysis approximation was able to be used.
The analysis for PVC, PP (870) and Douglas Fir rubbing blocks converged while the analysis
for the HDPE and PP (507) did not converge. This was likely due to the HDPE and PP
(507) materials being too flexible, leading to large deformations and instability. For the
three converged solutions, the bending and effective stress distributions on the rubbing
blocks are shown in Figure 4.10- Figure 4.15.
Figure 4.9 Static Analysis Finite Element Model.
56

Figure 4.10 Effective Stress Distributions for Douglas Fir Rubbing Blocks.
(Triangle shows location of maximum value)
Figure 4.11 Effective Stress Distributions for PVC Rubbing Blocks.
57

Figure 4.12 Effective Stress Distributions for PP870 Rubbing Blocks.
58

Figure 4.13 Bending Stress Distributions for Douglas Fir Rubbing Blocks.
Figure 4.14 Bending Stress Distributions for PVC Rubbing Blocks.
59

Figure 4.15 Bending Stress Distributions for PP870 Rubbing Blocks.
The stress distributions were similar for the timber and the WPC rubbing blocks
except for the stress concentrations around the WPC section voids. The maximum stresses
for each rubbing block are shown in Table 4.10. For the three converged solutions, models
were also revised so that stresses of the front 1/3 part of the cross section could be displayed
and averaged (see Figure 4.16).
60

Figure 4.16 Front Third of Section that is Contacted by the Vessel and the Remainder of the
Cross Section.
The stresses on all the nodes in the front third of the section were exported and an
average stress value was obtained. The results are listed in Table 4.10. The demands on the
front third section of the rubbing blocks was monitored to determine how localized the large
stress demands were on the rubbing blocks. Even though the average stress over the front
third of the section was approximately 1/2 to 1/3 of the maximum stress on the face of the
section, the stresses were still significantly larger than the design level stresses.
61

Table 4.10 Maximum Effective and Bending Stresses from Dynamic Analyses and the Average Stresses for the Front Third Section of the Rubbing Blocks from Static Analyses
Estress ksi
Bstress ksi
Front 1/3 Estress ksi
Front 1/3 Bstress ksi
Allowable Stress ksi
Douglas Fir 15.8 19.1 6.5 5.2 1.6
PP(870ksi) 10.5 12.8 6.9 4.7 1.1
PVC 9.9 12.1 6.5 4.2 1.5
PP(507ksi) 8.5 10.3 N/A N/A N/A
HDPE 7.3 8.9 N/A N/A N/A
4.5 Mass and Berthing Velocity Variation Study
The berthing velocity of the vessel used for analysis was 2.5ft/sec, as specified by
WSDOT. The influence of velocity and mass variations were studied to determine the
maximum vessel demand the rubbing blocks could withstand while remaining elastic. For
this study, the berthing velocity was changed to 1.5ft/sec, 1ft/sec and 0.5ft/sec. The
structural demands and the ratio between the demands for the changed velocity and original
velocity are listed in Table 4.11. This study is based on a contact location at Elevation 22.4’.
For mass variation, new models were created in which the mass was changed to 1/4, 1/9, and
1/16 of the original mass. Table 4.12 shows the new structural demands and the ratio
between the demands for the changed mass and original mass. This study is based on a
contact location at Elevation 7.375’ for PVC rubbing blocks.
62

Table 4.11 Wingwall Demands Due to Velocity Variation
Velocity ft/sec CFX (kips) CFY (kips) Estress (ksi) Bstress (ksi) 2.5 252 106 9.6 11.8
1.5 156 64.6 5.8 7.1
1.0 131 52.1 4.7 5.4
0.5 60 24.6 2.3 2.8 Velocity/2.5 CFX/252 CFY/106 Estress/9.6 Bstress/11.8 100.00% 100.00% 100.00% 100.00% 100.00% 60.00% 61.90% 60.94% 60.42% 60.17% 40.00% 51.98% 49.15% 48.96% 45.76% 20.00% 23.81% 23.21% 23.96% 23.73%
Table 4.12 Wingwall Demands Due to Mass Variation
Mass CFX (kips) CFY (kips) Estress (ksi) Bstress (ksi) 1/16 59.1 24.6 2.8 3.6
1/9 91 38 3.4 4.3
1/4 144 58 5.1 5.9
1 265 112 9.8 11.9 Sqrt(Mass/1) CFX/265 CFY/112 Estress/9.8 Bstress/11.9 25.00% 22.30% 21.96% 28.57% 30.25% 33.33% 34.34% 33.93% 34.69% 36.13% 50.00% 54.34% 51.79% 52.04% 49.58% 100.00% 100.00% 100.00% 100.00% 100.00%
Based on the values listed above, the vessel impact demand on the rubbing blocks has a
linear relationship with velocity and a square root relationship with the mass. The berthing
demand variation with mass and velocity correlated well with the following work-energy
relationship:
21/ 2 1/ 2 *mv F D=
where,
m= mass of berthing vessel;
63

v= vessel berthing velocity;
F= maximum contact forces;
D= maximum rubbing block deflection.
Change of velocity is squared thus influencing both F and D in a linear relationship while
change of mass is not squared, resulting in a square root relationship. In order to maintain
an elastic response of the wingwall structure, the berthing velocity needs to be decreased
from 2.5 ft/sec2. The required reduced velocities based on demand/capacity ratios for the
maximum stress on the rubbing block and the stress averaged over the front 1/3 of the
rubbing block cross section are listed in Table 4.13. These values are assuming a 45-degree
berthing angle.
Table 4.13 Berthing Velocities to Maintain Elastic Response of the Rubbing Blocks (ft/sec)
Velocity based on Bstress (ft/sec)
Velocity based on average Bstress over the front 1/3 of the rubbing block (ft/sec)
Douglas Fir 0.21 0.77 PP(870ksi) 0.21 0.59 PVC 0.31 0.89
4.6 Assessment of WPC Rubbing Block
In all the ferry vessel/wingwall berthing analyses, the rubbing block demand/capacity
ratios significantly exceeded one. However, due to the acceptable performance of timber
rubbing blocks in existing marine fenders, WPC rubbing blocks demand/capacity ratios
equivalent or superior to the timber rubbing blocks based on analytical (demand) and
experimental (capacity) testing can be considered an appropriate alternative. Depending on
the WPC rubbing block material formulation, the WPC alternatives either displayed lower or
64

similar demand/capacity ratios to the preservative-treated timber rubbing blocks. Of the
four WPC formulations analyzed, the PVC resulted in the lowest demand/capacity ratios,
with the PP870 having the next lowest demand/capacity ratios. Although the PVC
formulation resulted in lower demand/capacity ratios than PP870, the PP870 formulation
may be a more appropriate alternative for the preservative-treated timber rubbing blocks
since the PP870 formulation is more ductile than the PVC formulation. The final WPC
formulation is likely to vary from the WPC formulations used in this research. Regardless
of the WPC material choice, full scale experimental testing of the WPC rubbing blocks is
necessary to validate the design capacity assumptions and for comparison with the timber
design capacities.
65

CHAPTER 5
EXPERIMENTAL TEST PROTOCOL
Full scale experimental testing of the wingwall rubbing blocks is planned for the near
future. The rubbing block dynamic analyses were based on the structural demand from a
6184 ton ferry vessel with a berthing velocity of 2.5 ft/sec and a berthing angle of 45 degrees.
This research showed that the ferry vessel berthing demand on the wingwall rubbing blocks
takes place over several seconds. Since the dynamic loading spreads out over 2-3 seconds,
static loading based on the dynamic analysis demands can be used to approximate the
berthing demand on the rubbing blocks. The magnitudes of the ferry vessel berthing loads
varied due to change in the vessel weight and vessel berthing velocity. The vessel berthing
demand on the rubbing blocks has a linear relationship with velocity and a square root
relationship with the mass (see page 63).
Location 1 (see Figure 4.6) is the contact location with the highest structural demand
from the dynamic analyses. The magnitudes of the ferry vessel berthing load application
for the timber rubbing block perpendicular force, the timber rubbing block parallel force, the
PP870 rubbing block perpendicular force and the PP870 rubbing block parallel force were
333 kips, 132 kips, 288 kips and 112 kips, respectively. The rates of the ferry vessel
berthing load application for the timber rubbing block perpendicular force, the timber
rubbing block parallel force, the PP870 rubbing block perpendicular force and the PP870
rubbing block parallel force were 264 kips/sec, 112 kips/sec, 176 kips/sec and 74 kips/sec,
respectively. Since this loading rate is beyond the capacity of typical experimental loading
equipment, a slower loading rate will be used for the rubbing block testing. Due to the
66

absence of dynamic loading during the rubbing block experimental testing, the rubbing block
capacities will be conservatively assessed.
Figure 5.1 shows the moment distribution along the rubbing block with the largest
demand from the ferry vessel berthing. The bending moment diagrams show that three
spans of the rubbing block will be sufficient to approximate the continuous beam behavior of
the rubbing blocks. Table 5.1 lists the moment and displacement values at nodes 1-5 as
shown in Figure 5.1 (a). The displacement profile for nodes 1-5 is displayed in Figure 5.2.
Figure 5.3 shows the proposed test setup for the WPC rubbing blocks. When the ferry
vessel berths, the 1-foot high rub rail of the vessel contacts the rubbing blocks of the
wingwall. Therefore the experimental static load should be applied in the form of a 12” x
11.94” pressure load. In order to simulate the support of the rubbing block by the rest of
the wingwall structure, the WPC rubbing block should be bolted to a member with the same
width as a W36x160 flange, representing the horizontal members directly supporting the
rubbing blocks (see Figure 3.8). The members representing the W36x160 sections should
be simply supported at both ends with a length that results in the stiffness of each support
marked in Figure 5.3, K1-K4. . The stiffness of each support was calculated using the global
static finite element model by applying a unit load at a given support and dividing the load
by the deflection.
67

(a) Douglas Fir-Bending Moment-S
(moment parallel to the plane of the wingwall)
(b) Douglas Fir-Bending Moment-T (moment perpendicular to the plane of the wingwall)
(b) PP870-Bending Moment-S
(moment parallel to the plane of the wingwall)
(c) PP870-Bending Moment-T
(moment perpendicular to the plane of the wingwall)
Figure 5.1 Bending Moment Diagram of the Member with Maximum Demand.
68

Table 5.1 Moment and Displacement Values of Nodes 1-5 Marked in Figure 5.1 (a)
Node Moment-S Moment-TGlobal X
Displacement Global Y
Displacement kips*ft kips*ft in in Douglas Fir 1 0 0 26.2 4.0
2 196.1 68.6 25.5 4.0 3 77.6 27.2 24.4 3.9 4 22.1 7.8 22.7 3.8 5 6.3 2.2 21.0 3.6
PP870 1 0 0 21.8 3.6 2 159.2 60.4 21.4 3.6 3 63.0 23.9 20.4 3.4 4 18.0 6.8 18.9 3.3 5 5.1 2.0 17.5 3.1 Note: Moment-S: Moment parallel to the plane of the wingwall; Moment-T: Moment perpendicular to the plane of the wingwall.
Figure 5.2 Rubbing Block Displacement Profile.
69

Figure 5.3 Rubbing Block Test Setup.
70

CHAPTER 6
CONCLUSION AND RECOMMENDATION
Treated timbers have been the primary choice for rubbing blocks in marine fender
systems. As the first point of contact between the vessels and the fender structures, rubbing
blocks are required to distribute the vessel berthing load, and, if necessary, act as a fuse to
protect the rest of the structure from permanent damage. Timber rubbing blocks have
performed as intended, with periodic replacement required due to vessel overloading or
connection deterioration. However, due to increased environmental concerns and the desire
for longer service life, new wood plastic composite (WPC) materials are being developed to
replace existing timber members in marine applications.
This research focused on providing WPC alternatives to timber rubbing blocks in
wingwall structures. Dynamic Finite Element analysis of ferry vessel berthing into the
Friday Harbor Ferry Terminal wingwall structure was performed using ADINA to investigate
the response of the rubbing blocks. Five rubbing block materials were studied: [1]
Structural Select Douglas Fir, [2] Polyvinyl Chloride (PVC), [3] Polypropylene (E=870ksi)
(PP870), [4] Polypropylene (E=507ksi) (PP507), and [5] High-Density Polyethylene
(HDPE).
The time history of the ferry vessel berthing demands on the wingwall rubbing blocks
was compared for each material, based on a 2.5 ft/sec velocity of the largest vessel in the
Washington State Ferry (WSF) fleet as specified by the Washington State Department of
Transportation (WSDOT). Due to continual change in the tidal flow and the vessel
approach position, numerous contact locations were investigated. Variation in the ferry
71

vessel contact location on the wingwall structure did not result in significant change in the
rubbing block demands.
The berthing demands on the rubbing blocks exceeded the design capacities for all
five materials in each analysis. Since the rubbing blocks have performed well over time,
WSDOT does not require that the design capacity of the blocks exceed demands based on a
berthing velocity for the largest vessel in the WSF fleet of 2.5ft/sec2. This under design of
the rubbing blocks has an implicit benefit of allowing the rubbing blocks to serve as
structural fuses for the rest of the wingwall, failing under excessive berthing loads, and
thereby, protecting the rest of the structure from significant damage. The combination of
the typical berthing velocity being close to 0.5 ft/sec2, rather than the WSDOT design value
of 2.5ft/sec2 , and the safety factors used in the design of timber/WPC members has allowed
the rubbing blocks to elastically resist berthing demands in most cases.
A contact angle of 45 degrees was assumed for the majority of the analyses. In
addition, a larger contact angle of 60 degrees (with respect to the plane of the wingwall) was
investigated to determine the contact angle influence on structural demands. However, due
to additional dolphin members used to guide the vessels during landing, approach angles are
not expected to wander significantly from 45 degrees. Mass and berthing velocities were
also varied to determine their influence on the wingwall structure. The vessel berthing
demand on the rubbing blocks was linearly related to the vessel velocity and had a square
root relationship with the mass of the vessel. These relationships also agree with basic
energy principles.
This research showed that the WPC members can serve as alternatives for the
72

preservative-treated timber rubbing blocks in ferry landing wingwall structures. Based on
dynamic analysis of the ferry vessel berthing with the wingwall structures, WPC rubbing
blocks experienced similar demand/capacity ratios to the timber rubbing blocks while
offering both environmental and service life advantages. In order to choose the appropriate
WPC material formulation and confirm design capacities assumed in this research, full scale
testing of the WPC rubbing blocks is necessary.
73

REFERENCES: ADINA User Interface Users Guide, 2001. Andrew Edward Slaughter, 2004. “Design and Fatigue of a Structural Wood-Plastic
Composite,” Thesis, Washington State University, Pullman, Washington 99164. Charles T. Jahren and Ralph Jones, 1993. “Ferry Landing Design Phase 1.” Final Technical
Report. Charles T. Jahren, Steve Margaroni and Adele Sarpelli, 1994. “Design Criteria For Outer
Structures at Ferry Landings.” Final Report. Dimitris P. Servis and Manolis Samuelides, 1999. “Ship Collision Analysis Using Finite
Elements.” SAFER EURORO Spring Meeting, Nantes. Ed Kiedaisch, 1991. “Minimizing Dock Costs with Proper Fender Selection.” American
Association of Port Authorities Technical Seminar. Gary R. Consolazio and David R. Cowan, 2003. “Nonlinear Analysis of Barge Crush
Behavior and its Relationship to Impact Resistant Bridge Design.” Computers and Structures 81 547-557.
Joseph E, Bowles, 1996. Foundation Analysis and Design, 5th ed., McGraw-Hill. Kevin Jerome Haiar, 2000. “Performance and Design of Prototype Wood-Plastic Composite
Sections.” Thesis, Washington State University, Pullman, Washington 99164. Monique E. Paynter and David I. McLean, 2001. “Engineering Wood Composites for Naval
Waterfront Facilities, Review of Existing Fender Systems, Structural Analysis and Design,” Identify Candidate Components and Systems, Task 1A. Project End Report.
Robert D. Cook, David S. Malkus, Michael E Plesha and Robert J. Witt, 2001. Concepts and
Applications of Finite Element Analysis, 4th ed., John Wiley & Sons, Inc. Theory and Modeling Guide Volume I: ADINA, 2001. William F. Cofer, David I. McLean, Monique E. Paynter and Hughes Wang, 2001.
“Engineering Wood Composites for Naval Waterfront Facilities, The Structural Evaluation of Wood-Based Fender Systems Structural Analysis and Design.” Develop Performance Criteria, Task 1B. Project End Report.
74

William F. Cofer, David I. McLean, Monique E. Paynter and Hughes Wang, 1998. “Engineering Wood Composites for Naval Waterfront Facilities, The Development and Verification of Finite Element Models to Optimize the Design of Wale/Chock Structural Sections.” Develop Prototype Non-Reinforced Components-Wales/Chocks, Task 1C. Yearly Report.
75