dynamic 3d representation of information using low … 3d representation of information using low...
TRANSCRIPT

George Mourafetis, Charalabos Ioannidis, Anastasios Doulamis, Chryssy Potsiou (Greece) (7519)
Dynamic 3D representation of information using low cost Cloud ready Technologies
FIG Working Week 2015
From the Wisdom of the Ages to the Challenges of the Modern World
Sofia, Bulgaria, 17 – 21 May 2015
1/20
Dynamic 3D representation of information using low cost Cloud ready
Technologies
George MOURAFETIS, Charalabos IOANNIDIS, Anastasios DOULAMIS, Chryssy
POTSIOU, Greece
Key words: Dynamic representation, 3D visualization, Cloud platform, Low cost, DTM
SUMMARY
3D representation of objects and territories has been an everyday reality almost for
everything. Software such as Google Earth and Google Maps has spatially enabled almost
every aspect of our lives thus enhancing the way we deal with and use information. 3D
visualization requires expensive software and hardware especially in cases where a large
amount of data needs to be represented. Furthermore, most software available can handle only
static pre-processed data, when used for 3D visualisation, and cannot produce a seamless and
integrated outcome when the level of detail of the data changes rapidly. In this paper a low
cost and efficient way of displaying dynamic 3D information and basemaps that may be used
in various cases including displaying cadastral information is proposed. Furthermore a
mechanism for dynamically updating Digital Terrain Models which are used in order to
display the 3D information is also proposed. The efficiency of the technique is demonstrated
with an actual example developed in C++, .NET and OpenGL. Various improvements have
been tested with the use of Assembly language and SSE2 instructions. Data management and
representation of 3D information is a demanding process that usually has a great cost and is
difficult to implement and maintain. In the era of Information Technology, the CLOUD has
come to offer powerful infrastructures with low cost leading many public and private
companies to adapt this concept. The technics described in this paper can be easily transferred
on the CLOUD platform to massively provide 3D visualization for the scope of cadastral and
other purposes.

George Mourafetis, Charalabos Ioannidis, Anastasios Doulamis, Chryssy Potsiou (Greece) (7519)
Dynamic 3D representation of information using low cost Cloud ready Technologies
FIG Working Week 2015
From the Wisdom of the Ages to the Challenges of the Modern World
Sofia, Bulgaria, 17 – 21 May 2015
2/20
Dynamic 3D representation of information using low cost Cloud ready
Technologies
George MOURAFETIS, Charalabos IOANNIDIS, Anastasios DOULAMIS, Chryssy
POTSIOU, Greece
1. INTRODUCTION
3D representation has been in the foreground for many years. Today almost every computer
and console game is 3D based. Software and hardware have been optimized in order to
provide the fastest and most realistic 3D visualization possible. Computer graphic cards have
great power and are able to handle 3D models with billions of triangles. Many aspects of our
daily activities have been enhanced with 3D visualization beginning with movies and
televisions capable of reproducing 3D content. Game consoles provide 3D representation with
either the use of special glasses or even with the naked eye.
In Cadastre the Land Administration Domain Model (LADM, ISO 19152) provides support
for 3D representations and has been proposed as the framework on which a 3D cadastre
should be based (http://www.gdmc.nl/3dcadastres/). There are several 3D Cadastre scoping
options, which need to be investigated in more detail, and the result will define the scope of
the future 3D Cadastre in a country: what are the types of 3D cadastral objects that need to be
registered? Are these always related to (future) constructions (buildings, pipelines, tunnels,
etc.) as in Norway and Sweden or could it be any part of the 3D space, both airspace or in the
subsurface as in Queensland, Australia? In case of subsurface infrastructure objects, such as
long tunnels (for roads, metro, train), pipelines, cables: should these be divided based on the
surface parcels (as in Queensland, Australia) or treated as one cadastral object (as in Sweden).
In case of subdivision, note that all parts rights should be associated. For the representation of
a 3D cadastral object, is the legal space specified by its own coordinates in a shared reference
system (as is the practice for 2D in most countries) or is it specified by referencing existing
topographic objects/boundaries (as in the 'British' style of a cadastre)?
Note that there can be a difference between the 3D ownership space and the 3D restriction
space; e.g. one can be owner up to ±100 m around the earth surface, but only allowed to build
from -10 to +40 m. Both result in 3D parcels, that is, 3D spatial units with RRRs (Right,
Responsible, Restriction) attached. The ownership spaces (parcels) should not overlap other
ownership parcels, but they are allowed to overlap other space; e.g., restriction parcels.
Expensive software and hardware should be available in order to implement a 3D
visualization of a 3D Cadastre. Furthermore the software has to be customized to meet the
needs of each case, since there are various differences between the ways each Cadastre deals
with 3D. The common base between all the different approaches is that one needs a basemap
and a framework to draw on it. Another common requirement is that the representation should
be available for a whole country, which is something quite big in terms of storage, computing
and ultimately cost (Peng et al., 2004). Furthermore, Cadastre is a live institution which
means that new measurements are being incorporated every minute. The measurements on the
other hand are very precise to the level of centimetres. The system should be able to support
both the update of the measurements and the precision required for Cadastral applications.

George Mourafetis, Charalabos Ioannidis, Anastasios Doulamis, Chryssy Potsiou (Greece) (7519)
Dynamic 3D representation of information using low cost Cloud ready Technologies
FIG Working Week 2015
From the Wisdom of the Ages to the Challenges of the Modern World
Sofia, Bulgaria, 17 – 21 May 2015
3/20
This paper proposes an implementation method for creating an API (Application Programing
Interface) which can be used to 3D visualize large datasets (e.g., country-wide) with very low
cost and high precision. Additionally an algorithm is introduced in order to provide the ability
to dynamically update elevation data so that very accurate and time shifting representations
can occur. The scope of the algorithm is to smoothly update elevation data of tiles in order to
provide the best viewing experience to the observer while not utilizing many hardware
resources. Practically the API could be used to create a system where elevation information is
continuously updated to provide more accurate measurements while the users could see the
changes in real time without any impact on the viewing experience. The proposed algorithm
provides the following major innovations:
– The 3D information can be viewed by many users and can be extremely detailed in terms
of accuracy without the need of expensive infrastructure (software or hardware).
– The elevation information changes, in terms of accuracy, at different scales while still
maintaining its topology and thus providing smooth rendering when changing from one
scale to another.
– Innovative optimizations have been developed (Assembly Language) in order to accelerate
commonly used routines thus contributing by lowering the minimum hardware
requirements of the algorithm.
1.1 Existing virtual globe software - Related Work
Three dimensional representation of the world was widely introduced to the public by
NASA’s World Wind in mid-2004. Since then many virtual globe software has arise
providing various capabilities including visualizing custom 3D Content. All the relative
software developed was able to visualize in three dimensions both basemaps and structures,
but most of them were using static data, could not be customized to great extent and did not
provide the accuracies needed for Cadastral applications.
As more and more high resolution satellite imagery become accessible for free, many of the
latest online virtual globes are built to fetch and display these images
(http://en.wikipedia.org/wiki/Google_Earth; http://en.wikipedia.org/wiki/Virtual_globe;
http://en.wikipedia.org/wiki/List_of_3D_graphics_libraries;
http://www.brighthub.com/internet/google/articles/61335.aspx?cid=parsely_rec):
– NASA World Wind uses USGS topographic maps and several satellite and aerial image
datasets; it is the first popular virtual globe along with Google Earth; World Wind is open-
source software.
– CitySurf Globe has fast adaptation and transfer secured data due to special data storage
structure, dynamic spatial data editing on 3D client monitor, data stored in Oracle SDO or
PostGIS, flexible authorization models for different user groups (Lightweight Directory
Access Protocol and Active Directory support), excellent quality and fast 2D rendering.
– Bing Maps 3D interface runs inside Internet Explorer and Firefox, and uses NASA Blue
Marble: Next Generation.
– Worldwide Telescope features an Earth mode with emphasis on data import/export, time-
series support and a powerful Tour authoring environment.
– Google Earth uses satellite and aerial imagery datasets (including
commercial DigitalGlobe images) with international road dataset; it is the first popular

George Mourafetis, Charalabos Ioannidis, Anastasios Doulamis, Chryssy Potsiou (Greece) (7519)
Dynamic 3D representation of information using low cost Cloud ready Technologies
FIG Working Week 2015
From the Wisdom of the Ages to the Challenges of the Modern World
Sofia, Bulgaria, 17 – 21 May 2015
4/20
virtual globe along with NASA World Wind.
– Marble is part of the KDE (K Desktop Environment), with data provided
by OpenStreetMap, as well as NASA Blue Marble: Next Generation and others; Marble
is open-source software.
– OpenWebGlobe is a virtual globe SDK (Software Development Kit) written
in JavaScript using WebGL.
– Cesium is a WebGL virtual globe and map engine; Cesium is open-source software.
– ArcGIS Explorer is a lightweight client for ArcGIS Server, supports WMS and many
other GIS file formats.
– EarthBrowser is an Adobe Flash/AIR-based virtual globe with real-time weather forecasts,
earthquakes, volcanoes, and webcams.
– Earth3D is a program that visualizes the Earth in a real-time 3D view; it uses data from
NASA, USGS, the CIA and the city of Osnabrück and is open-source software.
– NORC is a street view web service for Central and Eastern Europe.
– MapJack is a map feature covering areas in Canada, France, Latvia, Macau, Malaysia,
Puerto Rico, Singapore, Sweden, Thailand, and the United States.
– Bhuvan is an India-specific virtual globe.
– driveme.in is a street view application for India.
The current virtual globe software focuses on creating an earth-like sphere and projecting 3D
content on that. This narrows down the possible levels of accuracy since a geographic, and not
a projected spatial reference, is used. Furthermore most software is not designed as API and
cannot be fully customized.
All the existing software has a way of dealing with more accurate both elevation and imagery
data when one zooms in further. The approach varies according to the software and ranges
between a gradual change of information with no information correlation to a fully mixed
result that changes progressively according to data used. None of these software reach the
accuracy levels that Cadastre requires. The amount of data required for displaying high
accuracy Cadastre information and the processing power of the CPU would make most of
these programs unusable. This paper proposes an algorithm that can be used to represent high
levels of accuracy without the need of great processing power or amount of data.
2. FRAMEWORK
Most of the current virtual globe projects have the concept of dealing with static data
projected on a sphere (Rocca et al., 2013). A sphere is not a very good representation of earth
because earth actually is not a perfect sphere. Furthermore current virtual globes are focused
in representing Earth as a whole planet thus not providing the accuracy needed for cadastral
and topographic applications. The current paper focuses on producing a 3D model based on a
projected coordinate system so that it can easily be used for measurements.

George Mourafetis, Charalabos Ioannidis, Anastasios Doulamis, Chryssy Potsiou (Greece) (7519)
Dynamic 3D representation of information using low cost Cloud ready Technologies
FIG Working Week 2015
From the Wisdom of the Ages to the Challenges of the Modern World
Sofia, Bulgaria, 17 – 21 May 2015
5/20
Figure 1. Workflow of the proposed algorithm
2.1 Key parts of implementation
Since the scope of the paper is to create a 3D engine in order to be used for Cadastral or other
representations, this engine must be accurate enough in order to support this kind of
information. The accuracy expected in these cases may be at the order of few centimetres
(pixel size) which leads in a huge and difficult-to-handle elevation model.
The quality of visualization of the basemap in 3D space is depending on both image and
elevation quality. The major parameter of the elevation quality is the density of the DTM
within a certain area; the denser elevation points, and the more real visualization of the
morphological features. For the realistic visualization of a high mountain, while viewing it
from above, many elevation points of the whole mountain are needed which would be very
difficult to handle. In reality dense elevation points are only needed for visualizing the top of
the mountain which is near to the observer’s eye while the bottom of the mountain may have a
Get image tiles and
elevations for the
smallest scale
visible at current
extents and scale
Based on tiles of smaller scale get the next
larger scale and get the respective image tiles
and elevations
Calculate new elevations for the tiles of the
smaller scale and all the previous sub tiles and
neighbours of current and smaller scales
Does a largest
scale exist?
YES
NO
Proceed to rendering process
(as described in Figure 10)
Are more data
needed
( because of pan or
change of scale)?
YES
NO

George Mourafetis, Charalabos Ioannidis, Anastasios Doulamis, Chryssy Potsiou (Greece) (7519)
Dynamic 3D representation of information using low cost Cloud ready Technologies
FIG Working Week 2015
From the Wisdom of the Ages to the Challenges of the Modern World
Sofia, Bulgaria, 17 – 21 May 2015
6/20
less precise elevation model without the observer ever noticing because of the distance
between him and the bottom of the mountain.
The proposed algorithm (Figure 1) is a mechanism for merging elevation models of different
levels of details (LoD) in order to:
– give a realistic visualization experience
– use as few points as possible so that the GPU, CPU and network utilization will be low
– dynamically change the model used according to the observer’s position and viewing
direction (Pajarola and Gobbetti, 2007).
2.1.1 Process narrative
In order to dynamically process different pieces of information several approaches have been
made in the past which are divided into those that use grid based techniques (Jenny et al.,
2011) and those that do not use such techniques (Tevs et al., 2008; Kalbermatten, 2011; Wan
and Chen, 2013). It is decided to follow the grid based technique and to divide the area of
interest, which in this study is Greece, into tiles for 22 scales as shown in Table 1. Each tile
will have width and height equal to 512 pixels and dpi equal to 96. For example, in scale
1:1000 one pixel on the image equals 0.264 meters (1000 pixels) in reality. Also, it is decided
that each scale is two times more precise than the previous one and two times less precise than
the next one. In this case each tile is completely divided in tiles of smaller scales and thus
allowing each sub tile to completely match a tile, in terms of extents, of a lower scale
(Cignoni et al., 2003).
SCALE ID SCALE 1: SCALE ID SCALE 1:
0 131072000 11 64000
1 65536000 12 32000
2 32768000 13 16000
3 16384000 14 8000
4 8192000 15 4000
5 4096000 16 2000
6 2048000 17 1000
7 1024000 18 500
8 512000 19 250
9 256000 20 125
10 128000 21 65.5 Table 1. Scales used for tiles
The elevation model follows the same principle and is divided according to the image tiles.
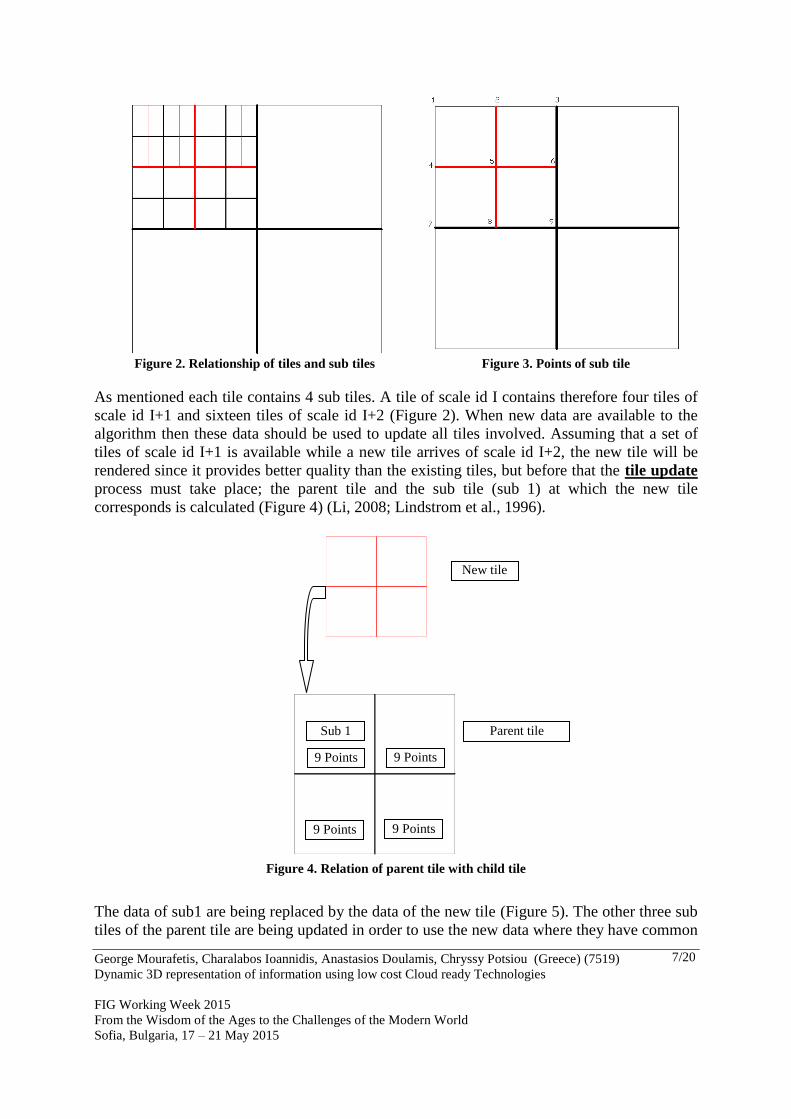
Each tile has 4 rectangle sub tiles with equal area (Figure 2). Following this structure it would
be possible to dynamically add and remove tiles in order to recreate more dense or less dense
DTMs resulting in realistic or less realistic visualization where not needed. As already
mentioned, each tile consists of four sub tiles. Each sub tile contains 9 points with X, Y, Z
information (Figure 3). The points are located at equal distances in such a way that each sub
tile is divided into 4 rectangles of equal length. This is the default information that is loaded
for a tile and is therefore mentioned as Restore Point. A restore point for a tile contains 4
times the points of a sub tile thus (4x9 =) 36 points in total.
George Mourafetis, Charalabos Ioannidis, Anastasios Doulamis, Chryssy Potsiou (Greece) (7519)
Dynamic 3D representation of information using low cost Cloud ready Technologies
FIG Working Week 2015
From the Wisdom of the Ages to the Challenges of the Modern World
Sofia, Bulgaria, 17 – 21 May 2015
7/20
Figure 2. Relationship of tiles and sub tiles Figure 3. Points of sub tile
As mentioned each tile contains 4 sub tiles. A tile of scale id I contains therefore four tiles of
scale id I+1 and sixteen tiles of scale id I+2 (Figure 2). When new data are available to the
algorithm then these data should be used to update all tiles involved. Assuming that a set of
tiles of scale id I+1 is available while a new tile arrives of scale id I+2, the new tile will be
rendered since it provides better quality than the existing tiles, but before that the tile update
process must take place; the parent tile and the sub tile (sub 1) at which the new tile
corresponds is calculated (Figure 4) (Li, 2008; Lindstrom et al., 1996).
Figure 4. Relation of parent tile with child tile
The data of sub1 are being replaced by the data of the new tile (Figure 5). The other three sub
tiles of the parent tile are being updated in order to use the new data where they have common
9 Points 9 Points
9 Points 9 Points
Sub 1 Parent tile
New tile

George Mourafetis, Charalabos Ioannidis, Anastasios Doulamis, Chryssy Potsiou (Greece) (7519)
Dynamic 3D representation of information using low cost Cloud ready Technologies
FIG Working Week 2015
From the Wisdom of the Ages to the Challenges of the Modern World
Sofia, Bulgaria, 17 – 21 May 2015
8/20
points. In case no common points exist dummy points are being calculated which contain the
average values of the elevations that are used in rendering (Figure 6).
Figure 5. Replacement of existing elevation data from a new tile
Figure 6. Calculation of dummy points with average elevation values where no points exist
The reason for which the sub tiles 2, 3 and 4 contain only 25 points instead of 36 is that only
the minimum number of points needed is used. Since Sub 1 has a denser grid, because its
points it updated with the points of the new tile, new points should be added to sub tiles 2 and
3 as they share a common edge with sub tile 1. Maintaining a standard grid for each sub tile,
the minimum number of points in order to have connected points between Sub 1 and Sub 2
and 3, is 25. Sub 4 shares a common edge with Sub 2 and Sub 3 which now have 25 points.
The minimum number of points needed is this case is again 25 in order to maintain common
points with adjacent sub tiles.
Sub 1 now
contains 36
points: 9 points
for each sub
tile
Sub 2
contains 25
points.
Sub 3
contains 25
points.
Sub 4
contains 25
points.
Sub 1
contains 36
points.
George Mourafetis, Charalabos Ioannidis, Anastasios Doulamis, Chryssy Potsiou (Greece) (7519)
Dynamic 3D representation of information using low cost Cloud ready Technologies
FIG Working Week 2015
From the Wisdom of the Ages to the Challenges of the Modern World
Sofia, Bulgaria, 17 – 21 May 2015
9/20
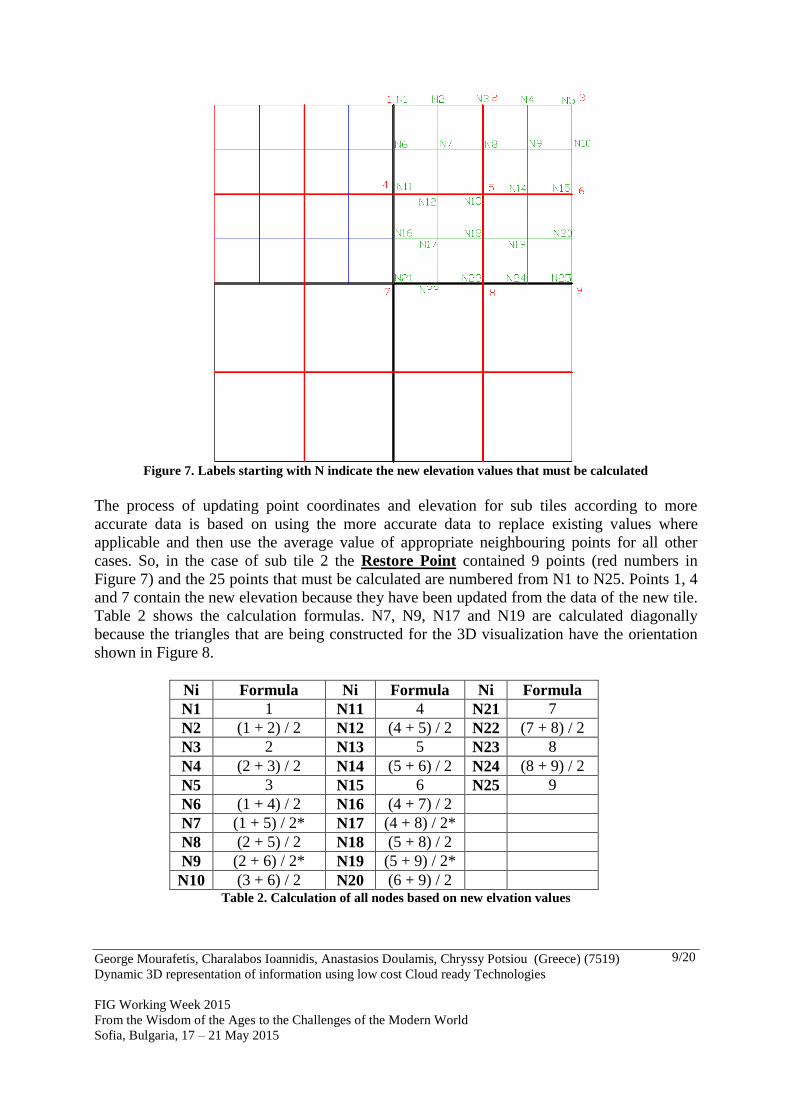
Figure 7. Labels starting with N indicate the new elevation values that must be calculated
The process of updating point coordinates and elevation for sub tiles according to more
accurate data is based on using the more accurate data to replace existing values where
applicable and then use the average value of appropriate neighbouring points for all other
cases. So, in the case of sub tile 2 the Restore Point contained 9 points (red numbers in
Figure 7) and the 25 points that must be calculated are numbered from N1 to N25. Points 1, 4
and 7 contain the new elevation because they have been updated from the data of the new tile.
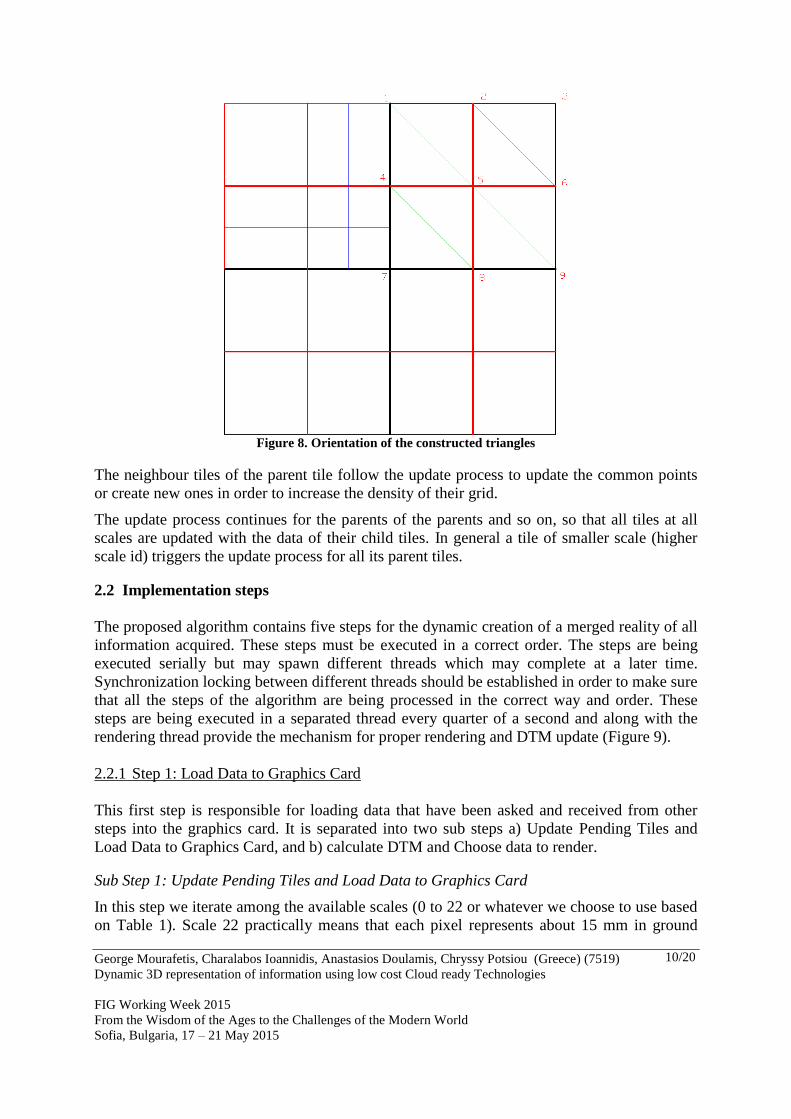
Table 2 shows the calculation formulas. N7, N9, N17 and N19 are calculated diagonally
because the triangles that are being constructed for the 3D visualization have the orientation
shown in Figure 8.
Ni Formula Ni Formula Ni Formula
N1 1 N11 4 N21 7
N2 (1 + 2) / 2 N12 (4 + 5) / 2 N22 (7 + 8) / 2
N3 2 N13 5 N23 8
N4 (2 + 3) / 2 N14 (5 + 6) / 2 N24 (8 + 9) / 2
N5 3 N15 6 N25 9
N6 (1 + 4) / 2 N16 (4 + 7) / 2
N7 (1 + 5) / 2* N17 (4 + 8) / 2*
N8 (2 + 5) / 2 N18 (5 + 8) / 2
N9 (2 + 6) / 2* N19 (5 + 9) / 2*
N10 (3 + 6) / 2 N20 (6 + 9) / 2 Table 2. Calculation of all nodes based on new elvation values
George Mourafetis, Charalabos Ioannidis, Anastasios Doulamis, Chryssy Potsiou (Greece) (7519)
Dynamic 3D representation of information using low cost Cloud ready Technologies
FIG Working Week 2015
From the Wisdom of the Ages to the Challenges of the Modern World
Sofia, Bulgaria, 17 – 21 May 2015
10/20
Figure 8. Orientation of the constructed triangles
The neighbour tiles of the parent tile follow the update process to update the common points
or create new ones in order to increase the density of their grid.
The update process continues for the parents of the parents and so on, so that all tiles at all
scales are updated with the data of their child tiles. In general a tile of smaller scale (higher
scale id) triggers the update process for all its parent tiles.
2.2 Implementation steps
The proposed algorithm contains five steps for the dynamic creation of a merged reality of all
information acquired. These steps must be executed in a correct order. The steps are being
executed serially but may spawn different threads which may complete at a later time.
Synchronization locking between different threads should be established in order to make sure
that all the steps of the algorithm are being processed in the correct way and order. These
steps are being executed in a separated thread every quarter of a second and along with the
rendering thread provide the mechanism for proper rendering and DTM update (Figure 9).
2.2.1 Step 1: Load Data to Graphics Card
This first step is responsible for loading data that have been asked and received from other
steps into the graphics card. It is separated into two sub steps a) Update Pending Tiles and
Load Data to Graphics Card, and b) calculate DTM and Choose data to render.
Sub Step 1: Update Pending Tiles and Load Data to Graphics Card
In this step we iterate among the available scales (0 to 22 or whatever we choose to use based
on Table 1). Scale 22 practically means that each pixel represents about 15 mm in ground

George Mourafetis, Charalabos Ioannidis, Anastasios Doulamis, Chryssy Potsiou (Greece) (7519)
Dynamic 3D representation of information using low cost Cloud ready Technologies
FIG Working Week 2015
From the Wisdom of the Ages to the Challenges of the Modern World
Sofia, Bulgaria, 17 – 21 May 2015
11/20
space which is quite accurate in terms of topographic measurements.
In case there are data available for a tile a check whether the data have already been loaded is
made and if not the data in the graphics card are loaded. The tile creates a Restore Point that
will be used later on if it is required to be removed. In this case the tile is looking for its
parent tile (to which is one of the four sub tiles) and updates the data of its parent tile as well.
If the parent tile is changed it is marked as updated. Then the data of its parent neighbours are
updated as well and they are marked as such.
Figure 9. Basic process flow
Data Loading Thread
Load Faces
(0)
Calculate and Get Data
Needed (0)
Load Data
Data Loading Fence
Data Loading Fence
Load Data
Data Loading Fence
Data Loading Fence
Load Data
Data Loading Fence
Data Loading Fence
Load Data to Graphics
Card (Error!
Reference source not
found.) Data Loading Fence
Data Loading Fence
Update Render Tiles
(0)
Render Fence
Render Fence
Remove Data from
Graphics Card (0)
Data Loading Fence
Data Loading Fence
Render Thread
Render
Render Fence
Render Fence

George Mourafetis, Charalabos Ioannidis, Anastasios Doulamis, Chryssy Potsiou (Greece) (7519)
Dynamic 3D representation of information using low cost Cloud ready Technologies
FIG Working Week 2015
From the Wisdom of the Ages to the Challenges of the Modern World
Sofia, Bulgaria, 17 – 21 May 2015
12/20
Sub Step 2: Calculate DTM and Choose Data to Render
In this step we iterate among the available scales (0 to 22 or whatever we choose to use).The
following cases may be considered:
- If there are data available for a tile and the tile has successfully passed sub step 1, then it
has its Proximity evaluated. The term Proximity refers to how close the tile is to the
observer (camera position). If a tile is close then it must be loaded and displayed; otherwise
it must be disposed of. This can be expressed in either absolute or relative values. Absolute
values would mean a default distance from the observer after which a tile is considered to
be too far. The disadvantage with the default distance is that it can give good results only
for specific scales. For example, for a depth of 1000 m the algorithm should use about 7
tiles of scale 1:1000, about 4 tiles of scale 1:2000, about 1 tile of scale 1:4000 and up.
Another approach would be to use the number of tiles as a proximity factor. For example, a
factor of 1 means that from the position of the observer a tile is considered to be near when
the vertical or horizontal distance from the tile that the observer is on at the same scale is
less or equal to the side of a tile at the same scale. This practice requires fewer tiles to be
loaded and provides a good visualization experience.
- If a tile is near to the observer then in case that its DTM has been updated it is recalculated
and pushed to the graphics card.
- If a tile is near to the observer then it is added to the Temporary Render List in order to
be rendered. The term Temporary Render List refers to a list that empties in every loop
of the algorithm and fills with tiles that are decided to be rendered. The list will be used in
Step 2 to update the actual list that will be used for rendering. A temporary render list is
being used because in this way the render process can run flawlessly without being
affected by delays happening from the data loading and calculations that take place in other
threads.
- If the tile is far from the observer then it is marked for deletion and not used for rendering.
2.2.2 Step 2: Update Render Tiles
In this step the algorithm uses all the tiles that have been added to the Temporary Render
List in order to replace the tiles in the Render List. This update takes place right after the
current Render Process ends and before the next Render Process begins.
The term Render List refers to a list that contains the tiles along with all the information
needed in order to be rendered by the Render Process. The term Render Process refers to a
separate process running usually on another thread that is responsible for rendering the result
on screen as fast as possible.
2.2.3 Step 3: Remove Data from Graphics Card
In this step we iterate among the available scales (0 to 22 or whatever we choose to use). If a
tile is marked for deletion then in case it contains valid data it uses the Restore Point to
recalculate its DTM. Using the Restored DTM all neighbour tiles are being recalculated and
marked in order to have its parents update their DTM as well. The parent tile updates its
DTM based on the Restored DTM. The tile’s parent uses the new DTM to update its

George Mourafetis, Charalabos Ioannidis, Anastasios Doulamis, Chryssy Potsiou (Greece) (7519)
Dynamic 3D representation of information using low cost Cloud ready Technologies
FIG Working Week 2015
From the Wisdom of the Ages to the Challenges of the Modern World
Sofia, Bulgaria, 17 – 21 May 2015
13/20
neighbours so that the whole affected area will be updated.
2.2.4 Step 4: Calculate and Get Data Needed
In this step we iterate among the available scales (0 to 22 or whatever we choose to use)
starting from higher scales (less precise) and moving towards smaller ones (more precise).
Based on the observer’s position the tiles needed for all scales that are near (Proximity
testing) the observer are calculated. The algorithm checks whether the tile is in the Data List
or already in the Fetch List at a previous iteration; in case it is not the tile is appended to the
Fetch List. The term Fetch List refers to a list which is populated with the tiles that need to
be asked from the Internet (or local storage). When a tile is fully downloaded then it is
transferred to the Data List and deleted from the Fetch List, in order to be used for loading in
the Graphics Card.
If a tile remains in the Fetch List too long without moving to the Data List then it is removed
from the Fetch List and added again. For all the tiles in the Fetch List, different processes are
spawned in order to fetch them and load data to the Data List.
2.2.5 Step 5: Load Faces
The API supports the rendering of external faces so that real life representations may be
visualized. In this step the faces are being transferred to the graphics card in groups of
predefined quantity so that they do not block the normal flow of the algorithm.
2.3 Deployment Phases
2.3.1 Phase 1: Data
Two types of data are needed in order to create the 3D basemap: the imagery and the
elevation. Both data have to be dynamically fed into the visualization software from local
storage or over the Internet. Speed of calculation is essential for the proper operation of the
proposed algorithm so there must be a way for the data to be indexed in order to provide
quick random access. As mentioned above, tiling algorithms have been used to create small
images along with elevation tiles. The size of the tiles is 512 x 512 pixels for each scale
mentioned at Table 1.
2.3.2 Phase 2: Cloud
The rendering process takes place at the client’s hardware with all the information being
stored either locally or on the Internet. All the necessary information is stored as tiles or
organised in an indexed way that can be easily downloaded from any type of web server and
with any kind of protocols (REST - Representational State Transfer; SOAP - Simple Object
Access Protocol) thus making it easy to be transferred to the Cloud. The Cloud offers many
alternatives when one wants to choose the best approach to support a service. One may
choose among PaaS (Platform as a Service), IaaS (Infrastructure as a Service), SaaS (Software
as a Service) or more.

George Mourafetis, Charalabos Ioannidis, Anastasios Doulamis, Chryssy Potsiou (Greece) (7519)
Dynamic 3D representation of information using low cost Cloud ready Technologies
FIG Working Week 2015
From the Wisdom of the Ages to the Challenges of the Modern World
Sofia, Bulgaria, 17 – 21 May 2015
14/20
As mentioned the rendering process takes place at the client’s hardware. The only thing that
needs to be provided by the server is data which are pre-processed. This can be done by any
web server supported by any Operating System which is something that widens the choices
when it comes to cloud. Furthermore it is easy to calculate the demands according to the
number of users because one can apply typical user scenarios and calculate the bandwidth and
processing power needed. Since the only thing that is needed is a web server to offer static
files, the solution may be easily scaled up or down according to the user needs which is
something that the cloud is ideal for. Furthermore, the solution may be easily migrated to
other infrastructures if such need arises. The solution is not bound to any technology or
platform and may run at any data centre.
2.3.3 Phase 3: Visualization Algorithm, Software development
The next step is the development of the software that will implement the algorithm mentioned
at section 2.2. There are many available 3D libraries that may be used to visualize 3D content
(http://en.wikipedia.org/wiki/List_of_3D_graphics_libraries). In order to support many
different operating systems and devices the development process should, if possible, use
programming languages available to all systems such as C++.
3. EXPERIMENTAL RESULTS
In order to test the proposed algorithm an example was developed using C++, .NET,
Assembly SSE2 (Streaming SIMD Extensions 2) and OpenGL (Open Graphics Library). The
example provides real time navigation over a basemap with dynamically adjusted elevation
according to the observer’s eye position and elevation. Figure 10 displays a visualization of
the elevation grid around the observer’s position. The density of the grid is adjusted so that
the greater the distance from the observer, the less the density of the elevation grid.
The equipment used was a medium level PC with an Intel Core 2 Duo E8400 @ 3.00 GHz
CPU and 3.25 GB of available RAM, graphics card NVIDIA GeForce 8400 GS 256 MB. The
test lasted for 10 minutes with a typical user scenario where the user zooms and pans at a ratio
of about once in 10 seconds. The data were delivered to the client over the Internet through a
Microsoft IIS (Internet Information Server) based web server. The maximum CPU usage was
about 30%, with an average of about 5% (Figure 11). The maximum memory used was about
90 Mb with an average of about 75 Mb. The user experience was very good with no delays.
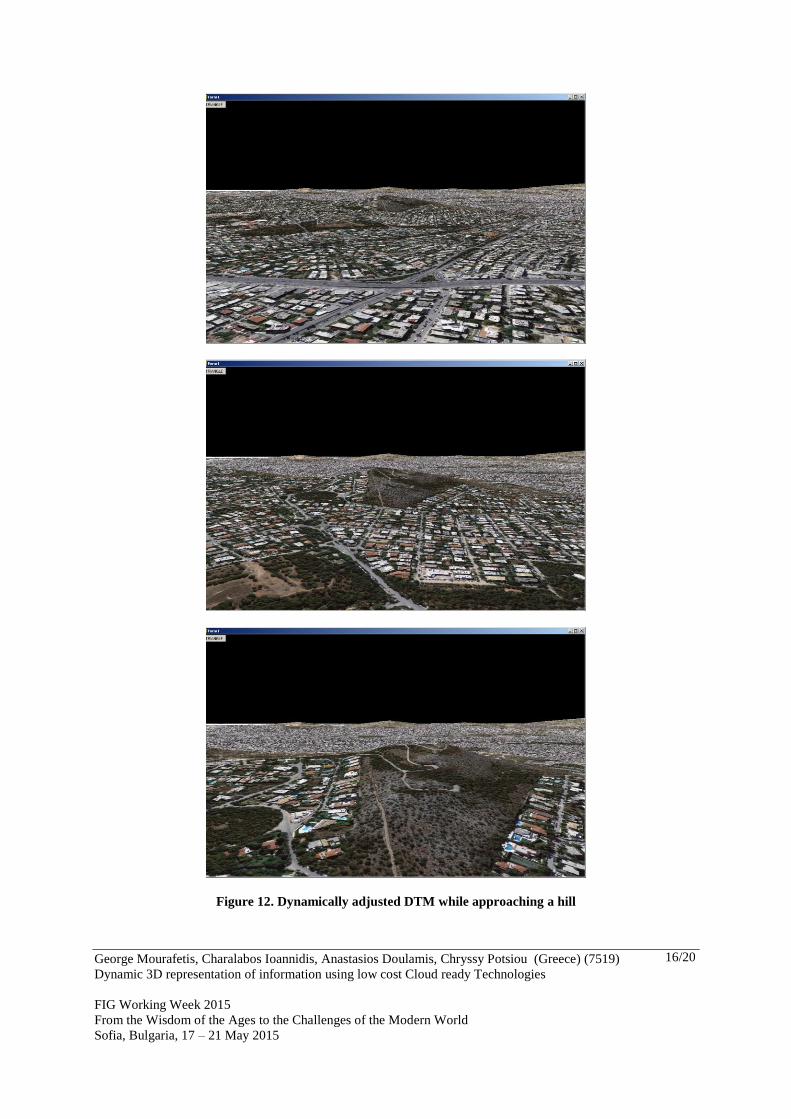
An animation was captured and published at http://youtu.be/F8O_wNoW1d4 that shows how
the terrain is dynamically adjusted according to the viewer’s position. Also, Figure 12 shows
three spots of this animation during a dynamic adjustement of the DTM while approaching a
hill. The DTM gradually changes respectively to the distance of the observer and loads more
accurate data as the observer approaches. So, the observer may experience high resolution and
accurate rendering.

George Mourafetis, Charalabos Ioannidis, Anastasios Doulamis, Chryssy Potsiou (Greece) (7519)
Dynamic 3D representation of information using low cost Cloud ready Technologies
FIG Working Week 2015
From the Wisdom of the Ages to the Challenges of the Modern World
Sofia, Bulgaria, 17 – 21 May 2015
15/20
Figure 10. Dynamically adjusted DTM at observer’s position
Figure 11. CPU usage diagram
George Mourafetis, Charalabos Ioannidis, Anastasios Doulamis, Chryssy Potsiou (Greece) (7519)
Dynamic 3D representation of information using low cost Cloud ready Technologies
FIG Working Week 2015
From the Wisdom of the Ages to the Challenges of the Modern World
Sofia, Bulgaria, 17 – 21 May 2015
16/20
Figure 12. Dynamically adjusted DTM while approaching a hill

George Mourafetis, Charalabos Ioannidis, Anastasios Doulamis, Chryssy Potsiou (Greece) (7519)
Dynamic 3D representation of information using low cost Cloud ready Technologies
FIG Working Week 2015
From the Wisdom of the Ages to the Challenges of the Modern World
Sofia, Bulgaria, 17 – 21 May 2015
17/20
4. CONCLUSIONS
In this paper a low cost and efficient way of displaying dynamic 3D information on basemaps
that may be used in any case including displaying Cadastral Information is proposed. Cadastre
requires accurate measurements and visualisations and for that reason a projected instead of a
geographic spatial reference system is used. The advantage of this approach is that
topographic measurements may be directly represented on the basemap without any
transformation. On the other hand, globe-like operations are not provided here since this
would require a geographic spatial reference. However, a hybrid solution could be
implemented in order to support both projected and geographic spatial reference systems
according to the observer’s elevation above the ground. The proposed algorithm enables the
dynamic change of the elevation information provided for the 3D visualisation, thus making it
usable in cases where this is necessary. The implemented example verifies that a 3D enabled
visualisation of cadastral or other data over basemaps is easy and scalable at low cost.
ACKNOWLEDGEMENTS
The research has been made for the research project “5 Dimensional Multi-Purpose Land
Information System” (5DMuPLIS). For the Greek side 5DMuPLIS project is co-funded by
the EU (European Regional Development Fund/ERDF) and the General Secretariat for
Research and Technology (GSRT) under the framework of the Operational Programme
"Competitiveness and Entrepreneurship", "Greece-Israel Bilateral R&T Cooperation 2013-
2015".
REFERENCES
Cignoni, P., Ganovelli, F., Gobbetti, E., Marton, F., Ponchio, F., Scopigno, R., 2003. Bdam -
batched dynamic adaptive meshes for high performance terrain visualization. Comput.
Graph. Forum, Vol. 22(3), pp. 505-514.
Jenny, B., Jenny, H., Hurni, L., 2011. Terrain Generalization with Multi-scale Pyramids
Constrained by Curvature. Cartography and Geographic Information Science, Vol. 38(1),
pp. 110-116.
Kalbermatten, M., van de Ville, D., Turberg, P., Tuia, D., Joost, S., 2011. Multiscale analysis
of geomorphological and geological features in high resolution digital elevation models
using the wavelet transform. Geomorphology, Vol. 138(1), pp. 352-363.
Li, Y., 2008. Based on the Triangular Grid Digital Elevation Model of the Terrain Modeling.
World Academy of Science, Engineering and Technology, Vol. 2,
http://waset.org/publications/8590/based-on-the-triangular-grid-digital-elevation-model-of-
the-terrain-modeling
Lindstrom, P., Koller, D., Ribarsky, W., Hodges, L.F., Faust, N., Turner, G.A., 1996. Real-
time, continuous level of detail rendering of height fields. Proceedings of ACM
SIGGRAPH, pp. 109–118.
Rocca, L., Panozzo, D., Puppo, E., 2013. Patchwork Terrains: Multi-resolution
Representation from Arbitrary Overlapping Grids with Dynamic Update. Proceedings of
VISIGRAPP 2012, Eds.: G. Csurka et al., CCIS 359, pp. 48-66,
http://www.inf.ethz.ch/personal/dpanozzo/papers/GRAPP12-RocPanPup.pdf

George Mourafetis, Charalabos Ioannidis, Anastasios Doulamis, Chryssy Potsiou (Greece) (7519)
Dynamic 3D representation of information using low cost Cloud ready Technologies
FIG Working Week 2015
From the Wisdom of the Ages to the Challenges of the Modern World
Sofia, Bulgaria, 17 – 21 May 2015
18/20
Pajarola, R., Gobbetti, E., 2007. Survey on Semi-Regular Multiresolution Models for
Interactive Terrain Rendering. The Visual Computer, vol. 23(8), pp. 583-605,
http://www.p-arch.it/bitstream/handle/11050/839/tvc2007-semi-regular.pdf?sequence=1
Peng, W., Petrovic, D., Crawford, C., 2004. Handling large terrain data in GIS. Proceedings
of XX ISPRS Congress, Istanbul, Turkey, Vol. XXXV, Part B4, pp. 281-286,
http://www.isprs.org/proceedings/XXXV/congress/comm4/papers/358.pdf
Samet, H., 1989. Applications of Spatial Data Structures: computer graphics, image
processing, and GIS. Addison Wesley, Reading, Massachusetts.
Tevs, A., Ihrke, I., Seidel, H.P., 2008. Maximum mipmaps for fast, accurate, and scalable
dynamic height field rendering. Eds.: E. Haines and M. McGuire, SI3D, pp. 183–190.
Wan, Q., Chen, Y., 2013. Comparison of several methods for multi-scale DEM generalization
in different landform areas. Proceedings of Geomorphometry 2013,
http://geomorphometry.org/system/files/QiaoYumin2013geomorphometry.pdf
http://www.gdmc.nl/3dcadastres/
http://en.wikipedia.org/wiki/Google_Earth, http://en.wikipedia.org/wiki/Virtual_globe
http://en.wikipedia.org/wiki/List_of_3D_graphics_libraries
http://www.brighthub.com/internet/google/articles/61335.aspx?cid=parsely_rec

George Mourafetis, Charalabos Ioannidis, Anastasios Doulamis, Chryssy Potsiou (Greece) (7519)
Dynamic 3D representation of information using low cost Cloud ready Technologies
FIG Working Week 2015
From the Wisdom of the Ages to the Challenges of the Modern World
Sofia, Bulgaria, 17 – 21 May 2015
19/20
BIOGRAPHICAL NOTES
George MOURAFETIS Surveyor Engineer, Msc in Geoinformatics, PhD student at School of Rural and Surveying
Engineering, National Technical University of Athens, Greece. He works as IT expert in
programming for cadastre applications, of EKXA SA.
Charalabos IOANNIDIS
Professor at the Lab. of Photogrammetry, School of Rural and Surveying Engineering,
National Technical University of Athens, Greece, teaching photogrammetry and cadastre.
1992-1996: Co-chair of Commission VI-WG2 ‘Computer Assisted Teaching’ in ISPRS.
1997-2001: Member of the Directing Council of Hellenic Mapping and Cadastral
Organization and Deputy Project Manager of the Hellenic Cadastre.
2010-2014: Chair of Working Group 3.2 ‘Technical Aspects of SIM’ of FIG Com 3.
He has authored more than 140 papers in the above fields.
Anastasios DOULAMIS
He received the Diploma degree in Electrical and Computer Engineering from the National
Technical University of Athens (NTUA) in 1995 with the highest honor. In 2000, he has
received PhD in Computer Engineering. He was Associate Professor at Technical University
of Crete and currently, he is Lecturer at the Lab. of Photogrammetry, School of Rural and
Surveying Engineering, NTUA. He serves as Program Chair/organizer in many IEEE/ACM
workshops/conferences, participating in many EU funded projects and having more than 200
papers and 2000 citations in his work.
Chryssy POTSIOU
Dr Surveyor Engineer, Associate Professor, School of Rural & Surveying Engineering,
National Technical University of Athens, Greece in the field of Cadastre, Property Valuation
and Spatial Information Management.
FIG Commission 3 chair (2007-2010). FIG Vice President (2011-2014). FIG President Elect
(2015-2018).
Elected bureau member of the UN ECE Working Party for Land Administration (2001-2015).
Member of the management board of EKXA SA (2009-2012).
CONTACTS
George Mourafetis School of Rural & Surveying Engineering,
National Technical University of Athens
Athens
GREECE
Email: [email protected]

George Mourafetis, Charalabos Ioannidis, Anastasios Doulamis, Chryssy Potsiou (Greece) (7519)
Dynamic 3D representation of information using low cost Cloud ready Technologies
FIG Working Week 2015
From the Wisdom of the Ages to the Challenges of the Modern World
Sofia, Bulgaria, 17 – 21 May 2015
20/20
Prof. Dr. Charalabos Ioannidis
School of Rural & Surveying Engineering,
National Technical University of Athens
Athens
GREECE
Tel. +302107722686
Fax +302107722677
Email: [email protected]
Web site: http://users.ntua.gr/cioannid/
Dr. Anastasios Doulamis
School of Rural & Surveying Engineering,
National Technical University of Athens
Athens
GREECE
Tel. +302107722684
Fax +302107722677
Email: [email protected]
Prof. Dr. Chryssy Potsiou
School of Rural & Surveying Engineering,
National Technical University of Athens
Athens
GREECE
Tel. +302107722688
Fax +302107722677
Email: [email protected]; [email protected]