dyes and pigments - dyuthi home
TRANSCRIPT

lable at ScienceDirect
Dyes and Pigments 87 (2010) 149e157
Contents lists avai
Dyes and Pigments
journal homepage: www.elsevier .com/locate/dyepig
The tautomerism, solvatochromism and non-linear optical properties offluorescent 3-hydroxyquinoxaline-2-carboxalidine-4-aminoantipyrine
V. Arun a, S. Mathewb,c, P.P. Robinson a, M. Jose a, V.P.N. Nampoori b,c, K.K.M. Yusuff a,*aDepartment of Applied Chemistry, Cochin University of Science and Technology, Cochin 682 022, Kerala, Indiab International School of Photonics, Cochin University of Science and Technology, Cochin 682 022, Kerala, IndiacCentre of Excellence in Lasers and Optoelectronic Sciences, Cochin University of Science and Technology, Cochin 682 022, Kerala, India
a r t i c l e i n f o
Article history:Received 2 January 2010Received in revised form10 March 2010Accepted 11 March 2010Available online 20 March 2010
Keywords:Schiff baseQuinoxalinesTautomerismFluorescenceSolvatochromismNon-linear optical behaviour
* Corresponding author. Tel./fax: þ91 484 2575804E-mail addresses: [email protected], yusuff15@gm
0143-7208/$ e see front matter � 2010 Elsevier Ltd.doi:10.1016/j.dyepig.2010.03.012
a b s t r a c t
The Schiff base, 3-hydroxyquinoxaline-2-carboxalidine-4-aminoantipyrine, was synthesized by thecondensation of 3-hydroxyquinoxaline-2-carboxaldehyde with 4-aminoantipyrine. HPLC, FT-IR and NMRspectral data revealed that the compound exists predominantly in the amide tautomeric form andexhibits both absorption and fluorescence solvatochromism, large stokes shift, two electron quasi-reversible redox behaviour and good thermal stability, with a glass transition temperature of 104 �C. Thethird-order non-linear optical character was studied using open aperture Z-scan methodology employing7 ns pulses at 532 nm. The third-order non-linear absorption coefficient, b, was 1.48 � 10�6 cm W�1 andthe imaginary part of the third-order non-linear optical susceptibility, Im c(3), was 3.36 � 10�10 esu. Theoptical limiting threshold for the compound was found to be 340 MW cm�2.
� 2010 Elsevier Ltd. All rights reserved.
1. Introduction
Materials with excellent optical non-linearity and spectralcharacteristics are required for high-level technologies such as datastorage, information processing, telecommunications and opticalswitching. Organic materials having p-extended frameworkswith alternating single (s) and double/triple bonds exhibit photo-luminescence and enjoy many applications as organic light-emitting diodes (OLEDs) [1]. Fluorescent heterocyclic dyes whosefluorescence emission occurs at red wavelengths are expected toplay a leading role in full color electroluminescence displays [2e7].Several quinoxaline derivatives as well as heterocycles that containa quinoxaline moiety have p-extended frameworks and are muchused as photoluminesent molecules [8e10] and electron-transportmaterials in multilayer OLEDs [11,12]. For use in LEDs, a knowledgeof the photophysical characteristics of the charge-transportingmaterials is of fundamental importance in terms of the optimisa-tion of device properties and is also valuable for the design ofpotential new blue-light emitters [13]. In recent years, numerousreports on the photophysical properties of quinoxalines haveappeared [14e23]. Organic compounds are also important for
.ail.com (K.K.M. Yusuff).
All rights reserved.
photonic devices because of their optical non-linear properties[24]. This paper concerns an investigation of the solvatochromism,tautomerism, electrochemistry, thermal analysis and non-linearoptical character of the Schiff base, 3-hydroxyquinoxaline-2-carboxalidine-4-aminoantipyrine (HQCAAP).
2. Experimental
2.1. Materials
All chemicals were obtained from SigmaeAldrich (Bangalore,India) and were used as supplied. Organic solvents used werepurified and dried using standard methods.
2.2. Methods
Microanalyses of the compound was carried out using an Ele-mentar Vario EL III CHNS elemental analyzer. Room-temperatureFT-IR spectrumwas recorded as KBr pellets using a JASCO FTIR 4100Spectrophotometer in the 4000e400 cm�1 range. The electronicspectra of the Schiff base (10�5 mol l�1) in different solvents wererecorded on a Thermo Electron Nicolet Evolution 300 UVeVISSpectrophotometer. The UVeVis diffuse reflectance spectrum wasrecorded on a Labomed UVeVis spectrophotometer equipped with

Fig. 1. Schematic diagram of the experimental setup for the Z-scan measurement.
V. Arun et al. / Dyes and Pigments 87 (2010) 149e157150
a diffuse reflectance accessory in the range 200e900 nm; %R valueswere converted to absorbance using the Kubelka Munk function. 1HNMR and 13C NMR spectra of the synthesized compound wererecorded in DMSO-d6 on a Bruker Avance DRX 500 MHZ NMRspectrometer. The fluorescence spectra of the compound(10�5 mol l�1) in different solvents were recorded on a Cary EclipseFluorescence Spectrophotometer (Varian). The linear refractiveindex of the compound in ethanol was determined using a SipconAbbe Refractometer. TGeDTAeDTG analysis was carried out undera nitrogen atmosphere employing two different heating rates(10 �C min�1 and 20 �Cmin�1) using a Perkin Elmer Pyres DiamondTG/DTA analyser. DSC analysis was carried out using a MettlerToledo DSC 822e at a heating rate of 10 �C min�1 under nitrogenatmosphere. The powder X-ray diffraction pattern of HQCAAP wasrecorded on a Bruker model D8 (CuKa source) X-ray diffractometerform 2-theta values 5e120� at a step time 0.2 s. Cyclic voltammetricstudies were carried out with a BAS EPSILON ElectrochemicalAnalyser using glassy-carbon working electrode. A Pt wire andAg/AgCl were used as counter and reference electrodes,respectively.
HPLC analysis was performed using a Dionex UltiMate 3000HPLC system equipped with pump, autosampler columncompartment, photodiode array detector and Chromeleon soft-ware. Separationwas carried out using an Acclaim 120 column, C185 mm 120 Å (4.6 � 250 mm), with a guard column packed with thesamematerial. The columnwasmaintained at 30 �C throughout theanalysis and detection was carried out at 254 nm. HPLC gradeacetonitrile and water (Qualigens) were used for sample prepara-tion and as mobile phase; the mobile phase used was 70% aceto-nitrileewater with a flow rate of 1 mL/min.
The third-order non-linear optical character was determinedusing the single beam, Z-scan technique employing a 1.0 �10�5 mol L�1 ethanolic solution of the compound. A Q-switchedNd:YAG laser (Spectra Physics LAB-1760, 532 nm, 7 ns, 10 Hz) wasused as light source. The sample was moved in the direction oflight at the focal point of the lens (focal length 200 mm), theradius of the beam waist being calculated as 35.467 mm. TheRayleigh length, ZR was estimated to be 7.42 mm, this beingmuch greater than the thickness of the sample cuvette (1.1 mm),which is an essential prerequisite for Z-scan experiments. Thetransmitted beam energy, reference beam energy and their ratiowere measured simultaneously using an energy ratiometer(Rj7620, Laser Probe Corp.) having two identical pyroelectricdetector heads (Rjp735). The effect of fluctuations of laser powerwas eliminated by dividing the transmitted power by the powerobtained at the reference detector; both measured using identicalphoto detectors. The schematic diagram of the experimental setupused is shown in Fig. 1.
Fig. 2. Powder XRD pattern of HQCAAP.
2.3. Synthesis of HQCAAP
The Schiff base, 3-hydroxyquinoxaline-2-carboxalidine-4-ami-noantipyrine (HQCAAP), was synthesized by employing theprocedure of Arun et al. [25]. Yield: (90%, 9.3 g). Anal. Cald. forC20H17N5O2 (359.38): C, 66.84; H, 4.77; N, 19.47. Found: C, 66.68; H,4.65; N, 19.32. IR (cm�1): 3451, 3038, 3009, 2928, 2901, 2837, 2712,1670,1656,1637,1591,1551,1489,1455,1414,1384,1350,1306,1268,1224, 1154, 1134, 1069, 1045, 1023, 949, 856, 817, 771, 757, 703, 685,625, 592, 575, 543, 513, 488, 468, 412. lmax(nm) in methanol(10�5 mol l�1) ¼ 210, 224, 423; 3max (L mol�1 cm�1) ¼ 1.98 � 105,1.90 � 105, 1.45 � 105. 1H NMR d ppm: (500 MHz, DMSO-d6, 296 K):d ¼ 2.49 (s, 3H, CeCH3), 3.27 (s, 3H, NeCH3), 7.28e7.85 (9H, AreH),9.98 (s, 1H, azomethine proton), 12.51 (s, 1H, AreOH or NeH).
3. Results and discussion
Hydroxyquinoxalines and their derivatives exhibit prototropicamideeiminol tautomerism and most of them exist in thepredominant amide form in the solid state [23,25e30]. Crystallinenature of the HQCAAP is confirmed from the presence of welldefined peaks in its powder XRD pattern (Fig. 2). The IR spectrumof the HQCAAP shows one broad, strong absorption band at3451 cm�1 which is either due to a hydrogen bonded n(OH) in theiminol tautomer or n(NH) in the amide tautomer. In the amidetautomeric form, the molecule contains two types of ketonicgroups, one attached to the quinoxaline ring and the other inthe pyrazoline ring. The pyrazoline carbonyl stretch in the caseof Schiff base ligands derived from 4-aminoantipyrine andsubstituted salicylaldehydes is in the 1616e1665 cm�1 range [31].In the present case, there is a strong band at 1656 cm�1 which maybe due to the nC]O stretch of the pyrazoline ring of the Schiff base.The peaks observed at 1670 cm�1 may be due to the C]O group ofthe amide tautomer of the Schiff base. Although HQCAAP containsthree different types of C]N bonds, two from the quinoxaline ringand one from the azomethine linkage, they are not well resolved inthe infrared spectrum. The azomethine eCH]N band is super-imposed with the C]O group of the amide tautomer and appearas a weak band at 1637 cm�1. The n(C]N) stretch of the quinoxalinering is observed at 1591 cm�1 [25]. The n(C]N) (azomenthine) fallsin between n(C]O) group of the amide tautomer and the n(C]N) ofthe quinoxaline ring.

Fig. 3. HPLC chromatogram of HQCAAP in acetonitrile and UVevisible spectra of the peaks.
V. Arun et al. / Dyes and Pigments 87 (2010) 149e157 151
The 1H NMR spectrum of the HQCAAP shows singlet peaks atd 3.27 ppm and d 2.49 ppm due to the NeCH3 and CeCH3 groups ofthe pyrazolone ring respectively. The multiplet in the range d 7.85to 7.28 ppm is due to the different aromatic protons of the 3-hydroxyquinoxaline-2-carbaxalidine-4-aminoantipyrine. Thesinglet peak at d 9.98 ppm is due to the azomethine proton of theSchiff base. The peaks at d 12.54 ppm and d 12.51 ppm are assign-able to the proton of the NeH of the amide tautomer or OeH of theiminol form of the Schiff base [23].
The HPLC analysis of the HQCAAP in acetonitrile (10�4 mol l�1)reveals that the compound may exist in two forms. The HPLCchromatogram (Fig. 3) gave two peaks: one with retention time3.18 min (a) having relative area percentage of 72.3 and anotherwith 3.48 min (b) having the relative area percentage of 27.7indicating the existence of the compound in two forms. For thepeak, a, the absorption occurs at 203, 234 (shoulder), 275(shoulder), and 422 nm and for b, it occurs at 206, 225, 275(shoulder) and 424 nm. The electronic spectrum of the speciescorresponding to the major peak is due to the amide form and thatcorresponding to the minor peak is due to the iminol from [23].Thus the Schiff base exhibits prototropic tautomerism and exists inthe predominant amide form. The two tautomeric structures areshown in the Scheme 1.
To study the effect of solvent on the absorption spectrum, werecorded the spectrum of HQCAAP in solid state and in varioussolvents with different polarities. The concentration of the solutionwas 10�5 mol l�1. The solvents used were methanol, ethanol, iso-propyl alcohol, tetrahydrofuran, acetonitrile, dichloromethane,dimethylformamide, dimethyl sulphoxide, ethylacetate, equimolarHQCAAP and NaOH in methanol and 1:1 hexaneemethanol. Thesolid state diffuse reflectance spectrum (DRS) of HQCAAP showsbands at 253 nm, 354 nm, 482 nm and 625 nm (shoulder). The first
Scheme 1. Amideeiminol ta
one is due to the p/ p* transitions of the heterocyclic quinoxalinering and the second one is due to the n/ p* transition of the eC]Ne group in quinoxaline ring [23]. The azomethine n / p* tran-sition appears at 482 nm. The shoulder band at 625 nmmay be dueto the intramolecular charge transfer transition. The highest energyabsorption bands in the solution spectra (all solvents) are assignedto p / p* transitions by virtue of their large molar extinctioncoefficients (Table 1). The n / p* transitions of the quinoxalinering appears as a shoulder band around 355 nm [23]. The bandcentered on 420 nm is due to the n / p* transitions of the azo-methine group.
The absorption peaks are blue shifted in solutionwith respect tothe peaks in the DRS spectrum. In solution, the ground state ofHQCAAP is stabilized by hydrogen bonding with the solvent. In theexcited state, the hydrogen bond of the molecule is almostcompletely broken or weakened to a larger extend. As a result theexcited state is less stabilized and absorption is shifted to higherenergy [32,33].
The longest wave length absorption band of HQCAAP in varioussolvents lies between 415 and 431 nm and is seen to increase withincreasing solvent polarity (Fig. 4). This positive solvatochromismexhibited by the compound may be due to the effect of dipolemoment changes of the excited state, changes in the hydrogenbonding strength and/or due to excited state protonation [32,33].Furthermore, in the present case there is a possibility for thepolarization of the lactam system of the pyrazolone ring leading toa net negative charge on the oxygen atom [34], which may alsoinfluence the absorption characteristics of HQCAAP. To study theabsorption characteristic of the enolate anion of HQCAAP, werecorded the UVeVis spectrum in methanol containing an equiva-lent amount of NaOH (Table 1). The enolate anion, formed by thedissolution of HQCAAP in an equivalent amount of NaOH in
utomerism in HQCAAP.

Table 1Absorption spectral data of HQCAAP.
Solvent lmax(nm) (3max � 10�5 (L mol�1 cm�1))
Ethanol 204 (1.09); 231 (0.55)sh; 425 (0.26)Methanol 210 (1.98); 224 (1.90); 275 (0.77)sh; 325 (0.51)sh; 422 (1.45)IPA 213 (1.92); 253 (0.30); 262 (0.29); 269 (0.26); 422 (0.25)Ethylacetate 252 (0.26); 268 (0.21); 415 (0.36)Acetonitrile 205 (2.02); 231 (0.79)sh; 420 (0.71)THF 242 (0.50); 294 (0.25); 415 (0.40)DCM 228 (0.48); 284 (0.21)sh; 316 (0.17)sh; 410 (0.28); 501 (0.07)sh
DMF 268 (0.32); 427 (0.41)Acetic acid 342 (1.16); 413 (0.15)sh
X1 193 (0.54); 203 (0.54); 223 (0.47); 225 (0.46); 432 (0.31)DRS 253, 354, 415sh, 482, 625sh
IPA ¼ isopropyl alcohol; THF ¼ tetrahydrofuran; DCM ¼ dichloromethane;DMF ¼ dimethylformamide; DMSO ¼ dimethyl sulphoxide; X1 ¼ equimolarHQCAAP and NaOH in methanol; DRS¼ diffuse reflectance spectrum; sh ¼ shoulderpeak.
Fig. 4. Longest wave length absorption bands of HQCAAP in various solvents.
Fig. 5. The UVeVis spectra of HQCAAP in 1:1 methanolehexane mixture at differenttime intervals.
Fig. 6. Different colours exhibited by HQCAAP in visible and UV light (For interpre-tation of the references to colour in this figure legend, the reader is referred to the webversion of this article).
V. Arun et al. / Dyes and Pigments 87 (2010) 149e157152
methanol, absorbs at a higher wavelength compared to the non-enolate from [35,36]. Also the presence of well defined isosebesticpoints (at 218, 246 324, 350 and 515 nm) in the UVeVis spectra ofHQCAAP recorded in 1:1methanolehexanemixtures (10�5mol l�1)at different time intervals (Fig. 5) reveal that in this medium thecompound contains more than one absorbing species [37].
The compound, HQCAAP, shows different colours in UV lightand this prompted us to study its fluorescent behaviour. Acomparison of the different colours exhibited by the compound invisible and UV light is shown in Fig. 6. The photoluminescencespectra of the compound in various solvents (10�5 mol L�1) at twodifferent excitation wavelength (270 and 430 nm) were recordedand are not identical. At the excitation wavelength 430 nm
Fig. 7. Photoluminescence spectra of HQCAAP in various solvents at the excitationwavelength 430 nm.
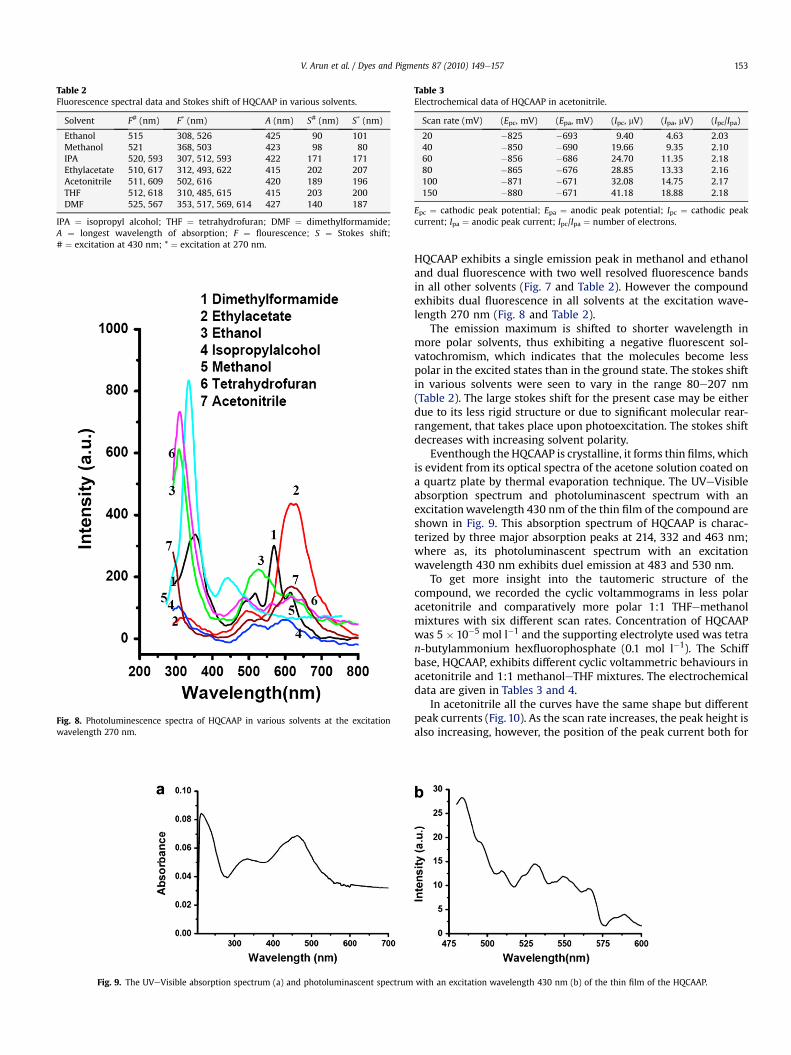
Table 2Fluorescence spectral data and Stokes shift of HQCAAP in various solvents.
Solvent F# (nm) F* (nm) A (nm) S# (nm) S* (nm)
Ethanol 515 308, 526 425 90 101Methanol 521 368, 503 423 98 80IPA 520, 593 307, 512, 593 422 171 171Ethylacetate 510, 617 312, 493, 622 415 202 207Acetonitrile 511, 609 502, 616 420 189 196THF 512, 618 310, 485, 615 415 203 200DMF 525, 567 353, 517, 569, 614 427 140 187
IPA ¼ isopropyl alcohol; THF ¼ tetrahydrofuran; DMF ¼ dimethylformamide;A ¼ longest wavelength of absorption; F ¼ flourescence; S ¼ Stokes shift;# ¼ excitation at 430 nm; * ¼ excitation at 270 nm.
Fig. 8. Photoluminescence spectra of HQCAAP in various solvents at the excitationwavelength 270 nm.
Fig. 9. The UVeVisible absorption spectrum (a) and photoluminascent spectrum
Table 3Electrochemical data of HQCAAP in acetonitrile.
Scan rate (mV) (Epc, mV) (Epa, mV) (Ipc, mV) (Ipa, mV) (Ipc/Ipa)
20 �825 �693 9.40 4.63 2.0340 �850 �690 19.66 9.35 2.1060 �856 �686 24.70 11.35 2.1880 �865 �676 28.85 13.33 2.16100 �871 �671 32.08 14.75 2.17150 �880 �671 41.18 18.88 2.18
Epc ¼ cathodic peak potential; Epa ¼ anodic peak potential; Ipc ¼ cathodic peakcurrent; Ipa ¼ anodic peak current; Ipc/Ipa ¼ number of electrons.
V. Arun et al. / Dyes and Pigments 87 (2010) 149e157 153
HQCAAP exhibits a single emission peak in methanol and ethanoland dual fluorescence with two well resolved fluorescence bandsin all other solvents (Fig. 7 and Table 2). However the compoundexhibits dual fluorescence in all solvents at the excitation wave-length 270 nm (Fig. 8 and Table 2).
The emission maximum is shifted to shorter wavelength inmore polar solvents, thus exhibiting a negative fluorescent sol-vatochromism, which indicates that the molecules become lesspolar in the excited states than in the ground state. The stokes shiftin various solvents were seen to vary in the range 80e207 nm(Table 2). The large stokes shift for the present case may be eitherdue to its less rigid structure or due to significant molecular rear-rangement, that takes place upon photoexcitation. The stokes shiftdecreases with increasing solvent polarity.
Eventhough the HQCAAP is crystalline, it forms thin films, whichis evident from its optical spectra of the acetone solution coated ona quartz plate by thermal evaporation technique. The UVeVisibleabsorption spectrum and photoluminascent spectrum with anexcitationwavelength 430 nm of the thin film of the compound areshown in Fig. 9. This absorption spectrum of HQCAAP is charac-terized by three major absorption peaks at 214, 332 and 463 nm;where as, its photoluminascent spectrum with an excitationwavelength 430 nm exhibits duel emission at 483 and 530 nm.
To get more insight into the tautomeric structure of thecompound, we recorded the cyclic voltammograms in less polaracetonitrile and comparatively more polar 1:1 THFemethanolmixtures with six different scan rates. Concentration of HQCAAPwas 5 � 10�5 mol l�1 and the supporting electrolyte used was tetran-butylammonium hexfluorophosphate (0.1 mol l�1). The Schiffbase, HQCAAP, exhibits different cyclic voltammetric behaviours inacetonitrile and 1:1 methanoleTHF mixtures. The electrochemicaldata are given in Tables 3 and 4.
In acetonitrile all the curves have the same shape but differentpeak currents (Fig. 10). As the scan rate increases, the peak height isalso increasing, however, the position of the peak current both for
with an excitation wavelength 430 nm (b) of the thin film of the HQCAAP.

Table 4Electrochemical data of HQCAAP in 1:1 methanoletetrahydrofuran.
Scan rate (mV) (Epc, mV) (Epa, mV) (Ipc, mV) (Ipa, mV) (Ipc/Ipa)
50 191 8, �995 5.04 4.23 1.19100 104 96, �906 8.68 8.66 1.00150 �7 224, �834 19.74 18.53 1.07200 �73, �320 310, �790 30.65 29.91 1.02250 �154, �387 352, �734 31.59 31.13 1.01300 �198, �422 385, �711 42.25 39.37 1.07
Epc ¼ cathodic peak potential; Epa ¼ anodic peak potential; Ipc ¼ cathodic peakcurrent; Ipa ¼ anodic peak current; Ipc/Ipa ¼ number of electrons.
Fig. 10. Cyclic voltammograms of HQCAAP in acetonitrile.
Fig. 11. Cyclic voltammograms of HQCAAP in 1:1 mixture of methanoletetrahydrofuran.
V. Arun et al. / Dyes and Pigments 87 (2010) 149e157154
the forward and reverse scan does not change. This is a character-istic of reversible electron transfer reaction [38]. For each scan theIpc/Ipa¼ 2.03 which corresponds to two electron transfer during theredox process. In the less polar acetonitrile, the compound maybe in the amide form and has a mobile proton in the NeH group ofthe quinoxaline fragment. During the oxidation step, the proton ispossibly eliminated (Scheme 2). The positive charge, which arisesin the product, facilitates the two electron oxidation. Similarobservations were found for 3-indolysine-2-yl-quinoxalines [39].
The cyclic voltammetric behaviour of HQCAAP in 1:1 mixture ofmethanoletetrahydrofuran (Fig. 11) is characterized by one reduc-tion peak and two oxidation peaks and are strongly dependentupon the scan rate. As the scan rate is increased, a new cathodicpeak is observed and its peak height increasedwith further increasein scan rate. This wave splitting might be due to a self protonationmechanism involving the proton transfer from the acidic iminol
Scheme 2. Two electron
form to basic reduction intermediate [40,41]. Hence in less polaracetonitrile, HQCAAP exhibits cyclic voltammograms characteristicof the amide tautomer, and in comparatively more polar meth-anoletetrahydrofuran mixture it shows cyclic voltammogramscharacteristics of its iminol tautomeric from. Generally the fluo-rescent heteroaromatic compoundswith imine nitrogen atoms (C]N)exhibiting less negative reduction potential compared to the anal-ogous aromatic hydrocarbons and heteroaromatic rings withoxygen or sulphur atoms are reported as good candidates for n-typesemiconductors in organic electronics [42]. HQCAAP exhibits halfwave reduction potential at �0.77 V (in acetonitrile), which iscomparatively more positive than that exhibited by pyrazine(�2.08 V) and quinoxaline (�1.62 V) [43] which indicates that it isa better choice for n-type organic semiconductor.
Thermal properties of HQCAAP were determined byTGeDTAeDTG and DSC measurements in the temperature range40e600 �C. The DSC thermogram is shown in the Fig. 12 andTGeDTAeDTG curves for the HQCAAP under nitrogen atmospherewith two different heating rates (10 �C min�1 and 20 �C min�1) aregiven in Fig.13. InDTA, no sharp endothermic peak corresponding tomelting was observed; instead of that one exothermic peak wasobserved at 245 �C, suggesting the compound to have no sharpmelting. The compound may undergo some decomposition/phasechange without melting. The first two exothermic peaks in DSCcorrespond to the loss of two water molecules which might behydrogen bonded to the HQCAAP. One water molecule may behydrogen bonded with the oxygen of the pyrazolone ring andthe other may be hydrogen bonded with the amide NeH of thequinoxaline ring. However, in the TG curves, the mass loss
transfer in HQCAAP.

Fig. 12. DSC thermogram of HQCAAP.
Fig. 14. Open aperture Z-scan curve for HQCAAP.
V. Arun et al. / Dyes and Pigments 87 (2010) 149e157 155
corresponding to removal of water of crystallization occurs ina single step below 110 �C (in the temperature range 45e100 �C for10 �C min�1 and in the temperature range 50e110 �C for20 �C min�1). As the heating rate decreased form 20e10 �C min�1,both the peaks corresponding to the loss of crystallized watermolecules and the decomposition of the compound shifted to lowertemperatures (Fig. 13). The procedure employed by Li et al. [44] wasused to find out the glass transition temperature; Tg. For this, thecompound was heated upto the 220 �C (below the decompositiontemperature) and thenwas quickly cooled by swirling water. Whenthe resulting amorphous glass of the compound was heated for thesecond time, a glass transition phenomenonwas observed at 104 �Cin the DSC. In principle, all the organic compounds for electrolumi-nescent (EL) devices should have high Tg values [44]. Comparativelyhigher value for Tg (104 �C) suggests the application potential of thiscompound for EL devices.
In the present investigation, Z-scan technique developed bySheik Bahae et al. [45] is used for measuring the non-linearabsorption coefficient, imaginary part of the third-order non-linear susceptibility and optical limiting threshold of HQCAAP. Theopen aperture Z-scan curve for the HQCAAP is shown in Fig. 14 andthe scatter dots are experimental data while the solid line is thetheoretically fitted curve. The open aperture Z-scan curve showsa normalized transmittance valley, indicating the presence of
Fig. 13. TGeDTAeDTG curves for the HQCAAP under nit
reverse saturable absorption (RSA) in the compound. The obtainednon-linearity is found to be of the third-order, as it fits to a twophoton absorption process. The corresponding net transmission isgiven by,
TðzÞ ¼ Cq0
ffiffiffip
pZN
�N
ln�1þ q0e
�t2�dt where
q0ðz; r; tÞ ¼ bIoðtÞLeff ð1ÞHere, Leff ¼ 1� e�al=a is the effective thickness of the sample
with linear absorption coefficient, a and thickness of the sample, l.b and Io are the non-linear absorption coefficient and the irradianceat focus respectively.
The non-linear absorption coefficient, b, is obtained byfitting theexperimental data to the equation (1). The constant, q0 is obtainedas the fit parameter and knowing the values of Io and Leff, the non-linear absorption coefficient can be calculated. The calculated valueof non-linear absorption coefficient at an intensity of 0.795 GW/cm2
(Io) is 1.48� 10�6 cm/W. The imaginary part of the third-order non-linear susceptibility can be calculated from non-linear absorptioncoefficient using the relation, Imðc3Þ ¼ n20lcb=480p
3 in esu, wheren0 is the linear refractive index of the sample, HQCAAP, in ethanol(1.453), l is the laser wavelength, c is the velocity of light in vacuumand its value obtained is 3.36 � 10�10 esu.
rogen atmosphere at 10 �C min�1 and 20 �C min�1.

Fig. 15. Optical limiting response of the HQCAAP.
V. Arun et al. / Dyes and Pigments 87 (2010) 149e157156
To study the optical limiting property of the sample, the non-linear transmission of the sample is studied as a function of inputfluence. Optical power limiting is operated through the non-linearoptical processes of the sample and an important term in theoptical limiting measurement is the optical limiting threshold.The optical limiting property of the compound can be estimatedfrom its Z-scan plots for various input fluences. For this, the non-linear transmission has to be plotted as a function of input fluences.From the value of fluence at focus, the fluence values at otherpositions could be calculated using the standard equations forGaussian beam waist given by;
u2ðzÞ ¼ u20
(1þ z2
z2R
)(2)
Fig.15 illustrates the optical limiting response of the sample. Thevertical line in the figure indicates the approximate fluence atwhich the normalized transmission begins to deviate from itslinearity which is considered as the optical limiting threshold value.The fluence value corresponding to the onset of optical limiting isfound to be 340 MW/cm2.
4. Conclusion
The Schiff base, HQCAAP, is polar and exhibts amideeiminoltautomerism. Its polarity decreases in solution. It exhibits positivesolvatochromism in its absorption spectra where as a negativesolvatochromism in its emission spectra in various solvents. Theresults of the UVeVis, fluorescence, CV and DSC studies suggestthat the present compound is a suitable candidate for application inorganic electronics. The values of third-order non-linear absorptioncoefficient, b, imaginary part of the third-order non-linear opticalsusceptibility, Im c(3), and optical limiting threshold suggest thatthis compound might find application in the photonic age.
Acknowledgement
The authors thank Department of Science and Technology,India, for using the Sophisticated Analytical InstrumentationFacility (SAIF) at STIC, Cochin University of Science and Tech-nology, Cochin for elemental analyses and DSC measurement.
We also thank Dr. A. Ajayaghosh, NIIST, Trivandrum, Kerala for the1H NMR and 13C NMR spectra.
References
[1] Shirota Y, Kageyama H. Charge carrier transporting molecular materials andtheir applications in devices. Chemical Reviews 2007;107(4):953e1010.
[2] Tang CW, VanSlyke SA, Chen CH. Electroluminescence of doped organic thinfilms. Journal of Applied Physics 1989;65(9):3610e6.
[3] Baldo MA, Lamansky S, Burrows PE, Thompson ME, Forrest SR. Very high-efficiency green organic light-emitting devices based on electro-phosphorescence. Applied Physics Letters 1999;75(1):4e6.
[4] Chen C-T. Evolution of red organic light-emitting diodes: materials anddevices. Chemistry of Materials 2004;16(23):4389e400.
[5] Huang Q, Evmenenko GA, Dutta P, Lee P, Armstrong NR, Marks TJ. Covalentlybound hole-Injecting nanostructures. Systematics of molecular architecture,thickness, saturation, and electron-blocking characteristics on organic light-emitting diode luminance, turn-on voltage, and quantum efficiency. Journal ofthe American Chemical Society 2005;127(29):10227e42.
[6] Gondek E, Calus S, Danel A, Kityk AV. Photoluminescence and electrolumi-nescence of methoxy and carboethoxy derivatives of 1,3-diphenyl-1-Hpyr-azolo[3,4-b]quinoline. Spectrochimica Acta Part A: Molecular andBiomolecular Spectroscopy 2008;69(1):22e6.
[7] Yu S, Ma C, Cheng C, Wang X, Ji D, Fan Z, et al. Synthesis and 0.88 mm near-infrared electroluminescence properties of a soluble chloroindium phthalo-cyanine. Dyes and Pigments 2008;76(2):492e8.
[8] Kulkarni AP, Zhu Y, Jenekhe SA. Quinoxaline-containing polyfluorenes:synthesis, photophysics, and stable blue electroluminescence. Macromole-cules 2005;38(5):1553e63.
[9] Gunes S, Baran D, Gunbas G, Ozyurt F, Fuchsbauer A, Sariciftci NS, et al.Photovoltaic and photophysical properties of a novel bis-3-hexylthiophenesubstituted quinoxaline derivative. Solar Energy Materials & Solar Cells2008;92(9):1162e9.
[10] Thomas KRJ, Velusamy M, Lin JT, Tao Y-T, Chuen C-H. Chromophore-labeledquinoxaline derivatives as efficient electroluminescent materials. Chemistryof Materials 2005;17(7):1860e6.
[11] Yamamoto T, Sugiyama K, Kushida T, Inoue T, Kanbara T. Preparation of newelectron-accepting p-conjugated polyquinoxalines. Chemical and electro-chemical reduction, electrically conducting properties, and use in light-emitting diodes. Journal of the American Chemical Society 1996;118(16):3930e7.
[12] Cui Y, Zhang X, Jenekhe SA. Thiophene-linked polyphenylquinoxaline: a newelectron transport conjugated polymer for electroluminescent devices.Macromolecules 1999;32(11):3824e6.
[13] Burrows HD, Fonseca SM, Gigante B, Esteves MA, Guerreiro AM. Fluorescencestudy of dehydroabietic acid-based bipolar arylamineequinoxalines. Journalof Fluorescence 2006;16(2):227e31.
[14] Touzani R, Ben-Hadda T, Elkadiri S, Ramdani A, Maury O, Le Bozec H, et al.Solution, solid state structure and fluorescence studies of 2,3-functionalizedquinoxalines: evidence for a p-delocalized keto-enamine form with NeH.Ointramolecular hydrogen bonds. New Journal of Chemistry 2001;25:391e5.
[15] Itoh T. Photophysical processes in quinoxaline vapor at low pressure. Spec-trochimica Acta Part A: Molecular and Biomolecular Spectroscopy 2003;59(13):3019e27.
[16] Pan Y, Sheng Z, Ye X, Ao Z, Chu G, Dai J, et al. Photochemistry of quinoxalinederivatives and mechanism of the triplet state quenching by electron-pooralkenes. Journal of Photochemistry and Photobiology A: Chemistry 2005;174(2):98e105.
[17] Kishida H, Hirota K, Wakabayashi T, Okamoto H, Lee B-L, Kokubo H, et al.Third-order nonlinear optical spectroscopy in charge-transfer type conjugatedpolymers. Synthetic Metals 2005;153(1e3):141e4.
[18] Jaung J-Y. Synthesis and halochromism of new quinoxaline fluorescent dyes.Dyes and Pigments 2006;71(3):245e50.
[19] Mac M, Danel A, Wisla A, Karocki A, Krolicki R. Electron transfer and inter-system crossing processes in new dyes based on 1H-pyrazolo[3,4-b]qui-noxaline: effect of temperature and solvent polarity on the CT fluorescence.Journal of Photochemistry and Photobiology A: Chemistry 2006;180(1e2):88e100.
[20] Barberis VP, Mikroyannidis JA, Spiliopoulos IK. Synthesis and optical proper-ties of quinoxaline-containing poly(aryl ether)s. Synthetic Metals 2007;157(10e12):475e80.
[21] Kim J-H, Jaung JY. The synthesis and optical properties of meso-substitutedporphyrins bearing quinoxaline derivatives. Dyes and Pigments 2008;77(2):474e7.
[22] Jang CK, Jaung J-Y. The synthesis and optical properties of quinoxalinesbearing 2,20:60 ,200-terpyridine. Dyes and Pigments 2009;80(1):168e73.
[23] Arun V, Robinson PP, Manju S, Leeju P, Varsha G, Digna V, et al. A novelfluorescent bisazomethine dye derived from 3-hydroxyquinoxaline-2-car-boxaldehyde and 2,3-diaminomaleonitrile. Dyes and Pigments 2009;82(3):268e75.
[24] Blau W. Organic materials for nonlinear optical devices. Physics in Technology1987;18:250e68.

V. Arun et al. / Dyes and Pigments 87 (2010) 149e157 157
[25] Arun V, Sridevi N, Robinson PP, Manju S, Yusuff KKM. Ni(II) and Ru(II) Schiffbase complexes as catalysts for the reduction of benzene. Journal of MolecularCatalysis A: Chemical 2009;304(1e2):191e8.
[26] Gazit A, App H, McMahon G, Chen J, Levitzki A, Bohmer FD. Tyrphostins. 5.Potent Inhibitors of platelet-derived growth factor receptor tyrosine kinase:structure-activity relationships in quinoxalines, quinolines, and indole tyr-phostins. Journal of Medicinal Chemistry 1996;39(11):2170e7.
[27] Mamedov VA, Kalinin AA, Gubaidullin AT, Isaikina OG, Litvinov IA. Synthesisand functionalization of 3-ethylquinoxalin-2(1H)-one. Russ. Journal ofOrganic Chemistry 2005;41(4):599e606.
[28] Bozdyreva KS, Aliev ZG, Maslivets AN. Five-membered 2,3-dioxo heterocycles:LVII. Recyclization of 3-pivaloylpyrrolo[1,2-a]quinoxaline-1,2,4(5H)-trionesby the action of o-phenylenediamine. Crystalline and molecular structure of3-[3,3-dimethyl-2-oxo-1-(3-oxo-3,4-dihydroquinoxalin-2-yl)butyl]-1-phenylquinoxalin-2(1H)-one. Russian Journal of Organic Chemistry 2008;44(4):607e11.
[29] Kotb ER, Anwar MA, Soliman MS, Salama MA. Synthesis and reactions of somenovel quinoxalines for anticancer evaluation. Phosphorus Sulfur Silicon andthe Related Elements 2007;182:1119e30.
[30] Cheeseman GWH, Werstiuk ESG. Qninoxaline chemistry. Developments1963e1975. Advances in Heterocyclic Chemistry 1978;22:367e431.
[31] Selvakumar PM, Suresh E, Subramanian PS. Synthesis, spectral characteriza-tion and structural investigation on some 4-aminoantipyrine containing Schiffbase Cu(II) complexes and their molecular association. Polyhedron 2007;26(4):749e56.
[32] Ahmed M, Khanl ZH. Electronic absorption spectra of benzoquinone and itshydroxy substituents and effect of solvents on their spectra. SpectrochimicaActa Part A: Molecular and Biomolecular Spectroscopy 2000;56(5):965e81.
[33] Hao Y, Xu B, Gao Z, Wang H, Zhou H, Liu X. Optical properties, electronicenergy level structure and electro-luminescent characteristics of salicylalde-hyde anil zinc. Journal of Materials Science and Technology 2006;22(2):225e9.
[34] Brown GH, Graham B, Vittum PW, Weissberger A. Azomethine dyes. I. colorand constitution of pyrazolone azomethine dyes. Journal of the AmericanChemical Society 1951;73(3):919e26.
[35] Katritzky AR, Kucharska HZ, Rowe JD. Potentially tautomeric pyridines. Part VI.2-, 3-, and 4-phenacylpyridines. Journal of the Chemical Society; 1965:3093e6.
[36] Katritzky AR, Ghiviriga I, Oniciu DC, O’Ferrall RAM, Walsh SM. Study of theenol-enaminone tautomerism of a-heterocyclic ketones by deuterium effectson 13C chemical shifts. Journal of the Chemical Society, Perkin Transactions1997;2:2605e8.
[37] Ledbetter Jr JW. Spectroscopic evidence for the enol imine-keto enaminetautomerism of N-(o-and p-hydroxybenzylidene) anils in solution. Journal ofPhysical Chemistry 1966;70(7):2245e9.
[38] Nicholson RS, Shain I. Theory of stationary electrode polarography. Single scanand cyclic methods applied to reversible, irreversible, and kinetic systems.Analytical Chemistry 1964;36(4):706e23.
[39] Yanilkin VV, Mamedov VA, Toropchina AV, Kalinin AA, Nastapova NV,Morozov VI, et al. Redox active surface films produced by electrooxidation ofsubstituted indolysines. Russian Journal of Electrochemistry 2006;42(3):212e24.
[40] Isse AA, Abdurahman AM, Vianello E. Self-protonation mechanism in theelectroreduction of hydroxyimines. Journal of the Chemical Society, PerkinTransactions 1996;2:597e600.
[41] Isse AA, Gennaro A, Vianello E. Electrochemical reduction of Schiff base ligandsH2salen and H2salophen. Electrochimica Acta 1997;42(13e14):2065e71.
[42] Tonzola CJ, Alam MM, Kaminsky W, Jenekhe SA. New n-type organic semi-conductors: synthesis, single crystal structures, cyclic voltammetry, photo-physics, electron transport, and electroluminescence of a series ofdiphenylanthrazolines. Journal of the American Chemical Society 2003;125(44):13548e58.
[43] Mancilha FS, DaSilveira Neto BA, Lopes AS, Moreira Jr PF, Quina FH,Goncalves RS, et al. Are molecular 5,8-extended-quinoxaline derivatives goodchromophores for photoluminescence applications? European Journal ofOrganic Chemistry 2006;21:4924e33.
[44] Li J, Ma C, Tang J, Lee C-S, Lee S. Novel starburst molecule as a hole injectingand transporting material for organic light-emitting devices. Chemistry ofMaterials 2005;17(3):615e9.
[45] Sheik-Bahae M, Said AA, Wei T, Hagan DJ, Van Strayland EW. Sensitivitivemeasurement of optical nonlinearities using a single beam. IEEE Journal ofQuantum Electronics 1990;26:760e9.