dvb-th transmitter measurements
DESCRIPTION
sTRANSCRIPT
DVB-T/H Transmitter Measurements for Acceptance, Operation and Monitoring Application Note
Products: | R&SETL
| R&SDVSG
This application note describes how to perform accep-tance, operational and monitoring measurements on a digital terrestrial television transmitter based on the Digi-tal Video Broadcasting – Terrestrial / Handheld (DVB-T/H) standard. As compared to analog television, digital television re-quires significantly fewer measurement parameters to evaluate the quality of the transmitter output signal. The most important parameters are:
Transmitter output level Bit error ratio (BER) Modulation error ratio (MER) Shoulder attenuation
Appli
catio
nNo
te
Walt
erFis
cher
04.20
09-7
BM10
1_0E

© 2009 Rohde & Schwarz GmbH & Co. KG 81671 Munich, Germany Subject to change – Data without tolerance limits is not binding. R&S® is a registered trademark of Rohde & Schwarz GmbH & Co. KG. Trade names are trademarks of the owners. The following abbreviations are used throughout this document: R&S®XYZ is abbreviated as R&S XYZ.
Broadcasting Table of Contents
7BM101_0E 1
Table of Contents 1 Overview.............................................................................................. 2
2 Test Setup ........................................................................................... 3
3 Measurements..................................................................................... 5 3.1 Transmitter Output Level ............................................................................................5 3.2 Bit Error Ratio ..............................................................................................................8 3.3 Modulation Error Ratio..............................................................................................10 3.4 I/Q Imbalance on the Modulator ...............................................................................11 3.5 Shoulder Attenuation ................................................................................................13 3.6 Out-of-Band Emissions.............................................................................................17 3.7 Crest Factor................................................................................................................19 3.8 Amplitude Frequency Response and Group Delay................................................21 3.9 Initial Carrier Frequency Tolerance .........................................................................22
3.10 TPS ..............................................................................................................................23 3.11 Constellation Diagram...............................................................................................25
4 Abbreviations.................................................................................... 26
5 Literature ........................................................................................... 26
6 Additional Information...................................................................... 26
7 Ordering Information........................................................................ 27

Broadcasting Overview
7BM101_0E 2
1 Overview This application note describes how to perform acceptance, operational and monitoring measurements on a digital terrestrial television transmitter based on the Digital Video Broadcasting – Terrestrial / Handheld (DVB-T/H) standard. As compared to analog television, digital television requires significantly fewer measurement parameters to evaluate the quality of the transmitter output signal. The most important parameters are:
Transmitter output level Bit error ratio (BER) Modulation error ratio (MER) Shoulder attenuation
This document is structured as follows: Chapter 2 presents the test setup and its de-vice requirements. Chapter 3 explains the particular measurements. Finally, ordering information is given.
Broadcasting Test Setup
7BM101_0E 3
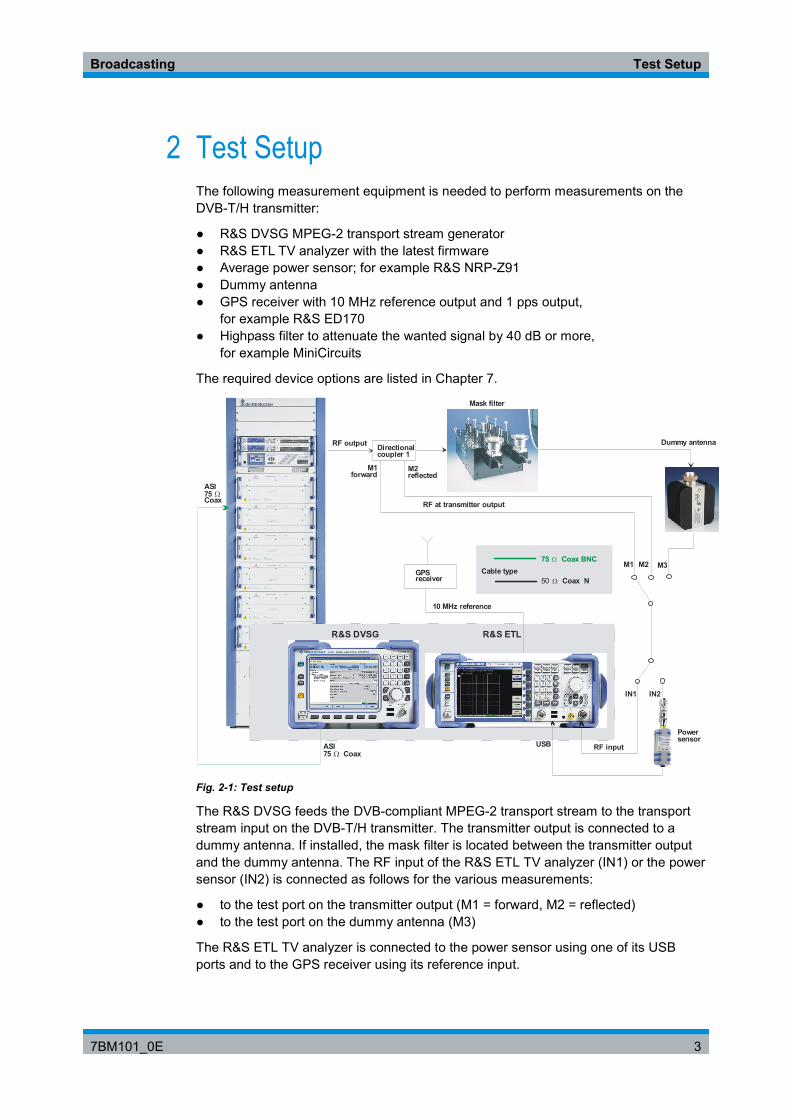
2 Test Setup The following measurement equipment is needed to perform measurements on the DVB-T/H transmitter:
R&S DVSG MPEG-2 transport stream generator R&S ETL TV analyzer with the latest firmware Average power sensor; for example R&S NRP-Z91 Dummy antenna GPS receiver with 10 MHz reference output and 1 pps output,
for example R&S ED170 Highpass filter to attenuate the wanted signal by 40 dB or more,
for example MiniCircuits
The required device options are listed in Chapter 7.
R&S DVSG
RF at transmitter output
Mask filter
GPSreceiver
10 MHz reference
Dummy antenna
M1forward
M2 reflected
RF output Directionalcoupler 1
75 Coax BNC Ω
50 Ω Coax NCable type
ASI75 Coax Ω
ASI75Coax
Ω
R&S ETL
USBPowersensor
M1 M2 M3
IN1 IN2
RF input
Fig. 2-1: Test setup
The R&S DVSG feeds the DVB-compliant MPEG-2 transport stream to the transport stream input on the DVB-T/H transmitter. The transmitter output is connected to a dummy antenna. If installed, the mask filter is located between the transmitter output and the dummy antenna. The RF input of the R&S ETL TV analyzer (IN1) or the power sensor (IN2) is connected as follows for the various measurements:
to the test port on the transmitter output (M1 = forward, M2 = reflected) to the test port on the dummy antenna (M3)
The R&S ETL TV analyzer is connected to the power sensor using one of its USB ports and to the GPS receiver using its reference input.
Broadcasting Test Setup
7BM101_0E 4
Default settings on the R&S ETL TV analyzer
Unless specified otherwise in the individual sections, the following default settings are always used on the R&S ETL TV analyzer to perform TV transmitter measurements:
Reference frequency
Set R&S ETL SETUP:REFERENCE EXT to use the external 10 MHz reference fre-quency.
Spectrum Analyzer mode
Center Frequency at mid-channel Span 15 MHz or 20 MHz Detector RMS (in the TRACE menu) RBW 30 kHz VBW 300 kHz Sweep Time 2 s
TV Analyzer/Receiver mode
Digital TV Settings: OFDM DVB-T/H Bandwidth 6 MHz, 7 MHz, or 8 MHz, depending on standard Select RF depending on transmitter frequency Special Settings: System Opt. Slow/Laboratory Important: Always press MENU:ADJUST ATTENUATION before every measure-
ment

Broadcasting Measurements
Transmitter Output Level
7BM101_0E 5
3 Measurements 3.1 Transmitter Output Level
The definition of transmitter output level for digital television is different from its defini-tion for analog television. DVB-T/H signals are noiselike signals, in contrast to vestigial sideband, AM-modulated analog TV signals. In the case of analog television, the syn-chronous pulse peak power is used as the power definition, while for digital television, the average power is measured versus the RMS value. The average power is constant for digital television, and not dependent on the picture contents, like it is in analog tele-vision. The transmitter output is followed by the mask filter, which can be implemented in either a critical or an uncritical mask. The filter itself has an attenuation of between 0.1 dB and 0.3 dB, depending on the technology used (coaxial or dual-mode waveguide). Therefore, the power has to be recorded both before and after the mask filter. The measurement itself takes place using a power sensor. This is connected to a calibrated test port on the transmitter output or on the dummy antenna. Measurements using the power sensor provide the greatest accuracy; alternatively, of course, the sig-nal level can also be measured using the R&S ETL TV analyzer set to TV Analyzer/Receiver mode via the RF input on the R&S ETL.
Procedure:
1. Connect the power sensor (IN2) (connected to R&S ETL via USB) to the test port on the transmitter output (M1).
2. Switch transmitter on.
3. On the R&S ETL, press MENU:POWER METER.
4. Read the measured value from the R&S ETL.
5. Alternatively, feed a signal into the RF input on the R&S ETL (50 ohm, IN1) and read the level from the MEAS:OVERVIEW menu.
6. Add to that the correction value from the test port.
7. Connect the power sensor (IN2) (connected to R&S ETL via USB) to the test port on the dummy antenna (M3).
8. Read the measured value from the R&S ETL.
9. Alternatively, feed a signal into the RF input (50 Ohm, IN1) on the R&S ETL and read the level from the MEAS:OVERVIEW menu (first press ADJUST ATTENUA-TION).
10. Add to that the correction value from the test port.

Broadcasting Measurements
Transmitter Output Level
7BM101_0E 6
Fig. 3-1: DVB-T spectrum with integrated reading from the power sensor

Broadcasting Measurements
Transmitter Output Level
7BM101_0E 7
Fig. 3-2: MEAS:OVERVIEW menu in TV Analyzer/Receiver mode on the R&S ETL with integrated level readings (zoom level, level result in the 2nd table row and along the bottom of the test screen)
Similarly, the power sensor (IN2) can also be used to measure the reflected power at measurement point M2 at the test port on the transmitter output.

Broadcasting Measurements
Bit Error Ratio
7BM101_0E 8
3.2 Bit Error Ratio
DVB-T/H provides an outer and an inner error correction: RS (Reed-Solomon) block coding and convolutional coding. The counterparts at the receiver end are the Viterbi decoder and the Reed-Solomon decoder. As a result, the following three BERs (Bit Error Ratios) are available in the DVB-T/H receiver:
Bit error ratio before Viterbi (BER before Viterbi) Bit error ratio after Viterbi or before Reed-Solomon (BER before RS) Bit error ratio after Reed-Solomon (BER after RS)
All interference on a DVB-T/H transmission path can be expressed as bit error ratios (BER). In the case of a functional DVB-T/H transmitter, only the BER before Viterbi can differ from null. It will lie in the range of 10–9 or less. With small BERs, it is necessary to select correspondingly long measurement times. For acceptance tests, these will be hours, while they will be minutes for monitoring tests.
Procedure:
1. Connect the R&S ETL TV analyzer to the test port on the transmitter output (M1) or the dummy antenna (M3).
2. Switch transmitter on.
3. On the R&S ETL, select OVERVIEW from the test menu.
4. Press MENU:ADJUST ATTENUATION.
5. On the R&S ETL, press BER reset.
6. Allow the test – lasting from several minutes to several hours – to run completely.
7. Read and document the BERs.

Broadcasting Measurements
Bit Error Ratio
7BM101_0E 9
Fig. 3-3: R&S ETL test screen with zoomed BER before Viterbi, as well as BER before RS and packet errors after RS

Broadcasting Measurements
Modulation Error Ratio
7BM101_0E 10
3.3 Modulation Error Ratio
The modulation error ratio (MER) is a measure of the sum of all interference that af-fects a digital TV signal. It is typically expressed in dB as a logarithmic relationship be-tween the RMS value of the signal amplitude and the MER. A high MER value indi-cates good signal quality. In practice, the MER lies in the range of 0 dB to 40 dB. A good DVB-T/H transmitter has a MER in the range of approximately 35 dB. When re-ceiving DVB-T/H signals over a roof antenna with gain, a MER of 20 dB to 30 dB would be measurable at the antenna box. Values between 13 dB and 20 dB are expended for portable receivers with a room antenna. At the same time, the MER is the single most important quality parameter for a DVB-T/H transmitter. The MER can be expressed as an averaged value over all COFDM subcarriers or as MER(f) in a graph via the DVB-T/H channel.
Procedure:
1. Connect the R&S ETL TV analyzer (IN1) to the test port on the transmitter output (M1) or the dummy antenna (M3).
2. Switch transmitter on.
3. On the R&S ETL, select MEASURE:MODULATION ANALYSIS: MER(f).
4. Use the SPAN menu to select the carrier range FULL SPAN (0 to 6816 or 0 to 1705).
5. Important: SPEC SETTING:SYSTEM OPT:Slow/Laboratory
6. Select MENU:ADJUST ATTENUATION.
7. Use PRINT to print the test screen.
Fig. 3-4: MER as a function of the frequency, and integrations of the MER averaged over the channel
Broadcasting Measurements
I/Q Imbalance on the Modulator
7BM101_0E 11
3.4 I/Q Imbalance on the Modulator
DVB-T/H modulators are essentially an IFFT signal processing block followed by an I/Q modulator. This I/Q modulator can be either digital or analog. If a DVB-T/H modula-tor uses direct modulation, then the I/Q modulator is analog. In this case, it must be aligned cleanly and must not exhibit any of the following:
I/Q imbalance I/Q phase error, quadrature error Carrier leakage
Carrier leakage is recognizable directly in mid-band (around carrier number 3408 or. 852) on MER(f) as a "notch" and results in a contorted and compressed constellation diagram in mid-band. I/Q imbalance and I/Q phase error negatively affect the MER of all COFDM carriers. The carriers above DVB-T/H mid-band relate to the carriers under mid-band and vice versa.
Procedure:
1. Connect the R&S ETL TV analyzer (IN1) to the test port on the transmitter output (M1) or the dummy antenna (M3).
2. Switch transmitter on.
3. On the R&S ETL, select MEAS:MODULATION ANALYSIS:MODULATION ER-RORS from the menu.
4. Important: SPEC SETTING:SYSTEM OPT:Slow/Laboratory
5. Select MENU:ADJUST ATTENUATION.
6. Print the test screen or document the amplitude imbalance, quadrature error, and carrier leakage.

Broadcasting Measurements
I/Q Imbalance on the Modulator
7BM101_0E 12
Fig. 3-5: Modulation errors
Fig. 3-6: I/Q imbalance and I/Q phase error
Broadcasting Measurements
Shoulder Attenuation
7BM101_0E 13
3.5 Shoulder Attenuation
DVB-T/H transmitters include very linear AB amplifiers. These are further linearized by a digital preliminary correction stage in the modulator. In spite of these, some residual nonlinearities remain. These cause intermodulation products to form from the many COFDM carriers. These intermodulation products are recognizable as "white nose" in the user channel and along the edges. These edges are called DVB-T/H signal shoul-ders. To further reduce the shoulders, mask filters can be used in a critical or uncritical mask. An important measurement parameter is the shoulder attenuation. It is deter-mined either via cursor measurements using a spectrum analyzer or using the "tangent method" defined in the DVB measurement guidelines [1]. The R&S ETL TV analyzer supports both, i.e. the cursor method in Spectrum Analyzer mode and the tangent method in DVB-T/H Analyzer mode. Both methods have practical uses; however, be-cause of their different definitions, they do not lead directly to the same result:

Broadcasting Measurements
Shoulder Attenuation
7BM101_0E 14
Procedure for method 1 (cursor method):
1. Connect the R&S ETL (IN1) to the corresponding test port M1 or M3.
2. Change the R&S ETL to Spectrum Analyzer mode.
3. Select the following settings on the spectrum analyzer:
a. Center Frequency at mid-band on the DVB-T/H channel b. Span 15 MHz c. Detector RMS d. RBW 30 kHz e. VBW 300 kHz f. Sweep Time 2 s g. Marker 1 at center h. Marker 2 at + 4.2 MHz over center (8 MHz channel) i. Marker 3 at –4.2 MHz under center (for 7 MHz channel use +/– 3.7 MHz) j. Read the marker delta values.
Fig. 3-7: Measuring the shoulder attenuation using the cursor method at +/– 4.2 MHz in the 8 MHz DVB-T channel

Broadcasting Measurements
Shoulder Attenuation
7BM101_0E 15
Procedure for method 2 (tangent method):
1. Connect the R&S ETL to the corresponding test port M1 or M3.
2. Change the R&S ETL to TV Analyzer/Receiver mode.
3. Press MENU:ADJUST ATTENUATION.
4. Select MEAS:SPECTRUM.
5. Set SHOULDER ON.
6. Print the test screen.
Fig. 3-8: Measuring the shoulder attenuation using the tangent method in accordance with the DVB measurement guidelines [1]

Broadcasting Measurements
Shoulder Attenuation
7BM101_0E 16
Table 3-1: Tolerance masks for shoulder attenuation using the uncritical mask:
frel [MHz] at 7 MHz channel bandwidth
frel [MHz] at 8 MHz chan-nel bandwidth
Attenuation [dB] as compared to total channel power at 4 kHz reference bandwidth
Attenuation [dB] at 7 MHz channel band-width
Attenuation [dB] at 8 MHz channel band-width
+/–3.4 +/–3.9 –32.2 (7 MHz)
–32.8 (8 MHz)
0 0
+/–3.7 +/–4.2 –73 –40.8 –40.2
+/–5.25 +/–6.0 –85 –52.8 –52.2
+/–10.5 +/–12.0 –110 –77.8 –77.2
+/–13.85 –126 –93.8
Table 3-2: Tolerance masks for shoulder attenuation using the critical mask:
frel [MHz] at 7 MHz channel bandwidth
frel [MHz] at 8 MHz chan-nel bandwidth
Attenuation [dB] com-pared to total channel power at 4 kHz refer-ence bandwidth
Attenuation [dB] at 7 MHz channel band-width
Attenuation [dB] at 8 MHz channel band-width
+/–3.4 +/–3.9 –32.2 (7 MHz)
–32.8 (8 MHz)
0 0
+/–3.7 +/–4.2 –83 –50.8 –50.2
+/–5.25 +/–6.0 –95 –62.8 –62.2
+/–10.5 +/–12.0 –120 –87.8 –87.2
+/–13.85 –126 –93.8
Adjacent channel transmissions farther away at over +/–10 MHz are more difficult to measure, because this requires an attenuation of over 80 dB as compared to the user channel. To measure these adjacent channel transmissions, the useful channel must be masked using a notch filter calibrated to the useful channel so that the spectrum analyzer can be used to conduct the measurement. It is also possible to measure the mask filter using the tracking generator in order to mathematically subtract the mask filter characteristics from the DVB-T/H spectrum before the mask filter and thus to simulate a measurement after the mask filter.
Broadcasting Measurements
Out-of-Band Emissions
7BM101_0E 17
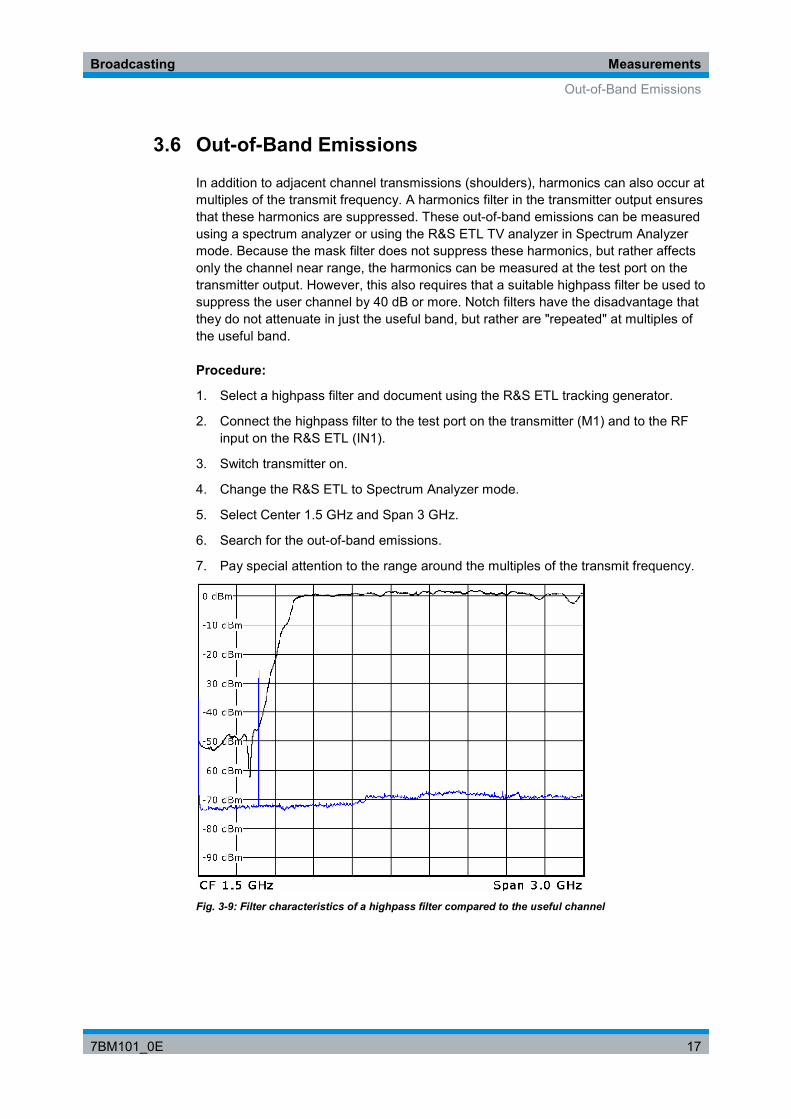
3.6 Out-of-Band Emissions
In addition to adjacent channel transmissions (shoulders), harmonics can also occur at multiples of the transmit frequency. A harmonics filter in the transmitter output ensures that these harmonics are suppressed. These out-of-band emissions can be measured using a spectrum analyzer or using the R&S ETL TV analyzer in Spectrum Analyzer mode. Because the mask filter does not suppress these harmonics, but rather affects only the channel near range, the harmonics can be measured at the test port on the transmitter output. However, this also requires that a suitable highpass filter be used to suppress the user channel by 40 dB or more. Notch filters have the disadvantage that they do not attenuate in just the useful band, but rather are "repeated" at multiples of the useful band.
Procedure:
1. Select a highpass filter and document using the R&S ETL tracking generator.
2. Connect the highpass filter to the test port on the transmitter (M1) and to the RF input on the R&S ETL (IN1).
3. Switch transmitter on.
4. Change the R&S ETL to Spectrum Analyzer mode.
5. Select Center 1.5 GHz and Span 3 GHz.
6. Search for the out-of-band emissions.
7. Pay special attention to the range around the multiples of the transmit frequency.
Fig. 3-9: Filter characteristics of a highpass filter compared to the useful channel
Broadcasting Measurements
Out-of-Band Emissions
7BM101_0E 18
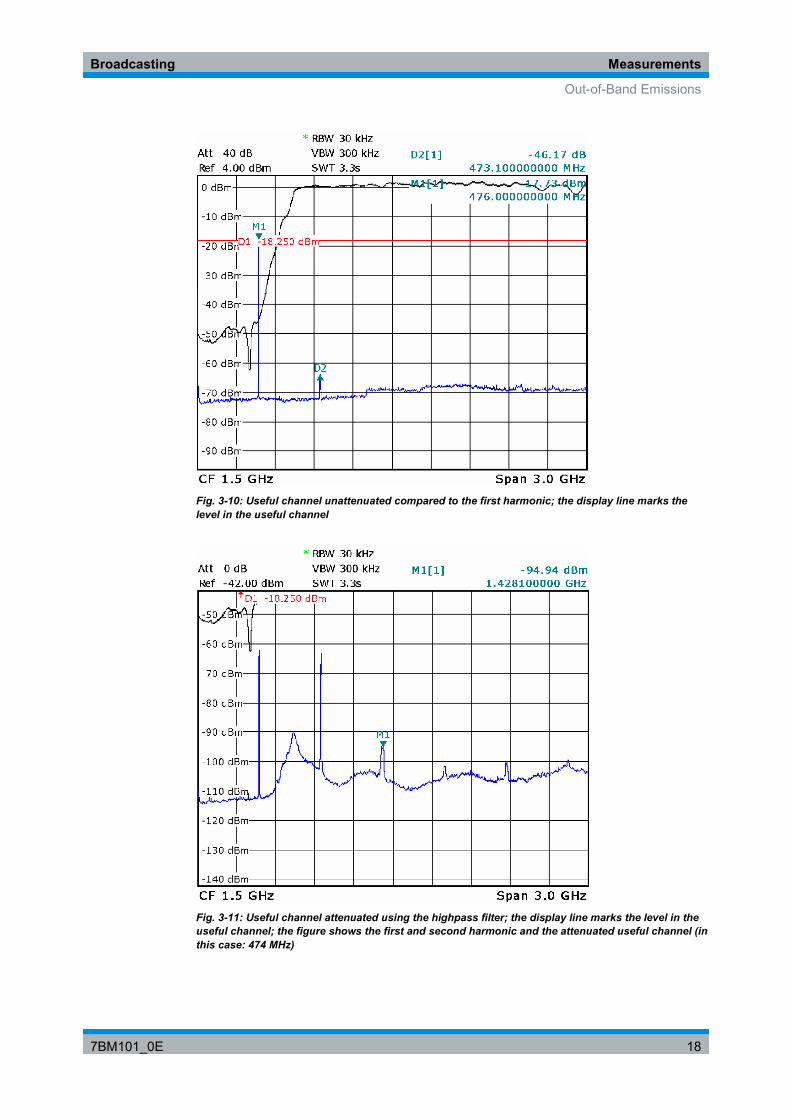
Fig. 3-10: Useful channel unattenuated compared to the first harmonic; the display line marks the level in the useful channel
Fig. 3-11: Useful channel attenuated using the highpass filter; the display line marks the level in the useful channel; the figure shows the first and second harmonic and the attenuated useful channel (in this case: 474 MHz)

Broadcasting Measurements
Crest Factor
7BM101_0E 19
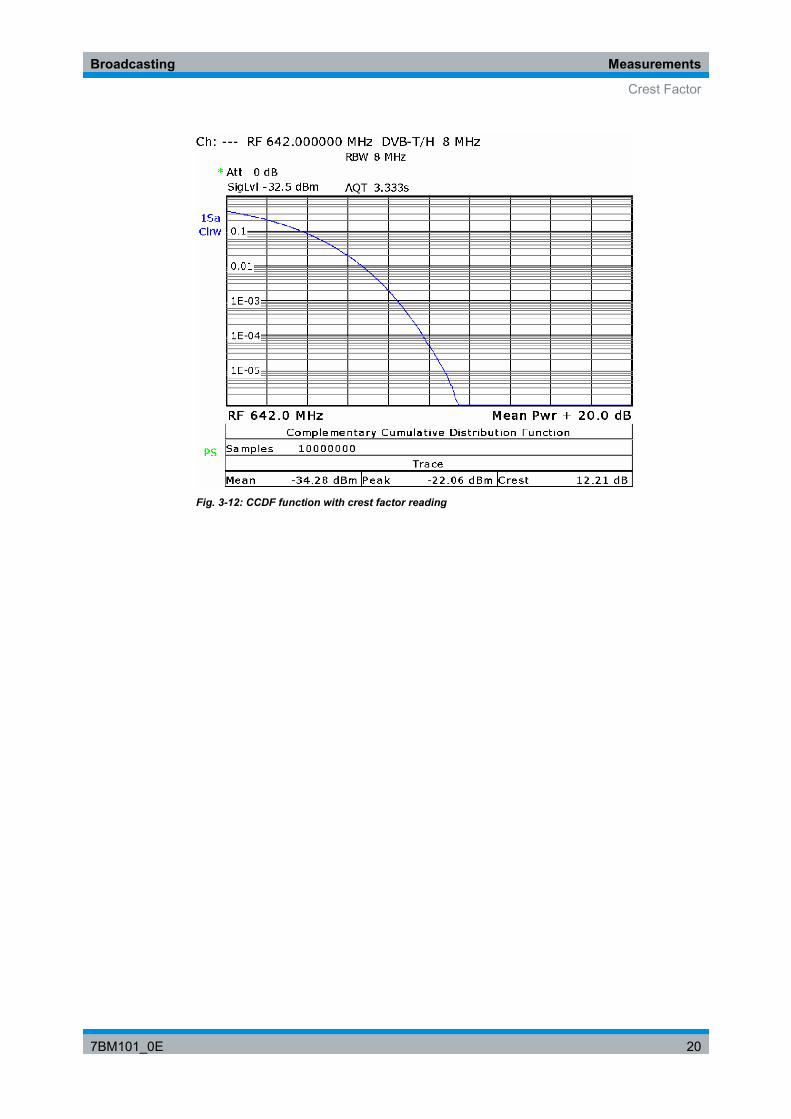
3.7 Crest Factor
The crest factor defines the relationship between the highest occurring signal ampli-tude and the RMS value of a signal. It is defined as:
⋅=
RMS
PEAK
UUCf log20
OFDM signals exhibit a very high crest factor because essentially all carriers could be overlaid or even eliminated at any given moment. In the case of OFDM, the following relationship applies to the theoretical crest factor:
( )NCfOFDM 2log10 ⋅= , where N = number of carriers
For DVB-T/H in 8K mode, it is theoretically over 40 dB. On transmitters, it is typically limited to about 13 dB. It is important to know the crest factor so that the components that follow the transmitter – such as the mask filter, the antenna splitter, the coaxial cable, and the antenna – can be adequately dimensioned. The crest factor is meas-ured using the R&S ETL directly at the test port on the transmitter (M1).
Procedure:
1. Connect the R&S ETL to the test port on the transmitter (M1).
2. Switch transmitter on.
3. Select MEAS:MODULATON ANALYSIS:CCDF from the menu.
4. Press MENU:ADJUST ATTENUATION
5. Allow the test to run completely.
6. Read the measured value on the R&S ETL.
7. Add a correction value of 3 dB1 and note the result.
1 For measurements with a spectrum analyzer featuring CCDF (complementary cumu-lative distribution function) capability, it should be taken into account that an instrument of this type measures the peak envelope power (PEP) rather than the absolute voltage peaks that occur in the amplifier. The measured value, therefore, has to be corrected by a factor of √2 or 3.01 dB. [2]
Broadcasting Measurements
Crest Factor
7BM101_0E 20
Fig. 3-12: CCDF function with crest factor reading
Broadcasting Measurements
Amplitude Frequency Response and Group Delay
7BM101_0E 21
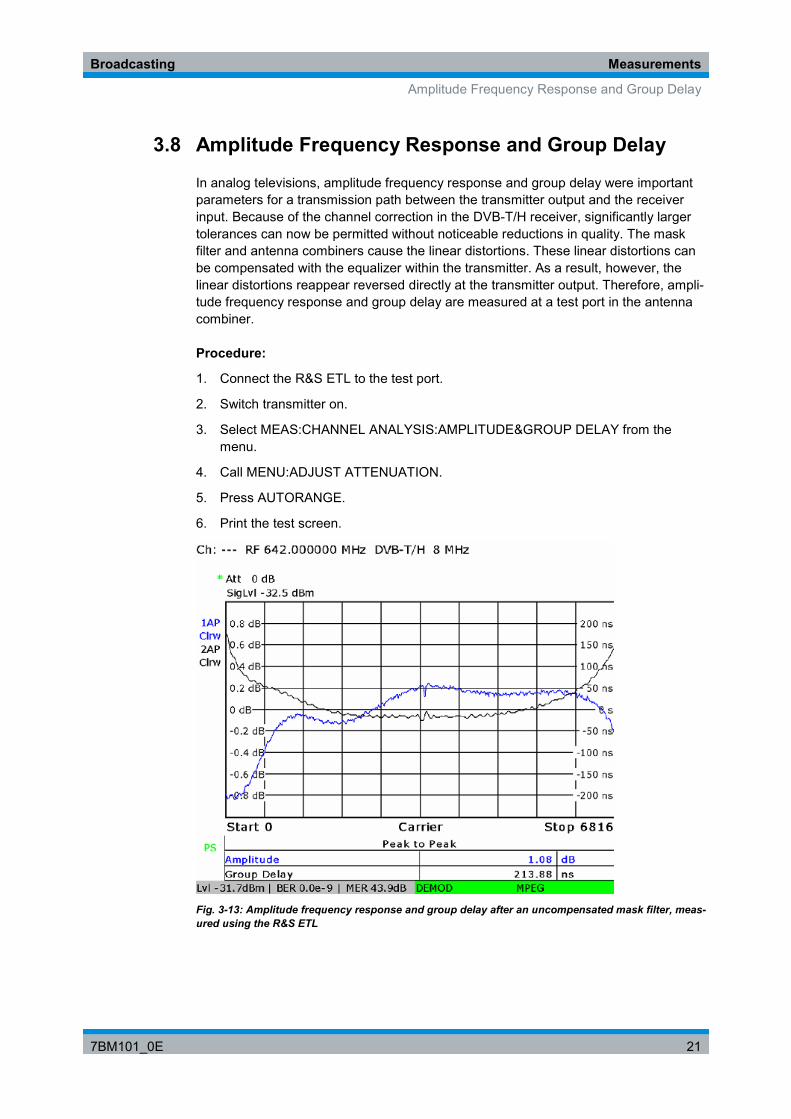
3.8 Amplitude Frequency Response and Group Delay
In analog televisions, amplitude frequency response and group delay were important parameters for a transmission path between the transmitter output and the receiver input. Because of the channel correction in the DVB-T/H receiver, significantly larger tolerances can now be permitted without noticeable reductions in quality. The mask filter and antenna combiners cause the linear distortions. These linear distortions can be compensated with the equalizer within the transmitter. As a result, however, the linear distortions reappear reversed directly at the transmitter output. Therefore, ampli-tude frequency response and group delay are measured at a test port in the antenna combiner.
Procedure:
1. Connect the R&S ETL to the test port.
2. Switch transmitter on.
3. Select MEAS:CHANNEL ANALYSIS:AMPLITUDE&GROUP DELAY from the menu.
4. Call MENU:ADJUST ATTENUATION.
5. Press AUTORANGE.
6. Print the test screen.
Fig. 3-13: Amplitude frequency response and group delay after an uncompensated mask filter, meas-ured using the R&S ETL

Broadcasting Measurements
Initial Carrier Frequency Tolerance
7BM101_0E 22
3.9 Initial Carrier Frequency Tolerance
In single frequency networks (SFN), in particular, very stringent requirements are placed on the initial carrier frequency tolerance (ICFT) of a DVB-T/H transmitter of less than 10–9. Due to the external 10 MHz reference from the GPS receiver, the ICFT of the transmitter can be measured using the R&S ETL TV analyzer operating in TV Ana-lyzer/Receiver mode. The measurement can take place at the test port (M1) on the transmitter output.
Procedure:
1. Connect the R&S ETL to the test port on the transmitter output.
2. Switch transmitter on.
3. Select MEAS:OVERVIEW from the menu.
4. Press MENU:ADJUST ATTENUATION
5. Note the Carrier Freq Offset reading.
Fig. 3-14: Measuring the initial carrier frequency tolerance (ICFT) of a DVB-T/H transmitter using the R&S ETL

Broadcasting Measurements
TPS
7BM101_0E 23
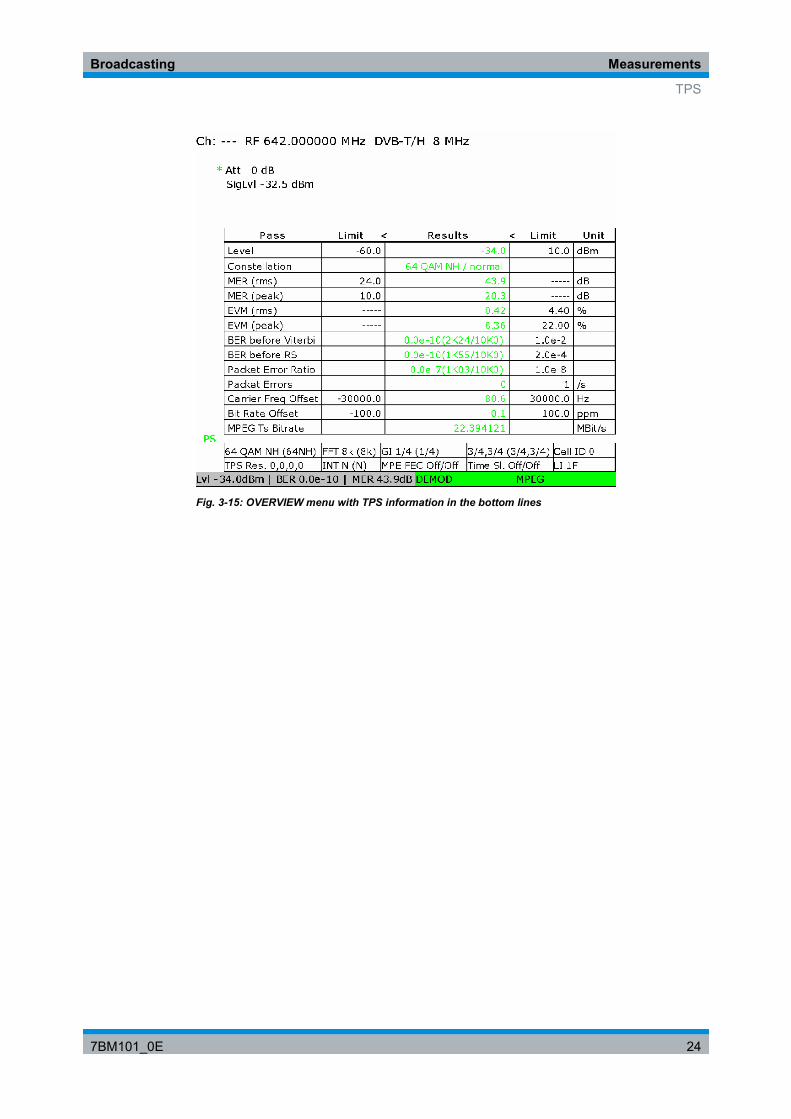
3.10 TPS
In the case of DVB-T/H, the transmission parameter signaling (TPS) carrier transmits a total of 67 TPS bits in the four frames of a superframe. The TPS bits signal the cur-rently selected transmission parameter. The 67 TPS bits can sometimes differ in the four frames of a superframe. They comprise the following:
Initialization word Length indicator Data burst in line with DVB-T standard Reserved bits Error protection
In an SFN, it is important that all involved transmitters send out the correct TPS bits and that these bits are completely identical. This is why the transmitted TPS informa-tion must be checked. Some of the reserved bits are currently being used as follows:
Cell ID DVB-H signaling
The TPS information is checked using an R&S ETL TV analyzer connected to the test port on the TV transmitter, in the MEAS:OVERVIEW menu.
Procedure:
1. Connect the R&S ETL to the test port on the transmitter output.
2. Switch transmitter on.
3. On the R&S ETL, select MEAS:OVERVIEW from the menu.
4. Print the test screen or take note of the final two lines.
Broadcasting Measurements
TPS
7BM101_0E 24
Fig. 3-15: OVERVIEW menu with TPS information in the bottom lines

Broadcasting Measurements
Constellation Diagram
7BM101_0E 25
3.11 Constellation Diagram
In addition to the measurements described above, the constellation diagram should also be documented. Any peculiarities will be immediately noticeable here. The con-stellation diagram is first printed in FULL SPAN, followed by the area around mid-band (carrier number 3408 in 8K mode or 852 in 2K mode). If the I/Q adjustment is not cor-rect, this would be noticeable on the distorted constellation diagrams in mid-band.
Procedure:
1. Connect the R&S ETL (IN1) to the test port on the transmitter output (M1).
2. Switch transmitter on.
3. Change the R&S ETL to TV Analyzer/Receiver mode.
4. Select MENU:ADJUST ATTENUATION.
5. Select MEAS:MODULATION ANALYSIS:CONST DIAGRAM.
6. Print the constellation diagram.
Fig. 3-16: Undistorted DVB-T constellation diagram (16QAM)
Broadcasting Abbreviations
7BM101_0E 26
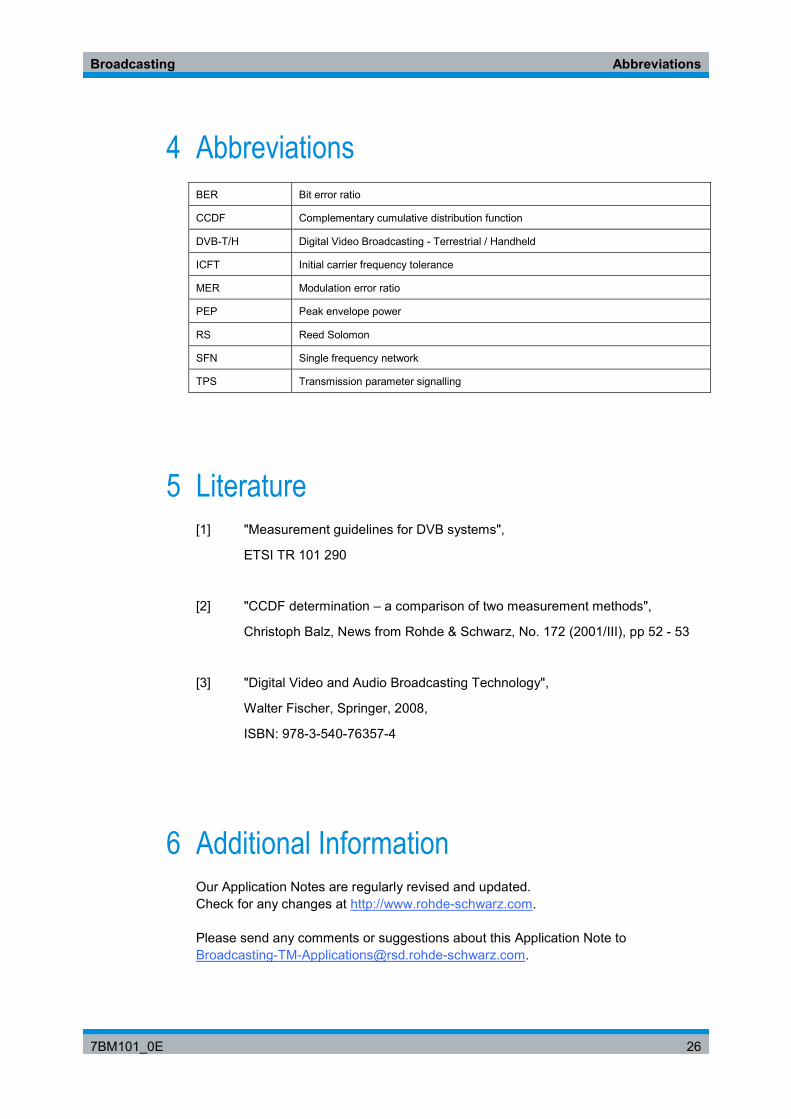
4 Abbreviations BER Bit error ratio
CCDF Complementary cumulative distribution function
DVB-T/H Digital Video Broadcasting - Terrestrial / Handheld
ICFT Initial carrier frequency tolerance
MER Modulation error ratio
PEP Peak envelope power
RS Reed Solomon
SFN Single frequency network
TPS Transmission parameter signalling
5 Literature [1] "Measurement guidelines for DVB systems",
ETSI TR 101 290
[2] "CCDF determination – a comparison of two measurement methods",
Christoph Balz, News from Rohde & Schwarz, No. 172 (2001/III), pp 52 - 53
[3] "Digital Video and Audio Broadcasting Technology",
Walter Fischer, Springer, 2008,
ISBN: 978-3-540-76357-4
6 Additional Information Our Application Notes are regularly revised and updated. Check for any changes at http://www.rohde-schwarz.com.
Please send any comments or suggestions about this Application Note to [email protected].
Broadcasting Ordering Information
7BM101_0E 27
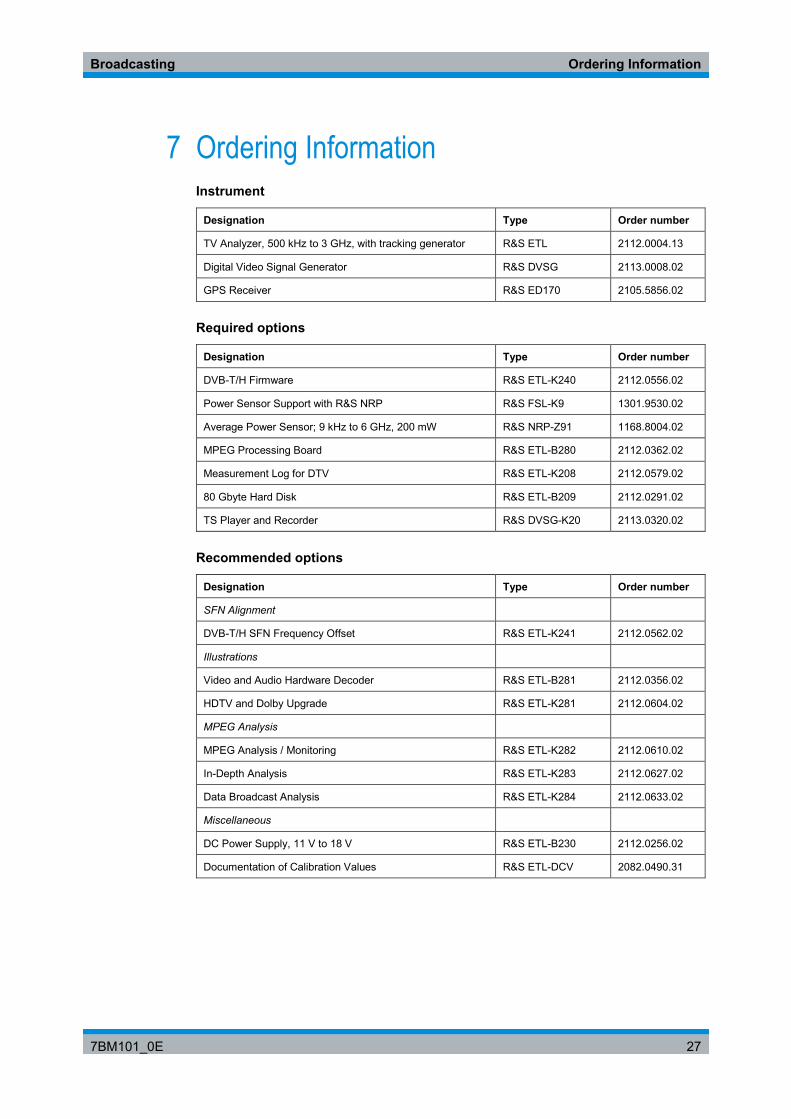
7 Ordering Information Instrument
Designation Type Order number
TV Analyzer, 500 kHz to 3 GHz, with tracking generator R&S ETL 2112.0004.13
Digital Video Signal Generator R&S DVSG 2113.0008.02
GPS Receiver R&S ED170 2105.5856.02
Required options
Designation Type Order number
DVB-T/H Firmware R&S ETL-K240 2112.0556.02
Power Sensor Support with R&S NRP R&S FSL-K9 1301.9530.02
Average Power Sensor; 9 kHz to 6 GHz, 200 mW R&S NRP-Z91 1168.8004.02
MPEG Processing Board R&S ETL-B280 2112.0362.02
Measurement Log for DTV R&S ETL-K208 2112.0579.02
80 Gbyte Hard Disk R&S ETL-B209 2112.0291.02
TS Player and Recorder R&S DVSG-K20 2113.0320.02
Recommended options
Designation Type Order number
SFN Alignment
DVB-T/H SFN Frequency Offset R&S ETL-K241 2112.0562.02
Illustrations
Video and Audio Hardware Decoder R&S ETL-B281 2112.0356.02
HDTV and Dolby Upgrade R&S ETL-K281 2112.0604.02
MPEG Analysis
MPEG Analysis / Monitoring R&S ETL-K282 2112.0610.02
In-Depth Analysis R&S ETL-K283 2112.0627.02
Data Broadcast Analysis R&S ETL-K284 2112.0633.02
Miscellaneous
DC Power Supply, 11 V to 18 V R&S ETL-B230 2112.0256.02
Documentation of Calibration Values R&S ETL-DCV 2082.0490.31

About Rohde & Schwarz Rohde & Schwarz is an independent group of companies specializing in electronics. It is a leading supplier of solutions in the fields of test and measurement, broadcasting, radiomonitoring and radiolocation, as well as secure communications. Established 75 years ago, Rohde & Schwarz has a global presence and a dedicated service network in over 70 countries. Company headquarters are in Munich, Germany.
Regional contact Europe, Africa, Middle East +49 1805 12 42 42* or +49 89 4129 137 74 [email protected]
North America 1-888-TEST-RSA (1-888-837-8772) [email protected]
Latin America +1-410-910-7988 [email protected]
Asia/Pacific +65 65 13 04 88 [email protected]
This document may only be used subject to the conditions of use set forth in the download area of the Rohde & Schwarz website.
Rohde & Schwarz GmbH & Co. KG Mühldorfstraße 15 | D - 81671 München Phone + 49 89 4129 - 0 | Fax + 49 89 4129 – 13777 www.rohde-schwarz.com