dv-gc-0027 8015c dro and rro by gcfid rev 4
TRANSCRIPT
Electronic Document Cover
The electronic copy of this document, as maintained on the TestAmerica Denver
computer network, is the controlled copy. Any printed copy becomes uncontrolled, and all work performed should ultimately reference the controlled electronic version.
Any printed or electronic copy of this document that is distributed external to TestAmerica Denver becomes uncontrolled. To arrange for automatic updates to
this document, contact TestAmerica Denver.
TestAmerica Laboratories, Inc. TestAmerica Denver 4955 Yarrow Street Arvada, CO 80002
Phone: 303-736-0100 Fax: 303-431-7171
TestAmerica Denver

Electronic Copy Only

SOP No. DV-GC-0027, Rev. 6 Effective Date:12/31/2015
Page No.: 2 of 50
Company Confidential & Proprietary
1.0 Scope and Application
1.1 This procedure is designed to measure the concentration of diesel range organics (DRO), jet fuels, and motor oils in water or solid samples by EPA Methods 8015B, 8015C, 8015D, using method 8000B and 8000C criteria. Also addressed in this SOP are Alaska Methods AK102 and AK103, and the NWTPH (Washington). The Oklahoma method appears in the appendix.
1.2 As most commonly defined, extractable hydrocarbons corresponds to a carbon range of C10 – C40 (boiling point range of approximately 170 °C to 56 0 °C). This carbon range can include kerosene, several types of jet fuel, several types of diesel fuels, and a number of types of light heating oils. Other petroleum hydrocarbon ranges, any within the C8 – C40 general range, may be characterized using this general method (details concerning the calibration and aliphatic reference standards need to be specified in the project work plan, and the final report must clearly indicate the range used).
1.3 Alaska Method AK102 for the determination of diesel range organics defines DRO as a carbon range from the beginning of C10 to the beginning of C25 (boiling point range of approximately 170°C to 400°C). Alaska met hod AK103 for the determination of residual range organics (RRO) defines RRO as a carbon range from the beginning of C25 to the end of C36 (boiling point range of approximately 400°C to 500°C). It should be noted that this is e ssentially the same range as defined for motor oil.
1.4 Table 1 provides boiling point information for the aliphatic hydrocarbons.
1.5 Petroleum products such as lubricating oils, waxes, and asphalt can have a significant fraction of higher molecular weight / higher boiling point components that are not detectable under the conditions of this method.
1.6 Analytes, Matrix(s), and Reporting Limits
1.6.1 The standard diesel reporting limit for this procedure is 0.25 mg/L for water samples and 4.0 mg/kg for soil samples. The jet fuel and motor oil reporting limits are 1 mg/L (0.5 mg/L for NWTPH) for water samples and 12 mg/kg for soil samples. Other reporting limits may apply to each of the listed methods with the level 1 initial calibration standard being the basis of the calibration for the lowest reporting limit.
1.6.2 Unless otherwise noted the most stringent criteria or common criteria will be reported and adhered to for the methods listed above.
1.6.3 On occasion clients may request modifications to this SOP. These modifications are handled following the procedures outlined in SOP DV-QA-0031.

SOP No. DV-GC-0027, Rev. 6 Effective Date:12/31/2015
Page No.: 3 of 50
Company Confidential & Proprietary
2.0 Summary of Method
2.1 The method involves extracting hydrocarbons from aqueous or solid samples with methylene chloride. See SOPs DV-OP-0006, DV-OP-0016, DV-OP-0015, and DV-OP-0007 for water sample extraction, solid sample extraction, and extract concentration procedures, respectively. For solvent-miscible products, medium/high level options are provided. All associated methods typically extract 1 L of water to a final volume of 1 mL. For method 8015 the typical soil amount is 30 g. Method AK102 calls for the extraction of 10-30 g of soil and NWTPH indicates that 20 g of soil is extracted. The laboratory typically extracts 25 g of soil for AK102. All soil extractions are taken to a final volume of 1 mL if possible.
2.2 The methylene chloride extract is concentrated and analyzed with a gas chromatograph equipped with a flame ionization detector (GC/FID). Quantitation is performed by comparing the total peak area within the specified carbon range, both resolved and unresolved peaks, to the response of an authentic fuel or oil calibration standard.
3.0 Definitions
3.1 Diesel Range Organics (DRO): The sum of compounds producing chromatographic peaks, both resolved and unresolved, eluting from:
• the start of the n-decane peak (C10) to the end of n-octacosane (C28), or
• n-decane (C10) to (beginning of for AK102) n-pentacosane (C25), or
• n-decane (C10) and n-hexatriacontane (C36) for extended DRO.
The markers used for integration for quantitation of DRO varies by method. In order for the quantification to be effective the other methods should likewise include the entire hydrocarbon range for the representative hydrocarbon standard material in the calibration. It is not recommended that narrower carbon ranges be selected compared to the wider ranges available in the standards.
Method Quantitation Markers 8015 Integration begins at the apex minus the RT window for
the starting alkane and ends at the apex plus the RT window for the ending alkane Marker
Oklahoma Integration begins 0.1 minute before the initial alkane and ends 0.1 minutes beyond the ending alkane marker.
NWTPH Integration includes the whole of the hydrocarbon pattern (peaks at least down to 10% of the highest representative peak) and that the integration breaks where multiple hydrocarbon patterns are indicated for a single sample.
3.2 Diesel Calibration Standard: A retail-purchased diesel #2 or fuel oil #2 (the two products are essentially the same crude oil distillation cut) used as the calibration
SOP No. DV-GC-0027, Rev. 6 Effective Date:12/31/2015
Page No.: 4 of 50
Company Confidential & Proprietary
stock. The Oklahoma standard uses a ten component (C10-C28, even homologs) blend of alkanes.
3.3 Motor Oil (MO): The sum of the compounds producing chromatographic peaks, both resolved and unresolved, eluting from
• the start of the n-cosane (C20) to n-octatriacontane (C38), or
• (the beginning of for AK103) n-pentacosane (C25) to (the end of for AK103) n-hexatriacontane (C36).
Alaska Method AK103 defines this latter range as “residual range organics” or RRO.
3.4 Jet Propellant-8 (JP-8): Also referred to as Jet fuel-8. The hydrocarbon range for this fuel is typically from C8 to C12 or from the start of n-octane to the end of n-dodecane. In cases where the solvent peak interferes with the integration of the C8
part of the chromatogram an adjustment may be made to start the integration just past the end of the solvent front.
3.5 Bunker C: The sum of compounds producing chromatographic peaks, both resolved and unresolved, eluting from:
• the start of the n-hexadecane peak (C16) to the end of n-hexatriacontane (C36).
3.6 Oklahoma: These carbon ranges and standards are defined and explained in detail in Appendix 1.
4.0 Interferences
4.1 Although primarily designed as a petroleum hydrocarbon test procedure, other organic compounds including, but not limited to, animal and vegetable oil and grease, chlorinated hydrocarbons, phenols, phthalate esters, and biogenic terpenes are measurable under the conditions of this method. A silica gel cleanup can be used to remove these biogenic and substituted hydrocarbons. The details of the cleanup procedure are found in SOP DV-OP-0007.
4.2 Heavier petroleum products such as lubricating oil and crude oil also produce a response within the retention time range for DRO. As defined in the method, the DRO results include these compounds.
4.3 Method interferences are reduced by washing all glassware in accordance with SOP DV-OP-0004. At least one method blank must be analyzed with each extraction batch to demonstrate that the samples are free from method interferences.
4.4 High-purity reagents must be used to minimize interference problems.

SOP No. DV-GC-0027, Rev. 6 Effective Date:12/31/2015
Page No.: 5 of 50
Company Confidential & Proprietary
4.5 Contamination by carryover can occur whenever high-level and low-level samples are sequentially analyzed. Whenever an unusually concentrated sample is encountered, it should be followed by an analysis of a solvent blank to check for cross-contamination. It is the laboratory’s policy to reanalyze any samples that follow an unusually concentrated sample (above the high level calibration standard) and that show detectable levels of the same compounds that appeared in the preceding concentrated sample.
5.0 Safety
5.1 Employees must abide by the policies and procedures in the Environmental Health and Safety Manual (CW-E-M-001), Radiation Safety Manual and this document. This procedure may involve hazardous material, operations and equipment. This SOP does not purport to address all of the safety problems associated with its use. It is the responsibility of the user of the method to follow appropriate safety, waste disposal and health practices under the assumption that all samples and reagents are potentially hazardous. Safety glasses, gloves, lab coats and closed-toe, nonabsorbent shoes are a minimum.
5.2 Specific Safety Concerns or Requirements
5.2.1 Eye protection that satisfies ANSI Z87.1, laboratory coat, and nitrile gloves must be worn while handling samples, standards, solvents, and reagents. Disposable gloves that have been contaminated must be removed and discarded; non-disposable gloves must be cleaned immediately.
5.2.2 The gas chromatograph contains zones that have elevated temperatures. The analyst needs to be aware of the locations of these zones, and must cool them to room temperature prior to working on them.
5.2.3 There are areas of high voltage in the gas chromatograph. Depending on the type of work involved, either turn the power to the instrument off, or disconnect it from its source of power.
5.3 Primary Materials Used
The following is a list of the materials used in this method, which have a serious or significant hazard rating.
NOTE: This list does not include all materials used in the method. The table contains a summary of the primary hazards listed in the SDS for each of the materials listed in the table.
A complete list of materials used in the method can be found in the reagents and materials section. Employees must review the information in the SDS for each material before using it for the first time or when there are major changes to the SDS.
SOP No. DV-GC-0027, Rev. 6 Effective Date:12/31/2015
Page No.: 6 of 50
Company Confidential & Proprietary
Material (1) Hazards Exposure Limit (2) Signs and Symptoms of Exposure
Methylene Chloride
Carcinogen Irritant
Poison
25 ppm – TWA 125 ppm – STEL
Causes irritation to respiratory tract. Has a strong narcotic effect with symptoms of mental confusion, light-headedness, fatigue, nausea, vomiting, and headache. Causes irritation, redness, and pain to the skin and eyes. Prolonged contact can cause burns. Liquid degreases the skin. May be absorbed through skin.
Acetone Flammable 1000 ppm – TWA Inhalation of vapors irritates the respiratory tract. May cause coughing, dizziness, dullness, and headache.
(1) Always add acid to water to prevent violent reactions. (2) Exposure limit refers to the OSHA regulatory exposure limit..
6.0 Equipment and Supplies
6.1 Instrumentation
Gas Chromatograph: Analytical system including appropriate gas supply and all required accessories, including a Flame Ionization Detector (FID), column supplies, gases, and syringes. A data system capable of determining peak areas using a forced baseline and baseline projection is required. A data system capable of storing and reintegrating chromatographic data is recommended. The instruments used for this SOP are Hewlett Packard 5890 series II instrument U and Agilent 7890 instrument U2.
6.2 Supplies
6.2.1 Chromatography Columns
6.2.1.1 Restek Corporation Rtx-1 (fused silica), 30 m, 0.32 mm ID, 0.25 µm film thickness used for both U and U2 (front).
6.2.1.2 HP-5 (fused silica), 30 m, 0.25 mm ID, 0.25 µm film thickness used for the rear injector in U2.
6.2.1.3 Other columns that meet the performance criteria stipulated in Section 10.0 may be used. Capillary columns are required to achieve the necessary resolution.
6.2.2 2-mL glass vials with Teflon-lined cap (autosampler vials) and limited volume liners.
6.2.3 40-mL VOA vials with Teflon-lined screw caps.
6.2.4 Thermogreen septa, ferrules, Siltek injection port liners, Siltek glass wool. Use Agilent liner 5183-4647 for instrument U2.
6.2.5 Microsyringes: 1, 5, 10, 25, 100, 250, 500, 1000, and 5000 µL.
6.2.6 Volumetric flasks: 10.0, 50.0, and 100 mL, Class A glass.

SOP No. DV-GC-0027, Rev. 6 Effective Date:12/31/2015
Page No.: 7 of 50
Company Confidential & Proprietary
6.2.7 An analytical balance capable of accurately weighing 0.0001 g must be used for preparing standards. A top-loading balance capable of weighing to the nearest 0.01 g must be used for sample preparation.
6.3 Computer Software and Hardware
Please refer to the master list of documents and software located on R:\QA\Read\Master List of Documents\Master List of Documents, Software and Hardware.xls or current revision for the current software and hardware to be used for data processing.
7.0 Reagents and Standards
7.1 Reagents
7.1.1 Methylene chloride, pesticide grade or equivalent. Each lot must be approved for use in accordance with CA-Q-S-001.
7.1.2 Acetone, pesticide grade or equivalent. Each lot must be approved for use in accordance with CA-Q-S-001.
7.1.3 Ottawa sand (reagent sand) for solid matrix method blanks and lab control samples.
7.1.4 Carrier gas, >/= 99.999999% pure hydrogen.
7.1.5 Make-up gas, >/= 99.99980% pure nitrogen.
7.1.6 Compressed air for the FID.
7.2 Standards
NOTE: The availability of the specific commercial standard solutions upon which the following sections are based may change at any time. As a result, it may be necessary to alter the dilution scheme presented herein to accommodate changes in stock standard concentrations. All such changes are documented in the standards preparation records.
7.2.1 RT Reference Standard: (DRO_RTMKR) DRO Mixture (Tennessee/Mississippi) and Calibration/Window Defining Hydrocarbon Standard. Current source Accu Std DRH-004S-R1-5x and Ultra Sci UST-210 both at 1000 ug/ml.
7.2.2 Stock Diesel Fuel Standard: (DRO_Fuel2) – Vendor purchased Diesel fuel oil #2 at a concentration of 50,000 µg/mL in methylene chloride. Current source Restek 31259.

SOP No. DV-GC-0027, Rev. 6 Effective Date:12/31/2015
Page No.: 8 of 50
Company Confidential & Proprietary
7.2.3 Stock Motor Oil / Residual Range Organics (RRO) Standard: (RRO_Comp) – Equal weights of 30-weight and 40-weight motor oils are composited and used to make this standard. Alternatively, the Alaska method standard may be purchased from a commercial source as a stock solution in methylene chloride at a concentration of 50,000 µg/mL. Current source is Ultra Sci RGO-724.
7.2.4 Stock Jet Fuel Standards, JP8: (DRO_JP8) - Purchased from a vendor at concentrations of 10,000 µg/mL in methylene chloride.
7.2.5 Stock Surrogate Solution: (DRO_SURR) – Purchased as a custom mix from a vendor, consisting of ortho-terphenyl and n-octacosane, at a concentration of 5,000 µg/mL each in methylene chloride. Accu Std S-8087-2.5x.
NOTE: Alaska Method AK103 (RRO) requires the use of n-triacontane-d62 as a surrogate. However, the Alaska Certification Office has granted approval to use n-octacosane (C28) as the surrogate.
7.2.6 Surrogate Spike Solution: (8015SurStock) – Dilute 1.0 mL of Stock Surrogate Solution to a final volume of 250 mL using 90:10 acetone:methylene chloride for a final concentration of each surrogate compound at 20 µg/mL.
7.2.7 Spike Solution: (8015LCS) (8015RROLCS) – Spike solutions may be prepared from alternate stock sources (Diesel uses AccuStandard DRO-AK-102-LCS-10x at 50mg/mL-8015DROStock ) as single or multi-component solutions in acetone as follows:
Standard Solution Vol of Standard
Solution (mL) Final Vol
(mL) Conc
(µµµµg/mL)
Stock Diesel Fuel Standard 8.0 200.0 2,000
Stock Jet Fuel Standard (JP8) 1.0 10.0 1,000
Stock RRO (or Motor Oil) Standard 1.0 10.0 5,000
7.2.8 Diesel Fuel Calibration Standards: (DRO L#)– Diesel fuel calibration standards are prepared in methylene chloride at 7 concentration levels using either the Stock Diesel Fuel Standard (Section 7.2.2)or a higher level calibration standard as summarized in the following table:
Level Fuel Standard
Solution Used Volume
Used (mL) Final
Volume (mL)
Final Diesel Conc
(µµµµg/mL)
Surrogate Conc
(µµµµg/mL)
7 Stock 0.6 1.0 30,000 NA
6 Stock + Stock Surrogate
1.5 and 0.075
5.0 15,000 75.0
5 Level 6 0.5 1.0 7500 37.5

SOP No. DV-GC-0027, Rev. 6 Effective Date:12/31/2015
Page No.: 9 of 50
Company Confidential & Proprietary
Level Fuel Standard Solution Used
Volume Used (mL)
Final Volume
(mL)
Final Diesel Conc
(µµµµg/mL)
Surrogate Conc
(µµµµg/mL)
4* Stock + Stock Surrogate
1 and 0.05 10 5000 25.0
3 Level 4 0.2 1.0 1000 5.0
2 Level 4 0.05 1.0 250 1.25
1 Level 4 0.02 1.0 100 0.5
NOTE: The Level 4 (*) calibration standard is also used as the continuing calibration verification (CCV) standard. Only the diesel fuel calibration standards contain the surrogates.
7.2.9 Jet Fuel Calibration Standards: (DRO_JP8_L#)– Jet Fuel (JF) Calibration standards are prepared in methylene chloride at 6 concentration levels using either the Stock Jet Fuel Standards (Section 7.2.4) or a higher level calibration standard as summarized in the following table:
Level Fuel Standard Solution Used
Volume Used (mL)
Final Volume (mL)
Final Conc (µµµµg/mL)
6 JF Stock NA NA 10,000
5 JF Stock 0.125 0.250 5000
4 JF Stock 0.0625 0.250 2500
3 JF* Stock 1.0 10.0 1000
2 JF Level 3 JF 0.125 0.250 500
1 JF Level 3 JF 0.025 0.250 100
NOTE: The Level 3 JF (*) jet fuel calibration standard is used as the CCV standard.
7.2.10 Motor Oil / RRO Calibration Standards: (RRO_L#) Motor Oil (MO) (or Alaska Method RRO) calibration standards are prepared in methylene chloride at 7 concentration levels using either the Stock Motor Oil / RRO Standard (Section 7.2.3) or a higher level calibration standard as summarized in the following table:
Level Fuel Standard Solution Used
Volume Used (mL)
Final Volume (mL)
Final Conc (µg/mL)
7RRO Stock 0.6 1.0 30,000
6RRO 7RRO 0.5 1.0 15,000
5 RRO 7RRO 0.250 1.0 7500
4 RRO* Stock 0.5 5.0 5000
3 RRO Level 4 RRO 0.2 1.0 1000
2 RRO Level 4 RRO 0.05 1.0 250
1 RRO Level 4 RRO 0.02 1.0 100
NOTE: The Level 4 MO (*) calibration standard is used as the CCV standard.
SOP No. DV-GC-0027, Rev. 6 Effective Date:12/31/2015
Page No.: 10 of 50
Company Confidential & Proprietary
7.2.11 Diesel Fuel Continuing Calibration Verification Standard (CCV): The Level 4 Diesel Fuel Calibration Standard (Section 7.2.8) is used as the CCV standard.
7.2.12 Jet Fuel CCV Standard: The Level 3 JF jet fuel calibration standard (Section 7.2.9) is used as the jet fuel CCV standard.
7.2.13 Motor Oil / RRO CCV Standard: The Level 4 MO motor oil / RRO calibration standard (Section 7.2.10) is used as the motor oil / RRO CCV standard.
7.2.14 Second-Source Calibration Verification Standards: A standard containing diesel fuel or motor oil/RRO in methylene chloride at a concentration of 1,000-µg/mL and jet fuel at a concentration of 2,500 µg/mL is used to verify each initial calibration. This standard uses diesel fuel, jet fuel and motor oil obtained from a source different than the source for the primary standard. (DRO_SS) AccuStandard DRO-AK-102_LCS-10x at 50 mg/mL. Stock surrogate standard. The second source is prepared by diluting 500 µL of DRO and 25 µL of surrogate to a final volume of 25 mL with methylene chloride.
(RRO_SS) AccuStandard FU-026-D-40x (30 weight) and FU-027-D-40x (40 weight) each at 20 mg/mL are combined in equal portions. The second source is prepared by diluting 125 µL of each stock to a final volume of 5 mL in methylene chloride.
(8015_JP8_SS) AccuStandard FU-015-D-40x at 20 mg/mL. The second source is prepared by diluting 250 µL to a final volume of 5 mL in methylene chloride.
7.3 Standards Verification
The standards verification process is described in SOP DV-QA-0015.
7.4 Storage of Stock Standards
Stock standard solutions are stored per vendor recommendations, generally at room temperature. Working level standard solutions are kept refrigerated at ≤ 6 ºC. Standard solutions must be replaced every six months or sooner as specified by the vendor. Standard solutions must be replaced more frequently if comparison with check standards indicates a problem.
7.5 Non-Routine Compounds
Other, non-routine compounds not listed in this section may be requested by a client and may be added to this procedure.
7.5.1 In these cases, all stock solutions will be obtained from commercial sources and will be verified with a second-source standard as described in SOP DV-QA-0015.

SOP No. DV-GC-0027, Rev. 6 Effective Date:12/31/2015
Page No.: 11 of 50
Company Confidential & Proprietary
7.5.2 Non-routine standards will be stored and treated as described in Section 7.4 above or as specified by the manufacturer.
7.5.3 Subsequent dilutions of specially requested compounds will be determined in a manner consistent with the client's recommendations for number of calibration points, inclusion of reporting limit, and concentration range adequate to represent the linearity of the instrument.
7.5.4 These specially requested, non-routine compounds either may be added to the dilution scheme used for routine compounds or may be prepared as a separate calibration.
7.5.5 All standards preparation for non-routine compounds shall be documented using the same method that is used for routine compounds.
7.5.6 The carbon range must be specified to accommodate the entirety of the hydrocarbon pattern.
8.0 Sample Collection, Preservation, Shipment and S torage
Matrix Sample
Container Min.
Sample Size
Preservation
Extraction Holding
Time
Analysis Holding
Time
Reference
Water 2 x 1 liter amber 1 liter Cool, <6oC and
not frozen 7 Days 40 Days
from extraction
SW-846
Water1 2 x 1 liter amber1 1 liter
Cool, <6oC and not frozen
pH < 2, HCl 14 Days
40 Days from
extraction
AK102/103 NWTPH
Soil 4- 8 oz amber Jar
30 grams
Cool, <6oC and not frozen 14 Days
40 Days from
extraction
SW-846 AK102/103
1 If requesting MS/MSD forAK102/103, must send at least 5 x 1 L bottles because method requires MS/MSD for DRO and RRO, which can’t be spiked together.
9.0 Quality Control
9.1 The minimum quality controls (QC), acceptance criteria, and corrective actions are described in this section. When processing samples in the laboratory, use the LIMS Method Comments to determine specific QC requirements that apply.
9.1.1 The laboratory’s standard QC requirements, the process of establishing control limits, and the use of control charts are described more completely in TestAmerica Denver policy DV-QA-003P, Quality Assurance Program.
9.1.2 Specific QC requirements for Federal programs, e.g., Department of Defense (DoD), Department of Energy (DOE), AFCEE, etc., are described in TestAmerica Denver policy DV-QA-024P, Requirements for Federal

SOP No. DV-GC-0027, Rev. 6 Effective Date:12/31/2015
Page No.: 12 of 50
Company Confidential & Proprietary
Programs. This procedure meets all criteria for DoD QSM 5.0 unless otherwise stated. Any deviation or exceptions from QSM 5.0 requirements must have prior approval in the project requirements. DoD QSM requirements and standard variances (if approved) for this procedure are summarized in Table VII.
9.1.3 Project-specific requirements can override the requirements presented in this section when there is a written agreement between the laboratory and the client, and the source of those requirements should be described in the project documents. Project-specific requirements are communicated to the analyst via Method Comments in the LIMS and the Quality Assurance Summaries (QAS) in the public folders.
9.1.4 Any QC result that fails to meet control criteria must be documented in a Nonconformance Memo (NCM). The NCM is automatically sent to the laboratory Project Manager by e-mail so that the client can be notified as appropriate. The QA group periodically reviews NCMs for potential trends. The NCM process is described in more detail in SOP DV-QA-0031. This is in addition to the corrective actions described in the following sections.
9.2 Initial Demonstration of Capability
Before analyzing samples, the analyst must demonstrate the ability to operate the instrumentation and generate data that meets method criteria (IDOC). The analyst must also establish a method detection limit (MDL) for each instrument used for a particular method of analysis. The initial demonstration and method detection limit (MDL) studies (see Policy DV-QA-005P) must be acceptable before analysis of samples may begin. An MDL verification standard prepared at approximately two times the MDL is analyzed quarterly to demonstrate the qualitative reliability of the calculated MDL value. MDL studies are performed when major changes are made to the analytical processes. MDLs are stored in the LIMS. Likewise ongoing proficiency must be demonstrated by each analyst on an annual basis. See Section 13 for more details on detection limit studies, initial demonstrations of capability, and analyst training and qualification.
9.3 Sample QC
The following quality control samples are prepared with each batch of samples.
9.3.1 Quality Control Batch
The batch is a set of up to 20 samples of the same matrix processed together using the same reagents and standards. Each quality control batch must contain a method blank (MB), a laboratory control sample (LCS), and matrix spike - matrix spike duplicate (MS/MSD) pair. If there is not enough sample volume for an MS/MSD then a duplicate LCS may be used to determine precision. For more details see Policy DV-QA-003P.
SOP No. DV-GC-0027, Rev. 6 Effective Date:12/31/2015
Page No.: 13 of 50
Company Confidential & Proprietary
NOTE: The AK-102 and AK-103 Methods require duplicate LCSs (i.e., LCS and LCSD) for each batch. If both ranges are requested, two sets of LCS/LCSD are required, one for each range. The NWTPH and Oklahoma methods specify that duplicates be supplied every 10 samples.
9.3.2 Method Blank (MB)
One method blank is analyzed with every preparation batch or every 20 samples, whichever is more frequent. The method blank consists of either 1 liter of organic-free water (for batches of aqueous samples) or 30 grams of Ottawa sand (for batches of soil samples). Method AK102 and 103 specifies a 25 gram sample size for soils. Oklahoma and NWTPH methods specify a 20 gram soil sample size. The method blank is processed exactly as samples in the batch, and is used to assess whether the laboratory processes have contaminated the samples in the batch.
Acceptance Criteria : Results for the method blank must be less than or equal to one-half the reporting limit concentration or less than 10% of the lowest concentration found in the associated samples. For DoD QSM 4.2 or QSM 5.0 the acceptance criteria is no analytes detected >1/2 RL (i.e., LOQ) or >1/10 the amount measured in any sample or 1/10 the regulatory limit whichever is greater.
Corrective Action: If the method blank acceptance criteria are not met, identify and correct the source of contamination, and re-prepare and reanalyze the associated samples. If the analyte that was present in the MB was not detected in the affected samples, then the data may be reported with qualifiers (check the project’s requirements to be sure that this is allowed) and it must be addressed in the projects narrative.
9.3.3 Laboratory Control Sample (LCS)
9.3.3.1 With the exception of sample batches analyzed by Methods AK-102 or AK-103, one LCS is analyzed with every preparation batch or every 20 samples, whichever is more frequent. The LCS consists of either 1 liter of organic-free water (for batches of aqueous samples) or 30 grams of Ottawa sand (or method designated sample size as noted in Section 9.3.2 for batches of soil samples), to which the analytes of interest are added at a known concentration.
9.3.3.2 Methods AK-102 and AK-103 require the analysis of an LCS and a duplicate LCS (LCSD) with each preparation batch or every 20 samples, whichever is more frequent. The LCS and LCSD consists

SOP No. DV-GC-0027, Rev. 6 Effective Date:12/31/2015
Page No.: 14 of 50
Company Confidential & Proprietary
of either 1 liter of organic-free water (for batches of aqueous samples) or 25 grams of Ottawa sand (for batches of soil samples), to which the analytes of interest are added at a known concentration.
9.3.3.3 See Table III for spike levels and section 7.2.7 for preparation of the spiking solution. The LCS is processed exactly as samples in the batch and is used to assess the accuracy of the analytical system.
Acceptance Criteria : The percent recovery of the analytes of interest must fall within the established control limits. For Alaska Methods AK102 and AK103, the acceptance limits are listed in Table V. Oklahoma method specifies a recovery of +/- 20% (80-120%) for waters and +/- 40% (60-140%) for soils. For all other methods, the control limits are set at ± 3 standard deviations around the calculated mean of the historical LCS recovery data, unless project-specific control limits apply. DoD QSM 5.0 limits apply to projects under this document. Current control limits are stored in the laboratory LIMS. See Policy DV-QA-003P for further details.
Corrective Action: If LCS acceptance limits are not met, check the analytical system for proper function and calibration control, make any corrections, then the LCS should be reanalyzed once to confirm that the original analysis is reliable. If the results are still outside control limits, the extraction process must be examined and corrected where problems are identified. The associated samples must then be re-extracted following the corrected procedure and reanalyzed. If the LCS recovery is above the upper control limit, and the associated samples are all below reportable concentrations, the deviation may be described in an NCM, if this is acceptable to the client or allowed by the specific program or project.
9.3.4 Matrix Spike and Matrix Spike Duplicate (MS/M SD)
One matrix spike (MS) and one matrix spike duplicate (MSD) are prepared for each preparation batch. A matrix spike (MS) is a field sample to which known concentrations of target analytes have been added. It is prepared in a manner similar to the LCS, but uses real sample matrix in place of the blank matrix. Field blanks and equipment rinses must not be used to

SOP No. DV-GC-0027, Rev. 6 Effective Date:12/31/2015
Page No.: 15 of 50
Company Confidential & Proprietary
prepare the MS and MSD. The MS and MSD are processed exactly as samples in the batch, and are used to assess the effects of sample matrix on the accuracy and precision of the analytical system. See Table III for spike levels and see section 7.2.7 for preparation of the spiking solution. For the DoD QSM 4.2 or QSM 5.0, the MS/MSD must be from the project site and insufficient sample is available to analyze the MS/MSD pair, this is documented in an NCM but no LCSD is performed.
Acceptance Criteria : The percent recovery of the analytes of interest must fall within the established control limits. The control limits are set at ± 3 standard deviations around the calculated mean of the historical MS recovery data, unless project-specific control limits apply. DoD QSM 5.0 limits apply to projects under this document for Method 8015. Current control limits are stored in the laboratory LIMS. See Policy DV-QA-003P for further details.
The relative percent difference (RPD) between the MS and MSD must be less than the established control limit, which is based on 3 standard deviations of the mean of the historical data. RPD control limits are maintained in the laboratory LIMS.
Corrective Action: If the analyte recovery in the MS and/or the RPD between the MS and MSD fails acceptance criteria, but all other QC criteria are met, the MS/MSD failure may be attributed to matrix effects and the associated sample results may be reported as qualified provided the analyst has verified that the failure is not due to lab error. Some programs require reanalysis to confirm that presumed matrix effects are reproducible. The probable cause of the out of control event must be documented (significant concentration in parent sample, other matrix effects, non homogenous sample, etc.) in the case narrative. Where no apparent cause is indicated or lab error is apparent then the batch should be re-extracted.
9.3.5 Surrogate Spikes
The calibration standards, field samples, and QC samples are spiked with ortho-terphenyl and n-octacosane as surrogates. These surrogates have chemistry similar to the analytes of interest, but are not expected to be found in environmental samples. See Table III for spike levels and Sections 7.2.5 and 7.2.6 for surrogate spike preparation. Surrogate results are used to assess the performance of the analytical system for each field and QC sample.

SOP No. DV-GC-0027, Rev. 6 Effective Date:12/31/2015
Page No.: 16 of 50
Company Confidential & Proprietary
Acceptance Criteria: The percent recovery of the surrogates must fall within the established control limits. For Alaska Methods AK102 and AK103, the acceptance limits are listed in Table V. For DoD QSM 5.0, QSM limits apply for Method 8015. For all other methods, the control limits are set at ± 3 standard deviations around the calculated mean of the historical surrogate recovery data, unless project-specific control limits apply. Current control limits are stored in the laboratory LIMS. See Policy DV-QA-003P for further details.
Corrective Action: If surrogate recoveries in the method blank are outside the established limits, verify calculations, standard solutions, and acceptable instrument performance. High surrogate recoveries in the blank might be acceptable if the surrogate recoveries for the field samples and other QC samples in the batch are in control. Low surrogate recoveries in the blank require re-preparation and re-analysis of the samples, unless the sample surrogate recoveries are in control and the targeted compounds are not found in the affected samples.
If the sample surrogate recoveries are outside the established limits, verify calculations, dilutions, standard solutions, and acceptable instrument performance. High recoveries may be due to a co-eluting matrix interference and the chromatogram should be examined for evidence of this. Low recoveries may be due to adsorption by the sample matrix (e.g., clay particles, peat, or organic material in the sample). Recalculate the results and/or reanalyze the extract if the checks reveal a problem.
If the surrogate recovery is outside the established limits due to well-documented matrix effects, the results must be flagged and an explanation included in the report narrative. As with matrix spike failures, some programs (e.g., USACE) may require additional analyses to confirm suspected matrix interferences. The decision to reanalyze or flag the data should be made in consultation with the client. If matrix interference is not obvious, it is only necessary to re-prepare / reanalyze a sample once to demonstrate that a matrix effect is reproducible. The decision to re-prepare samples for out of control surrogate outside of the holding time should be made when consultation with the
SOP No. DV-GC-0027, Rev. 6 Effective Date:12/31/2015
Page No.: 17 of 50
Company Confidential & Proprietary
client indicates that this corrective action will be satisfactory.
9.3.6 RT Reference Standard
A combination of two n-alkane mixtures is analyzed to establish the retention time (RT) window for each initial calibration. The Tennessee / Mississippi DRO mixture is composed of all n-alkanes from C10 – C25 and the Calibration / Window Defining Hydrocarbon Standard is composed of all even-numbered n-alkanes from C8 – C40. The instrument conditions should be chosen so that each alkane component is completely resolved from the next alkane component (this is necessary in order to define each range as different from another specified range). The RT standard data must be uploaded into each analytical batch for the applicable carbon range as the RTC.
10.0 Calibration and Standardization
10.1 Instrumentation
10.1.1 TestAmerica Denver gas chromatograph instrument systems are computer controlled to automatically inject samples and process the resulting data.
10.1.2 Instrument conditions are shown in Table IV.
10.1.3 The routine injection volume is 1 µL.
10.1.4 GC run conditions and columns must be chosen to meet the acceptance criteria for the RT Reference Standard listed in Section 9.3.6 and the calibration criteria in Section 10.
10.1.5 Detailed information regarding calibration models and calculations can be found in Corporate SOP CA-Q-S-005, Calibration Curves (General) and under the public folder Arizona Calibration Training.
10.1.6 Unprocessed calibration data are transferred to the Chrom database for processing. After processing the calibration data, print the calibration report and review it using the calibration review checklist, GC and HPLC ICAL TALS Review Checklist. (See SOP DV-QA-0020.) Submit the calibration report to a qualified peer or the group leader for final review. The completed calibration review checklist are scanned into the documents section of each analytical batch.
10.1.7 A new calibration curve must be generated initially, after major changes to the system, when continuing calibration criteria cannot be met, or at least annually. Major changes include installation of new columns and changing FID jets.
10.2 Calibration

SOP No. DV-GC-0027, Rev. 6 Effective Date:12/31/2015
Page No.: 18 of 50
Company Confidential & Proprietary
10.2.1 The ICAL is performed using the concentration levels described in Sections 7.2.8 for diesel fuel, 7.2.9 for the jet fuels, and 7.2.10 for motor oil. Calibration levels are also presented in Table II. Although some methods allow as few as three calibration levels, the minimum number of calibration levels will be maintained as five levels.
10.2.1.1 Several separate initial calibration curves (ICALs) are required to calibrate for all the mixtures. An ICAL must always be maintained for the diesel fuel as these standards contain the surrogate compounds. ICALs for the other mixtures are analyzed as needed, depending upon the requested parameters. Samples may be calculated as one or more mixtures, dependent upon the project requirements. Samples must be quantitated against a standard that encompasses the same hydrocarbon range as the range the client has requested. For example, Diesel Range Organics is defined as C10-C28. If a client is interested in the range C12-C14, the DRO standard cannot be used for the quantitation. It is not acceptable to integrate only over the C12-C14 range of the DRO envelope. The narrower range must be quantitated using the specified range in the RT marker standard, as is done in the Oklahoma method. If this approach does not meet the method requirements of the other methods referenced in this SOP, the client must approve the approach and this approval must be included in the project records.
10.2.1.2 The lowest calibration concentration is equal to the laboratory reporting limit (RL) concentration. The highest standard defines the highest sample extract concentration that may be reported without dilution.
10.2.1.3 It is not acceptable to remove points from a calibration curve for the purpose of meeting criteria, however, the lowest point or the highest point may be removed and the RL or maximum concentration adjusted accordingly (as long as the minimum number of calibration points is sufficient for the calibration model used). Transfer calibration standard solutions into autosampler vials and load onto the GC autosampler. Use the Chem Station software to set up the analytical sequence.
10.2.2 The external standardization method is used. Tabulate the area response for each calibration level against the concentration injected. The ratio of the response to the concentration injected, defined as the calibration factor (CF), is calculated for the standard at each concentration as follows:
Equation 1
Where: CFi = Calibration factor for the ith calibration level. Afuel = Total area of the fuel calibration standard peak. Cfuel = Concentration of fuel calibration standard, mg/mL
fuel
fueli C
ACF =

SOP No. DV-GC-0027, Rev. 6 Effective Date:12/31/2015
Page No.: 19 of 50
Company Confidential & Proprietary
10.3 Establishing the Calibration Function
Calibrations are modeled either as average calibration factors or as calibration curves, using a systematic approach to selecting the optimum calibration function. Start with the simplest model, i.e., a straight line through the origin and progress through other options until the calibration criteria are met. Pay particular attention to the residuals noticed at the upper and lower end of the curves. This may be cause for rejection of a curve fit even if the calibration acceptance criteria are met.
10.3.1 Linear Calibration Using Average Calibration Factor
Tabulate the peak area response for each target analyte or hydrocarbon range in each calibration level against the concentration injected. For each analyte in each calibration standard, calculate the calibration factor (CF) as shown in section 10.2.2 above. The calibration factor is a measure of the slope of the calibration line, assuming that the line passes through the origin. Under ideal conditions, the factors calculated for each calibration level will not vary with the concentration of the standard. In practice, some variation can be expected. When the variation, measured as the relative standard deviation, is relatively small (e.g., ≤ 20%), the use of the straight line through the origin model is generally appropriate.
For each target analyte, calculate the average calibration factor as follows:
n
CF
CFctoribrationFaAverageCal
n
ii∑
=== 1 Equation 2
Where: CFi = Calibration factor for the ith calibration level. n = The number of calibration levels.
The relative standard deviation (RSD) is calculated as follows:
%100×=CF
SDRSD Equation 3
Where SD is the standard deviation of the average CF, which is calculated as follows:
( )1
1
2
−
−=∑
=
n
CFCF
SD
n
ii
Equation 4
10.3.2 If the percent relative standard deviation (%RSD) for the average (mean) of the calculated calibration factors is less than 20%, the average calibration

SOP No. DV-GC-0027, Rev. 6 Effective Date:12/31/2015
Page No.: 20 of 50
Company Confidential & Proprietary
factor can be used for sample quantitation. Methods AK102 and AK103 require the % RSD to be <25%.
10.3.3 Evaluation of the Average Calibration Factor
The calibration relationship can be graphically represented as a line through the origin with a slope equal to the average calibration factor. Examine the residuals, i.e., the difference between the actual calibration points and the plotted line. Particular attention should be paid to the residuals for the highest points, and if the residual values are relatively large, a linear regression should be considered. SW-846 Method 8000B allows evaluation of the grand average RSD across all analytes, but TestAmerica-Denver evaluates each analyte individually.
Acceptance Criteria: The RSD must be ≤ 20% (AK102/AK103 upper limit is 25%).
Corrective Action: If the RSD exceeds the limit, linearity through the origin cannot be assumed, and a least-squares linear regression should be attempted.
10.3.4 Linear Calibration Using Least-Squares Regre ssion
Calibration using least-squares linear regression produces a straight line that does not necessarily pass through the origin. The calibration relationship is constructed by performing a linear regression of the instrument response (peak area or peak height) versus the concentration of the standards. The instrument response is treated as the dependent variable (y) and the concentration as the independent variable (x). The regression produces the slope and intercept terms for a linear equation in the following form:
Equation 5
Where: y = Instrument response (peak area or height). x = Concentration of the target analyte in the calibration
standard. a = Slope of the line. b = The y-intercept of the line.
For an external standard calibration, the above equation takes the following form:
Equation 6
To calculate the concentration in an unknown sample extract, the regression equation is solved for concentration, resulting in the following equation, where Cs is now Ce, the concentration of the target analyte in the unknown sample extract.
baxy +=
baCA ss +=

SOP No. DV-GC-0027, Rev. 6 Effective Date:12/31/2015
Page No.: 21 of 50
Company Confidential & Proprietary
Equation 7
Where: As = Area of the chromatographic peak for the target analyte in
the calibration standard. Ae = Area of the chromatographic peak for the target analyte in
the sample extract. a = Slope of the line as determined by the least-squares
regression. Cs = Concentration of the target analyte in the calibration
standard. Ce = Concentration of the target analyte in the sample extract. b = Intercept of the line as determined by the least-squares
regression.
10.3.5 Linear Regression Evaluation
With an unweighted linear regression, points at the lower end of the calibration curve have less weight in determining the curve than points at the high concentration end of the curve. For this reason, inverse weighting of the linear function is recommended to optimize the accuracy at low concentrations. Note that the August 7, 1998 EPA memorandum “Clarification Regarding Use of SW-846 Methods”, Attachment 2, Page 9, includes the statement “The Agency further recommends the use of a weighted regression over the use of an unweighted regression.”
Acceptance Criteria: To avoid bias in low level results, the absolute value of the y-intercept must be significantly less than the reporting limit, and preferably less than the MDL.
Examine the residuals, paying particular attention to the residuals at the low end of the curve. If the intercept or the residuals are large, a second-order regression should be considered.
The linear regression must have a correlation coefficient (r) ≥ 0.990. Some programs (e.g., AFCEE, DoD) require a correlation coefficient ≥ 0.995. DoD QSM 5.0 requires r2 >0.99. Note that the AK102/AK103 method requires that r2 be greater than or equal to 0.995.
Corrective Action: If the correlation coefficient falls below the acceptance limit, linear regression cannot be used and a second-order regression should be attempted.
10.3.6 Non-Linear Calibration
a
bAC e
e
−=
SOP No. DV-GC-0027, Rev. 6 Effective Date:12/31/2015
Page No.: 22 of 50
Company Confidential & Proprietary
When the instrument response does not follow a linear model over a sufficiently wide working range, or when the previously described calibration approaches fail acceptance criteria, a non-linear, second-order calibration model may be employed. The second-order calibration uses the following equation:
Equation 8
Where:
a, b, and c are coefficients determined using a statistical regression technique; y is the instrument response; and x is the concentration of the target analyte in the calibration standard.
10.3.7 Non-Linear Calibration Evaluation
A minimum of six points must be used for a second-order regression fit.
Second-order regressions should be the last option. Note that some programs (e.g., South Carolina) do not allow the use of second-order regressions.
Before selecting a second-order regression calibration model, it is important to ensure the following:
• The absolute value of the intercept is not large relative to the lowest concentrations being reported.
• The response increases significantly with increasing standard concentration (i.e., the instrument response does not plateau at high concentrations).
• The distribution of concentrations is adequate to characterize the curvature.
Acceptance Criteria: The coefficient of determination r2 must be ≥ 0.990.
Corrective Action: If the coefficient of determination falls below the acceptance limit and the other calibration models are unacceptable, the source of the problem must be investigated and the instrument recalibrated. Third-order regressions are not allowed at TestAmerica Denver.
Note: Method 8015C and the NWTPH method require that the calibration points be “back calculated” to the line or curve and that each point be within +/- 20% (for 8015C) and 15% (for NWTPH) of the expected concentration for that point. See the specific method for how to apply any exceptions (involves a narrowing of the concentration range to within the area that is within control).
cbxaxy ++= 2
SOP No. DV-GC-0027, Rev. 6 Effective Date:12/31/2015
Page No.: 23 of 50
Company Confidential & Proprietary
10.3.8 Second-Source Initial Calibration Verificati on (ICV)
10.3.8.1 A second-source initial calibration verification (ICV) standard is prepared as described in section 7.2.14 and analyzed immediately after each ICAL. This standard can also be used as the continuing calibration verification (CCV) standard. The recovered concentration for this standard must be within ± 20% of the expected (or theoretical) concentration (includes DoD QSM 4.2 and 5.0). AK102/AK103 method requires the standard response to be within ± 25% and 8000B requires ± 15%.
10.3.8.2 The percent difference between the measured ICV calibration factor (or the measured concentration of the ICV standard) and the ICAL calibration factor (or the known concentration of the ICV standard) is calculated as follows:
100% R
R R = DifferencePercent
1
21 ×−
Equation 9
Where:
R1 = Average calibration factor from the calibration curve or the ICV known value.
R2 = Calculated calibration factor for the ICV analysis or the measured ICV value.
10.3.8.3 If the percent difference for the second-source verification falls outside of ± 20% (25% for AK102/AK103, ± 15% for 8000B), then sample analysis cannot be performed. Reanalyze the second-source verification standard to confirm the original result. If the second result fails, then re-prepare the verification standard, and/or re-prepare and rerun the ICAL. The ICV must be analyzed under the same conditions that were used for the ICAL.
10.3.9 Continuing Calibration Verification (CCV)
10.3.9.1 A CCV standard (see Sections 7.2.11 through 7.2.13 for CCV standard concentrations) is analyzed at the beginning of the analytical sequence, every 12 hours of operation, or every 20 samples (whichever is more frequent), and at the end of the analytical sequence. A CCV must be included in each bracket for each fuel type that is requested and quantified for the samples and QC in the bracket.
10.3.9.2 The 8000 series methods (and some state specific methods-Arizona) indicate the need for two levels for the CCV where non-linear calibrations are used and all other methods indicate a single mid-point CCV. The concentration recovered for this

SOP No. DV-GC-0027, Rev. 6 Effective Date:12/31/2015
Page No.: 24 of 50
Company Confidential & Proprietary
standard must be within ± 20% (25% for AK102/AK103) of the expected concentration (see previous equation 9).
Note: It is not necessary to run a CCV standard at the beginning of the sequence if samples are analyzed immediately after the completion of the initial calibration.
10.3.9.3 If the percent difference between the measured CCV value and the expected CCV value falls outside of the method criteria, first check the accuracy of the preparation of the CCV standard. Method criteria for %D for the CCV are:
• ± 20% for Method 8015C or 8015D (Method 8000C), DoD QSM 4.2 or 5.0
• + 25% for AK102/AK103
• + 15% for Method 8015B (8000B) and NWTPH
If the standard is accurately prepared and the results fail acceptance criteria then the instrument must be recalibrated and all samples analyzed since the last successful CCV must be reanalyzed. DoD QSM 5.0 requires recalibration and reanalysis of all affected samples since the last acceptable CCV. As an alternative, the DoD QSM 5.0 indicates that the laboratory may analyze two additional consecutive CCVs within one hour of the failed CCV. If both pass, samples may be reported without reanalysis. If either fails, take corrective action(s) and re-calibrate; then reanalyze all affected samples since the last acceptable CCV.
If a DoD client accepts TestAmerica’s Technical Specifications for DoD QSM work, samples that have no detections when a CCV has recoveries above the project acceptance limits would be reported with a case narrative comment, in addition to applying any data qualifier flags required by the project.
10.3.9.4 In some cases the nature of the samples being analyzed may be the cause of the failing %D. If such matrix effects are suspected then those samples must be reanalyzed (at a dilution if column damage is imminent) to prove matrix effect. If the drift is repeated in the reanalysis, the analyst must generate an NCM for this occurrence to explain that the drift was most likely attributable to the sample matrix and that the samples may be diluted and reanalyzed to minimize the effect if so desired by the client. For DoD QSM 4.2 or 5.0, this must be approved by the client.
10.3.9.5 For any analyte not detected in the client samples, the %D for that analyte in the bracketing CCVs should also be within 20%, however, the results may be acceptable (with client approval) if

SOP No. DV-GC-0027, Rev. 6 Effective Date:12/31/2015
Page No.: 25 of 50
Company Confidential & Proprietary
the drift is positive (high). An NCM must be written to explain this case.
10.4 Retention Time Window Definition
10.4.1 Before establishing RT windows, be certain that the GC system is within optimum operating conditions. Analyze a diesel fuel CCV Standard (Section 7.2.11) and a Retention Time Reference Standard (section 7.2) three times each throughout the course of a 72-hour period. Serial injections over less than a 72-hour period result in retention time windows that are too tight.
10.4.2 Calculate the mean and standard deviation of the three absolute retention times for each compound, carbon range marker, and each surrogate. Table 1 lists the boiling points for the aliphatic hydrocarbons used in the retention time reference standard.
10.4.2.1 The width of the retention time window for an individual peak is defined as ± 3 times the standard deviation of the mean absolute retention time established during the 72-hour period for each component.
10.4.2.2 In those cases where the calculated window for a particular analyte is less than the default window, use ± 0.05 minute (AK102 and AK103) ± 0.03 (8000 methods) and ± 0.1 min (Oklahoma) as the retention time window.
10.4.3 The laboratory must calculate retention time windows for each standard on each GC column and whenever a new GC column is installed, if the instruments conditions are changed significantly, or after a major maintenance event. The data must be retained by the laboratory.
11.0 Procedure
11.1 One-time procedural variations are allowed only if deemed necessary in the professional judgment of supervision to accommodate variation in sample matrix, radioactivity, chemistry, sample size, or other parameters. Any variation in procedure shall be completely documented using an NCM. The NCM is automatically sent to the laboratory Project Manager by e-mail so that the client can be notified as appropriate. The QA group periodically reviews NCMs for potential trends. The NCM process is described in more detail in SOP DV-QA-0031. The NCM shall be filed in the project file and addressed in the case narrative.
11.2 Any deviations from this procedure identified after the work has been completed must be documented as a nonconformance, with a cause and corrective action described. An NCM must be used for this documentation.

SOP No. DV-GC-0027, Rev. 6 Effective Date:12/31/2015
Page No.: 26 of 50
Company Confidential & Proprietary
11.3 Sample Preparation
Refer to extraction SOPs DV-OP-0006 for aqueous samples and DV-OP-0016 for soil samples. In the case of samples with an organic matrix, waste dilution SOP DV-OP-0012 may apply.
11.4 Instrument Maintenance & Troubleshooting
11.4.1 Before the start of any daily sequence the instrument system should be evaluated for possible maintenance. If the previous run ended with a failing continuing calibration then the system should be maintained to bring it back into control.
• The injector septum should be changed after about 200 injections have been completed.
• If the last CCV that was analyzed indicated a high response then a simple liner change is typically sufficient to bring the system back into control.
• Analysis of a few solvent blanks or a system bake out may be necessary to drive out any residual contamination on the column.
• A reduced response may indicate that the system needs to be evaluated for leaks.
• Poor peak shape may necessitate clipping a loop out of the analytical column. If this fails to solve the peak shape problem then replacement of the columns may be indicated.
11.4.2 The goal is to maintain the system as close to top condition as possible as was observed when new columns and injector parts were installed. Re-calibration should not be used to correct for maintenance related issues.
11.4.3 Always document any maintenance procedure in the maintenance logbook.
11.5 Analytical Sequence
11.5.1 The analytical sequence starts with a RT reference standard, an initial calibration (ICAL) and initial calibration verification (ICV) or with a continuing calibration verification (CCV) (see Section 10).
11.5.2 An instrument blank (injection of methylene chloride solvent) must be included in each analytical sequence. The instrument blank must meet the same acceptance criteria as the method blank (with the exception of surrogate recoveries).

SOP No. DV-GC-0027, Rev. 6 Effective Date:12/31/2015
Page No.: 27 of 50
Company Confidential & Proprietary
11.5.3 A CCV standard is interspersed in the analytical sequence after 12 hours have elapsed or after 20 samples have been analyzed, whichever is more frequent. More frequent analysis of the CCV is recommended (and required by some programs) in order to minimize the number of samples needed to be reanalyzed in the event of an out of control recovery for the CCV.
11.5.4 Any sample suspected of being highly concentrated should be followed by an instrument blank to prevent carryover. If the blank analysis shows contamination beyond established “blank acceptance criteria”, the column must be baked out and subsequent blanks analyzed until the system is shown to be free from contaminants. If possible do not aliquot the entire sample volume. Use limited volume autosample vials so that an unused volume remains for possible repeat analyses.
11.5.5 If the measured concentration of any sample exceeds the highest calibration standard concentration, the sample extract must be diluted with methylene chloride and reanalyzed. See section 12.2 for dilution guidelines.
11.5.6 The analytical sequence is closed with a final CCV for each fuel type requested and quantified.
11.6 Daily Retention Time Windows
11.6.1 At the beginning of each daily analytical sequence, the RT Reference Standard (Section 7.2) is analyzed. The retention time windows for each diesel / motor oil range are adjusted based on the analysis of each n-alkane. The center of the retention time windows for the jet fuels are adjusted based on the analysis of the chromatography of any level of the jet fuel calibration standard. The center of the retention time windows must be updated at the beginning of each analytical sequence but not for any other CCV standards.
11.6.2 A notation is made in the run sequence log to identify any standard used for the retention time verification and adjustments.
11.7 Sample Analysis
11.7.1 Baseline Used for Integration
11.7.1.1 The same type of baseline must be applied equally to standards and samples. It is important that the baseline is drawn consistently by each analyst in the GC group, which must be part of the training for new analysts.
11.7.1.2 For the analysis of samples containing hydrocarbons that completely elute in the C10 to C28 range, the baseline should be drawn as shown in the example in Attachment 1. For routine analysis, this should be similar to the baseline produced by a method blank. Note that because of column bleed, this is not a flat, horizontal common baseline.
SOP No. DV-GC-0027, Rev. 6 Effective Date:12/31/2015
Page No.: 28 of 50
Company Confidential & Proprietary
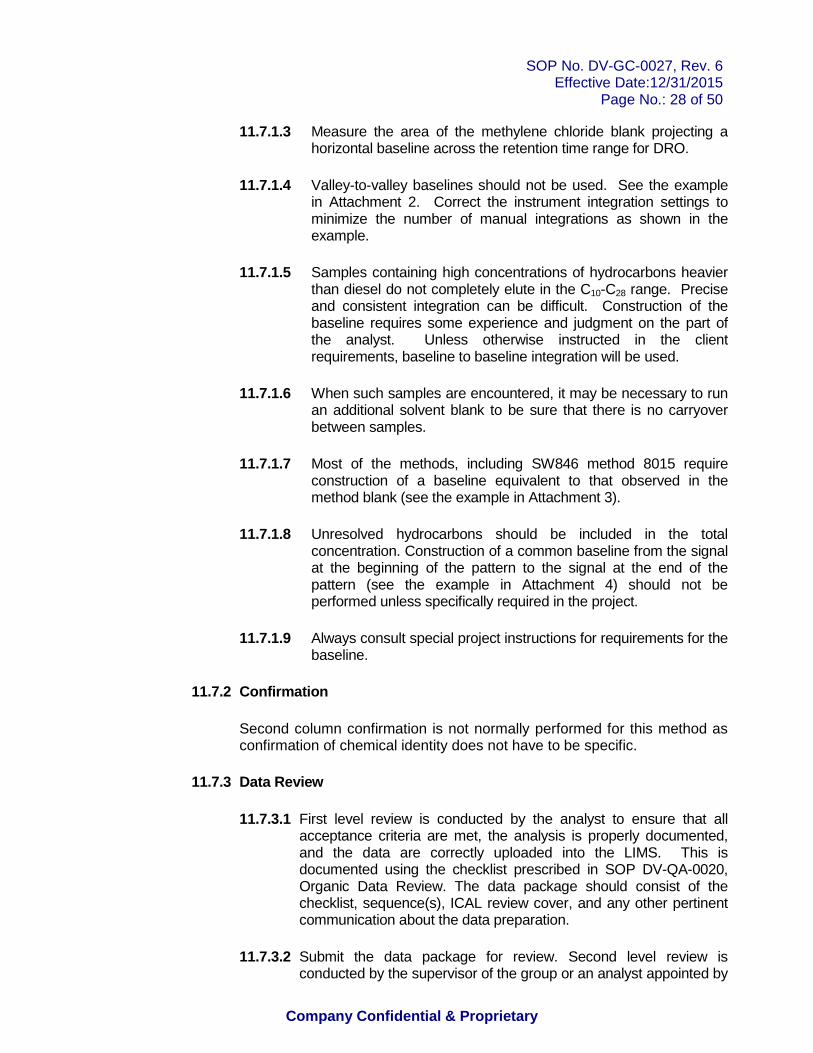
11.7.1.3 Measure the area of the methylene chloride blank projecting a horizontal baseline across the retention time range for DRO.
11.7.1.4 Valley-to-valley baselines should not be used. See the example in Attachment 2. Correct the instrument integration settings to minimize the number of manual integrations as shown in the example.
11.7.1.5 Samples containing high concentrations of hydrocarbons heavier than diesel do not completely elute in the C10-C28 range. Precise and consistent integration can be difficult. Construction of the baseline requires some experience and judgment on the part of the analyst. Unless otherwise instructed in the client requirements, baseline to baseline integration will be used.
11.7.1.6 When such samples are encountered, it may be necessary to run an additional solvent blank to be sure that there is no carryover between samples.
11.7.1.7 Most of the methods, including SW846 method 8015 require construction of a baseline equivalent to that observed in the method blank (see the example in Attachment 3).
11.7.1.8 Unresolved hydrocarbons should be included in the total concentration. Construction of a common baseline from the signal at the beginning of the pattern to the signal at the end of the pattern (see the example in Attachment 4) should not be performed unless specifically required in the project.
11.7.1.9 Always consult special project instructions for requirements for the baseline.
11.7.2 Confirmation
Second column confirmation is not normally performed for this method as confirmation of chemical identity does not have to be specific.
11.7.3 Data Review
11.7.3.1 First level review is conducted by the analyst to ensure that all acceptance criteria are met, the analysis is properly documented, and the data are correctly uploaded into the LIMS. This is documented using the checklist prescribed in SOP DV-QA-0020, Organic Data Review. The data package should consist of the checklist, sequence(s), ICAL review cover, and any other pertinent communication about the data preparation.
11.7.3.2 Submit the data package for review. Second level review is conducted by the supervisor of the group or an analyst appointed by

SOP No. DV-GC-0027, Rev. 6 Effective Date:12/31/2015
Page No.: 29 of 50
Company Confidential & Proprietary
the supervisor. All manual integrations must be evaluated by the peer reviewer and this review must be documented on the data review checklist. Details of this review and the documentation are described in SOP DV-QA-0020. If problems are found with the data package, then the data are reviewed with the analyst and corrections are made.
11.7.3.3 Other reviews (PM Level III review and QA Data Reviews) are described in the TestAmerica Quality Assurance Manual (QAM), and associated TestAmerica policies and procedures.
12.0 Calculations / Data Reduction
12.1 Calculations
12.1.1 LCS and Surrogate Spike Recovery Calculation
LCS and surrogate spike recoveries are calculated using the following equation:
%100spiked amount)(or ion Concentrat
found amount)(or ion Concentrat%Recovery ×= Equation 13
12.1.2 MS and MSD Recovery Calculation
Matrix spike recoveries are calculated as follows:
%100%Recovery MSDor MS ×
−=SA
SRSSR Equation 14
Where:
SSR = Measured concentration in spiked sample.
SR = Measured concentration in unspiked sample.
SA = Concentration of spike added to sample.
12.1.3 MS/MSD RPD Calculation
The relative percent difference between the MS and MSD is calculated as follows:
( )
%100%212
1
21 ×+
−=
RR
RRRPD Equation 15
Where:
R1 is the result for the MS and R2 is the result for the MSD.

SOP No. DV-GC-0027, Rev. 6 Effective Date:12/31/2015
Page No.: 30 of 50
Company Confidential & Proprietary
12.1.4 Concentration of Analyte in the Sample Extra ct
Depending on the calibration function used, the concentration of the analyte in the sample extract is calculated as follows (see Section 10.3 for details on establishing the calibration function):
Average Calibration Factor: CF
AC s
e = Equation 16
Linear Regression: [ ]
a
bAC s
e−
= Equation 17
Non-Linear Regression: ( )se AfC = Equation 18
Where:
Ce = Concentration of the analyte in the sample extract (ng/mL).
As = Peak area for the analyte in the sample extract injection. b = y-intercept of the calibration fit. a = Slope of the calibration fit. f(As) = Mathematical function established by the non-linear
regression.
12.1.5 Concentration of Analyte in Original Sample (for 1 uL injection)
DFV
VCC
s
e
g
nge
sample ××=µ1000
Equation 19
Where: Csample = Concentration of analyte in original sample (µg/L or
µg/kg). Ce = Concentration of analyte in sample extract injected in
GC (ng/mL).
g
ng
µ1000 = Factor to convert ng/mL to µg/mL.
Ve = Volume of sample extract (mL). Vs = Volume (or weight) of original sample (L or kg). DF = Dilution Factor (post extraction dilutions)
12.2 Calibration Range and Sample Dilutions
12.2.1 If the concentration of any analyte exceeds the working range as defined by the calibration standards, then the sample must be diluted with methylene chloride (record the lot number in the run sequence) and reanalyzed. Dilutions should target the most concentrated analyte in the upper half (over 50% of the high level standard) of the calibration range.

SOP No. DV-GC-0027, Rev. 6 Effective Date:12/31/2015
Page No.: 31 of 50
Company Confidential & Proprietary
Samples that were analyzed immediately following the high sample must be evaluated for carryover. If the samples have results at or above the RL for the analyte(s) that were found to be over the calibration range in the high sample, they must be reanalyzed to rule out carryover, unless other objective evidence indicates that the detection is not the result of carryover. Such evidence may include an observation where carryover was not observed when samples or blanks were analyzed after another sample with similar high compound recovery or when the detection in the sample with suspected carryover is much higher than the expected amount of carryover (i.e. the sample’s concentration may be similar to or higher than the concentration found in the previous sample). It may also be necessary to dilute samples because of matrix interferences.
12.2.2 If the initial diluted run has no hits or hits below 20% of the calibration range, and the matrix allows for analysis at a lesser dilution, then the sample must be reanalyzed at a dilution targeted to bring the largest hit above 50% of the calibration range.
13.0 Method Performance
13.1 Method Detection Limit Study (MDL)
The method detection limit (MDL) is the lowest concentration that can be detected for a given analytical method and sample matrix with 99% confidence that the analyte is present. The MDL is determined according to the laboratory’s MDL policy in DV-QA-005P. MDLs reflect a calculated (statistical) value determined under ideal laboratory conditions in a clean matrix, and may not be achievable in all environmental matrices. The laboratory maintains MDL studies for analyses performed; these are verified at least annually unless method or program requirements require a greater frequency.
13.2 Demonstration of Capabilities
All personnel are required to perform an initial demonstration of proficiency (IDOC) on the instrument they will be using for analysis before they are allowed to analyze samples without direct oversight. Prior to the successful completion and approval (by the QA department) of the IDOC the supervising analyst must document this oversight by including a comment in the notes section of the worksheet in TALS. On-going proficiency must be demonstrated annually. IDOCs and on-going proficiency demonstrations are conducted as follows.
13.2.1 Four aliquots of the QC check sample are analyzed using the same procedures used to analyze samples, including sample preparation. The concentration of the QC check sample should be equivalent to a mid- level calibration.
13.2.2 Calculate the average recovery and standard deviation of the recovery for each analyte of interest.
13.2.3 If any analyte does not meet the acceptance criteria, the test must be

SOP No. DV-GC-0027, Rev. 6 Effective Date:12/31/2015
Page No.: 32 of 50
Company Confidential & Proprietary
repeated. Only those analytes that did not meet criteria in the first test need to be evaluated. Repeated failure for any analyte indicates the need for the laboratory to evaluate the analytical procedure and take corrective action.
13.2.4 Further details concerning demonstrations of proficiency are described in SOP DV-QA-0024.
13.2.5 The Oklahoma method requires that the analyst must make an initial demonstration of the ability to generate acceptable accuracy and precision with this method by successful analysis of the following:
13.2.5.1 Analysis of 7 replicates of the diesel component standard at a concentration of 100 ug/L of total DRO in organic-free water with recoveries of all components within + 40% of the known concentration and precision of all replicates within + 30%.
13.2.5.2 Analysis of 7 replicates of DRO_free sand at a concentration of 10 mg/kg of total DRO with all recoveries within + 40% of the known concentration and precision of all replicates within + 30%.
13.2.5.3 As an exception use the NELAC recommended procedure for initial demonstration of capability in place of this procedure.
13.3 Training Requirements
The Group Leader is responsible for ensuring that this procedure is performed by an associate who has been properly trained in its use and has the required experience. See requirements for demonstration of analyst proficiency in SOP DV-QA-0024.
14.0 Pollution Control
14.1 It is TestAmerica’s policy to evaluate each method and look for opportunities to minimize waste generated (i.e., examine recycling options, ordering chemicals based on quantity needed, preparation of reagents based on anticipated usage and reagent stability). Employees must abide by the policies in Section 13 of the Environmental Health and Safety Manual (M-E-001 DV) for “Waste Management and Pollution Prevention.”
14.2 Standards and reagents are prepared in volumes consistent with laboratory use to minimize the volume of expired standards and reagents requiring disposal.
15.0 Waste Management
15.1 All waste will be disposed of in accordance with Federal, State, and local regulations. Where reasonably feasible, technological changes have been implemented to minimize the potential for pollution of the environment. Employees will abide by this procedure, the policies in section 13, “Waste Management and
SOP No. DV-GC-0027, Rev. 6 Effective Date:12/31/2015
Page No.: 33 of 50
Company Confidential & Proprietary
Pollution Prevention”, of the Corporate Environmental Health and Safety Manual, and DV-HS-001P, “Waste Management Program.”
15.2 The following waste streams are produced when this method is carried out:
15.2.1 Expired Chemicals/Reagents/Standards – Contact Waste Coordinator
15.2.2 Vial waste – Expired Extract Vials – Waste Stream A
NOTE: Radioactive and potentially radioactive waste must be segregated from non-radioactive waste as appropriate. Contact the Radioactive Waste Coordinator for proper management of radioactive or potentially radioactive waste generated by this procedure.
16.0 References / Cross-References
16.1 Determinative Chromatographic Separations, , SW-846, Test Methods for Evaluating Solid Waste, Physical/Chemical Methods, Third Edition and all promulgated updates, EPA Office of Solid Waste, January 2005.
16.1.1 Method 8000B, Determinative Chromatographic Separations, Revision 2, December 1996
16.1.2 Method 8000C, Determinative Chromatographic Separations, Revision 3, March 2003.
16.1.3 Method 8015B, Nonhalogenated organics by Gas Chromatography, Revision 2, December 1996.
16.1.4 Method 8015C, Nonhalogenated organics by Gas Chromatography, Revision 3, February 2007.
16.1.5 Method 8015D, Nonhalogenated organics by Gas Chromatography, Revision 4, June 2003.
16.1.6 Method 3510C, Separatory Funnel Liquid-Liquid Extraction, Revision 3, December 1996.
16.1.7 Method 3546, Microwave Extraction, Revision 0, February 2007.
16.1.8 Method 3550B, Ultrasonic Extraction, Revision 3, December 1996.
16.1.9 Method 3550C, Ultrasonic Extraction, Revision 4, February 2007.
16.2 Alaska Method AK102, “For the Determination of Diesel Range Organics”, Version 04/08/02.
SOP No. DV-GC-0027, Rev. 6 Effective Date:12/31/2015
Page No.: 34 of 50
Company Confidential & Proprietary
16.3 Alaska Method AK103, “For the Determination of Residual Range Organics”, Version 04/08/02.
16.4 NWTPH-HCID “Hydrocarbon Identification Method for Soil and Water,” Manchester Environmental Laboratory, Dept. of Ecology, State of Washington.
16.5 Oklahoma Department of Environmental Quality, Methods 8000/8100 (modified), Diesel Range Organics (DRO), October 22, 1997, Rev. 4.1.
17.0 Modifications from Source Methods
17.1 Alaska Method AK103 for residual range organics (RRO) does not include analysis of aqueous samples. This SOP does provide for the determination of RRO, as defined in the Alaska method, in water.
17.2 The NELAC IDOC procedure is used in place of the Oklahoma IDOC procedure.
17.3 Method AK102 calls for the LCS to be the same source as used for the calibration stock. The laboratory typically uses second source standards for the LCS.
17.4 Method AK102 requires standards to be stored in the freezer. The laboratory stores all standards in the refrigerator as recommended by the manufacturer and other source methods. The same stock standards are used for all analyses.
18.0 Attachments
Table I: Aliphatic Hydrocarbon Standard Table II: Calibration Levels Table III: Spike Levels for Quality Control Table IV: Recommended GC Conditions Table V: Alaska Methods AK102 and AK103 Acceptance Criteria for Quality
Control Table VI: DRO and RRO Method Summary Comparison Chart Table VII: DoD QSM 5.0 Requirements for Organic Analysis by Gas
Chromatography Attachment 1: Routine DRO Integration Attachment 2: Valley-to-Valley Integration Cannot Be Used Attachment 3: Heavy Hydrocarbons with Baseline from Method Blank Attachment 4: Heavy Hydrocarbons with Non-Standard Signal-to-Signal Integration Attachment 5: Retention Time Reference Standard Appendix 1: Oklahoma Method Specifications
19.0 Revision History
• Revision 6, dated 31 December 2014 o Added detail to Section 2.1 regarding sample sizes o Added detail to the definition of JP-8 (Section 3.4) o Added SOP reference for Silica Gel cleanup if performed to section 4.1 o Removed reference to JP4 in Section 7.

SOP No. DV-GC-0027, Rev. 6 Effective Date:12/31/2015
Page No.: 35 of 50
Company Confidential & Proprietary
o Added details to Section 7.2.14 for second source calibration verification standards
o Added section 7.5.6 o Corrected sample size for solid matrix in section 9.3.3.2 o Added requirement that ICAL be performed at least annually per the QA
Manual (Section 10.1.7) o Clarified language in Section 10.3.9.3 regarding corrective action for CCV
failures o Deleted Section 11.7.2 and renumbered remainder of Section 11. The
information on calculations was duplicated in Section 12. o Added Method modifications for AK102 (Sections 17.3 and 17.4) o Removed reference to TX1005 from Table VI. Laboratory no longer
performs this method. o Added Table VII, summarizing QSM requirements and standard variances (if
accepted by the client) and specific to this procedure
• Revision 5, dated 31 December 2014
o Removed references to CA LUFT method. Lab does not perform. o Removed information and procedure steps related to analysis of Terphenyls.
Lab no longer performs. o Removed client specific references to a separate work instruction. o Updated instrumentation descriptions and supplies list. o Revised section 7.3 to reflect current practice o Reformatted Section 8.0 as a table for ease of reference o Added details regarding requirements for DoD QSM 4.2 and 5.0 throughout o Added “carbon range marker” to Section 10.4.2 when calculating retention
time windows o Added requirement the RT windows must be recalculated when column
replaced, significant change to instruments or after major maintenance. o Removed requirement for L2 reviewer to sign and date the MI summary
report. Review is documented on the data review checklist.
• Revision 4, dated 31 October 2013
o Editorial and formatting updates o Updates throughout the document to reflect current practices
• Revision 3.2, dated 15 October 2012
o Updated section 1.2 to include analysis up to C40. o Updated section 3.0. Updated the ranges for DRO, deleted the option for
JP4, added the ranges for Bunker C. o Updated section 11.6.1.7 to clarify appropriate baseline assignment. o Updated section 11.6.1.8 to clarify the requirement to include unresolved
hydrocarbons in the integration. o Change the name of Appendix 4 to “Heavy Hydrocarbons with Non-Standard
Signal-to-Signal Integration”
• Revision 3.1, dated 30 June 2012
o Updated to include Terphenyls
• Revision 3, dated 04 April 2012
o Updated section 6.2 with current supply list.

SOP No. DV-GC-0027, Rev. 6 Effective Date:12/31/2015
Page No.: 36 of 50
Company Confidential & Proprietary
o Added some current vendor sources in section 7.2 for materials used. o Added sections 7.3 Standards Verification, 7.4 Storage of Stock Standards, and
section 7.5 Non-Routine Compounds. o Added holding time clarification to section 8.3. o Modified Section 10 for clarity and consistency with other SOP formats.
Removed wording from section 10.3.4 that indicated the need for at least three multi-point curves in order to use a weighted regression. Changed the wording for section 10.4.2.2 to indicate when to use a default RT window.
o Modified section 11 to include some guidelines for 11.3 Instrument Maintenance. o Modified section 12 to be consistent with other SOP formats. o Updated Table IV with current configurations. o Added Table VI and Attachment 5
• Revision 2, dated 25 March 2011
o Updated SOP to include requirements for the various revisions of Methods 8000, 8015 and to include state methods for extractable hydrocarbons, including Alaska, California, Oklahoma and Washington.
o Modified definitions for clarity o Updated section 13.
• Revision 1, dated 05 March 2010
o Added section 6.3 o Updated to match other GC SOP Format
• Revision 0, dated 31 January 2009

SOP No. DV-GC-0027, Rev. 6 Effective Date:12/31/2015
Page No.: 37 of 50
Company Confidential & Proprietary
Table I: Aliphatic Hydrocarbon Standard
Compound Boiling Points
n-Alkane Name B.P. 760 (°C)
C8 Octane 126
C10 Decane 174
C24 Tetracosane 391
C28 Octacosane 432
C32 Dotriacontane 468
C36 Hextriacontane 498
This Table can be used to get the estimated boiling point ranges of the hydrocarbons reported in a given sample.
Table II: Calibration Levels
Standard Level 1 Level 2 Level 3 Level 4 Level 5 Level 6 Level 7
DRO 0.1 0.25 1.00 5.00 7.50 15.00 30.00
Jet Fuel 8 0.1 0.5 1.00 2.50 5.00 10.00 NA
Motor Oil / RRO 0.1 0.25 1.00 5.00 7.50 15.00 30.0
Ortho-Terphenyl and n-octacosane (surrogates) 0.0005 0.00125 0.005 0.025 0.0375 0.075 ---
(All concentrations are in mg/mL.)
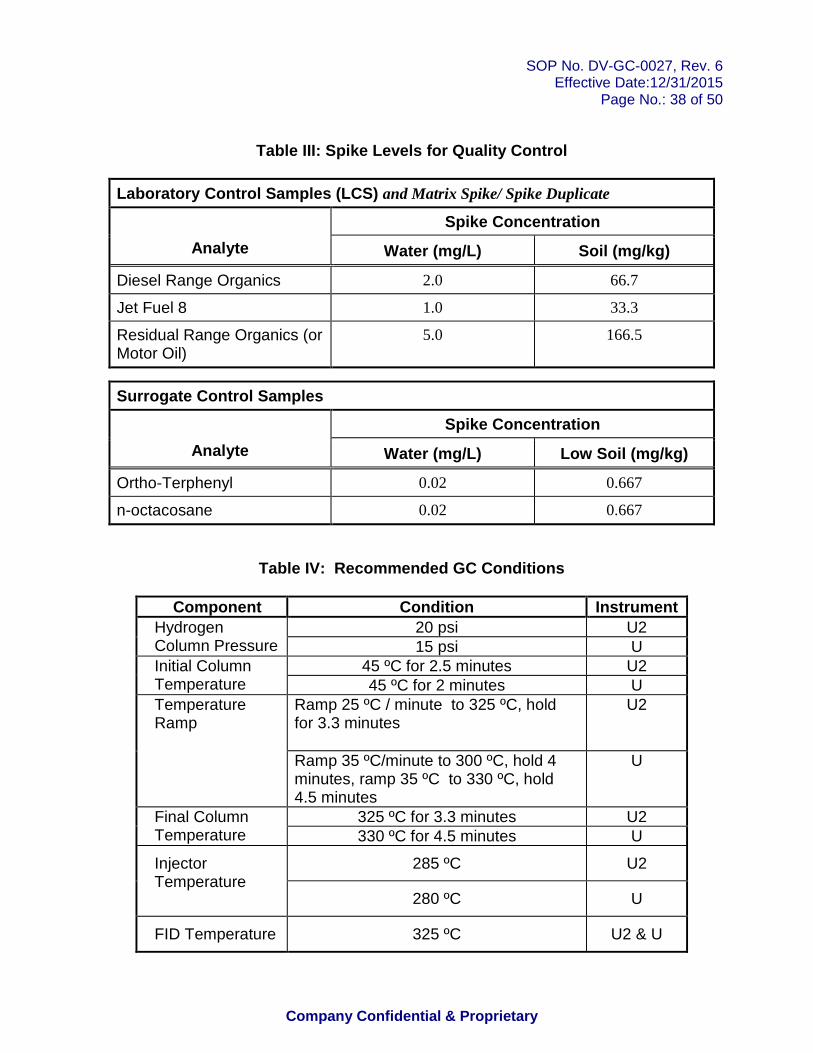
SOP No. DV-GC-0027, Rev. 6 Effective Date:12/31/2015
Page No.: 38 of 50
Company Confidential & Proprietary
Table III: Spike Levels for Quality Control
Laboratory Control Samples (LCS) and Matrix Spike/ Spike Duplicate
Spike Concentration
Analyte Water (mg/L) Soil (mg/kg)
Diesel Range Organics 2.0 66.7
Jet Fuel 8 1.0 33.3
Residual Range Organics (or Motor Oil)
5.0 166.5
Surrogate Control Samples
Spike Concentration
Analyte Water (mg/L) Low Soil (mg/kg)
Ortho-Terphenyl 0.02 0.667
n-octacosane 0.02 0.667
Table IV: Recommended GC Conditions
Component Condition Instrument 20 psi U2 Hydrogen
Column Pressure 15 psi U 45 ºC for 2.5 minutes U2 Initial Column
Temperature 45 ºC for 2 minutes U Ramp 25 ºC / minute to 325 ºC, hold for 3.3 minutes
U2 Temperature Ramp
Ramp 35 ºC/minute to 300 ºC, hold 4 minutes, ramp 35 ºC to 330 ºC, hold 4.5 minutes
U
325 ºC for 3.3 minutes U2 Final Column Temperature 330 ºC for 4.5 minutes U
285 ºC U2 Injector Temperature
280 ºC U
FID Temperature 325 ºC U2 & U
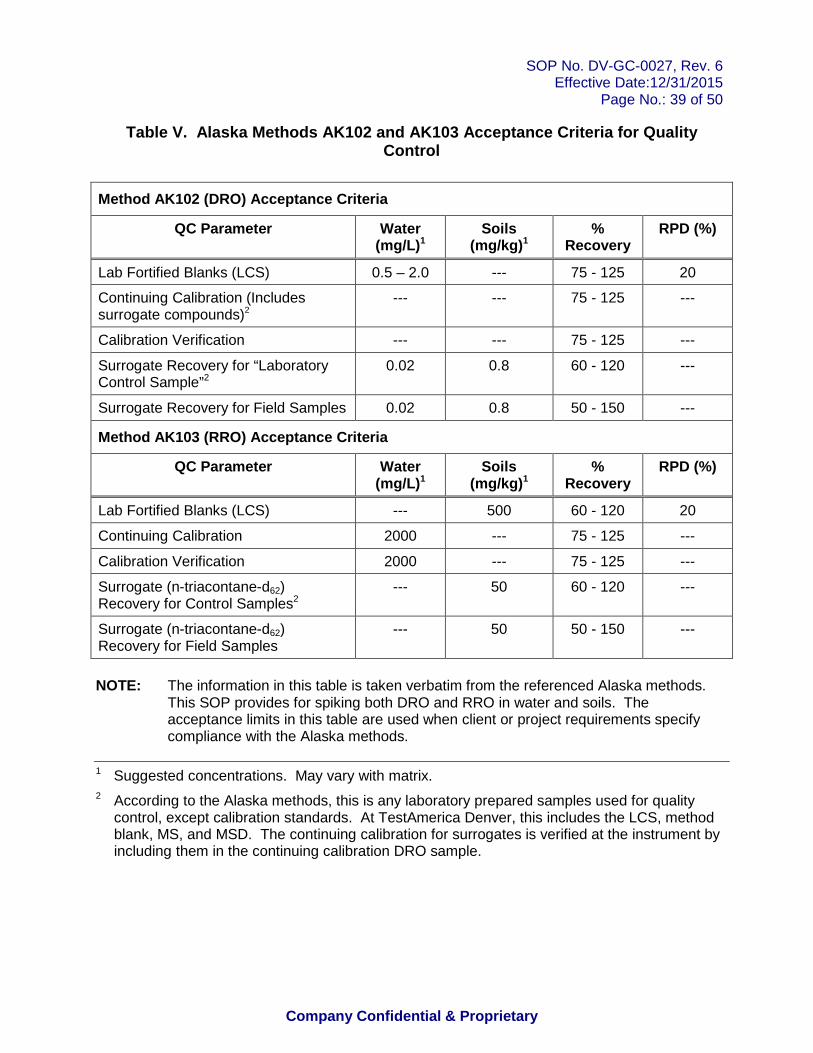
SOP No. DV-GC-0027, Rev. 6 Effective Date:12/31/2015
Page No.: 39 of 50
Company Confidential & Proprietary
Table V. Alaska Methods AK102 and AK103 Acceptance Criteria for Quality Control
Method AK102 (DRO) Acceptance Criteria
QC Parameter Water (mg/L) 1
Soils (mg/kg) 1
% Recovery
RPD (%)
Lab Fortified Blanks (LCS) 0.5 – 2.0 --- 75 - 125 20
Continuing Calibration (Includes surrogate compounds)2
--- --- 75 - 125 ---
Calibration Verification --- --- 75 - 125 ---
Surrogate Recovery for “Laboratory Control Sample”2
0.02 0.8 60 - 120 ---
Surrogate Recovery for Field Samples 0.02 0.8 50 - 150 ---
Method AK103 (RRO) Acceptance Criteria
QC Parameter Water (mg/L) 1
Soils (mg/kg) 1
% Recovery
RPD (%)
Lab Fortified Blanks (LCS) --- 500 60 - 120 20
Continuing Calibration 2000 --- 75 - 125 ---
Calibration Verification 2000 --- 75 - 125 ---
Surrogate (n-triacontane-d62) Recovery for Control Samples2
--- 50 60 - 120 ---
Surrogate (n-triacontane-d62) Recovery for Field Samples
--- 50 50 - 150 ---
NOTE: The information in this table is taken verbatim from the referenced Alaska methods.
This SOP provides for spiking both DRO and RRO in water and soils. The acceptance limits in this table are used when client or project requirements specify compliance with the Alaska methods.
1 Suggested concentrations. May vary with matrix. 2 According to the Alaska methods, this is any laboratory prepared samples used for quality
control, except calibration standards. At TestAmerica Denver, this includes the LCS, method blank, MS, and MSD. The continuing calibration for surrogates is verified at the instrument by including them in the continuing calibration DRO sample.
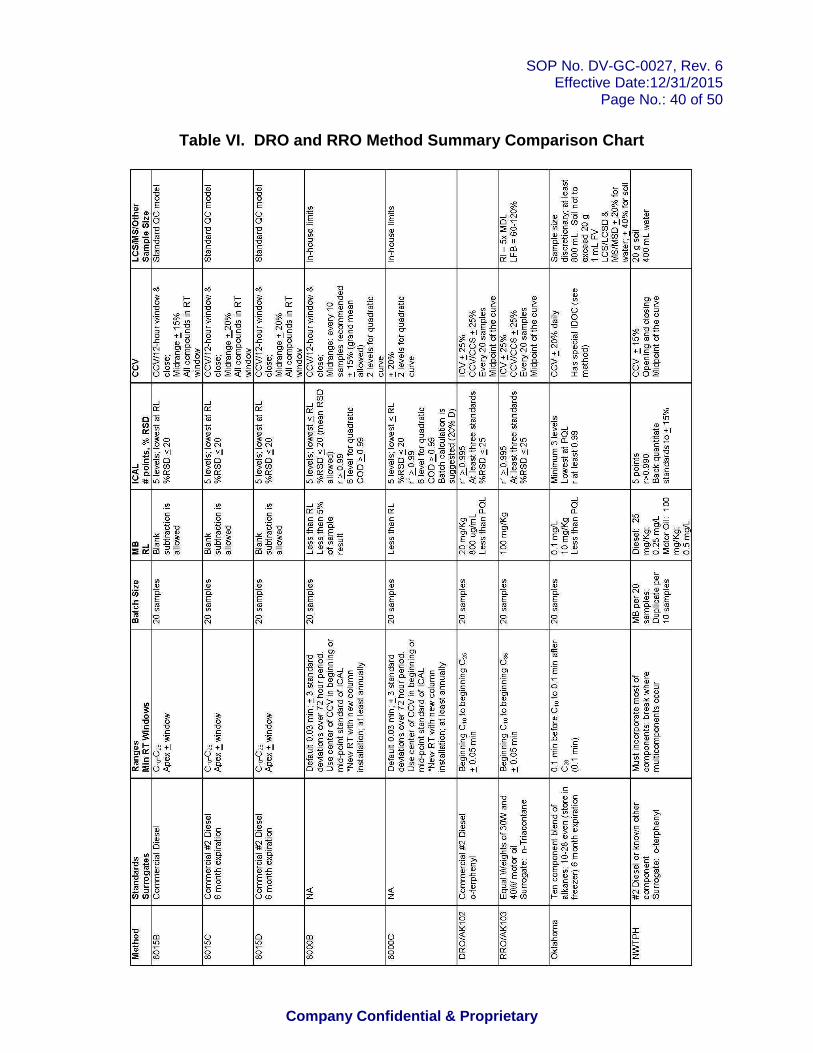
SOP No. DV-GC-0027, Rev. 6 Effective Date:12/31/2015
Page No.: 40 of 50
Company Confidential & Proprietary
Table VI. DRO and RRO Method Summary Comparison Ch art
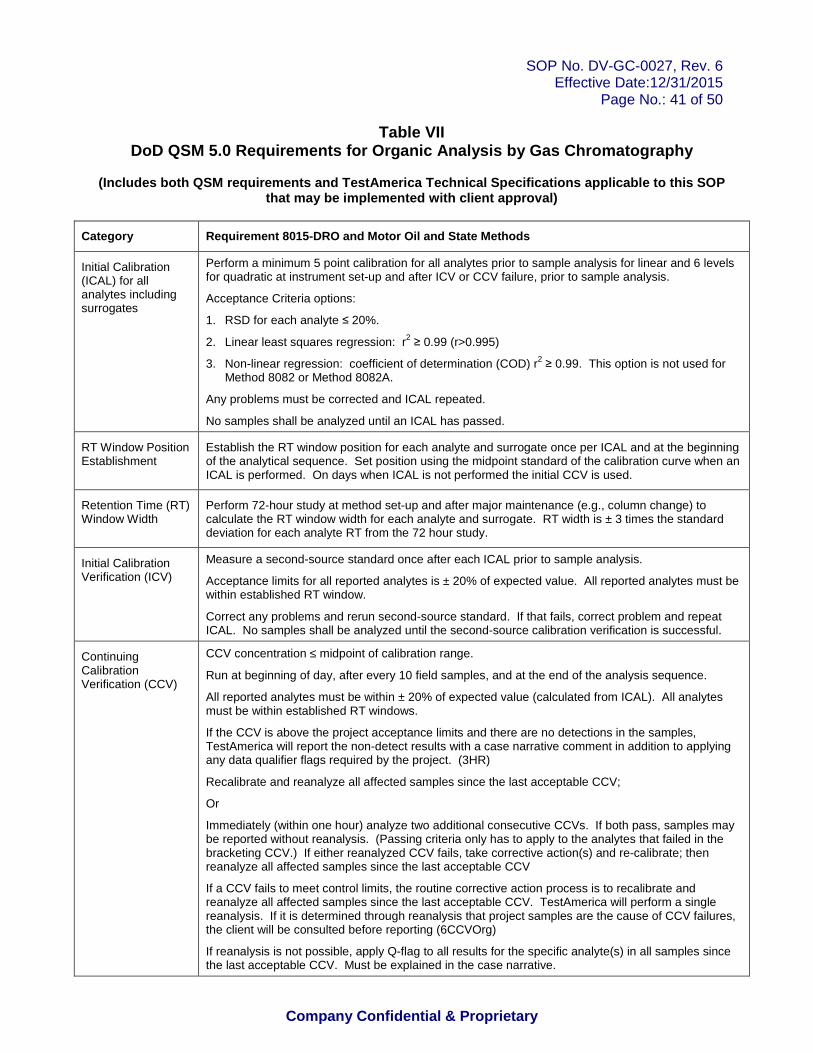
SOP No. DV-GC-0027, Rev. 6 Effective Date:12/31/2015
Page No.: 41 of 50
Company Confidential & Proprietary
Table VII DoD QSM 5.0 Requirements for Organic Analysis by Ga s Chromatography
(Includes both QSM requirements and TestAmerica Tec hnical Specifications applicable to this SOP
that may be implemented with client approval)
Category Requirement 8015-DRO and Motor Oil and Sta te Methods
Initial Calibration (ICAL) for all analytes including surrogates
Perform a minimum 5 point calibration for all analytes prior to sample analysis for linear and 6 levels for quadratic at instrument set-up and after ICV or CCV failure, prior to sample analysis.
Acceptance Criteria options:
1. RSD for each analyte ≤ 20%.
2. Linear least squares regression: r2 ≥ 0.99 (r>0.995)
3. Non-linear regression: coefficient of determination (COD) r2 ≥ 0.99. This option is not used for Method 8082 or Method 8082A.
Any problems must be corrected and ICAL repeated.
No samples shall be analyzed until an ICAL has passed.
RT Window Position Establishment
Establish the RT window position for each analyte and surrogate once per ICAL and at the beginning of the analytical sequence. Set position using the midpoint standard of the calibration curve when an ICAL is performed. On days when ICAL is not performed the initial CCV is used.
Retention Time (RT) Window Width
Perform 72-hour study at method set-up and after major maintenance (e.g., column change) to calculate the RT window width for each analyte and surrogate. RT width is ± 3 times the standard deviation for each analyte RT from the 72 hour study.
Initial Calibration Verification (ICV)
Measure a second-source standard once after each ICAL prior to sample analysis.
Acceptance limits for all reported analytes is ± 20% of expected value. All reported analytes must be within established RT window.
Correct any problems and rerun second-source standard. If that fails, correct problem and repeat ICAL. No samples shall be analyzed until the second-source calibration verification is successful.
Continuing Calibration Verification (CCV)
CCV concentration ≤ midpoint of calibration range.
Run at beginning of day, after every 10 field samples, and at the end of the analysis sequence.
All reported analytes must be within ± 20% of expected value (calculated from ICAL). All analytes must be within established RT windows.
If the CCV is above the project acceptance limits and there are no detections in the samples, TestAmerica will report the non-detect results with a case narrative comment in addition to applying any data qualifier flags required by the project. (3HR)
Recalibrate and reanalyze all affected samples since the last acceptable CCV;
Or
Immediately (within one hour) analyze two additional consecutive CCVs. If both pass, samples may be reported without reanalysis. (Passing criteria only has to apply to the analytes that failed in the bracketing CCV.) If either reanalyzed CCV fails, take corrective action(s) and re-calibrate; then reanalyze all affected samples since the last acceptable CCV
If a CCV fails to meet control limits, the routine corrective action process is to recalibrate and reanalyze all affected samples since the last acceptable CCV. TestAmerica will perform a single reanalysis. If it is determined through reanalysis that project samples are the cause of CCV failures, the client will be consulted before reporting (6CCVOrg)
If reanalysis is not possible, apply Q-flag to all results for the specific analyte(s) in all samples since the last acceptable CCV. Must be explained in the case narrative.

SOP No. DV-GC-0027, Rev. 6 Effective Date:12/31/2015
Page No.: 42 of 50
Company Confidential & Proprietary
Table VII DoD QSM 5.0 Requirements for Organic Analysis by Ga s Chromatography
(continued)
Category Requirement 8015-DRO and Motor Oil and State Method s
Method Blank (MB)
One per prep batch. No analytes detected > ½ LOQ (RL) or >1/10 the amount measured in any sample or 1/10 the regulatory limit, whichever is greater. For Method RSK-175, no common lab contaminants >LOQ (2CLC)
If criteria not met, correct problem. If required, reprep and reanalyze MB and all samples processed with the contaminated blank.
If reanalysis is not possible, apply B-flag to all results for the specific analyte(s) in all samples processed with the contaminated blank. Must be explained in the case narrative. Flagging is only appropriate when samples cannot be reanalyzed.
LCS One LCS per prep batch. Include all analyte(s) in LCS that are required to be reported, including surrogates. For Method 8081, only single-component compounds are spiked (9Spik)
Use DoD acceptance criteria if project limits are not specified. If analyte not listed by DoD, use in-house LCS limits if project limits not specified.
If the LCS recovery is above the project acceptance limits and there are no detections in the samples, TestAmerica will report the non-detect results with a case narrative comment in addition to applying any data qualifier flags required by the project (3HR).
Otherwise, correct any problems then re-prep and reanalyze the LCS and all associated samples for failed analytes. If insufficient sample, then apply Q-flag to specific analyte(s) in all samples in the associated prep batch. Flagging is only appropriate when samples cannot be reanalyzed unless 3HR is accepted by the client.
Matrix Spike One per prep batch. Include all analyte(s) in LCS that are required to be reported, including surrogates.
Use DoD-specific criteria for LCS. For failures, consult project-specific DQOs and contact client for additional measures to be taken.
For specific analyte(s) in parent sample, apply J-flag if acceptance criteria are not met. Explain in the case narrative.
The MS is for matrix evaluation only. If MS falls outside LCS limits, evaluate data to determine the source of the difference and to determine if there is a matrix effect or analytical error.
MSD or Sample Duplicate
One per prep batch. Include all analyte(s) in LCS that are required to be reported, including surrogates.
Use DoD-specific criteria for LCS. For failures, consult project-specific DQOs and contact client for additional measures to be taken. RPD between duplicates ≤ 30%.
For specific analyte(s) in parent sample, apply J-flag if acceptance criteria are not met. Explain in the case narrative. Data shall be evaluated to determine the source of the difference.
Surrogate Spike Spike all field and QC samples with surrogates. Must meet DoD acceptance criteria, otherwise method-specified criteria or lab's in-house criteria.
For QC and field samples, correct any problems, then re-prep and reanalyze all failed samples for failed surrogates in the associated prep batch. If obvious chromatographic interference with surrogate is present, reanalysis may not be necessary.
If surrogate recoveries are above the project acceptance limits and there are no detections in the samples, TestAmerica will report the non-detect results with a case narrative comment in addition to applying any data qualifier flags required by the project. For samples with ND results, a high bias as evidenced in these situations is typically not an issue (3HR).
Apply Q-flag to all associated analytes if acceptance criteria are not met. Explain in the case narrative.

SOP No. DV-GC-0027, Rev. 6 Effective Date:12/31/2015
Page No.: 43 of 50
Company Confidential & Proprietary
Attachment 1 Routine DRO Integration

SOP No. DV-GC-0027, Rev. 6 Effective Date:12/31/2015
Page No.: 44 of 50
Company Confidential & Proprietary
Attachment 2 Valley to Valley Integration cannot be used
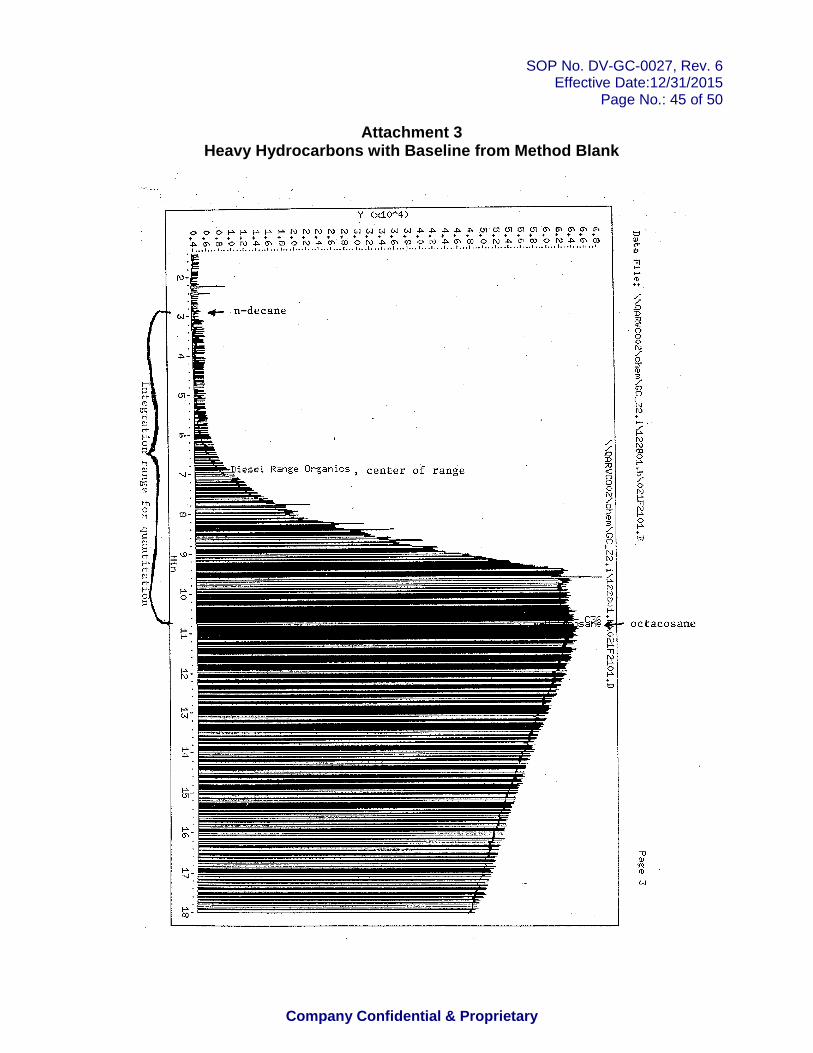
SOP No. DV-GC-0027, Rev. 6 Effective Date:12/31/2015
Page No.: 45 of 50
Company Confidential & Proprietary
Attachment 3 Heavy Hydrocarbons with Baseline from Method Blank

SOP No. DV-GC-0027, Rev. 6 Effective Date:12/31/2015
Page No.: 46 of 50
Company Confidential & Proprietary
Attachment 4 Heavy Hydrocarbons with Non-Standard Signal to Signal Integration

SOP No. DV-GC-0027, Rev. 6 Effective Date:12/31/2015
Page No.: 47 of 50
Company Confidential & Proprietary
Attachment 5 Retention Time Reference Standard

SOP No. DV-GC-0027, Rev. 6 Effective Date:12/31/2015
Page No.: 48 of 50
Company Confidential & Proprietary
Appendix 1: Oklahoma DRO/RRO Requirements Definitions
C8-C11; C12-C14; C15-C20; C21-C30. Each of these carbon ranges are determined by the retention time defining standard. In terms of retention time, the lab will include instrument response eluting 0.1 minutes prior to the apex of the peak for the first alkane of a given carbon range. The end of a given carbon range is defined by the retention time for the alkane marker that designates the beginning of the next carbon range, finally ending 0.1 minutes after the elution of the C30 marker. Identification and quantification of TPH components requires more analytical judgment than other GC methods. The TPH chromatograms consist of groups of peaks that fall within a noted carbon retention time range. Diesel Fuel will be defined as C8-C30 for the Oklahoma method. The standard used for this calibration is a mixture of the even-numbered n-alkanes from C10 – C28. To calibrate for this method, the following determinations are used: C8 – C11 range: based on the response of C10 C12 – C14 range: based on the responses of C12 and C14 C15 – C20 range: based on the responses of C16, C18 and C20 C21 – C30 range: based on the responses of C22, C24, C26, and C28
Standards:
Stock Oklahoma Standard : Supelco TPH1 Standard at 2000 µg/mL of each n-alkane compound. Stock Oklahoma Second Source Standard : Ultra Scientific EPA/Wisconsin Standard at 2000 µg/mL of each n-alkane compound. Stock Oklahoma Surrogate Standard : Supelco o-terphenyl solution at 10,000 µg/mL in methylene chloride. Oklahoma Surrogate Spike Solution : Dilute 5 mL of Stock Oklahoma Surrogate Solution to a final volume of 200 mL using 90:10 acetone:methylene chloride for a final concentration of 50 µg/mL. Oklahoma Spike Solution : Dilute 12.5 mL of Stock Diesel Fuel Second Source Standard to a final volume of 50 mL using acetone for a final concentration of 500 µg/mL of each n-alkane.

SOP No. DV-GC-0027, Rev. 6 Effective Date:12/31/2015
Page No.: 49 of 50
Company Confidential & Proprietary
Appendix 1: Oklahoma DRO/RRO Requirements (continue d)
Oklahoma Calibration Standards : Diesel fuel standards for the Oklahoma methods are prepared in methylene chloride at 6 concentration levels using the Stock Oklahoma Standard and the Stock Oklahoma Surrogate Standard as defined for this method.
Level Fuel Standard Solution Used
Volume Used (mL)
Final Volume
(mL)
Final Conc of each n-alkane
(µg/mL)
Surrogate Conc
(µg/mL)
6 Stock + Stock
Surrogate
0.75
.15
1.0 1500 1500
5 Level 6 .2 0.6 500 500
4* Stock + Stock Surrogate
0.25
0.05
5 100 100
3 Level 4 0.5 1.0 50 50
2 Level 4 0.25 1.0 25 25
1 Level 4 0.1 1.0 10 10
NOTE: The Level 4 (*) calibration standard is also used as the continuing calibration verification standard.
Oklahoma Second Source : The second source for this method is prepared by diluting 0.05 mL of the Stock Oklahoma Second Source Standard and 0.01 mL of the Stock Oklahoma Surrogate Standard to a final volume of 1 mL.
Calibration Levels:
Standard Level 1 Level 2 Level 3 Level 4 Level 5 Le vel 6
C8 – C11 10 25 50 100 500 1500
C12 – C14 20 50 100 200 1000 3000
C15 – C20 30 75 150 300 1500 4500
C21 – C30 40 100 200 400 2000 6000
C8 – C30 100 250 500 1000 5000 15000
Ortho-Terphenyl (surrogate)
10 25 50 100 500 1500
(All concentrations are in mg/L.)

SOP No. DV-GC-0027, Rev. 6 Effective Date:12/31/2015
Page No.: 50 of 50
Company Confidential & Proprietary
Appendix 1: Oklahoma DRO/RRO Requirements (continue d)
Spike Levels for Quality Control
Laboratory Control Samples (LCS) and Matrix Spike/ Spike Duplicate
Spike Concentration
Analyte Water (mg/L) Soil (mg/kg)
C8 – C11 0.5 10
C12 – C14 1.0 20
C15 – C20 1.5 30
C21 – C30 2.0 40
C8 – C30 5.0 100
Surrogate Control Samples
Spike Concentration
Analyte Water (mg/L) Low Soil (mg/kg)
Ortho-Terphenyl 0.05 1