durham e-theses it's teaching jim, but not as we know it
TRANSCRIPT

Durham E-Theses
�It's teaching Jim, but not as we know it�: An
examination of the beliefs and attitudes of teachers to
the use of technology in Further & Vocational Education
from a teacher's perspective.
SHEDDEN, ROBERT,JOHN
How to cite:
SHEDDEN, ROBERT,JOHN (2020) �It's teaching Jim, but not as we know it�: An examination of the
beliefs and attitudes of teachers to the use of technology in Further & Vocational Education from a teacher's
perspective. , Durham theses, Durham University. Available at Durham E-Theses Online:http://etheses.dur.ac.uk/13451/
Use policy
The full-text may be used and/or reproduced, and given to third parties in any format or medium, without prior permission orcharge, for personal research or study, educational, or not-for-pro�t purposes provided that:
• a full bibliographic reference is made to the original source
• a link is made to the metadata record in Durham E-Theses
• the full-text is not changed in any way
The full-text must not be sold in any format or medium without the formal permission of the copyright holders.
Please consult the full Durham E-Theses policy for further details.

Academic Support O�ce, Durham University, University O�ce, Old Elvet, Durham DH1 3HPe-mail: [email protected] Tel: +44 0191 334 6107
http://etheses.dur.ac.uk
2

1
Title “It’s teaching Jim, but not as we know it”: An examination of the beliefs and
attitudes of teachers to the use of technology in Further & Vocational Education
from a teacher’s perspective.
Robert John Shedden
Submitted in fulfilment of the degree of EdD
School of Education
Durham University

2

3
Abstract This study sought to understand the beliefs and attitudes of teachers in Further and Vocational
Education regarding the use and usefulness of technology in their teaching practice.
Policymakers and advocates view increased access to, but continued under-utilisation of
technology as indicative of how the sector is failing to meet the expectations and demands
from industry. This study examined the underlying perceptions of teachers and identified the
barriers and enablers that presented themselves to technology integration. I wanted to gain an
understanding in what ways and how often teachers were using technology in their teaching
practices. Additionally, teacher's perceptions about the potential contribution that technology
could make to their teaching practice would be explored. The study was completed in three
phases; the first was an online questionnaire distributed through the college intranet networks
and yielded 229 responses. The second phase was another online questionnaire; and this one
was distributed directly to teachers that had confirmed that they would be prepared to continue
with the study and was sent to 31 teacher’s work email addresses resulting in 21 completed
surveys. Eleven one-to-one interviews completed the third phase of the study. The interviews
used photo-elicitation to examine the beliefs of the teachers from the Further Education (FE)
colleges across a range of subject areas. Each phase of the research was designed to elicit
information relating to teacher’s perceptions of the utility and value of technology in their
teaching. The results presented in this thesis reflect many of the findings from previous
research from other education sectors, namely schools and universities; however other
perceptions reflected the uniqueness of the Further and Vocational Education sector and are
perhaps a reflection of the demographics of the sector. The main findings of the study were
that several barriers existed to the integration and use of technology, a perceived lack of time
along with lack of training and support in how to teach effectively using technology. Insufficient
provision and access to technology within colleges meant that there was a reliance on students
using personal devices to supplement lack of provision in the college, raising issues in low
socioeconomic areas. Additionally, there was a perception that technology integration had
been superseded in recent years by other CPD mandated for external audits and inspection.

4

5
Table of Contents:
Title .................................................................................................................... 1
Abstract ............................................................................................................. 3
Table of Contents: .............................................................................................. 5
List of Tables: ................................................................................................... 13
List of Figures: .................................................................................................. 24
List of Abbreviations. ........................................................................................ 25
Statement of Copyright .................................................................................... 27
Acknowledgements .......................................................................................... 27
Dedication ........................................................................................................ 28
Chapter 1 - Background, rationale & context of the study. ........................... 29
1.1 Background. .......................................................................................... 29
1.2 Research Questions. .............................................................................. 32
1.3 Scope of the Study. ................................................................................ 33
1.4 Significance of Study. ............................................................................ 33
1.5 Structure of this Thesis. ........................................................................ 34
Chapter 2 - Literature Review. ....................................................................... 37
2.1 Introduction. ......................................................................................... 37
2.2 Context of Vocational Education. ........................................................... 38
2.2.1 Introduction. ................................................................................. 38
2.2.2 Context, and Perceptions of Post-Compulsory Education. .......... 39
2.2.3 Further and Vocational Education Teaching and Delivery. ........ 42
2.2.4 Management and External Policies. ............................................. 45
2.2.5 Section Conclusions. ..................................................................... 46
2.3 Barriers, attitudes and beliefs related to technology integration. ...... 48
2.3.1 Introduction. ................................................................................. 48
2.3.2 Position of Technology in Education. ........................................... 48
2.3.3 The Concept of Barriers to technology integration. .................... 51
6
2.4 Established Barriers. ............................................................................ 56
2.4.1 Barriers associated with Resources. ............................................. 57
2.4.2 The Absence of or non-specific Training. ..................................... 58
2.4.3 Lack of Technical Support. ............................................................ 59
2.4.4 Absence of Pedagogical Support. .................................................. 60
2.4.5 Shortage of Time. ........................................................................... 61
2.4.6 Infra-structure related barriers. ................................................... 62
2.4.7. Intrinsic barriers. .......................................................................... 63
2.4.8 Teacher self-efficacy in using technology. .................................... 64
2.4.9 Teacher Core Beliefs. ..................................................................... 65
2.5 Technology Adoption Models. .............................................................. 67
2.6 Development of the Research Questions. ............................................ 69
Chapter 3 Methodology and design. .............................................................. 71
3.1 Introduction. ......................................................................................... 71
3.2 The philosophical and theoretical underpinnings of the research
project. ........................................................................................................ 71
3.2.1 Theoretical stances and positions. ................................................ 71
3.3 Approaches to Data collection. ............................................................... 76
3.3.1 Qualitative Research. ..................................................................... 76
3.3.2 Quantitative Research. ................................................................... 76
3.3.3 Mixed Methods Research. .............................................................. 76
3.3.4 Theoretical perspective and Epistemological Considerations. .... 77
3.4 Design. ................................................................................................... 79
3.5 Methods. ................................................................................................ 79
3.5.1 Satisfying Shenton’s (2004) criteria. ............................................ 81
3.5.2 Identifying Participants and Gaining Access................................. 82
3.5.3 Phase 1. .......................................................................................... 83
3.5.4 Questionnaires. .............................................................................. 83
3.5.5 Summary of Phase 1 Survey. ......................................................... 84

7
3.5.6 Phase 2. .......................................................................................... 85
3.5.7 Interviews...................................................................................... 85
3.5.8 Preparation of interview schedule. .............................................. 87
3.5.9 Phase 3 Data Analysis. .................................................................. 88
3.6 Sample. .................................................................................................. 89
3.6.1 Breakdown of Sample in phase one survey. ................................ 90
3.6.2 Breakdown of participants in phase 1 survey by independent
variable. .................................................................................................. 91
3.6.3 Breakdown of participants in phase 2 survey by independent
variable. .................................................................................................. 91
3.6.4 Breakdown of participants in phase 3 survey by independent
variables. ................................................................................................ 92
3.7.1 Voluntary and informed consent. ................................................. 92
3.7.2 Anonymity and Confidentiality. ................................................... 93
Chapter 4 – Results. ........................................................................................ 95
4.1 Introduction. ......................................................................................... 95
4.2. Teachers perceived self-efficacy in using technology for teaching
preparation and delivery. ........................................................................... 96
4.2.1 Introduction. ................................................................................. 96
4.2.2 Summary of statistically significant results on “Teacher perceived
self-efficacy in the use of technology for tasks linked to teaching and
delivery.” ................................................................................................ 97
4.2.3 Interpretation of results from Analysis of Variance into teachers
perceived self-efficacy in using technology for teaching preparation and
delivery. .................................................................................................. 98
4.3 Barriers and facilitators to support the use of technology in Further/
Vocational Education? ................................................................................ 99
4.3.1 Introduction. ................................................................................. 99
4.3.2 A Summary of statistically significant results regarding barriers
perceived as impacting on the integration and use of technology. ... 100

8
4.4.3 An Interpretation of Statistically Significant Results of perceived
teacher barriers to the integration of technology into classroom
practices. ............................................................................................... 101
4.4 Technology related Continued Professional Development (CPD) -
Teacher Participation. .............................................................................. 102
4.4.1 Introduction. ................................................................................. 102
4.4.2 A Summary of statistically significant results regarding
participation in training and CPD courses. .......................................... 103
4.4.3 Interpretation of statistically significant results regarding
participation in Training and CPD........................................................ 103
4.5 Summary. ............................................................................................. 105
Chapter 5 - Thematic Analysis. .................................................................... 107
5.1 Introduction. ....................................................................................... 107
5.2 Identified barriers to the integration of technology. ........................ 110
5.2.1 Extrinsic Barriers to technology integration. ................................. 110
5.2.1.1 Lack of resources. ..................................................................... 111
5.2.1.2 Access to training. ..................................................................... 115
5.2.1.3 Lack of Technical Support. ....................................................... 118
5.2.1.4 Absence of Pedagogical Support. ............................................. 120
5.2.1.5 Shortage of Time. ...................................................................... 122
5.2.1.6 Infra-structure related barriers. .............................................. 123
5.2.1.7 Summary ................................................................................... 124
5.2.2 The intrinsic barriers to technology integration. ........................... 125
5.2.2.1 Teacher self-efficacy in using technology. ............................... 126
5.2.2.2 Perceptions of colleague’s efficacy. .......................................... 129
5.2.2.3 Core Belief. ................................................................................ 130
5.3 Role of & Engagement with Technology in Teaching Practices. ....... 138
5.3.1 How technology is used by teachers. .......................................... 138
5.3.2 Perceptions of technology usefulness. ........................................ 141
5.3.3 Summary. ..................................................................................... 142
9
5.4 Management. ....................................................................................... 143
5.4.1 Introduction ...................................................................................... 143
5.4.2 Management decisions. ................................................................... 143
5.4.2.1 External influences affecting technology integration. ............ 143
5.4.2.2 Internal influences affecting technology integration. ............ 145
5.4.2.3 Management Decisions ............................................................ 147
5.4.2.4 Summary. ................................................................................. 148
Chapter 6 - Discussion, Limitations and Recommendation for Future Discussion.
....................................................................................................................... 151
6.1 Introduction. ........................................................................................ 151
6.2 How do teachers in Further and Vocational Education use and integrate
technology into their teaching practice? .................................................... 153
6.3 What barriers and facilitators exist to inhibit or support the use of
technology in Further/ Vocational Education? ........................................... 155
6.4 What are teacher's beliefs concerning the integration and contribution
technology can make to their teaching in Further/Vocational Education? . 158
6.5 Limitations of the study. ....................................................................... 159
6.6 The future: Implications for Policy, Practice & Research ...................... 161
6.7 Future Research. .................................................................................. 163
References: .................................................................................................... 167
Appendices: ................................................................................................... 193
Appendix A. ................................................................................................ 193
Ethical Approval from University. ............................................................... 193
Appendix B. ................................................................................................ 194
Satisfying criteria from Shenton (2004): ..................................................... 194
Appendix C. ................................................................................................ 195
Participation request letter ........................................................................ 195
Appendix D. ................................................................................................ 197
Phase 1 Survey. .......................................................................................... 197
Phase 1 Survey Version 5 ....................................................................... 197
10
Confidential participant information ...................................................... 199
Experience of using ICT within your teaching practice............................ 200
ICT access for teaching ........................................................................... 200
Support to teachers for ICT use .............................................................. 202
ICT based activities and material used for teaching ................................ 203
Obstacles to the use of ICT in teaching and learning .............................. 205
Teachers’ skills ....................................................................................... 207
ICT in school management ..................................................................... 209
Finish & Thank You ................................................................................. 210
Appendix E. ................................................................................................ 211
Complete results chapter. .......................................................................... 211
Statistically Significant results from One-Way between subject ANOVA.211
Results of the one-way between subjects’ ANOVA showing statistical
significance on “Teacher perceived self-efficacy and integration of
technology for tasks linked to preparation, teaching and delivery” ....... 211
Results of the one-way ANOVA showing statistical significance on “Teachers
perceptions of barriers that could adversely affect the integration of
Technology into teaching practice” ........................................................ 217
Results of the one-way between subjects’ ANOVA showing statistical
significance of “Teacher participation in technology related Continued
Professional Development (CPD) courses.” ............................................ 221
Results of on-way between subject ANOVA showing no statistical
significance ............................................................................................. 226
Teacher self-efficacy in general tasks incorporating technology............. 226
Frequency and type of teacher engagement with technology in their
teaching practice. ................................................................................... 241
Using ICT to browse or search the internet for resources to be used during
classroom practice. ................................................................................ 241
4.5.5 Using ICT to create their own digital materials. ............................. 242
Types of ICT resources used in classroom delivery or teaching. ............. 245
11
Teachers’ perceptions about potential barriers and factors that could
adversely affect the integration of Technology into teaching practice: . 247
Teacher participation in technology related Continued Professional
Development (CPD) courses: ................................................................. 256
Tables of results showing no statistical significance and therefore not
included in results chapter .................................................................... 268
Frequency and type of teacher engagement with Information
Communication Technology (ICT) in their teaching practice. ................. 272
Types of ICT resources used in classroom delivery or teaching. ............ 276
Teacher’s perceptions regarding potential barriers and factors that could
adversely affect the integration of Technology into teaching practice: . 279
Teacher participation in technology related Continued Professional
Development (CPD) courses that produced results showing no statistical
significance: ........................................................................................... 284
Results showing a statistical significance with independent variables of
Location and Gender. ............................................................................ 286
Confidence in preparing material for use with interactive white boards.292
Appendix F. ................................................................................................ 294
Phase 2 Survey. .......................................................................................... 294
Phase 2 Questionnaire .......................................................................... 294
Page 1 .................................................................................................... 294
Page 2: Confidential participant information ......................................... 295
Page 3: Teacher Academic and Professional autobiography .................. 295
Finish & Thank You ................................................................................ 296
Appendix G. ................................................................................................ 297
Comparison of study data and Education and Training Foundation 2017
Report. ....................................................................................................... 297
Appendix H. ................................................................................................ 298
One to One Interview Images & General Questions. .................................. 298
Appendix I. ................................................................................................. 301
Participant transcript with coding: ............................................................. 301
12
Appendix J. ................................................................................................. 312
Profiles of teachers taking part in the one to one interviews. .................... 312
Lynn: ...................................................................................................... 312
Mike: ...................................................................................................... 312
Ray: ........................................................................................................ 313
Philip: ..................................................................................................... 314
Nancy: .................................................................................................... 314
Gill: ......................................................................................................... 315
Peter: ..................................................................................................... 315
Dan: ........................................................................................................ 316
Geoff: ..................................................................................................... 317

13
List of Tables: Table 3.1: Number of participants in each phase of the study.............. 89
Table 3.2: Breakdown of participants in phase 1 by independent variable. 91
Table 3.3: Breakdown of participants in phase 2 by independent variable. 91
Table 3.4: Breakdown of participants in phase 3 by independent variable. 92
Table 4.1: Summary of statistically significant ANOVA results showing teacher
perceived self-efficacy in using technology in tasks linked to teaching and
delivery. ............................................................................................... 97
Table 4.2: Summary of barriers perceived as impacting on the integration and
use of technology. .............................................................................. 100
Table 4.3: Summary of ANOVA results showing statistically significant results for
participation in training courses. ........................................................ 103
Appendix E Table1: Participant self-efficacy in their ability to create an online
questionnaire. ANOVA results by Age, Subject Area and Teaching Experience.
........................................................................................................... 211
Appendix E Table2: Reported self-efficacy of respondents in their ability to
create an online questionnaire by age. .............................................. 211
Appendix E Table3: Participant self-efficacy in their ability to create a
presentation containing simple animation. ANOVA results by Age, Subject Area
and Teaching Experience. ................................................................... 212
Appendix E Table4: Reported self-efficacy of respondents in their ability to create
a presentation containing simple animation by age. .......................... 212
Appendix E Table5: Participant self-efficacy in their ability to create a
presentation containing video. ANOVA results by Age, Subject Area and Teaching
Experience.......................................................................................... 212
Appendix E Table6: Reported self-efficacy of respondents in their ability to
create a presentation containing video by age. .................................. 213
Appendix E Table7: Participant self-efficacy in their ability to download materials
from websites or learning platforms. ANOVA results by Age, Subject Area and
Teaching Experience........................................................................... 213
Appendix E Table8: Reported self-efficacy of respondents in their ability to
download resources from websites and learning platforms by age.... 213
14
Appendix E Table9: Participant self-efficacy in their ability to prepare materials
for interactive whiteboards. ANOVA results by Age, Subject Area and Teaching
Experience. ........................................................................................ 214
Appendix E Table10: Reported self-efficacy of respondents in their ability to
prepare materials for interactive whiteboards by age. ...................... 214
Appendix E Table11: Reported self-efficacy of respondents in their ability to
prepare materials for interactive whiteboards by teaching experience.214
Appendix E Table12: Participants' attitudes to engagement with and use of
technology to collect resources to be used during lessons. ANOVA results by Age,
Subject Area and Teaching Experience. .............................................. 215
Appendix E Table13: Participants’ attitudes to the frequency of use of technology
to collect resources to be used in class teaching by age. .................... 215
Appendix E Table14: Participants' attitudes to engagement with and use of
technology to prepare tasks for students. ANOVA results by Age, Subject Area
and Teaching Experience. ................................................................... 215
Appendix E Table15: Participants’ attitudes to the frequency of use of technology
to prepare tasks for students by age. ................................................. 216
Appendix E Table16: Teacher use of resources collected from existing
educational sources in classroom delivery and teaching. ANOVA results by Age,
Subject Area and Teaching Experience. .............................................. 216
Appendix E Table17: Frequency table showing number of participants who
collect resources from existing educational sources in classroom delivery and
teaching by age. ................................................................................. 216
Appendix E Table18: Frequency table showing number of participants who
collect resources from existing educational sources in classroom delivery and
teaching by subject area. ................................................................... 217
Appendix E Table19: Participants' attitudes to the number of computers present
in the classroom as a potential barrier to the integration of technology into
teacher practice by Age, Subject Area and Teaching Experience. ....... 217
Appendix E Table20: Participants' attitudes to the number of computers present
in the classroom as a potential barrier to the integration of technology into
teacher practice by age. ..................................................................... 218
Appendix E Table21: Is insufficient bandwidth perceived as a barrier to
technology integration into teacher practice? ANOVA results by Age, Subject
Area and Teaching Experience. .......................................................... 218

15
Appendix E Table22: Participant attitudes to the availability of adequate
bandwidth as a barrier to the integration of technology into teacher practice by
subject area. ....................................................................................... 218
Appendix E Table23: Is insufficient number of portable devices perceived to be a
barrier to technology integration into teacher practice? ANOVA results by Age,
Subject Area and Teaching Experience ............................................... 219
Appendix E Table24: Participant attitudes to the availability of portable devices
as a barrier to the integration of technology into teacher practice by age. 219
Appendix E Table25: Participant attitudes to the availability of portable devices
as a barrier to the integration of technology into teacher practice by subject area.
........................................................................................................... 219
Appendix E Table26: Is a lack of pedagogical models perceived to be a barrier to
technology integration into teacher practice? ANOVA results by Age, Subject
Area and Teaching Experience. .......................................................... 220
Appendix E Table27: Participant attitudes to pedagogical models as a barrier to
the integration of technology into teacher practice by age. ............... 220
Appendix E Table28: Is the pressure to prepare students for examinations
perceived to be a barrier to technology integration into teacher practice? ANOVA
results by Age, Subject Area and Teaching Experience. ...................... 220
Appendix E Table29: Participant attitudes to pressure for assessment or
examination preparations as a barrier to the integration of technology into
teacher practice by subject area. ....................................................... 221
Appendix E Table30: Participation in training courses in Introduction to
computers and internet. ANOVA results by Age, Subject Area and Teaching
Experience.......................................................................................... 221
Appendix E Table31: Number of participants who attended CPD courses in
introduction to computer and internet use by age. ............................ 221
Appendix E Table32: Frequency table showing number of participants who
attended CPD courses in introduction to computer and internet use by teaching
experience. ........................................................................................ 222
Appendix E Table33: Participation in training courses in equipment specific use.
ANOVA results by Age, Subject Area and Teaching Experience. ......... 222
Appendix E Table34: Number of participants who attended CPD courses in
equipment specific training by teaching experience. ......................... 222

16
Appendix E Table35: Participation in training on subject specific training courses
using technology and learning apps. ANOVA results by Age, Subject Area and
Teaching Experience. ......................................................................... 223
Appendix E Table36: Number of participants who attended CPD courses on
subject specific training by age. ......................................................... 223
Appendix E Table37: Number of participants who attended CPD courses on
subject specific training by teaching experience. ............................... 223
Appendix E Table38: Participation in courses through In-House training. ANOVA
results by Age, Subject Area and Teaching Experience. ...................... 224
Appendix E Table39: Number of participants who attended CPD courses through
In-House training by age. ................................................................... 224
Appendix E Table40: Number of participants who attended CPD courses through
In-House training by teaching experience. ......................................... 224
Appendix E Table41: Participation in courses provided from sources other than
though In-House training. ANOVA results by Age, Subject Area and Teaching
Experience. ........................................................................................ 225
Appendix E Table42: Number of participants who attended CPD courses
provided from sources other than through In-House training by age. 225
Appendix E Table43: Number of participants who attended CPD courses
provided from sources other than through In-House training by teaching
experience. ........................................................................................ 225
Appendix E Table44: Teacher self-efficacy in creating a database by Location,
Age, Gender, Subject Area and Teaching Experience. ........................ 226
Appendix E Table45: Frequency table showing number of participants who were
able to create a database by age. ....................................................... 226
Appendix E Table46: Teacher self-efficacy in able to create an online
questionnaire by Location, Age, Gender, Subject Area and Teaching Experience.
........................................................................................................... 227
Appendix E Table47: Frequency table showing number of participants who have
confidence in creating an online questionnaire by age. ..................... 227
Appendix E Table48: Frequency table showing number of participants who
collect resources from existing educational sources in classroom delivery and
teaching by subject area. ................................................................... 228
Appendix E Table49: Teacher self-efficacy in emailing files by Location, Age,
Gender, Subject Area and Teaching Experience. ................................ 228
17
Appendix E Table50: Frequency table showing number of participants who have
confidence in creating an online questionnaire by age. ..................... 229
Appendix E Table51: Teacher self-efficacy in being able to create a presentation
containing simple animation by Location, Age, Gender, Subject Area and
Teaching Experience........................................................................... 230
Appendix E Table52: Frequency table showing number of participants who have
confidence in creating a presentation with simple animation by age. 230
Appendix E Table53: Teacher self-efficacy in being able to create a presentation
containing video by Location, Age, Gender, Subject Area and Teaching
Experience.......................................................................................... 231
Appendix E Table54: Frequency table showing number of participants who have
confidence in creating a presentation containing video by age. ......... 231
Appendix E Table55: Teacher self-efficacy in participating in professional online
forums by Location, Age, Gender, Subject Area and Teaching Experience. 232
Appendix E Table56: Frequency table showing number of participants who have
confidence taking part in professional online forums by age. ............ 232
Appendix E Table57: Teacher self-efficacy in being able to create or maintain a
blog or website by Location, Age, Gender, Subject Area and Teaching Experience.
........................................................................................................... 233
Appendix E Table58: Frequency table showing number of participants who have
confidence in creating or maintaining a blog or website by age. ........ 234
Appendix E Table59: Frequency table showing number of participants who have
confidence in creating or maintaining a blog or website by subject area.234
Appendix E Table60: Frequency table showing number of participants who have
confidence in creating or maintaining a blog or website by teaching experience.
........................................................................................................... 235
Appendix E Table61: Teacher self-efficacy in being able to participate in social
network by Location, Age, Gender, Subject Area and Teaching Experience. 236
Appendix E Table62: Frequency table showing number of participants who have
confidence in participating in social network by age. ......................... 236
Appendix E Table63: Teacher self-efficacy in being able to download computer
software by Location, Age, Gender, Subject Area and Teaching Experience. 237
Appendix E Table64: Frequency table showing number of participants who have
confidence in downloading software by age. ..................................... 237

18
Appendix E Table65: Teacher self-efficacy in being able to download resources
from websites and learning platforms by Location, Age, Gender, Subject Area
and Teaching Experience. ................................................................... 238
Appendix E Table66: Frequency table showing number of participants who have
confidence in downloading resources from websites and learning platforms by
age. .................................................................................................... 238
Appendix E Table67: Teacher self-efficacy in being able to preparing materials
for interactive whiteboards. by Location, Age, Gender, Subject Area and
Teaching Experience. ......................................................................... 239
Appendix E Table68: Frequency table showing number of participants who have
confidence in preparing materials for interactive whiteboards by age.239
Appendix E Table69: Frequency table showing number of participants who have
confidence in preparing materials for interactive whiteboards by teaching
experience. ........................................................................................ 239
Appendix E Table70: Summary of test showing statistical significance for teacher
self-efficacy in specific tasks using ICT. ............................................... 240
Appendix E Table71: Teacher engagement with ICT using apps to prepare
presentations by Location, Age, Gender, Subject Area and Teaching Experience.
........................................................................................................... 241
Appendix E Table72: Frequency table showing number of participants who
engage with ICT to collect resources to be used in class teaching by age.241
Appendix E Table73: Teacher engagement with ICT and creating their own digital
material by Location, Age, Gender, Subject Area and Teaching Experience. 242
Appendix E Table74: Frequency table showing number of participants who
engage with ICT to create their own digital material by subject area. 243
Appendix E Table75: Teacher engagement with ICT using applications to prepare
tasks for students by Location, Age, Gender, Subject Area and Teaching
Experience. ........................................................................................ 243
Appendix E Table76: Frequency table showing number of participants who
engage with ICT to prepare tasks for students by age. ....................... 244
Appendix E Table77: Summary of interaction and engagement with ICT in
teaching practice. ............................................................................... 244
Appendix E Table78: Teacher use of resources collected from existing
educational sources in classroom delivery and teaching by Location, Age,
Gender, Subject Area and Teaching Experience. ................................ 245
19
Appendix E Table79: Frequency table showing number of participants who
collect resources from existing educational sources in classroom delivery and
teaching by age. ................................................................................. 246
Appendix E Table80: Frequency table showing number of participants who
collect resources from existing educational sources in classroom delivery and
teaching by subject area. ................................................................... 246
Appendix E Table81: Summary of materials used by teachers in delivery and
teaching. ............................................................................................ 247
Appendix E Table82: Insufficient number of computers perceived to be a barrier
to ICT integration into teacher practice by Location, Age, Gender, Subject Area
and Teaching Experience. ................................................................... 248
Appendix E Table83: Frequency table showing number of participants who
regarded insufficient number of computers to be a barrier to the integration of
ICT into teacher practice by age. ........................................................ 248
Appendix E Table84: Insufficient bandwidth is perceived to be a barrier to ICT
integration into teacher practice by Location, Age, Gender, Subject Area and
Teaching Experience........................................................................... 249
Appendix E Table85: Frequency table showing number of participants who
perceived insufficient bandwidth to be a barrier to the integration of ICT into
teacher practice by subject area. ....................................................... 250
Appendix E Table86: Insufficient number of portable devices is perceived to be a
barrier to ICT integration into teacher practice by Location, Age, Gender, Subject
Area and Teaching Experience ........................................................... 251
Appendix E Table87: Frequency table showing number of participants who
regarded insufficient number of portable devices to be a barrier to the
integration of ICT into teacher practice by age. .................................. 251
Appendix E Table88: Frequency table showing number of participants who
perceived insufficient number of portable devices to be a barrier to the
integration of ICT into teacher practice by subject area. .................... 252
Appendix E Table89: Lack of pedagogical models is perceived to be a barrier to
ICT integration into teacher practice by Location, Age, Gender, Subject Area and
Teaching Experience........................................................................... 253
Appendix E Table90: Frequency table showing number of participants who
regarded lack of pedagogical models to be a barrier to the integration of ICT into
teacher practice by age. ..................................................................... 253

20
Appendix E Table91: Pressure to prepare students for examinations is perceived
to be a barrier to ICT integration into teacher practice by Location, Age, Gender,
Subject Area and Teaching Experience. .............................................. 254
Appendix E Table92: Frequency table showing number of participants who
regarded pressure to prepare students for assessments to be a barrier to the
integration of ICT into teacher practice by subject area. .................... 254
Appendix E Table93: Summary of perceived barriers to integration of ICT into
classroom practices. ........................................................................... 255
Appendix E Table94: Participation in CPD courses in Introduction to computers
and internet by Location, Age, Gender, Subject Area and Teaching Experience.
........................................................................................................... 256
Appendix E Table95: Frequency table showing number of participants who
attended CPD courses in introduction to computer and internet use by age. 257
Appendix E Table96: Frequency table showing number of participants who
attended CPD courses in introduction to computer and internet use by subject
area. ................................................................................................... 257
Appendix E Table97: Frequency table showing number of participants who
attended CPD courses in introduction to computer and internet use by teaching
experience. ........................................................................................ 258
Appendix E Table98: Participation in CPD courses in equipment specific use by
Location, Age, Gender, Subject Area and Teaching Experience. ......... 259
Appendix E Table99: Frequency table showing number of participants who
attended CPD courses in equipment specific training by teaching experience.
........................................................................................................... 259
Appendix E Table100: Participation in CPD courses in subject specific training on
learning apps. by Location, Age, Gender, Subject Area and Teaching Experience
........................................................................................................... 260
Appendix E Table101: Frequency table showing number of participants who
attended CPD courses on subject specific training by age. ................. 261
Appendix E Table102: Frequency table showing number of participants who
attended CPD courses on subject specific training by teaching experience. 261
Appendix E Table103: Participation in CPD courses in multi-media by Location,
Age, Gender, Subject Area and Teaching Experience ......................... 262
Appendix E Table104: Frequency table showing number of participants who
attended CPD courses on multi-media by teaching experience. ........ 262

21
Appendix E Table105: Participation in CPD courses through In-House training by
Location, Age, Gender, Subject Area and Teaching Experience. ......... 263
Appendix E Table106: Frequency table showing number of participants who
attended CPD courses through In-House training by age. .................. 263
Appendix E Table107: Frequency table showing number of participants who
attended CPD courses through In-House training by teaching experience. 264
Appendix E Table108: Participation in CPD courses provided from sources other
than though In-House training by Location, Age, Gender, Subject Area and
Teaching Experience........................................................................... 265
Appendix E Table109: Frequency table showing number of participants who
attended CPD courses provided from sources other than through In-House
training by age. .................................................................................. 265
Appendix E Table110: Frequency table showing number of participants who
attended CPD courses provided from sources other than through In-House
training by teaching experience. ........................................................ 266
Appendix E Table111: Summary of test showing statistical significance for
participation in CPD courses. .............................................................. 267
Appendix E Table112: Teacher self-efficacy in use of word processing programme
by Location, Age, Gender, Subject Area and Teaching Experience. .... 268
Appendix E Table113: Teacher self-efficacy in using email by Location, Age,
Gender, Subject Area and Teaching Experience. ................................ 269
Appendix E Table114: Teacher self-efficacy in capturing and editing digital
photos and images by Location, Age, Gender, Subject Area and Teaching
Experience.......................................................................................... 269
Appendix E Table115: Teacher self-efficacy in editing text online containing
hyperlinks and images by Location, Age, Gender, Subject Area and Teaching
Experience.......................................................................................... 270
Appendix E Table116: Teacher self-efficacy in organising computer files and
folders by Location, Age, Gender, Subject Area and Teaching Experience. 270
Appendix E Table117: Teacher self-efficacy in using a spreadsheet programme
by Location, Age, Gender, Subject Area and Teaching Experience. .... 271
Appendix E Table118: Teacher self-efficacy in using a spreadsheet to plot a graph
by Location, Age, Gender, Subject Area and Teaching Experience. .... 271
Appendix E Table119: Teacher engagement with ICT to collect resources for
lesson preparation by Location, Age, Gender, Subject Area and Teaching
Experience.......................................................................................... 272

22
Appendix E Table120: Teacher engagement with ICT using apps to prepare
presentations by Location, Age, Gender, Subject Area and Teaching Experience.
........................................................................................................... 273
Appendix E Table121: Teacher use of ICT to provide student feedback by
Location, Age, Gender, Subject Area and Teaching Experience. ......... 273
Appendix E Table122: Teacher using ICT to evaluate other digital learning
resources by Location, Age, Gender, Subject Area and Teaching Experience. 274
Appendix E Table123: Teacher engagement with ICT to download material from
the college website by Location, Age, Gender, Subject Area and Teaching
Experience. ........................................................................................ 274
Appendix E Table124: Teacher engagement with ICT to download material from
a VLE by Location, Age, Gender, Subject Area and Teaching Experience.275
Appendix E Table125: Teacher engagement with ICT to research possible CPD
opportunities by Location, Age, Gender, Subject Area and Teaching Experience.
........................................................................................................... 275
Appendix E Table126: Teacher use of resources collected from the internet in
classroom delivery and teaching by Location, Age, Gender, Subject Area and
Teaching Experience. ......................................................................... 276
Appendix E Table127: Teacher use of off-line electronic resources by Location,
Age, Gender, Subject Area and Teaching Experience. ........................ 277
Appendix E Table128: Teacher use materials of their own creation by Location,
Age, Gender, Subject Area and Teaching Experience. ........................ 277
Appendix E Table129: Teacher use materials from mainstream websites by
Location, Age, Gender, Subject Area and Teaching Experience. ......... 278
Appendix E Table130: Insufficient number of internet connected computers
perceived to be a barrier to ICT integration into teacher practice by Location,
Age, Gender, Subject Area and Teaching Experience. ........................ 279
Appendix E Table131: Low or out-dated specification of Technology and
computer hardware is perceived to be a barrier to ICT integration into teacher
practice by Location, Age, Gender, Subject Area and Teaching Experience. 280
Appendix E Table132: Lack of teacher skills is perceived to be a barrier to ICT
integration into teacher practice by Location, Age, Gender, Subject Area and
Teaching Experience. ......................................................................... 280
Appendix E Table133: Insufficient technical support is perceived to be a barrier
to ICT integration into teacher practice by Location, Age, Gender, Subject Area
and Teaching Experience. ................................................................... 281
23
Appendix E Table134: Insufficient pedagogical support is perceived to be a
barrier to ICT integration into teacher practice by Location, Age, Gender, Subject
Area and Teaching Experience. .......................................................... 281
Appendix E Table135: Classroom layout perceived to be a barrier to ICT
integration into teacher practice by Location, Age, Gender, Subject Area and
Teaching Experience........................................................................... 282
Appendix E Table136: Teacher resistance is perceived to be a barrier to ICT
integration into teacher practice by Location, Age, Gender, Subject Area and
Teaching Experience........................................................................... 282
Appendix E Table137: Lack of teacher interest is perceived to be a barrier to ICT
integration into teacher practice by Location, Age, Gender, Subject Area and
Teaching Experience........................................................................... 283
Appendix E Table138: No or unclear benefits is perceived to be a barrier to ICT
integration into teacher practice by Location, Age, Gender, Subject Area and
Teaching Experience........................................................................... 283
Appendix E Table139: Not regarded as a goal of the college and therefore is
perceived to be a barrier to ICT integration into teacher practice by Location,
Age, Gender, Subject Area and Teaching Experience. ........................ 284
Appendix E Table140: Participation in CPD courses in advanced internet use by
Location, Age, Gender, Subject Area and Teaching Experience. ......... 284
Appendix E Table141: Participation in CPD courses in ICT pedagogy by Location,
Age, Gender, Subject Area and Teaching Experience. ........................ 285
Appendix E Table142: Participation in on-line professional communities by
Location, Age, Gender, Subject Area and Teaching Experience .......... 285
Appendix E Table143: Frequency table showing number of participants who
attended CPD courses in equipment specific training by location. ..... 286
Appendix E Table144: Frequency table showing number of participants who
perceived insufficient bandwidth to be a barrier to the integration of ICT into
teacher practice by location. .............................................................. 287
Appendix E Table145: Frequency table showing number of participants who
perceived insufficient number of whiteboards to be a barrier to the integration
of ICT into teacher practice by location. ............................................. 288
Appendix E Table146: Frequency table showing number of participants who
perceived insufficient number of portable devices to be a barrier to the
integration of ICT into teacher practice by location. .......................... 288
24
Appendix E Table147: Frequency table showing number of participants who
regarded insufficient number of portable devices to be a barrier to the
integration of ICT into teacher practice by gender. ............................ 289
Appendix E Table148: Frequency table showing number of participants who
regarded lack of adequate content to be a barrier to the integration of ICT into
teacher practice by gender. ............................................................... 289
Appendix E Table149: Frequency table showing number of participants who
engage with ICT to collect resources to be used in class teaching by age.290
Appendix E Table150: Frequency table showing number of participants who
collect resources from the college network or Database in classroom delivery
and teaching by location. ................................................................... 290
Appendix E Table151: Frequency table showing number of participants who have
confidence in creating or maintaining a blog or website by gender. .. 291
Appendix E Table152: Frequency table showing number of participants who have
confidence in participating in social network by gender. ................... 291
Appendix E Table153: Frequency table showing number of participants who have
confidence in downloading software by gender. ................................ 292
Appendix E Table154: Frequency table showing number of participants who have
confidence in preparing materials for interactive whiteboards by location. 292
Appendix E Table155: Frequency table showing number of participants who have
confidence in programming by gender............................................... 293
List of Figures: Figure 2.1: Conditions for Technology Innovations (Zhao et al., 2002). 54
Figure 3.1: Selection and validation of phase 1 data. ........................... 83
Figure 3.2: Selection and validation of phase 2 data. ........................... 85
Figure 3.3: Selection of phase 1 sample ............................................... 90
Figure 5. 1: Barriers and Themes from Interview Data ....................... 109
Figure 6. 1: Barriers and Themes from Interview Data ....................... 152

25
List of Abbreviations. ANOVA Analysis of Variance Pg. 81
APPS Applications Pg. 28
BECTA British Educational Communications and Technology Pg. 37
B.Ed Bachelor of Education Pg. 87
BERA British Education Research Association Pg.100
BSA British Sociological Association Pg.101
CPD Continued Professional Development Pg. 6
DfBIS Department for Business Innovation and Skills Pg. 33
DfE Department for Education Pg. 56
DfES Department for Education and Skills Pg. 21
ETFR Education and Training Foundation Report Pg. 99
FE Further Education Pg. 2
Hons Honours Pg. 87
ICT Information Communication Technology Pg. 9
ILT Interactive Learning Technology Pg.136
IT Information Technology Pg. 49
IWB Interactive White Board Pg. 21
MIM Multi-Media Instructional Materials Pg. 37
NEA National Education Association Pg. 49
PCK Pedagogical Content Knowledge Pg. 63
PhD Doctorate of Philosophy Pg. 87
SERA Scottish Education Research Association Pg.101
SPSS Statistical Package for Social Sciences Pg. 78
TPACK Technological, Pedagogical, Content Knowledge Pg. 38
TQFE Teaching Qualification in Further Education Pg. 32
VLE Virtual Learning Environment Pg. 50
Voc. Ed. Vocational Education Pg. 33
VET Vocational Education and Training Pg. 32

26
27
Statement of Copyright The copyright of this thesis rests with the author. No quotation from it should be published
without the author's prior written consent and information derived from it should be
acknowledged.
Acknowledgements
There are so many people who have encouraged and helped me during this Doctorate that I
cannot really begin to list them all. Thank you to everyone who has encouraged and supported
me throughout the past fifteen years when a chance conversation with a golfing friend piqued
my interest and imagination and I began on a journey that has culminated in this thesis. I would
like to thank my supervisor, Julie Rattray who has provided constant encouragement and
support and tempered my ramblings and journalistic meanderings when necessary. Julie has
from day one been a source of inspiration and support taking over my supervision when I was
on the verge of quitting and I will be forever grateful. To the college principals and especially
the teachers that came forward and allowed me an insight into their professional lives, I will be
eternally grateful. I hope that this thesis does you justice and may even in some small way
help to provide a voice for you. To my fellow students at the University of Durham who started
with me on this road at a summer school in July 2013, I hope you have persevered and
successfully complete your own work. Thank you, all of you.

28
Dedication To my family and friends, you have always been a source of support and encouragement and
believed that this day would be possible, my inadequate words cannot express my true feelings
and eternal thanks.

29
Chapter 1 - Background, rationale & context of the study.
1.1 Background.
This thesis explores teacher’s beliefs concerning the integration and use of technology in
Further & Vocational Education Colleges in the delivery of courses across a range of levels
and disciplines. There has been a high level of investment in the provision of technology across
all sectors of education. This investment has been with the expectation, from government and
policymakers, that teachers will have more time and be able to focus on other aspects of their
role, not just on teaching (Department for Business Innovation and Skills ((DfBIS)), 2014), and
that student engagement and consequently attainment will improve as a result (Chandra &
Lloyd, 2008). There remains little in the way of conclusive evidence of improved learning
outcomes or higher attainment by students, and a fundamental debate continues to rage
between sceptics and advocates as to whether technology supports traditional delivery
techniques or provides a radically different vision of pedagogy (Livingston, 2012).
Technology integration within Further Education teaching and learning remains sporadic and
inconsistent. Classroom practices remain comparatively unchanged from what has been
termed ‘chalk and talk’ approaches despite the introduction of technology. There has been little
in the way of the fundamental change that was envisaged by policymakers. There have been
“thousands” of methods and innovations presented that have claimed success in improving
education unfortunately, they rarely lead to strategic changes nor are they adopted by teachers
(Hattie & Yates, 2013), it appears there is a “reshuffling [of] the pack of cards, but little evidence
of anybody trying a new game” (Goodson & Mangan, 1995, p.626).
Further & Vocational education is primarily associated with preparing students either to
continue education at a higher level or to develop the skills an individual will require for work
and working life. Preparing students achieved by identifying the knowledge required and
providing an environment where learners can use and apply that knowledge to develop the
skills required in the workplace (Billett, 2011; OECD, 2012; Spöttl, 2013).

30
The challenges faced by the country from global competition and emerging economies has
been identified by the U.K. Government as a potential threat that could impact on the economic
wellbeing of the country and success in meeting these challenges “depends on the people in
further education…in teaching and learning and in using technology effectively in teaching and
learning” DfBIS (2014, p.3). Most of the teachers in Further & Vocational Education have
worked in professions and industry before becoming teachers. It is because of the time spent
working, before becoming teachers, that often means they have different characteristics and
profiles to teachers and lecturers in other sectors of education. The average age of teachers
in the further education is over 46 years this is seven years older than secondary schools in
England and Wales and six years older than in U.K. Universities (Cambridge Assessment,
2016; Frontier Economics, 2017; Higher Education Statistics Agency, 2015).
My interest in this research area materialised while was working abroad in the Middle East,
first as a teacher in a Government college and then as a Deputy Principal. The government
had similar beliefs to those expressed by the U.K. government, that technology is a powerful
medium that can transform teaching and learning (DfBIS, 2014; Department for Education and
Skills ((DfES)), 2003). A result of this belief was the procurement of technology in all education
sectors. This investment was primarily based on the belief that the integration would enable
students and learners to acquire the skills necessary to become integrated members of the
21st Century workplace (Anderson, 2008; Valtonen et al., 2015) and the country to become
less reliant on immigrant workers. Nevertheless, although governments have invested in the
procurement of the technology the wholesale technological and pedagogical revolution in
education has not transpired (Ertmer & Ottenbreit-Leftwich, 2010; Howard, Chan, Mozejko, &
Caputi, 2015; Plesch, Kaendler, Rummel, Wiedmann, & Spada, 2013).
On many occasions, while working abroad, questions arose as to why teachers were not using
technology, primarily interactive whiteboards (IWB), to make the lessons more engaging for
the students. The rather simplistic response was to ask in return who had taught the teachers
how to teach using the technology other than to convert existing materials to produce
Powerpoint presentations and use the IWB as a projector screen. The assumption of the
managers and perhaps policymakers reflected the viewpoint that all that was needed by
teachers to use technology effectively in the classroom and change the entire classroom into
a student-centred environment where students are fully engaged and improve attainment was
“some technical skills and a good attitude” (Zhao, Pugh, Sheldon, & Byers, 2002). I needed to
understand what the underlying reasons were that led teachers only to use the technology
provided in such a rudimentary way.

31
Since the 1990's research has been conducted regarding the integration of technology into
education and teacher attitudes, beliefs and perceptions concerning this integration. Other
research has addressed and examined whether teacher autobiographies are in any way linked
to their use of technology in terms of teaching practice. This research has been from different
countries, Cyprus (Mama & Hennessy, 2013), Switzerland (Petko, 2012), Australia (Prestridge,
2012), Taiwan (Liu, 2011) and the U.S.A. (Ertmer & Ottenbreit-Leftwich, 2010). Much of this
research focused on the integration and utilization of technology in a variety of school systems
(Blackwell, Lauricella, Wartella, Robb, & Schomburg, 2013; Petko, Egger, Cantieni, & Wespi,
2015; Scherer, Siddiq, & Teo, 2015).
The focus of the study was the Further & Vocational Education sector as there has been little
in the way of research conducted in this sector. The Skills Commission recommended that
Vocational Education pedagogies should become a research priority (Skills Commission,
2010). Reflecting on personal experiences and reviewing the literature in the area, the rationale
for this study was to gain a better understanding of why the technology that is available in
Further & Vocational Education institutes is not utilized more extensively and effectively by
teachers. I wanted to explore the extent to which this phenomenon existed in similar institutes
in different locations in England. I sought to uncover the educational and professional profiles
of the teachers employed in the institutes and conduct self-administered surveys to provide
background information and data related to teacher engagement with technology from their
perspective and to build a picture of the participants in the study.
Additionally, I wanted to examine the belief and attitudes of the teachers and whether these
beliefs and attitudes manifested themselves as barriers to the integration of technology into
their teaching practice. I wanted to understand the nature of any barriers from the teachers’
perspective, to identify how these may be overcome and therefore facilitate a better integration
of technology into the classroom. The research questions developed from an examination of
these themes.
32
1.2 Research Questions.
There is no requirement for teachers engaged in Further/Vocational Education to possess any
formal teaching qualification unlike other sectors of the education system. This is either
because they were teaching prior to 2007 or have been engaged after this date on the basis
that they achieve a teaching qualification after engagement. I wanted to investigate the self-
efficacy of teachers in using and integrating technology and after a review of the literature
developed research question.
1. How do teachers in Further/Vocational Education use and integrate technology into
their teaching practice?
The main area of research was to investigate teacher’s beliefs and attitudes in their teaching
practice towards the use and integration of technology in Further and Vocational education
colleges. The research that has identified the existence of these barriers has largely been
conducted in schools and as a result a gap exists in the types and barriers that exist in the
Further/Vocational Education sector. The investigation of the existence of barriers to the
integration of technology led to the second research question.
2. What barriers and facilitators exist to inhibit or support the use of technology in Further/
Vocational Education?
The final research question presented was to examine the beliefs of the teachers concerning
the integration of technology into their teaching practice. The perceptions of teachers toward
technology and the perceptions of others to teachers was examined. Research question three
examined the area of teacher beliefs and attitudes about technology integration.
3. What are teacher's beliefs concerning the integration and contribution technology can
make to their teaching in Further/Vocational Education?
33
1.3 Scope of the Study.
The study purpose was to investigate the beliefs of teachers concerning the integration and
use of technology in their teaching practice and was conducted across nine Post-Compulsory
Further Education Colleges in England in three phases; the first was an online questionnaire
distributed through the college intranet networks and yielded 229 responses. The second
phase was another online questionnaire, distributed directly to teachers who had confirmed
that they would be prepared to continue with the study. Thirty-one surveys were sent, resulting
in 21 completed surveys. Eleven one-to-one interviews completed the third phase of the study.
The profile of the participants was they were all teachers in the colleges delivering courses
ranging from Level 2 to Post-Graduate Diplomas. Participants held Academic qualifications
ranging from Level 4 through to PhD with varying levels of teaching and industry experience.
The connection between the participants was that they all worked in similar types of post-
compulsory colleges, they deliver similar types and levels of courses and before teaching had
industry and employment experience in the industry/professional area in which they teach.
1.4 Significance of Study.
The study specifically investigated the beliefs and attitudes of the teachers from the
participating Further & Vocational Education Colleges regarding the usefulness and place of
technology in their teaching practice. There have been numerous studies conducted in schools
and Higher Education, but little in the way of research in the post-compulsory Further
Education sector. I believe that the benefits concerning the use of technology in education may
have been overstated. Successive governments have promoted the use of technology in
education as a means of achieving better engagement and attainment by students; this study
investigated the reality of the situation from the perspective of the practitioners who face the
reality of teaching every day. I hope that the study results might influence future direction and
policy involving the integration of technology in Further & Vocational teaching. The study
results will highlight the beliefs, perceptions and barriers that are constructed, held or identified
by teachers in this area. I see this study as potentially informing management within colleges
about the skills that teachers have and identifying any deficiencies in skills that need to be
overcome to enable technology to be integrated more effectively into teaching practices. The
study will also identify how technology is used by teachers in the colleges and what they
perceive technology integration to mean. It will provide data related to the concerns of teachers
that manifest themselves in resistance and barriers to the integration of technology. The study
may inform teacher training course developers as to the skills that need to be acquired and
become embedded during teacher training.
34
1.5 Structure of this Thesis.
In Chapter 2 of the thesis, the Literature Review begins with establishing the context of the
study, positioning Further and Vocational Education in the broader Education sector. An
examination of the context of post-compulsory education and the perceptions of stakeholders
at all levels will be presented. The characteristics of teachers within the sector will be explored
to determine any unique or particular traits taking into account the industry or professional skills
that the teachers possess. The final sub-section of the first part of the review will investigate
the management and external decisions that can impact and influence further and vocational
education.
The perception of technology in the education sector will be investigated, and the concept of
barriers to the integration of technology examined in part 2 of the literature review, two well-
established models, will act as a reference for the barriers, first and second-order barriers
identified by Ertmer (1999) and the conditions for classroom innovations set out by Zhao, et al.
(2002). There will then follow a review of the barriers that have been identified and accepted
as relevant to the integration of technology in teacher’s classroom practices. These barriers
will be mapped against the two models identified earlier.
The final section will identify the conditions that have been proposed for technology to be
successfully integrated into teaching and learning, examining briefly technology adoption
models reviewing established and accepted models outlining the conditions necessary for
technology integration to be successful in education.
The methodology and design Chapter 3 is where I detail the research methodology selected,
outline and discuss research philosophy and the theoretical underpinning of the study. A
justification for deciding on an interpretive approach for the study is set out, and the reasoning
for discarding alternative approaches will be stated. The design and methods used for data
collection and analysis will be outlined, the chosen methods having been approved by the
university ethics committee (Appendix A), and the rationale for the selection of the preferred
methods presented. There is a clear statement of the sample selection process and how the
participants became part of the study. The final section of the chapter will outline the ethical
considerations adhered to throughout the study.
The results presented in chapter 4 relate to the data collected from the Phase One self-
administered online questionnaire. This questionnaire examined perceived self-efficacy
regarding the use of technology in preparation of lessons and classroom practices. The second
35
section examined potential barriers to the integration of technology identified by teachers in
the study and evident in previous research. The final section identified the Continued
Professional Development (CPD) offered or undertaken by teachers in the study in the use
and integration of technology.
The results detailed in Chapter 4 are a summary of the statistically significant results only, and
provide the background data for the study as well as addressing some of the issues presented
in the research questions that will be expanded on and set out in greater detail in Chapter 5.
Chapter 5 is where I explore the results of the interviews and how they address the core aim
of the study regarding technology integration and teacher beliefs and attitudes. During this
chapter, thematic analysis provides rich detail and addresses the research questions while
cross-referencing back to the Literature Review to ensure quality, rigour and the
trustworthiness for the study. The results address each research question individually as far
as possible, but the focus of these results will be in answering research questions as well as
building on and supporting the results data presented in Chapter 4.
In Chapter 6, sets out and discuss the main findings of the study that have been presented
earlier in Chapter 4 and Chapter 5. The discussion section of this chapter will address the
research questions in turn and present the key findings. The limitation section will discuss the
constraints of the study and what could have been approached differently and suggest how
future research could address these. The chapter concludes with recommendations in the
areas of management policy within the colleges to better meet the needs of teachers and
thereby achieve the desires of the policymakers and government while considering
implications for teachers and practitioners.

36

37
Chapter 2 - Literature Review.
2.1 Introduction.
This research focused primarily on the barriers and enablers that are perceived to exist by
teachers in the Further & Vocational Education sector concerning the integration and use of
technology in the context of their teaching and learning. The context of the study defines
technology as any device, platform or programme used or integrated into the teaching practice
of tutors and teachers. Technology could be interactive whiteboards (IWB), smart boards,
computers’ either desktops or portable devices, smartphones or other portable devices with
internet connectivity, computer programmes or applications (apps), this list is not prescriptive
and could include other devices or applications. In this chapter, the literature that has informed
the study will be examined.
The first section of the chapter outlines the broader position and context of Further & Vocational
Education. Sub-sections will establish the context in which Further and Vocational Education
operates and the perceptions of the sector from several stakeholders. The types of teaching
and delivery used within Further and Vocational Education will be explored, the section will
conclude with a review of the management practices and external policies that impact on the
sector and the potential effect they have on teachers.
The second section of the review will examine and identify the literature that forms the main
body of the study, exploring the barriers and enablers that are perceived by teachers to exist
regarding the integration of technology in their teaching practice from their standpoint. The
section will begin with setting out the ideas and concepts around barriers and enablers. Two
models will be introduced and compared that have contributed in this area of research, First
and Second-Order Barriers first identified by Ertmer (1999) and Conditions for Classroom
Technology Innovations proposed by Zhao et al. (2002).
The third section will consider those barriers and enablers that have already been identified by
researchers as impacting on the integration and use of technology in classroom practices. The
final section will introduce the models relating to integration and adoption of technology
incorporating the work of Rogers (2003), Shulman (1987) and Mishra and Koehler (2006)
outlining the considerations and conditions that are necessary for technology to be adopted
and integrated successfully.
38
2.2 Context of Vocational Education.
2.2.1 Introduction.
Many governments express similar beliefs to the U.K. Government of 2014 that technology
offers the potential to transform teaching and learning (DfBIS, 2014; DfES, 2003). There has
been significant investment to support the provision and integration of technology into
education (De Witte & Rogge, 2014; Nagel, 2014; Vaughan, 2013), based mainly on the
expectation that technology integration into teaching and learning will enable students to
engage more effectively with the curriculum and acquire the skills necessary to become fully
integrated members of the 21st Century workplace and broader society (Anderson, 2008;
Valtonen et al., 2015). Despite this investment, the wholesale technological and pedagogical
revolution in the education sector, that was envisaged by policymakers, has not transpired and
technology integration remains inconsistent and elusive (Ertmer & Ottenbreit-Leftwich, 2010;
Howard et al., 2015; Plesch et al., 2013).
Much of the research conducted thus far has investigated the integration of technology in the
school sector (Ertmer & Ottenbreit-Leftwich, 2013; Prestridge, 2012; Sang, Valcke, van Braak,
Tondeur, & Zhu, 2011) and Higher Education (Al-Qirim, 2011; Hu & McGrath, 2011;
Venkatesh, Croteau, & Rabah, 2014). There has been limited research in the post-compulsory
sector, as identified by the Skills Commission, who recommended that “Vocational and applied
pedagogies should become a research priority” (Skills Commission, 2010, p.14).
In the first part of the Literature Review, the focus will be on three key issues, the context and
perceptions that exist regarding Post-compulsory education, the teaching and delivery
methods used in the sector and the differences in teacher characteristics within the sector. In
addition, an examination of the changes that have taken place since 2000 that have impacted
the sector and the teachers employed in Post-Compulsory Education will be carried out.

39
2.2.2 Context, and Perceptions of Post-Compulsory Education.
Further and Vocational Education in England forms part of a more comprehensive learning
and skills sector, alongside workplace education, prison education, and other types of non-
school, non-university education and training. Post-compulsory education in Further Education
Colleges (FEC) is distinct from the education offered in universities; it may be at any level from
basic skills training to higher vocational education such as City and Guilds or Foundation
Degrees. Further Education in the United Kingdom usually includes education for people over
16, excluding universities. Colleges in England that are part of the F.E. sector include general
F.E. (GFE) and tertiary colleges, sixth form colleges, specialist colleges (mainly colleges of
agriculture and horticulture and colleges of drama and dance) and adult education institutes
(Department for Education ((DfE)), 2012).
There is a diverse choice of courses available in Post-Compulsory Education with thousands
of available courses varying widely in length, level, degree of difficulty and specialisation.
These can range from courses taken as pastimes, personal interests or hobbies, basic skills
courses, Science, Technology, English and Maths (STEM) courses that are deemed as
necessary by government. Academic subjects at ‘O’ and ‘A’ Level and subject-specific
Vocational courses studied at many levels up to and including foundation degrees and Post-
Graduate courses in conjunction with universities. There is a wide diversity in both the kind of
courses delivered and type of learners participating in Post-Compulsory Education in the U.K.
with differing purposes for study and varying levels of motivation to undertake study.
Despite this Post-Compulsory Education continues to be primarily perceived as developing the
skills an individual requires for work in a career or profession, identifying the knowledge needed
and providing an environment where learners can use and apply the knowledge to develop
life-skills as well as the skills necessary for work (Billett, 2011; OECD, 2012; Spöttl, 2013).
However, some of the courses offered have uncertain value in the labour market and often low
prospects for progression on to higher levels of education (Hupkau, McNally, Ruiz-Valenzuela,
& Ventura, 2016).
Changes within the sector during the last twenty years, the launch of the Regulated
Qualifications Framework (R.Q.F.) in January 2018 as the latest manifestation of Qualification
Frameworks dating back to 2004, set out equivalency between qualifications within different
sectors of the education system. There are clearly defined pathways and mapping between
qualifications and levels of study across Vocational and Academic courses to Level 8 or
Doctoral Level in England and Level 12 in Scotland. The development of the framework
demonstrates that it is possible within Vocational Education to achieve high-level qualifications
40
that could address the perception that Vocational Education qualifications are not of as much
value as academic qualifications. Nevertheless, despite this opportunity, many parents and
potential students have taken the view that Higher Education qualifications provide a more
advantageous position within the labour market (Tomlinson, 2008; Atkins & Flint, 2015).
In the U.K., in Feb 2019, there were 303 Further Education Colleges (FEC) showing a decline
of 99 from 402 in 2011, this decrease was across England, Wales and Scotland. The number
of students participating in Further Education (FE) programmes has correspondingly dropped
by 1.2 million from 4.8 million in 2011/12 to 3.6 million in 2016/17. During this period
participation in Higher Education (HE) had increased with the latest figures showing an
increase of 100,000 between 2015/16 and 2016/17 to 2.5 million (Association of Colleges,
2019; Department for Education ((DfE)), 2018). This decline in numbers could reflect the
choices made by students and parents based on the perceptions that they hold about Post-
Compulsory Education in Further Education Colleges.
Coupled with the perceptions of parents and students regarding the worth of Vocational
Qualifications, there persists a belief from other stakeholders that Post-Compulsory Education
has failed to address the skills, needs and expectations of business and industry (DfBIS, 2014).
The European Center for the Development of Vocational Training (Cedefop) reported that
while there was “evidence of closer collaboration between the worlds of education and work”
there was still an identifiable skills shortage and gap, one possible conclusion drawn, other
than genuine skills shortage, was a “lack of international recognition of qualifications”
(Cedefop, 2015, p.8) which could potentially limit social mobility and opportunity.
Despite the negative perceptions expressed, Post-Compulsory Education has the potential to
make a valuable contribution to the economic wellbeing of the country, society and individual
growth and development. For these reasons, it should be considered an essential and
worthwhile sector of the education system (Billett, 2014). Billett (2014) goes on to warn this will
only be achieved when Vocational Education has demonstrated it can meet the expectations
of all stakeholders, only then is it likely to be accepted as an essential contributor to a nations'
education system. Negative perceptions will be a challenge to overcome because, as Wolf
(2011) states, an estimated 350,000 16 – 19-year-old students are getting little or no benefit
from post-compulsory education. In most developed countries, some two-thirds of the
workforce have learned a substantial part of their job-related skills and knowledge through non-
academic technical vocational education (UNESCO-UNEVOC, 2007). Given that Vocational
Education has the potential to impact directly and contribute to the overall economic wellbeing
and success of the country it is remarkable that its practitioners struggle for the level of social
recognition that would establish it as a well-regarded profession (Grollmann, 2008).
41
The adverse perception of Further and Post-compulsory Education is not universal in all
countries and in the German-speaking world it does enjoy a higher status, whereas in other
countries where it has an equally strong tradition and is a long-established sector of the
education system, it continues to suffer from low status and negative perceptions (Billett, 2011,
2014; Feather, 2017; Wolf, 2011). Within the U.K. because of these negative perceptions
Further and Vocational Education still seems to lack identity (Simmons & Lea, 2013), and be
regarded as the ‘Cinderella’ sector of the education system (Feather, 2010; Simmons, 2008).
The U.K. Government has identified the challenges faced by the country from global
competition and emerging economies. Successive governments believe that success in
meeting these challenges “depends on the people in further education…in teaching and
learning and in using technology effectively in teaching and learning.” (DfBIS, 2014, p.3). In
more recent times and indeed since the late 1990’s successive U.K. governments have started
to recognise the potential of the sector to address some of the broader challenges that are
faced by the country going forward. The recognition that Post-Compulsory Education can
contribute to the economy, through training and developing the future workforce, has led to
more significant and increasing scrutiny. This scrutiny, coupled with higher demands and
influence from business and industry, has increased the number of external interventions in
the Further and Vocational Education sector (Billett, 2011; Hyland & Winch, 2007; Lucas,
2013).
Post-Compulsory education falls under the umbrella of Office for Standards in Education
(Ofsted), since it became the dominant partner in a merger with the Adult Learning Inspectorate
(ALI) in 2002 (Burnell, 2017). This merger introduced changes aimed at raising standards in
the sector but has also led to changes in practices with the introduction of a regime of
inspection comparable to the one operating in schools. Ofsted has the authority to influence
college operations in many areas through direct and indirect pressure and influence. Not all
these interventions are welcomed and are viewed by some as “unwarranted interference and
external mandation by external bodies seeking to control and stipulate the provisions,
processes and outcomes in unhelpful ways” (Billett, 2014, p.2).
Interventions have included determining Continued Professional Development (CPD) of staff
and the introduction of Observed Teaching and Learning (OTL) and have had far-reaching
implications for the sector at every level, “making an impact on careers, classroom practice
and, for some, a decision on whether to remain in the sector” (Burnell, 2017, p.228). The policy
changes were made to raise standards in the Further Education sector and have established
almost exclusively the use of the Ofsted four-point graded scale to measure performance.
Teachers are encouraged to adopt classroom practices, including using prescribed resources,

42
that comply with the criteria determined to be ‘good’ or ‘outstanding’ on the Ofsted grading
scale (Gleeson, Hughes, O’ Leary, & Smith, 2015). In this way, levers are in place and used
by policymakers to exert pressure on college management and as a result on teachers to
comply with their demands through this ‘downward pressure of audit, funding and managerial
reform’ (Gleeson 2014, p.26).
Historically teaching in further education colleges was based around the practice of learning
from skilled and knowledgeable practitioners with the quality of delivery assessed primarily on
subject expertise rather than education practices (Harkin, 2005). Many of the teachers and
tutors having worked in professions and trades before becoming teachers have experience of
working with young people and adults in a variety of work environments. The average age of
entry into the sector for a teacher is 37 years (Gleeson, 2014). The reliance on professional
expertise and subject knowledge maintained the perceptions among teachers that they were
primarily skilled practitioners or professionals who taught in whatever way they believed to be
consistent with their subject while being supported by mentors, colleagues and line-managers
(Lucas & Nasta, 2010). Recruitment into post-compulsory teaching is often through the
unofficial apprenticeship of part-time work provided teachers have the specific skills needed in
the labour market. Progression tends to be less linear and more complex than entry into
schools and H.E. It is based primarily on potential teachers possessing the required skills and
workplace experience, rather than a more academic route from school to university and then
teaching, because of this the characteristics of teachers can be somewhat different from other
sectors (Gleeson, 2014; Lucas & Nasta, 2010). These teacher characteristics are not unique
to Post-Compulsory Education, the government are engaged at present in recruitment drives
to engage professionals from business sectors into school teaching, but they do operate in a
different context from other sectors in the education system.
2.2.3 Further and Vocational Education Teaching and Delivery.
Until the early part of the 21st century, there was little in the way of uniform standards and
qualification requirements for teachers employed in the Further and Vocational Education
sector (European Agency for Special Needs and Inclusive Education, 2014). The primary
focus, prior to 2007, had been on industry experience with no statutory requirement for post-
compulsory teachers to have a formal teaching qualification in the U.K. Teachers in Further
Education usually became teachers after many years gaining experience in other occupations,
this was due in part to the predominantly vocational nature of further education (Lucas & Nasta,
2010; Orr & Simmons, 2010). “This contrast[ed] with other European countries and with
schools, where staff have long been required to have an initial teaching qualification” (Avis,

43
Canning, Fisher, Morgan-Klein, & Simmons, 2012, p.15; Skills Commission, 2010; Thompson
& Robinson, 2008).
One of the consequences of this is that teachers in the sector suffered from a perceived lack
of status within the profession, reflected in lower salaries and less attractive employment
conditions when compared to teachers in schools and universities (Education International,
2009; Grollmann, 2008; Skills Commission, 2010). The changes in standards in 2007 have
meant that Further and Vocational Education teachers are now required to be doubly qualified,
qualified in their field and qualified to teach this reflects many of the standards and
requirements that already existed in other countries (Avis et al., 2012; Grollmann, 2008).
Nevertheless, as Grollmann opines “it is remarkable that its practitioners so lack the level of
social recognition needed to establish it as a well-regarded profession” (Grollmann, 2008, p.
535).
Recruitment of suitably qualified personnel has proven difficult. The U.K. government
recognise that F.E. is not perceived “as a sufficiently attractive career option”, with the sector
failing to attract the “best young graduates”. They also recognise that some government
policies make it harder for colleges to recruit suitable individuals with an additional barrier to
recruitment being the time it can take to achieve a Teaching Qualification in Further Education
(TQFE) (DfBIS, 2014; Harris, Simons, & Maher, 2009; Noel, 2006).
The changes implemented in Post-Compulsory Education at the behest of Government,
inspectorate and management has meant that the role of teachers within Vocational Education
is changing. The focus is no longer merely on teaching; there has been the addition of new
roles such as supervisor, mentor, counsellor and adult trainer (Hughes & Attwell, 2010; Kats,
van Lakerveld, & Smit, 2010; Sirk, Liivik, & Loogma, 2016). The perception from the
government is that technology integration will free up the teacher's time for these other
activities (DfBIS, 2014).
It is important to recognise that the characteristics of Vocational Education teachers differ from
other sectors in various respects, they are generally older than schoolteachers when they enter
initial teacher training (Lucas & Nasta, 2010). Gleeson (2014) determined the average age on
entry into the sector as 37 years. The average age of teachers in the post-compulsory sector
is over 46 years, with almost 40% of teaching staff aged 50 years or older (Frontier Economics,
2017). The average age of teachers is seven years older than secondary school teachers in
England (Cambridge Assessment, 2016) and six years older than academic staff in U.K.
universities (Higher Education Statistics Agency, 2015). Furthermore, it has been suggested
44
that Further Education teachers are slow to adopt new practices and ideas with teaching
remaining didactic with little in the way of professional development (Orr & Simmons, 2010).
Teachers in the post-compulsory sector are not required to hold a teaching qualification on
engagement, provided they are prepared to work towards achieving one, usually within two
years. While working towards this qualification, they continue to teach and develop a teaching
style dependent primarily on the support from colleagues in the workplace and their prior
experience in education as students (Lucas & Nasta, 2010). The context and demands of
Further Education suggest there is little recognition of the dual identity of teachers undergoing
teacher training, as a student and employee, they are often unable to benefit from reduced
teaching load or off-the-job training due to the demands of the role (Lucas & Nasta, 2010; Orr
& Simmons, 2010). Teaching styles develop through experience over many years; this
experience and industry background may reflect personal views or beliefs of the purpose of
education and how subjects are delivered.
As stated previously, Further Education teachers can be slow to adopt new ideas and practices
(Orr & Simmons, 2010). However, there have been significant, and numerous changes
introduced to the sector since the late 1990’s with over thirty new initiatives in the area of
technology integration in education alone (Watson, 2001). This avalanche of initiatives
continues but, as Somekh et al. (2004) identify, there is little evidence of evaluation or analysis
of the previous initiative having taken place before the following one is implemented, often
resulting in initiative overload (Hattie & Yates, 2013).
Change involves confronting the unknown, losing the familiar and divorcing the status quo, it
also represents a significant disruption to established patterns of behaviour, work methods,
procedures and job skills which increases ambiguity and uncertainty. Cuban (2011) illustrated
the difficulties when he stated that policymakers determine change based on “criteria of
organizational effectiveness, efficiency, and equity. Teachers accept, modify, and reject
innovations on similar criteria, but with the focus on students and classrooms.” It is not the
change itself that is the problem, but often it is introduced with a lack of understanding,
resources, time and, as is often the perception, from above, it is implemented rapidly and not
thought through thoroughly leaving teachers to cope with the consequences (Dinham & Scott,
2000; Harris et al., 2009).

45
2.2.4 Management and External Policies.
Not all the changes affecting Further Education are directly as a result of government policy.
College managers can also introduce changes that could shape and change the operations
and culture of a college that are independent of government policy. Staff faced with this
situation try to reconcile the demands for change from management and policymakers with the
internal beliefs and values that they hold (Edward, Coffield, Steer, & Gregson, 2007).
There is a growing practice of government regulation and reform (Hyland & Winch, 2007;
Lucas, 2013), and a fundamental shift in management practices in colleges, as part of the
marketplace reforms introduced in the Public Sector, since the 1980’s. These reforms have
resulted in the adoption of "Taylorist" and corporate practices within Further Education to
"cheapen labour" the result of which is fewer staff, working harder and longer and teaching
more students (Feather, 2017; Mather, Worrall, & Seifert, 2007).
The growth of directive management and audit cultures, coupled with competitive funding,
have had profound effects on the working lives of teachers in Further Education. The
proliferation of performance criteria and target setting has led to teachers questioning what
constitutes a ‘good’ teacher under the new performance management regimes driving the
sector (Plowright & Barr, 2012; Shain & Gleeson, 1999). The regime changes have led to a
language of competitiveness not only between colleges, but also between college departments
(Avis, 2007; Garbett, Orrock, & Smith, 2013).
Performance-based management systems and a culture of internal and external auditing has
added to teacher’s workload with constant demands for information, target grades, progress
grades and attendance information, which demand attention and are considered an everyday
function of the role of teachers (Bailey & Colley, 2015). Increased workloads resulting from
these trends find teachers working consistently over hours, with work spilling over into personal
time including holidays (Avis, Bathmaker, & Parsons, 2001; Jephcote, Salisbury, & Rees,
2008).
Studies highlight a plethora of good ideas and educational innovations that have produced
very little in the way of tangible improvements (Carpenter, 2000; Kozol, 2005). There are
significant issues related not to resistance to accept change, but more the uncoordinated
haphazard and uncritical acceptance of any innovation without scrutiny and evaluation (Fullan
& Stiegelbauer, 1991). Hattie and Yates (2013) conclude there are “thousands” of methods
and innovations presented that have claimed success in improving education; unfortunately,
46
they rarely lead to changes, and as a result, the classroom has remained unchanged for 200
years (Tyack & Cuban, 1997).
2.2.5 Section Conclusions.
The literature reviewed in this section outlined the placement of Further and Vocational
Education and the context in which it operates from, whether it is in recognised colleges of
Further Education or specialist subject colleges in areas such as agriculture and the performing
arts, prisons and workplace learning. There is a bewildering variety of courses in the level and
duration of subjects delivered ranging from formal recognised courses leading to recognised
qualifications to informal qualification in subjects that are for hobbies or personal interest, but
primarily FE is to enable learners to progress to higher level of education or prepare them for
the workplace through the acquisition of employment-related skills.
Although it is possible to achieve high-level qualifications through Vocational Education, most
students and parents believe that the route to better employment prospects lies through
Academic courses and university, this has resulted in a decline in the number of colleges and
FE students and an increase in university student numbers. The perception that the
qualifications gained through the vocational education pathway are not of as much worth as
academic qualification belies the fact that further and vocational education can contribute
directly to the economic wellbeing of the country by training the workforce of the future.
Recognising this fact successive governments have introduced changes, in an attempt to raise
the standard of teaching in the sector, resulting in a regime of inspection and audit overseen
by Ofsted, this regime has impacted directly on classroom practices and teachers alike. The
adoption of corporate practices within Further Education has had the effect of “cheapen[ing]
labour“, resulting in fewer staff working harder and longer and teaching more students
(Feather, 2017; Mather et al., 2007). These changes have had a profound effect on the working
lives of teachers in Further Education.
The proliferation of performance criteria and target setting has led to teachers questioning what
constitutes a ‘good’ teacher under the new performance management regimes driving the
sector (Plowright & Barr, 2012; Shain & Gleeson, 1999). Increased teacher’s workload with
constant demands for information is considered a normal part of the role of teachers (Bailey &
Colley, 2015).
Not all these changes have been welcomed or understood with teacher recruitment often
based on teachers having the necessary workplace skills to train the future workforce.
47
Teaching is considered to be learning from skilled and knowledgeable practitioners with the
quality of delivery assessed primarily on subject expertise rather than education practices. As
teaching is for many teachers in the sector a second career, the characteristics of teachers in
further and vocational education are somewhat different to teachers in other sectors. The
status of teachers in the sector is also perceived to be lacking, with lower salaries and less
attractive employment conditions. Given this background and changes that have been
introduced it is important to consider the implications of these initiatives for FE teaching. This
thesis explores just one of these initiatives concerning the integration and use of technology
into teaching practice.

48
2.3 Barriers, attitudes and beliefs related to technology integration.
2.3.1 Introduction.
It has been suggested that in the 21st Century digital technology will become as important and
influential as the book was in the 19th century (Livingstone, 2012), and as a result there has
been significant and continued investment by many governments to support the provision and
integration of technology into the educational sector (De Witte & Rogge, 2014; Nagel, 2014;
Vaughan, 2013). This investment has primarily been based on the belief that the integration of
technology into the classroom will enable students and learners to engage more effectively
with the curriculum and acquire the skills necessary to become integrated members of the 21st
Century workplace and the broader society (Anderson, 2008; Valtonen et al., 2015). Although
this is the belief of government and policymakers there has not been the envisaged wholesale
technological and pedagogical revolution in the education sector (Ertmer & Ottenbreit-Leftwich,
2010; Howard et al., 2015; Plesch et al., 2013).
2.3.2 Position of Technology in Education.
When trying to establish the position of technology in education there appears to be a lack of
clarity and definition as stated by Watson (2001, p. 253) when he argues "Is I.T. a subject in
its own right, or is I.T. a tool to be used mainly for the [teaching and] learning of other
subject[s]?" The perceived inability to clearly define the position of I.T. led to continual change
since the 1980's when I.T was based on computer science and defined as "The rigorous
academic discipline, encompassing programming languages, data structures, algorithms,…"
(Royal Society, 2012, p.5). In modern life technology and I.T. has become all-encompassing
and has brought about a shift in focus in which the necessary skills and applications of I.T.
became the primary emphasis of the curriculum eventually manifesting itself in the creation of
the new subject area of technology.
The most recent change proposed and implemented by the U.K. Government in 2014 and
heavily influenced by the demands of business and industry, has been to once more focus on
a rigorous computer-science based curriculum. With this change, there appears little
consideration of students who do not have the aptitude or skills to undertake such a technical
academic programme. These changes of position manifest themselves in upheavals in the
classroom resulting in lack of clarity or certainty, “The greatest problem we face with
educational technology has little to do with recognizing that it must be an essential part of
teaching and learning. Rather it is a lack of clear vision as to its real purpose and usefulness
in shaping the educational system of the future.” (Roblyer, 1993, p.13)

49
For more than 25 years, there have been several propositions regarding technology integration
in education. Hawkridge (1990), presented four rationale related to the benefits from the
integration of computers and technology in education which continue to resonate to this day:
• economic rationale: for the workforce of the future the development of technological
skills will not be optional, but a necessity to integrate into a skilled workforce,
possession of these skills will relate to future jobs and careers;
• social rationale: members of society will be familiar with computers and how it impacts
on all aspects of daily life thereby becoming better informed;
• educational rationale: technology is a positive development method to improve
teaching and learning;
• catalytic rationale: technology is expected to stimulate and accelerate educational
innovations.
In the intervening period, the economic, social and educational rationale presented by
Hawkridge (1990) have shown greater convergence (Tondeur, Hermans, van Braak, & Valcke,
2008) as technology has become more pervasive. Even so the wholesale integration and use
of technology in education is far from accepted by many practitioners, technology is viewed by
many from the perspective of not only being a catalyst for change, but also necessitating
changes to teaching and learning styles (Watson, 2001).
Despite the rationale presented by Hawkridge (1990), there appears to be continued intense
discussion taking place concerning the place, usefulness and role of technology in teaching
and learning. Advocates and supporters suggest that technology use develops many of the
skills necessary to effectively contribute to a diverse, sustainable and robust economy
(Akcaoglu, Gumus, Bellibas, & Boyer, 2015; Johnson, Adams Becker, Estrada, & Freeman,
2015; Lim, 2007). Despite these claims, a US Congress report found no identifiable difference
in results for reading and mathematics between using technology, computers and subject-
specific programmes when compared to more traditional teaching methods. (Dynarski et al.,
2007). The National Education Association (NEA) in 2008 concluded that there was a shortage
of “classroom environments that permit students to engage with technology in a way that
prepares them to use technology in the real world” (NEA, 2008, p.19) and business leaders
have long held the opinion that Information Technology (I.T.) and computer skills need to be
more rigorous to satisfy the demands of industry and the wider economy.
50
Others present a more cautious view that technology is not a panacea to cure the ills within
education nor that better technology means better education (Earle, 2002; Kirschner &
Selinger, 2003). There remains little in the way of conclusive evidence that technology has
improved learning outcomes or leads to better attainment by students (Stevenson, 2013). The
fundamental debate continues to rage between sceptics and advocates as to whether the
purpose of technology is to support traditional delivery techniques or provides a radically
different vision of pedagogy based around soft skills and technology-led student-centred
learning (Livingston, 2012).
Studies conducted previously explored the possibility that technology-supported education
improves the academic achievement of students whether this be through an element of
competition in a gaming environment, (Burguillo, 2010; Hwang, Hung, & Chen, 2014; Sung &
Hwang, 2013), interacting with animated pedagogical agents (Davey & Parker, 2010) or using
Multi-Media Instructional Materials (MIM) (Lee, Hsiao, & Ho, 2014).
Conversely, others have highlighted that there is more to learning and learner achievement
that technology cannot support, these include the social aspects of learning and the
importance of social interaction in learning (Dillenbourg, Järvelä, & Fischer 2009; Kreijns,
Kirschner, & Jochems, 2003; Meyer, 2002). With such dichotomous positions held and little in
the way of consensus there seems to be an overriding position that endures with practitioners
that “Good teaching remains good teaching with or without the technology” (Higgins,
Beauchamp, & Miller, 2007, p. 217) and technology in education is more akin to “reshuffling
the pack of cards, but little evidence of anybody trying a new game” Goodson and Mangan
(1995, p. 626). There is perhaps an unrealistic expectation from government and policymakers
alike that teachers might discard the familiar and adopt the unfamiliar in the "general risk
aversion [environment] in teaching" (Howard, 2013, p. 357).
51
2.3.3 The Concept of Barriers to technology integration.
2.3.3.1 First and Second-Order Barriers.
The characteristics of first and second-order change in organisations proposed by Levy (1986)
concerned organisational change management. It was stated that first-order change was
quantitative and remained within the old way of thinking and acting, second-order change was
qualitative and required a new state of thinking and acting. Brickner (1995) extended this
concept of first and second-order change and proposed barriers to change when studying
computer usage by mathematics teachers.
The successful integration of technology into teaching and learning requires many barriers to
be overcome. Ertmer (1999) proposed a simple two state model identifying first and second-
order barriers to the introduction of technology in teaching. First-order barriers are observable,
measurable and extrinsic often displayed as deficiencies, deficits in infrastructure, reliability,
shortages of computers, absence of software, lack of technical or pedagogical support, non-
specific training for teachers and shortage of time through increased teacher workloads and
demands (Ertmer, 2005; Prestridge, 2012). Government investment has addressed some first-
order barriers with the result that technology is now more common in many classrooms across
all sectors of education. There continues to be many sources of on-going frustration,
infrastructure deficiencies, access to computers when required remains an issue in many
institutes and adds to rather than eases teacher’s concerns (Plesch et al., 2013). There are
also unintended consequences from the on-going existence of first-order barriers and
restricted access to technology.
More significant than addressing first-order barriers is the recognition of second-order barriers
that are the ‘real gate-keepers’ to the integration of technology and begins to acknowledge the
degree of change required in teacher’s beliefs and understandings. Second-order barriers are
intrinsic, embracing the core values that teachers have and often concern the core beliefs of
what constitutes teaching, added to this is the concept of self-efficacy and confidence in using
technology. Within these barriers are the personal beliefs and attitudes of teachers and the
degree of change required in teacher’s understanding and beliefs to integrate technology,
these have been deemed much more difficult to address (Blackwell et al., 2013; Ertmer &
Ottenbreit-Leftwich 2013; Howard, 2013).
Trying to define teacher beliefs is a complex and often confusing exercise (Etrmer, 2005;
Prestridge, 2012). Teacher’s beliefs are not immediately identifiable, consistent or quantifiable
and based on personal experience and emotions, beliefs often shape teacher perceptions of

52
what constitutes teaching and are linked to their experiences as students and are shaped by
the context in which they operate. Beliefs become stronger over time and seem to exhibit no
logical connections between differing beliefs (Hansen & Stephens, 2000; Joram & Gabriele,
1998; Lofstrom & Poom-Valickis, 2013). Beliefs, therefore are far more influential than
knowledge in manipulating behaviour (Griffin & Ohlsson, 2001; Nespor, 1987; Pajares, 1992).
Pedagogical beliefs form over many years of experiences, from life as a pupil in the classroom
(Keys, 2007; Richardson, 2003) to the variety of professional contexts teachers’ encounter.
Long-standing beliefs are supported by strong authority and broad consensus (Albion &
Ertmer, 2002), and though beliefs are not easily changed, it does not mean that they cannot
be changed (Prestridge, 2012).
Self-efficacy is one form of belief that has been explored and specifically relates to beliefs
about our abilities to do or accomplish something Self-efficacy acts as a second-order barrier
to the effective integration of technology into the classroom. Ertmer & Ottenbreit-Leftwich
described the influence of self-efficacy thus “knowledge of technology is necessary, [but] it is
not enough if teachers do not also feel confident using that knowledge to facilitate student
learning” (Ertmer & Ottenbreit-Leftwich, 2010, p.261).
Teachers appear comfortable using technology for familiar tasks within their personal and
working lives. Still, there is a perceived lack of confidence associated with how to use
technology for instructional purposes (Bingimlas, 2009; Prestridge 2012; Wiseman &
Anderson, 2012). Moreover, the fundamental pedagogical beliefs of teachers will determine
the style of teaching that they adopt in the delivery of classes (Bandura, 1986; Clark &
Peterson, 1986).
Policymakers and government actively promote the belief that teaching is undergoing an
evolutionary change, shifting from a teacher-centred to a student-centred activity, but
ultimately teachers will determine the level of integration based on their perceptions of what
benefits technology can bring to the classroom. Teachers form their own beliefs about the role
and position of technology as a teaching tool, the value that it can offer to students in terms of
learning outcomes and perhaps, more importantly, their self-efficacy and competency. These
beliefs intersect with teachers’ established beliefs about pedagogy and as stated by Prestridge
(2012) can be a point of ‘collision’ or ‘collusion’ and technology is viewed as an add-on to
established practices, or as a means of accomplishing real change in practices. Despite this
teaching styles and classroom environments have remained mostly unchanged for 200 years
(Akcaoglu et al., 2015; Prestridge, 2012; Shin, 2015).

53
The first and second-order barriers to technology integration model presented by Ertmer in
1999 identified barriers in two categories as extrinsic and intrinsic. These barriers were a fit
depending on the quantitative and qualitative nature of the situation, representing deficiencies
of some nature as extrinsic barriers and the more intrinsic barriers as individual characteristics
of practitioners. This binary representation of a complicated situation led to the development
of a model containing eleven factors in three domains that can impact technology integration
and was presented by Zhao et al. (2002).
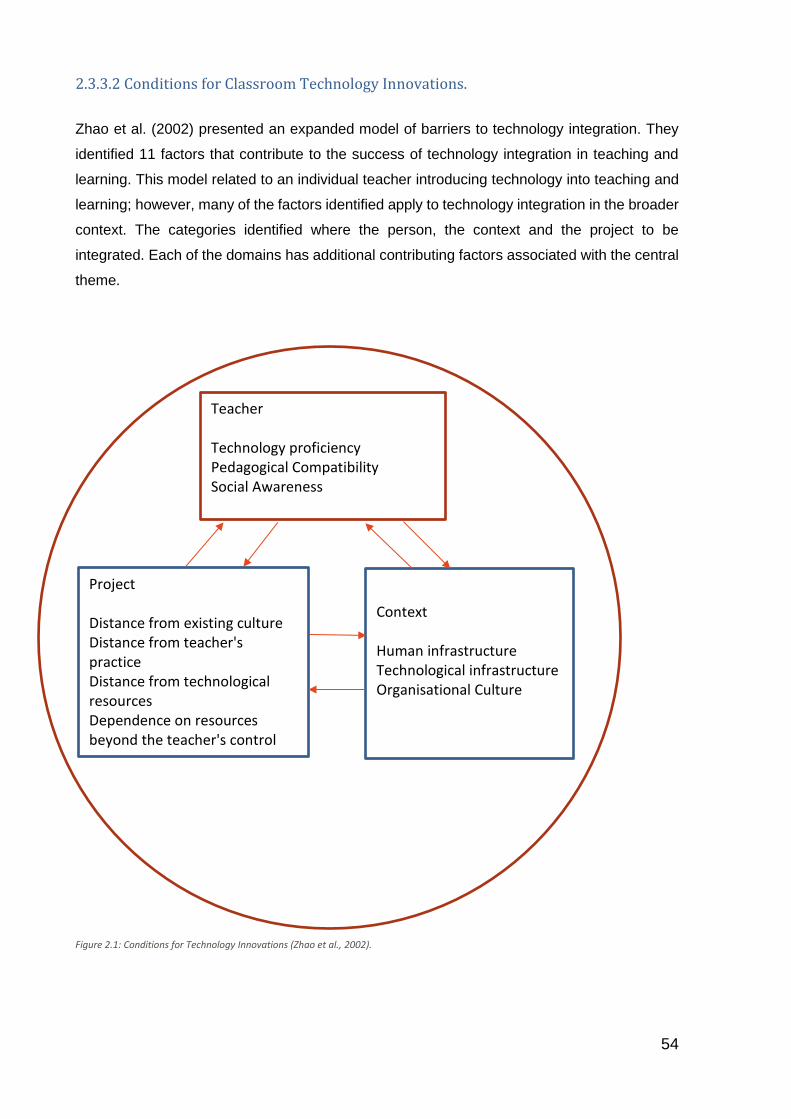
54
2.3.3.2 Conditions for Classroom Technology Innovations.
Zhao et al. (2002) presented an expanded model of barriers to technology integration. They
identified 11 factors that contribute to the success of technology integration in teaching and
learning. This model related to an individual teacher introducing technology into teaching and
learning; however, many of the factors identified apply to technology integration in the broader
context. The categories identified where the person, the context and the project to be
integrated. Each of the domains has additional contributing factors associated with the central
theme.
Figure 2.1: Conditions for Technology Innovations (Zhao et al., 2002).
Teacher Technology proficiency
Pedagogical Compatibility
Social Awareness
Project Distance from existing culture Distance from teacher's practice
Distance from technological resources
Dependence on resources beyond the teacher's control
Context Human infrastructure
Technological infrastructure
Organisational Culture

55
Three factors associated with the teacher have been found to contribute significantly to the
success of classroom technology integration: technology proficiency, pedagogical
compatibility, and social awareness, see Fig 2.1.
Zhao et al. (2002) confirmed the assumption that a teacher’s technology proficiency plays a
significant role in classroom technology integration. Technology proficiency is not only deemed
to be the ability to operate a piece of equipment or use a software application, but also knowing
what is necessary to use a technology specifically in teaching. The factor is comparable to the
first-order barriers identified by Ertmer (2005) as lack of training in technology and its use in
classroom delivery that can act as a barrier to technology integration. The second factor
discusses the compatibility of technology integration with the teacher’s pedagogical beliefs.
When a teacher’s pedagogical approach to teaching was consistent with the technology, then
the efforts to use technology were more likely to yield positive results. Pedagogical beliefs were
identified by Ertmer (2005) as a second-order barrier the willingness to use technology could
also be determined by self-efficacy another second-order barrier. Bandura (1995) stated that
self-efficacy determined the effort applied and willingness to persevere in the face of setbacks,
if the teacher had more confidence in technology use, then the outcome was more likely to be
positive. The final factor in the teacher domain related to the social aspects or dynamics of the
school, the type of support that was available and knowing where this support was available
Ertmer (2005) identified all aspects of support as a first-order barrier whether this was
technology support for equipment malfunction and failures or pedagogical support through
technology champions or mentors.
There are two dimensions to the project domain, distance and dependence, see Fig 2.1. The
distance domain refers to how much the project deviates from the status quo. Within distance
are three sub-areas; distance from the existing culture, distance from existing practice and
distance from available technological resources. The second dimension, dependence, refers
to how much input is required from other people or resources, particularly people or resources
that are beyond the innovator’s immediate control.
Distance from the culture discusses how far the integration of technology deviates from the
dominant set of values, pedagogical beliefs, and practices of the teachers and management.
This domain stands comparison with second-order barriers related to teacher core beliefs.
Distance from practice denotes the degree to which technology use differs from the prior
educational practices and practical experiences of the teacher, once more a second-order
barrier related to teacher pedagogy and self-efficacy. Distance from existing technological
resources relates to the number of new technologies needed for successful completion of the
project, this aspect in the study is not a significant barrier as resources are available although

56
they are not unlimited and lack of resources or access to resources still exists as a first-order
barrier.
Dependence on others refers to the degree that the integration requires the cooperation,
participation, or support of people not under the individual teacher’s authority. Support is a
first-order barrier; in colleges, central technical support and training is not under the control of
the teacher; therefore, it would be one of Ertmer’s (1999) first-order barriers. Dependence on
technological resources signifies the degree that the technology requires the use of resources
beyond the control of the teacher. Although resources are available access to the resources
remains beyond the control of individual teachers and is allocated by management, limited
resources are still a first-order barrier (Ertmer, 2005).
The third domain, context, see Fig 2.1, has three aspects considered central to the success or
failure of technology integration, these factors determine the context, and although not
explicitly identified in the two-state Ertmer (1999) model some aspects are comparable. The
factors are human infrastructure, technological infrastructure, and social support. Human
infrastructure concerns the organizational planning to support technology integration in the
classroom. Some of the factors associated with this include a flexible and responsive technical
staff, and identifiable people who can help the teacher understand and use technologies for
their own classroom needs, rather like the role of a “champion”. Lack of support, in whatever
role, was identified as potential first-order barriers by Ertmer (2005). The second aspect, the
technological infrastructure, relates to the level of resources currently available to meet the
needs of the project, Ertmer (2005) identified these as first-order barriers. When evaluating
access to the available resources, these are determined by management based on criteria
such as subject area and delivery or assessment requirements. The third aspect, the social
support, refers to the extent to which peers support or discourage the project, this factor will
be dependent on the culture of the college, and mainly determined by the beliefs and attitudes
of the staff and management an identified second-order barrier (Ertmer, 2005).
2.4 Established Barriers.
Many of the types of barrier that exist to the integration of technology into teaching and learning
have been acknowledged as extrinsic and are centred primarily on quantifiable facets, lack of
resources, absence of non-specific training, poor technical support, lack of time, variable
infrastructure, connectivity, bandwidth availability and technology reliability. Although there has
been continued investment, extrinsic barriers continue to exist and remain a continued source
of frustration. (Akcaoglu et al., 2015; Cárdenas-Claros & Oyanedel, 2015; Goktas, Gedik, &
Baydas, 2013).

57
The integration of technology takes time to become effective, and it requires changes to move
from teacher-centred to learner-centred approaches which cannot happen in the short term
(Chandra & Mills, 2015). Even when teachers are enthusiastic about integrating technology,
there remain many barriers to successful integration into teaching practices.
2.4.1 Barriers associated with Resources.
Successive U.K. governments have continued to invest in technology in education, and as a
result many of the extrinsic first-order barriers (Ertmer, 2005) or deficiencies in technical
infrastructure (Zhao et al., 2002) have been reduced, but not eliminated. Technology is now
standard in classrooms across all sectors of education. There continues to be though
shortages of technology or limited access to technology and this continues to be perceived as
a barrier to integration (Plesch et al., 2013; Prestridge, 2012).
Colleges and individual teachers often allow students to use personal portable devices to
supplement the lack of provision by the college, and this can create additional unintended
barriers to technology integration. To supplement the lack of resources, students ostensibly
use personal devices to access the internet or Virtual Learning Environment (VLE) during
classes; nevertheless, many distractions have the potential to disrupt teaching and learning. It
is difficult in these circumstances for teachers to monitor the students’ activities when they are
using their devices.
The most common activities not related to teaching and learning that students engage in during
class time include texting, Facebook, tweeting, gaming, watching videos and online shopping
among others (Kuznekoff & Titsworth, 2013). Portable devices can serve as a distraction when
used in an uncontrolled and non-directed manner, constant connectivity results in a constant
stream of distractions (Bellur, Nowak, & Hull, 2015; Fried, 2008). Despite student‘s beliefs that
they have the self-efficacy to cope with this level of multi-tasking, the continual shifting of
attention from work to non-work tasks distracts students from tasks requiring deep thinking.
The continual shifting of task has been shown to have a more significant effect on lower-
achieving students although, it impacts students of all abilities (Fried, 2008; Ravizza,
Hambrick, & Fenn, 2014). The potential for student disengagement through these types of
distractions acts as a barrier to technology integration, with teachers avoiding this potential
disruption by avoiding and preventing the use of personal technology in the classroom (Heflin,
Shewmaker, & Nguyen, 2017).

58
An unfavourable outcome of students using personal devices, without adequate monitoring or
control, has been identified as “checking”. "Checking" is a new phenomenon for those that
cannot seem to endure a day without repeated and regular access to mobile devices. Checking
is checking for text messages, checking Facebook updates, checking emails, checking Twitter,
checking web sites, and checking whether my friends are checking me.” (Goundar, 2014,
p.212).
An additional unintended consequence of lack of resources in areas of low socioeconomic
status that acts as a barrier to technology use in class is a situation known as the digital divide.
The digital divide describes the unequal access to technology, computers and the Internet,
which creates a gap between the “haves” and “have-nots.” Poor, less able or disadvantaged
students are less likely to have equal access to technology, this has a knock-on effect on their
ability to learn and develop (Hohlfeld, Ritzhaupt, Dawson, & Wilson, 2017). Teachers faced
with this situation avoid integration of technology for reasons including avoiding
embarrassment for the individuals that do not have personal devices as well as maintaining
equality within the classes (Clayton & Macdonald, 2013; Zhang, 2014).
2.4.2 The Absence of or non-specific Training.
While it is possible to recognise the effectiveness of technology when teachers have a positive
attitude towards using the technology, an essential determinant in teachers adopting
technology is the training they have received relating to its use specifically for teaching
purposes. This lack of specific training can manifest itself as a barrier to technology integration
into classroom practice (Donnelly, McGarr, & O’Reilly, 2011; Keengwe, Onchwari, & Wachira,
2008; Prestridge, 2012).
With the continual development of technology and the expectation of integration into education
by policymakers, computer anxiety among teachers, created by lack of training and self-
efficacy, has been identified as a barrier to achieving integration (Celik & Yesilyurt, 2013).
When training is limited or not specific in how to use technology for teaching and learning
purposes, it acts as a barrier (Al-Senaidi, Lin, & Poirot, 2009; Lee & Tsai, 2010).
Zhao et al. (2002) identified this type of barrier being associated with human infrastructure and
teacher proficiency while Ertmer (2005) considered this to be a first-order barrier, in this context
training is deemed to be a tangible, quantifiable factor. According to Jones (2004), in a review
of research literature commissioned by the British Educational Communications and
Technology Agency (BECTA), teachers feel reluctant to use computers if they lack confidence.
“Fear of failure” and “lack of technology knowledge” have been cited as some of the reasons
59
for teachers’ lack of confidence in adopting and integrating technology into their teaching
(Balanskat & Bleamir, 2007).
Previous studies concluded that proficiency in using technology in general, using word
processing, email and browsing the web, is not a reliable indicator that technology will be used
in the context of teaching and learning (Lau & Yuen, 2013; Messina & Tabone, 2013; Shawer,
2013). Technology integration is dependent primarily on the perspective of the teacher. Shin
(2015) suggested that most teachers decide the level of integration, but as policy is determined
mainly at management and even government level, teachers’ feel that they are obliged to
engage.
The level of engagement varies with many teachers continuing to use technology for
convenience rather than any fundamental change to classroom practices, although the
medium of delivery has transformed, from the blackboard to a flip chart, to a whiteboard or a
computer screen in the form of Power-point or similar presentations delivery methods remain
unchanged.
Fundamentally teaching styles remain whatever the teachers are familiar and comfortable
using (Akcaoglu et al., 2015; Shin, 2015). Even when teachers have a positive attitude and
possess the level of training and knowledge to integrate technology, there are factors beyond
their control, and lack of technical support inhibits the integration of technology.
2.4.3 Lack of Technical Support.
Recurring technical faults and equipment malfunctions lead to lower levels of technology use
by teachers. Technology failures, or the expectation of failures occurring during lessons, are
likely to reduce teacher confidence and cause teachers to avoid using the technology in future
lessons (Jones, 2004). A lack of technical support in colleges can results in routine technical
maintenance and software upgrades impacting on the serviceability and availability of
technology when required (Jones, 2004; Buabeng-Andoh, 2012).
Zhao et al. (2002) identified this type of barrier as being in the social aspects of the teacher
domain, being able to identify the type and location of the support available and within the
dependence aspect of the project domain, dependence on the cooperation, participation, or
support of people not under the innovator's authority, Ertmer (2005) considered lack of support
to be a first-order barrier.

60
Technical problems results in loss of time, interrupting the delivery and flow of classroom
activities and demotivates both students and teachers (Jones, 2004; Bingimlas, 2009; Korte &
Husing, 2007). When teachers, with limited expertise and experience in using technology in
classroom practices, are unable to accomplish a task, they often shun these situations and
avoid using technology (Snoeyink & Ertmer, 2001). The lack of available technical support is
likely to lead to teachers avoiding technology, for fear of a fault occurring and lessons being
unsuccessful as a result (Jones, 2004). Lack of technical support is easy to identify; lack of
pedagogical support is more difficult to identify or quantify as it is intrinsic and individual.
2.4.4 Absence of Pedagogical Support.
Pedagogical beliefs are formed from experiences over many years, beginning as a pupil in
school (Keys, 2007; Richardson, 2003) and continuing through a variety of professional
contexts faced by teachers. A lack of support from dedicated, specialized staff experienced in
integrating and using educational technologies in different subject areas, that are capable of
supporting different pedagogical styles can lead to lost teaching time, teacher and learner
frustration and the eventual abandonment of technology (Akcaoglu et al., 2015; Cárdenas-
Claros & Oyanedel, 2015; Goktas et al., 2013). There appears to be an assumption as
presented by Zhao et al. (2002) that all that was needed by teachers was “some technical skills
and a good attitude”. The lack of specific support in the use of technology in the classroom for
teaching and learning coupled with the inability of teachers to identify and implement effective
digital pedagogies has acted as a barrier to the effective integration of technology (Scrimshaw,
2004).
Zhao et al. (2002) considered this type of barrier as being within the realms of all three
domains, within the teacher domain it suggested compatibility with the teacher’s pedagogical
beliefs, but it was also reflected within the project domain as the distance the project deviates
from the dominant set of values, pedagogical beliefs, and practices of the teachers and
management. Another aspect of distance, distance from practice, refers to the degree to which
a project differs from the prior educational practices and practical experiences of the teacher.
Within the context domain it signified human infrastructure as a potential barrier to integration
of technology referring to factors including flexible, responsive and identifiable people who can
help the teacher understand and use technologies for their own classroom needs. This help is
rather like the role of a “champion”, who could provide support on an individual basis. Ertmer
(2005) identified pedagogical beliefs as a second-order barrier. The factor of distance from the
culture in the project domain stands comparison with second-order barriers related to teacher
core beliefs incorporating teacher pedagogy and self-efficacy.

61
The assumptions identified by Zhao et al. (2002) earlier contribute to a perception among
teachers that there is a general lack of pedagogical support and training in the effective
integration of technology into teaching and delivery. It has been suggested that eighty hours
of specific continued professional development (CPD) is required before teachers can begin
to integrate technology effectively into their teaching according to Carlson and Gadio (2002),
while Marcinkiewicz (1993) suggests that it will take five to six years before teachers can fully
acquire the expertise to use technology in the ways advocated and move to a constructivist
student-centred classroom environment. Despite governments and educational institutions
endeavouring to provide students with better learning environments by investing heavily in the
procurement of computer hardware and technology (Türel & Johnson, 2012) the scarcity of
support and time to integrate technology effectively has resulted in the situation remaining
largely unchanged.
2.4.5 Shortage of Time.
Contracts for teaching staff in Further Education equate routinely to twenty-five hours of
contact time per week on a full-time contract. In addition to this, they have other duties including
preparation, marking, mentoring, counselling, as well as CPD and meetings of various types
(Feather, 2017; Tummons, Orr, & Atkins, 2013). Parry et al. (2009) suggested that due to this
level of contact time students become more dependent on teachers. The integration of
technology has added to the workload of teachers, and these additional duties include,
converting teaching materials to a format compatible with the technology used, course
maintenance and upgrades associated with the VLE, responding to student emails and the
need to learn new skills (Samarawickrema & Stacey, 2007). Many teachers feel overwhelmed
by the constant and increasing demands on their time with an already overcrowded curriculum
and substantial teaching commitments another demand in the form of this additional work and
training is pushing teachers to the limit and in some cases beyond (Neyland, 2011; Waite,
2004) this acts as a barrier to technology integration.
Changes in managerial practices and increased external pressure has led to an intensification
of work to reduce labour costs leading to the view that lecturers are now regarded as more
akin to production operatives (Feather, 2010; Mather et al., 2007). Prior research concludes
that teachers are unable to find time to be able to use or explore the potential of the technology
considering the intensity of the curriculum as well as a perceived lack of support (Waite, 2004).
Performance-based management systems and a culture of internal and external auditing has
added to teacher’s workload with constant demands for information which is considered a
normal function of the role of teachers (Bailey & Colley, 2015). As a result of these demands,

62
teachers are working consistently over hours, with work spilling over into personal time,
including holidays (Avis et al., 2001; Jephcote et al., 2008).
2.4.6 Infra-structure related barriers.
While the government has continued to support the provision of technology in schools and
colleges, (Association of Colleges, 2019; De Witte & Rogge, 2014; Nagel, 2014), there
continues to be fundamental challenges regarding the delivery and reliability of internet and
broadband services that are essential for the integration of technology into education as in all
other areas of modern life. People in some areas are at risk of being left behind because of
inadequate access, and the government’s focus should be on providing reliable, consistent
broadband connectivity rather than download speeds that will vary depending on the demand
at different times of the day (The House of Lords Select Committee on Communications, 2013).
In an educational environment, infra-structure reliability is considered essential, and when
technology fails due to unreliability or poor connectivity, this acts as a barrier to integration.
Teachers stay with the reliable methods that they know will work rather than risk the potential
disruption caused by technology malfunctions.
Many of the barriers discussed in this section, being extrinsic, are to a greater or lesser extent
measurable and through procurement and investment can be reduced or minimized. Much
harder to address and impossible to measure are the intrinsic barriers, the beliefs of teachers
that are fluid and prone to change depending on the context or situation teachers face, and
teacher self-efficacy or self-confidence in using technology. Despite the continued investment
and provision of technology, there remains deep-seated barriers and suspicion related to the
use of technology in teaching and learning. Additionally, second-order barriers need to be
addressed before teachers will be able to integrate technology as policymakers envisage.

63
2.4.7. Intrinsic barriers.
More significant than the first-order barriers are the second-order barriers, identified as the
‘real gate-keepers’ to the integration of technology. Second-order barriers are intrinsic,
embracing the core values that teachers have and often concern the beliefs and attitudes that
are central to what constitutes teaching and how this is achieved. Self-efficacy is another
second-order barrier that can have a significant influence as to whether teachers will even
attempt to integrate technology into their teaching practices. Within these barriers are the
personal beliefs and attitudes of teachers and the degree of change required in teacher’s
understanding and beliefs to integrate technology. These barriers provide more of a challenge
to address as they are individual, personal and liable to inexplicable change (Blackwell et al.,
2013; Ertmer & Ottenbreit-Leftwich 2013; Howard, 2013).
The integration of technology is far more complicated than the perspective stating that all that
was needed by teachers was “some technical skills and a good attitude” (Zhao et al., 2002,
p.511). Teachers do use technology for familiar tasks within their personal and working lives.
As much of the training and CPD focuses on computer use and neglects how to effectively use
technology to teach students barriers develop associated with using technology for
instructional purposes (Bingimlas, 2009; Prestridge 2012; Wiseman & Anderson, 2012).
Moreover, the fundamental pedagogical beliefs of teachers will determine the style of teaching
that they adopt in the delivery of classes (Bandura, 1986; Clark & Peterson, 1986).
There is a belief that teachers teach the way they were taught, but perhaps a better
interpretation is that teachers teach the way that they learn (Dunn & Dunn, 1979). It is,
therefore, conceivable that teachers continue using these methods as they believe them to be
easy or correct. This perseverance could explain why teachers are reluctant to dispense with
what is familiar and embrace what may be uncomfortable, thereby building barriers to the
introduction of technology into their teaching (Dunn & Dunn, 1979). There is an argument that
most reforms are unsuccessful because they fail to take teachers’ existing knowledge,
perceptions, attitudes and beliefs into consideration when educational changes are imposed
in a top-down manner (Van Driel, Beijaard, & Verloop, 2001).

64
2.4.8 Teacher self-efficacy in using technology.
Bandura (1995, p.3) defined self-efficacy as “the belief in one’s capabilities to organize and
execute the courses of action required to manage prospective situations” or “the belief that one
has the necessary skills and abilities to perform the behaviour" (DiClemente, Crosby, & Kegler,
2009, p.218). Self-efficacy theory reflected the belief that certain behaviours will lead to specific
outcomes, confidence that the behaviour can be successfully performed in the first instance
and shows the individual’s expectation of personal success (Bandura, 1977, 1982; Maddux,
Sherer, & Rogers, 1982).
Technology has become an indispensable part of modern living and an inseparable part of
daily life. The developments within technology has led to the widespread desire for the
integration of technology into education. With the continual development of technology and
desire for integration by management and policymakers has led to increased anxiety among
some teachers. Jones (2004) reported “many teachers who do not consider themselves to be
well skilled in using technology feel anxious about using it in front of a class of children who
perhaps know more than they do” Jones (2004, p.7; Betoret, 2006). A study of 82 teachers
with several years teaching experience concluded that perhaps some of this anxiety exhibited
by teachers is down to the lack of training and resultant lack of efficacy in the use of technology
in the delivery of teaching (Balanskat & Bleamir, 2007).
Research on teacher self-efficacy in technology integration and use has focused on specific
clearly defined areas and contexts across many different geographical areas (Banas & York,
2018; Celik & Yesilyirt, 2013; Tweed, 2013) and provide a snapshot of some of the research
studies that have indicated that teacher self-efficacy is a valid indicator of technology use in
the classroom (Kavanoz, Yuksel, & Ozcan, 2015).
The perceived ease of use of the technology, teacher’s attitude to the contribution technology
can make as well as the professional development and support teachers received are
contributing factors affecting integration, (Kerckaert, Vanderlinde, & van Braak, 2015; Li, Li, &
Franklin, 2016; Oddone, 2016).

65
2.4.9 Teacher Core Beliefs.
Policymakers and government actively promote the belief that teaching is undergoing an
evolutionary change, shifting decidedly from a teacher-centred to a student-centred activity. In
practice, established curricula and teaching approaches remain virtually unchanged with
technology being underused and poorly integrated into the classroom (Akcaoglu et al., 2015;
Shin, 2015). Teachers form their own beliefs about the role and contribution technology can
make as a teaching tool and the value that it can offer to students in terms of learning
outcomes. These beliefs intersect with teachers’ established beliefs about pedagogy, and as
Prestridge (2012) concluded, can be a point of ‘collision’ or ‘collusion’. Technology is viewed
either as an add-on to established practices, or as a means of accomplishing real change in
practices. Whatever views the teacher holds, they are likely to be reflected in the practices and
beliefs about teaching and learning.
The methods employed by teachers will depend on their view of how learning is achieved
(Conole, Dyke, Oliver & Seale, 2004; Trigwell & Prosser, 1996). When teachers view learning
as the accumulation of knowledge to meet external requirements, there is a tendency to focus
on the transmission of information, learning in this context becomes more surface learning to
achieve a specific outcome. Conversely learning viewed from the perspective of student
growth and development means teaching becomes more student-centred with deeper and
more sustained learning (Prosser & Trigwell, 1998). To change the way that teachers approach
their teaching, they need to change the way they conceive learning and consequently teaching
(Marton & Säljö, 1997; Trigwell & Prosser, 1996).
“Research offers little support for the popular (though perhaps unrealistic) rhetoric about
technology revolutionizing teaching.” (Hennessy, Ruthven, & Brindley, 2005 p.156; Liu, 2013;
Underwood & Dillon, 2011). Technology primarily remains viewed as a useful tool that is used
to support traditional teaching approaches (Ertmer & Ottenbreit-Leftwich, 2013; Hernández-
Ramos et al., 2014). Liu (2011) maintained that 80% of teachers use lecture-based teaching
with technology while others demonstrated that teachers preferred to use traditional teaching
methods (Plesch et al., 2013; Scherer, Siddiq, & Teo, 2015). Whether this is due to teachers
reticence and resistance, (Howard, 2013; Selwyn, Dawes, & Mercer; 2001) or based on caution
and practical experiences (Donnelly et al., 2011; Prestridge, 2012) there is clearly a failure to
acknowledge the degree of change in teacher’s beliefs that is required (Ertmer & Ottenbreit-
Leftwich, 2013; Hennessy et al., 2005; Pierce & Ball, 2009).
Trying to define teacher beliefs is a complex and often confusing exercise (Etrmer 2005;
Prestridge, 2012). Teacher's beliefs are not immediately identifiable, consistent or quantifiable

66
being based often on experience and emotions. Beliefs often shape teacher perceptions of
what constitutes teaching and are linked to their experiences as students as well as the context
in which they operate. (Hansen & Stephens, 2000; Joram & Gabriele, 1998; Lofstrom & Poom-
Valickis, 2013). Beliefs are far more influential than knowledge in manipulating behaviour
(Griffin & Ohlsson, 2001).
A widespread perception has developed regarding teacher resistance, whether curriculum
change in the UK (Birchley, 2013) restructuring and league tables in New Zealand, (Mutch,
2012) or the introduction of ICT in the US and many other countries (Cuban, 2011). Advocates
of technology integration opine that teachers are the major obstacle and barrier to the smooth
integration, (Chandra & Mills, 2015; Hu & McGrath, 2011; Sipila, 2013) while powerful and
influential organizations, operating from a position of self-interest and shareholder obligation,
consider it time to re-design outmoded learning environments to make them more relevant to
a new generation of students (Apple, 2008).
To counter this viewpoint sceptics argue that their caution is justified and teachers understand
the operational practicalities of life in the classroom, while “teacher resistance” is a convenient
label attached to teacher’s reservations and professional misgivings by others, who do not
understand the classroom realities (Hernández-Ramos et al., 2014). Cuban (2011) illustrated
the difficulties when he stated that policymakers determine change based on “criteria of
organizational effectiveness, efficiency, and equity. Teachers accept, modify, and reject
innovations on similar criteria, but with the focus on students and classrooms.”
As Csikszentmihalyi (1995) determined, there must be compelling reasons for others to adopt
new ideas, tools or practices and those reasons are that they are more powerful or easier to
use. Prior research indicates that technology has yet to reach its full potential in the classroom
and the widescale revolution in practice remains as elusive as ever (Hernández-Ramos et al.,
2014; Sipila, 2010; Underwood & Dillon, 2011). Teachers use technology, however, despite
technological advances these activities are usually confined to tasks that they are comfortable
with (Bouwman, Carlsson, Molina-Castillo, & Walden, 2007; Chen, 2008; Hernández-Ramos
et al., 2014). Remaining within this comfort zone may be indicative of some of the reluctance
to adopt technology in the classroom, there is also a known dip in performance identified in
national testing experienced after technology integration (Somekh et al., 2004) and this may
reinforce teacher’s reluctance to adopt technology in the classroom.
Regardless of the benefits of technology-supported education, there needs to be a specific
and targeted programme of development and training to overcome the intrinsic barriers of self-
efficacy and address the changes needed to teacher’s core beliefs. The level of training and
67
development provided to teachers in how to use computers in teaching practices remains
limited, and many are unable to use technology for teaching and learning purposes (Al-Senaidi
et al., 2009; Lee & Tsai, 2010). There are significant changes required to embed technology
in the educational infrastructure associated with teacher training, curriculum structures and
materials, classroom practices and modes of assessment at all levels (Livingstone, 2012).
Discarding the familiar and adopting the unfamiliar might be overly ambitious in the “general
risk aversion [environment] in teaching” (Howard, 2013, p.357), technology will only be
adopted when there is a clear benefit to teachers from using it. Zhao et al. (2002) stated that
“when teachers’ beliefs conflicted with the technology … they struggled to successfully
accomplish the goals of the project” Zhao et al. (2002 p. 492).
2.5 Technology Adoption Models.
Rogers (2003) classified in the Diffusion of Innovations several factors that would need to be
of benefit for any innovation to be adopted, these related to economic advantage, convenience
and ease of use as well as compatibility with existing values and practices. Teachers need to
be convinced that there is a tangible benefit for them from integrating technology into the
classroom for them to use it (Hernández-Ramos et al., 2014; Scherer et al., 2015; Tondeur et
al., 2008).
The Technology Adoption Model is one of the most cited models (MacCallum, Jefferies, &
Kinshuk, 2014), the model suggests that there are several contributing factors that will
determine whether an individual will adopt a particular technology, among them are, attitudes,
(Straub, 2009) ease of use and perceived usefulness, (Saadé & Kira, 2007) and improved
results (Brown, Venkatesh, & Goyal, 2012).
Earlier research into teacher education determined that not only was it necessary for teachers
to possess in-depth subject matter knowledge, but they should also possess pedagogical
knowledge which was crucial to good teaching and understanding (PCK) (Feiman-Nemser &
Buchmann, 1987; Shulman, 1986, 1987; Tobin & Garnett, 1988).
Mishra and Koehler (2006) extended the work of Shulman to incorporate technology and
developed the Technological, Pedagogical, Content Knowledge (TPACK) framework.
Teachers' understanding of educational technology interact with Pedagogical Content
Knowledge to deliver effective teaching using technology. There is a tendency to focus on the
technology and not on how to use the technology in teaching (Mishra & Koehler, 2006). The
focus of much of the training associated with technology for teachers has been on the

68
transmission and acquisition of technological skills, rather than on the effective use of
technology to enhance student learning (Chen, 2008; Daly, Pachler, & Pelletier, 2009; Gorder,
2008; Liu, 2013).
Teacher’s understanding of educational technology is a vital component in association with
Pedagogical Content Knowledge to deliver effective teaching using technology. Studies have
been unable to establish any particular characteristics or demographics that are more or less
reluctant to integrate and use technology (Kerckaert et al., 2015; Scherer & Siddiq, 2015;
Tweed, 2013). However, despite the best efforts of government, policymakers, management
and teachers “In practice, established curricula and teaching methods remain in place under a
thin coating of technological glitter, and available technology is often underused and poorly
integrated into classroom practice.” (Hennessy et al., 2005 p.159).
69
2.6 Development of the Research Questions.
When reviewing the literature and developing the research questions, it was essential to review
some of the aspects of teaching and learning literature that underpinned the study and were
felt to be relevant to the Further and Vocational Education sector (section 2.2.3). Within the
Further/Vocational Education sector, different teaching strategies are used by teachers’
dependent upon the context and environment faced as well as the content and curriculum to
be delivered (section 2.2.2). Further and Vocational Education provides opportunities for
teachers and practitioners to adopt a variety of approaches to teaching and context is of vital
importance (Harkin, 2005; Lucas & Nasta, 2010).
The Further/Vocational Educational sector is an under-researched area and being familiar to
me as a practitioner, was of specific interest resulting in the research study. From my
understanding of the sector and from working within it, it appeared to operate within a unique
context (section 2.2.2). Teachers and tutors within the sector may not have followed what could
be considered a traditional route into teaching, with teachers and tutors having gained a wide
range of industry experience within a precise discipline or field before they entered the field of
education. It was necessary to investigate, through the literature, the characteristics and
profiles of teachers in Further/Vocational Education to try to determine if there were any distinct
traits or characteristics that existed (section 2.2.2).
Until 2007 there was no requirement for teachers in Further/Vocational Education to have
undertaken or achieved a formal teaching qualification as industry experience, and
professional qualifications were deemed to be more relevant (section 2.2.2). When examining
why teachers did not integrate technology into their teaching practice, one of the main barriers
established from the literature was that of efficacy in using technology within the classroom.
The concept of barriers was introduced in section 2.3.2 and featured in more detail in a later
section 2.4.8 when reviewing the literature around self-efficacy. There are teachers engaged
in Further/Vocational Education that do not possess any formal teaching qualification either
because they were teaching before or engaged after this date on the basis that they achieve
a teaching qualification after engagement. I felt that it was necessary, therefore, to examine
the literature around self-efficacy in section 2.4.8.

70
From the review of the literature outlined above, I developed research questions one:
1. How do teachers in Further/Vocational Education use and integrate technology into
their teaching practice?
The main area of research was to investigate teacher’s beliefs and attitudes in their teaching
practice towards the use and integration of technology in Further and Vocational education
colleges. Much of the previous research has established the existence of barriers these
barriers defined as first-order barriers, are deemed to be extrinsic in nature and measurable
(section 2.4) and second-order barriers that are more intrinsic and liable to change and vary
depending on the context or situation that exists (section 2.4.7). The research identifying
barriers was mostly from schools, and as a result, a gap exists in the types and barriers that
exist in the Further/Vocational Education sector. The investigation of the existence of barriers
to the integration of technology led to the second research question:
2. What barriers and facilitators exist to inhibit or support the use of technology in Further/
Vocational Education?
The final research question presented was to examine the beliefs of the teachers concerning
the integration of technology into their teaching practice. The perceptions of teachers toward
technology and the perceptions of others to teachers was examined. There was also a review
of literature around the area of technology adoption models that examined the constituent parts
that were necessary for the effective adoption of technology and a recognition of the
fundamental change that was necessary for teachers to integrate technology effectively. The
literature highlighted that constant change or innovation often left teachers feeling
overwhelmed by change while not always receiving the necessary support and training that
would enable them to move from a position of teaching students about technology to one of
teaching students with technology. Research question three examined the area of teacher
beliefs and attitudes about technology integration
3. What are the teacher's beliefs concerning the integration and contribution technology
can make to their teaching in Further/Vocational Education?

71
Chapter 3 Methodology and design.
3.1 Introduction.
This chapter details the philosophical and theoretical underpinnings of the research
methodology and design. The section begins by outlining the research philosophy,
epistemological and ontological considerations that are relative to the research study. The
design employed and the rationale for using it will be detailed. Full details of the recruitment of
participants, the sample selection process, methods of data collection and analysis and ethical
considerations surrounding the study are set out.
3.2 The philosophical and theoretical underpinnings of the research project.
3.2.1 Theoretical stances and positions.
Crotty states that the terminology used in research literature is baffling with epistemologies,
ontologies, theoretical perspectives, methodologies, and methods “thrown together in grab-
bag style as if they were all comparable terms” (Crotty, 1998 p.3). It is easy to conclude that
these terms signify some hierarchical levels of decision making within the research design
process, but the overarching concern must be the evidence obtained answers the research
question posed no matter what label is ascribed to them (De Vaus, 2011). It is also imperative
that there is recognition that “a researcher's background and position will affect what they
choose to investigate, the angle of investigation, the methods judged most adequate for this
purpose, the findings considered most appropriate, and the framing and communication of
conclusions" (Malterud, 2001, pp. 483-484).
When deciding on a research philosophy, there are two theoretical concepts to be considered,
although Crotty contends that these, epistemology and ontology, are mutually dependent and
therefore difficult to examine or discuss in isolation. They intersect, “to talk about construction
of meaning is to talk of the construction of a meaningful reality” (Crotty 1998, p. 10). There are
also important taken for granted assumptions about how individual researchers view the world.
These assumptions underpin the entire research strategy and methods employed. A
researcher needs to be aware of them since they will impact on the research study (Saunders,
Lewis, & Thornhill, 2009). Recognising these assumptions and the positions adopted are vital,
and the positions adopted, and stances taken have been stated throughout. The first concept
ontology is concerned with the nature of reality and questions associated with how the world
operates.
72
3.2.1.1 Ontology.
Ontological assumptions are concerned with what we believe constitutes social reality (Blaikie,
2000, p. 8), and is associated with a central question of whether social entities, such as culture,
should be perceived as objective or subjective. Objectivism asserts that social phenomena and
their meanings have an existence that is independent of social actors’.
Subjectivism/Constructivism asserts that social phenomena, and their meanings, are
continually being created from the perceptions and actions of social actors and suggests that
social phenomena are not only produced through social interaction, but are constantly revised
and modified (Bryman, 2015). I am primarily a constructivist in the way that I view the world. I
deem that social phenomena and categories are the product of social interaction and
continuously in a state of flux. The study focuses primarily on the perceptions of teachers
regarding the barriers and enablers they are faced with when using and integrating technology
in their professional lives. These barriers are often socially constructed and are personal based
on experiences, the constructivist stance that I hold, therefore supported the study. The second
theoretical concept to examine is epistemology and concerns what constitutes knowledge in a
field of study.
3.2.1.2 Epistemology.
Epistemology involves the theory of knowledge and claims about how what is assumed to exist
can be known (Blaikie, 2000, p. 8). Epistemology focuses on the knowledge gathering process
and is concerned with developing new models or theories; knowledge is deemed to be
continually changing (Grix, 2002). Within epistemology, there are two different positions
‘positivism’ and ‘interpretivism’. Positivism adheres to the prevailing view that real knowledge
is the result of observation and measurement. The role of the researcher is limited to data
collection and objective interpretation, resulting in quantifiable findings capable of statistical
analyses. Interpretivism integrates human interest whereby researchers interpret elements of
the study. Interpretivism contends that reality is only achieved through social constructions
such as language and shared meanings and acknowledges the differences between people
and objects, requiring the researcher to grasp the subjective meaning behind social actions
(Bryman, 2015; Myers, 2013). The study focused on examining the perceptions of the
participants from the individual’s perspective; the researcher interpreted the subjective
meaning behind the social constructions presented by each participant. An interpretivist
epistemology, therefore, underpins the current study as it sought to explore perceptions and
beliefs of individual the teachers regarding the integration and use of technology in their
professional lives.

73
The epistemological assumptions of interpretivism are that social reality is individual and
multiple people interpreting an event will result in multiple perspectives of an incident. (Chandra
& Mills, 2015; Howard, 2013; Yang, 2012). Interprteivist studies have had questions raised
over reliability, but others take the view that these different ways of seeing the issue provide a
richer, more developed understanding of complex situations (Malterud, 2001).
A standard method for achieving this, according to Crotty (1998) is to use and collect data via
unstructured interviews in which only open-ended questions are asked (section 3.4.7). This
method was employed in the current study. Semi-structured interviews with open-ended
questions were used to examine the perceptions and beliefs of teachers through their own
experiences; this way, themes emerged from the data. Semi-structured interviews rather than
unstructured interviews were appropriate due to the constraints of time and availability of
participants for interview purpose. They also limited the quantity of data generated for analysis
and transcription purposes as well as prevented interviews drifting off-topic and becoming
rambling conversations failing to address the research topic, and this is one possible outcome
from using unstructured interviews (Bryman, 2015; Coolican, 2013; Mears, 2012).
Many influences will determine the position adopted by a researcher when undertaking any
research study, experiences and character as well as background and perceptions will all
contribute to the ontological and epistemological position held and adopted by the researcher
(Malterud, 2001). Another aspect of the position occupied by the researcher that could impact
and influence the research study is reflexivity.
3.2.1.3 Reflexivity.
Reflexivity is a recognition that a researcher cannot divorce themselves from their personal
feelings, reactions and motives when conducting a research study and these may influence
and affect what they think in particular contexts throughout the research process. Different
researchers will approach a situation from different positions or perspectives, this could lead
to a different, though equally valid, interpretation of the same situation under investigation by
different researchers. As Malterud contends "Preconceptions are not the same as bias, unless
the researcher fails to mention them" (2001, p. 484) Having worked in the F.E. sector and
faced the situation first-hand, both as a teacher and a manager within a college, inevitably I
held preconceived ideas concerning the perceived barriers faced by teachers regarding
technology integration into teaching practices, these ideas formed during discussions with
colleagues in colleges. To maintain credibility, qualitative researchers need to identify their role

74
due to the direct and detailed role that they occupy during both data collection and data
analysis phases where researcher membership in the group or area studied has greater
relevance (Dwyer & Buckle, 2009).
3.2.1.4 Summary and researcher position.
The research philosophies defined as ontology and epistemology, and the alternative stances
within them, are often depicted as being binary in nature although there is no particular stance
that is better than the other, they are selected based on the assumptions made by the
researcher and how the world is viewed (Duberley, Johnson & Cassell, 2012). The subjective
nature of the study and the framing of the research questions, as well as the personal beliefs
and assumptions held by the researcher, have formulated a study that will be from an
epistemological stance interpretivist, and an ontological position of subjectivist/constructivist.
Investigating and examining teacher’s perceptions and beliefs regarding the barriers and
enablers that exist for them in integrating technology into their teaching practice and the
contribution and usefulness of technology in their teaching, are personal and subjective and
fits with the philosophies identified and stated earlier.
It must be recognised and accepted that I have preconceived beliefs and attitudes established
through experience and background, not just confined to the area of study. Individuals are
constructed by the world while at the same time constructing the world through our
backgrounds and experiences (Laverty, 2003). Heidegger, cited in Polkinghorne (1983),
emphasized the importance of history and background on a person’s understanding of the
world by providing a reference for what is considered real and my personal opinions and beliefs
will influence any decisions taken. What was of interest was building a total picture from the
partial accounts of the teachers based on their experiences, recording the way things appeared
to them and reporting any consistent themes that emerged. I wanted to collect and analyse
data about their experience while recognising the subjective nature of their responses.
3.2.1.5 Insider or Outsider.
Merton (1972), classified two opposing views as the Outsider and Insider Doctrines. The
Outsider Doctrine values researchers who are not from the communities they study, they are
neutral, detached observers. The Outsider Doctrine questions the ability of insider researchers
to analyse, in a detached, objective manner, when they are an integral part of it. The Insider
Doctrine conversely disputes the ability of outsider researchers to understand the culture or
context fully as they have no experience of it directly (Kerstetter, 2012).

75
Dwyer and Buckle (2009) challenge the notion of binary positioning of insider and outsider
status. The proposition was that there are a few characteristics of a researcher that will remain
consistent throughout the research process, but there are few cases in which researchers
remain complete insiders or outsiders. Their identities often change along a spectrum between
these binary positions dependent on the context, location, personality of the researcher and
participants and the research subject (Dwyer & Buckle 2009; Kerstetter, 2012; Mercer, 2007).
3.2.1.6 The Inbetweenie.
I feel as the researcher that I occupy the space in-between the insider and outsider researcher.
I based this assertion on the fact that I worked for many years as a teacher in the Further and
Vocational Education Sector both in the U.K. where I trained, and abroad where I went initially
as a teacher and then progressed to become a manager and vice-principle of a college. I have
first-hand knowledge and experience of the work, environment and context of colleges in these
locations from a teacher’s perspective and a manager’s perspective. I faced the same
questions that formed the basis of the study as a teacher and have asked those same
questions as a manager in a college; this background allowed me to consider myself as a
partial insider researcher. Since I left the U.K. in 2008, there have been many changes within
the sector, the requirement for teachers to hold a formal teaching qualification that was
implemented in 2007 being an example of just one. Working practices and the role of teachers
in Further and Vocational Education had changed significantly from when I taught in the U.K.,
and I must, therefore, consider myself to be something of an outsider researcher, but not a
complete one.

76
3.3 Approaches to Data collection.
3.3.1 Qualitative Research.
Qualitative research is associated broadly with the interpretivist/constructivist paradigm
emphasising the individual construction of meaning of the world through the subjective
assessment of attitudes, perceptions, experiences and behaviour of the research participants
(Mack, 2010). Qualitative research techniques were used during the interview process of the
study, although participants were also invited to complete two preliminary online surveys to
collect background data and build a picture of the teachers taking part in the study.
3.3.2 Quantitative Research.
Quantitative research is primarily viewed from a positivist perspective of the social world and
studied according to the principles and procedures of the natural sciences. Positivist research
has an emphasis on scientific methods, statistical analysis and generalizable findings. Auguste
Comte, the founder of positivism, believed reality could be observed (Mack, 2010). Positivist
researchers maintain that the scientist is the observer of an objective reality (Underwood &
Dillon, 2011). Quantitative data was collected during the Phase 1 survey to establish a
background profile of participants and used for comparison purposes with the Education and
Training Foundation 2017 Report to confirm that the sample was consistent with the sector
overall. The data was analysed using IBM Statistical Package for the Social Sciences (SPSS)
to establish any statistical significance between dependent and independent variables. The
dependent variables were associated with, teacher’s confidence in using technology, the
frequency and type of engagement that teachers had with technology, perceived barriers that
existed to the integration and use of technology and CPD or training that had been offered or
undertaken. The independent variables used were Age, Subject Area, and Teaching
Experience.
3.3.3 Mixed Methods Research.
Mixed methods research involves blending the philosophical assumptions concerning the
fundamental questions of ontology, epistemology and theoretical perspective and deciding that
a combination of these approaches will best suit the research process and answer the
questions posed. Mixed method research uses quantitative and qualitative data collection
techniques and analysis procedures, but does not combine them (Sadaf, Newby & Ertmer,
2012). Quantitative data are analysed quantitatively, and qualitative data are analysed
qualitatively (Creswell & Plano Clark, 2007; Saunders et al., 2009). The fundamental premise

77
is that the use of quantitative and qualitative approaches, in combination, provides a better
understanding of research problems than either approach alone (Haydn, 2014; Hu & McGrath,
2011). When deciding on the approach to be used for data collection is was necessary to
evaluate the different methods outlined above and determine what I considered to be the best
fit for the study.
3.3.4 Theoretical perspective and Epistemological Considerations.
I initially approached the study intending to use mixed methods, combining both a qualitative
and a quantitative perspective, a method previously used by Prestridge (2012), Sadaf, et al.
(2012) and Eteokleous (2008). There have been arguments against using mixed methods
based on the belief that research paradigms are incompatible and inextricably linked to
epistemological assumptions, values and methods (Lincoln & Guba, 1985). However, as
Bryman (2015) stated, research methods are much more compatible than is often supposed,
with methods associated with both quantitative and qualitative research being employed
together in a single piece of research.
The purpose of the first of two online surveys was for initial data gathering and identification of
themes that would support the development of the interview schedule and the second survey
to give an insight into the teachers participating in the study. The second survey could be used
for comparison with a much larger sample contained in the Education and Training Foundation
2017 Report, to determine whether the characteristics of the teachers in the study were
comparable to the broader sector. The results generated from the surveys were limited in terms
of how they could be used to inform the study directly, and I abandoned the mixed methods
approach in favour of a more qualitative specific approach based on an interpretive paradigm.
Nevertheless, the data generated from the first phase survey was useful and acted as a starting
point for the development of the interview schedule.
The use of self-administered on-line surveys to gather autobiographical background data of
the participants in the study replicated the method employed by Sipila (2010, 2013). The
rationale of using online surveys was that they have some advantages, they are convenient to
use, allowing rapid distribution of the survey to participating institutes through email and by
hyperlink to the Bristol Online survey platform. This way, the survey was accessible to potential
participants through the college intranet. Survey results were in a standardized format for use
with recognised statistical analysis software packages; this would minimise data handling and
inputting errors. The survey data was also updated in real-time and allow liaison with colleges
on the numbers of participants taking part in the surveys. However, not everything in life is
78
measurable (Popkewitz, 2004) nor capable of statistical analysis and the second and third
parts of the study were conducted using methods more associated with qualitative research.
Qualitative researchers study phenomenon in natural situations attempting to bring meaning
to the phenomena through the interpretation of the data given by the participants (Denzin &
Lincoln, 2005). This approach attempts to view and interpret the world from the other person’s
perspective and as I was seeking to understand teachers as individuals, recognizing the
differences they have related to other teachers with whom they work, trying to discover
individual attitudes and beliefs regarding the integration of technology into the classroom
environment and identify any perceived barriers or enablers it was consistent with the study.
As the study focused on the beliefs that teachers hold, providing meaning and understanding
of the world from their perspective through their accounts, it could not be value-free, nor was
it capable of measurement. It was also not immune from the researcher’s background and
experiences (Bryman, 2015; Hammersley, 2012; Mackenzie & Knipe, 2006; Mertens 2005;
Saunders et al., 2009). The ontological standpoint of the study was that individuals continually
construct their meaning of the world which is context dependent. The epistemological
perspective was a position of interpretivism recognizing the difference between the objects of
natural sciences and people (Bryman, 2015), the main focus of the study was to understand
“the subjective world of human experience” (Cohen, Manion, & Morrison, 2007 p. 21).
Constructivist researchers are more likely to approach data collection and analysis from a
qualitative perspective. In this study, the view adopted was one where the 1st on-line survey
quantitative data was to support and enhanced the collection of qualitative data and deepened
the description provided from the participants during the interviews (Mackenzie & Knipe, 2006).

79
3.4 Design.
The exploratory nature of the research mirrored the nature of research completed by Donnelly
et al. (2011). The study encouraged close work with the participants enabling them, through
their experiences, to provide an understanding of the complex social events within a real-life
context (Baxter & Jack, 2008; Flyvbjerg, 2011; Stake, 2005; Yin, 2013). The interpretivist
design utilised a principal method of data collection of interviews supported by self-
administered surveys. The use of surveys provided background data for the development of
themes and then the interview schedule. There are situations when more than one strategy is
used in any particular study, as demonstrated by Prestridge (2012) Sadaf, et al., (2012) and
Eteokleous (2008), it was decided therefore to use two self-administered surveys with follow-
up one to one semi-structured interviews.
3.5 Methods.
The traditional measures used to evaluate the quality of research have focused on the
concepts of validity and reliability and as the accuracy, dependability and credibility of the
information depend on it, addressing these criteria are essential in all studies. The emphasis
of qualitative research is often in answering questions about experience, meaning and
perspective, most often from the standpoint of the participant. In qualitative research, each
study is unique, with no expectation of replication. Therefore, the quality of qualitative research
is evaluated using terms like quality, rigour or trustworthiness, instead of validity and reliability
(Lincoln & Guba, 1985; Seale, 1999; Stenbacka, 2001).
Although the terms ‘reliability’ and ‘validity’ can be contentious, research integrity and
robustness are as important in qualitative studies as they are in other forms of research
(Lincoln and Guba, 1985). When data are gathered to answer questions of personal or social
meaning, with researchers endeavouring to capture real-life experiences, these can never be
identical from one study to the next. Nevertheless, faced with increased criticism regarding the
reliability and objectivity of qualitative research, qualitative researchers have sought to
establish more rigorous criteria and methodological standards (Lub, 2015) and verification
strategies for evaluating the credibility of qualitative findings (Morse, Barrett, Mayan, Olson, &
Spiers, 2002).
The rational definition of validity does not work well in qualitative naturalistic research.
Alternative terms such as authenticity, adequacy, plausibility, neutrality, trustworthiness,
credibility, applicability and consistency have replaced validity (Leininger, 1994; Lincoln &
Guba, 1985; Maxwell, 1996; Merriam, 1998).

80
Despite efforts to the contrary by some researchers the range of qualitative methods is too
extensive to be represented by a standardised set of criteria and the quality of each project
should be determined on an individual basis. Sandelowski and Barroso (2002, p8) maintain
‘‘The only site for evaluating research studies, whether they are qualitative or quantitative, is
the report itself’’. Rolfe (2006) goes further stating there is no common understanding of the
field of qualitative theory or methodology which can collectively be described as ‘‘qualitative
research’’.
Lincoln and Guba (1985) were among the first to develop specific criteria for qualitative
research and termed these criteria as trustworthiness and authenticity; they presented these
as four sub-criteria:
• Credibility.
• Transferability.
• Dependability.
• Confirmability.
Researchers should attempt to demonstrate that the data presented is a true reflection of the
phenomenon being investigated, thereby address concerns regarding credibility. Details of
the context of the study will allow the reader to decide whether the context of the study is
comparable to another situation and whether the findings can reasonably be applied, thus
enabling transferability. The dependability criterion is difficult to achieve in qualitative
research; however, researchers should endeavour to enable future investigators to repeat
the study, through providing rich detail about the boundaries, context and methods
employed.
Researchers ensure confirmability by taking steps to demonstrate that findings emerge from
the data and not from their inclinations or biases (Shenton, 2004).
Shenton (2004) went further and identified an extensive list of conditions that could be satisfied
by a qualitative researcher wishing to address Lincoln and Guba's four criteria, I have
presented these and sought to identify where I believe they have been met, within the current
study although not every condition has been met, Appendix B provides a comparison in table
format.

81
3.5.1 Satisfying Shenton’s (2004) criteria.
Enhanced credibility of the study was achieved by using well recognised qualitative research
data collection methods, surveys and semi-structured interviews. Through on-going
communication with the colleges and personal experience in the sector, I had an in-depth
knowledge of the prevailing culture that existed in the sector and within the colleges
participating. While I was not able to utilise random sampling as a method to identify potential
participants, I did not know the participants before their voluntary engagement, eliminating any
potential bias that might have occurred.
Partial triangulation of data through using different data collection methods and from different
colleges, satisfied one of the dependability criteria in that the study used over-lapping methods
which increased confirmability through reducing researcher bias. Shenton (2004), identifies
tactics to ensure the honesty of participants as a criteria for credibility, and I believed that the
participants were honest with their answers and the candid responses reported in Chapter 5
were evidence of the honesty and integrity of the participants.
Throughout Chapter 3, I have provided an in-depth methodological description of the study,
regarded as necessary to meet the dependability and confirmability criteria. I clearly stated
using reflective commentary my position, beliefs and any assumptions throughout chapter 3
(Section 3.2.1.4, 3.2.1.6) this also met the credibility and confirmability criteria as defined by
Shenton (2004).
Background data established the context of study with a detailed description of the study to
promote transferability and allow comparison. At every stage of the study, I set out my
background, experience and motivation for undertaking the study. This information was
available all potential participants and I used this also as an icebreaker, before the start of each
interview. Participant checks of the interview transcripts and interpretation of the responses
was available throughout the process and is also a condition of the university ethics approval
procedure. The participant's right to withdraw at any stage of data collection was confirmed
before each stage. Chapter 5 provides a thick, detailed description of the entire study setting
out the results in as much detail as possible to enable other readers to understand the
complete study. The process of sample selection, at each stage of the study, has been set out
including the use of diagrams, presenting the processes involved throughout the study
providing confirmability. The credibility of the current study through identification of previous
research that has used similar methods has been clearly stated where applicable in chapter 2,
chapter 3 and chapter 5. Identification of the study limitations and potential effects in Chapter
6 supports confirmability.

82
3.5.2 Identifying Participants and Gaining Access.
The initial phase of the research involved collecting information that would establish the
educational and professional autobiographies of the tutors engaged in the colleges taking part
in the study. A letter of introduction and request to participate, as well as a sample
questionnaire was distributed to the Principal or Chief Executive of 27 institutes across England
and permission sought from the principles to engage in the research project (Appendix C).
There was a positive response from 9 principals and contacts within the college were identified
for further liaison. The principals were very enthusiastic about being part of the project
considering the research to be both timely and valuable, as there is now a requirement for
vocational and further education colleges to deliver part of their curriculum online. It was seen
that the research and results would provide a benchmark for each institute about the
capabilities and opinions of staff concerning their perceptions of teaching and delivery using
technology.
I met the designated personnel in the nine colleges and discussed the overall rationale and
aims of the project. During this meeting, I answered questions raised about the level of
involvement and commitment from potential participants. A sample of the first online survey
for examination and comments, and minor adjustments were made based on feedback from
the designated personnel, but there were more of an editing nature and not critical to the layout
or detail of the survey instrument.

83
3.5.3 Phase 1.
The First stage online questionnaire (Appendix D) was distributed and administered through
Bristol Online Surveys, through an agreement with Durham University. This was distributed to
the designated liaison personnel in each institute. There was a mixed response from both the
teachers and liaison staff concerning participation in the project. The selected method, a self-
administered questionnaire, was intended primarily to facilitate the development of the
interview schedule by providing background data on teachers experience of and with
technology in their teaching practices and identifying themes from the data similar to a method
as used by Sipila (2010, 2013).
Figure 3.1: Selection and validation of phase 1 data.
3.5.4 Questionnaires.
Questionnaires are a popular way of gathering information in research projects. They are a
convenient way of collecting data and are deemed less intrusive and time-consuming than
some other methods that could make some participants apprehensive and reluctant to
participate (Berdie, Anderson & Niebuhr, 1986; Yang & Hinkle, 2012). The advantages of
questionnaires are that they are a cost-effective way of gathering information from a large
number of people, are relatively easy to administer, and information collected in a standardized
format. The standardized nature of the responses means it is easy to handle, collate and
analyse data using a variety of statistical techniques (Munn & Dreyer, 1990). I used web-based
questionnaires because I was able to distribute the survey to the participating institutes by
sending a hyperlink to the platform hosting the survey. This method of distribution minimized
the time required, kept any potential disruption to a minimum, and it was easy to distribute to
all staff through the college internal email system.
27 Institutes approached to
participate
9 Positive responses and
agreed to participate
232 Participants completed
phase 1 survey
229 valid phase 1 survey data
sets

84
The study’s standardized data sets were exported from the Bristol Online Survey website and
were updated in real time. For analysis, data was exported directly into the IBM Statistical
Package for the Social Sciences (SPSS) programme. A series of one-way analysis of
variance (ANOVA) tests were conducted to determine whether there were any statistically
significant results across a range of dependent and independent variables. Dependent
variables of age, subject area taught and years of teaching experience and independent
variables of the type and level professional development of teachers in the use of technology,
frequency and type of interaction with technology in teaching practice and teacher self-efficacy
and competence in performing specific tasks using technology in their professional life were
analysed. Participants were assigned to one dependent variable group only this is sometimes
referred to as an attribute independent variable because individuals are allocated to a group
based on some attribute that they possess. ANOVA tests were used to analyse the data from
the first questionnaire as they control Type I errors. Type 1 errors are false positives and occur
when statistically significant differences occur when there are none. ANOVA therefore give
greater confidence in any statistically significant results produced.
3.5.5 Summary of Phase 1 Survey.
The study was conducted across nine Post-Compulsory Further Education Colleges in
England. A series of one-way analysis of variance (ANOVA) were conducted to identify any
statistically significant results and identify and any recurring themes. The data was then used
to facilitate the development of the interview schedule by providing background data on
teacher’s experience of and with technology in their teaching practices. The data generated
from several key variables concerning the integration of technology in teacher’s professional
lives is presented in Chapter 4, and full data analysis is in Appendix E.
The data sets were manipulated and collapsed for ease of handling and analysis, an example
of this was that 57 different locations were entered by participants to identify their location it
was possible to collapse this data and identify the nine parent colleges participating. A similar
process of collapsing was undertaken where different terminology was used by the participants
to indicate the subjects that were taught. There were initially 41 different subjects identified
that were collapsed into seven subject families or groups. Chapter 4 provides details, and
Appendix E gives a full set of statistical results.

85
3.5.6 Phase 2.
After the analysis of the 1st phase survey, another survey was compiled to obtain additional
data that would give me a sense of the people taking part in the study and working in the
colleges taking part. It would also be possible to compare the teacher profiles with a larger
survey, from the Education and Training Foundation 2017 Report, to determine whether the
sample was comparable with the wider Vocational sector and exhibited similar characteristics.
However, there could be no claim that such a small sample was representative of the sector
at large. A second survey (Appendix F) was distributed directly to these participants, another
on-line self-administered survey, but the questions allowed for a more narrative response to
obtain data that provided more details of background and qualifications and produced similar
results to the data reported in the Education and Training Foundation 2017 Report (Appendix
G). Participant profiles were established from the data provided, and the flow chart below
shows the process of selection and validation of phase 2 data. The primary purpose of this
questionnaire was to build a profile of the teachers participating and provide a sense of the
teachers working in the colleges.
Figure 3.2: Selection and validation of phase 2 data.
3.5.7 Interviews.
If you want to know what people think it is best to ask them, conversation is a basic human
characteristic, and during these conversations, people talk and interact with each other while
posing and answering questions. Through these conversations, we get to know about
experiences, feelings, perceptions and discover the world in which others live. The interview
is an inter-view where knowledge is constructed through inter-action between the interviewer
and the interviewee and provides a useful way for researchers to learn about the world of
others. Although it is not possible to ever be as one with the other person, it is possible to
discover about the lives of the other through their own words and the use of interviews (Kvale,
2007; Qu & Dumay, 2011).
Interviews can be used in many ways depending on the type of data that is being sought. The
more structured the interview technique, the more standardized the data generated, the less
structured the interview, the more detailed and in-depth the data (Bryman, 2015). The purpose
of the study is to understand the perceptions and beliefs of teachers regarding the integration
92 1st survey participants indicated a willingness to continue
57 participants
proveded valid contact
details
31 phase 2 surveys
distributed
25 completed
surveys returned
22 surveys deemed valid for
inclusion in results

86
of technology into their teaching practices, these perceptions vary depending on the context
and would be personal and individual to each participant. There were several types of interview
that I could have used for data collection purposes, and each interview type has its advantages
and drawbacks when used in research studies. The method of data collection that I selected
was semi-structured interviews incorporating visual methods.
Semi-structured interviews are often the most effective and convenient means of gathering
information (Kvale and Brinkmann, 2009), because it is based in conversation, allowing
modification of style, pace and order of questions to uncover the deepest responses. It enables
interviewees to provide responses in their terms and in the ways that they think and use
language, thus providing accounts of how the participants perceive their world. A primary
technique used in semi-structured interviews is the use of scheduled and unscheduled probes,
providing the researcher with the means to draw out more complete narratives from the
interviewees, drilling down into a particular topic (Bryman, 2015; Coolican, 2013; Mears, 2012;
Qu & Dumay, 2011). This contrasts with structured interviews where participants are asked
the same questions in the same order allowing only a limited number of response categories,
this technique would not produce the rich detail that I was seeking in the current study, but
structured interviews are considered to be easier for data comparison and analysis because
of the limited responses (Bryman, 2015; Coolican, 2013; Mears, 2012; Qu & Dumay 2011).
Semi-structured interviews are flexible and are capable of unearthing important and hidden
facets of human behaviour, and this is the data that I wanted to unearth. I set out prepared
questions, guided by the themes that emerged from the 1st phase survey, in a consistent
manner, interposed with probes designed to elicit more detailed responses. The focus of semi-
structured interviews was a series of broad themes to be covered during the interview to help
direct the conversation toward the topics and issues about which I wanted to learn. The
purpose of the schedule is to ensure the same thematic approach is applied during each
subsequent interview (Bryman, 2015; Coolican, 2013; Mears, 2012; Qu & Dumay, 2011). I
incorporated photo-elicitation to present a consistent series of themes that were to be
discussed based around themes and barriers that had been identified in previous research
(Ertmer, Ottenbreit-Leftwich, Sadik, Sendurur, & Sendurur, 2012; Prestridge, 2012; Sipila,
2013, Zhao et al. (2002) and themes that had emerged from the survey data. These visual
images acted as cues, provoking more in-depth discussion, eliciting more detailed and rich
information from the participant (Fiedler & Posch, 2009; Pink, 2004). The intention was that
the images would provide a way for each participant to convey their vision of the world in the
context of their teaching and experience (Clarke-Ibanez, 2007; Collier, 1967).
87
The rationale for using image-elicitation within semi-structured interviews was to empower
participants in a way unachievable through more traditional methods of data collection, such
as structured interviews, which may have been perceived as hierarchical and distant from the
participants. This approach moved from doing research on participants, to doing research with
participants, recognizing that participants are the experts in their own lives (Bryman, 2015;
Denzin & Lincoln, 2013; Karlsson 2012). Photo (image) elicitation has the potential to illuminate
the lives of participants from their perspective, identifying what is important to them through
the discussion of visual images (Fiedler & Posch, 2009; Pink, 2004) while enabling me to
discover the perceptions they had regarding the integration and use of technology in their
teaching practices.
The semi-structured format enabled me to keep the interview on track as, the alternative of
unstructured interviews, can sometimes lead to rambling and veering off on tangents. While
unstructured interviews may produce rich data, they can also adversely affect the interview if
there are time constraints, as well as generating large quantities of data that could make
transcription and coding more problematic (Bryman, 2015; Coolican, 2013; Mears, 2012). The
use of unstructured interviews may also support the view expressed by some quantitative
researchers that the data produced through qualitative interviews is “unreliable,
impressionistic, and not objective” (Denzin and Lincoln, 2005, p. 12). To these researchers,
interviews are regarded as nothing more than informal routine conversations.
3.5.8 Preparation of interview schedule.
The first stage of preparing for the one-to-one interviews was to identify broad themes that had
been acknowledged from previous research regarding the integration of technology in teaching
practices. Having identified the themes, I then developed eight questions that would form the
central topics of the interview. Having satisfied myself with the questions to be set, I then
searched for images that would reflect three different positions or responses to each question.
The visual images were only to provide cues and prompt more detailed discussion. These
images were moderated independently to try to ensure that they were seen as reflecting similar
viewpoints between the originator and the mediator. The images were modified until there was
agreement on each image. When it was deemed that there were perceived in similar ways for
each of the questions, the interview stage could be progressed (Appendix H).
As I intended that the interviews would be primarily led by the participant, my role was mostly
to keep the discussion loosely on track and ask occasional open-ended questions. The
duration of the interviews was difficult to determine with any precision. I envisaged that they
would be between forty and sixty minutes. Digital recording of interviews allowed me to
88
concentrate on the responses of each participant rather than taking notes; it also enabled more
straightforward transcription and analysis of data.
A pilot interview with a college coordinator was arranged, the coordinator was not part of the
study, but had an insight into the overall project something that had been suggested as
beneficial by Bryman (2015). The pilot interview provided me with experience of using the
interview schedule; it gave more clarity and identified adjustments that were necessary to the
questions, format or sequencing for the actual interviews. After the pilot interview, I was able
to determine the adequacy of the instrument without impact on the sample while I gained useful
feedback as to the performance of the instrument as well as the interviewer (Bryman, 2015).
3.5.9 Phase 3 Data Analysis.
The use of interviews to collect data and subsequent transcription can quickly lead to data
analysis become overwhelming, due to the quantity of data produced in a relatively short time
(Bryman, 2015). The interviews, when completed were transcribed verbatim, after this process
the interviews were then transcribed a further twice to remove fillers and pauses and make
reading and coding easier, an example is included in Appendix I. I selected thematic analysis
as the method of analysis because it is accessible and flexible and as Braun, Clarke, Hayfield,
& Terry (2019) state offers an entry into an area that may be regarded as complex for
researchers that are new to qualitative research.
Thematic analysis is aligned with a constructionist stance recognizing the context of the
situation, identifying themes and patterns across data sets which allows researchers to see
shared meanings or experiences, identifying what is common and relevant to answering the
research questions (Braun & Clarke, 2006).
Through analysis of the two self-administered surveys, the familiarisation process with the data
started. The statistically significant results that were reported began the process of generating
initial codes that were supported by previous research (Ertmer, 2005; Zhao et al. 2002). The
familiarisation process continued through the verbatim transcription of the interviews,
reproducing all spoken words and sounds. Subsequent re-transcription of the interviews
continued for ease of reading and increased familiarisation with the data. Through this process,
themes and sub-themes began to emerge from the detailed reading and re-reading of the
transcripts and listening to recordings of interviews.
The process for generating themes was straight forward and reflected something significant
within the data related to the research question. I used what has been termed bottom-up

89
inductive coding, that is derived directly from the data, as I had no prior knowledge of the
participants’ responses. The alternative, deductive coding, adopts a top-down approach where
ideas and topics are developed before analysis begins. Braun et al. (2019) argue that rather
than this being a binary, either/or decision in how the analysis of data is conducted. It is more
often a combination of approaches, although one will take precedence. A combination of
approaches was used, in reviewing the literature around the study, previous research had
identified many of the barriers that existed regarding integration of technology into teacher’s
practices, and models presented by Ertmer (2005) and Zhao et al. (2002) were used to support
the analysis. Nevertheless, the data was analysed in a way that fairly represents what I saw
and heard, but it cannot be value-free (Lichtman, 2010). The use of inductive or deductive
coding has a bearing on how the data is interpreted and presented. Inductive coding focuses
on the meaning from the participant and researcher while deductive coding focuses on the
data and theory-based meaning Braun et al. (2019). The generation of themes was determined
by using my judgement as I deemed them to emerge from the data with no fixed process
(Bryman, 2015; Braun & Clarke, 2006; Coolican, 2013). Inevitably, the themes are based on
my own set of assumptions and the reality I decided the data represents, in this situation,
transparency is vital (Braun & Clarke, 2006).
3.6 Sample.
In purposive sampling, the participants are deemed to have relevance to the research
questions being posed. Purposive sampling is useful where there is a need to reach a targeted
sample quickly, enabling selection of cases that allowed me to answer the research questions
and was a sampling technique used in similar studies conducted by Ertmer et al. (2012) and
Chen (2008). I selected a subcategory of purposive sampling identified as expert purposive
sampling that involved assembling a sample of participants with known or demonstrable
experience and expertise in the study area. (Bryman 2015; Saunders et al., 2009; Trochim,
2006). The sample assembled for the study consisted entirely of teaching practitioners from
colleges delivering courses in Further and Vocational Education in England.
Research Phase Number of Participants
Phase 1 229
Phase 2 22
Phase 3 11
Table 3.1: Number of participants in each phase of the study.

90
3.6.1 Breakdown of Sample in phase one survey.
Two hundred thirty-two participants submitted survey results; 229 of these submissions were
accepted as valid based on the purposive sampling technique used in the study, three (3) were
discarded. At this time, 92 participants indicated that they would be prepared to participate in
later stages of the project.
Figure 3.3: Selection of phase 1 sample
229 useable data sets
232 completed questionnaires
9 positive responses
27 colleges approached

91
3.6.2 Breakdown of participants in phase 1 survey by independent variable.
Independent Variable Category Number of participants
Age =<29Years 28
30 - 39 years 60
40 - 49 years 70
=>50 Years 71
Years of teaching in F.E. One year or less 10
1 – 3 years 33
4 – 10 years 88
11 – 20 years 71
21 years or more 27
Subject area Academic 69
Engineering 30
Vocational specific 73
Vocational related 12
Computing & design 18
Higher education 7
Table 3.2: Breakdown of participants in phase 1 by the independent variable.
3.6.3 Breakdown of participants in phase 2 survey by independent variable.
Independent Variable Category Number of participants
Age =<29Years 1
30 - 39 years 3
40 - 49 years 9
=>50 Years 9
Years of teaching in F.E. 4 – 10 years 11
11 – 20 years 6
21 years or more 5
Subject area Academic 4
Vocational specific 7
Vocational related 2
Computing & design 8
Higher education 1
Table 3.3: Breakdown of participants in phase 2 by the independent variable.

92
3.6.4 Breakdown of participants in phase 3 survey by independent variables.
Independent Variable Category Number of participants
Age =<29Years 0
30 - 39 years 2
40 - 49 years 2
=>50 Years 7
Years of teaching in F.E. 4 – 10 years 4
11 – 20 years 2
21 years or more 5
Subject area Academic 5
Vocational specific 3
Vocational related 2
Computing & design 1
Table 3.4: Breakdown of participants in phase 3 by independent variable.
3.7 Ethical Considerations.
There are numerous guidelines and fundamental principles that need to be observed when
conducting research which involves people (British Education Research Association (BERA),
2011; Lichtman, 2010). One overarching principle is to do no harm to the participants in the
study; this is central to all of the codes of practice published by professional and academic
research organizations (Bryman, 2015; Coolican, 2013; Gorard, 2013; Hammersley &
Traianou, 2012; Lichtman, 2010). After taking these principles and guidelines into
consideration and developing a research strategy, the project was given ethical approval from
Durham University School of Education Ethics Committee on the 28th April 2017 (Appendix A).
3.7.1 Voluntary and informed consent.
The participants engaged in the study based on the principle of voluntary informed consent
(Bryman, 2015; Coolihan, 2013; Hammersley & Traianou, 2012). Information sheets giving
details of the purpose, processes involved, the nature and rationale for the research, including
who would have access to the results, were distributed to potential participants before any
commitment to take part was given. The details were initially distributed through the institute
coordinator to potential participants, this informed potential participants that they also had the
right to withdraw at any stage before, during or after completion of any stage of the study
(Bryman, 2015; Coolihan, 2013; Sammons, 2005).
93
A statement of acknowledgement of participation on a voluntary and informed basis and giving
permission for the data to be used for the research study was included before the final
submission of data at the end of the survey questionnaire. This satisfied another principle of
ethical research participation that agreement was given without duress or coercion at each
stage of the data collection process. (Bryman, 2015; Coolican, 2013; Sammons, 2005).
Participation was voluntary with no incentives offered or expected, and therefore, I accepted it
was inappropriate to set deadlines that would impinge on the participant’s life (Lichtman, 2010).
3.7.2 Anonymity and Confidentiality.
One of the main pillars of ethical research is the preservation of the anonymity and
confidentiality of participants. It is imperative to protect data collected from participants and
avoid discloser of data without their express written permission (British Sociological
Association, 2017). It was vital to maintain participant anonymity and confidentiality, not only
from an ethical perspective relevant to this study, but to also maintain credibility and goodwill
from the participants for any potential future research projects that may request their
participation (Coolican, 2013).
All references to the institutes and participants were erased from all transcription and
substituted with pseudonyms which is considered as a common technique to maintain
anonymity (Bryman, 2015; Coolican, 2013; Scottish Education Research Association, 2005).
Digital recordings were stored in a secure file location with password protection, and not stored
on any computer with unrestricted or shared access, in line with the requirements of the Data
Protection Act 1998. The use, access and storage of the data was in accordance with the Data
Protection Act 1998 and relevant areas of the Research Governance Framework, as cited in
Bryman (2015 p137).
Whilst anonymity is relatively easy to achieve Coolihan (2013) opines confidentiality, when
applied in a literal sense, would not be of much value in a research environment where data
may be accessed by other researches. In a research context confidentiality means not
disclosing participant information accidentally or deliberately, not discussing information with
others and ensuring that information is presented in a way that prevents identification of
participant (Wiles, Crow, Heath & Charles, 2008).
Open and honest disclosure of the results of the surveys and interviews is another of the main
ethical principles, (BERA 2011; Lichtman, 2010; SERA, 2005) the data was analysed in a
manner that avoided misrepresentation or fraudulent analysis. The data fairly represents what

94
I have seen and heard, but will inevitably reflect my stance, set of beliefs and assumptions; it
cannot be value-free (Lichtman, 2010).

95
Chapter 4 – Results.
4.1 Introduction.
The results presented in this chapter relate to the data collected from the Phase One self-
administered online questionnaire. This questionnaire examined perceived self-efficacy
regarding the use of technology in preparation for lessons and classroom practices. The
second section examined potential barriers to the integration of technology identified by
teachers in the study and evident in previous research. The final section focused on Continued
Professional Development (CPD) offered or undertaken by teachers in the study that had
relevance to teacher self-efficacy in technology use.
The data was analysed using One-Way between-subjects ANOVA to identify any statistical
significance using a range of dependent and independent variables. The dependent variables
were associated with five main topics, teacher’s confidence in performing specified tasks using
technology, the frequency and type of engagement that teachers had with technology in their
teaching practices, perceived barriers that existed to the integration and use of technology in
the classroom and CPD or training that had been offered or undertaken. The one-way
between-subjects ANOVA used Age, Subject Area, and Teaching Experience as three
independent variables, the results are presented in the following three sections under general
themes that have been identified using only statistically significant results at the <0.05 level.
The results presented here provide an overview of results for ease of readability; there are a
full set of all results contained in Appendix E.
The presentation format for each series of analysis will be an introduction followed by a
summary table of findings and a short interpretation of the findings.

96
4.2. Teachers perceived self-efficacy in using technology for teaching preparation
and delivery.
4.2.1 Introduction.
Self-efficacy (section 2.4.8) has been defined as the belief an individual has about their
capabilities to perform a specific action or as having the skills necessary to perform a specific
behaviour (Bandura 1995; DiClemente et al., 2009). An individuals' efficacy expectations are
significant as it determines the initial decision to perform a behaviour, the effort expended and
the individual's persistence in the face of adversity (Bandura, 2006). Research concluded that
efficacy in technology in general, using word processing, email and browsing the web, has not
translated into the integration and use of technology in the teaching and learning environment
(Lau & Yuen, 2013; Messina & Tabone, 2013; Shawer, 2013). Self-efficacy is considered a
second-order barrier as identified by Ertmer (1999) and as a barrier within the teacher domain
by Zhao et al. (2002).
In section 2.5, several factors were identified as determining whether an individual will adopt
technology (MacCallum et al., 2014; Rogers, 2003; Saadé & Kira, 2007; Straub, 2009).
Teachers must see a tangible benefit for them (the teacher) from integrating technology into
their classroom practices to begin to modify their beliefs and attitudes toward technology
integration and use (Brown et al., 2012).
The results presented below include a summary table of results (Table 4.1), and a brief
interpretation of the statistically significant results concerning the teachers perceived self-
efficacy in using technology for tasks associated with teaching preparation and delivery, a full
set of results are in Appendix E.
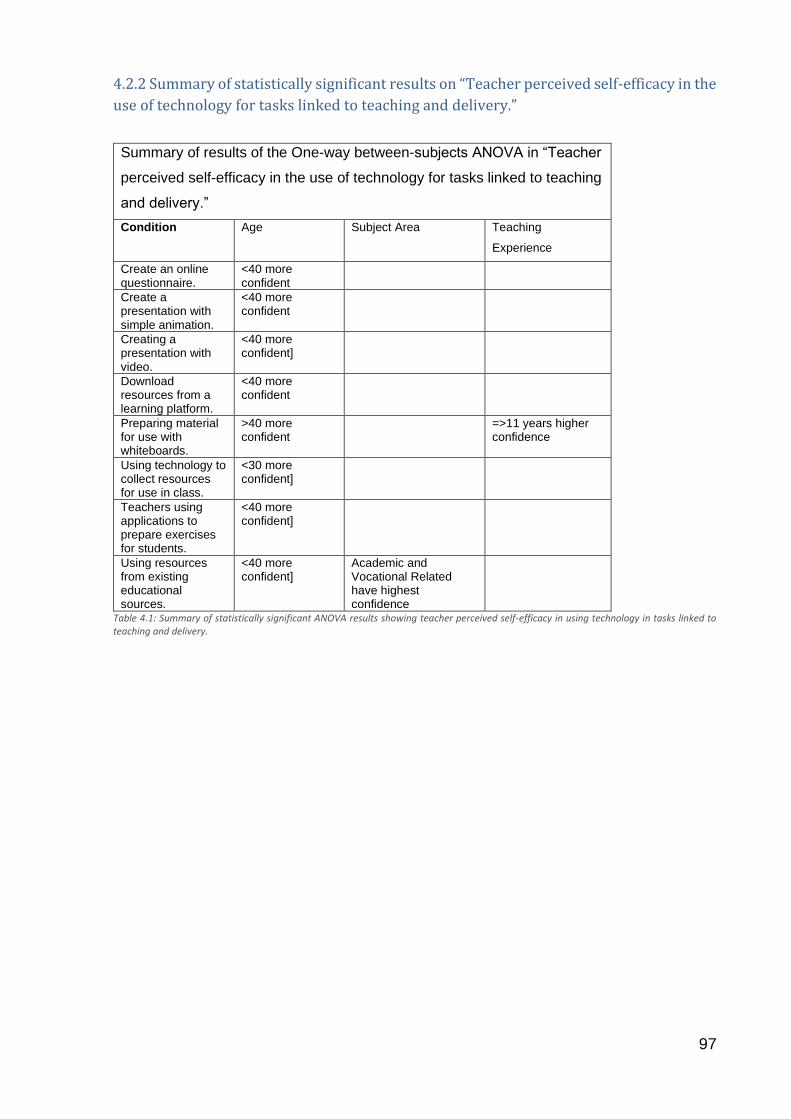
97
4.2.2 Summary of statistically significant results on “Teacher perceived self-efficacy in the
use of technology for tasks linked to teaching and delivery.”
Summary of results of the One-way between-subjects ANOVA in “Teacher
perceived self-efficacy in the use of technology for tasks linked to teaching
and delivery.”
Condition Age Subject Area Teaching
Experience
Create an online questionnaire.
<40 more confident
Create a presentation with simple animation.
<40 more confident
Creating a presentation with video.
<40 more confident]
Download resources from a learning platform.
<40 more confident
Preparing material for use with whiteboards.
>40 more confident
=>11 years higher confidence
Using technology to collect resources for use in class.
<30 more confident]
Teachers using applications to prepare exercises for students.
<40 more confident]
Using resources from existing educational sources.
<40 more confident]
Academic and Vocational Related have highest confidence
Table 4.1: Summary of statistically significant ANOVA results showing teacher perceived self-efficacy in using technology in tasks linked to teaching and delivery.
98
4.2.3 Interpretation of results from Analysis of Variance into teachers perceived self-
efficacy in using technology for teaching preparation and delivery.
We can see from the data (Table 4.1) that age played a significant part in how confident the
teachers in the study felt about the overall use of technology in their classroom practices.
Several separate analysis’ of variance were carried out yielding ten statistically significant
results at the <0.05 level. There is a general pattern; eight out of the ten results suggested that
age is directly related to the level of confidence of individual teachers in tasks linked to the use
of technology for teaching and delivery. Further, it is noteworthy that seven out of the eight
results indicated that younger teachers, under the age of 40, were more confident in using
technology for tasks related to teaching preparation and delivery.
A second significant set of findings indicates that when it came to using technology to collect
resources to be used in classroom delivery all teachers under 30 years of age indicated that
they collected resources in this way often or all of the time. Teachers aged 30 years and older
used technology less frequently, and some teachers never or rarely collected resources for
use in this way.
Similar findings can be observed for when it came to using technology in the preparation of
tasks for students, teachers under 40 years of age were more likely to use technology in the
preparation of tasks for students than teachers aged over 40 years of age.
When it comes to sources of material used for the preparation of resources it can be seen from
table 4.1 that teachers under 40 years of age and teaching in Academic and Vocational specific
subject areas were more likely to use resources from existing educational sources than were
teachers aged 40 years of age and older and other subject areas. It was not possible to
determine if there was any relationship between the age of the teacher and subject areas
through the analysis conducted at this time.
Similarly, age effects contributed to the ability to carry out a range of tasks using technology.
Teachers under the age of 40 years were more confident in being able to create an online
questionnaire than participants aged 40 years and over, similarly, they felt a higher degree of
confidence when incorporating animation or video into presentations. Furthermore, the under
40 years age groups felt more confident downloading resources from websites and learning
platforms than teachers aged 40 years and over.
The analysis of variance carried out for the confidence of teachers in preparing materials for
use with interactive whiteboards produced two statistically significant results at the 0.05 level,

99
one based on age and the other on teaching experience. Teachers aged 40 years and older
were more confident in creating materials for use with Interactive White Board technology than
teachers in the 40 years and younger age group.
Teachers with more than 11 years of teaching experience also expressed more confidence in
this task than teachers with less than 11 years of teaching experience. Teachers with more
than 11 years teaching experience would have been working the sector when IWB’s were
being introduced and may have undergone specific training in their integration and use, but it
is not possible to determine this based on the analysis completed at this time, similarly teachers
aged 40 years and over may have undertaken similar training, but again it is not possible to
confirm this at this time.
4.3 Barriers and facilitators to support the use of technology in Further/ Vocational
Education?
4.3.1 Introduction.
The integration of technology takes a considerable commitment and fundamental changes to
teaching practices that cannot happen in the short term (Chandra & Mills, 2015). Even when
teachers are enthusiastic about integrating technology into their teaching practices, many
abandoned the technology due to frustrations and barriers, perceived or real that cannot be
overcome or dismissed. The type and complexity of barriers were identified in section 2.3 and
2.4 earlier. The phase one questionnaire considered many of the factors previously identified
as potential barriers from previous research. These areas included many first-order barriers
(Ertmer, 1999) and the technological infrastructure aspect of the context domain identified by
Zhao et al. (2002). These reflect resources, training and CPD in the use of technology and
teacher efficacy in the use and application of technology in their teaching practices.
The results presented below include a summary table of results (Table 4.2) showing the result
and mapping the result against the models identifying first and second-order barriers (Ertmer,
1999; Prestridge, 2012) and Zhao et al. (2002) conditions for classroom technology integration.
There is then a brief interpretation of the statistically significant results concerning the
perceived barriers to the integration of technology into classroom practices, a full set of results
are in Appendix E.
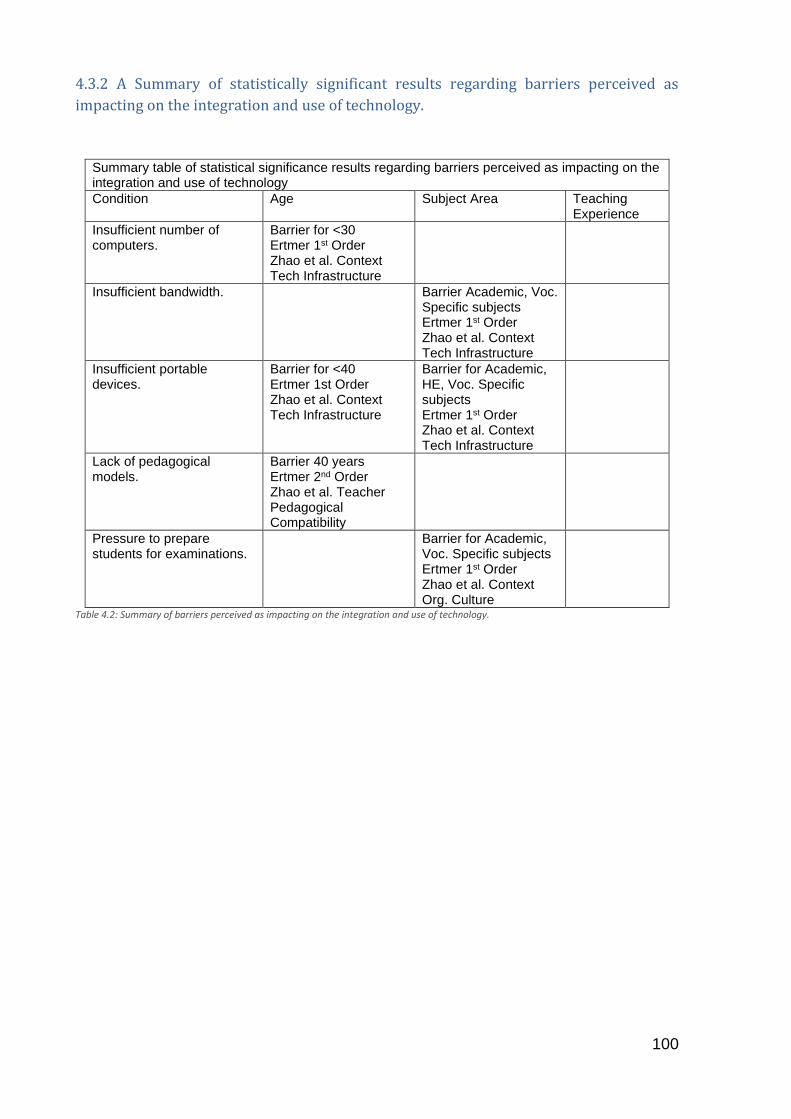
100
4.3.2 A Summary of statistically significant results regarding barriers perceived as
impacting on the integration and use of technology.
Summary table of statistical significance results regarding barriers perceived as impacting on the integration and use of technology
Condition Age Subject Area Teaching Experience
Insufficient number of computers.
Barrier for <30 Ertmer 1st Order Zhao et al. Context Tech Infrastructure
Insufficient bandwidth. Barrier Academic, Voc. Specific subjects Ertmer 1st Order Zhao et al. Context Tech Infrastructure
Insufficient portable devices.
Barrier for <40 Ertmer 1st Order Zhao et al. Context Tech Infrastructure
Barrier for Academic, HE, Voc. Specific subjects Ertmer 1st Order Zhao et al. Context Tech Infrastructure
Lack of pedagogical models.
Barrier 40 years Ertmer 2nd Order Zhao et al. Teacher Pedagogical Compatibility
Pressure to prepare students for examinations.
Barrier for Academic, Voc. Specific subjects Ertmer 1st Order Zhao et al. Context Org. Culture
Table 4.2: Summary of barriers perceived as impacting on the integration and use of technology.

101
4.4.3 An Interpretation of Statistically Significant Results of perceived teacher barriers to
the integration of technology into classroom practices.
We can tell from the data (Table 4.2) that age and subject area played a significant part in the
identification of barriers that were perceived to exist by teachers in their classroom practices.
Several separate analysis of variance were carried out yielding six statistically significant
results at the <0.05 level; three out of the six results related to age and the remaining three
results related to subject area. There was one condition where age and subject area both
revealed statistically significant results. e subject area being taught.
Insufficient number of computers acted as a barrier to the integration of technology into
teaching practices for teachers up to the age of 30 years of age than for teachers in any other
age group. When mapped across to the two models identified earlier lack of hardware was
identified as a first-order barrier by Ertmer (2005) and Prestridge (2012) and was aligned with
the context domain presented by Zhao et al. (2002) occupying a position within technology
infrastructure.
Analysis of the data regarding the access and availability of portable devices teachers under
the age of 40 years perceived this first-order barrier to be a significant inhibitor of technology
use and integration than teachers aged 40 years of age or older, this barrier is identified by
Zhao et al. (2002) as within the context domain of technology infrastructure.
The lack of portable devices was considered a barrier to technology integration in teaching
practices by teachers in academic, higher education and vocational specific subject areas
more than in other subject areas.
The analysis of variance for insufficient bandwidth being a barrier to technology integration
showed that teachers in Academic and Vocational Specific subject areas perceived this to be
a barrier more than other subject areas. Insufficient bandwidth is a first-order barrier (Ertmer,
2005) and within the context domain as technology infrastructure (Zhao et al., 2002).
Teachers within the Academic and Vocational Specific subject areas perceived that pressure
to prepare students for examinations was a barrier to technology integration in classroom
practices. Ertmer (2005) and Prestridge (2012) considered this to be a 1st Order barrier related
to lack of time while Zhao et al. (2002) believed this barrier was related to the organisational
culture within the context domain.
102
4.4 Technology related Continued Professional Development (CPD) - Teacher
Participation.
4.4.1 Introduction.
It is often incorrectly assumed that competency in using digital technology in everyday
applications is somehow ample to be able to use technology effectively in teaching (Prestridge,
2012). Such assumptions may contribute to a perception among teachers that there is a
general lack of support and training for the effective integration of technology into teaching and
delivery. It has been suggested that eighty hours of specific continued professional
development (CPD) is required before teachers can begin to integrate technology effectively
into their teaching (Carlson & Gadio, 2002) while Marcinkiewicz, (1993), suggests that it will
take up to six years before teachers can fully acquire the expertise to use technology
effectively.
Research conducted previously concluded that some of the anxiety exhibited by teachers,
when faced with technology integration into their teaching practices, is down to the lack of
training and resultant lack of efficacy (Celik & Yesilyurt, 2013). Regardless of the benefits, real
or perceived, of technology-supported education, the level of training given to teachers on how
to use technology in education and the classroom practice remains limited (Al-Senaidi et al.,
2009; Lee, & Tsai, 2010). Lack of training has been identified (Ertmer, 2005; Prestridge, 2012;
Zhao et al., 2002) as a barrier contributing to the lack of integration of technology by teachers.
The results presented below include a summary table 4.3 and a brief interpretation of the
statistically significant results at the <0.05 level, concerning teacher participation in training
and CPD related to technology use and integration. A full set of results are in Appendix E.

103
4.4.2 A Summary of statistically significant results regarding participation in training and
CPD courses.
Summary table of statistically significant results of teacher participation in training and CPD courses.
Condition Age Subject Area Teaching Experience
Introductory courses on internet use and general applications
Under 30 less likely <11 years of experience less likely to participate
Equipment specific training
<4 years of experience less likely to participate
Subject-specific courses
Under 40 less likely <11 years of experience less likely to participate
In-house training Under 40 less likely <11 years of experience less likely to participate
CPD training provided from external sources
Under 40 less likely <4 years of experience less likely to participate
Table 4.3: Summary of ANOVA results showing statistically significant results for participation in training courses.
4.4.3 Interpretation of statistically significant results regarding participation in Training
and CPD.
From the results presented in the data (Table 4.3), age and teaching experience acted as a
significant factor in whether teachers took part in different CPD courses related to the
integration of technology into their teaching practices. Several separate analysis of variance
were carried out yielding nine statistically significant results at the <0.05 level. The results
showed a pattern where age is directly related to the participation in CPD courses in 4 of the
results. Teachers aged under 40 years are less likely to participate in the CPD courses related
to the integration of technology than teachers aged 40 years and over. Furthermore, there was
a similar pattern of 5 statistically significant results related to teacher experience that showed
that teachers with more teaching experience were more likely to participate in the technology
integration CPD courses than teachers with the least teaching experience.

104
4.4.3.1 Introductory courses on internet use and general applications.
When it came to taking part in introductory-level courses in computers, internet use and
general applications teachers in the age group under 30 years of age were the least likely to
undertake this type of CPD course. As the age of the teachers increased, so did the levels of
participation. When teacher experience was analysed teachers with 11 years of teaching
experience or more were more likely to undertake these courses, teachers with less than 11
years of teaching experience had lower levels of participation.
4.4.3.2 Equipment specific training.
The results showed that teachers with less than four years of teaching experience were the
least likely to take part in equipment-specific training. The more teaching experience teachers
had, the more likely they were to undertake this type of CPD.
4.4.3.3. Subject-specific courses.
The data results presented in Table 4.3 suggests that teachers aged under 40 years of age
were less likely to participate in subject-specific training using technology than teachers aged
40 years or older. The analysis of data regarding teacher experience showed that teachers
with less than 11 years of teaching experience were less likely to participate in subject-specific
training courses involving technology than teachers with 11 years or more experience.
4.4.3.4. In-house training.
Teachers aged under 40 years of age were less likely to participate in in-house training courses
than teachers aged 40 years and over. Teachers with less than 11 years of teaching
experience were less likely to participate in in-house training courses than participants with 11
years or more teaching experience.
4.4.3.5 CPD training provided from external sources.
The results show that respondents aged 40 years and older were more likely to participate in
externally provided training. The results indicate that participants with less than four years of
experience are more unlikely to participate in CPD courses provided by external bodies.
Participants with more than four years of teaching experience are more likely to participate in
externally provided CPD courses.

105
4.5 Summary.
The results presented in this chapter relate to the data collected from the Phase One self-
administered online questionnaire and was used to develop the interview schedule by
providing background data on teacher’s experience of using technology in their teaching
practice. Analysis of the data showed the effect of age to be the most statistically significant
factor, younger teachers under the age of 40 years of age considered themselves more
confident in using technology than teachers aged 40 and older. Teachers aged under 40 years
of age were the least likely to participate in technology-related continual professional
development courses and identified more barriers to the integration of technology into their
teaching practice than older teachers. Furthermore, analysis of teaching experience showed
that teachers with more teaching experience were more likely to participate in the technology
integration CPD courses than teachers with less teaching experience. There were two subject
areas Academic and Vocation Specific subjects that identified barriers related to the integration
of technology.
From the analysis of the data from the online questionnaire, it was possible to build a more
detailed picture of the participants in the study and develop an interview schedule for use
during the semi-structured one-to-one interviews. The results of the interviews are presented
in the following chapter and were a result of using thematic analysis and bottom-up inductive
coding that is derived directly from the data. The themes that emerged related directly to the
central area of the study that investigated the thoughts and beliefs of teachers in the post-
compulsory colleges regarding the integration and use of technology in their teaching practice.

106
107
Chapter 5 - Thematic Analysis.
5.1 Introduction.
The main aim of the study was to investigate the beliefs and attitudes of teachers working in
Further and Vocational Education colleges concerning the use and integration of technology
into their teaching practices. The initial data collection process was through the distribution and
completion of an online self-administered questionnaire (Appendix D) and detailed in section
3.4.3.
Several one-way between-subjects ANOVA related to the continued professional development
(CPD) provided and undertaken by teachers in the use of technology were carried out the
results are in section 4.4. The data was analysed regarding perceptions of potential barriers to
the integration of technology into teacher practice and the results presented see section 4.3.
Section 4.2 shows the results of the one way between-subjects ANOVA regarding teachers
perceived self-efficacy in performing specific tasks using technology in the professional
practices.
The selected method, a self-administered questionnaire, was intended mainly to facilitate the
development of the interview schedule by providing background data on teachers experience
of and with technology in their teaching practice and identifying themes from the data similar
to a methods as used by Sipila (2010, 2013).
After the analysis of the 1st phase survey, a second survey was compiled to obtain additional
data that would give a sense of the people taking part in the study and working in the colleges
taking part. It would also be possible to compare the teacher profiles with a more extensive
survey, from the Education and Training Foundation 2017 Report, to determine whether the
sample was comparable with the wider Vocational sector and exhibited similar characteristics.
However, there could be no claim that such a small sample was representative of the sector
at large. There were 21 completed surveys, on completion of the 2nd self-administered survey,
the participants were approached to determine if they were willing to participate in one to one
semi-structured interviews. Eleven teachers participated in the one-to-one interviews the data
from which form the basis of this chapter.
Through a process of iterative analysis of the interview transcripts, recurring themes emerged
from the interviews data. These themes were extrinsic barriers; within this theme were six
identified sub-themes presented in section 5.2.1. The next theme that arose was intrinsic

108
barriers with the interview data reflecting efficacy and core beliefs of teachers. This theme
contained nine sub-themes presented in section 5.2.2. The role and perception of technology
was the next theme to appear see section 5.3, showing how teachers use technology in their
teaching practice and the perceived usefulness that technology had in their teaching. The final
theme that came out of the interviews concerned the management of the integration of
technology in the colleges and how the integration is affected by external forces, internal
decisions related to technology integration, management style and college culture (section
5.4). The diagram below, Fig 5.1, shows the barriers and themes that emerged from the
interview data.

109
Figure 5. 1: Barriers and Themes from Interview Data

110
5.2 Identified barriers to the integration of technology.
The first theme identified from the one to one interviews related to the perceived barriers that
exist to the integration and use of technology by teachers. First-order barriers are extrinsic and
can be quantified in some way, lack of resources, lack of training, poor technical support, I.T.
infrastructure, connectivity and bandwidth availability and lack of time. Second-order barriers
are more intrinsic and can change depending on the context, they are difficult to measure and
are concerned more with feelings, beliefs and attitudes of teachers (Ertmer, 2005; Prestridge,
2012). The binary nature of the barriers, presented by Ertmer (1999) in section 2.3.3.1, were
further developed by Zhao et al. (2002) in section 2.3.3.2 and expanded and presented as
three domains that contained 11 factors that were deemed to act as barriers to technology
integration in the classroom.
5.2.1 Extrinsic Barriers to technology integration.
Many barriers to technology integration are extrinsic and centred principally around
quantifiable facets. Although there has been continued investment from governments, extrinsic
barriers continue to exist and remain a continued source of frustration to teachers (Akcaoglu
et al., 2015; Cárdenas-Claros & Oyanedel, 2015; Goktas et al., 2013). The integration of
technology takes time to become effective; it requires changes to move from teacher-centred
to learner-centred approaches and cannot be achieved in the short term (Chandra & Mills,
2015). Even when teachers are enthusiastic about using technology, there remain many
barriers to successful integration into teaching practices.
In this section, I present the data that relates to the extrinsic barriers that were reported by the
teachers taking part in the study and compare these too previous research presented by
Ertmer (1999) and Zhao et al. (2002) and other research discussed previously in the literature
review, see section 2.4. 6 topics emerged from the data and were categorised as extrinsic
barriers to technology integration.

111
5.2.1.1 Lack of resources.
Successive U.K. governments have continued to invest in technology in education, and many
of the identified extrinsic quantifiable first-order barriers (Ertmer, 1999) see section 2.3.3.1 or
deficiencies in technical infrastructure (Zhao et al., 2002) see section 2.3.3.2 have reduced,
although not eliminated. Technology is now standard in classrooms across all sectors within
education. Nevertheless, there continues to be shortages or limited classroom access to
technology (Plesch et al., 2013; Prestridge, 2012), this perceived barrier concerning resources
was the first theme with three sub-themes to emerge from the interview data. The first of the
sub-themes related to resources concerns access to technology.
Access to resources.
Teachers in the colleges perceived restricted access and limited resources to be a barrier to
the integration of technology into their teaching practice. All the interviewees expressed
concerns that lack of resources acted as a barrier to technology integration.
The following quote from Philip is representative of the interview participants and typifies the
feelings of frustration with the lack of resources or access to resources identified by teachers
in the colleges.
I would like to use it more, but don’t teach in any computer rooms, computer rooms
[are] few and far between. If I had a computer room, I would use all the resources
online and that are out there. Not one Maths or English teacher has a computer
room while the vocational staff float between them, but their resources and
submissions are on the VLE. We have paper-based exams (Philip).
Lynn also highlighted this issue.
I work in very few rooms with computers in, resources are limited, and [the]
assumption is that every student is computer savvy and have personal resources
to use. We don’t have enough resources in terms of hardware to allow access for
all the students (Lynn).
Although technology was available, there was a perceived need to downsize or upgrade
the type and specification. The specification and type of technology acted as a barrier
to integration for some teachers in all colleges; the following quotes highlight the issue.

112
I think we could have more rooms kitted out, less so with desktops and start using
smaller technology. I’d probably want more rooms to move over to that [smaller
technology] now because I think that’s [the] technology we’ve got [now] (Mike).
One of Mike’s colleagues supported this observation concerning the type of technology
available and the barriers it presents to their teaching.
I would have computers available for the students, but what we have [are]
desktops, the kids have to look over the desktops to see the board, and it’s very
intrusive when you’re teaching (Rose).
The nature of Vocational Education exacerbated the lack of resources with popular or high
demand courses attracting high numbers of students leading to a scarcity of resources at
certain times in one rural campus.
We have some large cohorts with 160 students and trying to cater for enough I.T.
for those students to have it when they want it, even though we have lots of
resources, it still is a challenge for planning and programming (Peter).
Financial constraints have resulted in a change in college management's approach regarding
the provision of resources; Don identified this, but the issue raised concerns in other colleges
from some of the teachers during the interviews.
I’ve been here, this is my sixth year, and most of the rooms were kitted out with
electronic whiteboards that I presume had been in since the college started up
(eight years previous). They’ve taken those out and replaced them with TV’s; I
don’t know why that is, I don’t know whether the contract that they had is up or
whether they just became too costly to replace. I would guess that they’d be coming
to the end of their natural lives, but yea last year or the year before there was a
whole process of taking out the electronic interactive whiteboards and replacing
them with TV’s, it just acts as a monitor (Don).
One consequence of changes in the provision of resources by colleges has been an increased
reliance on students having access to personal devices to supplement this lack of provision by
the colleges. This situation has created another barrier related to lack of resources shown as
the digital divide in the following sub-theme concerning resources.

113
Digital Divide.
The digital divide (section 2.4.1) describes the unequal access to technology which creates a
gap between the “haves” and “have-nots.” Poor, less able or disadvantaged students are less
likely to have equal access to technology, this has a knock-on effect on their ability to learn
and develop (Clayton & Macdonald, 2013; Hohlfeld et al., 2017; Zhang, 2014).
One college faced this specific issue that acted as a barrier to technology integration when
there were not enough resources supplied or available in the college.
The big elephant in the room is poverty; I work with refugees; I work with long term
carers. Some of them don’t have smartphones, not in this area (Lynn).
There was a level of consistency in the same college with another teacher expressing similar
views that the digital divide created a barrier to technology integration.
If I use the phones in the classroom, some kids don’t have them, and I can’t always
get my hands on a tablet to aid them so sometimes it can become exclusive. Some
kids can almost be excluded from the activity unless they work with their friend
using one phone between two, and that always doesn’t go down well (Philip).
Limited access, as shown above, creates one set of barriers, but uncontrolled or uncoordinated
access also creates barriers to teachers when trying to integrate technology into their teaching
practice. The final sub-theme related to lack of resources is the disruption caused when
students use or are encouraged to use personal devices to supplement the lack of resources
available in the college.
Disruption from use of technology.
Continual distractions disrupt teaching and learning (Bellur et al., 2015; Fried, 2008). Potential
disruption during classes caused by the use of technology was considered to be a barrier to
technology use and integration by all teachers across every site. This situation worsened when
there was a lack of resources provided by the colleges and a reliance on students having
personal devices to supplement this lack of provision.
The following quotes are representative of the interview data and illustrate the concerns
expressed across all colleges by all of the participants.

114
There is an issue with students using the mobile phones for other purposes than
education. That is really the only negative, if students are using I.T. [for] the right
purposes it is a benefit but [it] could be a nuisance and classroom management
and discipline could be issue (Peter).
Students using personal mobile devices for none learning activities raised concerns from
another teacher in a different college.
The risk is with the tablets and phones is that they are not doing what I am asking
them to do (James).
The use of personal devices, it was suggested, had changed classroom dynamics and
management.
Classroom management has totally changed, it has come from kids jumping on the
tables and making a noise to this low level which is worse, so much worse, because
they are like this all the time, [Looking down as if texting on the phone]. They’re not
noisy they are sitting there, they’re quiet if you want them to be, but totally
disengaged, and if you ask them to work on the computers I have to be standing
at the back of the room, so you can see all of the screens because they are on
Facebook or check their emails (Rose).
Nancy experienced students not using technology as she wanted when they were allocated
work or tasks to complete but could easily identify when they were not working as expected.
You do sort of monitor, and I have caught them, I usually do a wander around, and
it’s when you see them sat smiling that’s a giveaway, why are you smiling at a
piece of research about death? It’s a dead giveaway (Nancy).

115
5.2.1.2 Access to training.
Specific training in the use of technology for teaching purposes is important in determining
whether teachers adopt and integrate technology into their classroom practice and lack of
specific training can manifest itself as a barrier (Donnelly et al., 2011; Keengwe et al., 2008;
Prestridge, 2012).
Zhao et al. (2002) identified this type of barrier as being within the context and teacher
domains, while Ertmer (2005) considered this to be a first-order barrier. According to Jones
(2004), teachers feel reluctant to use computers if they lack confidence. “Fear of failure” and
“lack of technology knowledge” have been cited as some of the reasons for teachers’ lack of
confidence in adopting and integrating technology into their teaching (Balanskat & Bleamir,
2007). Access to training was the second theme to appear from the interview data with two
sub-themes identified by teachers as perceived barriers the first of which was the nature of the
training provided as CPD and the second being the source of the training. All of the teachers
interviewed highlighted the need for training in how to use technology for teaching purposes
to be vital to its integration.
Nature of training provided as CPD.
When training is targeted and specific to the user in the context of teaching and learning, then
it can be beneficial and informative and lead to teachers becoming positive and integrating
technology in a way that many stakeholders envisaged as stressed by Rose who had
undergone such a training programme.
I taught in America for a few years, and we went on a week’s training on how to
use, prepare materials, all sorts of stuff using the whiteboard and I think that is the
best thing anyone has ever done for my teaching and use of IT, because you don’t
know it’s there unless you are pointed in that direction. I’m lucky because I had that
experience so I can, I think I can use any whiteboard, but I know a lot of us do use
it [only] as another powerpoint projector. I think I am able to use it a bit more than
a lot of my colleagues; they don’t even try (Rose).
The training provided during many CPD sessions did not prepare teachers to utilise technology
in their classroom practice and as has been previously identified proficiency in using
technology, in general, is a reliable indicator of technology use in the context of teaching and
learning (Lau & Yuen, 2013; Messina & Tabone, 2013; Shawer, 2013). Teachers across all

116
campuses and colleges identified lack of training in how to use technology in teaching as a
barrier to technology integration.
The formal training I have had is on how to switch the whiteboard on and get things
on there, so it's always a bit [of] trial and error really. We do get I.T. support if things
don't work, but in terms of training; [it] isn't amazing. (James).
The previous quote from James represents a general sense amongst the interviewees
that training on how to use technology in teaching is essential.
I have had an hour training on the Itouch board, but you need a week or a fortnight
on it possibly. [There is] training within the college, but not long enough to take it
all in, lots of people say the same (Nancy).
While teachers in the study stated that the training provided did not always satisfy their
requirements, Mike did suggest the type of training that could support the integration of
technology.
I would make sure that people were pretty well trained in up to date packages. I
would give everybody a [personal training] strategy and say to them well think
about those areas in your curriculum where you can integrate this and identify
which ICT tool are going to be most effective (Mike).
Teachers in the study not only identified the type of training provided as being a barrier to
technology integration, but also the trainers conducting the training sessions as potentially
creating a barrier.
Source of training and training providers.
It was not just the content and the whole group approach to training and CPD that concerned
and discouraged teachers, the training format and timetabling also raised concerns and
barriers. How CPD was delivered and when it was delivered concerned some teachers in
different colleges.
Gill identified a detail related to CPD that concerned her and which acted as a barrier.

117
Avoid I.T. lecturers who make assumptions on peoples understanding, [provide]
jargon-busting user-friendly sessions where people are not made to feel stupid
because they are not technologically able (Gill).
Lynn also raised the decisions regarding the type and delivery of CPD.
College CPD is mandated and not specific to the needs of teachers to address
specific requirements. It’s not a lack of training I think sometimes its’ how the
training is delivered. Sometimes we’ll be talked at for an hour, but we won’t actually
do. It wasn’t until you actually had to develop your own [material] that you were
like, how the hell do we do this (Lynn).
Gill went further and questioned the importance attached to CPD in general when it was not
given a specific timetable slot and was delivered between the end of the teaching day and
before the evening classes began.
If the college were to say this training is to be put on, they need to make it easy for
people to access, give them the time don’t make them stay from 4.30 – 6.00 for
training sessions (Gill).
Don raised the issue of the importance attached to technology related CPD specifically when
he observed.
I don’t think that it’s [I.T.] got the same profile as it had, I think that maybe it’s
declined and I don’t know, there might be more of a thing now where people just
assume that you know, you know it might just be my perception, but I think if we
sort of rated where IT was on the importance agenda if you like, I think it’s probably
fallen down it’s probably to do with just maybe we take it for granted now (Don).
The previous section has identified many different perceptions of teachers in the study that
CPD involving technology is not specific to the effective integration into their teaching and
delivery. An additional barrier was the lack of adequate technical support.

118
5.2.1.3 Lack of Technical Support.
Recurring technical maintenance, upgrades, faults and equipment malfunctions lead to lower
levels of technology use by teachers. Technology failures, or the expectation of failures
occurring during lessons, are likely to reduce teacher confidence and cause teachers to
abandon technology in future lessons (Buabeng-Andoh, 2012; Jones, 2004, Snoeyink &
Ertmer, 2001). Lack of technical support was identified as the third theme from the interview
data with two facets perceived to act as a barrier to technology integration. These sub-themes
were presented as the I.T. support that was available to teachers and an additional barrier
created due to having to share resources among different teachers and courses within the
college.
Zhao et al. (2002) identified lack of technical support as a barrier aspects of which were within
both in the teacher domain and the project domain while Ertmer (2005) considered lack of
technical support to be one of the first-order barrier to technology integration.
I.T. Support Available.
All colleges had internal I.T. departments that provided support for technical issues, faults and
breakdown of equipment, the support was limited to addressing these technical breakdowns,
but there were differing perceptions of the effectiveness of the support available. Ray indicated
that this type of support was not sufficient and did not enable him to use interactive software
because the level of support needed during its use was not available.
I’m thinking of running a Jaguar programme, but need an I.T. technician that knows
it and is on hand when things go wrong, it’s a collaboration with IT support, but we
don’t have that. They’re very good, they always come along and try to fix
something, but they are under a lot of pressure, A lot more support is needed on
the I.T. front (Ray).
Main college campuses did have greater access to I.T. departments when they needed it,
because of the centralisation of the support functions in colleges, as shown by the comments
below from teachers in two different main college campuses.
We do get IT support if things are dead if you switch a button and nothing comes
on, but you only have to make one phone call, and they’ll be out to sort the volume

119
out or sort the sound out, if there’s a hardware issue rather than enhancing your
teaching (James).
This perception of the technical support available appeared to be consistent with other colleges
where teachers worked in centralized campuses.
There is this support in the background, if you’re struggling somebody will be there
to maybe, give you a hand, so it’s only a phone call or an email and they’re happy
to support you with anything really (Nancy).
Nevertheless, lack of support was difficult to address when teachers were working in satellite
campuses where they perceived they were more isolated and lacked the necessary access to
help.
We have limited support from IT because the team is not very big and they have a
big workload with all three sites; we had support all week during Ofsted. They try
most of the time to get us a techie for the morning. Doesn’t always work because
the team isn’t very big (Gill).
Shared Resources.
Teachers perceived that shortage of staff in the I.T. departments but caused issues that acted
as barriers. The workload within the I.T. departments determines the performance of the
technology in the classroom and unscheduled upgrades, breakdowns and shared resources
can create barriers for teachers. The following quotes reflect the concerns of teachers taking
part in the study in two of the colleges.
Generally, it’s quite good and reliable. We have to share classrooms so it may not
always be working or able to work. We have no set rooms we might be in a
classroom that we haven’t been in since last week. Computers do upgrades at any
time [its] not planned to be done out of teaching time because they are turned off
[after each class] (Don).
The problems caused by sharing resources, highlighted by Don, was perceived as a
barrier for Ray, in a different college, he noticed the differences with his previous
experiences in schools.
As a schoolteacher, your interactive whiteboard is yours; your classroom is your
domain, you manage it, nobody else is going to come in there and mess it up.

120
Whereas here because all classrooms are used by all manner of people, things go
wrong here a lot more with the IT. I’ve got a room at the moment which I’ve had
[to] unplug it [I.T.] because it’s doing all sorts of weird things and stopping me
teaching (Ray).
5.2.1.4 Absence of Pedagogical Support.
A lack of support from dedicated, specialized staff experienced in integrating and using
educational technologies in different subject areas that are capable of identifying and
implementing effective digital pedagogies acts as a barrier to technology integration (Akcaoglu
et al., 2015; Cárdenas-Claros & Oyanedel, 2015; Goktas et al., 2013). Absence of pedagogical
support was the fourth theme to arise from the interview data and was perceived to be a barrier
for teachers in the study.
Zhao et al. (2002) considered this type of barrier as being within the realms of all three
domains, within the teacher domain it was a barrier due to an incompatibility with the teacher's
pedagogical beliefs. It reflected n the project domain as the distance the project deviates from
the dominant set of values, pedagogical beliefs, and prior educational practices and
experiences of the teachers. Within the context domain, the barrier sat within the human
infrastructure. This barrier could be reduced or eliminated by having flexible, responsive and
identifiable people who can help the teacher understand and use technologies for their own
classroom needs. Ertmer (2005) identified pedagogical beliefs as a second-order barrier.
Previous research identified the timescale and commitment to specific CPD related to
classroom practice and pedagogies required to integrate technology into teaching practices
effectively (Carlson & Gadio, 2002; Marcinkiewicz, 1993). The scarcity of support and time to
integrate technology effectively has resulted in a situation where classroom practices have
remained largely unchanged (Akcaoglu et al., 2015; Shin, 2015).
The interviews identified the need for support and CPD directly related to the use and
integration of technology for teaching in the classroom. Teachers in the study were consistent
in their identification of the type of specific support that they perceived would enable them to
integrate technology into their teaching practices effectively.
When I arrived here, we had a member of staff who would give help and advice
and support, and he used to do a lot of the staff development sessions. I don’t think
that [I.T has] got the same profile as it had. I think that maybe, there might be more
of a thing now where people just assume that you know. Someone who you could

121
turn to, maybe that’s the sort of role. Maybe [it’s] the bridge, I would like to see that
role because there are people who are not quite so savvy who just think well I
wouldn’t have a clue so I’ll not do it. I’ll just do what I’ve done, stick with what they’re
comfortable with (Don).
There was a high level of consistency supporting this perception and identifying affirmative
action that could be taken to improve technology integration.
There aren’t many that are leading the field, the one person who was leading the
field, happens to be on long-term leave at the moment, so in terms of this campus
one of the people who would be actively searching some of the best new resources
he’s not in the loop now, so I think we are probably missing out just a little bit there
(Peter).
The support needed should not be limited to providing CPD sessions of limited duration on
generic subjects, the majority of teachers felt that CPD and pedagogical support should be on-
going, helping teachers to upgrade their skills continually with the support of designated
personnel.
I’m I.T. literate but need support on the modern aspect of things apps,
programmes, but teaching with it is harder. I feel like walking a tight rope, and it
could go wrong at any moment. If I was using something new, I would need lots of
support (Philip).
The pace and perceived continual change in technology was also considered to be a
demotivating factor for Lynn.
It seems to be you just get use to one thing, and suddenly it’s out of date and not
acceptable or not de rigueur (Lynn).

122
5.2.1.5 Shortage of Time.
Teachers in post-compulsory education have many duties and responsibilities in addition to
teaching including preparation, marking, mentoring, counselling, as well as CPD and meetings
of various types (Feather, 2017; Tummons et al., 2013). The perception among teachers is
that the integration of technology has added to their workload; converting teaching materials
to a format compatible with the technology used, course maintenance and upgrades
associated with the VLE, responding to student emails and the need to learn new skills
Samarawickrema & Stacey (2007). Many teachers feel overwhelmed, and this acts as a barrier
for them.
Ertmer (1999) see section 2.3.3.1 determined that lack of time was a first-order barrier while
Zhao et al. (2002) see section 2.3.3.2 categorised lack of time as being within the context and
project domains.
Teachers have reported they are unable to find time to be able to use or explore the potential
of the technology considering the intensity of the curriculum. Performance-based management
and a culture of internal and external auditing has added to the teacher's workload with
constant demands for information (Bailey & Colley, 2015). As a result of these demands,
teachers are working consistently over hours, with work spilling over into personal time,
including holidays (Avis et al., 2001; Jephcote et al., 2008).
Lack of time was perceived to be a considerable barrier to technology integration by all
teachers in the study across all campuses. The quotes selected from Ray, Nancy and Gill, are
representative of each of the interviews.
What I need is time off curriculum, instead of teaching then meetings and CPD the
government keep throwing at us. For the last five years you’re just pushed into the
ground constantly, we do cover, we do our own invigilation, we have to do advice
and guidance some evenings, there is a lot of admin to save money. I don’t feel
the staff get the time to do this professional[ly] (Ray).
Even when teachers are confident and very proactive in the use of technology in their teaching,
as is the case with Mike and Nancy, they still feel as if they are under pressure from the
workload they are expected to fulfil as stated by Nancy.
There is a heavy workload with marking, delivery and planning; it can be very time
consuming to change [materials] to powerpoint or prezzie, just give me more time
123
to learn and understand. I think it’s time-consuming, I mean I’m not full-time I’m
0.7, so I do work from home quite a bit, I am a bit of a workaholic, so I put my own
time into learning software and technology and trying to embed it the lesson
(Nancy).
All participants supported this perception, and it was not confined just to one campus or
college, but Gill made a more personal plea.
We’re all very time-constrained this is a very time-consuming job it is not just the
hour teaching in the lesson it’s the marking, it’s the planning, don’t make me use
any more of my own time please (Gill).
5.2.1.6 Infra-structure related barriers.
Although progress has been made, through investment both internal and external to the
colleges, there are still issues surrounding infrastructure reliability with slow bandwidth and
internet speeds during peak demand times impacting directly on teacher's willingness to
integrate technology into their teaching practices. Technology reliability is a first-order barrier
(Ertmer, 2005), see section 2.3.3.1, and as a barrier within the context domain (Zhao et al.,
2002) see section 2.3.3.2.
Issues surrounding the reliability of the technology infrastructure result in teachers preparing
lessons in the expectation that the technology will fail, which leads to the duplication of work
and an increase in workload (Neyland, 2011). All of the teachers interviewed in one college,
experienced issues related to the infrastructure; the quotes below illustrate some of the
frustrations.
Doesn’t always go well, I find sometimes the slow network speed does frustrate
me a little although I do usually have a back-up plan in progress (Mike).
The complex mix of technology that interface in colleges means that at some point, some part
will fail in some way and cause disruption to the class.
When you have somewhere like this, where there is a large I.T. infrastructure,
things go wrong all the time. When you’re dealing with these sorts of things a lot
can go wrong, and I think our server, infra-structure, upgrading to Windows 10
there are a lot of variables (Ray).

124
This perception gained support from teachers in other colleges,
The internet goes out, or the wireless goes out, but that is reality, this is how it is, I
tend not to use it on a regular basis because you can’t rely on it 100% of the time
(Gill).
5.2.1.7 Summary
The barriers identified and discussed thus far are extrinsic, measurable, and through
procurement and investment have been reduced. There does remain though deep-seated
extrinsic barriers related to the use of technology in teaching and learning. The barriers
identified from the data, obtained through the interviews confirmed many of the aspects that
had been identified by previous research from other sectors of education (Ertmer 1999; Zhao
et al., 2002; Shin, 2015; Scherer & Siddiq, 2015).
One barrier in one location related to lack of resources provided by the colleges and was
specific to a low socio-economic area. This barrier is related to what has been termed the
digital divide. Another barrier to technology use resulted from the nature of Further and
Vocational education. The allocation of and access to resources is determined mainly by
college management on the basis of the subjects taught and the assessment methods used
resulting in Academic subject areas, with traditional paper-based exams, having very limited
access to resources when compared to Vocational subject areas that use technology to
distribute materials and complete assignments via the college intranet of by using a VLE.
The data identified that teachers perceived that lack of time acted as a barrier to integration,
as the shift in management practices in colleges meant there were now greater demands on
teachers. Teachers were expected to undertake many additional roles in addition to teaching;
teachers in post-compulsory education teach a higher number of contact hours than any other
sector and have less time for additional activities like learning to use and integrate technology.
Measures have been taken to reduce extrinsic barriers through procurement of technology, as
identified from the interview data; nevertheless, they do still exist. Much harder to address are
intrinsic barriers, these barriers are the result of conflict with the fundamental beliefs of
teachers, these beliefs are prone to change depending on the context or situation and teacher's
perceived self-efficacy or self-confidence in using technology.

125
5.2.2 The intrinsic barriers to technology integration.
More significant than the extrinsic barriers are the intrinsic barriers, identified as the ‘real gate-
keepers' to the integration of technology. Intrinsic barriers embrace the core beliefs and values
that teachers hold; many of these are central to what the purpose of teaching is. These barriers
are more difficult to address as they are individual, personal and liable to inexplicable change
(Blackwell et al., 2013; Ertmer & Ottenbreit-Leftwich 2013; Howard, 2013). The integration of
technology is far more complicated than just "some technical skills and a good attitude" (Zhao
et al., 2002, p.511), the fundamental pedagogical beliefs of teachers will determine the style
of teaching that they adopt in the delivery of classes (Bandura, 1986; Clark & Peterson, 1986).
In this section, I will present the data related to the intrinsic barriers as reported by the teachers
taking part in the study. Intrinsic barriers discussed previously, see section 2.3.3.1 and section
2.3.3.2, have a significant influence on effective technology integration into teaching practice.
Self-efficacy or teacher proficiency (Bandura, 2006) has been identified by Ertmer (2005) and
Zhao (2002) as an intrinsic barrier and is considered a critical component for the integration of
technology (section 2.4.8).
Two main themes developed from the interview data that related to intrinsic barriers these were
efficacy in the use and integration of technology and core beliefs held by teachers regarding
technology integration and the effect that they have on teacher practice. Within the efficacy
theme, there were two sub-themes related to teacher self-efficacy and the efficacy of teacher's
colleagues. The theme of teacher core beliefs had five sub-themes related to the core beliefs
of teachers regarding technology use and integration. The following section presents the
results from the interview data related to teacher's perceived efficacy in technology use.
126
5.2.2.1 Teacher self-efficacy in using technology.
Self-efficacy has been defined as “the belief that one has the necessary skills and abilities to
perform the behaviour" (DiClemente et al., 2009, p.218). Self-efficacy theory proposed that
certain behaviours will lead to certain outcomes and shows the individual’s expectation of
personal success (Bandura, 1977, 1982; Maddux et al., 1982). Three different sub-themes
arose from the interview data surrounding the issue of self-efficacy, the first of these concerned
the establishment by teachers of boundaries and limits in their technology use. There were
several different perspectives presented by interviewees regarding the boundaries that were
established by the teachers and how these boundaries acted as barriers to technology
integration.
Boundaries.
All the teachers in the study stated that they were confident and used technology for tasks and
functions that were familiar to them. Confidence level and the use of technology were
perceived by teachers to have many different strands and reflected in the quotes below.
Confidence and experience were linked to technology integration, as expressed by James.
Moderately confident, that comes from experience, in the early years, I felt quite
fearful, but years of experience got me over that, other people get stressed about
it. (James).
Ray stated that familiarity with the technology was key for him, due to the culture that existed
in colleges.
I am fairly confident, I know what I’m doing and its self-protectionism when it comes
to teaching and being confident with what you are doing, you use the packages
you’re used to (Ray).
Boundaries were a consistent theme throughout the interviews, interviewees in all colleges
stating that they recognised their limitations and capabilities when using technology. There
was an overriding impression given that the teachers in the study were determined to remain
within the boundaries that they established; these boundaries were in effect the barriers for
them to greater integration.

127
I think in general I’m OK I don’t take the lead, I am not averse to using technology;
however, I am not knowledgeable enough to be in the forefront. Some things I find
more difficult than others, I can’t use Excel very well, I use what I’m familiar and
comfortable with, and that’s the boundaries (Rose).
Teachers were confident and competent in using technology that they were familiar with and
had learned how to use well; there appeared to be little desire to experiment. Peter best
summarised the overall perception of teachers in the study.
When I use computers, and I’m not shy of computers, I usually feel happy what I
do use, is tried and tested, I use it for a purpose and don’t use it begrudgingly.
Anything I do use it has a set role within the lesson, and I’m very comfortable with
it (Peter).
The previous quotes demonstrate that teacher confidence in using technology had clear
boundaries defined by the teachers, but some teachers expressed a higher degree of
self-confidence. Nonetheless, it did not always lead to a greater use of technology;
confidence became the second sub-theme within self-efficacy.
Confidence.
A more valid indicator of a teacher’s degree of efficacy was evident through the level of
engagement that teachers showed. Not all the teachers in the study remained within the
boundaries of comfort; some were prepared to explore more possibilities. Nancy and Geoff,
two of the more confident teachers when using technology, showed a different level of
commitment to use technology than most other teachers in the study.
I always have a powerpoint there, linking to videos and software to introduce gaps
and questions [and] used virtually all the time. I’m self-confident, the college gives
support when necessary I’m no expert, but I am confident and can work out how
to use a piece of software and integrate it into a lesson (Nancy).
There were similar sentiments from Geoff, who was considered by colleagues to be a
champion within the department.
Generally, I can do pretty much everything I want to, and I’m confident I can learn
anything I want to. I use ICT in every lesson in every session. I take the lead in my
team; I am the person who shows others. I guess I am the person that others would
128
ask how to do things. If it is something to do with a classroom thing, then they
would ask me. I feel confident using ICT in class. (Geoff).
Self-confidence and self-efficacy though were no indicator of technology integration when most
interviewees remained unconvinced of the benefits and improvements that technology could
bring. The following comments from Gill and Philip reflected a position that was consistent
throughout most of the interviews across all the colleges.
I have at times been a leader, I fully embraced it, and I had to drag my team into
the 21st Century, kicking and screaming, about computers. If the college in its
wisdom decided that from tomorrow all teaching had to be done via technology I
could do it, I don’t think it is an effective use of my skills, however but I could do it,
I can produce very decent power points even with all the whizzy bits, I don’t like it,
but I could do it (Gill).
This perception found support from other participants and was not confined just to one campus
or college. Philip questioned the need to change.
Why is it being imposed on people who are getting results in their own style, so is
there a need to impose technology on them just because other people are doing it
that way. As long as it is not adversely affecting a lot of people allow them to do it
(Philip).
The final sub-theme related to the self-efficacy of teachers raised the possibility of the pace
and perceived constant change creating barriers because of teacher's inability to understand
and master technology, that quickly becomes outdated and redundant.
Constant change.
The speed and constant change of technology was perceived to be affecting the confidence
and self-efficacy of teachers resulting in increased levels of anxiety and stress Betoret (2006).
Teachers from all colleges suggested that constant change acted as a barrier to integration;
Don highlighted this point.
I have confidence using IT, certain things I am not up to speed with, but things
change so fast you can’t always know everything. I always have at the back of my
mind what happens if it doesn’t work (Don).

129
There was a degree of consistency across all colleges that supported the perception that the
pace of change affected teacher's self-efficacy, as shown by Lynn.
I think technology changes so quickly it is hard to be very confident. ICT is
constantly changing, and I feel I never know programmes 100%. When I know the
programmes, I am comfortable with it (Lynn).
Teachers that taught I.T were not immune from the feelings of constant change, creating
barriers as Mike stated.
Yes, I’d hope I’m quite confident with that anyway, we do have a lot of software
come our way at any one time I sometimes wish I could use it all perhaps that little
bit more effectively I just want to be more on top than I am (Mike).
Having examined teacher’s self-efficacy, I wanted to explore how the teachers in the study
viewed the efficacy of colleagues and their engagement with technology.
5.2.2.2 Perceptions of colleague’s efficacy.
The teachers were willing to share their observations of colleagues and how they use
technology in teaching and learning. Even when technology is available, there is no guarantee
of its use, with teachers in post-compulsory education being perceived as slow to adopt new
ideas and regimes (Orr and Simmons, 2010). There was a perception that some teachers were
not willing to utilise technology in even the most basic way and avoided its use altogether.
Geoff identified that some colleagues shunned technology completely, not just in their teaching
practice.
There are some staff who don’t even read emails and admit that they don’t.
Integrating technology through mandating training or [demanding] that ILT must be
included in the classroom, it doesn’t seem to work. I guess it is really if you are
interested in using technology (Geoff).

130
Some teachers observed that colleagues were not willing to attempt to integrate technology
into their teaching.
A lot of my colleagues don’t even try. Some are really good, but I might be in my
department, maybe one of the very few, I don’t want to say the only one who uses
a smartboard completely (Rose).
The interview data showed that teachers used technology within boundaries that they
established and set and were comfortable operating within. When the teachers in the study
discussed their colleagues use of technology, they identified that some teachers would not use
technology even for task unrelated to teaching practice. The second theme related to intrinsic
barriers was core beliefs; it was necessary to investigate and discover the core beliefs of
teachers; the results of interview data are in the following section.
5.2.2.3 Core Belief.
Policymakers and government actively promote the belief that teaching is undergoing an
evolutionary change, shifting decidedly from a teacher-centred to a student-centred activity. In
practice, established curricula and teaching approaches remain virtually unchanged with
technology being underused and poorly integrated into the classroom (Akcaoglu et al., 2015;
Shin, 2015).
Teacher’s fundamental beliefs and attitudes about the integration of technology form part of
what Ertmer (1999) termed second-order barriers see section 2.3.3.1. These are the real
gatekeepers to technology integration and use. Zhao et al. (2002) considered these barriers
to exist both within the teacher and the project domains. The barriers were related to teacher’s
pedagogical belief and proficiency and are affected by the dominant culture in the college and
practices of the individual teacher.
In this section, I present the data that relates to the core beliefs that teachers in the study
identified as potential barriers to technology integration. Five sub-themes developed from the
interview data, and that I categorised as relating to teacher core beliefs, the first of these is a
belief that the age of the teachers influenced technology integration.

131
Impact of age.
Teachers across all colleges suggested characteristics such as age and teaching experience
would determine how technology was adopted and used in their teaching practice. The quotes
below are representative of many of the perceptions voiced during most of the interviews
across all colleges. Interviewees raised age as potentially being a factor that led to the creation
of barriers, however, previous research (Scherer & Siddiq, 2015), concluded that
demographics were not a determining factor in technology integration see section 2.5.
My position on this is potentially something to do with my age I am fairly old school
as a teacher, I have been in education since I was 16 and I have grown up through
most of my career with my pen and my board, and that is my entire comfort zone
in the classroom, I don’t mind them [students] using their phones to research I don’t
have a problem with any of that, our registers are all taken via tablet these days,
so I think it is really more me and my head and where I am. (Gill).
Philip supported Gill's comments when suggesting age might have some influence.
Yea I suppose there are certain things within IT, that would probably, I don’t know
if it’s an age thing I don’t know, would probably make me nervous (Philip).
Role of technology.
“Research offers little support for the popular (though perhaps unrealistic) rhetoric about
technology revolutionizing teaching.” (Hennessy et al. 2005 p.156; Liu, 2013; Underwood &
Dillon, 2011). Technology primarily remains viewed as a useful tool that is used to support
traditional teaching approaches (Ertmer & Ottenbreit-Leftwich, 2013; Hernández-Ramos et al.,
2014). Liu (2011) maintained that 80% of teachers use lecture-based teaching with technology
while others demonstrated that teachers preferred to use traditional teaching methods (Plesch
et al., 2013; Scherer et al., 2015).
The second sub-theme connected to core beliefs was the belief that technology added to the
existing repertoire of teaching techniques that teachers possessed. Many participants viewed
technology as part of their teaching toolbox rather than a significant deviation from existing
practice. The suggestion was that technology could enhance delivery by enabling a blend of
approaches to teaching and learning within their classroom practice (Ertmer & Ottenbreit-
Leftwich, 2013; Hernández-Ramos et al., 2014) see section 2.4.9.

132
I.T. is a tool to help you as part of your toolbox, I use it as a tool to get ideas across,
and I’m not pushing kids with it either. I use it as a teaching tool. I am fine with it,
but I’m not leading people, I don’t champion it (Ray).
Some of Ray's comments were echoed by Don who viewed technology as an additional tool
to be used when appropriate.
I use IT selectively; it is part of a teaching toolbox. It is one of the many things I will
use, but by no means exclusively (Don).
There was a level of consistency supporting this perception as well as identifying the positive
contribution technology could make to teaching practice as Peter states.
Computers have a useful role in the teaching, and I find the technology really good
in terms of showing some really good images, Youtube clips and videos and re-
caps. It definitely has a place (Peter).
Lack of depth in learning.
The methods employed by teachers will depend on their view of how learning is achieved
(Conole et al., 2004; Trigwell & Prosser, 1996). Technology use raised concerns among a
small number of teachers in two colleges regarding the depth of learning. It was perceived that
using technology promoted surface learning.
I don’t think it does them [students] any favours I find critical thinking is going,
because they don’t have to think any more, you type the question into Google, and
you get an answer, they don’t even critique the answer. They’re getting so you
know, you kind of ask a question in class if you are not careful what you get is a
response from Google so that they haven’t even thought about the question they
just want to hear the question and they regurgitate an answer which they found
online (Rose).
Peter supported this view, and they also questioned whether students were fully engaged with
the learning process.

133
I think some students become too reliant on thinking I don’t need to know anything
I can look it all up. I’m not convinced, I think many things can be researched, but if
students just think I will go and look it up it doesn’t engage with their brain in the
same way (Peter).
Participants ’ delivery preference.
Whether technology is integrated and used by teachers in their classroom practices will depend
upon the fundamental beliefs' individuals hold over the effectiveness and benefits derived from
its use. The technology adoption model proposed by MacCallum et al. in section 2.4.5 identified
factors that determine if technology is adopted or rejected in practice. The beliefs that teachers
hold regarding what constitutes teaching and how best this is achieved are the most crucial
considerations see section 2.4.9, and from the interview data, teacher preferences became
the fourth sub-theme related to teacher core beliefs. The quotes presented offer some of the
perspectives that reflect the variety of perceptions held by teachers that affect technology
integration in their practice.
I strongly, strongly believe in still using the textbook because that’s what we have,
learn how to read, gleam correct information and the information that you need
from what you have read. Be able to understand the information that’s in front of
you and then be able to use that information for us now to answer questions. I don’t
use ICT exclusively. (Rose).
The style of teaching adopted is influenced not only by the beliefs of the teachers concerning
the delivery; Gill raised the issue of subject area determining delivery style.
I think with early years there is a lot of hands-on stuff and I am a kinaesthetic
learner, and we have found over time and research that the majority of early years
practitioners who come are also kinaesthetic learners’, so we are all very hands-
on, it’s is a very hands-on profession... It’s not a requirement to be a good teacher
to be technologically able (Gill).
Garry suggested that imposing technology on teachers does not take into account the
fundamental way that some teachers view teaching.
I am aware of staff who are very challenged when it comes to ICT, I worked in a
community centre without access to a whiteboard or projector, if I had [to explain]

134
what I was doing using a flip chart I would have said like a powerpoint, but on
paper, some staff here would say [powerpoint is] like a flip chart, but on the
computer (Garry).
Don suggested that teacher’s core beliefs will always determine the level of integration and
use of technology. He summed up the concerns of most of the teachers in the study regarding
teaching and delivery.
There are people who are not quite so savvy who will just avoid I.T. and stick with
what they are comfortable with. They don’t have the expertise to solve potential
problems, so avoid the situation that might cause that problem (Don).
When there was little or no active monitoring of technology use by teachers in any of the
colleges, personal choice or preferred delivery style often dictated classroom practice.
It’s not consistent in college we have some teachers that still use OHP’s and
acetates, on some courses (James).
During the interviews, no particular demographic identified as being resistant to technology
integration, and as noted by Nancy, it seemed to be determined primarily by personal
preference and choice.
It is not just age we’ve got another young guy in the department, and he’s not that
struck on powerpoint, I think it is more just personal preference and your teaching
style it boils down to. I have some colleagues who don’t even turn the IWB on; it is
down to each individual as to whether they use it or not (Nancy).
Personal preference has a considerable influence on classroom practice, the beliefs
concerning what constitutes teaching and learning will have a dramatic impact on teaching
style and willingness to change from a method that has probably developed over the years.
However, teachers were able to identify situations where technology had made an impact in
areas of their professional lives even if they also raised caveats.
Impact technology has in the classroom.
Hattie & Yates (2013) suggest teachers seem to fluctuate in the views and beliefs they have
about technology, never quite seeming to decide on the value that technology can bring to

135
teaching and learning (section 2.4.5). Given below are a sample of teacher's views showing a
high degree of consensus and caution associated with technology use from the interviewees.
I think it’s [technology] made a phenomenal difference, but has it made the kids
any smarter? I.T. yes it has revolutionized teaching of course it has, but it can be
used badly as well (Ray).
Aspects of this apparent conflict centred around the results that technology can achieve as
alluded to in section 2.3.2 and additionally, the expectation of others that technology was used,
or seen to be used, in class.
I use ICT in every lesson, I’m not sure it drags the students up or anything like that,
but it’s just another way of delivering certain things. I feel it is a bit of a balancing
act while using it in the classroom, are they getting what I want them to get from it.
Am I just showing them a clip from the Open University website, am I getting more
out of it than them, it has to be effective, so it’s a balancing act. I do what I am
asked to do (James).
The internal conflict and hesitancy teachers showed, centres around whether technology can
achieve what has been claimed by others Hennessy et al., (2005). There were areas of real
consensus among the teachers regarding lesson preparation and research capabilities, as
shown by Gill and James.
To research and prepare it is the best thing since sliced bread, what would any of
us do without Google (Gill).
James and other teachers confirmed this to be a benefit when attesting to the usefulness
of technology.
There probably isn’t a teacher today that doesn’t use technology to prepare
lessons or for administration purposes (James).
All of the teachers interviewed recognised the potential and possibilities that technology could
offer, but these positions were tempered by an almost innate caution that inhibited them from
whole-heartedly accepting all of the claims made in some quarters (Howard, 2013).
It has massive advantages, and if it is used correctly, it has massive potential. I
think it can add to students learning and achievement, if used appropriately. I don’t

136
think it’s the best thing since sliced bread and I’m not a technophobe. At one time,
it was seen as a solution for everything rather than seeing it as a tool that can be
used in certain areas, and it might be effective (Don).
Despite what appeared to be an innate caution, this did not come across as being negative;
the data showed that teachers remained positive and were willing to use technology where
they could see a benefit, many of the interviewees shared the opinion of Nancy and Peter
reflecting the benefits and possibilities offered by technology.
The best thing since sliced bread, I like it, and it’s fantastic. I like looking around
for software to use. I am happy when I am using ICT in class; it makes it more
interesting (Nancy).
A similarly positive comment from Peter promoted the heightened level of engagement from
students.
It does engage the learners and effectively makes the links between the theoretical
and practical parts of the subject. You can show, and students are more likely to
have meaningful opinions if they just don’t see text, they actually see an image,
images can be a good starting point for discussions. I think the effect of ICT has
been positive. I have embraced it from the start, and my teaching is definitely better
as a result. Given that the students are so IT savvy and with smartphones and
whatever, there’s no you can’t, and you couldn’t, you wouldn’t want to turn the clock
back (Peter).
Summary.
Intrinsic barriers embrace the core beliefs and values that teachers hold. Many of these beliefs
are central to what the purpose of teaching is. Two main themes surfaced from the interview
data that related to intrinsic barriers; efficacy in the use and integration of technology and core
beliefs held by teachers in the study consisting of five sub-themes that were perceived to shape
technology integration in teacher practice.
There were two components within efficacy shown from the interview data; the first was teacher
self-efficacy the second was observations regarding colleague's efficacy. All the teachers
interviewed believed that they were competent in using technology, but the level of self-efficacy
was directly related to and remained within clearly defined boundaries that the teachers set for
137
themselves. The boundaries varied in the level of integration and differed between individual
teachers. None of the colleges had a programme of training to establish and develop the skills
of individual teachers, and as a result, the level of integration remained within the boundaries
and comfort level established by the individual teacher.
Constant change and the speed at which technology and programmes changed was deemed
to be a barrier to effective integration. Teachers perceived that they would never be able to
understand and utilise technology with complete confidence. Teachers suggested that there
was no obvious process to identify and evaluate software packages before there adoption,
leading to problems for the teachers when they were expected to use them. The teachers in
the study used technology, albeit at varying level of integration, but there remained other
teachers in the colleges who were unwilling to use technology in any form and avoided its use
completely.
The possibility of the age of the teacher being a barrier to technology integration was discussed
and analysed from the interview data. Three of the teachers suggested that their age might act
as a barrier to technology integration, this perception was not shared by other teachers in the
study and supported previous research by (Scherer & Siddiq, 2015) that found demographics
was not an indicator of technology integration and use.
The teacher's perception was that technology was an addition to the teaching toolbox rather
than a significant deviation from their existing practice. Personal preference and delivery style
continue to have a considerable influence on classroom practice, when technology was
integrated it within the bounds of traditional teaching methods that remained relatively
unchanged, as Liu (2011) stated. A small number of teachers identified concerns about the
depth of learning, and this acted as a barrier to them. Teacher’s core beliefs will determine the
level of integration and use of technology and summed up the concerns of the majority of
teachers in the study regarding teaching and delivery.
138
5.3 Role of & Engagement with Technology in Teaching Practices.
5.3.1 How technology is used by teachers.
Policymakers and government actively promote the belief that teaching is undergoing an
evolutionary change, shifting decidedly from a teacher-centred to a student-centred activity
through the integration of technology. In practice, established curricula and teaching
approaches remain virtually unchanged with technology being underused and poorly
integrated into the classroom (Akcaoglu et al., 2015; Shin, 2015). Although previous research
indicated that little had changed fundamentally in classroom practice, it was necessary to
examine more closely how teachers in the study utilized the technology.
The interview data showed that all teachers engaged with technology in their teaching practice
to a greater or lesser extent. There were high levels of consistency in responses, and the over-
riding perception regarding engagement with technology from the teacher's perspective was
thought to have been from the use of presentation tools like Microsoft Power-point, this type
of engagement will be presented in the first section below.
Delivery with Power-point.
When interviewees were asked to discuss their engagement with technology in their teaching
practice, there was an overriding assumption from them that technology use was about using
Microsoft Power-point or similar presentation tool despite there being no specific mention of
these teaching tools from the interviewer. It is clear from the representative quotes below that
technology use in teaching practice was primarily perceived by all of the teachers in the study
to be related to how they used presentation tools like Microsoft Power-point during classes.
There is an over-emphasis on the use of Microsoft powerpoint but having said that
doing a Microsoft power-point is probably going to be more useful for the kids to
see what’s going on than doing something on the board. We are powerpoint driven;
I hate to say. It has become formulaic, there is a process of powerpoint making, I
think most teachers in the Maths department, we all use powerpoint, and that’s the
main way, and without it I think we‘d be stuck. (Ray).
Don referred to his previous experience at a different college where powerpoint materials were
purchased to provide a level of standardisation and uniformity.
139
We actually bought a lot of interactive powerpoints which were already written,
which we then used, which we could use in conjunction with electronic
whiteboards. So [you] could say here’s a jigsaw puzzle match these two equations,
I used to like to use it for things like the graph drawing [be]cause it makes it so
much easier than for me to draw a graph and then spend the next twenty minutes
sort of knocking something up very crudely on the board where you can do it where
they can interact as well (Don).
Ray and Don’s comments reinforced the perception that the classroom remained mostly
unchanged from the traditional ‘chalk and talk’ with powerpoint presentations taking centre
stage in what is still a teacher-focused environment. When Geoff discussed the use of
technology in teacher’s practice, he too perceived this to mean powerpoint, and although he
stated he did not use it himself, he noted that it was the main tool used by his colleagues.
I don’t use powerpoint, but colleagues use powerpoint for every session, for every
day, every activity, but with teaching, you’re always on your own how do you know
what others are doing (Geoff).
Hernández-Ramos et al. (2014) stated that when teachers identify an application that could
add to their teaching, then they are willing to integrate and use technology. Nancy felt the
benefits of using technology and was able to search for new resources although, she also
acknowledged she did this in her own time, see section 5.2.1.5.
I like looking around for software to use. Use mind-map and use a lot of visuals in
the powerpoint. I always have a powerpoint there, linking to videos and software
to introduce gaps and questions. It can be very time consuming to change to
powerpoint or prezzie, but I like using ICT and can’t see me going back to using
whiteboards because I can write on the IWB (Nancy).
Powerpoint, being perceived by all teachers as a primary use of technology for classroom
delivery, was identified by Gill as having the potential in itself to act as a distraction during
delivery.
I can produce very decent power points even with all the whizzy bits, I don’t like
them, but there you go. I like static ones, but I think it distracts from the information,
flash in, flash out, the builder ones where there’s animation. If people are looking
at these little squares coming together to make a whole picture on the screen,
they’re not looking at the information, is my feeling on that (Gill).

140
The quotes above clearly show that powerpoint was the dominant delivery method for teachers
in the study. However, some teachers were looking to use technology in other ways, as well.
Other uses of technology in classroom practices.
Many of the teachers across all colleges also used other tools and techniques during their
teaching. The idea of using different methods within the same lesson was thought to be a
positive way of utilising technology within a traditional approach.
I use ICT in every lesson, but it’s just another way of delivering certain things, I use
it every lesson, but only when I see it fit. It’s a blended approach I suppose, I test
and set homework using technology watching the iPlayer and then ask questions
in [the] following lesson (James).
Peter’s comments showed that technology had much more to offer than just being a
presentation tool when integrated effectively.
I find the technology really good in terms of showing some really good images and
Youtube clips and videos you can show. Students are more likely to have
meaningful opinions if they just don’t see text; they actually see an image; images
can be a good starting point for discussions. My colleagues use powerpoint
extensively; there are the ones that are a bit more interactive, sometimes we use
technology for setting up quizzes that self-mark and do checks. Powerpoint is for
transfer of information, but we use videos and interactive power-points. We use
Moodle and put extra resources on there, and students have the option to
correspond via Moodle, some staff engage with that more or less than others.
(Peter).
When faced with learners of lower abilities and individual needs, then technology enables
teachers to engage with learners in other ways that offers flexibility in delivery. Gill and Geoff
from different colleges, demonstrated how technology could be used to overcome barriers to
learning for some students.
I use a tablet, I use the computer I do use the IWB, I personally don’t use power-
point, I know how to do it, but don’t use it. I teach a special needs group, and I
wouldn’t be without Google and Google images because three out of the group

141
have no writing ability at all, but they do have reading ability so I use images and
they match it to words (Gill).
The same techniques were used by Geoff in a different college in his classes with low ability
learners.
I use images to teach the meaning of things rather than words and reading. I just
have to use whatever method suits the lesson and learner. I just use the projector
now, I used to have a smartboard which was really good, but I don’t have that now.
When I had a smartboard, my lessons were much more interactive then and more
fun. I don’t use powerpoint (Geoff).
5.3.2 Perceptions of technology usefulness.
It was suggested that technology contributed to student’s experiences in a positive way
because they were able to interact with teachers and peers via the VLE to discuss issues and
access help and support at any time.
It does act as a motivation for students who know they will get a response if they
have a problem away from the college (Peter).
Peter continued and identified some of the benefits that were representative of comments from
the more enthusiastic teachers in the study.
Computers have a useful role in the teaching. I find the technology really good in
terms of showing some really good images. Youtube clips and videos and re-caps,
it definitely has a place, but could still be used better and more effectively. I think
the effect of ICT has been positive; I have embraced it from the start, and my
teaching is definitely better as a result (Peter).
The place and role of technology identified from the teacher's viewpoint was that technology
was a useful addition, but it is not a cure for all of the ills that exist as stated by Earle (2002).
I.T. is not the panacea, it is a tool that we should be using to better our lives, make
being a human being better, but at the moment it is working the other way round
when students are not able to communicate properly (Ray).

142
The belief among teachers that technology is a useful addition or tool for existing teaching
methods was widespread, and technology is confined, when used, to supplement traditional
teaching methods related to the transfer of information from teachers to students (section
2.4.4).
It adds to parts of the lesson, and for that 10 minutes it enhanced [teaching], it has
some value in certain circumstances it is a tool to go with all the other tools at your
disposal. I use it every lesson, but only when I see it fit (James).
The potential for online delivery of courses raised concerns with one teacher.
There are now complete apprenticeship courses that are totally online, I had to
investigate online early years’ programmes, and it horrifies me that early years’
practitioners depend on themselves to train themselves, wouldn’t you rather have
someone with 40 years of experience training them and it is [just] because they
promise quick results (Gill).
5.3.3 Summary.
The analysis of the interview data regarding the role and teacher engagement with technology
showed there was a degree of consistency in the responses of interviewees that technology
integration into teacher practice primarily meant the use of programmes such as Microsoft
Powerpoint within traditional presentation type, teacher-centred classes. Less than half of the
teachers used technology in any other way than this.
The positive benefits of technology were related to student engagement and in being able to
bridge the gap between theory and practice in some subject areas. Students of low ability were
able to use images rather than just relying on text; this was considered to be an advantage
and benefited student learning.
Teacher perceptions around the use of technology in their teaching practice showed some
teachers to be very enthusiastic about the potential offered by integrating technology from a
student engagement standpoint and the access to materials and peers through the VLE.
Nevertheless, an equal number expressed an opinion that technology should not be viewed
as having all of the answers to the perceived failings in education as a whole and should be
used only when appropriate in classroom delivery.
143
5.4 Management.
5.4.1 Introduction
Post-Compulsory education falls under the umbrella of Office for Standards in Education
(Ofsted), since it became the dominant partner in a merger with the Adult Learning Inspectorate
(ALI) in 2002 (Burnell, 2017). Ofsted has the authority to influence college operations in many
areas through direct and indirect pressure and influence. Not all these interventions are
welcomed and are viewed by some as “unwarranted interference and external mandation by
external bodies seeking to control and stipulate the provisions, processes and outcomes in
unhelpful ways” (Billett, 2014, p.2) see section 2.2.4. Some interventions have had far-reaching
implications for the sector at every level, "making an impact on careers, classroom practice
and, for some, a decision on whether to remain in the sector" (Burnell, 2017, p.228).
The imposition of standards in areas such as CPD and classroom practices can create conflict
when they challenge the core beliefs of the teachers, Ertmer (2005) identified this as a second-
order barrier. Zhao et al. (2002) identified these barriers as residing within all three of the
identified teacher, project and context domains.
5.4.2 Management decisions.
5.4.2.1 External influences affecting technology integration.
There was a considerable degree of consensus from the majority of interviewees about the
role and influence exerted by external bodies regarding CPD and its provision. The teachers
perceived that external bodies manipulated many of the decisions taken in the college through
a regime of inspection and audit. The majority of teachers confirmed that Ofsted inspections
were a source of stress with a constant regime of internal and external audits.
A few years ago, there was a big push to integrate ILT [Interactive Learning
Technology], and it had to be identified on lesson plans where it would be used in
each lesson. I don’t know if that was a fad or trend at the time, I think that has
dropped off now, either because it is not fashionable anymore or maybe other
things that have superseded that. Things like British Values, Equality and Diversity,
Safeguarding and Student Welfare those sorts of things and maybe ILT has
dropped down the list of importance. If we rated where IT was on the importance

144
agenda, it has probably fallen down that list, or it has been superseded with
inspections, and we are driven by Ofsted (Don).
The influence of Ofsted and the impact it has in the colleges was evident through the interview
data, and although Philip's comments appeared light-hearted, there was a serious undertone
that came through.
We do a lot of staff development, but we do a lot of staff development that’s sort of
imposed on us, the type of CPD that’s very strong at the moment is safeguarding
and student welfare. We’re at the moment, completely at the mercy of a re-Ofsted
[inspection] and the eighteen months since [the last] Ofsted have been in has been
a slog. There’s been a lot of CPD that we’ve gone to, and come away from thinking
I don’t get the meaning of that. We would all do things if we see the value of it, it’s
when it is forced on you, and then you don’t see the end product. I don’t know what
boxes it might be ticking for the hierarchy for an Ofsted inspection. It’s like we’re
Troy and outside there is Ofsted we’re under a siege mentality yea there’s a huge
horse out there, and it’s got Ofsted in it (Philip).
It is not only in CPD where the influence and pressures from Ofsted are felt, as Gleeson et al.
(2015) state, teachers are also encouraged to adopt classroom practices, including using
prescribed resources, that comply with the criteria determined to be ‘good' or ‘outstanding' on
the Ofsted grading scale.
We’ve had a change of specification, for A level, it’s all changed, and so we have
to write new powerpoints that go with the text we bought, so we’re writing power-
points now, you try to write them in the Ofsted way so it will have challenge,
different coloured questions, so it refers to the text, well that’s a grade D question,
and then you have a problem –solving question. (Ray).
The nature of the CPD provided tends to be driven by external requirements based primarily
on Ofsted audits and inspections, and the prominence of the technology-based CPD has
diminished and been overtaken by other areas that are deemed to be of more significance and
importance in satisfying the criteria of external audits. External audits can directly affect the
performance of the college, and the Ofsted reports and grade influence stakeholders, and
student numbers and retention directly affect funding of the colleges. External bodies do not
take all the decisions related to technology integration and use, and internal actors are also
responsible for decisions that affect technology integration.

145
5.4.2.2 Internal influences affecting technology integration.
As stated previously, personal preferences play a leading role in whether technology is
adopted and integrated into classroom practice. Personal preference can also play a role in
the selection of technology and software used by teachers. Teachers across all the colleges
perceived there to be no clear and consistent method of identifying the types of technology to
be used nor the packages to be used in teaching and learning and often it was left to personal
preference. Avoiding ambiguity is vital in any change management process Carr, Hard, &
Trahant (1996) see section 2.4.4.1 teachers felt that a lack of clarity contributed to the lack of
technology integration.
The college does have a policy about no phones in lessons, but it slips, and some
lecturers actually use mobile phone technology as part of the lesson (James).
The perspective alluded to by James was offered by a colleague in the same college.
I allow students to use mobile phones and no way will I ever stop students using
mobile phones (Mike).
The issue was not confined to just one college but did appear to be unenforceable without a
clear policy and direction from management.
There is no college-wide policy it tends to be department by department regarding
the use of mobile phones, the other issue is you sometimes getting other students
dropping in who are not from that area, who think hang on wait a minute nothing
has been said to me (Don).
As teachers control the activities in their class, as Shin (2015) stated, the level of
technology integration, monitoring of technology use is accomplished through internal
and external audits.
It would be frowned upon not to use ICT on an internal or external inspection
without good reason, but the rest of it you’re left alone really, nobody [is] saying
use it (James).
Materials used with technology are not subjected to evaluation by peers or colleagues before
the materials are bought and utilized, as is shown in the following quotes from teachers in one
college, barriers are created for teachers unfamiliar with the materials.
146
Here if we take on a new member of staff they might come along and say well this
is what I use to do in my old school, can we use that or somebody in the senior
team will come along having read TES or been to a conference and impose things
when they have not been properly evaluated. We stick to what we like; it comes
down to your personal preferences. Because when you’re a teacher, and you have
spent a decade teaching with a certain package you use that, because I know what
I’m doing you use the packages you’re used to (Ray).
Ray continued to offer an insight into an example of software imposed on teachers
without the necessary evaluation and the problems it causes as a result.
New software was introduced in the college, and it was great for English and
subjects where you gave wordy answers, but it had no facility for inputting basic
Maths symbols so was useless for the Maths and Science courses. To be
constantly updating software and constantly looking at change that’s quite a
dangerous and a hard thing to do [but] it’s what senior management would like us
to do. In the department, there is much more discussion (Ray).
Mike, another teacher in the same college, highlighted other problems regarding technology
introductions as being a barrier.
The only things that frustrate me sometimes we find that various systems get
introduced around college not always communicated to that what is actually
coming (Mike).
Pressure from management to use technology in particular ways without discussion or
communication caused barriers, as Philip identified, communication was not very effective in
his college in a different location.
If they said this is a new site, this is what we are going to do with it, go away create
your resources run it for x amount of time and then we’ll evaluate it and see what’s
happening with it, people would understand that, but going bang bang bang this is
what we want, this is what you will do, this is what’s going to happen, this is going
to be the outcome, and then the outcome doesn’t work, that alienates some staff,
when it is forced on you, and then you don’t see the end product. We would all like
to be confident that if we tried things and they went wrong, you weren’t going to be
pilloried for it (Philip).

147
5.4.2.3 Management Decisions
There is a fundamental shift in management practices in colleges, this has resulted in the
adoption of what has been termed “Taylorist” practices within Further Education to “cheapen
labour“ the result of which is fewer staff, working harder and longer and teaching more students
(Feather, 2017; Mather et al., 2007).
The proliferation of performance criteria and target setting has led to teachers questioning what
constitutes a ‘good’ teacher under the new performance management regimes driving the
sector (Plowright & Barr, 2012; Shain & Gleeson, 1999). Ertmer (1999) identified these barriers
as second-order barriers created by challenges to the core beliefs of teachers. Zhao et al.
(2002) depicted these barriers as residing within the project and context domains, affected by
differences with existing teaching and management styles and the culture that exists in the
college.
For the last, since I’ve been here, 5 years you’re just pushed into the ground
constantly, we do cover, we do invigilation, we have to do advice and guidance of
evenings, we have to do a lot of admin that just they wouldn’t get away with in
schools to save money (Ray).
Performance-based management systems demand attention, and constant demands for
information, target grades, progress grades and attendance information, are considered an
everyday function of the role of teachers (Bailey & Colley, 2015). Teachers in another location
identified the continual demand for information led to confusion and frustration.
At the moment I don’t know with ICT where I’m supposed to be tracking my
student’s progress, I’ve got three different trackers from three different people, I
don’t have the time to do three different trackers (Philip).
Lynn, a colleague, echoed similar sentiments.
We have lots of parallel systems. So again, sometimes there’re that many different
systems that don’t talk to each other that it’s like how many times do I have to
upload the same document or how many documents do I have to upload which
sort of say the same things but in different format. One is for the college, one for
148
[Senior Manager] one is for the apprentices [Awarding body] and my line manager,
and we’re counting and making sure that we’re doing what we need to do (Lynn)
The change in prominence regarding the type of CPD was noted and illustrated in each college
with the support role for teachers in helping them to source materials, prepare resources and
integrate technology being made redundant in all colleges in the study. The majority of
teachers in the study voiced similar comments to Don.
We have lost our ILT champions; each department would have someone who
would find the latest software and innovations and disseminate this information as
Best Practice, that doesn’t happen here. The person we had here now has become
less prominent when they used to support specific classroom delivery techniques.
I think people just assume we know about ILT (Don).
5.4.2.4 Summary.
Internal and external forces have a significant impact on the role and integration of technology
into teacher practice. The majority of teachers confirmed that Ofsted inspections were a source
of stress with a continual regime of internal and external audits. External bodies such as Ofsted
can mandate the CPD provision in the college through external audits and as stated the
perception is that CPD related to technology use and integration seems to have become less
important in recent years. The use of prescribed resources also form part of the audit regime
as Gleeson et al. (2015) state; teachers are also encouraged to adopt classroom practices,
including using prescribed resources, that comply with the criteria determined to be ‘good’ or
‘outstanding’ on the Ofsted grading scale. External audits can directly affect the performance
of the college, stakeholders are influenced by the Ofsted report and grade, and student
numbers and retention directly affect funding of the colleges and are deemed of vital
importance by college management.
Internal decisions regarding technology use and integration also can act as a barrier to teacher
practice. Personal preference can also play a role in the selection of technology and software
used by teachers; there is little or no evaluation by peers or colleagues of the materials used.
The lack of a consistent approach to the procurement and use of technology and software
packages for teaching creates barriers for teachers unfamiliar with the software package that
often changes or is considered not fit for purpose.
The proliferation of performance criteria and target setting has led to teachers questioning what
constitutes a ‘good’ teacher under the new performance management regimes driving the

149
sector (Plowright & Barr, 2012; Shain & Gleeson, 1999). Performance-based management
systems and constant demands for information, led to confusion and frustration, increased
stress, greater resentment and feelings of being undervalued.

150
151
Chapter 6 - Discussion, Limitations and Recommendation for
Future Discussion.
6.1 Introduction.
In this chapter, I discuss the main findings of the study that have been presented earlier in
Chapter 4 and Chapter 5, the limitations that affected the study and the potential areas for
future research. The discussion section of this chapter will address the research questions in
turn and as such will discuss first the teacher’s perceptions of their self-efficacy and that of
their colleagues in the use and integration of technology in their teaching practices. After this
section, the discussion will examine how teachers use technology in their teaching practices
and then the barriers and enablers that exist to the use of technology. The final section will
then discuss the beliefs and attitudes of teachers concerning the integration and contribution
technology can make in their teaching. The limitation section of the chapter will discuss the
constraints of the study and how I might have approached some aspects differently.
Suggestions for future research areas will be reviewed with a focus on implications for policy
and management practice. The chapter concludes with recommendations in areas of
management policy within the colleges to better meet the needs of teachers and thereby
achieve the ambitions of the policymakers and government while outlining the implications for
teachers and practitioners.

152
Figure 6. 1: Barriers and Themes from Interview Data

153
6.2 How do teachers in Further and Vocational Education use and integrate
technology into their teaching practice?
The first research question generated data from participants in this study indicating that
integration and engagement with technology varied and was consistent with the findings of
Shin (2015) in the suggestion that teachers decide the level of integration, but as policy is
determined mainly at government and college management level teachers’ feel, they are
obliged to engage. Nevertheless, the level of engagement varies, and many continue to use
technology for convenience rather than any fundamental change to classroom practices.
Subject content is often just formatted differently to incorporate technology, but fundamentally
continuing with teaching styles that they are familiar and comfortable using and have remained
mostly unchanged for 200 years (Akcaoglu et al., 2015; Shin, 2015; Tyack & Cuban, 1997).
The belief among many practitioners endures that “Good teaching remains good teaching with
or without the technology” (Higgins et al., 2007 p. 217) with evidence of “reshuffling the pack
of cards, but little evidence of anybody trying a new game” Goodson & Mangan (1995 p. 626).
There were two aspects relating to teacher’s use and integration of technology into their
teaching practice, the first relates to how teachers utilise technology and the second concerns
how often teachers use technology in their teaching practice. Based on the results of the 1st
survey how teachers in Further and Vocational Education use and integrate technology into
their teaching practice was initially shown to depend on the age of the teacher and the subject
area that they taught.
The younger teachers under the age of 40 were much more likely to use technology to collect
and prepare resources for use in teaching than teachers aged over 40. This reluctance to use
technology could be because older teachers might have alternative sources and formats of
materials that had been developed previously, if they have more years of teaching experience,
but it was not possible to establish this from the data analysis completed in the current study.
In addressing the first research question, three key elements appear to be relevant. All
teachers interviewed were positive in using technology for research and lesson preparation,
while utilising the flexibility of the VLE’s for the distribution of materials; these activities were
perceived to be beneficial by the teachers. The technology adoption models, identified by
MacCallum et al. (2014) see section 2.5, confirmed that for technology to be utilised there
needed to be a perceived benefit for using it, these benefits were perceived by teachers in the
study to be ease of use for research and preparation of teaching materials. Although the
teachers used technology frequently to source, collect and prepare materials for use in the
154
classroom, teachers still relied on more traditional teaching and presentation method with the
use of power-point or similar tools.
The overwhelming perception among the teachers interviewed was that technology integration
was predominately, though not exclusively, confined to the use of presentation tools and was
viewed as a useful addition to their teaching techniques that could be utilised to enhance
existing teaching approaches. There was little change in the practicalities of classroom delivery
despite the investment in technology, high expectation and persuasive rhetoric from
policymakers and advocates alike. Classroom delivery remained largely teacher-centred and
focused on the transfer of information from teacher to student (Akcaoglu et al., 2015; Shin,
2015). With classroom practices remaining mainly unchanged only the medium through which
students acquire the necessary information has changed.
The training associated with technology integration for teachers has focused on the acquisition
of technological skills, rather than the effective use of technology to enhance student learning
and pedagogy. Therefore, the integration and adoption of technology has been limited. Without
clear identifiable benefits to using technology, as stated by Mishra and Koehler (2006),
teachers will continue to employ familiar, trusted existing techniques and technology
integration will remain sporadic. Teachers in the study perceived technology as not offering
sufficient benefit to teachers and students, and their view was that it was not a panacea for all
of the perceived ills and failings in the further and vocational education sector.

155
6.3 What barriers and facilitators exist to inhibit or support the use of technology
in Further/ Vocational Education?
The second research question explored the barriers and enablers that existed to the integration
of technology in the Further and Vocational education sector within what has been termed
broadly as extrinsic and intrinsic barriers. Throughout most of the 21st Century, there has been
a significant and continued investment by many governments to support the provision and
integration of technology into the educational sector (De Witte & Rogge, 2014; Nagel, 2014;
Vaughan, 2013). There has not been the wholesale technological and pedagogical revolution
in the education sector that was envisaged by many (Ertmer & Ottenbreit-Leftwich, 2010;
Howard et al., 2015; Plesch et al., 2013). Many barriers to technology integration are extrinsic
and centred principally around quantifiable facets. Although there has been continued
investment from governments, extrinsic barriers continue to exist and remain an ongoing
source of frustration to teachers (Akcaoglu et al., 2015; Cárdenas-Claros & Oyanedel, 2015;
Goktas et al., 2013).
Those barriers and enablers identified in this study echo those of previous research conducted
in schools and universities. Resources are limited and not available to all teachers consistently,
which acts as a barrier to integration. Barriers related to the potential for disruption in class
through uncontrolled and uncoordinated use of technology were consistent with previous
research (Heflin et al., 2017) and were brought about because of limited access to resources.
Uncontrolled or uncoordinated access also creates barriers for teachers when trying to
integrate technology into their teaching practice. The use of personal devices created barriers
for teachers and were exaggerated when colleges implicitly rely on their use because of a lack
of resources available to teachers and students (Goundar, 2014).
CPD mandated by Ofsted, and forming part of the inspection regime, has superseded training
and CPD in how to integrate technology into teaching practice, besides CPD that forms part of
an inspection regime is considered to be more important by college management. There are
no consistent and uniform teaching packages used in colleges and teacher personal
preference plays a major part; this acts as a barrier when teachers are untrained or unfamiliar
with these packages. Workload and shortage of time are perceived to be barriers to integration
because of the time needed to convert materials to a format used with technology
(Samarawickrema & Stacey, 2007), time to train to use technology effectively, a known dip in
performance and achievement as a result of technology integration that could reflect poorly on
the teacher, as a result teachers continue to use what they are familiar with and know produces
the results expected in student achievement (Somekh et.al., 2004).
156
Reliability of infrastructure is mostly beyond the control of colleges and is part of an ongoing
and widespread debate at a government level. There were; however, some aspects of the
extrinsic barriers highlighted that could be considered unique to the Further and Vocational
Education sector. Lack of resources and access to the available resources created a barrier
to technology integration, with the allocation of resources and access based on subject areas,
Teachers that taught within the Academic subject area, subjects that had externally set
curriculum and paper-based examinations did not receive the same access to resources as
Vocational subject areas where courses were less prescribed, and resources and materials as
well as submissions of course work and examinations were via the VLE. The nature of
Vocational education exacerbated any lack of resources with popular high demand courses
creating excess demand for resources, particularly during exam periods. Lack of resource
within the college increased the reliance on students having personal resources to supplement
this lack of provision. This trait created an additional barrier to technology integration due to a
phenomena termed the digital divide. Unequal access to technology is perceived to be a barrier
to technology use in low socio-economic areas (Hohlfeld et al., 2017; Zhang, 2014).
.
More salient than the extrinsic barriers are the intrinsic barriers, identified as the ‘real
gatekeepers’ to the integration of technology. Intrinsic barriers embrace the core beliefs and
values that teachers hold; many of these are central to what the purpose of teaching is. These
barriers are more difficult to address as they are individual, personal and liable to inexplicable
change (Blackwell et al., 2013; Ertmer & Ottenbreit-Leftwich 2013; Howard, 2013). The
integration of technology is far more complicated than just “some technical skills and a good
attitude” (Zhao et al., 2002, p.511), the fundamental pedagogical beliefs of teachers will
determine the style of teaching that they adopt in the delivery of classes (Bandura, 1986; Clark
& Peterson, 1986).
Self-efficacy has been defined as “the belief that one has the necessary skills and abilities to
perform the behaviour” (DiClemente et al., 2009, p.218). Self-efficacy theory proposed that
certain behaviours will lead to specific outcomes and shows the individual’s expectation of
personal success (Bandura, 1977, 1982; Maddux et al., 1982). Many factors determine a
teacher’s self-efficacy in using and integrating technology and decisions taken by college
management and external bodies have had an impact on teacher efficacy in the use of
technology. The role of technology “champions” has been made redundant in all colleges’; this
has removed a level of support that was viewed as essential by teachers to encourage
technology integration. A shift in focus in recent years away from training and CPD related to
technology integration to other areas, as determined primarily by Ofsted, has reduced the level
of self-efficacy for teachers and limited the integration of technology confining it to areas that

157
teachers feel comfortable in, linked to this notion of boundaries, that all teachers expressed, is
the constant changes and upgrades and the perception from teachers is that they can never
be confident when technology is continually changing; therefore, they will use technology in
areas that they are comfortable and confident with
There are within colleges teachers that will not use and engage with technology in any form
for either teaching or administrative purposes. The interview data showed that teachers used
technology within boundaries that they established and set and were comfortable operating
within. Policymakers and government actively promote the belief that teaching is undergoing
an evolutionary change, shifting decidedly from a teacher-centred to a student-centred activity
(Howard et al., 2015; Plesch et al., 2013). In practice, established curricula and teaching
approaches remain virtually unchanged with technology being underused and poorly
integrated into the classroom (Akcaoglu et al., 2015; Shin, 2015).
The methods employed by teachers will depend on their view of how learning is achieved
(Conole et al., 2004; Trigwell & Prosser, 1996). Technology use raised concerns among a
small number of teachers in two colleges regarding the depth of learning that took place and
that technology promoted surface learning as defined by Marton & Säljö (1997). Instant access
to answers through the internet, using search engines like ‘Google’ led to students having the
apparent instant gratification of providing the answer. The concern from the teachers was that
students might be surface rather than deep learning the subject. Some teachers believed that
students are just happy to search for answers without really understanding either the question
or the answer.
The interview data suggested that whether technology is integrated and used by teachers in
their classroom practices depended on the fundamental beliefs' individuals hold over the
effectiveness and benefits that were derived rived from its use. MacCallum et al. (2014) see
section 2.4.5 the technology adoption model outlined relevant factors that determine if
technology is adopted or rejected in practice. The beliefs that teachers hold regarding what
constitutes teaching and how best this is achieved are the most crucial considerations.
Personal preference has a considerable influence on classroom practice, the beliefs
concerning what constitutes teaching and learning will have a dramatic impact on teaching
style and willingness to change from a method that has probably developed over the years.
The integration of technology takes time to become effective; it requires significant changes to
move from teacher-centred to learner-centred approaches and cannot be achieved in the short
term (Chandra & Mills, 2015). Even when teachers are enthusiastic about using technology,
there remain many barriers to successful integration into teaching practices.

158
6.4 What are teacher's beliefs concerning the integration and contribution
technology can make to their teaching in Further/Vocational Education?
The third research question considered the beliefs of teachers concerning the integration and
contribution technology can make to teaching and learning. Teacher’s beliefs are not
immediately identifiable, consistent or quantifiable and based on personal experience and
emotions, beliefs often shape teacher perceptions of what constitutes teaching and are linked
to their experiences as students and the context in which they operate. Beliefs become
stronger over time and seem to exhibit no logical connections between differing beliefs
(Hansen & Stephens, 2000; Joram & Gabriele, 1998; Lofstrom & Poom-Valickis, 2013;
Pajaras, 1992). Teachers form their own beliefs about the role and contribution that technology
can make to their teaching practice and the value that it can offer to students in terms of
learning outcomes. The degree of change required by teachers to their central beliefs to
integrate technology has often been underestimated (Blackwell et al., 2013) and challenges
what many teachers regard as the basic tenets in teaching and learning (section 2.4.2).
The interview data implied that technology integration and use by teachers in their classroom
practices depends on the fundamental beliefs’ individuals hold over the effectiveness and
benefits derived from its use. The findings in this study and reported by teachers endorsed
those proposed by MacCallum et al. (2014) technology adoption model identified factors that
determine if technology is adopted or rejected in practice. The beliefs that teachers hold
regarding what constitutes teaching and how best this is achieved are the most crucial
considerations.
Teachers in the study considered the purpose of education to be the transfer of information
from the teacher to the student, and technology was viewed as an additional tool in what was
primarily a teacher-centred process. Traditional teaching methods were considered to be the
norm with teachers reluctant to move away from methods that had been developed over time.
Technology was incorporated into existing methods of delivery, but there was no new
pedagogy used by any of the teachers in the study. It was also stated that not all subjects were
compatible with technology use, especially for subjects that were very hands-on or practical.
Teachers were positive about the use of technology and the benefits gained from its use; they
perceived that it made a positive contribution to their teaching practice and student
achievement through better engagement. Teachers enjoyed the flexibility and options that
were available with using technology in classes and presented this as a positive contribution
in moving towards a student-centred approach to teaching and learning while the access

159
through VLE’s when out of college meant that students could interact with the colleagues and
teachers.
A further positive aspect of using technology, derived from the data of participants, was the
ability to enhance and demonstrate aspects of the curriculum that was not possible previously,
this advance was through the application of computer graphics that enabled students to view
3D diagrams, images, videos and graphics that enhanced the interactivity for students and
promoted student engagement with the subject.
The teachers interviewed were positive and receptive to the potential and possibilities that
technology could offer, but these positions were tempered by an almost innate caution that
inhibited them from whole-heartedly accepting all the claims made in some quarters. While all
the teachers agreed that technology-enhanced student engagement, they were unconvinced
that it raised standards of attainment or the benefits and improvements when measured
against the methods that they used currently.
6.5 Limitations of the study.
Whilst the study offers us some interesting insights into teacher’s beliefs about the use of
technology the research, like all research the study is subject to certain limitations The first
limitation of the study is the number of participants, there were only nine colleges that
participated and contributed data, the total number of colleges in England according to the
Association of Colleges in their recent 2017/18 data is 181 FE colleges. A comparison of data,
between the sample participating and the 2017 Education and Training Foundation FE
Workforce data (2017), shows that the sample can be seen to be comparable with the sector,
but the number of participating colleges is relatively small. The willingness of the colleges to
participate in the survey was the first obstacle encountered it was difficult to persuade college
principals to allow participation in the study. Any number of theories might be presented for
non-participation, but some of the reasons given were that the college did not participate in
outside research projects, the college and staff were busy preparing for inspections or audits,
the college was approaching examinations and assessment period and staff would be unable
to devote any time to the project, the college was undertaking other research in the area of the
study and therefore it would just be a duplication of their research. Any or all of these were
major obstacles, but there could be no participation without the consent of the college principal.
Another limitation of the study was down to the difference between the number of participants
taking part in the first phase and second phase survey. Early in the study, and as a result of

160
the concerns raised from the principals regarding participation and reasons for non-
participation, there was a concern that there would not be sufficient participants completing the
first survey. To minimise the survey completion time and thereby overcome any potential issue
presented by this; the intention was to keep the survey as short as possible to complete. In
hindsight, it would have been more advantageous to have incorporated the second phase
survey with the first, but the colleges allocated a specific time frame before summer break that
proved to be a major constraint. The advantage of merging both surveys would have been
having a larger overall number of data sets to compare with other survey data to provide further
support to claims of the sample being representative of the sector. While it is difficult to claim
that the sample is representative of the entire sector, the sample in the study does reflect
favourably with the much larger study conducted by Frontier Economics 2017. Nevertheless,
it has to be accepted that the perceptions and views expressed are personal viewpoints and
cannot, of course, be claimed as representative of the entire sector.
It had been my initial intention to compare colleges in different geographical areas within the
study. Perhaps this is an area for future study provided a larger and more geographically
diverse sample can be obtained, this will, of course, be a much larger study requiring more
time and resources during the data collection and analysis phases, but it could provide useful
data in research exploring the existence of the digital divide, the existence of which acted as
a barrier for teachers in one college to technology integration.
When it came to the distribution of the second stage questionnaire, the number of participants
dropped off compared with the first stage questionnaire. With the responses to the second
phase survey being more narrative in nature, if a greater number of participants had completed
the survey, it would have added to the study and may have provided more evidence to support
the notion that the study reflected the wider sector.
161
6.6 The future: Implications for Policy, Practice & Research
I began the study when the integration of technology and ICT into teaching practices within
Further and Vocational Education was at the forefront of policy from the perspective of the
government, policymakers, external auditors and the management in FE colleges. The
investment in technology, both hardware and software, has been considerable, and the
expectation from government was always that technology would encourage more and better
engagement with learning leading to better attainment. Mindful of the external pressure from
businesses, it was also hoped that students would graduate competent in the uses of
technology and familiar with the applications used in different sectors of business. Previously
the CPD within colleges focused on technology, and there was an expectation that teachers
would integrate technology into their teaching practices.
Research in other sectors provided little in the way of evidence to support the notion that
technology was integrated in anything other than a rudimentary and superficial way. The
perception from the teachers in the study regarding the place of technology is that the use of
technology appears to have fallen down the list of priorities and been superseded by other
“more important” issues that have taken precedence regarding the limited time allocated for
CPD, with management attention focused on the requirements of external audits and
inspections where current CPD requirements have superseded the use and integration of
technology.
The implications of the research study vary depending upon the level at which it is viewed. The
study provides an insight into what skills are perceived to be lacking by teachers in the Post-
Compulsory teaching sector. This insight focuses not on the necessary skills that are used for
everyday purposes such as word processing, research and presentations that all participants
profess to possess at a good level of competence, but the skills that are required for the specific
function of being able to integrate and use technology competently in teaching and delivery.
The study may provide an impetus for the inclusion of courses relating to the integration of
technology in teacher training courses. The provision of this in-depth training, using universal
and widespread technology, would enable trainee teachers or in-service teachers working
towards a teaching qualification an opportunity to develop skills and materials in a supportive
and collaborative environment and would go some way towards enhancing the integration of
technology into the classroom. The provision of such training removed from the colleges will
enable teachers to become familiar with creating materials for use in their teaching practices
as well as becoming familiar with the pedagogical methods required for teaching with
technology rather than teaching about technology. This type of training would not address the

162
needs of teachers who were engaged before 2007 when there was no requirement for teachers
to possess a teaching qualification. Training of staff in this category would need to be
addressed locally within the colleges.
At an institutional level, the study presented the perceptions of teachers, qualified or working
towards a qualification and with many years of experience teaching in the sector, regarding
the skills and training that are needed to enable them to integrate technology effectively into
their teaching practice. The teachers identified that there was a need for concentrated and
targeted training in the development of teaching approaches and methods integrating
technology into classroom practice. It was suggested that training of this nature should be
provided not as CPD sessions limited to perhaps one hour every month, but as a course
delivered over days and weeks at a time when the college was normally closed during the
summer break when students were not in attendance.
Within the participating colleges, the study provides feedback to management on the
perceptions of teachers identifying the barriers and beliefs of practitioners who are expected
to integrate and use technology. The study highlighted the perception among participants that
there was a lack of direction to the use and purpose of technology, personal preference in the
use and selection of teaching packages resulted in many different software packages being
used across and within courses. Teachers perceive there to be a lack of consistency and
leadership from management and rather than being trained on the best package available to
meet the requirements of the curriculum, personal preference dominates.
There is an opportunity for the colleges to decide individually within each department and in
conjunction with management what technology should be used for each course to meet the
learning objectives of the course most effectively, this would provide a degree of consistency
and direction for teaching staff. There should be a skills audit of staff delivering the courses
and individual training plans developed. In this way, staff can achieve clearly defined levels of
competency that can identify the parts of a course they could teach using the technology
available. This would go some way to setting in place a consistent policy regarding the use of
technology, eliminating personal preference and pet projects that could in themselves act as
barriers to teachers.
The study provides management, in the participating colleges, with a snapshot of the
perceptions and beliefs of teachers regarding the use and integration of technology into
teaching practice. It has identified barriers and facilitators that exist and the beliefs and
attitudes that teachers have to the integration of technology. The study provides an insight into

163
the types of training that teachers feel they require and the perceptions that they have
regarding the position of technology in teacher’s practices.
Management must clearly define the benefits of technology integration, communicate the
benefits and rationale for using technology and drive the change if there is a serious intention
of integrating technology. Further change could affect the sector; there is the potential for the
student demographics of FE and Vocational Education to change as a result of the new
Apprenticeship Scheme. Employers faced with a government levy to support the
Apprenticeship scheme have started enrolling existing employees on training courses to gain
some benefit from the levy imposed on them by government. This means that older skilled
workers, that have gained years of experience doing an actual job and learning a trade in the
industry are now attending colleges at the behest of their employers to study formal courses
and gain qualifications, often for the first time and at an age when they would never have
expected to be in a classroom. This is potentially another barrier to the integration of
technology into the classroom and teaching practices. The possibility exists where many
students have never used technology in anything other than a very basic way. They may find
the experience of returning to the classroom daunting enough without the added stress caused
by having to cope with the technology as used in many Vocational courses, as repositories for
materials and, for submitting and completing assignments. There is the potential for the
demographics in some subjects and course to be changed by an influx of older students.
6.7 Future Research.
“The greatest problem we face with educational technology has little to do with recognizing
that it must be an essential part of teaching and learning. Rather it is a lack of clear vision as
to its real purpose and usefulness in shaping the educational system of the future.” (Roblyer,
1993, p.13).
A priority future research area would be to define what technology integration meant. This
would cover several areas, determining what type of technology is effective and the context in
which it is useful. From the results of the study, the teachers primarily perceive technology
integration to mean using presentation tools with the aid of computers and projectors. If this is
what is perceived and accepted as technology integration, then little has changed when
delivery remains a teacher-centred activity continuing to focus on the transfer of information
from teacher to student. If this is technology integration what is the benefit for teachers in
changing what they already do and have resources for doing, as Rogers, (2003) and
MacCallum et al. (2014) state there has to be an improvement or benefit for the teachers to
make the change and implement the integration of technology.
164
There are many research areas that could be explored in any future research as a result of the
study presented. An equally important sphere is a theme that researchers have continued to
grapple with, that is to determine whether technology integration into teaching and learning
improves student attainment as many of the advocates of technology have stated. In a related
field, research could identify if greater student engagement leads to improved attainment and
results.
Once this has been determined that better engagement leads to better attainment then it will
be possible to confidently engage with teachers supported by data showing that technology
integration is effective, this would address a major barrier that came out of the study whereby
teachers were not convinced of the improvements that could be achieved through the
integration and use of technology, the teachers accepted that improvements in student
engagement was noticeable, but did this engagement lead to improved attainment. As a result
of this and within the context in which further and vocational education is situated teachers
continued to use methods of delivery that they are familiar with and perceived to be the best
way for students to achieve the learning outcomes of the course.
It would help in the process of integration if there were a clear definition of what technology
integration in the classroom means. Once this has been determined, then research could take
place to determine if using technology in this way improves student achievement. If and when
it has been established that technology integration improves student attainment then there will
have to be an intensive programme of workshops and training to convince teachers of the
results first of all and then a programme of training and staff development in-line with the
results, packages and technology available.
In this context it must be understood why the technology is not being used, and to this end
there is a need for a study to discover why this is the case to discover the barriers that exist to
technology integration and then work towards reducing and eliminating them. The next stage
for any future research project specific to this question would be to focus on one college and
engage all staff to ensure that the entire spectrum of teachers is covered from the most
enthusiastic advocates to the most reluctant technophobes. This way, the data would reflect
the whole of the college rather than any one particular sector.
The over-riding factor within any study of this nature is that participants need to convinced that
it will be carried out in an atmosphere of discovery, support and development of staff, rather
than one that is perceived with suspicion and unclear or ulterior management motives in which
165
case, it might be perceived as a method to reduce staff numbers or cull staff members that do
not meet some predetermined criteria or level of competence.
Another potential area of research would be to determine the level of access to technology
within colleges and how the access to this technology is determined. As I have previously
stated, I began this study while working in a Gulf State, and every classroom was equipped
with an interactive whiteboard and associated technology. My perception prior to the data
collection part of this study was that there would be a similar inventory available in colleges in
England, this is clearly not the case, therefore it would be worthwhile investigating how much
technology is available in collages, how the allocation and access to this technology is decided
and whether colleges are reliant on students having their own personal devices to supplement
any lack of resources in colleges.
The barriers and affordances to the use of technology are multiple and complex and were
centred around three themes within this study, extrinsic barriers related to deficiencies and
shortages have been highlighted as directly affecting the integration of technology by teachers
interviewed. Incorporated within extrinsic barriers were three clearly identified conditions
related to the provision of resources and how access to resources were often determined by
the context of Further and Vocational Education. The second main theme concerned intrinsic
barriers incorporating efficacy, brought about by a lack of specific training, and the core beliefs
of teachers, that contributed many facets defined as barriers, that were shown to be personal
and individual in nature and had a greater impact on technology integration. The final main
theme included management attitudes and the influence of external bodies; there needs to be
a clear vision of the contribution that technology can make to teaching and learning and a set
clearly defined policies, procedures and standards for integration of technology within colleges
to provide a level of consistency that is evidently lacking at the present time in the participating
colleges.

166

167
References:
Akcaoglu, M., Gumus, S., Bellibas, M.S., & Boyer, D.M. (2015). Policy, practice, and reality:
exploring a nation-wide technology implementation in Turkish schools. Technology,
Pedagogy and Education, 24(4), 477-491.
Albion, P., & Ertmer, P. (2002). Beyond the foundations: The role of vision and beliefs in
teachers’ preparation for integration of technology. TechTrends, 46(5), 34-38.
Al-Qirim, N. (2011). Determinants of interactive white board success in teaching in higher
education institutions. Computers & Education, 56(3), 827-838.
Al-Senaidi, S., Lin, L., & Poirot, J. (2009). Barriers to Adopting Technology and Learning in
Oman. Computer & Education, 53(3), 575-590.
Anderson, R.E. (2008). Implications of the information and knowledge society for education.
In J.Voogt & G. Knezek (Eds), International Handbook of information technology in primary
and secondary education, New York, United States: Springer.
Apple (2008). Apple Classrooms of Tomorrow—Today Learning in the 21st Century
Retrieved from http://education.apple.com/acot2/global/files/ACOT2_Background.pdf
Association of Colleges. (2019). Key Further Education Statistics. Retrieved from
https://www.aoc.co.uk/about-colleges/research-and-stats/key-further-education-statistics
Atkins, L., & Flint, K. (2015). Nothing Changes: Perceptions of vocational education in a
coalition era. International Journal of Training Research, 13(1), 35-48.
Avis, J., Bathmaker, A. M., & Parsons, J. (2001). “Reflections from a Time Log Diary:
Towards an Analysis of the Labour Process within Further Education.” Journal of Vocational
Education and Training, 53(1), 61–80.
Avis, J. (2007). “Post-compulsory Education and Training: Transformism and the Struggle for
Change.” International Studies in Sociology of Education, 17(3), 195–209.
Avis, J., Canning, R., Fisher, R., Morgan-Klein, B., & Simmons, R. (2012). Teacher education
for vocational education and training: a comparative study of the Scottish and English
systems set within a European context. Scottish Educational Review, 44(2), 14-23.

168
Bailey, G., & Colley, H. (2015). ‘Learner-centred’ assessment policies in further education:
putting teachers’ time under pressure, Journal of Vocational Education & Training, 67(2),
153-168.
Balanskat, A., & Bleamir, R. (2007). European Schoolnet (2007). ICT in Schools: Trends,
Innovations and Issues in 2006, 1.
Banas, J. R., & York, C. S. (2018). Authentic learning exercises as a means to influence pre-
service teachers’ technology integration self-efficacy and intentions to integrate
technology. Australasian Journal of Educational Technology, 30(6), 728-746.
Bandura, A. (1977). Self-efficacy: toward a unifying theory of behavioural change.
Psychological review, 84(2), 191-215.
Bandura, A. (1982). Self-efficacy mechanism in human agency. American Psychologist,
37(2), 122-147.
Bandura, A. (1986). Social foundations of thought and action: A social cognitive theory.
Englewood Cliffs, NJ, United Sates: Prentice-Hall.
Bandura, A. (1995). Self-efficacy in changing societies. Cambridge, MA, United States:
University Press.
Bandura, A. (2006). Toward a psychology of human agency. Perspectives on Psychological
Science, 1, 164-180.
Baxter, P., & Jack, S. (2008). Qualitative Case Study Methodology: Study Design and
Implementation for Novice Researchers. The Qualitative Report, 13(4), 544-559.
Bellur, S., Nowak, K., & Hull, K. (2015). Make it our time: In class multitaskers have lower
academic performance. Computers in Human Behaviour, 53, 63-70.
Berdie, D.R., Anderson, J.F., & Niebuhr, M.A. (1986). Questionnaires: Design and Use
(2nded). Lanham, United States: Scarecrow Press.
Betoret, F. D. (2006). Stressors, self‐efficacy, coping resources, and burnout among
secondary school teachers in Spain. Educational psychology, 26(4), 519-539.
169
Billett, S. (2011). Traditions and Prospects. Dordrecht, Netherlands: Springer.
Billett, S. (2014). The standing of vocational education: sources of its
societal esteem and implications for its enactment, Journal of Vocational Education &
Training, 66(1), 1-21.
Bingimlas, K. A. (2009). Barriers to the Successful Integration of ICT in Teaching and
Learning Environments: A Review of the Literature. Eurasia Journal of Mathematics, Science
& Technology Education, 5(3), 235-245.
Birchley, E. (2013). School National Curriculum Changes Unveiled. Retrieved from:
http://news.sky.com/story/1112734/schools-national-curriculum-changes-unveiled.
Blackwell, C., Lauricella, A.R., Wartella, E., Robb, M., & Schomburg, R. (2013). Adoption and
use of technology in early education: The interplay of extrinsic barriers and teacher attitudes.
Computers and Education, 69, 310-319.
Blaikie, N. (2000). Designing Social Research. Cambridge: Polity Press.
Bouwman, H., Carlsson, C., Molina-Castillo, F.J., & Walden, P. (2007). Barriers and drivers
in the adoption of current and future mobile services in Finland. Telematics and Informatics,
24, 145-160.
Braun, V., & Clarke, V. (2006). Using thematic analysis in psychology. Qualitative Research
in Psychology, 3(2), 77-101.
Braun V., Clarke V., Hayfield N., & Terry G. (2019). Thematic Analysis. In: Liamputtong P.
(Ed.) Handbook of Research Methods in Health Social Sciences. Retrieved from
https://link.springer.com/content/pdf/10.1007%2F978-981-10-2779-6_103-1.pdf
Brickner, D. (1995). The effects of first and second order barriers to change on the degree
and nature of computer usage of secondary mathematics teachers: A case study.
Unpublished doctoral dissertation, Purdue University, West Lafayette, United States.
British Educational Research Association (BERA). (2011). Ethical Guidelines for Educational
Research. Retrieved from

170
http://content.yudu.com/Library/A2xnp5/Bera/resources/index.htm?referrerUrl=http://free.yud
u.com/item/details/2023387/Bera
British Sociological Association. (2017). Statement of Ethical Practice. Retrieved from
https://www.britsoc.co.uk/media/24310/bsa_statement_of_ethical_practice.pdf
Brown, S. A., Venkatesh, V., & Goyal, S. (2012). Expectation confirmation in technology use.
Information Systems Research, 23(2), 474–487
Bryman, A. (2015). Social research methods, (5thed.). Oxford: Oxford University Press.
Buabeng-Andoh, C. (2012). Factors influencing teachers’ adoption and integration of
information and communication technology into teaching: A review of the literature.
International Journal of Education and Development using Information and Communication
Technology, 8(1),136-155.
Burguillo, J.C. (2010). Using Game-Theory and Competition-based Learning to Stimulate
Student Motivation and Performance. Computers & Education, 55(2), 566-575.
Burnell, I. (2017) Teaching and learning in further education: The Ofsted factor, Journal of
Further and Higher Education, 41(2), 227-237.
Cambridge Assessment. (2016). Average Age of Teachers in Secondary Schools. Retrieved
from http://www.cambridgeassessment.org.uk/our-research/data-bytes/the-average-age-of-
teachers-in-secondary-schools/
Cárdenas-Claros, M., & Oyanedel, M. (2015). Teachers’ implicit theories and use of ICTs in
the language classroom. Technology, Pedagogy and Education, 1-19.
Carlson, S., & Gadio, C. (2002). Teacher Professional Development in the Use of
Technology. In W. Haddad & A. Draxler (Eds), Technologies for Education: potential,
parameters and prospects. Paris, France: UNESCO & Academy for Educational
Development. Available at: www.aed.org/publications/TechEdInfo.html.
Carpenter, W. A. (2000). Ten years of silver bullets: Dissenting thoughts on education
reform. The Phi Delta Kappan, 81(5), 383-389.
171
Carr, D. K., Hard, H J., & Trahant, W J. (1996). Managing the Change process: A Field Book
for Change Agents, Consultants. Team Leaders, and Reengineering Managers. New York,
United States: McGraw-Hill.
Cedefop (2015). Skill shortages and gaps in European enterprises: striking a balance
between vocational education and training and the labour market. Luxembourg: Publications
Office.
Celik, V., & Yesilyurt, E. (2013). Attitudes to technology, perceived computer self-efficacy
and computer anxiety as predictors of computer supported education. Computers &
Education, 60(1), 148-158.
Chandra, V., & Lloyd, M. (2008). The methodological nettle: ICT and student achievement.
British Journal of Educational Technology. 39(6), 1087-1098.
Chandra, V., & Mills, K.A. (2015). Transforming the core business of teaching and learning in
classrooms through ICT. Technology, Pedagogy and Education, 24(3), 285-301.
Chen, C-H. (2008). Why do teachers not practice what they believe regarding technology
integration? The Journal of Educational Research, 102, 65-75.
Clark, C. M., & Peterson, P. L. (1986). Teachers’ thought processes. In M. C. Wittrock (Ed.),
Handbook of research on reaching (3rd ed., pp.255-296). New York, United States:
Macmillan.
Clarke-Ibanez, M. (2007). Inner city children in sharper focus: Sociology of childhood and
photo-elicitation interviews. In G. Stanczak (Ed.), Visual research methods: Image, society
and representation (pp167-196). Thousand Oaks, United States: Sage.
Clayton, J., & Macdonald, S. J. (2013). The Limits of Technology. Information,
Communication & Society, 16(6), 945-966.
Cohen, L., Manion, L., & Morrison, K. (2007). Research Methods in Education. (6th ed.).
Abingdon: Routledge.
Collier, J. (1967). Visual Anthropology: Photography as a Research Method. New York,
United States: Holt, Rinehart & Winston.

172
Conole, G., Dyke, M., Oliver, M., & Seale, J. (2004). Mapping pedagogy and tools for
effective learning design. Computers & Education 43, 17–33.
Coolican, H. (2013). Research Methods and Statistics in Psychology. (5th ed.). Abingdon:
Routledge
Creswell, J., & Plano Clark, V.L. (2007). Designing and Conducting Mixed Methods
Research. Thousand Oaks, United States: Sage.
Crotty, M. (1998). The Foundations of Social Research Meaning and Perspectives in the
Research Process. London, England: Sage.
Csikszentmihalyi, M. (1995). The Evolving Self: A Psychology for the Third Millennium. New
York, United States: Harper Collins.
Cuban, L. (2011). Teacher resistance and reform failure. [Weblog]. Retrieved from
http://larrycuban.wordpress.com/2011/04/30/teacher-resistance-and-reform-failure/
Daly, C., Pachler, N., & Pelletier, C. (2009). Continuing Professional Development in ICT for
Teachers: A literature review. BECTA.
Davey, B., & Parker, K. R. (2010, June). Technology in education: An agile systems
approach. In Proceedings of 2010 Informing Science+ Information Technology Education
(InSITE) Conference. Cassino Italy. Retrieved from
http://proceedings.informingscience.org/InSITE2010/InSITE10p297-306Davey785.pdf
Denzin, N.K., & Lincoln, Y.S. (2005). Introduction The Discipline and Practice of Qualitative
Research In N.K. Denzin & Y.S. Lincoln (Eds), Handbook of Qualitative Research (3rd ed.).
Thousand Oaks, United States: Sage.
Denzin, N.K. and Lincoln, Y.S. (2013). Introduction The Discipline and Practice of Qualitative
Research In N.K. Denzin and Y.S. Lincoln (Eds), Collecting and Interpreting Qualitative
Materials (5th ed.). Thousand Oaks, United States: Sage.
Department for Business, Innovation and Skills. (2014). The Government’s Strategy to
Support Workforce Excellence in Further Education. Retrieved from
https://www.gov.uk/government/publications/further-education-workforce-strategy

173
Department for Education and Skills (2003). Fulfilling the Potential Transforming teaching
and learning through ICT in schools. Retrieved from
http://dera.ioe.ac.uk/6094/1/eOrderingDownload/FulfillingthePotential.pdf.
Department for Education (2012) Education system in United Kingdom. Retrieved from
https://assets.publishing.service.gov.uk/government/uploads/system/uploads/attachment_dat
a/file/219167/v01-2012ukes.pdf
Department for Education (2018). Education and Training Statistics for the United Kingdom
2018. Retrieved from
https://assets.publishing.service.gov.uk/government/uploads/system/uploads/attachment_dat
a/file/757675/UKETS_2018_Text.pdf
De Vaus, D. A. (2011). Research Design in Social Research. London, England: Sage.
De Witte, K., & Rogge, N. (2014). Does ICT matter for effectiveness and efficiency in
mathematics education? Computers & Education, 75, 173-184.
DiClemente, R. J., Crosby, R. A., & Kegler, M. (2009). Emerging theories in health promotion
practice and research. Hoboken, United States: John Wiley & Sons.
Dillenbourg, P., Järvelä, S., & Fischer, F. (2009). The evolution of research on computer-
supported collaborative learning. In Technology-enhanced learning (pp.3-19). Dordrecht,
Netherlands: Springer.
Dinham, S., & Scott, C. (2000). "Moving into the third, outer domain of teacher
satisfaction". Journal of Educational Administration, 38(4), 379-396,
Donnelly, D., McGarr, O., & O’Reilly, J. (2011). A framework for teachers’ integration of ICT
into their classroom practice. Computers & Education, 57(2), 1469-1483.
Duberley, J., Johnson, P., & Cassell, C. (2012). Philosophies underpinning Qualitative
research In G. Symon & C. Cassell (Eds.), Qualitative Organizational Research: Core
Methods and Current Challenges London: Sage.
Dunn, R.S., & Dunn, K.J. (1979). Learning Styles/Teaching Styles: Should They ... Can They
... Be Matched? Educational Leadership, 36(4), 238-244.

174
Dwyer, S. C., & Buckle, J.L. (2009). “The Space Between: On Being an Insider-Outsider in
Qualitative Research.” International Journal of Qualitative Methods, 8, 54–63.
Dynarski, M., Agodini, R., Heaviside, S., Novak, T., Carey, N., Campuzano, L., Means, B.,
Murphy, R., Penuel, W., Javitz, H., Emery, D., & Sussex, W. (2007). Effectiveness of
Reading and Mathematics Software Products: Findings from the First Student Cohort,
Washington, D.C.: U.S. Department of Education, Institute of Education Sciences. Retrieved
from https://ies.ed.gov/ncee/pdf/20074005.pdf
Earle, R.S. (2002). The integration of instructional technology into public education: Promises
and challenges. Educational Technology, 42(1), 5-13.
Education International. (2009). Literature Review Vocational Education and Training.
Retrieved from http://download.ei-
ie.org/Docs/WebDepot/091213_VET_Literature_EDITED%20AA.pdf.
Edward, S., Coffield, F., Steer, R., & Gregson, M. (2007). Endless Change in the Learning
and Skills Sector: the impact on teaching staff. Journal of Vocational Education and Training,
59(2), 155-173
Ertmer, P.A. (1999). Addressing First- and Second-Order Barriers to Change: Strategies for
Technology Integration. Educational Technology Research and Development, 47(4), 47-61.
Ertmer, P.A. (2005). Teacher Pedagogical Beliefs: The Final Frontier in Our Quest for
Technological Integration? Educational Technology Research and Development, 53(4), 25-
39.
Ertmer, P.A., & Ottenbreit-Leftwich, A. (2010). Teacher technology change: How knowledge,
confidence, beliefs and culture intersect. Journal of Research on Technology in Education,
42(3), 255-284.
Ertmer, P. A., Ottenbreit-Leftwich, A. T., Sadik, O., Sendurur, E., & Sendurur, P. (2012).
Teacher’s beliefs and technology integration practices: a critical relationship. Computers and
Education, 59(2), 423–435.
Ertmer, P. A., & Ottenbreit-Leftwich, A. T. (2013). Removing obstacles to the pedagogical
changes required by Jonassen’s vision of authentic technology-enabling learning. Computers
and Education, 64, 175-182.

175
Eteokleous, N. (2008). Evaluating computer technology integration in a centralized school
system. Computers and Education, 51, 669–686.
European Agency for Special Needs and Inclusive Education (2014). Vocational Education
and Training – Summary of Country Information. Odense, Denmark: European Agency for
Special Needs and Inclusive Education.
Feather, D. (2010). “A Whisper of Academic Identity: An HE in FE Perspective.” Research in
Post-Compulsory Education, 15(2), 189-204.
Feather, D. (2017). Time! What’s that? You’re joking, I don’t have any!,
Journal of Further and Higher Education, 41(5), 706-716.
Feiman-Nemser, S., & Buchmann, M. (1987). When is student teaching teacher education?
Teaching and Teacher Education, a, 255-273.
Fiedler, J., & Posch, C. (2009). Yes, They Can! Children Researching Their Lives: 2nd
International Conference on Research with and on Children, Hermann Gmeiner Academy.
Innsbruck, Baltmannsweiler: Schneider Verlag Hohengehren.
Flyvbjerg, B. (2011). “Case Study,” In N.K. Denzin & Y.S. Lincoln (Eds.), The Sage
Handbook of Qualitative Research. (4thed., pp.301-316). Thousand Oaks, United States:
Sage.
Fried, C. B. (2008). In-class laptop use and its effects on student learning. Computers &
Education, 50(3), 906–914.
Frontier Economics (2017). Further Education Workforce Data for England. Analysis of the
2015-2016 Staff Individualized Record (SIR) data. Frontier Economics. Education and
Training Foundation.
Fullan, M., & Stiegelbauer, S. (1991). The new meaning of educational change. School
Effectiveness and School Improvements, 2(4), 336-343.
Garbett, G., Orrock, D., & Smith, R. (2013). “Culture Clash: Mentoring Student Literacy
Educators in a Marketised and Instrumentalist Further Education Policyscape.” Research in
Post-compulsory Education, 18(3), 239–256.

176
Gleeson, D. (2014). ‘Trading Places On becoming an FE professional’ In S. Crowley, 2014,
(Ed), Challenging Professional Learning, (pp20-30). London, England: Routledge.
Gleeson, D., Hughes, J., O’ Leary, M., & Smith, R. (2015). “The State of Professional
Practice and Policy in the English Further Education System: A View from below.” Research
in Post-Compulsory Education, 20(1), 78–95.
Goktas, Y., Gedik, N., & Baydas, O. (2013). Enablers and barriers to the use of ICT in
primary schools in Turkey: A comparative study of 2005–2011. Computers and Education,
68, 211-222.
Goodson, I. F., & Mangan, J. M. (1995). Subject cultures and the introduction of classroom
computers. British Educational Research Journal, 21(5), 613–628.
Gorard, S (2013). Research Design Creating Robust Approaches for the Social Sciences.
London, England: Sage.
Gorder, L.M. (2008). A study of teacher perceptions of instructional technology integration in
the classroom. Delta Pi E[silom Journal, 50(2), 63-76.
Goundar, S. (2014). The Distraction of Technology in the Classroom. Journal of Education &
Human Development, 3(1), 211-229.
Griffin, T. D., & Ohlsson, S. (2001, August). Beliefs versus knowledge: A necessary
distinction for explaining, predicting, and assessing conceptual change. In Proceedings of the
23rd Annual Conference of the Cognitive Science Society. Edinburgh, Scotland University of
Edinburgh. Retrieved from http://csjarchive.cogsci.rpi.edu/proceedings/2001/cogsci01.pdf
Grix, J. (2002). Introducing Students to the Generic Terminology of Social Research. Politics
22(3), 175–186
Grollmann, P. (2008). The Quality of Vocational Teachers: teacher education, institutional
roles and professional reality. European Educational Research Journal, 7(4), 535-547.
Hammersley, M. (2012). What is Qualitative Research? London: Bloomsbury.

177
Hammersley, M., & Traianou, A. (2012). Ethics and Educational Research, British
Educational Research Association on-line resource. Retrieved from:
https://www.bera.ac.uk/wp-content/uploads/2014/03/Ethics-and-Educational-Research.pdf
Hansen, E.J., & Stephens, J.A. (2000). The Ethics of Learner-Centred Education: Dynamics
that Impede the Process. Change, 32(5), 40-47.
Harkin, J. (2005). Fragments stored against my ruin: The place of educational theory in the
professional development of teachers in further education. Journal of Vocational Education
and Training, 57(2), 165–79.
Harris, R., Simons, M., & Maher, K. (2009). New directions in European vocational education
and training policy and practice: Lessons for Australia. Centre for Research in Education,
Equity and Work. University of South Australia.
Hattie, J., & Yates, G. C. (2013). Visible learning and the science of how we learn. Abingdon,
England: Routledge.
Hawkridge, D. (1990). Who needs computers in schools, and why?. Milton Keynes, England:
Open University. Inst. of Educational Technology.
Haydn, T. (2014). How do you get pre-service teachers to become ‘good at ICT’ in their
subject teaching. The views of expert practitioners. Technology, Pedagogy and Education.
23(4), 455-469.
Heflin, H., Shewmaker, J., & Nguyen, J. (2017). Impact of mobile technology on student
attitudes, engagement, and learning. Computers & Education, 107, 91-99.
Hennessy, S., Ruthven, K., & Brindley, S. (2005). Teacher perspectives on integrating ICT
into subject teaching: commitment, constraints, caution, and change, Journal of Curriculum
Studies, 37(2), 155-192.
Hernández-Ramos, J.P., Martínez-Abad, F., García Peñalvo, F.J., García, M.E.H., &
Rodríguez-Conde, M.J. (2014). Teachers’ attitude regarding the use of ICT. A factor
reliability and validity study. Computers in Human Behavior, 31, 509-516.
Higgins, S., Beauchamp, G., & Miller, D. (2007). Reviewing the literature on interactive
whiteboards. Learning, Media, & Technology, 32(3), 213-22

178
Higher Education Statistics Agency Limited, (2015) Staff in Higher Education. Retrieved from
https://www.hesa.ac.uk/data-and-analysis/publications/staff-2013-14/introduction
Hohlfeld, T.N., Ritzhaupt, A.D., Dawson, K., & Wilson, M.L. (2017). An examination of seven
years of technology integration in Florida schools: Through the lens of the Levels of Digital
Divide in Schools. Computers & Education, 113, 135-161.
Howard, S.K. (2013). Risk-aversion: understanding teachers’ resistance to technology
integration. Technology, Pedagogy and Education, 22(3), 357-372.
Howard, S.K., Chan, A., Mozejko, A. and Caputi, P. (2015). Technology practices:
Confirmatory factor analysis and exploration of teachers’ technology integration in subject
areas. Computers and Education, 90, 24-35.
Hu, Z & McGrath I. (2011). Innovation in higher education in China: are teachers ready to
integrate ICT in English Language teaching? Teaching, Pedagogy and Education, 20(1), 41-
59.
Hughes, J., & Attwell, G. (2010). Training needs of trainers and VET teachers in the UK. In:
S. Kirpal (Ed.), Changing roles and competences of VET teachers and trainers. Vol.2, 7-22.
University of Bremen: Germany.
Hupkau, C., McNally, S., Ruiz-Valenzuela, J., & Ventura, G. (2016). Post-Compulsory
Education in England: Choices and Implications Discussion Paper 001 Centre for Vocational
Educational Research London School of Economics & Political Science
Hwang, G. J., Hung, C. M., & Chen, N. S. (2014). Improving learning achievements,
motivations and problem-solving skills through a peer assessment-based game development
approach. Educational Technology Research and Development, 62(2), 129-145.
Hyland, T., & Winch, C. (2007). A Guide to Vocational Education and Training, London:
Continuum.
Jephcote, M., Salisbury, J., & Rees, G. (2008). “Being a Teacher in Further Education in
Changing Times.” Research in Post-compulsory Education, 13(2), 163–172.

179
Johnson, L., Adams Becker, S., Estrada, V., &Freeman, A. (2015). NMC Horizon Report:
2015. Higher Education Edition. Austin, United States: The New Media Consortium.
Jones, A.L. (2004). Becta | A review of the research literature on barriers to the uptake of ICT
by teachers, Retrieved from
https://dera.ioe.ac.uk/1603/1/becta_2004_barrierstouptake_litrev.pdf
Joram, E., & Gabriele, A. (1998). Preservice teacher’s prior beliefs: transforming obstacles
into opportunities. Teaching and Teacher Education, 14(2), 175-191.
Karlsson, J. (2012). Visual methodologies. In J. Arthur, M. Waring, R. Coe, and L.V. Hedges
(Eds), Research Methods & Methodologies in Education. (pp. 177-185). London, England:
Sage.
Kats, E., van Lakerveld, J., & Smit H (2010) Changing roles and competences in vocational
training and professional development—reflections on the interviews with Dutch educational
professionals. In: Kirpal S (Ed.), Changing roles and competences of VET teachers and
trainers. Final Report National Summaries of Interview Results, Vol 2. University of Bremen:
Germany, 23–33.
Kavanoz, S., Yüksel, H. G., & Özcan, E. (2015). Pre-service teachers' self-efficacy
perceptions on Web Pedagogical Content Knowledge. Computers & Education, 85, 94-101.
Keengwe, J., Onchwari, G., & Wachira, P. (2008). Computer Technology Integration and
Student Learning: Barriers and Promise. Journal of Science Education and Technology,
17(6), 560-565.
Kirschner, P., & Selinger, M. (2003). The state of affairs of teacher education with respect to
information and communications technology, Technology, Pedagogy and Education, 12(1),
5-17.
Kerckaert, S., Vanderlinde, R., & van Braak, J. (2015). The role of ICT in early childhood
education: Scale development and research on ICT use and influencing factors. European
Early Childhood Education Research Journal, 23(2), 183-199.
Kerstetter, K. (2012). Insider, Outsider, or Somewhere In Between: The impact of
researchers’ identities on community-based research process. Journal of Rural Social
Sciences, 27(2), 99–117.

180
Keys, P. M. (2007). A knowledge filter model for observing and facilitating change in
teachers’ beliefs. Journal of Educational Change, 8(1), 41-60.
Korte, W.B., & Husing, T. (2007). Benchmarking access and use of ICT in European schools
2006: Results from Head teacher and a classroom surveys in 27 European countries,
elearning papers, 29(10), 1-6.
Kozol, J. (2005). Still separate, still unequal. Harper's Magazine, 9, 41-55.
Kreijns, K., Kirschner, P. A., & Jochems, W. (2003). Identifying the pitfalls for social
interaction in computer-supported collaborative learning environments: a review of the
research. Computers in human behavior, 19(3), 335-353.
Kuznekoff, J. H., & Titsworth, S. (2013). The impact of mobile phone usage on
student learning. Communication Education, 62(3), 233–252.
Kvale, S. (2007). Doing Interviews, London England: Sage.
Kvale, S., & Brinkmann, S. (2009). Inter Views: Learning the Craft of Qualitative Research
Interviewing, Los Angeles, United States: Sage.
Lau, W. W. F., & Yuen, A. H. K. (2013). Educational technology training workshops for
mathematics teachers: An exploration of perception changes. Australasian Journal of
Educational Technology, 29(4), 595-611.
Laverty, S.M. (2003). Hermeneutic Phenomenology and Phenomenology: A Comparison of
Historical and Methodological Considerations. International Journal of Qualitative Methods,
2(3), 21-35.
Lee, Y. H., Hsiao, C., & Ho, C. H. (2014). The effects of various multimedia instructional
materials on students’ learning responses and outcomes: A comparative experimental study.
Computers in Human Behaviour, 40, 119-132.
Lee, M. & Tsai, C. (2010) Exploring Teachers' Perceived Self Efficacy and Technological
Pedagogical Content Knowledge with Respect to Educational Use of the World Wide Web.
Instructional Science: An International Journal of the Learning Sciences, 38(1), 1-21.

181
Leininger M. (1994). Evaluation criteria and critique of qualitative research studies. In: J
Morse (Ed.). Critical Issues in Qualitative Research Methods (95-115). Thousand Oaks,
United States: Sage,95–115.
Levy, A. (1986). Second-order planned change: Definition and conceptualization.
Organisational Dynamics, 15(1), 5-17, 19-23
Li, K., Li, Y., & Franklin, T. (2016). Preservice Teachers’ Intention to Adopt Technology in
Their Future Classrooms. Journal of Educational Computing Research. Retrieved from
https://doi.org/10.1177/0735633116641694
Lichtman, M. (2010). Qualitative Research in Education: A Users Guide. (2nd ed.). Thousand
Oaks, United States: Sage.
Lim, C.P. (2007). Effective Integration of ICT in Singapore Schools: Pedagogical and Policy
Implications. Educational Technology Research and Development, 55(1), 83-116.
Lincoln, Y.S. and Guba, E.G. (1985). Naturalistic inquiry. Beverly Hills, United States: Sage.
Liu, S.H. (2011). Factors related to pedagogical beliefs of teachers and technology
integration. Computers & Education, 56, 1012-1022.
Liu, S.H. (2013). Teacher professional development for technology integration in a primary
school learning community. Technology, Pedagogy and Education, 22(1), 37-54.
Livingstone, S. (2012). Critical reflections on the benefits of ICT in education. Oxford review
of education, 38(1), 9-24.
Lofstrom, E. & Poom-Valickis, K. (2013). Beliefs about teaching: Persistent or Malleable? A
longitudinal study of Prospective student teachers' beliefs. Teaching and teacher Education,
35, 104-113.
Lub, V. (2015). Validity in Qualitative Evaluation: Linking Purpose, Paradigms, and
Perspectives. International Journal of Qualitative Methods, 1-8.
Lucas, N & Nasta, T. (2010). State regulation and the professionalisation of further education
teachers: a comparison with schools and HE, Journal of Vocational Education and Training,
62(4), 441-454.
182
Lucas, N. (2013) One step forward, two steps back? The professionalisation of further
education teachers in England, Research in Post-Compulsory
Education, 18(4), 389-401.
MacCallum, K., Jeffrey, L., & Kinshuk. (2014). Factors impacting teachers’ adoption of mobile
learning. Journal of Information Technology Education: Research, 13. Retrieved from
http://www.jite.org/documents/Vol13/JITEv13ResearchP141-162MacCallum0455.pdf.
MacKenzie, N., & Knipe, S. (2006). Research dilemmas: Paradigms, methods and
methodology. Issues in Educational Research, 16(2). 193-205.
Mack, L. (2010). The Philosophical Underpinnings of Educational Research. Polyglossia 19.
Retrieved from
https://secure.apu.ac.jp/rcaps/uploads/fckeditor/publications/polyglossia/Polyglossia_V19_Li
ndsay.pdf
Maddux, J. E., Sherer, M., & Rogers, R. W. (1982). Self-efficacy expectancy and outcome
expectancy: Their relationship and their effects on behavioural intentions. Cognitive Therapy
and Research, 6(2), 207-211.
Malterud, K. (2001). "Qualitative research: Standards, challenges and guidelines." The
Lancet, 358, 483-488.
Mama, M., & Hennessy, S. (2013). Developing a typology of teacher beliefs and practices
concerning classroom use of ICT. Computers & Education, 68, 380–387.
Marcinkiewicz, H. R. (1993). Computers and teachers: Factors influencing computer use in
the classroom. Journal of Research on Computing in Education, 26, 220–237.
Marton, F., & Säljö, R. (1997). ‘Approaches to learning’, In F. Marton, D. Hounsell, and N.J.
Entwistle (Eds), The Experience of Learning (pp. 39–58). Edinburgh, Scotland: Scottish
Academic Press.
Mather, K., Worrall, L., & Seifert, R. (2007) Reforming further education: the changing labour
process for college lecturers. Personnel Review, 36(1), 109-127.
183
Maxwell, J.A. (1996). Qualitative research design: An interactive approach. Thousand Oaks,
United States: Sage.
Mears, C.L. (2012). In-depth interviews. In J. Arthur, M. Waring, R. Coe, & L.V. Hedges,
(Eds.), Research Methods & Methodologies in Education (pp. 15-20). London: Sage.
Mercer, J. (2007). “The Challenges of Insider Research in Educational Institutions: Wielding
a Double-edged Sword and Resolving Delicate Dilemmas.” Oxford Review of Education, 33,
1–17.
Merriam, S.B. (1998). Qualitative research and case study applications in education. San
Francisco, United States: Josey-Bass.
Merton, R. (1972). “Insiders and Outsiders: A Chapter in the Sociology of Knowledge.”
American Journal of Sociology, 78, 9–47.
Messina, L., & Tabone, S. (2013). Technology proficiency, TPACK and beliefs about
technology: A survey with primary school student teachers. REM–Research on Education
and Media, 5(1), 11-30.
Meyer, K. A. (2002). Quality in Distance Education: Focus on On-Line Learning. ASHE-ERIC
Higher Education Report. Jossey-Bass Higher and Adult Education Series. 29(4). San
Francisco United States: Wiley.
Mishra, P., & Koehler, M.J. (2006). Technological pedagogical content knowledge: A
framework for integrating technology in teacher knowledge. Teachers College Record,
108(6), 1017-1054.
Morse, J.M., Barrett, M., Mayan, M., Olson, K., & Spiers, J. (2002). Verification strategies for
establishing reliability and validity in qualitative research. International Journal of Qualitative
Methods, 1, 13-22.
Munn, P., & Dreyer, E. (1990). Using Questionnaires in Small-Scale Research. A Teachers’
Guide. Scottish Council for Research in Education.
Mutch, C. (2012). Curriculum change and teacher resistance. Curriculum Matters, 8, 1-8.
184
Myers, M.D. (2013). “Qualitative Research in Business & Management” (2nd ed.). London:
Sage.
Nagel, D. (2014). Spending on Instructional Tech To Reach $19 Billion Within 5 Years. The
Journal Retrieved from: http://thejournal.com/articles/2014/06/11/spending-on-instructional-
tech-to-reach-19-billion-within-5-years.aspx.
National Education Association. (2008). Technology in schools: The ongoing challenge of
access, adequacy, and equity. Policy Brief # 19. Washington DC: NEA Policy and Practice
Department. ww.nea.org/assets/docs/PB19_Technology08.pdf.
Nespor, J. (1987). The role of beliefs in the practice of teaching. Journal of Curriculum
Studies, 19(4), 317-328.
Neyland, E. (2011). Integrating online learning in NSW secondary schools: Three school’s
perspectives on ICT adoption. Australia Journal of Educational Technology, 27(1), 152-173.
Noel, P. (2006). The secret life of teacher educators: becoming a teacher educator in the
learning and skills sector. Journal of Vocational Education & Training, 58(2), 151-170.
Oddone, F. (2016). Cloud Computing Applications and Services fostering Teachers’ Self-
efficacy. Journal of e-Learning and Knowledge Society, 12(2).
OECD (2012). Post-Secondary Vocational Education and Training: Pathways and
Partnership. Higher Education in Regional and City Development, OECD Publishing.
Ofsted (2018) 2018 Further education and skills inspection handbook Retrieved
from https://www.gov.uk/government/publications/further-education-and-skills-
inspection-handbook#history.
Orr, K. & Simmons, R. (2010). Dual identities: the in‐service teacher
trainee experience in the English further education sector, Journal of Vocational Education &
Training, 62(1), 75-88.
Pajares, M. (1992). Teachers' Beliefs and Educational Research: Cleaning up a Messy
Construct. Review of Educational Research, 62(3), 307-332.
185
Parry, G., Blackie, P., Thompson, A., Hayday, S., Greenwood, M., & Parker, L. (2009).
Supporting Higher Education in Further Education Colleges - Policy, Practice and Prospects.
Bristol: Higher Education Funding Council for England.
Petko, D. (2012). Teachers’ pedagogical beliefs and their use of digital media in classrooms:
Sharpening the focus of the ‘will, skill, tool’ model and integrating teachers’ constructivist
orientations. Computers & Education, 58(4), 1351-1359.
Petko. D., Egger, N., Cantieni, A., & Wespi, B., (2015). Digital media adoption in schools:
Bottom-up, top-down, complementary or optional? Computers & Education, 84, 49-61.
Pierce, R., & Ball, L. (2009). Perceptions That May Affect Teachers’ Intentions to Use
Technology in Secondary Mathematics Classes. Educational Studies in Mathematics, 71(3),
299-317.
Pink, S. (2004). ‘Visual Methods’, In C. Seale, G. Gobo, J.F. Gubrium, & D. Silverman (Eds.),
Qualitative Research Practice. London: Sage.
Plesch, C., Kaendler, C., Rummel, N., Wiedmann, M., & Spada, H. (2013). Identifying Areas
of Tension in the field of technology-enhanced learning: Results of an international Delphi
study. Computers and Education, 65, 92-105.
Plowright, D., and G. Barr. (2012). “An Integrated Professionalism in Further Education: A
Time for Phronesis?” Journal of Further and Higher Education, 36(1), 1–16.
Polkinghorne, D. (1983). Methodology for the human sciences: Systems of inquiry. Albany,
United States: State University of New York Press.
Popkewitz, T.S. (2004). Is the National Research Council committee’s report on scientific
research in education scientific? On trusting the manifesto. Qualitative Inquiry, 10(1). 62 –
78.
Prestridge, S. (2012). The beliefs behind the teacher that influence their ICT practices.
Computers & Education, 58, 449-458.
Prosser, M., & Trigwell, K. (1998). Understanding Learning and Teaching: The Experience in
Higher Education. Milton Keynes, England: Open University Press.
186
Qu, S.Q. & Dumay, J. (2011). The qualitative research interview. Qualitative Research in
Accounting & Management, 8(3), 238-264.
Ravizza, S., Hambrick, D., & Fenn, K. (2014). Non-academic internet use in the classroom is
negatively related to classroom learning regardless of intellectual ability. Computers &
Education, 78, 109-114.
Richardson, V. (2003). Pre-service Teachers’ Beliefs. In J. Raths & A. McAninch (Eds).
Teacher beliefs and classroom performance: The impact of teacher education. Greenwich,
United States: Information Age Publishing.
Roblyer, M. D. (1993). Why use technology in teaching? Making a case beyond research
results. Florida Technology in Education Quarterly, 5(4), 7-13.
Rogers, E.M. (2003). Diffusion of Innovations (5th ed). New York, United States: Free Press
15-16.
Rolfe, G. (2006). Validity, trustworthiness and rigour: Quality and the idea of qualitative
research. Journal of Advanced Nursing, 53, 304-310.
Royal Society (2012). Shut down or restart? The way forward for computing in UK schools.
Retrieved from http://royalsociety.org/education/policy/computing-in-schools/report/
Saadé, R. G., & Kira, D. (2007). Mediating the impact of technology usage on perceived
ease of use by anxiety. Computers and Education, 49(4), 1189–1204.
Sadaf, A., Newby, T.J., & Ertmer, P.A. (2012). Exploring pre-service teachers’ beliefs about
using Web 2.0 technologies in K-12 classroom. Computers and Education, 59, 947-955.
Samarawickrema, G., & Stacey, E. (2007). Web-based learning and teaching: A case study
in higher education. Distance Education, 28(3), 313-333.
Sammons, P. (2005). Ethical Issues & Statistical Work. In R G Burgess (Ed.), The Ethics of
Education Research. Abingdon, England: Routledge.
Sandelowski, M., & Barroso, J. (2002). Reading qualitative studies. International Journal of
Qualitative Methods, 1(1), 74-108.
187
Sang, G., Valcke, M., van Braak, J., Tondeur, J., & Zhu, C. (2011). Predicting ICT integration
into classroom teaching in Chinese primary schools: exploring the complex interplay of
teacher‐related variables. Journal of Computer Assisted Learning, 27(2), 160-172.
Saunders, M., Lewis, P., & Thornhill, A. (2009). Research methods for business students. (5th
ed.). Harlow: Pearson.
Scherer, R., & Siddiq, F. (2015). Revisiting teachers’ computer self-efficacy: A differentiated
view on gender differences. Computers in Human Behaviour, 53, 48-57.
Scherer, R., Siddiq, F., & Teo, T. (2015). Becoming more specific: Measuring and modeling
teachers’ perceived usefulness of ICT in the context of teaching and learning. Computers
and Education, 88, 202-214.
Scottish Educational Research Association (SERA) Ethical Guidelines for Educational
Research. (2005). Retrieved from:
http://www.sera.ac.uk/documents/Publications/SERA%20Ethical%20GuidelinesWeb.PDF
Scrimshaw, P. (2004). Enabling Teachers to Make Successful Use of ICT, BECTA.
Seale, C. (1999). The Quality of Qualitative Research. London: Sage.
Selwyn, N., Dawes, L., & Mercer N. (2001). Promoting Mr.‘Chips’: the construction of the
teacher/computer relationship in educational advertising. Teaching and Teacher Education,
17, 3-14.
Shain, F., & Gleeson, E. (1990). “Under New Management: Changing Conceptions of
Teacher Professionalism and Policy in the Further Education Sector.” Journal of. Education
Policy, 14(4), 445–462.
Shulman, L. S. (1986). Those who understand: Knowledge growth in teaching. Educational
Researcher, 15, 4-14.
Shulman, L. S. (1987). Knowledge and teaching: Foundations of the new reform. Harvard
Educational Review, 57, 1-22.
188
Shawer, S. F. (2013). Initial teacher education: Does self-efficacy influence candidate
teacher academic achievement and future career performance? Journal of Further and
Higher Education, 37(2), 201-223.
Shenton, A.K. (2004). Strategies for ensuring trustworthiness in qualitative research projects,
Education for Information 22, 63-75.
Shin, W.S. (2015). Teachers’ use of technology and its influencing factors in Korean
elementary schools, Technology, Pedagogy and Education, 24(4), 461-476.
Simmons, J & Lea, J. (2013). Capturing an HE ethos in college higher education practice.
Gloucester: QAA.
Simmons, R. (2008). Golden years? Further education colleges under local authority control.
Journal of Further and Higher Education, 32(4), 359–371.
Sipila, K. (2010). The impact of laptop provision on teacher attitudes towards ICT.
Technology, Pedagogy and Education, 19(1), 3-16.
Sipila, K. (2013). Educational use of information and communications technology: teachers’
perspective: Technology, Pedagogy and Education, 23(2), 225-241.
Sirk, M., Liivik, R., & Loogma, K. (2016). Changes in the professionality of vocational
teachers as viewed through the experiences of long-serving vocational teachers in Estonia.
Empirical Research in Vocational Education and Training, 8-13.
Skills Commission (2010) Teacher Training In Vocational Education. European Training
Foundation. Retrieved from
http://www.edge.co.uk/media/17075/teaching_training_in_vocational_education_-_report.pdf.
Snoeyink, R. & Ertmer, P.A. (2001). Thrust into Technology: How Veteran Teachers
Respond. Journal of Educational Technology Systems. 30(1), 85-111.
Somekh, B., Underwood, J., Convery, A., Dillon, G., Lewin, C., Mavers, D., …& Woodrow, D.
(2004) Evaluation of DfEs ICT Test Bed project. Annual Report of the Department for
Education and Skills. Retrieved from:
http://dera.ioe.ac.uk/1598/7/becta_2004_icttestbed_annualreport_report_Redacted.pdf.

189
Spöttl, G. (2013). "Permeability between VET and higher education – a way of human
resource development". European Journal of Training and Development, 37(5), 454 – 471.
Stake, R.E. (2005). Qualitative Case Studies, In N.K. Denzin & Y.S. Lincoln (Eds.), The Sage
Handbook of Qualitative Research (3rd ed., pp.443-466). Thousand Oaks, United States:
Sage.
Stenbacka, C. (2001). Qualitative Research Requires Quality Concepts of Its Own.
Management Decision, 39, 551-555.
Stevenson, I. (2013) Does technology have an impact on learning? A Fuzzy Set Analysis of
historical data on the role of digital repertoires in shaping the outcomes of classroom
pedagogy. Computers and Education, 69, 148-158.
Straub, E. T. (2009). Understanding technology adoption: Theory and future directions for
informal learning. Review of Educational Research, 79(2), 625–649.
Sung, H. Y., & Hwang, G. J. (2013). A collaborative game-based learning approach to
improving students' learning performance in science courses. Computers & Education, 63,
43-51.
The House of Lords Select Committee on Communications. (2013). Broadband for all - an
alternative vision. Retrieved from
https://publications.parliament.uk/pa/ld201213/ldselect/ldcomuni/41/4107.htm
Thompson, R. and Robinson, D. (2008). Changing step or marking time? Teacher education
reforms for the learning and skills sector in England. Journal of Further and Higher
Education, 32(2), 161-173.
Tobin, K., & Garnett, P. (1988). Exemplary practice in science classrooms. Science
Education, 72, 197-208.
Tomlinson, M. (2008). ‘The degree is not enough’: students’ perceptions of the role of higher
education credentials for graduate work and employability, British Journal of Sociology of
Education, 29(1), 49-61.
Tondeur, J., Van Keer, H., van Braak, J., & Valcke, M. (2008). ICT integration in the

190
classroom: Challenging the potential of a school policy. Computers & Education, 51,
212–223.
Trigwell, K., & Prosser, M. (1996). Changing approaches to teaching: A relational
perspective. Studies in Higher Education, 21(3), 275-284.
Trochim, W.M.K. (2006). The Research Methods Knowledge Base. (3rd ed.). Cincinnati,
United States: Atomic Dog Publishing.
Tummons, J., Orr, K., & Atkins, L. (2013). Teaching Higher Education Courses in Further
Education Colleges. London: Sage.
Türel, Y. K., & Johnson, T. E. (2012). Teachers' Belief and Use of Interactive Whiteboards for
Teaching and Learning. Educational Technology & Society, 15(1), 381-394.
Tweed, S. R. (2013). Technology implementation: teacher age, experience, self-efficacy, and
professional development as related to classroom technology integration (Doctoral Thesis).
East Tennessee University.
Tyack, D. & Cuban, L. (1997). Tinkering with Utopia: A century of Public School Reform.
Cambridge MA: Harvard University Press.
Underwood, J., & Dillon, G. (2011). Chasing dreams and recognising realities: teachers’
responses to ICT. Technology, Pedagogy and Education, 20(3), 317-330.
UNESCO-UNEVOC International Centre for Technical and Vocational Education and
Training & UNESCO Institute for Statistics (2007) Participation in Formal Technical and
Vocational Education and Training Programmes Worldwide: an initial statistical study. Bonn:
UNESCO.
Valtonen, T., Kukkonen, J., Kontkanen, S., Sormunun, K., Dillon, P. & Sointu, E. (2015). The
impact of authentic learning experiences with ICT on pre-service teachers’ intentions to use
ICT for teaching and learning. Computers & Education, 81, 49-58.
Van Driel, J. H., Beijaard, D. & Verloop, N. (2001). Professional development and reform in
science education: the role of teachers’ practical knowledge. Journal of Research in Science
Teaching, 38(2), 137–158.
191
Vaughan, R. (2013, Sept 20). Technology – Schools say yes to tablet computers as ICT
spending soars. TES magazine, Retrieved from:
https://www.tes.co.uk/articles.aspx?storycode=6358755.
Venkatesh, V., Croteau, A. M., & Rabah, J. (2014, January). Perceptions of effectiveness of
instructional uses of technology in higher education in an era of Web 2.0. 47th Hawaii
International Conference on System Sciences (pp. 110-119). IEEE.
Waite, S. (2004). Tools for the job: A report of two surveys of information and
communications technology training and use for literacy in primary schools in the West of
England. Journal of Computer Assisted Learning, 20, 11–20.
Watson, D. M. (2001). Pedagogy before technology: Re-thinking the relationship between
ICT and teaching. Education and Information technologies, 6(4), 251-266.
Wiles, R., Crow, G., Heath, S. and Charles, V. (2008). The Management of Confidentiality
and Anonymity in Social Research, International Journal of Social Research Methodology,
11(5), 417-428.
Wiseman, A.W., and Anderson, E. (2012). ICT-integrated education and national innovation
systems in the Gulf Cooperation Council (GCC) countries. Computers & Education, 59(2),
607-618.
Wolf, A. (2011). Review of Vocational Education. Retrieved from
https://assets.publishing.service.gov.uk/government/uploads/system/uploads/attachment_dat
a/file/180504/DFE-00031-2011.pdf
Yang, H. (2012). ICT in English schools: transforming education? Technology, Pedagogy
and Education, 21(1), 101-118.
Yang SM., & Hinkle J.C. (2012). Issues in Survey Design: Using Surveys of Victimization and
Fear of Crime as Examples. In: L. Gideon (Ed.), Handbook of Survey Methodology for the
Social Sciences (pp. 443-462). New York, United States: Springer.
Yin, R.K. (2013). Case Study Research – Design & Methods (Applied Social Research
Methods) (5th ed.). Thousand Oaks, United States: Sage.

192
Zhang, M. (2014). Who are interested in online science simulations? Tracking a trend of
digital divide in Internet use. Computers & Education, 76, 205-214.
Zhao, Y., Pugh, K., Sheldon, S. & Byers, J.L. (2002). Conditions for Classroom Technology
Innovations. Teachers College Record, 104(3) 482-515.

193
Appendices:
Appendix A.
Ethical Approval from University.

194
Appendix B.
Satisfying criteria from Shenton (2004):
Quality Criterion
Provision made by Researcher Achieved in Study
Credibility Adoption of appropriate, well recognised research methods
Research methods identified
Development of early familiarity with culture of participating organisations
Communication with college principals and meetings with designated coordinators (Appendix
Random sampling of individuals serving as informants
Participants selected from volunteers
Triangulation via use of different methods, different types of informants and different sites
Survey and interviews from across three college sites
Tactics to help ensure honesty in participants
Use of “reflective commentary” Chapter 3 section 3.2.2.3, 3.2.2.4, 3.2.2.5 & 3.2.2.6
Description of background, qualifications and experience of the researcher
Introduction of self in initial contact with principle and potted life history before each one-to-one interview
Member checks of data collected/interpretations formed
Dialogue with participants and review of transcripts to verify
Thick description of phenomenon under scrutiny
Setting out context of study in as much detail as possible to describe study but maintain anonymity and satisfy university ethics approval.
Examination of previous research to frame findings
Etrmer First/second order barriers Zhao et al
Transferability Provision of background data to establish context of study and detailed description of phenomenon in question to allow comparisons to be made
Identified and communicated in thesis
Dependability Employment of “overlapping methods” Surveys and interviews Appendix 3, 4 & 5.
In-depth methodological description to allow study to be repeated
Chapter 3 in thesis section 3.5
Confirmability Triangulation to reduce effect of investigator bias
Admission of researcher’s beliefs and assumptions
Chapter 3 section 3.2.2.4
Recognition of shortcomings in study’s methods and their potential effects
Chapter 6
In-depth methodological description to allow integrity of research results to be scrutinised
Chapter 3 section 3.5
Use of diagrams to demonstrate “audit trail” research

195
Appendix C.
Participation request letter
School of Education
Dear Principal ________________,
My name is Robert Shedden and I am a Doctoral student with Durham University (working with
Dr. Julie Rattray and Dr. Andrew Joyce-Gibbons). I am writing to ask for your help and
permission to approach some of the teachers who are studying on courses in your institute, who
may be practitioners in other institutes, and also members of staff within your institute who
would be willing to help with my research.
My research project primarily focuses on an exploration of the underlying beliefs held by
teachers in Vocational and Further Education regarding the integration of ICT into their
teaching. My own professional background is that after a career and over 20 years of
management experience in business I returned to university to study at age 43 and then studied
a PGCE in post compulsory education. I have worked in the U.K. in an F.E. college and university
in South Wales, where I was living at the time, as an hourly paid lecturer. I moved to the
Midlands to take up a full time position with Kaplan Professional before working for more than 8
years overseas in Libya and Abu Dhabi. I progressed from Lecturer to Deputy Principle during
my time overseas and began my Doctorate with Durham 4 years ago. The motivation for my
research centers around the wide spread investment by governments in the acquisition of ICT in
the expectation that this alone will improve student attainment and educational levels. I am
approaching the study from the perspective of the teachers in Vocational/FE colleges I am
particularly interested in how teachers feel about using technology and the training and support
that they receive to use technologies in the way that many policy makers envisage. More
specifically I am focusing on the extent to which the introduction of ICT brought about any
perceptible change in the pedagogy in Vocational/FE teaching or are teachers using technology
for mainly preparation and administration tasks.

196
I have chosen the Vocational/ FE sector for my research because I am part of it and feel
passionately about the work that is done in this important part of education and as the Skills
Commission identified the Vocational Education sector is under-represented in Educational
research. Initially the study will require the distribution and completion of an on-line
questionnaire to establish the profiles of teachers currently working in Vocational/FE delivery.
After this stage a representative sample of participants will be approached to participate in one
to one interviews and/or a focus group. The interview will utilise photo-elicitation instead of the
normal question format. Participants will be asked to collect photographs or images that reflect
their beliefs about the use of ICT in their teaching. They will then explain what the image means
and represents for them. Discussion will therefore be heavily focused on the representations of
the images that the participants identify. Confidentiality for participants will be maintained and
as with any research will be sanctioned by Durham University ethics committee. Participants
will have the right to withdraw from the project at any time and all data provided will be
returned and not used in the final study.
I hope that you will allow me to engage with the staff and relevant students within your institute
as I feel this an opportunity to perhaps, in some small way, benefit the delivery of courses in
Vocational Education and give the teachers an opportunity to discuss the issues that may affect
how they deliver and engage in the classroom.
I would be happy to discuss the project with you more fully before you agree that I can contact
your staff and of course you are free to contact my supervisors should you have any other
questions about my credentials.
Robert J. Shedden
Email: [email protected]
Mobile: 07786-958179
Enclosed:
Link to survey: https://durham.onlinesurveys.ac.uk/introduction-phase-version-3
Supervisor contact details:
Dr. Julie Rattray. Email: [email protected]
Dr. Andrew Joyce-Gibbons Email: [email protected]
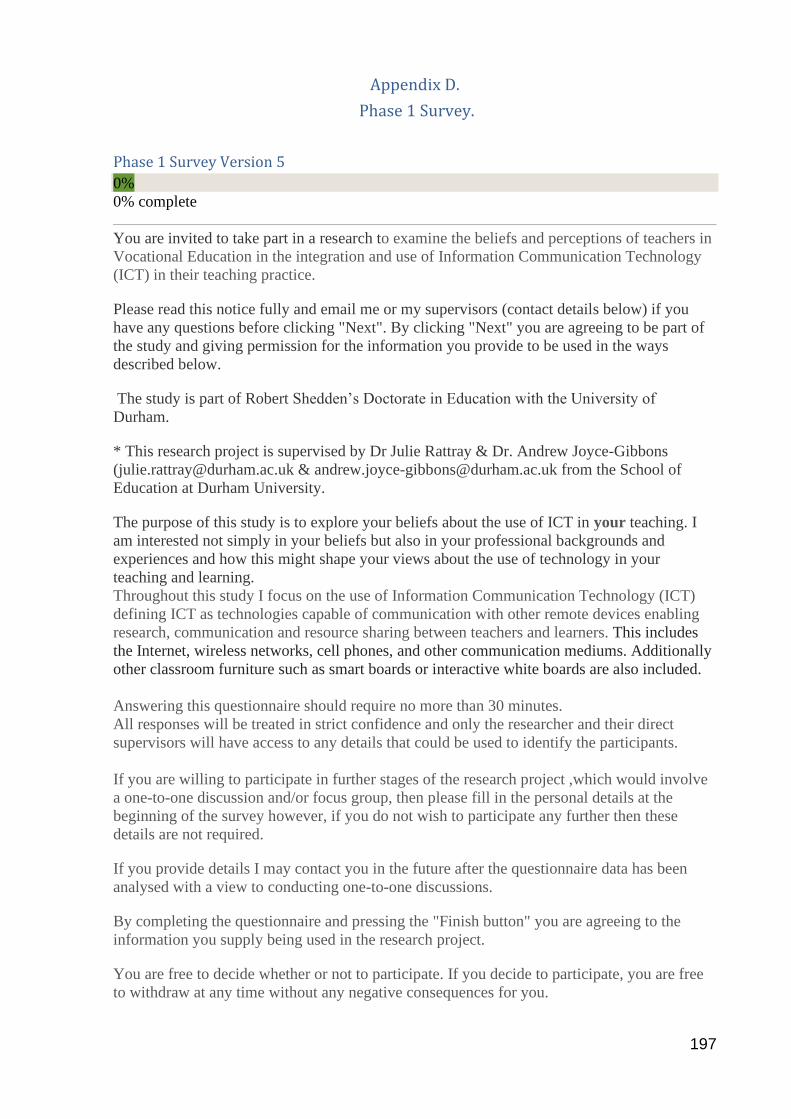
197
Appendix D.
Phase 1 Survey.
Phase 1 Survey Version 5
0%
0% complete
You are invited to take part in a research to examine the beliefs and perceptions of teachers in
Vocational Education in the integration and use of Information Communication Technology
(ICT) in their teaching practice.
Please read this notice fully and email me or my supervisors (contact details below) if you
have any questions before clicking "Next". By clicking "Next" you are agreeing to be part of
the study and giving permission for the information you provide to be used in the ways
described below.
The study is part of Robert Shedden’s Doctorate in Education with the University of
Durham.
* This research project is supervised by Dr Julie Rattray & Dr. Andrew Joyce-Gibbons
([email protected] & [email protected] from the School of
Education at Durham University.
The purpose of this study is to explore your beliefs about the use of ICT in your teaching. I
am interested not simply in your beliefs but also in your professional backgrounds and
experiences and how this might shape your views about the use of technology in your
teaching and learning.
Throughout this study I focus on the use of Information Communication Technology (ICT)
defining ICT as technologies capable of communication with other remote devices enabling
research, communication and resource sharing between teachers and learners. This includes
the Internet, wireless networks, cell phones, and other communication mediums. Additionally
other classroom furniture such as smart boards or interactive white boards are also included.
Answering this questionnaire should require no more than 30 minutes.
All responses will be treated in strict confidence and only the researcher and their direct
supervisors will have access to any details that could be used to identify the participants.
If you are willing to participate in further stages of the research project ,which would involve
a one-to-one discussion and/or focus group, then please fill in the personal details at the
beginning of the survey however, if you do not wish to participate any further then these
details are not required.
If you provide details I may contact you in the future after the questionnaire data has been
analysed with a view to conducting one-to-one discussions.
By completing the questionnaire and pressing the "Finish button" you are agreeing to the
information you supply being used in the research project.
You are free to decide whether or not to participate. If you decide to participate, you are free
to withdraw at any time without any negative consequences for you.

198
You will only be asked to provide your name and a contact email address if you are willing to
participate in phase two of the study - a short interview.
Thank you very much for your collaboration. Your input is really valuable and important for
my study.

199
Confidential participant information
Location Required
Name: Contact Details: Phone or email Optional
Age: Required
29 and under
from 30 to 39
from 40 to 49
50 or more
Gender: Optional
Female
Male
Subject Area(s): Required
Teaching hours per week Optional
fewer than 10 hours
10-15 hours
16-20 hours
21-25 hours
more than 25 hours
Including this year, how long have you been teaching in Vocational or Further
Education? Required
Less than 12 months
1-3 years
4-10 years
11-20 years
21-30 years
More than 30 years
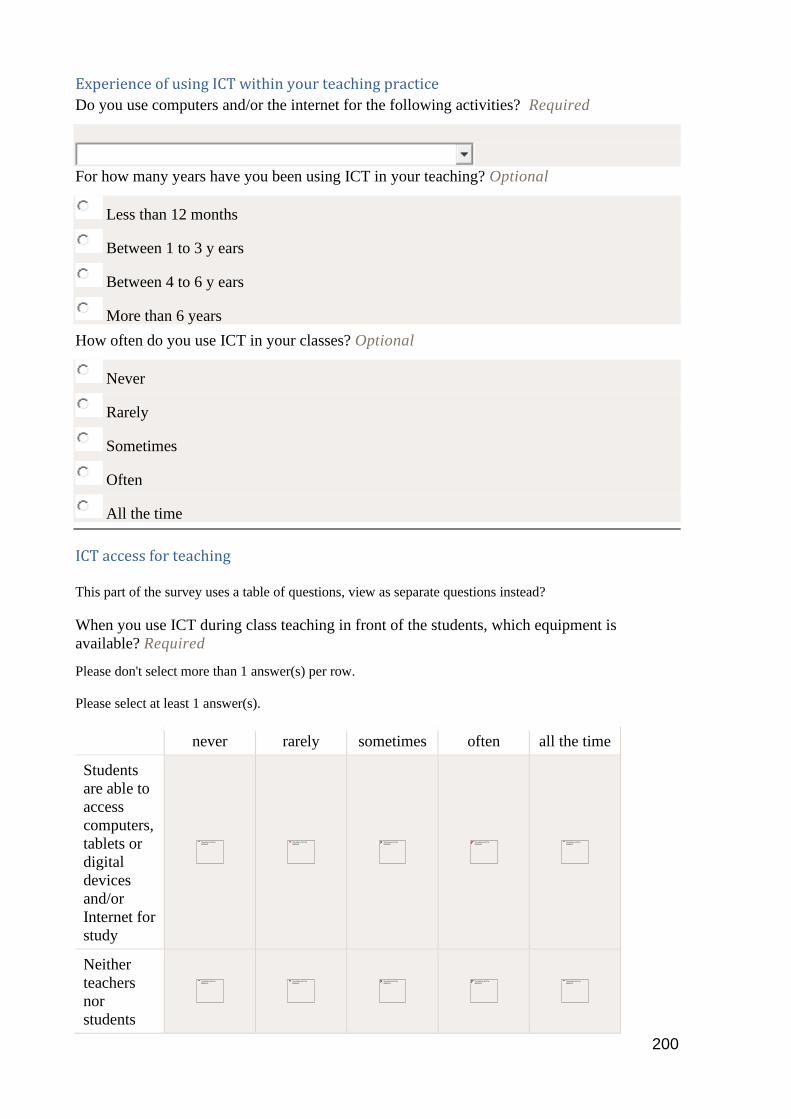
200
Experience of using ICT within your teaching practice
Do you use computers and/or the internet for the following activities? Required
For how many years have you been using ICT in your teaching? Optional
Less than 12 months
Between 1 to 3 y ears
Between 4 to 6 y ears
More than 6 years
How often do you use ICT in your classes? Optional
Never
Rarely
Sometimes
Often
All the time
ICT access for teaching
This part of the survey uses a table of questions, view as separate questions instead?
When you use ICT during class teaching in front of the students, which equipment is
available? Required
Please don't select more than 1 answer(s) per row.
Please select at least 1 answer(s).
never rarely sometimes often all the time
Students
are able to
access
computers,
tablets or
digital
devices
and/or
Internet for
study
Neither
teachers
nor
students

201
use
computers,
tablets or
digital
devices
and/or the
internet
during
classes.
Only the
teacher
uses a
computers,
tablets or
digital
devices
and/or
Internet
Both,
teacher
and
students,
use
computers,
tablets or
digital
devices
and/or
Internet
Which ICT equipment do you have access to in your classes? Required
Desktop computer without internet access
Desktop computer with internet access
Non-internet-connected laptop, tablet PC, net book or notebook computer
Internet-connected laptop, tablet PC, net book or notebook computer
Interactive whiteboard
Computer laboratory
Does your college provide teachers with laptops (or tablet, PC desktop computers) for their
own use? (Please specify) Optional
If you selected Yes please specify: Optional

202
Are the students allowed to use the personally owned devices listed below at college for
learning?Optional
Laptop, tablet,
Smartphone
Support to teachers for ICT use
This part of the survey uses a table of questions, view as separate questions instead?
Have you ever undertaken professional development in the following areas? Required
Please don't select more than 1 answer(s) per row.
Please select at least 1 answer(s).
Yes No
Introductory courses on internet use and general applications
(basic word-processing, spreadsheets, presentations, databases,
etc.
Advanced courses on applications (advanced word-processing,
complex relational databases, Virtual Learning Environment,
etc.)
Advanced courses on internet use (creating websites/ home
page, video conferencing, etc.)
Equipment-specific training (interactive whiteboard, laptop,
tablet, etc.)
Courses on the pedagogical use of ICT in teaching and learning
Subject-specific training on learning applications (tutorials,
simulations, etc.)
Course on multimedia (using digital video, audio equipment,
etc.)
Participate in online communities (e.g., mailing lists, groups,
blogs) for professional discussions with other teachers
ICT training provided by college staff Personal learning about
ICT in your own time
Other professional development opportunities related to ICT
Who provides the ICT support at your college? Required

203
A more experienced / knowledgeable teacher
College ICT/technician(s) or professional
Teaching or Administrative colleagues
Experts from outside the college
An online help desk, community or website
ICT based activities and material used for teaching
This part of the survey uses a table of questions, view as separate questions instead?
How often do you do the following activities?
Please don't select more than 1 answer(s) per row.
Please select at least 1 answer(s).
Never Rarely Sometimes Often All the
time
Browse/search
the internet to
collect
information to
prepare
lessons
Browse/search
the internet to
collect
resources to
be used
during lessons
Use
applications to
prepare
presentations
for lessons
Create your
own digital
learning
materials for
students
Prepare
exercises and
tasks for
students
204
This part of the survey uses a table of questions, view as separate questions instead?
How often do you do the following activities?
Please don't select more than 1 answer(s) per row.
Please select at least 1 answer(s).
Use ICT to
provide feedback
and/or assess
students’ learning
Evaluate digital
learning resources
in the subject(s)
you teach
Download/upload/
browse material
from the college's
website
Download/upload/
browse material
from a learning
platform
Look for online
professional
development
opportunities
This part of the survey uses a table of questions, view as separate questions instead?
Which of the following types of materials have you used when teaching your classes with the
aid of a computer and/or the Internet? Required
Please don't select more than 1 answer(s) per row.
Please select at least 1 answer(s).
Yes No
Material that you’ve searched the Internet for
Existing online material from established educational
sources
Material that is available on the college's computer
network or database
Electronic offline material (e.g., C D-ROM)

205
Material of your own creation
Material from mainstream websites, (news sites,
streaming sites or social media).
Obstacles to the use of ICT in teaching and learning
This part of the survey uses a table of questions, view as separate questions instead?
Is the use of ICT in teaching and learning adversely affected by the following? Required
Please don't select more than 1 answer(s) per row.
Please select at least 1 answer(s).
Not at all A little Partially A lot
Insufficient
number of
computers
Insufficient
number of
internet-
connected
computers
Insufficient
Internet
bandwidth or
speed
Insufficient
number of
interactive
whiteboards
Insufficient
number of
laptops/
notebooks
College
computers out
of date and/or
needing repair
Lack of
adequate skills
of teachers
206
Insufficient
technical
support for
teachers
Insufficient
pedagogical
support for
teachers
This part of the survey uses a table of questions, view as separate questions instead?
Is the use of ICT in teaching and learning adversely affected by the following?
Please don't select more than 1 answer(s) per row.
Please select at least 1 answer(s).
Lack of
adequate
content/
material for
teaching
Too
difficult to
integrate
ICT use
into the
curriculum
Lack of
pedagogical
models on
how to use
ICT for
learning
Classroom
layout, size
and
furniture
etc,
Pressure to
prepare
students for
exams
Most
teachers not
in favour of
the use of

207
ICT at
college
Lack of
interest of
teachers
No or
unclear
benefit to
use ICT for
teaching
Using ICT
in teaching
and
learning not
being a
goal in our
college
Teachers’ skills
This part of the survey uses a table of questions, view as separate questions instead?
To what extent are you confident in the following? Required
Please don't select more than 1 answer(s) per row.
Please select at least 1 answer(s).
None A little Somewhat A lot
Produce a text
using a word
processing
programme
Use emails to
communicate
with others
Capture and edit
digital photos,
movies or other
images
Edit text online
containing
internet links
and images

208
Create a
database
Create and/or
edit a
questionnaire
online
Email a file to
someone
Organise
computer files
in folders and
sub-folders
Use a
spreadsheet
(e.g., Excel)
Use a
spreadsheet to
plot a graph
This part of the survey uses a table of questions, view as separate questions instead?
To what extent are you confident in the following?
Please don't select more than 1 answer(s) per row.
Please select at least 1 answer(s).
Create a
presentation
with simple
animation
functions
Create a
presentation
with video or
audio clips
Participate in
a discussion
forum on the
internet
Create and
maintain
blogs or web
sites
Participate in
social
networks
209
Download
and install
software on a
computer
Download or
upload
curriculum
resources
from/to
websites or
learning
platforms for
students to
use
Prepare
materials to
use with an
interactive
whiteboard
Programming
• Next
ICT in school management
• This part of the survey uses a table of questions, view as separate questions instead?
• Who is given your professional email address? Optional • Please don't select more than 1 answer(s) per row.
• Please select at least 1 answer(s).
Yes No
To teachers?
To students?
To administrative & support staff?
• An Electronic Register System is a system whereby you can record attendance in your
class and in your college, do you use one in your college? Optional
• Yes
• No
• Don't Know
• A Learning Management System (LMS) is a system whereby you can communicate
directly with your students and post marks/grades, attendace and feedback to students
do you use such a system in the college? (This could be with a Virtual Learning
Environment (VLE))
• Yes
• No
• Don't Know
210
• A Content Management System (CMS) allows modification and editing of material
that is used collaboratively in colleges, is such a system used in your institution? (This
could be with a Virtual Learning Environment (VLE)) Optional
• Yes
• No
• Don't Know
• You have now completed the survey and thank you very much for taking the time to
do so. • By completing the questionnaire and pressing the "Finish button" you are agreeing to the
information you supply being used in the research project.
• You are free to decide whether or not to participate. If you decide to participate, you are
free to withdraw at any time without any negative consequences for you.
• If you wish to withdraw from the survey please contact me or my supervisors so that the
relevant data can be deleted.
• Robert Shedden ([email protected])
•
• Dr Julie Rattray & Dr. Andrew Joyce-Gibbons ([email protected] &
[email protected] from the School of Education at Durham
University.
Finish & Thank You

211
Appendix E.
Complete results chapter.
Statistically Significant results from One-Way between subject ANOVA.
Results of the one-way between subjects’ ANOVA showing statistical significance on
“Teacher perceived self-efficacy and integration of technology for tasks linked to
preparation, teaching and delivery”
The one-way between subjects’ ANOVA test results, shown in table 1, indicate that there is a
statistically significant difference in the perceived self-efficacy of respondents in their ability to
create an online questionnaire based on age.
Condition Results
Age (n-225) [F(3,222)=8.038, p=.001]
Subject Area (n=225) [F(3,222)=4.576, p=.004]
Teaching Experience (n=224) [F(3,221)=1.832, p=.142]
Appendix E Table 1: Participant self-efficacy in their ability to create an online questionnaire. ANOVA results by Age, Subject Area and Teaching Experience.
Table 2 shows that respondents in age groups 39 years and younger were more confident in
being able to create an on-line questionnaire than were the participants aged 40 years and
over.
Age
Years
None A little Somewhat A lot Total Number
=<29 1 8 19 28
30 – 39 2 11 16 29 58
40 – 49 5 23 16 26 70
=>50 13 15 22 20 70
Appendix E Table 2: Reported self-efficacy of respondents in their ability to create an online questionnaire by age.

212
The one-way between subjects’ ANOVA test results, shown in table 3, indicate that there is a
statistically significant difference in the perceived self-efficacy of respondents in their ability to
create a presentation containing simple animation based on age.
Condition Results
Age (n-227) [F(3,224)=3.329, p=.020]
Subject Area (n=227) [F(3,224)=1.643, p=.180]
Teaching Experience (n=226) [F(3,223)=1.837, p=.141]
Appendix E Table 3: Participant self-efficacy in their ability to create a presentation containing simple animation. ANOVA results by Age, Subject Area and Teaching Experience.
The results, shown in table 4, indicate that participants in the youngest age group had the most
confidence in creating a presentation with simple animation although within all age groups
most participants responded that they were somewhat confident in performing this task. There
were a small number of participants across three age groups that reported no confidence in
being able to create a presentation using simple animation.
Age
Years
None A little Somewhat A lot Total Number
=<29 1 2 25 28
30 – 39 2 8 49 59
40 – 49 3 4 15 48 70
=>50 2 5 18 46 71
Appendix E Table 4: Reported self-efficacy of respondents in their ability to create a presentation containing simple animation by age.
The one-way between subjects’ ANOVA test results, shown in table 5, indicate that there is a
statistically significant difference in the perceived self-efficacy of respondents in their ability to
create a presentation containing video based on age.
Condition Results
Age (n-226) [F(3,223)=5.541, p=.001]
Subject Area (n=226) [F(3,223)=2.429, p=.066]
Teaching Experience (n=225) [F(3,222)=.691, p=.558]
Appendix E Table 5: Participant self-efficacy in their ability to create a presentation containing video. ANOVA results by Age, Subject Area and Teaching Experience.

213
The results shown, in table 6, indicate that respondents in the youngest age group reported
high levels of participants who were somewhat or more confident in creating a presentation
containing video although, there was a slight increase in participants completing this task
reporting little or no confidence.
Age
Years
None A little Somewhat A lot Total Number
=<29 2 1 25 28
30 – 39 3 9 46 58
40 – 49 4 5 13 48 70
=>50 4 9 19 39 71
Appendix E Table 6: Reported self-efficacy of respondents in their ability to create a presentation containing video by age.
The one-way between subjects’ ANOVA test results, shown in table 7, indicate that there is a
statistically significant difference in the perceived self-efficacy of respondents in their ability to
download materials from websites or learning platforms based on age.
Condition Results
Age (n-226) [F(3,223)=4.703, p=.003]
Subject Area (n=226) [F(3,223)=1.141, p=.333]
Teaching Experience (n=225) [F(3,222)=.590, p=.622]
Appendix E Table 7: Participant self-efficacy in their ability to download materials from websites or learning platforms. ANOVA results by Age, Subject Area and Teaching Experience.
Table 8 indicates that participants in the younger age group had more self-efficacy in
downloading resources from websites and learning platforms than other age groups that had
some respondents that had no confidence in doing this task.
Age
Years
None A little Somewhat A lot Total Number
=<29 2 26 28
30 – 39 1 3 13 41 58
40 – 49 3 9 15 43 70
=>50 5 10 15 41 71
Appendix E Table 8: Reported self-efficacy of respondents in their ability to download resources from websites and learning platforms by age.

214
The one-way between subjects’ ANOVA test results, shown in table 9, indicate that there is a
statistically significant difference in the perceived self-efficacy of respondents in their ability to
prepare materials for use with interactive whiteboards based on age and years of teaching
experience.
Condition Results
Age (n-226) [F(3,223)=2.982, p=.032]
Subject Area (n=226) [F(3,223)=2.196, p=.089]
Teaching Experience (n=225) [F(3,222)=3.299, p=.021]
Appendix E Table 9: Participant self-efficacy in their ability to prepare materials for interactive whiteboards. ANOVA results by Age, Subject Area and Teaching Experience.
Table 10 indicates that the over 30 years age group had less perceived self-efficacy in this
task.
Age
Years
None A little Somewhat A lot Total Number
=<29 3 2 4 19 28
30 – 39 5 11 9 33 58
40 – 49 9 10 22 29 70
=>50 3 14 22 32 71
Appendix E Table 10: Reported self-efficacy of respondents in their ability to prepare materials for interactive whiteboards by age.
Table 11 shows participants with more than 4 years, but less than 21 years teaching
experience had more self-efficacy in preparing materials for use with interactive whiteboards
than did other participants.
Teaching Experience
(Years)
None A little Somewhat A lot Total Number
=<1 1 2 6 10 19
1 - 3 1 5 7 20 33
4 – 10 10 15 17 44 86
11 – 20 7 10 21 32 70
=>21 4 12 11 27
Appendix E Table 11: Reported self-efficacy of respondents in their ability to prepare materials for interactive whiteboards by teaching experience.

215
The one-way between subjects’ ANOVA results shown in Table 12 indicate age produced
statistically significant results regarding teachers “use technology to collect resources to be
used during lessons”.
Condition Results
Age (n-2225) [F(3,225)=3.654, p=.013]
Subject Area (n=225) [F(3,225)=1.126, p=.339]
Teaching Experience (n=227) [F(3,224)=1.188, p=.315]
Appendix E Table 12: Participants' attitudes to engagement with and use of technology to collect resources to be used during lessons. ANOVA results by Age, Subject Area and Teaching Experience.
The one-way between subjects’ ANOVA results shown in table 13 indicate that younger
participants "use technology to collect resources to be used during lesson" often or all the time
while other age groups, although they recognise and used technology to source resources for
teaching, also had participants that used it rarely or only sometimes.
Age
Years
Never
Rarely
Sometime Often All the time Total Number
=<29 7 21 28
30 – 39 2 7 19 32 60
40 – 49 1 7 26 35 69
=>50 5 33 33 71
Appendix E Table 13: Participants’ attitudes to the frequency of use of technology to collect resources to be used in class teaching by age.
The results of a one-way between subjects’ ANOVA in table 14 indicate that age resulted in a
statistically significant outcome when examining "using applications to prepare exercises for
students".
Condition Results
Age (n-226) [F(3,223)=4.253, p=.006]
Subject Area (n=226) [F(3,223)=.459, p=.711]
Teacher Experience (n=225) [F(3,222)=.175, p=.913]
Appendix E Table 14: Participants' attitudes to engagement with and use of technology to prepare tasks for students. ANOVA results by Age, Subject Area and Teaching Experience.

216
The results in table 15 suggest that younger participants had higher levels that used technology
to prepare tasks for students. The results indicate that the respondents within the lower age
range proportionally were more likely to use applications often or all the time to prepare tasks
or exercises for students.
Age
Years
Never
Rarely
Sometimes Often All the time Total Number
=<29 1 3 7 17 28
30 – 39 2 11 16 30 59
40 – 49 2 11 31 25 69
=>50 5 11 34 21 71
Appendix E Table 15: Participants’ attitudes to the frequency of use of technology to prepare tasks for students by age.
The results of a one-way between subjects’ ANOVA in table 16 indicate that age and subject
areas resulted in a statistically significant outcome when examining the use of resources
collected from existing educational sources in classroom delivery and teaching.
Condition Results
Age (n-223) [F(1,222)=5.795, p=.017]
Subject Area (n=223) [F(1,222)=8.327, p=.004]
Teaching Experience (n=222) [F(1,221)=1.893, p=.170]
Appendix E Table 16: Teacher use of resources collected from existing educational sources in classroom delivery and teaching. ANOVA results by Age, Subject Area and Teaching Experience.
The frequency table 17 indicates that all respondents in the youngest age group use resources
collected from exiting educational sources in their classroom delivery and teaching. The results
are shown in Table 17 below.
Age
Years
Yes No Total Number
=<29 28 28
30 – 39 53 6 59
40 – 49 61 7 68
=>50 62 7 69
Appendix E Table 17: Frequency table showing number of participants who collect resources from existing educational sources in classroom delivery and teaching by age.
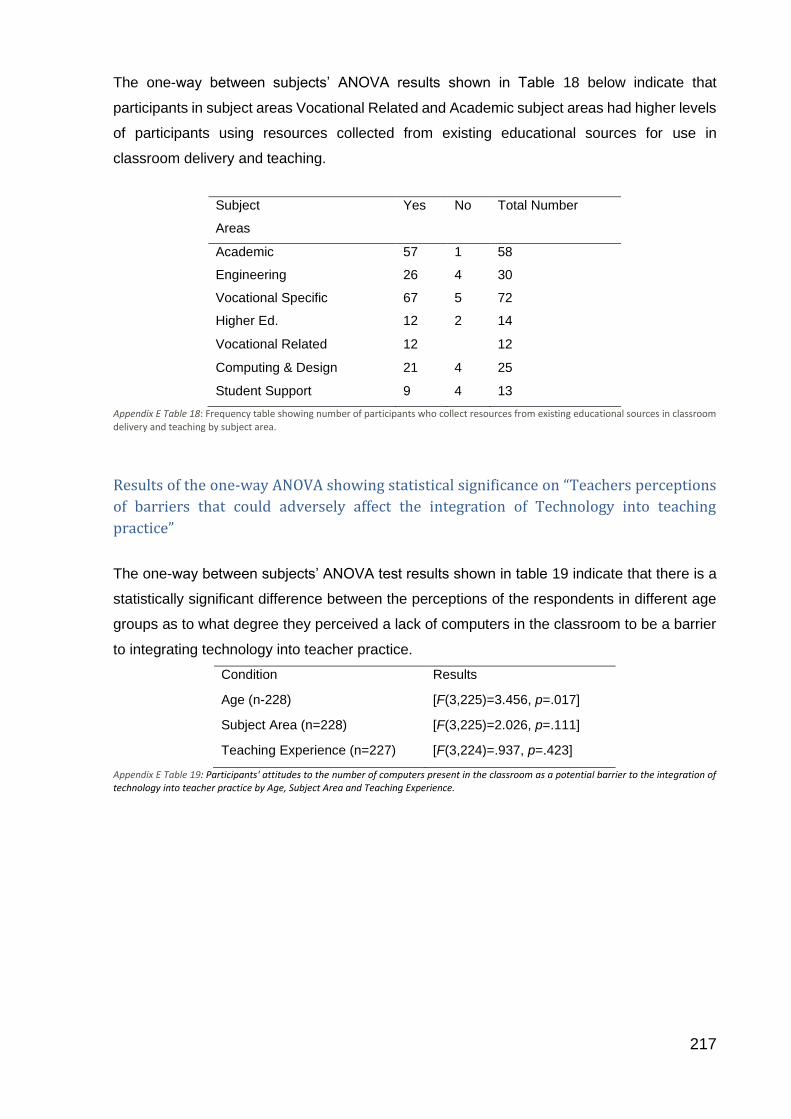
217
The one-way between subjects’ ANOVA results shown in Table 18 below indicate that
participants in subject areas Vocational Related and Academic subject areas had higher levels
of participants using resources collected from existing educational sources for use in
classroom delivery and teaching.
Subject
Areas
Yes No Total Number
Academic 57 1 58
Engineering 26 4 30
Vocational Specific 67 5 72
Higher Ed. 12 2 14
Vocational Related 12 12
Computing & Design 21 4 25
Student Support 9 4 13
Appendix E Table 18: Frequency table showing number of participants who collect resources from existing educational sources in classroom delivery and teaching by subject area.
Results of the one-way ANOVA showing statistical significance on “Teachers perceptions
of barriers that could adversely affect the integration of Technology into teaching
practice”
The one-way between subjects’ ANOVA test results shown in table 19 indicate that there is a
statistically significant difference between the perceptions of the respondents in different age
groups as to what degree they perceived a lack of computers in the classroom to be a barrier
to integrating technology into teacher practice.
Condition Results
Age (n-228) [F(3,225)=3.456, p=.017]
Subject Area (n=228) [F(3,225)=2.026, p=.111]
Teaching Experience (n=227) [F(3,224)=.937, p=.423]
Appendix E Table 19: Participants' attitudes to the number of computers present in the classroom as a potential barrier to the integration of technology into teacher practice by Age, Subject Area and Teaching Experience.

218
Table 20 shows that some of the younger age groups perceive this to be more of a barrier than
participants in the older age groups.
Age
Years
Not at all A little Partially A lot Total Number
=<29 1 8 9 10 28
30 – 39 6 11 21 22 60
40 – 49 8 24 21 17 70
=>50 14 24 18 15 71
Appendix E Table 20: Participants' attitudes to the number of computers present in the classroom as a potential barrier to the integration of technology into teacher practice by age.
The results displayed in table 21 indicate that there is a statistically significant difference
between the perceptions of participants in different subject areas to the issue of insufficient
bandwidth as a barrier to technology integration into teacher practice.
Condition Results
Age (n=228) [F(3,225)=2.453,p=.064]
Subject Area (n=228) [F(3,225)=4.023,p=.008]
Teaching Experience (n227) [F(3,224)=.312, p=.817]
Appendix E Table 21: Is insufficient bandwidth perceived as a barrier to technology integration into teacher practice? ANOVA results by Age, Subject Area and Teaching Experience.
Within Academic subjects and Vocational Specific subjects’ respondents perceived insufficient
bandwidth to be more of a barrier to technology integration as shown in Table 22. More
participants from these subject areas indicating that lack of bandwidth was at least a partial
barrier, most of the other subject areas were almost equally split between it being a barrier and
it being little or no barrier. The reliability issues regarding infra-structure and bandwidth were
highlighted in all areas during the interviews (section 5.2.6) as being an issue that deterred
teachers from using technology as it often resulted in additional work to produce an alternative
back-up strategy for when the technology did fail.
Subject Area Not at all A little Partially A lot Total Number
Academic 7 13 21 19 60
Engineering 6 9 6 10 31
Vocational Specific 9 16 23 24 72
Higher Ed. 4 6 2 3 15
Vocational Related 2 4 4 2 12
Computing & Design 7 9 7 3 26
Appendix E Table 22: Participant attitudes to the availability of adequate bandwidth as a barrier to the integration of technology into teacher practice by subject area.

219
The one-way between subjects’ ANOVA test results shown in table 23 indicate that there is a
statistically significant difference between the perceptions of participants in different age
groups and subject areas to the issue of insufficient number of portable devices as a barrier to
technology integration into teacher practice.
Condition Results
Age (n-226) [F(3,223)=2.979, p=.034]
Subject Area (n=226) [F(3,223)=3.003, p=.031]
Teaching Experience (n=225) [F(3,222)=2.158, p=.094]
Appendix E Table 23: Is insufficient number of portable devices perceived to be a barrier to technology integration into teacher practice? ANOVA results by Age, Subject Area and Teaching Experience
Table 24 shows that respondents under the age of 40 years considered insufficient portable
devices to be at least a partial barrier to integration whereby participants 40 years and over
considered it to be less of a barrier.
Age
Years
Not at all A little Partially A lot Total Number
=<29 3 6 10 9 28
30 – 39 9 9 27 15 60
40 – 49 15 20 19 14 68
=>50 19 19 20 13 71
Appendix E Table 24: Participant attitudes to the availability of portable devices as a barrier to the integration of technology into teacher practice by age.
Table 25 indicates that academic subjects, Academic and vocational specific subject areas
indicated that a lack of portable devices was at least a partial barrier to technology integration
into classroom practices.
Subject Area Not at all A little Partially A lot Total Number
Academic 9 17 23 11 60
Engineering 8 7 8 8 31
Vocational Specific 8 15 28 21 72
Higher Ed. 1 4 6 4 15
Vocational Related 4 3 3 4 14
Computing & Design 12 4 6 3 25
Student Support 6 3 1 3 13
Appendix E Table 25: Participant attitudes to the availability of portable devices as a barrier to the integration of technology into teacher practice by subject area.
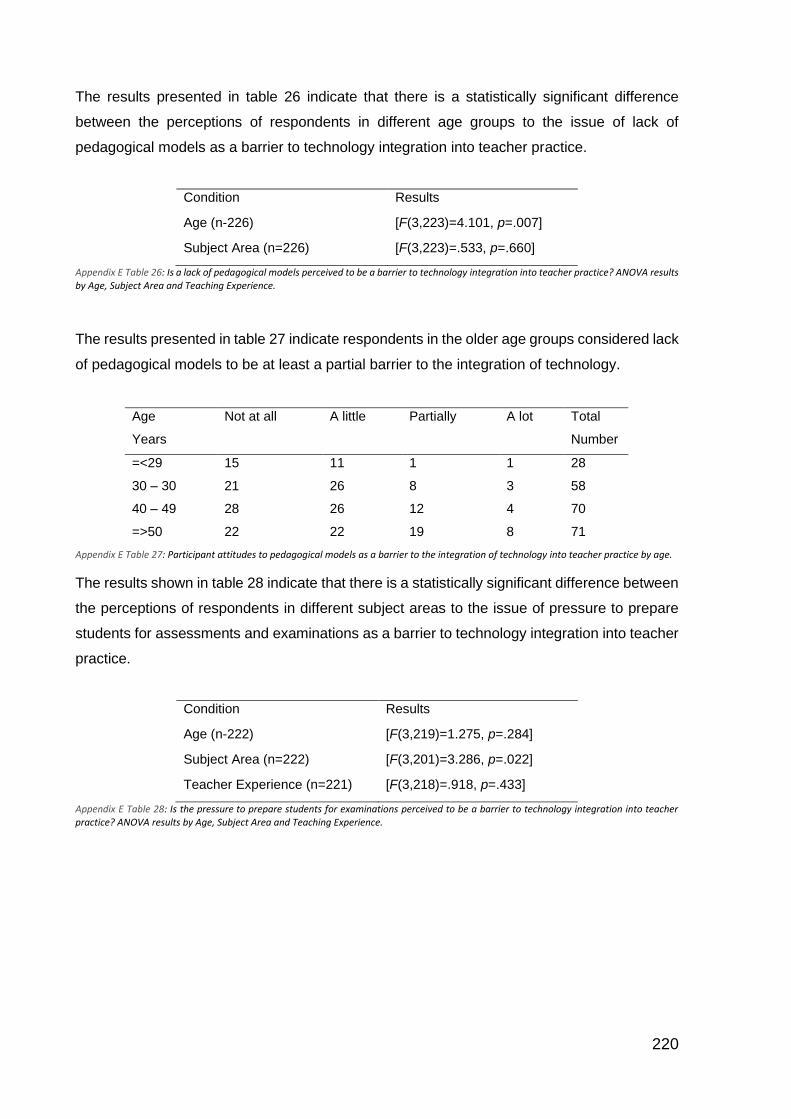
220
The results presented in table 26 indicate that there is a statistically significant difference
between the perceptions of respondents in different age groups to the issue of lack of
pedagogical models as a barrier to technology integration into teacher practice.
Condition Results
Age (n-226) [F(3,223)=4.101, p=.007]
Subject Area (n=226) [F(3,223)=.533, p=.660]
Appendix E Table 26: Is a lack of pedagogical models perceived to be a barrier to technology integration into teacher practice? ANOVA results by Age, Subject Area and Teaching Experience.
The results presented in table 27 indicate respondents in the older age groups considered lack
of pedagogical models to be at least a partial barrier to the integration of technology.
Appendix E Table 27: Participant attitudes to pedagogical models as a barrier to the integration of technology into teacher practice by age.
The results shown in table 28 indicate that there is a statistically significant difference between
the perceptions of respondents in different subject areas to the issue of pressure to prepare
students for assessments and examinations as a barrier to technology integration into teacher
practice.
Condition Results
Age (n-222) [F(3,219)=1.275, p=.284]
Subject Area (n=222) [F(3,201)=3.286, p=.022]
Teacher Experience (n=221) [F(3,218)=.918, p=.433]
Appendix E Table 28: Is the pressure to prepare students for examinations perceived to be a barrier to technology integration into teacher practice? ANOVA results by Age, Subject Area and Teaching Experience.
Age
Years
Not at all A little Partially A lot Total
Number
=<29 15 11 1 1 28
30 – 30 21 26 8 3 58
40 – 49 28 26 12 4 70
=>50 22 22 19 8 71
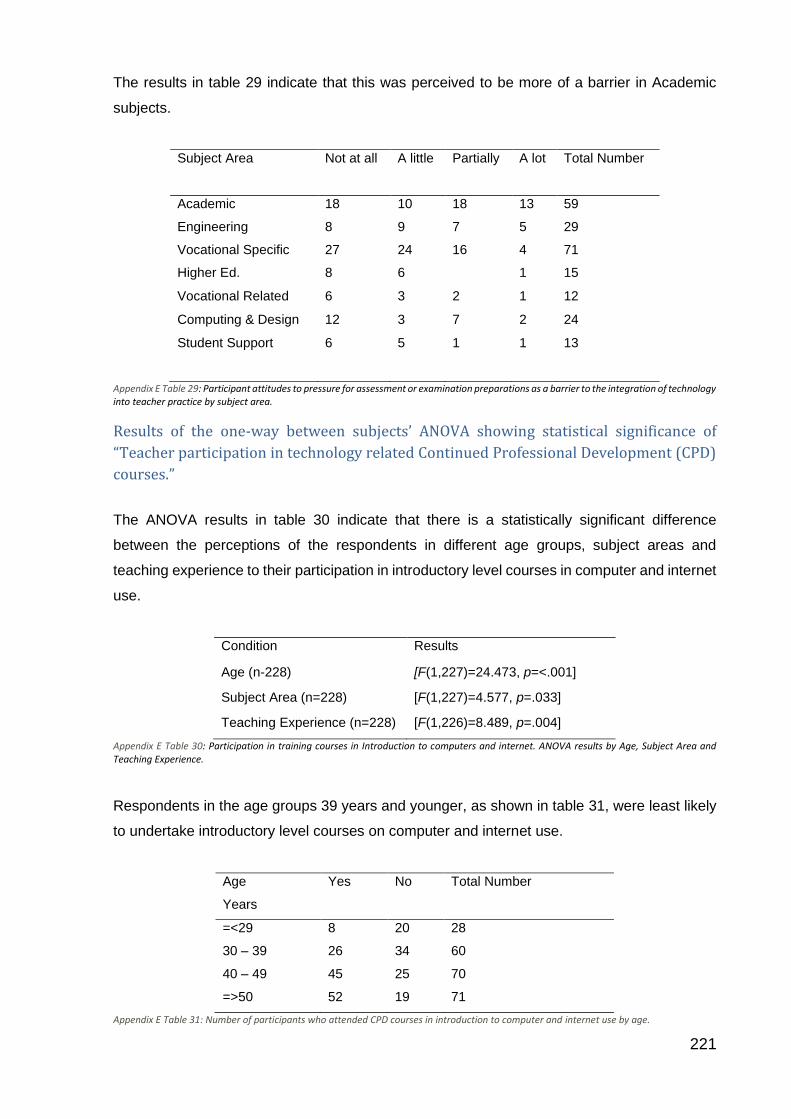
221
The results in table 29 indicate that this was perceived to be more of a barrier in Academic
subjects.
Subject Area Not at all A little Partially A lot Total Number
Academic 18 10 18 13 59
Engineering 8 9 7 5 29
Vocational Specific 27 24 16 4 71
Higher Ed. 8 6 1 15
Vocational Related 6 3 2 1 12
Computing & Design 12 3 7 2 24
Student Support 6 5 1 1 13
Appendix E Table 29: Participant attitudes to pressure for assessment or examination preparations as a barrier to the integration of technology into teacher practice by subject area.
Results of the one-way between subjects’ ANOVA showing statistical significance of
“Teacher participation in technology related Continued Professional Development (CPD)
courses.”
The ANOVA results in table 30 indicate that there is a statistically significant difference
between the perceptions of the respondents in different age groups, subject areas and
teaching experience to their participation in introductory level courses in computer and internet
use.
Condition Results
Age (n-228) [F(1,227)=24.473, p=<.001]
Subject Area (n=228) [F(1,227)=4.577, p=.033]
Teaching Experience (n=228) [F(1,226)=8.489, p=.004]
Appendix E Table 30: Participation in training courses in Introduction to computers and internet. ANOVA results by Age, Subject Area and Teaching Experience.
Respondents in the age groups 39 years and younger, as shown in table 31, were least likely
to undertake introductory level courses on computer and internet use.
Age
Years
Yes No Total Number
=<29 8 20 28
30 – 39 26 34 60
40 – 49 45 25 70
=>50 52 19 71
Appendix E Table 31: Number of participants who attended CPD courses in introduction to computer and internet use by age.
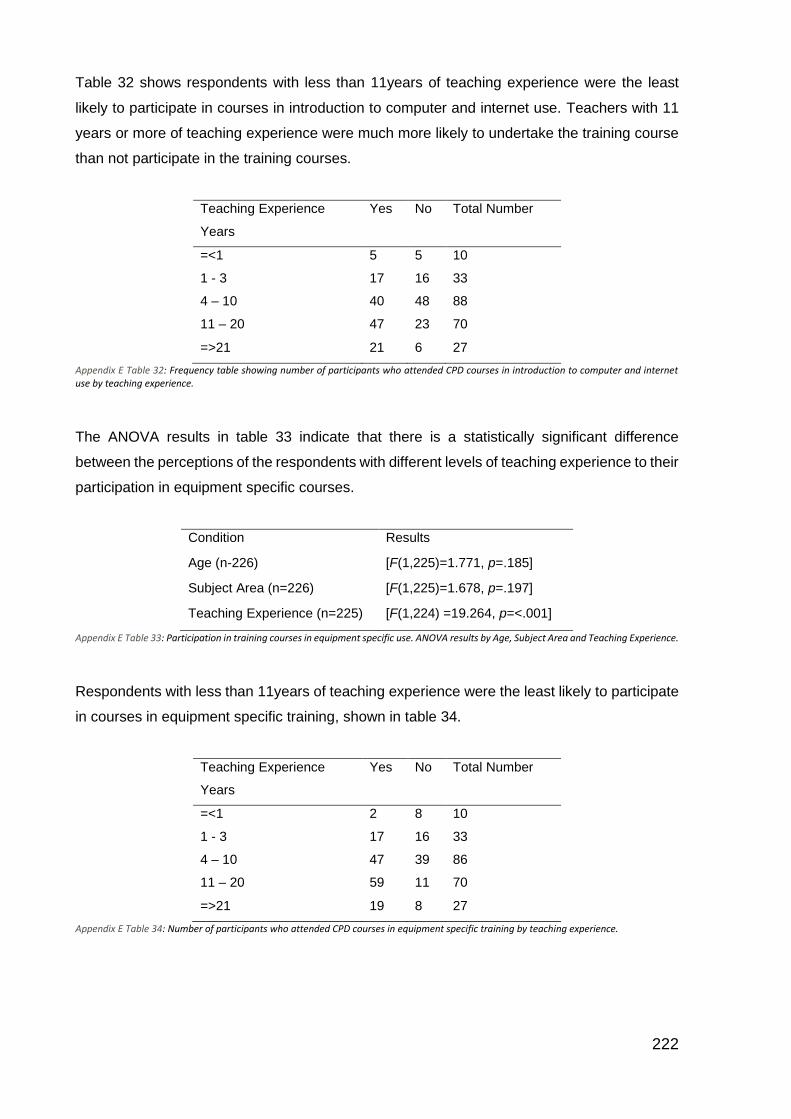
222
Table 32 shows respondents with less than 11years of teaching experience were the least
likely to participate in courses in introduction to computer and internet use. Teachers with 11
years or more of teaching experience were much more likely to undertake the training course
than not participate in the training courses.
Teaching Experience
Years
Yes No Total Number
=<1 5 5 10
1 - 3 17 16 33
4 – 10 40 48 88
11 – 20 47 23 70
=>21 21 6 27
Appendix E Table 32: Frequency table showing number of participants who attended CPD courses in introduction to computer and internet use by teaching experience.
The ANOVA results in table 33 indicate that there is a statistically significant difference
between the perceptions of the respondents with different levels of teaching experience to their
participation in equipment specific courses.
Condition Results
Age (n-226) [F(1,225)=1.771, p=.185]
Subject Area (n=226) [F(1,225)=1.678, p=.197]
Teaching Experience (n=225) [F(1,224) =19.264, p=<.001]
Appendix E Table 33: Participation in training courses in equipment specific use. ANOVA results by Age, Subject Area and Teaching Experience.
Respondents with less than 11years of teaching experience were the least likely to participate
in courses in equipment specific training, shown in table 34.
Teaching Experience
Years
Yes No Total Number
=<1 2 8 10
1 - 3 17 16 33
4 – 10 47 39 86
11 – 20 59 11 70
=>21 19 8 27
Appendix E Table 34: Number of participants who attended CPD courses in equipment specific training by teaching experience.

223
The ANOVA results in table 35 indicate that there is a statistically significant difference
between the perceptions of the respondents in age and teaching experience to their
participation in subject specific courses using technology.
Condition Results
Age (n-227) [F(1,226)=4.013, p=.046]
Subject Area (n=227) [F(1,226)=.013, p=.910]
Teaching Experience (n=226) [F(1,225)=4.411, p=.037]
Appendix E Table 35: Participation in training on subject specific training courses using technology and learning apps. ANOVA results by Age, Subject Area and Teaching Experience.
As shown in table 36 respondents in the age groups 39 years and younger, as shown in table
37, were least likely to undertake subject specific training using technology. Teachers aged 40
years and over were more likely to participate in subject specific training courses than not
participate.
Age
Years
Yes No Total Number
=<29 11 17 28
30 – 39 30 29 59
40 – 49 47 23 70
=>50 42 29 71
Appendix E Table 36: Number of participants who attended CPD courses on subject specific training by age.
Teachers with less than 11years of teaching experience were the least likely to participate
subject specific training in using technology table 37.
Teaching Experience
Years
Yes No Total Number
=<1 4 6 10
1 - 3 17 16 33
4 – 10 44 43 87
11 – 20 47 23 70
=>21 17 10 27
Appendix E Table 37: Number of participants who attended CPD courses on subject specific training by teaching experience.

224
The ANOVA results indicate in table 38 that there is a statistically significant difference
between the perceptions of the respondents in age and teaching experience to their
participation in In-House training.
Condition Results
Age (n-222) [F(1,221)=5.545, p=.019]
Subject Area (n=222) [F(1,221)=.062, p=.804]
Teaching Experience (n=221) [F(1,221)=11.874, p=.001]
Appendix E Table 38: Participation in courses through In-House training. ANOVA results by Age, Subject Area and Teaching Experience.
Respondents aged 39 years and younger were less likely to participate in in-house training
courses than respondents aged 40 years and over shown in table 39.
Age
Years
Yes No Total Number
=<29 11 17 28
30 – 39 28 31 59
40 – 49 35 33 68
=>50 43 25 68
Appendix E Table 39: Number of participants who attended CPD courses through In-House training by age.
Table 40 shows that respondents with less than 11years of teaching experience were the least
likely to participate in In-House training. Respondents with 11 years or more teaching
experience were more likely to undertake in-house training courses.
Teaching Experience
Years
Yes No Total Number
=<1 4 6 10
1 - 3 10 23 33
4 – 10 43 43 87
11 – 20 42 25 67
=>21 18 8 26
Appendix E Table 40: Number of participants who attended CPD courses through In-House training by teaching experience.
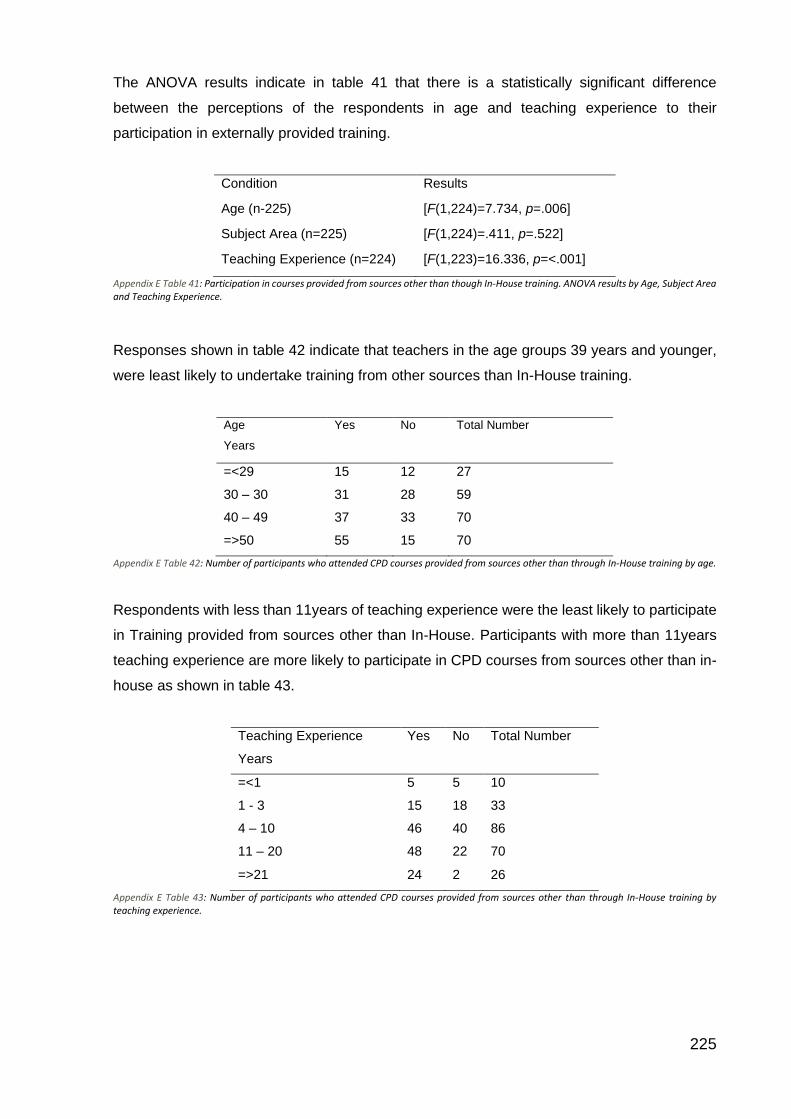
225
The ANOVA results indicate in table 41 that there is a statistically significant difference
between the perceptions of the respondents in age and teaching experience to their
participation in externally provided training.
Condition Results
Age (n-225) [F(1,224)=7.734, p=.006]
Subject Area (n=225) [F(1,224)=.411, p=.522]
Teaching Experience (n=224) [F(1,223)=16.336, p=<.001]
Appendix E Table 41: Participation in courses provided from sources other than though In-House training. ANOVA results by Age, Subject Area and Teaching Experience.
Responses shown in table 42 indicate that teachers in the age groups 39 years and younger,
were least likely to undertake training from other sources than In-House training.
Age
Years
Yes No Total Number
=<29 15 12 27
30 – 30 31 28 59
40 – 49 37 33 70
=>50 55 15 70
Appendix E Table 42: Number of participants who attended CPD courses provided from sources other than through In-House training by age.
Respondents with less than 11years of teaching experience were the least likely to participate
in Training provided from sources other than In-House. Participants with more than 11years
teaching experience are more likely to participate in CPD courses from sources other than in-
house as shown in table 43.
Teaching Experience
Years
Yes No Total Number
=<1 5 5 10
1 - 3 15 18 33
4 – 10 46 40 86
11 – 20 48 22 70
=>21 24 2 26
Appendix E Table 43: Number of participants who attended CPD courses provided from sources other than through In-House training by teaching experience.

226
Results of on-way between subject ANOVA showing no statistical significance
Teacher self-efficacy in general tasks incorporating technology.
Confidence create a database.
A one-way between subjects’ ANOVA was conducted to compare means exploring whether
there is a statistically significant difference in the means values of the number of respondents
"confident creating a database" by Location, Age, Gender, Subject Area and Teaching
Experiences.
There was a significant effect of age regarding ability to create a database at the p=<.05 level,
[F(2,222)=3.159, p=.026]. The results presented in Table 44 together with the values in Table
45 suggest that participants in the lowest age group were more confident in being able to
create a database while the participants aged 40 years and over were the least confident in
this particular task.
No significant effects were shown regarding a participant's location, gender, subject area or
teaching experience in the number of participants confidence in being able to create a
database. The results are shown in Table 44 below.
Condition Results
Location (n=225) [F(3,222)=.120, p=.948]
Age (n-225) [F(3,222)=3.159, p=.026]
Gender (n=210) [F(3,207)=1.081, p=.358]
Subject Area (n=225) [F(3,222)=2.308, p=.077]
Teaching Experience (n=224) [F(3,2212)=1.316, p=.270]
Appendix E Table 44: Teacher self-efficacy in creating a database by Location, Age, Gender, Subject Area and Teaching Experience.
The frequency table indicates that all respondents in the youngest age group were more
confident of being able to create a database and the participants in the 40 years and older age
groups were least confident of creating a database. The results are shown in Table 45 below.
Appendix E Table 45: Frequency table showing number of participants who were able to create a database by age.
Age
Years
None A little somewhat A lot
=<29 2 6 9 11
30 – 30 8 19 16 14
40 – 49 15 22 16 20
=50 21 19 15 16

227
Confidence creating an online questionnaire.
A one-way between subjects’ ANOVA was conducted to compare means exploring whether
there is a statistically significant difference in the means values of the number of respondents
who are "confident in creating an online questionnaire" by Location, Age, Gender, Subject Area
and Teaching Experiences.
No significant effects were shown regarding location, gender or teaching experience in the
number of participants using resources collected from existing educational sources in
classroom delivery or teaching. The results are shown in Table 46 below.
Condition Results
Location (n=225) [F(3,222)=.162, p=.922]
Age (n-225) [F(3,222)=8.038, p=.001]
Gender (n=210) [F(3,207)=.394, p=.757]
Subject Area (n=225) [F(3,222)=4.576, p=.004]
Teaching Experience (n=224) [F(3,221)=1.832, p=.142]
Appendix E Table 46: Teacher self-efficacy showing participants able to create an online questionnaire by Location, Age, Gender, Subject Area and Teaching Experience.
The frequency table indicates that participants in age groups 39 years and younger were more
confident in being able to create an on-line questionnaire than were the participants aged 40
years and over. The respondents in the older age groups had the most participants with little
or no confidence in this task. The results are shown in Table 47 below.
Age
Years
None A little Somewhat A lot
=<29 1 8 19
30 – 30 2 11 16 29
40 – 49 5 23 16 26
=50 13 15 22 20
Appendix E Table 47: Frequency table showing number of participants who have confidence in creating an online questionnaire by age.

228
The frequency table indicates that participants in Computing and Design, Academic and
Vocational Specific subject areas had high numbers of participants with confidence levels of
"somewhat" or above, the Higher Education subject area showed the only participants that had
more respondents with little or no confidence in this task than possessed confidence at
"somewhat" or a lot. The results are shown in Table 48 below.
Subject
Areas
None A little Somewhat A lot
Academic 6 13 17 23
Engineering 4 8 10 9
Vocational Specific 6 19 23 22
Higher Ed. 2 7 2 4
Vocational Related 2 2 8
Computing & Design 1 1 4 20
Student Support 1 4 8
Appendix E Table 48: Frequency table showing number of participants who collect resources from existing educational sources in classroom delivery and teaching by subject area.
Confidence in emailing files.
A one-way between subjects’ ANOVA was conducted to compare means exploring whether
there is a statistically significant difference in the means values of the number of respondents
who are "confident in emailing files" by Location, Age, Gender, Subject Area and Teaching
Experiences.
The results presented in Table 49 together with the values in Table 50 suggest that participants
in the oldest age group had the least confidence in emailing files. Participants in Computing
and Design subject areas had the most confidence in emailing files.
No significant effects were shown regarding location, age, subject area or teaching experience
in the number of participants confident in emailing files. The results are shown in Table 49
below.
Condition Results
Location (n=226) [F(2,224)=.570, p=.567]
Age (n-226) [F(2,224)=1.799, p=.168]
Gender (n=211) [F(2,209)=.4.929, p=.008]
Subject Area (n=226) [F(2,224)=.613, p=.543]
Teaching Experience (n=225) [F(2,223)=.915, p=.402]
Appendix E Table 49: Teacher self-efficacy in emailing files by Location, Age, Gender, Subject Area and Teaching Experience.

229
Check results from participants who did not indicate gender.
The frequency table indicates that respondents in the oldest age group have the least
confidence in creating an online questionnaire and the youngest age group had most
confidence. The results are shown in Table 50 below.
Age
Years
None A little Somewhat A lot
=<29 1 8 19
30 – 30 2 11 16 29
40 – 49 5 23 16 26
=50 13 15 22 20
Appendix E Table 50: Frequency table showing number of participants who have confidence in creating an online questionnaire by age.
Confidence in creating a presentation containing simple animation.
A one-way between subjects’ ANOVA was conducted to compare means exploring whether
there is a statistically significant difference in the means values of the number of respondents
who are "confident in creating a presentation with simple animation" by Location, Age, Gender,
Subject Area and Teaching Experiences.
There was a significant effect of age on teacher self-efficacy in being able to create a
presentation containing simple animation at the p=<.05 level [F(3,224)=3.329, p=.020]. The
results presented in Table 51 together with the values in Table 52 suggest that participants in
the youngest age group had the most confidence in creating a presentation with simple
animation although within all age groups most participants responded that they were
somewhat confident in performing this task. There were a small number of participants across
three age groups that reported no confidence in being able to create a presentation using
simple animation.

230
No significant effects were shown regarding location, gender, subject area or teaching
experience in the number of participants confident in creating a presentation containing simple
animation. The results are shown in Table 51 below.
Condition Results
Location (n=227) [F(3,224)=.312, p=.816]
Age (n-227) [F(3,224)=3.329, p=.020]
Gender (n=212) [F(3,209)=.530, p=.662]
Subject Area (n=227) [F(3,224)=1.643, p=.180]
Teaching Experience (n=226) [F(3,223)=1.837, p=.141]
Appendix E Table 51: Teacher self-efficacy in being able to create a presentation containing simple animation by Location, Age, Gender, Subject Area and Teaching Experience.
The frequency table indicates that participants in the youngest age group had the most
confidence in creating a presentation with simple animation although within all age groups
most participants responded that they were somewhat confident in performing this particular
task. There were a small number of participants across three age groups that reported no
confidence in being able to create a presentation using simple animation. The results are
shown in Table 52 below.
Age
Years
None A little Somewhat A lot
=<29 1 2 25
30 – 30 2 8 49
40 – 49 3 4 15 48
=50 2 5 18 46
Appendix E Table 52: Frequency table showing number of participants who have confidence in creating a presentation with simple animation by age.
Confidence create a presentation containing video.
A one-way between subjects’ ANOVA was conducted to compare means exploring whether
there is a statistically significant difference in the means values of the number of respondents
who are "confident in creating a presentation containing video" by Location, Age, Gender,
Subject Area and Teaching Experiences.
There was a significant effect of age on teacher self-efficacy in being able to create a
presentation containing video at the p=<.05 level [F(3,223)=5.541, p=.001]. The results
presented in Table 53 together with the values in Table 54 suggest that participants in the

231
youngest age group reported high levels of participants who were somewhat or more confident
in this task, there was a slight increase in the number of participants who had little or no
confidence in creating a presentation containing video.
No significant effects were shown regarding location, gender, subject area or teaching
experience in the number of participants in the number of participants confident in creating a
presentation containing video. The results are shown in Table 53 below.
Condition Results
Location (n=226) [F(3,223)=.167, p=.919]
Age (n-226) [F(3,223)=5.541, p=.001]
Gender (n=211) [F(3,208)=.232, p=.874]
Subject Area (n=226) [F(3,223)=2.429, p=.066]
Teaching Experience (n=225) [F(3,222)=.691, p=.558]
Appendix E Table 53: Teacher self-efficacy in being able to create a presentation containing video by Location, Age, Gender, Subject Area and Teaching Experience.
The frequency table indicates that respondents in the youngest age group reported high levels
of participants who were somewhat or a lot confident in this task, there was a slight increase
in the number of participants who had little or no confidence in creating a presentation
containing video. The results are shown in Table 54 below.
Age
Years
None A little Somewhat A lot
=<29 2 1 25
30 – 30 3 9 46
40 – 49 4 5 13 48
=50 4 9 19 39
Appendix E Table 54: Frequency table showing number of participants who have confidence in creating a presentation containing video by age.

232
Confidence participating in a professional online forum.
A one-way between subjects’ ANOVA was conducted to compare means exploring whether
there is a statistically significant difference in the means values of the number of respondents
who participate in a professional online forum by Location, Age, Gender, Subject Area and
Teaching Experiences.
There was a significant effect of age on teacher participation in professional online forums at
the p=<.05 level [F(3,222)=9.879, p=.001]. The results presented in Table 55 together with the
values in Table 56 suggest that participants in the age groups of 39 years or younger had more
confidence in creating a participating in a professional on-line forum, as the age of the
participants increased the confidence level for taking part in on-line professional forums
decreased.
No significant effects were shown in regard to location, gender, subject area or teaching
experience in the number of participants taking part in professional online forums. The results
are shown in Table 55 below.
Condition Results
Location (n=225) [F(3,222)=.673, p=.570]
Age (n-225) [F(3,222)=9.879, p=.001]
Gender (n=210) [F(3,207)=1.677, p=.173]
Subject Area (n=225) [F(3,222)=1.704, p=.167]
Teaching Experience (n=224) [F(3,221)=1.815, p=.145]
Appendix E Table 55: Teacher self-efficacy in participating in professional online forums by Location, Age, Gender, Subject Area and Teaching Experience.
The frequency table indicates that respondents in the participants in the age groups of 39 years
and younger had more confidence in participating in a professional on-line forum than did the
participants in the age groups 40 years and over in participating in professional online forums,
as the age of the participants increased the confidence level for taking part in on-line
professional forums decreased. The results are shown in Table 56 below.
Age
Years
None A little Somewhat A lot
=<29 1 1 3 23
30 – 30 6 6 15 31
40 – 49 7 10 23 29
=50 10 20 21 20
Appendix E Table 56: Frequency table showing number of participants who have confidence taking part in professional online forums by age.
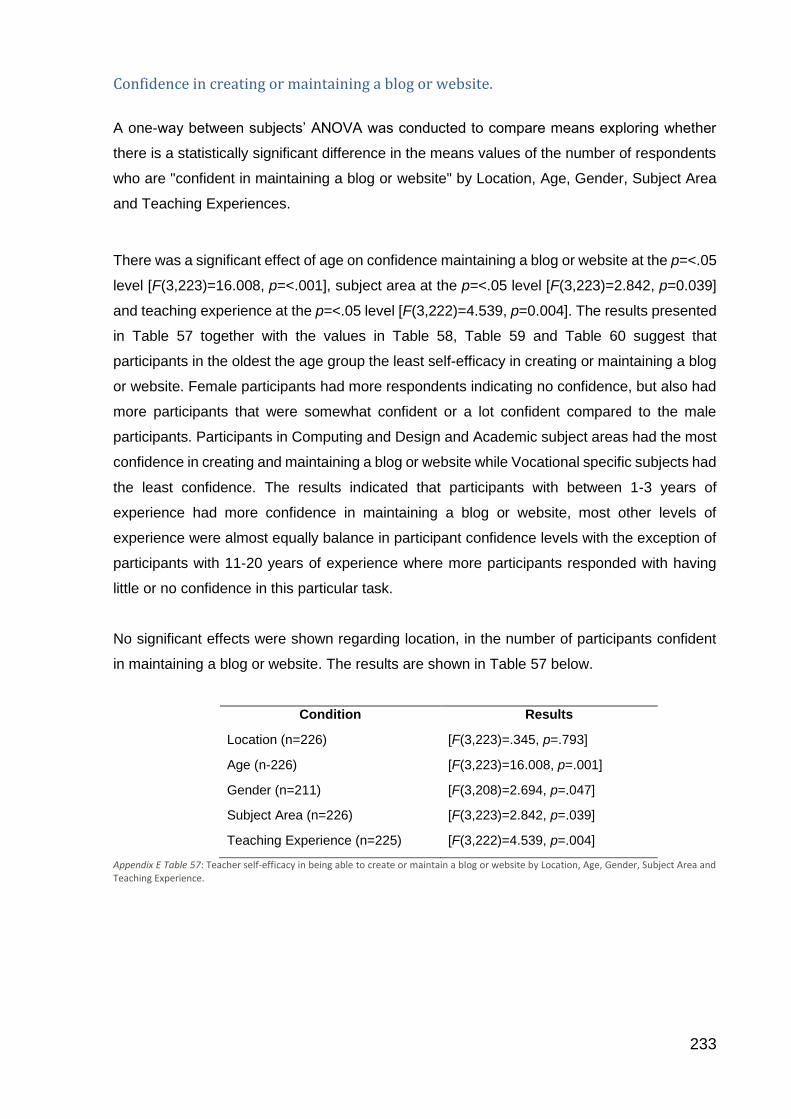
233
Confidence in creating or maintaining a blog or website.
A one-way between subjects’ ANOVA was conducted to compare means exploring whether
there is a statistically significant difference in the means values of the number of respondents
who are "confident in maintaining a blog or website" by Location, Age, Gender, Subject Area
and Teaching Experiences.
There was a significant effect of age on confidence maintaining a blog or website at the p=<.05
level [F(3,223)=16.008, p=<.001], subject area at the p=<.05 level [F(3,223)=2.842, p=0.039]
and teaching experience at the p=<.05 level [F(3,222)=4.539, p=0.004]. The results presented
in Table 57 together with the values in Table 58, Table 59 and Table 60 suggest that
participants in the oldest the age group the least self-efficacy in creating or maintaining a blog
or website. Female participants had more respondents indicating no confidence, but also had
more participants that were somewhat confident or a lot confident compared to the male
participants. Participants in Computing and Design and Academic subject areas had the most
confidence in creating and maintaining a blog or website while Vocational specific subjects had
the least confidence. The results indicated that participants with between 1-3 years of
experience had more confidence in maintaining a blog or website, most other levels of
experience were almost equally balance in participant confidence levels with the exception of
participants with 11-20 years of experience where more participants responded with having
little or no confidence in this particular task.
No significant effects were shown regarding location, in the number of participants confident
in maintaining a blog or website. The results are shown in Table 57 below.
Condition Results
Location (n=226) [F(3,223)=.345, p=.793]
Age (n-226) [F(3,223)=16.008, p=.001]
Gender (n=211) [F(3,208)=2.694, p=.047]
Subject Area (n=226) [F(3,223)=2.842, p=.039]
Teaching Experience (n=225) [F(3,222)=4.539, p=.004]
Appendix E Table 57: Teacher self-efficacy in being able to create or maintain a blog or website by Location, Age, Gender, Subject Area and Teaching Experience.

234
The frequency table indicates that youngest age group reported more confidence in being able
to maintain a blog or website, as the age or the participant increased then so did the number
of participants reporting no confidence in this particular task. Participants in the age groups 40
years and over had the lowest level of self-efficacy in creating or maintaining a blog or website.
The results are shown in Table 58 below.
Age
Years
None A little Somewhat A lot
=<29 4 6 18
30 – 30 13 7 18 20
40 – 49 20 20 13 17
=50 29 23 11 8
Appendix E Table 58: Frequency table showing number of participants who have confidence in creating or maintaining a blog or website by age.
The frequency table indicates that Participants in Computing and Design and Academic
subject areas had the most confidence in creating and maintaining a blog or website while
Vocational specific subjects had the least confidence. the Computing & Design and Academic
subject areas there was a high level of respondents confident in being able to create and
maintain a blog or website the Vocational specific and Engineering subject areas had the
highest number of participants reporting little or no confidence in this task. The results are
shown in Table 59 below.
Subject
Areas
None A little Somewhat A lot
Academic 15 9 14 20
Engineering 11 11 3 6
Vocational Specific 24 21 18 8
Higher Ed. 6 4 3 2
Vocational Related 2 3 3 4
Computing & Design 3 5 18
Student Support 3 3 2 5
Appendix E Table 59: Frequency table showing number of participants who have confidence in creating or maintaining a blog or website by subject area.

235
The frequency table indicates that participants The results indicated that participants with
between 1-3 years of experience had more confidence in maintaining a blog or website, most
other levels of experience were almost equally balance in participant confidence levels with
the exception of participants with 11-20 years of experience where more participants
responded with having little or no confidence in this particular task The results are shown in
Table 60 below.
Teaching Experience
Years
None A little Somewhat A lot
=<1 4 1 5
1 - 3 2 5 13 13
4 – 10 25 18 14 29
11 – 20 24 21 13 12
=>21 6 9 8 4
Appendix E Table 60: Frequency table showing number of participants who have confidence in creating or maintaining a blog or website by teaching experience.
Confidence in participating in a social network.
A one-way between subjects’ ANOVA was conducted to compare means exploring whether
there is a statistically significant difference in the means values of the number of respondents
who are "confident in participating in social network" by Location, Age, Gender, Subject Area
and Teaching Experiences.
There was a significant effect of age on confidence participating in social network at the p=<.05
level [F(3,223)=17.339, p=<.001]. The results presented in Table 61 together with the values
in Table 62suggest that participants in the age groups of 39 years and less had more self-
efficacy in participating in social networks than participants on older age groups.
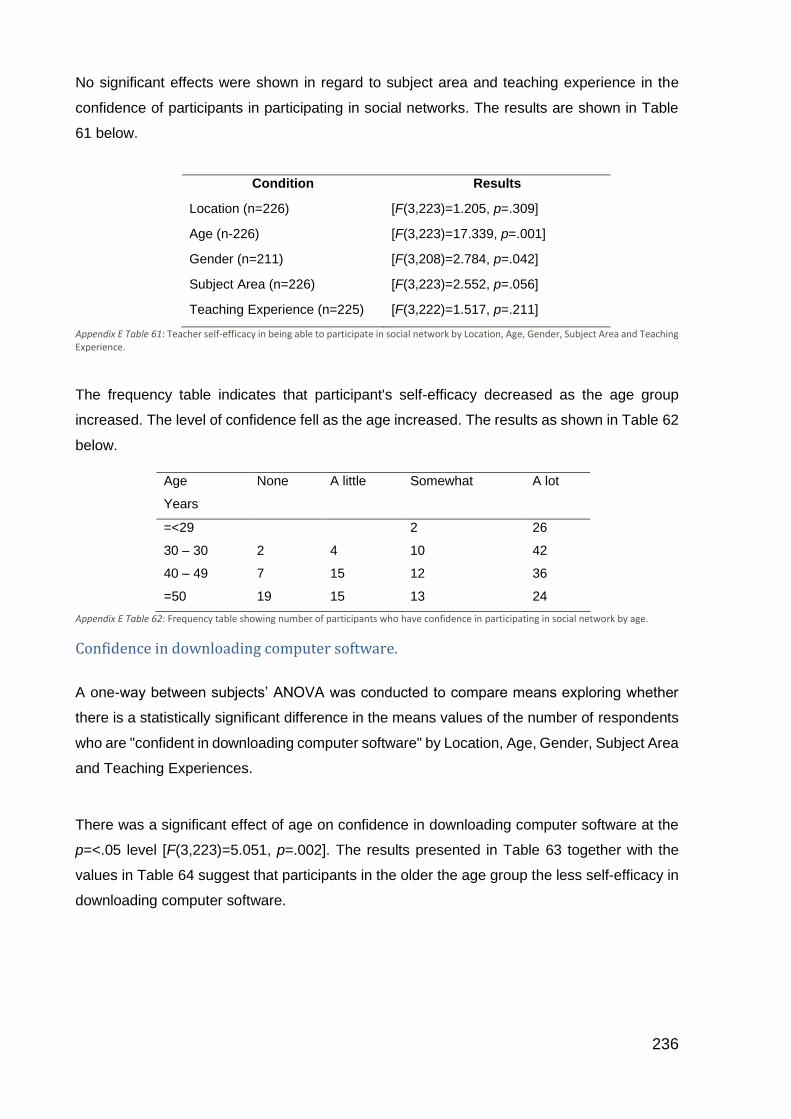
236
No significant effects were shown in regard to subject area and teaching experience in the
confidence of participants in participating in social networks. The results are shown in Table
61 below.
Condition Results
Location (n=226) [F(3,223)=1.205, p=.309]
Age (n-226) [F(3,223)=17.339, p=.001]
Gender (n=211) [F(3,208)=2.784, p=.042]
Subject Area (n=226) [F(3,223)=2.552, p=.056]
Teaching Experience (n=225) [F(3,222)=1.517, p=.211]
Appendix E Table 61: Teacher self-efficacy in being able to participate in social network by Location, Age, Gender, Subject Area and Teaching Experience.
The frequency table indicates that participant's self-efficacy decreased as the age group
increased. The level of confidence fell as the age increased. The results as shown in Table 62
below.
Age
Years
None A little Somewhat A lot
=<29 2 26
30 – 30 2 4 10 42
40 – 49 7 15 12 36
=50 19 15 13 24
Appendix E Table 62: Frequency table showing number of participants who have confidence in participating in social network by age.
Confidence in downloading computer software.
A one-way between subjects’ ANOVA was conducted to compare means exploring whether
there is a statistically significant difference in the means values of the number of respondents
who are "confident in downloading computer software" by Location, Age, Gender, Subject Area
and Teaching Experiences.
There was a significant effect of age on confidence in downloading computer software at the
p=<.05 level [F(3,223)=5.051, p=.002]. The results presented in Table 63 together with the
values in Table 64 suggest that participants in the older the age group the less self-efficacy in
downloading computer software.
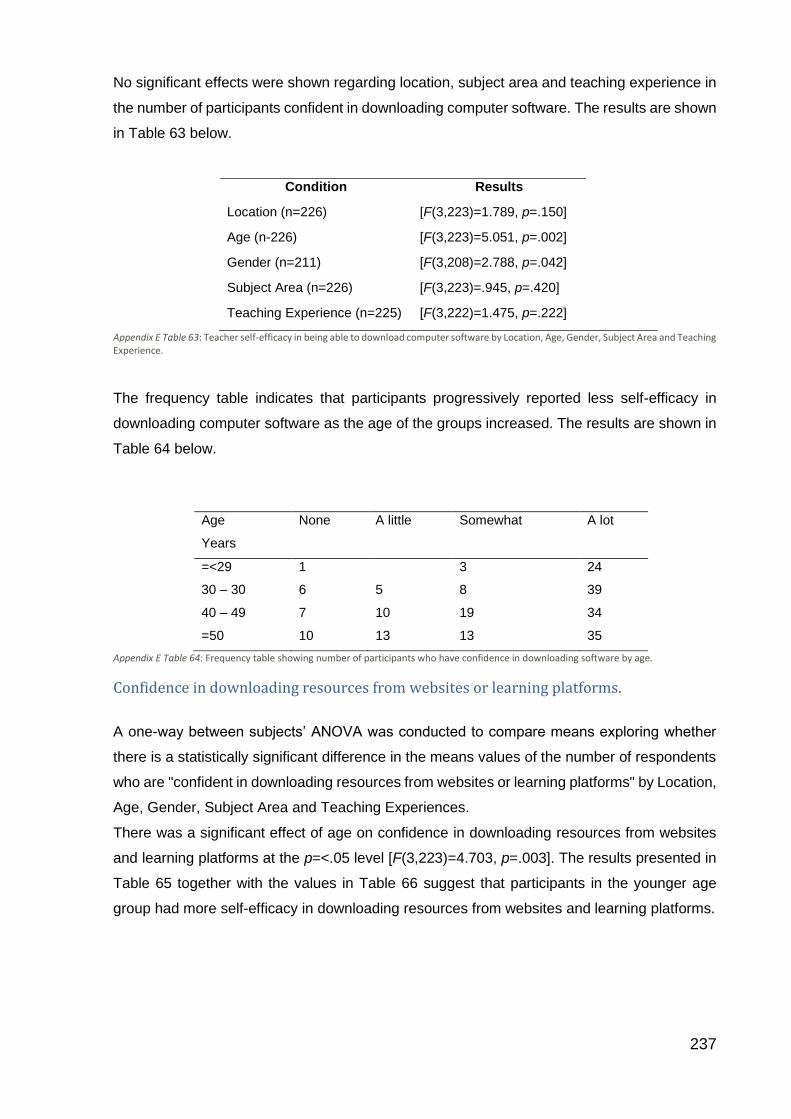
237
No significant effects were shown regarding location, subject area and teaching experience in
the number of participants confident in downloading computer software. The results are shown
in Table 63 below.
Condition Results
Location (n=226) [F(3,223)=1.789, p=.150]
Age (n-226) [F(3,223)=5.051, p=.002]
Gender (n=211) [F(3,208)=2.788, p=.042]
Subject Area (n=226) [F(3,223)=.945, p=.420]
Teaching Experience (n=225) [F(3,222)=1.475, p=.222]
Appendix E Table 63: Teacher self-efficacy in being able to download computer software by Location, Age, Gender, Subject Area and Teaching Experience.
The frequency table indicates that participants progressively reported less self-efficacy in
downloading computer software as the age of the groups increased. The results are shown in
Table 64 below.
Age
Years
None A little Somewhat A lot
=<29 1 3 24
30 – 30 6 5 8 39
40 – 49 7 10 19 34
=50 10 13 13 35
Appendix E Table 64: Frequency table showing number of participants who have confidence in downloading software by age.
Confidence in downloading resources from websites or learning platforms.
A one-way between subjects’ ANOVA was conducted to compare means exploring whether
there is a statistically significant difference in the means values of the number of respondents
who are "confident in downloading resources from websites or learning platforms" by Location,
Age, Gender, Subject Area and Teaching Experiences.
There was a significant effect of age on confidence in downloading resources from websites
and learning platforms at the p=<.05 level [F(3,223)=4.703, p=.003]. The results presented in
Table 65 together with the values in Table 66 suggest that participants in the younger age
group had more self-efficacy in downloading resources from websites and learning platforms.
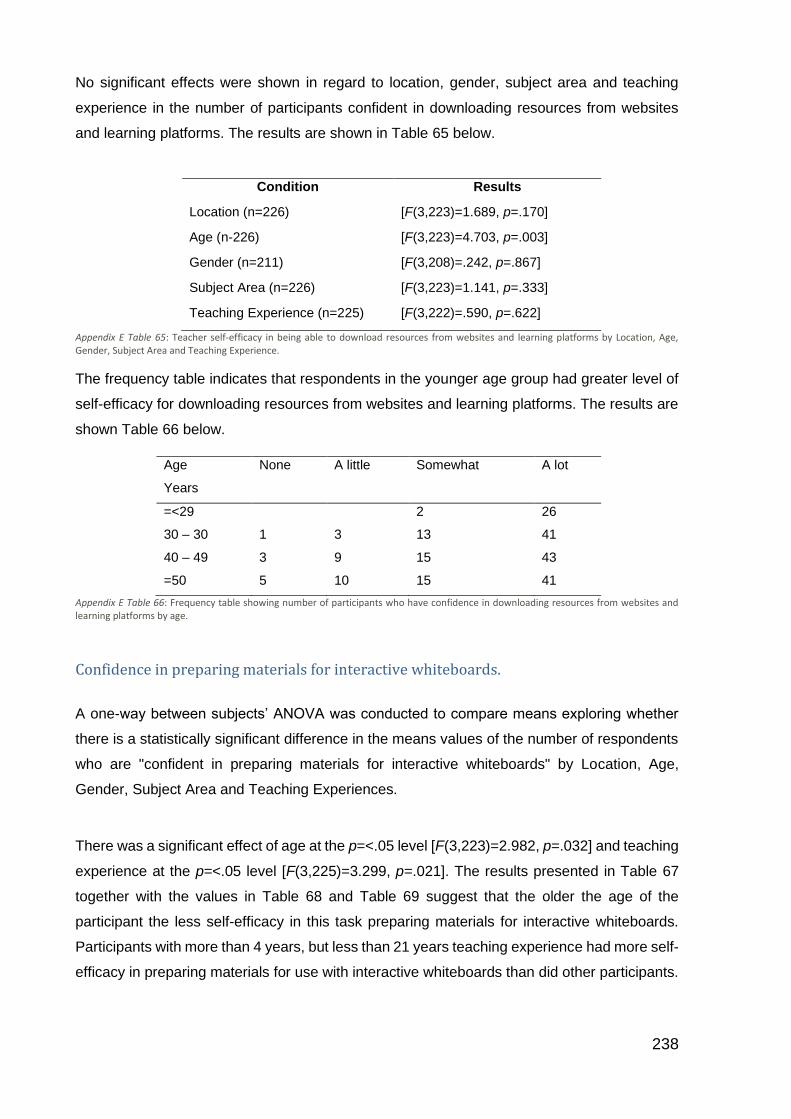
238
No significant effects were shown in regard to location, gender, subject area and teaching
experience in the number of participants confident in downloading resources from websites
and learning platforms. The results are shown in Table 65 below.
Condition Results
Location (n=226) [F(3,223)=1.689, p=.170]
Age (n-226) [F(3,223)=4.703, p=.003]
Gender (n=211) [F(3,208)=.242, p=.867]
Subject Area (n=226) [F(3,223)=1.141, p=.333]
Teaching Experience (n=225) [F(3,222)=.590, p=.622]
Appendix E Table 65: Teacher self-efficacy in being able to download resources from websites and learning platforms by Location, Age, Gender, Subject Area and Teaching Experience.
The frequency table indicates that respondents in the younger age group had greater level of
self-efficacy for downloading resources from websites and learning platforms. The results are
shown Table 66 below.
Age
Years
None A little Somewhat A lot
=<29 2 26
30 – 30 1 3 13 41
40 – 49 3 9 15 43
=50 5 10 15 41
Appendix E Table 66: Frequency table showing number of participants who have confidence in downloading resources from websites and learning platforms by age.
Confidence in preparing materials for interactive whiteboards.
A one-way between subjects’ ANOVA was conducted to compare means exploring whether
there is a statistically significant difference in the means values of the number of respondents
who are "confident in preparing materials for interactive whiteboards" by Location, Age,
Gender, Subject Area and Teaching Experiences.
There was a significant effect of age at the p=<.05 level [F(3,223)=2.982, p=.032] and teaching
experience at the p=<.05 level [F(3,225)=3.299, p=.021]. The results presented in Table 67
together with the values in Table 68 and Table 69 suggest that the older the age of the
participant the less self-efficacy in this task preparing materials for interactive whiteboards.
Participants with more than 4 years, but less than 21 years teaching experience had more self-
efficacy in preparing materials for use with interactive whiteboards than did other participants.

239
No significant effects were shown regarding gender and subject area in the number of
participants preparing materials for interactive whiteboards. The results are shown in Table 67
below.
Condition Results
Location (n=226) [F(3,223)=3.078, p=.028]
Age (n-226) [F(3,223)=2.982, p=.032]
Gender (n=211) [F(3,208)=.604, p=.613]
Subject Area (n=226) [F(3,223)=2.196, p=.089]
Appendix E Table 67: Teacher self-efficacy in being able to preparing materials for interactive whiteboards. by Location, Age, Gender, Subject Area and Teaching Experience.
The frequency table indicates that proportionally as the age of the group progressed so did the
self-efficacy of the participants in preparing for use with interactive whiteboards. The results
are shown in Table 68 below.
Age
Years
None A little Somewhat A lot
=<29 3 2 4 19
30 – 30 5 11 9 33
40 – 49 9 10 22 29
=50 3 14 22 32
Appendix E Table 68: Frequency table showing number of participants who have confidence in preparing materials for interactive whiteboards by age.
The frequency table indicates that participants with more than 4 years but less than 21 years
teaching experience had more self-efficacy in preparing materials for use with interactive
whiteboards than did other participants. The results are shown in Table 69 below.
Teaching Experience
(Years)
None A little Somewhat A lot
=<1 1 2 6 10
1 - 3 1 5 7 20
4 – 10 10 15 17 44
11 – 20 7 10 21 32
Appendix E Table 69: Frequency table showing number of participants who have confidence in preparing materials for interactive whiteboards by teaching experience.

240
Summary table of statistical significance results concerning teacher self-efficacy
performing tasks involving ICT.
The summary table below (Table 70) displays the results of the one-way between subjects’
ANOVA tests conducted to compare means exploring whether there is a statistically significant
difference in the means values of Location, Age, Gender, Subject Area and Teaching
Experience for teacher self-efficacy on a number of tasks involving and using ICT.
The results indicate that of the 20 results showing statistical significance, ten results indicated
that the independent variable age indicated a significant result, five of these results indicated
that the independent variable was gender, two results indicated that the independent variable
was subject area and teaching experience the other result was with independent variable
location.
Independent Variable showing statistical significance at the p=.05 level Condition Location Age Gender Subject Area Teaching
Experience
Create a database [F(2,222)=3.159, p=.026].
Create an online questionnaire
[F(3,222)=4.576, p=0.004]
[F(3,222)=4.576, p=0.004]
Email files [F(2,209)=4.929, p=.008]
Create a presentation with simple animation.
[F(3,224)=3.329, p=.020]
Creating a presentation with video
[F(3,223)=5.541, p=.001]
Participating in a professional online forum
[F(3,222)=9.879, p=.001
Create or maintain a blog or website
[F(3,223)=16.008, p=<.001]
[F(3,208)=2.694, p=.047]
[F(3,223)=2.842, p=0.039]
[F(3,222)=4.539, p=0.004].
Participating in social network
[F(3,223)=17.339, p=<.001]
[F(3,208)=2.784, p=.042].
Downloading computer software
[F(3,223)=5.051, p=.002]
[F(3,208)=2.788, p=.042]
Download resources from learning platform
[F(3,223)=4.703, p=.003].
Preparing material for use with whiteboards
[F(3,223)=3.078, p=.028]
[F(3,223)=2.982, p=.032]
[F(3,225)=3.299, p=.021].
Programming [F(3,208)=4.180, p=.007]
Appendix E Table 70: Summary of test showing statistical significance for teacher self-efficacy in specific tasks using ICT.

241
Frequency and type of teacher engagement with technology in their teaching practice.
Using ICT to browse or search the internet for resources to be used during classroom
practice.
A one-way between subjects’ ANOVA was conducted to compare means exploring whether
there is a statistically significant difference in the means values of the number of respondents
who "use ICT to collect resources to be used during lesson" by Location, Age, Gender, Subject
Area and Teaching Experiences.
There was a significant effect of age on using ICT integration to collect resources to be used
during at the p<.05 level [F(3,225)=3.654, p=.013]. The results presented in Table 71 together
with the values in Table 72 suggest that younger participants used ICT for this task in some
way while all other age groups had one participant who never used ICT for this task.
No significant effects regarding location, subject area or teaching experience in the collection
of resources to be used in classroom practice. The results are shown in Table 71 below.
Condition Results
Location (n=228) [F(3,225)=.130, p=.942]
Age (n-2225) [F(3,225)=3.654, p=.013]
Gender (n=213) [F(3,210)=2.971, p=.0.33]
Subject Area (n=225) [F(3,225)=1.126, p=.339]
Teaching Experience (n=227) [F(3,224)=1.188, p=.315]
Appendix E Table 71: Teacher engagement with ICT using apps to prepare presentations by Location, Age, Gender, Subject Area and Teaching Experience.
The frequency table indicates that respondents in the youngest age group use the internet to
source resources for use during lessons to some degree. The results are shown in Table 72
below.
Age
Years
Never
Rarely
Sometime Often All the time
=<29 7 21
30 – 30 2 7 19 32
40 – 49 1 7 26 35
=50 5 33 33
Appendix E Table 72: Frequency table showing number of participants who engage with ICT to collect resources to be used in class teaching by age.

242
4.5.5 Using ICT to create their own digital materials.
A one-way between subjects’ ANOVA was conducted to compare means exploring whether
there is a statistically significant difference in the means values of the number of respondents
who engaged in "creating their own digital materials" by Location, Age, Gender, Subject Area
and Teaching Experiences.
There was a significant effect of subject area on ICT integration concerning respondents
creating their own digital material at the p<.05 level [F(3,223=3.652, p=0.013]. The results
presented in Table 73 together with the values in Table 74 suggest that participants in subject
areas of computing and design had higher levels of participants creating their own digital
learning material.
No significant effects regarding location, age or gender in the number of participants creating
their own digital materials. The results are shown in Table 73 below.
Condition Results
Location (n=226) [F(3,223)=.548, p=.650]
Age (n-226) [F(3,223)=1.131, p=.337]
Gender (n=211) [F(3,208)=1.328, p=.266]
Subject Area (n=226) [F(3,223)=3.652, p=.013]
Teaching Experience (n=225) [F(3,222)=.196, p=.899]
Appendix E Table 73: Teacher engagement with ICT and creating their own digital material by Location, Age, Gender, Subject Area and Teaching Experience.

243
The frequency table indicates that within the Computing and design subjects there was a high
level of respondents creating their own digital materials. Other subject areas were not shown
to have a statistically significant influence on whether or not they created their own digital
materials. The results are shown in Table 74 below.
Subject
Areas
Never
Rarely
Sometimes Often All the Time
Academic 11 17 20 10
Engineering 6 8 11 6
Vocational Specific 13 22 22 15
Higher Ed. 4 2 6 3
Vocational Related 1 5 4 2
Computing & Design 3 17 26
Student Support 8 3 2
Appendix E Table 74: Frequency table showing number of participants who engage with ICT to create their own digital material by subject area.
Using ICT to prepare exercises for students.
A one-way between subjects’ ANOVA was conducted to compare means exploring whether
there is a statistically significant difference in the means values of the number of respondents
"using applications to prepare exercises for students" by Location, Age, Gender, Subject Area
and Teaching Experiences.
There was a significant effect of age on ICT integration in respect to respondents using
applications to prepare tasks or exercises for students at the p<.05 level [F(4,203=3.77,
p=0.006]. The results presented in Table 75 together with the values in Table 76 suggest that
younger participants had higher levels of participants that used ICT to prepare tasks for
students. No significant effects regarding location, gender or subject specialisation in
preparing tasks for students. The results are shown in Table 75 below.
Condition Results
Location (n=226) [F(3,223)=1.702, p=.167]
Age (n-226) [F(3,223)=4.253, p=.006]
Gender (n=211) [F(3,208)=1.431, p=.235]
Subject Area (n=226) [F(3,223)=.459, p=.711]
Teacher Experience (n=225) [F(3,222)=.175, p=.913]
Appendix E Table 75: Teacher engagement with ICT using applications to prepare tasks for students by Location, Age, Gender, Subject Area and Teaching Experience.
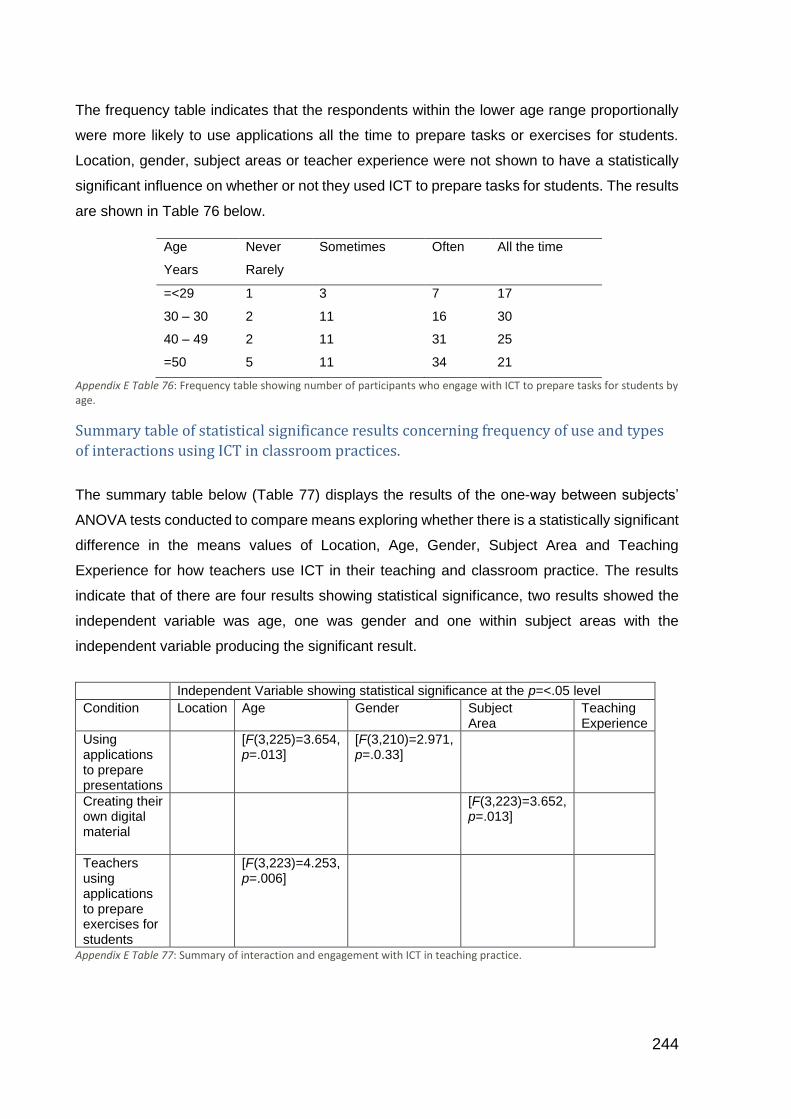
244
The frequency table indicates that the respondents within the lower age range proportionally
were more likely to use applications all the time to prepare tasks or exercises for students.
Location, gender, subject areas or teacher experience were not shown to have a statistically
significant influence on whether or not they used ICT to prepare tasks for students. The results
are shown in Table 76 below.
Age
Years
Never
Rarely
Sometimes Often All the time
=<29 1 3 7 17
30 – 30 2 11 16 30
40 – 49 2 11 31 25
=50 5 11 34 21
Appendix E Table 76: Frequency table showing number of participants who engage with ICT to prepare tasks for students by age.
Summary table of statistical significance results concerning frequency of use and types
of interactions using ICT in classroom practices.
The summary table below (Table 77) displays the results of the one-way between subjects’
ANOVA tests conducted to compare means exploring whether there is a statistically significant
difference in the means values of Location, Age, Gender, Subject Area and Teaching
Experience for how teachers use ICT in their teaching and classroom practice. The results
indicate that of there are four results showing statistical significance, two results showed the
independent variable was age, one was gender and one within subject areas with the
independent variable producing the significant result.
Independent Variable showing statistical significance at the p=<.05 level
Condition Location Age Gender Subject Area
Teaching Experience
Using applications to prepare presentations
[F(3,225)=3.654, p=.013]
[F(3,210)=2.971, p=.0.33]
Creating their own digital material
[F(3,223)=3.652, p=.013]
Teachers using applications to prepare exercises for students
[F(3,223)=4.253, p=.006]
Appendix E Table 77: Summary of interaction and engagement with ICT in teaching practice.

245
Types of ICT resources used in classroom delivery or teaching.
Introduction.
A number of one-way between subjects’ ANOVA was conducted to compare means to
exploring whether there is a statistically significant difference in the means values of Location,
Age, Gender, Subject Area and Teaching Experience on the types and source of ICT resources
used in classroom delivery or teaching.
Using resources from existing educational sources in classroom delivery and teaching.
A one-way between subjects’ ANOVA was conducted to compare means exploring whether
there is a statistically significant difference in the means values of the number of respondents
who use "resources collected from existing educational sources in classroom delivery and
teaching" by Location, Age, Gender, Subject Area and Teaching Experiences.
There was a significant effect of age on the use of resources collected from existing
educational sources in classroom delivery and teaching at the p<.05 level [F(1,222)=5.795,
p=.017] and of subject area at the p<.05 level [F(1,222)= 8.327, p=0.004]. The results
presented in Table 78 together with the values in Table 79 and Table 80 suggest that
participants in the lowest age group and in subject areas Vocational Related and Academic
subject areas had higher levels of participants using resources collected from existing
educational sources in classroom delivery and teaching.
No significant effects concerning location, gender or teaching experience in the number of
participants using resources collected from existing educational sources in classroom delivery
or teaching. The results are shown in Table 78 below.
Condition Results
Location (n=223) [F(1,222)=5.795, p=.017]
Age (n-223) [F(1,222)=1.387, p=.240]
Gender (n=208) [F(1,207)=3.089, p=.080]
Subject Area (n=223) [F(1,222)=8.327, p=.004]
Teaching Experience (n=222) [F(1,221)=1.893, p=.170]
Appendix E Table 78: Teacher use of resources collected from existing educational sources in classroom delivery and teaching by Location, Age, Gender, Subject Area and Teaching Experience.

246
The frequency table indicates that all respondents in the youngest age group use resources
collected from exiting educational sources in their classroom delivery and teaching. The results
are shown in Table 79 below.
Age
Years
Yes No
=<29 28
30 – 30 53 6
40 – 49 61 7
=50 62 7
Appendix E Table 79: Frequency table showing number of participants who collect resources from existing educational sources in classroom delivery and teaching by age.
The frequency table indicates that within the Vocational Related and Academic subject areas
there was a high level of respondents using resources collected from existing educational
sources in classroom delivery and teaching. The results are shown in Table 80 below.
Subject
Areas
Yes No
Academic 57 1
Engineering 26 4
Vocational Specific 67 5
Higher Ed. 12 2
Vocational Related 12
Computing & Design 21 4
Student Support 9 4
Appendix E Table 80: Frequency table showing number of participants who collect resources from existing educational sources in classroom delivery and teaching by subject area.
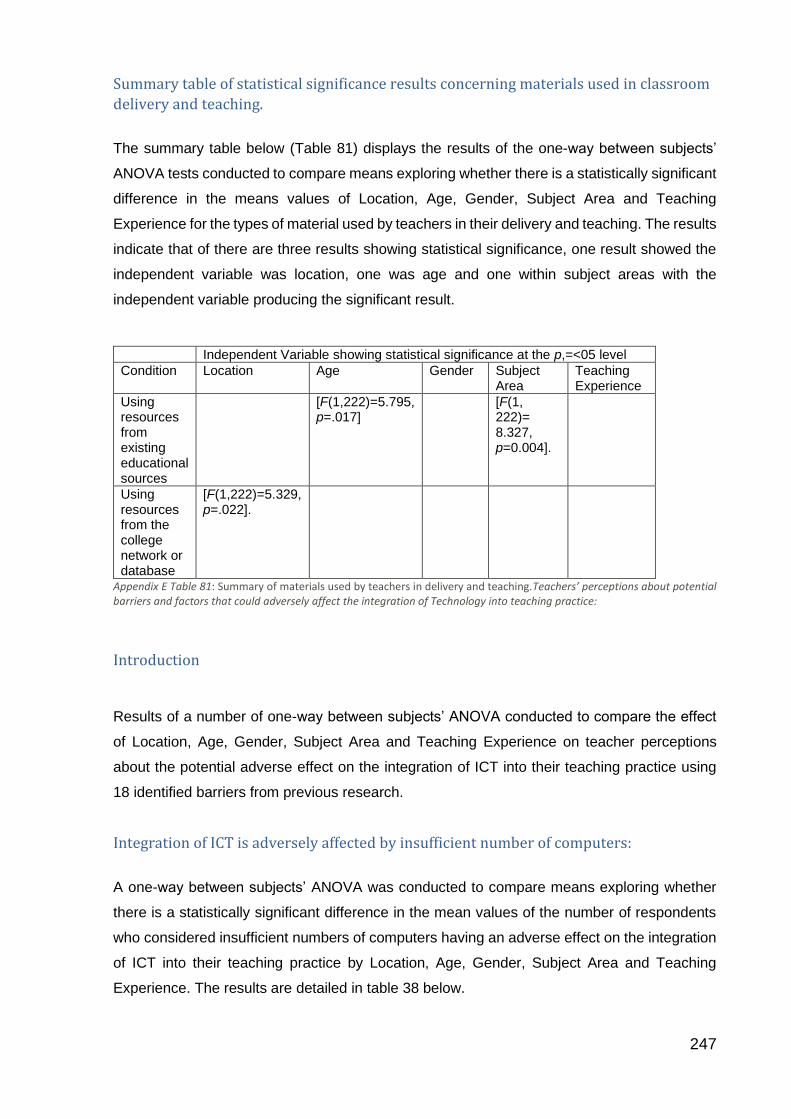
247
Summary table of statistical significance results concerning materials used in classroom
delivery and teaching.
The summary table below (Table 81) displays the results of the one-way between subjects’
ANOVA tests conducted to compare means exploring whether there is a statistically significant
difference in the means values of Location, Age, Gender, Subject Area and Teaching
Experience for the types of material used by teachers in their delivery and teaching. The results
indicate that of there are three results showing statistical significance, one result showed the
independent variable was location, one was age and one within subject areas with the
independent variable producing the significant result.
Independent Variable showing statistical significance at the p,=<05 level
Condition Location Age Gender Subject Area
Teaching Experience
Using resources from existing educational sources
[F(1,222)=5.795, p=.017]
[F(1, 222)= 8.327, p=0.004].
Using resources from the college network or database
[F(1,222)=5.329, p=.022].
Appendix E Table 81: Summary of materials used by teachers in delivery and teaching.Teachers’ perceptions about potential barriers and factors that could adversely affect the integration of Technology into teaching practice:
Introduction
Results of a number of one-way between subjects’ ANOVA conducted to compare the effect
of Location, Age, Gender, Subject Area and Teaching Experience on teacher perceptions
about the potential adverse effect on the integration of ICT into their teaching practice using
18 identified barriers from previous research.
Integration of ICT is adversely affected by insufficient number of computers:
A one-way between subjects’ ANOVA was conducted to compare means exploring whether
there is a statistically significant difference in the mean values of the number of respondents
who considered insufficient numbers of computers having an adverse effect on the integration
of ICT into their teaching practice by Location, Age, Gender, Subject Area and Teaching
Experience. The results are detailed in table 38 below.
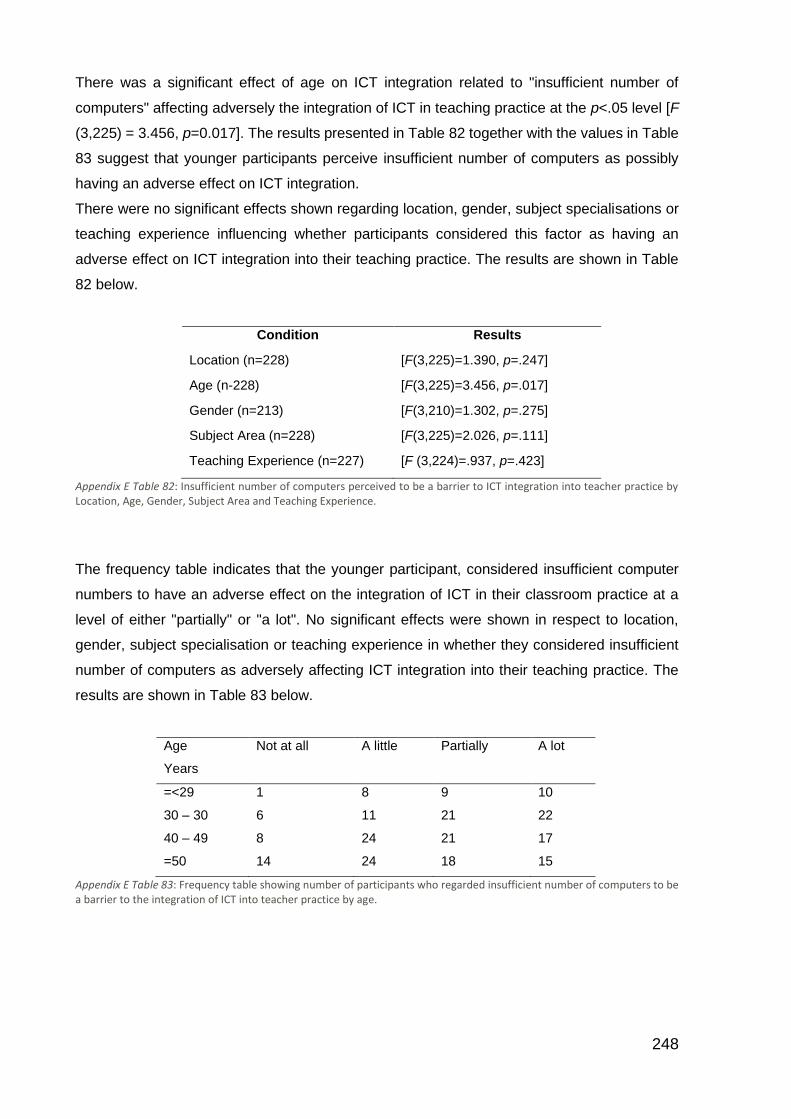
248
There was a significant effect of age on ICT integration related to "insufficient number of
computers" affecting adversely the integration of ICT in teaching practice at the p<.05 level [F
(3,225) = 3.456, p=0.017]. The results presented in Table 82 together with the values in Table
83 suggest that younger participants perceive insufficient number of computers as possibly
having an adverse effect on ICT integration.
There were no significant effects shown regarding location, gender, subject specialisations or
teaching experience influencing whether participants considered this factor as having an
adverse effect on ICT integration into their teaching practice. The results are shown in Table
82 below.
Condition Results
Location (n=228) [F(3,225)=1.390, p=.247]
Age (n-228) [F(3,225)=3.456, p=.017]
Gender (n=213) [F(3,210)=1.302, p=.275]
Subject Area (n=228) [F(3,225)=2.026, p=.111]
Teaching Experience (n=227) [F (3,224)=.937, p=.423]
Appendix E Table 82: Insufficient number of computers perceived to be a barrier to ICT integration into teacher practice by Location, Age, Gender, Subject Area and Teaching Experience.
The frequency table indicates that the younger participant, considered insufficient computer
numbers to have an adverse effect on the integration of ICT in their classroom practice at a
level of either "partially" or "a lot". No significant effects were shown in respect to location,
gender, subject specialisation or teaching experience in whether they considered insufficient
number of computers as adversely affecting ICT integration into their teaching practice. The
results are shown in Table 83 below.
Age
Years
Not at all A little Partially A lot
=<29 1 8 9 10
30 – 30 6 11 21 22
40 – 49 8 24 21 17
=50 14 24 18 15
Appendix E Table 83: Frequency table showing number of participants who regarded insufficient number of computers to be a barrier to the integration of ICT into teacher practice by age.

249
Integration of ICT is adversely affected by insufficient bandwidth:
A one-way between subjects’ ANOVA was conducted to compare means exploring whether
there is a statistically significant difference in the mean values of the number of respondents
who considered "insufficient bandwidth" and speed having an adverse effect on the integration
of ICT into their teaching practice by Location, Age, Gender, Subject Area and Teaching
Experience.
There was a significant effect of subject areas shown at the p=<.05 level [F(3,225)=4.023,
p=.008] on insufficient bandwidth affecting the integration of ICT into teaching practice.
The results presented in Table 84 together with the values in Table 85 suggest that in the
Yorkshire region and in the subject areas of Academic and Vocational Specific participants
perceive insufficient bandwidth as possibly having an adverse effect on ICT integration. No
significant effects in respect to age, gender or teaching experience in whether they regarded
insufficient bandwidth as adversely affecting ICT integration into their teaching practice. The
results are shown in Table 84 below.
Condition Results
Location (n=228) [F(3,225)=3.579, p=.015]
Age (n-228) [F(3,225)=2.453, p=.064]
Gender (n=213) [F(3,210)=.504, p=.680]
Subject Area (n=228) [F(3,225)=4.023, p=.008]
Teaching Experience (n=227) [F(3,224)=.312, p=.817]
Appendix E Table 84: Insufficient bandwidth is perceived to be a barrier to ICT integration into teacher practice by Location, Age, Gender, Subject Area and Teaching Experience.

250
The frequency table indicates that participants in the subject areas of Academic and Vocational
Specific subjects considered insufficient bandwidth a greater barrier to the integration of ICT
into classroom practice, reporting higher levels of either "partially" or "a lot", than other
participants. No significant effects regarding location, gender or teaching experience. The
results are shown in Table 85 below.
Subject Area Not at all A little Partially A lot
Academic 7 13 21 19
Engineering 6 9 6 10
Vocational Specific 9 16 23 24
Higher Ed. 4 6 2 3
Vocational Related 2 4 4 2
Computing & Design 7 9 7 3
Appendix E Table 85: Frequency table showing number of participants who perceived insufficient bandwidth to be a barrier to the integration of ICT into teacher practice by subject area.
Integration of ICT is adversely affected by insufficient number of portable devices:
A one-way between subjects’ ANOVA was conducted to compare means exploring whether
there is a statistically significant difference in the mean values of the number of respondents
who perceived "insufficient number of portable devices" having adverse effect on the
integration of ICT into their teaching practice by Location, Age, Gender, Subject Area and
Teaching Experience.
There was a significant effect of age indicated at the p=<.05 level [F(3,223)=2.979, p=.034]
and subject areas shown at the p=<.05 level [F(3,223)=3.003, p=.031] on "insufficient number
of portable devices affecting the integration of ICT into teaching practice.

251
The results presented in Table 86 together with the values in Table 87 and Table 88 suggest
in the subject areas of Academic and Vocational Specific, younger participants perceive
insufficient number of portable devices as possibly having an adverse effect on ICT integration.
No significant effects regarding teaching experience concerning insufficient number of portable
devices as adversely affecting ICT integration into their teaching practice. The results are
shown in Table 86 below.
Condition Results
Location (n=226) [F(3,223)=2.869, p=.037]
Age (n-226) [F(3,223)=2.979, p=.034]
Gender (n=212) [F(3,209)=3.114, p=.027]
Subject Area (n=226) [F(3,223)=3.003, p=.031]
Teaching Experience (n=225) [F(3,222)=2.158, p=.094]
Appendix E Table 86: Insufficient number of portable devices is perceived to be a barrier to ICT integration into teacher practice by Location, Age, Gender, Subject Area and Teaching Experience
The frequency table indicates that participants in the age range 30 - 39 years considered
insufficient portable devices as possibly having an adverse effect on the integration of ICT into
their teaching practice reporting a level of either "partially" or "a lot". The results are shown in
Table 87 below.
Age
Years
Not at all A little Partially A lot
=<29 3 6 10 9
30 – 39 9 9 27 15
40 – 49 15 20 19 14
=>50 19 19 20 13
Appendix E Table 87: Frequency table showing number of participants who regarded insufficient number of portable devices to be a barrier to the integration of ICT into teacher practice by age.

252
The frequency table indicates that participants in the subject areas of Vocational Specific
subjects considered insufficient number of portable devices a greater barrier to the integration
of ICT into classroom practice, reporting higher levels of either "partially" or "a lot", than other
participants. No significant effects in respect of teaching experience perceived that insufficient
number of portable devices adversely affecting ICT integration into their teaching practice. The
results are shown in Table 88 below.
Subject Area Not at all A little Partially A lot
Academic 9 17 23 11
Engineering 8 7 8 8
Vocational Specific 8 15 28 21
Higher Ed. 1 4 6 4
Vocational Related 4 3 3 4
Computing & Design 12 4 6 3
Student Support 6 3 1 3
Appendix E Table 88: Frequency table showing number of participants who perceived insufficient number of portable devices to be a barrier to the integration of ICT into teacher practice by subject area.
Integration of ICT is adversely affected by the lack of pedagogical models.
A one-way between subjects’ ANOVA was conducted to compare means exploring whether
there is a statistically significant difference in the mean values of the number of respondents
who regarded lack of pedagogical models as having an adverse effect on the integration of
ICT into teaching practice by Location, Age, Gender, Subject Area and Teaching Experience.
There was a significant effect of age on ICT integration in regard to "lack of pedagogical
models" affecting the integration of ICT in teaching practice at the p<.05 level [F(3,223=4.101,
p=0.007]. The results presented in Table 89 together with the values in Table 90 suggest that
older participants perceive lack of pedagogical models to possibly having an adverse effect on
ICT integration.

253
No significant effects were shown in regard to a participant's location, gender or subject
specialisation in whether they regarded lack of pedagogical models as adversely affecting ICT
integration into their teaching practice. The results are shown in Table 89 below.
Condition Results
Location (n=226) [F(3,223)=.446, p=.720]
Age (n-226) [F(3,223)=4.101, p=.007]
Gender (n=211) [F(3,208)=1.445, p=.231]
Subject Area (n=226) [F(3,223)=.533, p=.660]
Teaching Experience (n=225) [F(3,222)=1.833, p=.142]
Appendix E Table 89: Lack of pedagogical models is perceived to be a barrier to ICT integration into teacher practice by Location, Age, Gender, Subject Area and Teaching Experience.
The frequency table indicates that the younger age group indicated that a "lack of pedagogical
models" was less of a barrier whereby the two oldest group reported “lack of pedagogical
models to be more of a barrier. Location, gender, subject area or teaching experience were
not shown to have a statistically significant influence on whether lack of pedagogical models
was regarded as having an adverse effect on their teaching practice. The results are shown in
Table 90 below.
Appendix E Table 90: Frequency table showing number of participants who regarded lack of pedagogical models to be a barrier to the integration of ICT into teacher practice by age.
Integration of ICT is adversely affected by pressure to prepare students for assessments.
A one-way between subjects’ ANOVA was conducted to compare means exploring whether
there is a statistically significant difference in the mean values of the number of respondents
who regarded "pressure to prepare students for assessments" as having an adverse effect on
the integration of ICT into teaching practice by Location, Age, Gender, Subject Area and
Teaching Experience.
There was a significant effect of subject area on ICT integration in regard to "pressure to
prepare students for assessments" affecting the integration of ICT in teaching practice at the
Age
Years
Not at all A little Partially A lot
=<29 15 11 1 1
30 – 30 21 26 8 3
40 – 49 28 26 12 4
=50 22 22 19 8
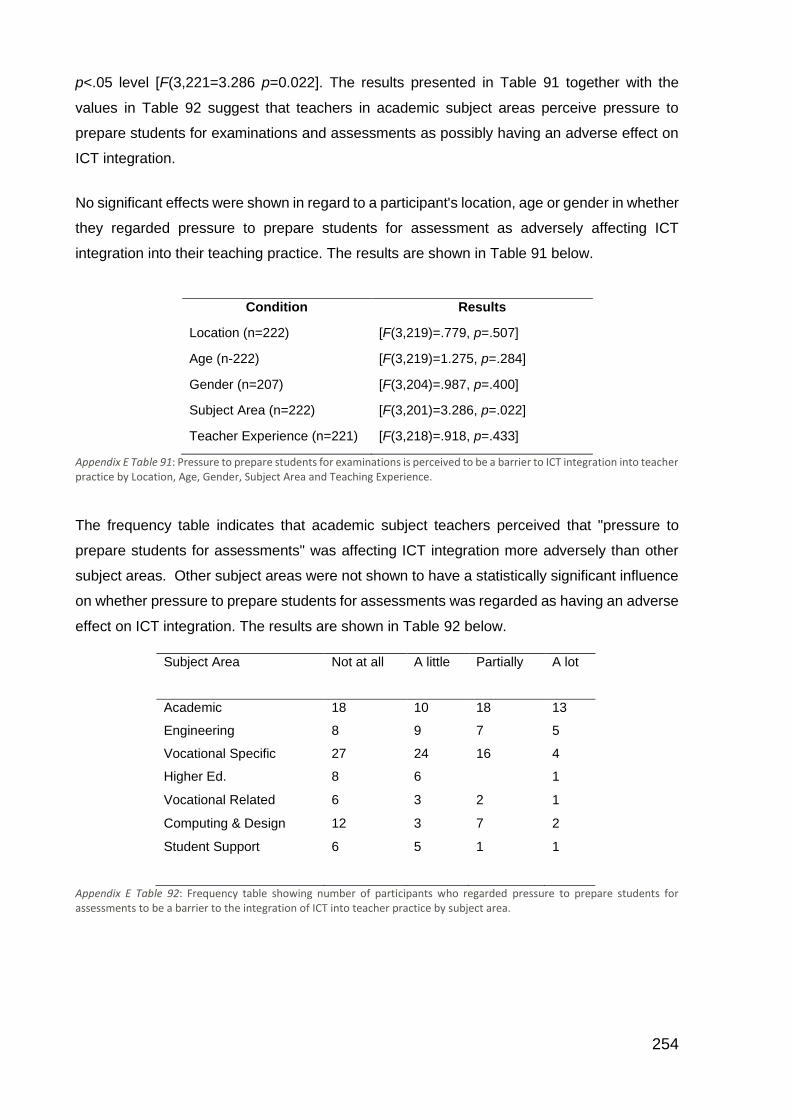
254
p<.05 level [F(3,221=3.286 p=0.022]. The results presented in Table 91 together with the
values in Table 92 suggest that teachers in academic subject areas perceive pressure to
prepare students for examinations and assessments as possibly having an adverse effect on
ICT integration.
No significant effects were shown in regard to a participant's location, age or gender in whether
they regarded pressure to prepare students for assessment as adversely affecting ICT
integration into their teaching practice. The results are shown in Table 91 below.
Condition Results
Location (n=222) [F(3,219)=.779, p=.507]
Age (n-222) [F(3,219)=1.275, p=.284]
Gender (n=207) [F(3,204)=.987, p=.400]
Subject Area (n=222) [F(3,201)=3.286, p=.022]
Teacher Experience (n=221) [F(3,218)=.918, p=.433]
Appendix E Table 91: Pressure to prepare students for examinations is perceived to be a barrier to ICT integration into teacher practice by Location, Age, Gender, Subject Area and Teaching Experience.
The frequency table indicates that academic subject teachers perceived that "pressure to
prepare students for assessments" was affecting ICT integration more adversely than other
subject areas. Other subject areas were not shown to have a statistically significant influence
on whether pressure to prepare students for assessments was regarded as having an adverse
effect on ICT integration. The results are shown in Table 92 below.
Subject Area Not at all A little Partially A lot
Academic 18 10 18 13
Engineering 8 9 7 5
Vocational Specific 27 24 16 4
Higher Ed. 8 6 1
Vocational Related 6 3 2 1
Computing & Design 12 3 7 2
Student Support 6 5 1 1
Appendix E Table 92: Frequency table showing number of participants who regarded pressure to prepare students for assessments to be a barrier to the integration of ICT into teacher practice by subject area.

255
Summary table of statistical significance results regarding previously identified barriers
to ICT integration.
The summary table below (Table 93) displays the results of the one-way between subjects’
ANOVA tests conducted to compare means exploring whether there is a statistically significant
difference in the means values of Location, Age, Gender, Subject Area and Teaching
Experience for factors that have been identified from previous research as being barriers that
affect the integration of ICT into teaching practices. The results indicate that of the eleven
results showing statistical significance, three results showed the independent variable was
location, three results showed the independent variable as age, two was gender and three
were within subject areas with the independent variable producing the significant result.
Independent Variable showing statistical significance at the p=<.05 level
Condition Location Age Gender Subject Area Teaching Experience
Insufficient number of computers
[F(3,225)=3.456, p=.017]
Insufficient bandwidth
[F(3,225)=3.579, p=.015]
[F(3,225)=4.023, p=.008]
Insufficient number of Whiteboards
[F(3,223)=4.923, p=.002]
Insufficient portable devices
[F(3.223)=2.869, p=.037
[F (3, 223) = 2.979, p=0.034].
[F(3,209)=3.114, p=.027
[F (3,223) = 3.003, p=0.031].
Lack of adequate content
[F (3,206 = 3.477, p=0.017]
Lack of pedagogical models
[F (3,223 = 4.101, p=0.007]
Pressure to prepare students for examinations"
[F (3,221 = 3.286, p=0.022]
Appendix E Table 93: Summary of perceived barriers to integration of ICT into classroom practices.

256
Teacher participation in technology related Continued Professional Development (CPD)
courses:
Introduction
A number of one-way between subjects’ ANOVA were conducted to compare means to
exploring whether there is a statistically significant difference in the means values of Age,
Subject Area and Teaching Experience on the participation of teachers in ten identified
Continued Professional Development Courses, (CPD) related to the use and application of
Information Communication Technology, (ICT).
Participation in introductory ICT course.
A one-way between subjects’ ANOVA was conducted to compare means exploring whether
there is a statistically significant difference in the means values of Age, Subject Area and
Teaching Experience regarding participation in "introductory courses on internet use and
general applications such as word processing, spreadsheets, presentations etc."
There was a significant effect of age shown at the p<.05 level [F(1,227)= 24.473, p=<.001],
subject area shown at the p<.05 level [F(1,227)= 4.577, p=.033] and teaching experience
shown at the p<.05 level [F(1,226)=8.489, p=.004] on participation in “Introductory courses on
computer and internet use with general applications such as word processing, spreadsheets,
presentations etc.” .
The results presented in Table 94 together with the values in Table 95 and Table 96 suggest
that younger and the less experienced the participants the less likely they were to take part in
introductory level courses than were older participants. The results are shown in Table 94
below.
Condition Results
Location (n=228) [F(1,227)=.599, p=.440]
Age (n-228) [F(1,227)=24.473, p=<.001]
Gender (n=213) [F(1,212)=.705, p=.402]
Subject Area (n=228) [F(1,227)=4.577, p=.033]
Teaching Experience (n=228) [F(1,226)=8.489, p=.004]
Appendix E Table 94: Participation in CPD courses in Introduction to computers and internet by Location, Age, Gender, Subject Area and Teaching Experience.
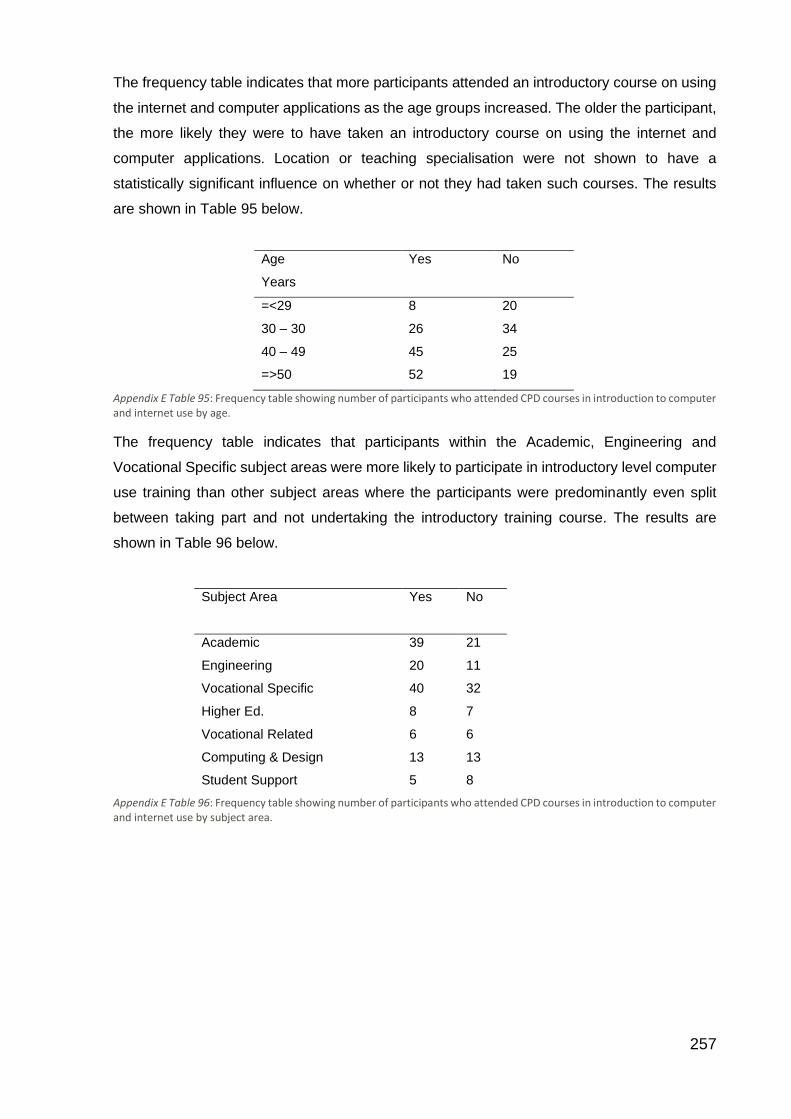
257
The frequency table indicates that more participants attended an introductory course on using
the internet and computer applications as the age groups increased. The older the participant,
the more likely they were to have taken an introductory course on using the internet and
computer applications. Location or teaching specialisation were not shown to have a
statistically significant influence on whether or not they had taken such courses. The results
are shown in Table 95 below.
Age
Years
Yes No
=<29 8 20
30 – 30 26 34
40 – 49 45 25
=>50 52 19
Appendix E Table 95: Frequency table showing number of participants who attended CPD courses in introduction to computer and internet use by age.
The frequency table indicates that participants within the Academic, Engineering and
Vocational Specific subject areas were more likely to participate in introductory level computer
use training than other subject areas where the participants were predominantly even split
between taking part and not undertaking the introductory training course. The results are
shown in Table 96 below.
Subject Area Yes No
Academic 39 21
Engineering 20 11
Vocational Specific 40 32
Higher Ed. 8 7
Vocational Related 6 6
Computing & Design 13 13
Student Support 5 8
Appendix E Table 96: Frequency table showing number of participants who attended CPD courses in introduction to computer and internet use by subject area.

258
The frequency table indicates that participants with 3 years or less experience were equally
likely to participate in introductory training courses in computer and internet use than they were
to not participate. Teachers with mid-range experience of between 4 – 10 years were more
likely to not participate in this type of course, participants with 11 or more years of experience
were more likely to attend the introductory courses. The results are shown in Table 97 below.
Teaching Experience
Years
Yes No
=<1 5 5
1 - 3 17 16
4 – 10 40 48
11 – 20 47 23
=>21 21 6
Appendix E Table 97: Frequency table showing number of participants who attended CPD courses in introduction to computer and internet use by teaching experience.
Participation in equipment specific courses:
A one-way between subjects’ ANOVA was conducted to compare means exploring whether
there is a statistically significant difference in the means values of Location, Age, Gender,
Subject Area and Teaching Experience regarding participation on "equipment specific training
courses".
There was a significant effect of teaching experience shown at the p=<.05 level [F(1,224)
=19.264, p=<.001] on participation in “equipment specific training courses”.

259
The results presented in table 98 together with the values in table 99 suggest the years of
teaching experience of the participant may in some way influence how likely they are to
undertake training courses in the use of specific digital technology. No significant effects shown
in regard to age, gender or subject specialisation influencing whether participants had taken
such courses. The results are shown in Table 98 below.
Condition Results
Location (n=226) [F(1,225)=18.432, p=<.001]
Age (n-226) [F(1,225)=1.771, p=.185]
Gender (n=211) [F(1,210)=.584, p=.446]
Subject Area (n=226) [F(1,225)=1.678, p=.197]
Teaching Experience (n=225) [F(1,224) =19.264, p=<.001]
Appendix E Table 98: Participation in CPD courses in equipment specific use by Location, Age, Gender, Subject Area and Teaching Experience.
The frequency table indicates that participants with 3 years of teaching experience or less were
more likely to not participate in equipment specific training courses. Participants with 4 years
or more teaching experience were more likely to participate than not participate in equipment
specific training courses. Age, gender or teaching specialisation were not shown to have a
statistically significant influence on whether or not they had taken such courses. The results
are shown in Table 99 below.
Teaching Experience
Years
Yes No
=<1 2 8
1 - 3 17 16
4 – 10 47 39
11 – 20 59 11
=>21 19 8
Appendix E Table 99: Frequency table showing number of participants who attended CPD courses in equipment specific training by teaching experience.
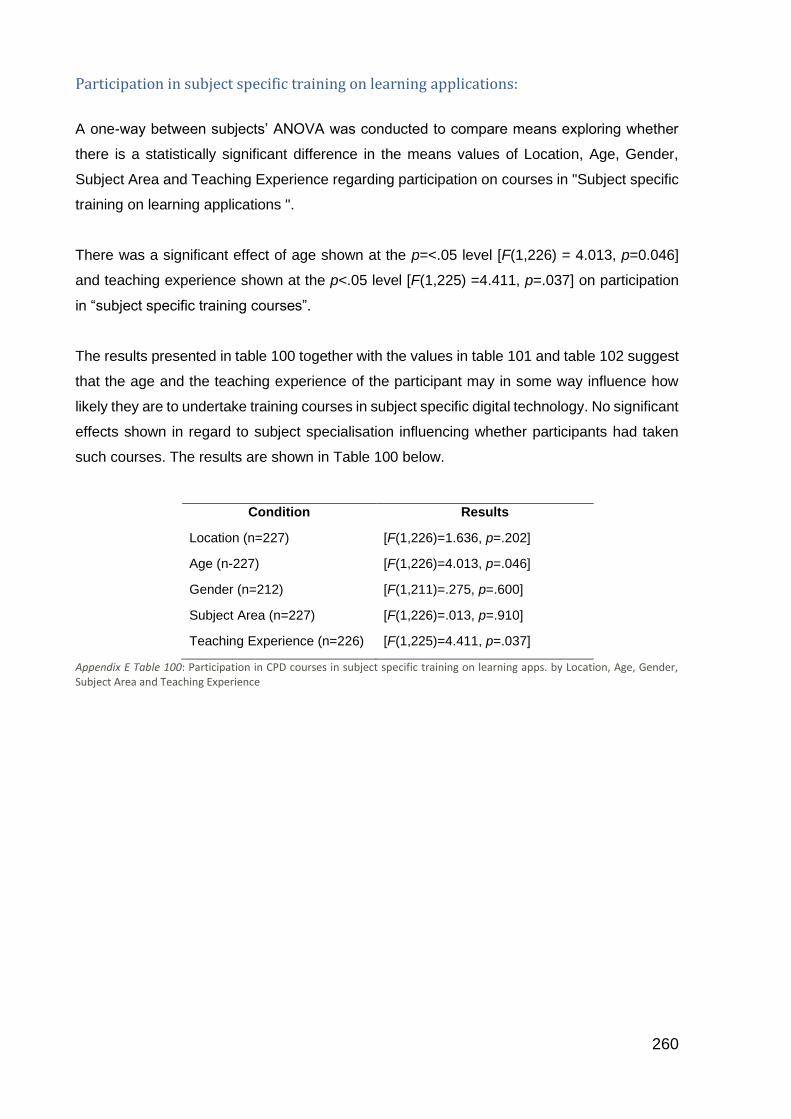
260
Participation in subject specific training on learning applications:
A one-way between subjects’ ANOVA was conducted to compare means exploring whether
there is a statistically significant difference in the means values of Location, Age, Gender,
Subject Area and Teaching Experience regarding participation on courses in "Subject specific
training on learning applications ".
There was a significant effect of age shown at the p=<.05 level [F(1,226) = 4.013, p=0.046]
and teaching experience shown at the p<.05 level [F(1,225) =4.411, p=.037] on participation
in “subject specific training courses”.
The results presented in table 100 together with the values in table 101 and table 102 suggest
that the age and the teaching experience of the participant may in some way influence how
likely they are to undertake training courses in subject specific digital technology. No significant
effects shown in regard to subject specialisation influencing whether participants had taken
such courses. The results are shown in Table 100 below.
Condition Results
Location (n=227) [F(1,226)=1.636, p=.202]
Age (n-227) [F(1,226)=4.013, p=.046]
Gender (n=212) [F(1,211)=.275, p=.600]
Subject Area (n=227) [F(1,226)=.013, p=.910]
Teaching Experience (n=226) [F(1,225)=4.411, p=.037]
Appendix E Table 100: Participation in CPD courses in subject specific training on learning apps. by Location, Age, Gender, Subject Area and Teaching Experience

261
The frequency table indicates that participants age 29 or younger were more likely to not attend
subject specific ICT training courses. Participants from the 30 – 39 years age group were
almost equally split between participation and non-participation, while participants aged 40
years and over were more likely to attend subject specific courses using ICT. Location, gender
or teaching specialisation were not shown to have a statistically significant influence on
whether or not they had taken such courses. The results are shown in Table 101 below.
Age
Years
Yes No
=<29 11 17
30 – 39 30 29
40 – 49 47 23
=>50 42 29
Appendix E Table 101: Frequency table showing number of participants who attended CPD courses on subject specific training by age.
The frequency table indicates that participants with 10 years teaching experience or less were
almost equally split between participation and non-participation in subject specific using ICT
training courses. Participants with 11 years or more of teaching experience were more likely
to participate than not participate in subject specific training courses using ICT. The results are
shown in Table 102 below.
Teaching Experience
Years
Yes No
=<1 4 6
1 - 3 17 16
4 – 10 44 43
11 – 20 47 23
Appendix E Table 102: Frequency table showing number of participants who attended CPD courses on subject specific training by teaching experience.
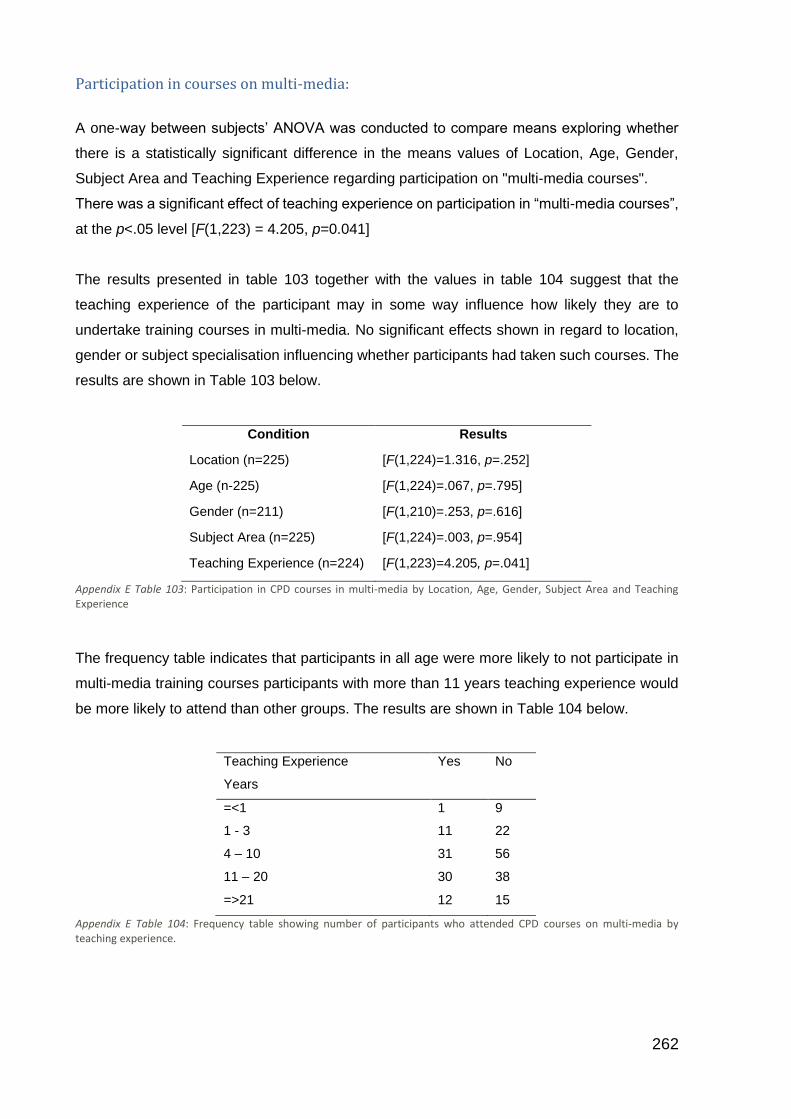
262
Participation in courses on multi-media:
A one-way between subjects’ ANOVA was conducted to compare means exploring whether
there is a statistically significant difference in the means values of Location, Age, Gender,
Subject Area and Teaching Experience regarding participation on "multi-media courses".
There was a significant effect of teaching experience on participation in “multi-media courses”,
at the p<.05 level [F(1,223) = 4.205, p=0.041]
The results presented in table 103 together with the values in table 104 suggest that the
teaching experience of the participant may in some way influence how likely they are to
undertake training courses in multi-media. No significant effects shown in regard to location,
gender or subject specialisation influencing whether participants had taken such courses. The
results are shown in Table 103 below.
Condition Results
Location (n=225) [F(1,224)=1.316, p=.252]
Age (n-225) [F(1,224)=.067, p=.795]
Gender (n=211) [F(1,210)=.253, p=.616]
Subject Area (n=225) [F(1,224)=.003, p=.954]
Teaching Experience (n=224) [F(1,223)=4.205, p=.041]
Appendix E Table 103: Participation in CPD courses in multi-media by Location, Age, Gender, Subject Area and Teaching Experience
The frequency table indicates that participants in all age were more likely to not participate in
multi-media training courses participants with more than 11 years teaching experience would
be more likely to attend than other groups. The results are shown in Table 104 below.
Teaching Experience
Years
Yes No
=<1 1 9
1 - 3 11 22
4 – 10 31 56
11 – 20 30 38
=>21 12 15
Appendix E Table 104: Frequency table showing number of participants who attended CPD courses on multi-media by teaching experience.
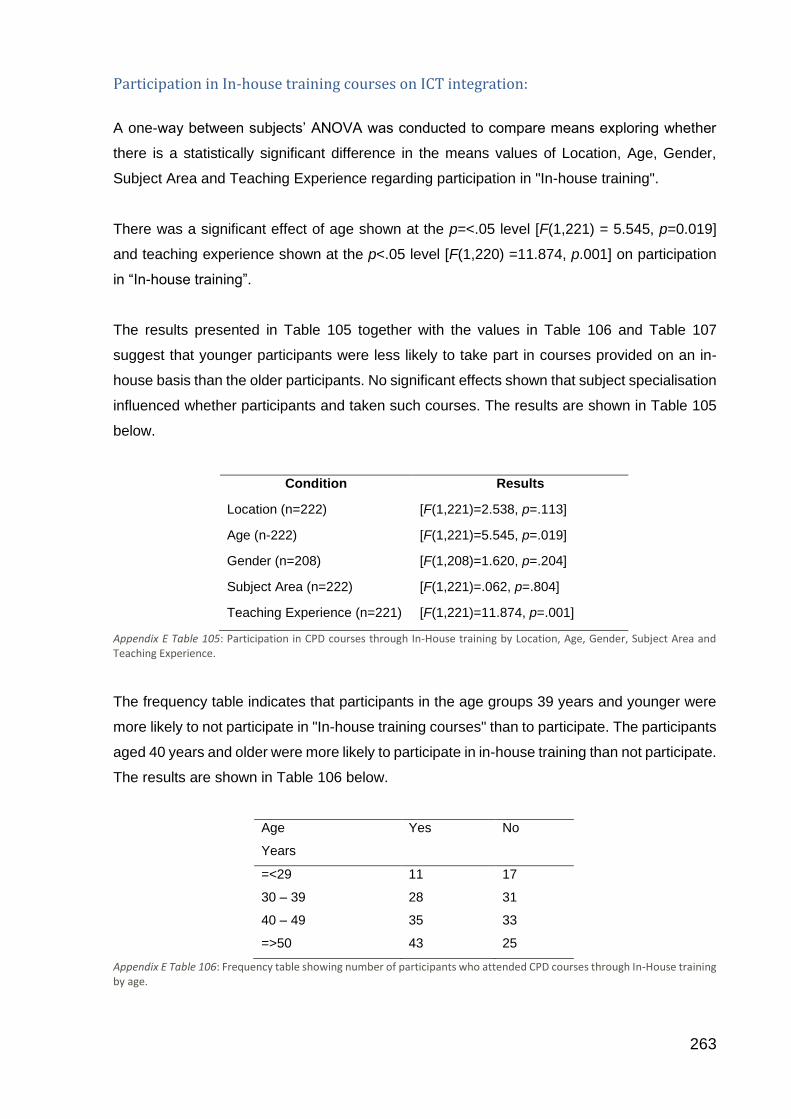
263
Participation in In-house training courses on ICT integration:
A one-way between subjects’ ANOVA was conducted to compare means exploring whether
there is a statistically significant difference in the means values of Location, Age, Gender,
Subject Area and Teaching Experience regarding participation in "In-house training".
There was a significant effect of age shown at the p=<.05 level [F(1,221) = 5.545, p=0.019]
and teaching experience shown at the p<.05 level [F(1,220) =11.874, p.001] on participation
in “In-house training”.
The results presented in Table 105 together with the values in Table 106 and Table 107
suggest that younger participants were less likely to take part in courses provided on an in-
house basis than the older participants. No significant effects shown that subject specialisation
influenced whether participants and taken such courses. The results are shown in Table 105
below.
Condition Results
Location (n=222) [F(1,221)=2.538, p=.113]
Age (n-222) [F(1,221)=5.545, p=.019]
Gender (n=208) [F(1,208)=1.620, p=.204]
Subject Area (n=222) [F(1,221)=.062, p=.804]
Teaching Experience (n=221) [F(1,221)=11.874, p=.001]
Appendix E Table 105: Participation in CPD courses through In-House training by Location, Age, Gender, Subject Area and Teaching Experience.
The frequency table indicates that participants in the age groups 39 years and younger were
more likely to not participate in "In-house training courses" than to participate. The participants
aged 40 years and older were more likely to participate in in-house training than not participate.
The results are shown in Table 106 below.
Age
Years
Yes No
=<29 11 17
30 – 39 28 31
40 – 49 35 33
=>50 43 25
Appendix E Table 106: Frequency table showing number of participants who attended CPD courses through In-House training by age.

264
The frequency table indicates that participants with 3 years teaching experience are more likely
to not participate in in-house training courses, participants with between 4 – 10 years teaching
experience are equally split between participation and non-participation. Participants with 11
years or more a more likely to participate in in-house training courses, a participant’s gender,
location or teaching specialisation were not shown to have a statistically significant influence
on whether or not they had taken such courses. The results are shown in Table 107 below.
Teaching Experience
Years
Yes No
=<1 4 6
1 - 3 10 23
4 – 10 43 43
11 – 20 42 25
=>21 18 8
Appendix E Table 107: Frequency table showing number of participants who attended CPD courses through In-House training by teaching experience.
Participation in externally provided ICT CPD courses:
A one-way between subjects’ ANOVA was conducted to compare means exploring whether
there is a statistically significant difference in the means values of Location, Age, Gender,
Subject Area and Teaching Experience regarding participation in "CPD training provided from
sources other than in-house training".
There was a significant effect of age shown at the p=<.05 level [F(1,224) = 7.734, p=0.006]
and teaching experience shown at the p<.05 level [F(1,223) =16.336, p=<.001] on participation
in “CPD training provided from sources other than in-house training”.

265
The results presented in Table 108 together with the values in Table 109 and Table 110
suggest that older participants were more likely to take part in CPD training provided from a
source other than in-house training. No significant effects shown in regard to subject
specialisations influencing whether participants had taken such courses. The results are
shown in Table 108 below.
Condition Results
Location (n=225) [F(1,224)=1.103, p=.293]
Age (n-225) [F(1,224)=7.734, p=.006]
Gender (n=210) [F(1,209)=1.484, p=.225]
Subject Area (n=225) [F(1,224)=.411, p=.522]
Teaching Experience (n=224) [F(1,223)=16.336, p=<.001]
Appendix E Table 108: Participation in CPD courses provided from sources other than though In-House training by Location, Age, Gender, Subject Area and Teaching Experience.
The frequency table indicates that participants in all age groups are more likely to take part in
training courses provided from sources other than in-house, the 50 years and over age group
are much more likely to participate than not participate in "CPD training provided from sources
other than In-house training courses". Location, gender or teaching specialisation were not
shown to have a statistically significant influence on whether or not they had taken such
courses. The results are shown in Table 109 below.
Age
Years
Yes No
=<29 15 12
30 – 30 31 28
40 – 49 37 33
=>50 55 15
Appendix E Table 109: Frequency table showing number of participants who attended CPD courses provided from sources other than through In-House training by age.

266
The frequency table indicates that participants with less than 3 years of experience are more
likely not to attend CPD courses provided from sources other than through In-House training
while participants with 4 or more years teaching experience are more likely to attend these
training courses. Gender, location or teaching specialisation were not shown to have a
statistically significant influence on whether or not they had taken such courses. The results
are shown in Table 110 below.
Teaching Experience
Years
Yes No
=<1 5 5
1 - 3 15 18
4 – 10 46 40
11 – 20 48 22
=>21 24 2
Appendix E Table 110: Frequency table showing number of participants who attended CPD courses provided from sources other than through In-House training by teaching experience.
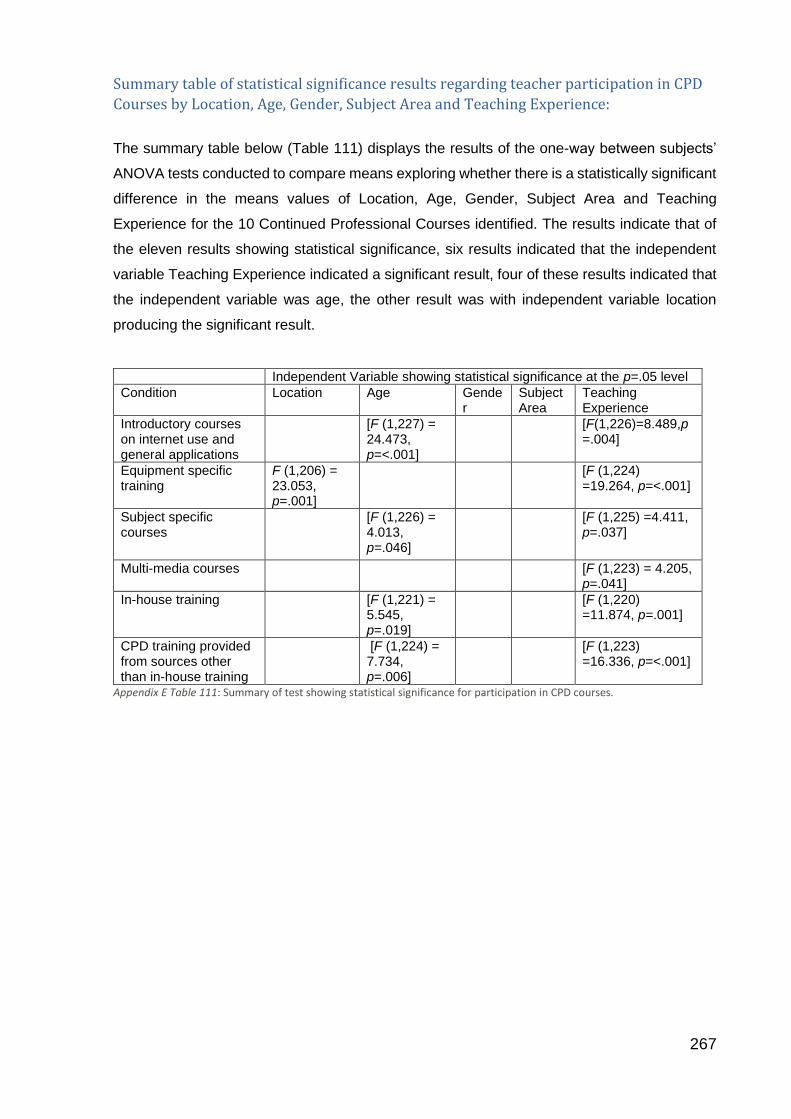
267
Summary table of statistical significance results regarding teacher participation in CPD
Courses by Location, Age, Gender, Subject Area and Teaching Experience:
The summary table below (Table 111) displays the results of the one-way between subjects’
ANOVA tests conducted to compare means exploring whether there is a statistically significant
difference in the means values of Location, Age, Gender, Subject Area and Teaching
Experience for the 10 Continued Professional Courses identified. The results indicate that of
the eleven results showing statistical significance, six results indicated that the independent
variable Teaching Experience indicated a significant result, four of these results indicated that
the independent variable was age, the other result was with independent variable location
producing the significant result.
Independent Variable showing statistical significance at the p=.05 level
Condition Location Age Gender
Subject Area
Teaching Experience
Introductory courses on internet use and general applications
[F (1,227) = 24.473, p=<.001]
[F(1,226)=8.489,p=.004]
Equipment specific training
F (1,206) = 23.053, p=.001]
[F (1,224) =19.264, p=<.001]
Subject specific courses
[F (1,226) = 4.013, p=.046]
[F (1,225) =4.411, p=.037]
Multi-media courses [F (1,223) = 4.205, p=.041]
In-house training [F (1,221) = 5.545, p=.019]
[F (1,220) =11.874, p=.001]
CPD training provided from sources other than in-house training
[F (1,224) = 7.734, p=.006]
[F (1,223) =16.336, p=<.001]
Appendix E Table 111: Summary of test showing statistical significance for participation in CPD courses.

268
Tables of results showing no statistical significance and therefore not included in results
chapter
Teacher self-efficacy in general tasks incorporating technology.
Introduction.
A number of one-way between subjects’ ANOVA was conducted to compare means to
exploring whether there is a statistically significant difference in the means values of Location,
Age, Gender, Subject Area and Teaching Experience on investigate teacher self-efficacy in a
number of general tasks incorporating ICT
Confidence using a word processing programme.
A one-way between subjects’ ANOVA was conducted to compare means exploring whether
there is a statistically significant difference in the means values of the number of respondents
"confident in using a word processing programme" by Location, Age, Gender, Subject Area
and Teaching Experiences.
No statistically significant values were returned for any conditions (see table 112).
Condition Results
Location (n=226) [F(3,223)=1.278, p=.283]
Age (n-226) [F(3,223)=.653, p=.582]
Gender (n=211) [F(3,208)=.684, p=.563]
Subject Area (n=226) [F(3,223)=.235, p=.872]
Teaching Experience (n=225) [F(3,223)=.910, p=.437]
Appendix E Table 112: Teacher self-efficacy in use of word processing programme by Location, Age, Gender, Subject Area and Teaching Experience.

269
Confidence using email.
A one-way between subjects’ ANOVA was conducted to compare means exploring whether
there is a statistically significant difference in the means values of the number of respondents
"confident using email" by Location, Age, Gender, Subject Area and Teaching Experiences.
No statistically significant values were returned for any conditions (see table 113).
Condition Results
Location (n=227) [F(3,224)=.172, p=.915]
Age (n-227) [F(3,224)=.024, p=.995]
Gender (n=212) [F(3,209)=1.348, p=.260]
Subject Area (n=227) [F(3,224)=1.854, p=.138]
Teaching Experience (n=226) [F(3,223)=.469, p=.704]
Appendix E Table 113: Teacher self-efficacy in using email by Location, Age, Gender, Subject Area and Teaching Experience.
Confident capturing and editing digital photos and images.
A one-way between subjects’ ANOVA was conducted to compare means exploring whether
there is a statistically significant difference in the means values of the number of respondents
"confident in capturing and editing digital photos and images" by Location, Age, Gender,
Subject Area and Teaching Experiences.
No statistically significant values were returned for any conditions (see table 114).
Condition Results
Location (n=227) [F(3,224)=1.511, p=.213]
Age (n-227) [F(3,224)=1.542, p=.205]
Gender (n=212) [F(3,209)=2.528, p=.058]
Subject Area (n=227) [F(3,224)=1.430 p=.235]
Teaching Experience (n=226) [F(3,223)=.858, p=.464]
Appendix E Table 114: Teacher self-efficacy in capturing and editing digital photos and images by Location, Age, Gender, Subject Area and Teaching Experience.

270
Confidence editing text online containing hyperlinks and images.
A one-way between subjects’ ANOVA was conducted to compare means exploring whether
there is a statistically significant difference in the means values of the number of respondents
"confident editing text online containing hyperlinks and images" by Location, Age, Gender,
Subject Area and Teaching Experiences.
No statistically significant values were returned for any conditions (see table 115).
Condition Results
Location (n=226) [F(3,223)=1.240, p=.296]
Age (n-226) [F(3,223)=1.247, p=.294]
Gender (n=211) [F(3,208)=.691, p=.558]
Subject Area (n=226) [F(3,223)=1.127, p=.339]
Appendix E Table 115: Teacher self-efficacy in editing text online containing hyperlinks and images by Location, Age, Gender, Subject Area and Teaching Experience.
Confidence in organising computer files and folders.
A one-way between subjects’ ANOVA was conducted to compare means exploring whether
there is a statistically significant difference in the means values of the number of respondents
confident in organising computer files and folders" by Location, Age, Gender, Subject Area
and Teaching Experiences.
No statistically significant values were returned for any conditions (see table 116).
Condition Results
Location (n=226) [F(2,224)=.221, p=.802]
Age (n-226) [F(2,224)=2.911, p=.056]
Gender (n=211) [F(2,209)=.468, p=.627]
Subject Area (n=226) [F(2,224)=.586, p=.558]
Appendix E Table 116: Teacher self-efficacy in organising computer files and folders by Location, Age, Gender, Subject Area and Teaching Experience.

271
Confidence in using a spreadsheet.
A one-way between subjects’ ANOVA was conducted to compare means exploring whether
there is a statistically significant difference in the means values of the number of respondents
"confident in using a spreadsheet programme" by Location, Age, Gender, Subject Area and
Teaching Experiences.
No statistically significant values were returned for any conditions (see table 117).
Condition Results
Location (n=227) [F(3,224)=1.354, p=.258]
Age (n-227) [F(3,224)=2.072, p=.105]
Gender (n=212) [F(3,209)=1.341, p=.262]
Subject Area (n=227) [F(3,224)=1.061, p=.366]
Teaching Experience (n=226) [F(3,223)=.211, p=.889]
Appendix E Table 117: Teacher self-efficacy in using a spreadsheet programme by Location, Age, Gender, Subject Area and Teaching Experience.
Confidence using a spreadsheet to plot a graph.
A one-way between subjects’ ANOVA was conducted to compare means exploring whether
there is a statistically significant difference in the means values of the number of respondents
"confident using a spreadsheet to plot a graph" by Location, Age, Gender, Subject Area and
Teaching Experiences.
No statistically significant values were returned for any conditions (see table 118).
Condition Results
Location (n=225) [F(3,222)=.580, p=.629]
Age (n-225) [F(3,222)=1.111, p=.346]
Gender (n=210) [F(3,207)=1.954, p=.122]
Subject Area (n=225) [F(3,222)=1.531, p=.207]
Appendix E Table 118: Teacher self-efficacy in using a spreadsheet to plot a graph by Location, Age, Gender, Subject Area and Teaching Experience.
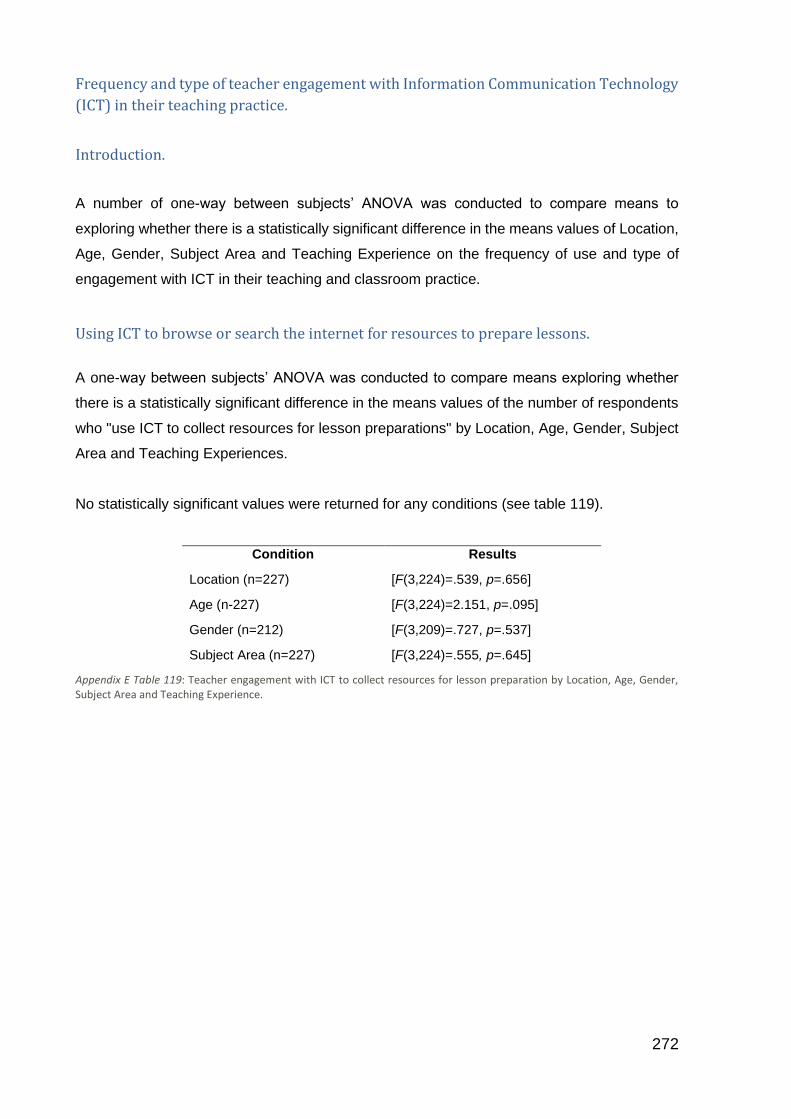
272
Frequency and type of teacher engagement with Information Communication Technology
(ICT) in their teaching practice.
Introduction.
A number of one-way between subjects’ ANOVA was conducted to compare means to
exploring whether there is a statistically significant difference in the means values of Location,
Age, Gender, Subject Area and Teaching Experience on the frequency of use and type of
engagement with ICT in their teaching and classroom practice.
Using ICT to browse or search the internet for resources to prepare lessons.
A one-way between subjects’ ANOVA was conducted to compare means exploring whether
there is a statistically significant difference in the means values of the number of respondents
who "use ICT to collect resources for lesson preparations" by Location, Age, Gender, Subject
Area and Teaching Experiences.
No statistically significant values were returned for any conditions (see table 119).
Condition Results
Location (n=227) [F(3,224)=.539, p=.656]
Age (n-227) [F(3,224)=2.151, p=.095]
Gender (n=212) [F(3,209)=.727, p=.537]
Subject Area (n=227) [F(3,224)=.555, p=.645]
Appendix E Table 119: Teacher engagement with ICT to collect resources for lesson preparation by Location, Age, Gender, Subject Area and Teaching Experience.

273
Using ICT applications to prepare presentations.
A one-way between subjects’ ANOVA was conducted to compare means exploring whether
there is a statistically significant difference in the means values of the number of respondents
who engaged in "using applications to prepare presentations" by Location, Age, Gender,
Subject Area and Teaching Experiences.
No statistically significant values were returned for any conditions (see table 120).
25 Results
Location (n=225) [F(3,222)=.653, p=.582]
Age (n-225) [F(3,222)=.793, p=.499]
Gender (n=210) [F(3,207)=.147, p=932]
Subject Area (n=225) [F(3,222)=2.064, p=.103]
Teaching Experience (n=224) [F(3,221)=.058, p=.982]
Appendix E Table 120: Teacher engagement with ICT using apps to prepare presentations by Location, Age, Gender, Subject Area and Teaching Experience.
Using ICT to provide student feedback.
A one-way between subjects’ ANOVA was conducted to compare means exploring whether
there is a statistically significant difference in the means values of the number of respondents
"using ICT to provide student feedback" by Location, Age, Gender, Subject Area and Teaching
Experiences.
No statistically significant values were returned for any conditions (see table 121).
Condition Results
Location (n=228) [F(3,225)=.001, p=1.000]
Age (n-228) [F(3,225)=1.764, p=.155]
Gender (n=213) [F(3,210)=1.657, p=.177]
Subject Area (n=228) [F(3,225)=.903, p=.440]
Teaching Experience (n=227) [F(3,224)=.340, p=.796]
Appendix E Table 121: Teacher use of ICT to provide student feedback by Location, Age, Gender, Subject Area and Teaching Experience.
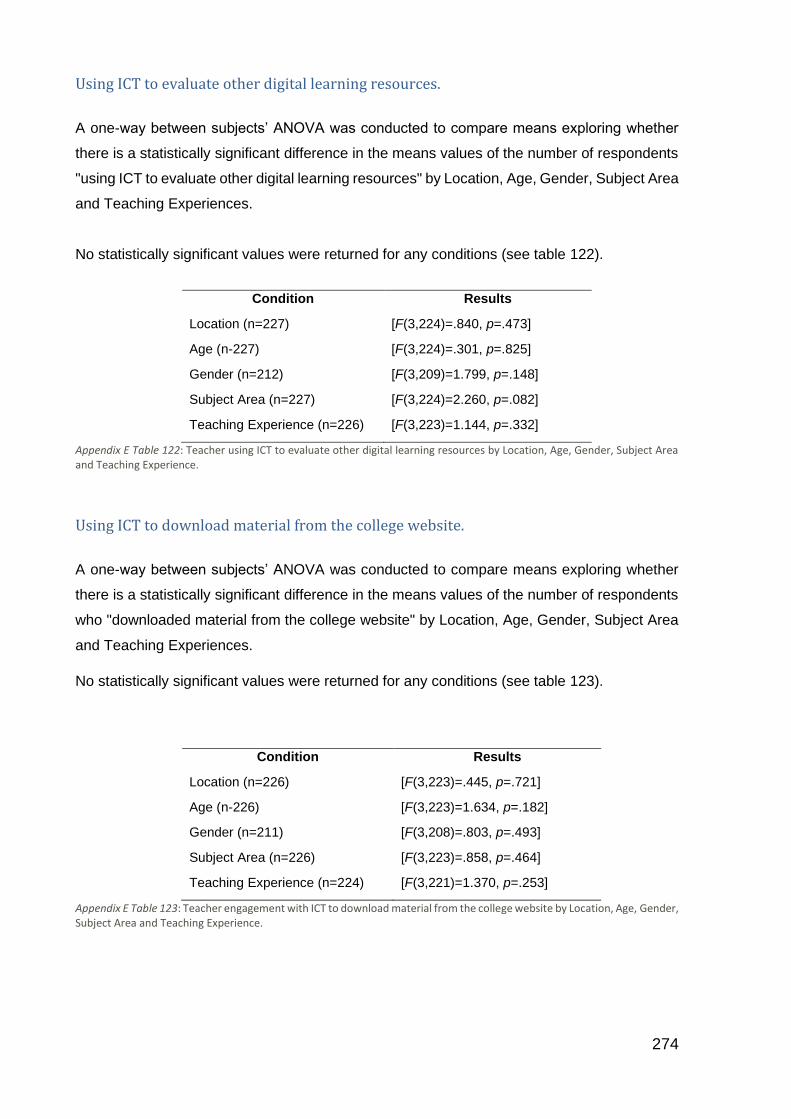
274
Using ICT to evaluate other digital learning resources.
A one-way between subjects’ ANOVA was conducted to compare means exploring whether
there is a statistically significant difference in the means values of the number of respondents
"using ICT to evaluate other digital learning resources" by Location, Age, Gender, Subject Area
and Teaching Experiences.
No statistically significant values were returned for any conditions (see table 122).
Condition Results
Location (n=227) [F(3,224)=.840, p=.473]
Age (n-227) [F(3,224)=.301, p=.825]
Gender (n=212) [F(3,209)=1.799, p=.148]
Subject Area (n=227) [F(3,224)=2.260, p=.082]
Teaching Experience (n=226) [F(3,223)=1.144, p=.332]
Appendix E Table 122: Teacher using ICT to evaluate other digital learning resources by Location, Age, Gender, Subject Area and Teaching Experience.
Using ICT to download material from the college website.
A one-way between subjects’ ANOVA was conducted to compare means exploring whether
there is a statistically significant difference in the means values of the number of respondents
who "downloaded material from the college website" by Location, Age, Gender, Subject Area
and Teaching Experiences.
No statistically significant values were returned for any conditions (see table 123).
Condition Results
Location (n=226) [F(3,223)=.445, p=.721]
Age (n-226) [F(3,223)=1.634, p=.182]
Gender (n=211) [F(3,208)=.803, p=.493]
Subject Area (n=226) [F(3,223)=.858, p=.464]
Teaching Experience (n=224) [F(3,221)=1.370, p=.253]
Appendix E Table 123: Teacher engagement with ICT to download material from the college website by Location, Age, Gender, Subject Area and Teaching Experience.
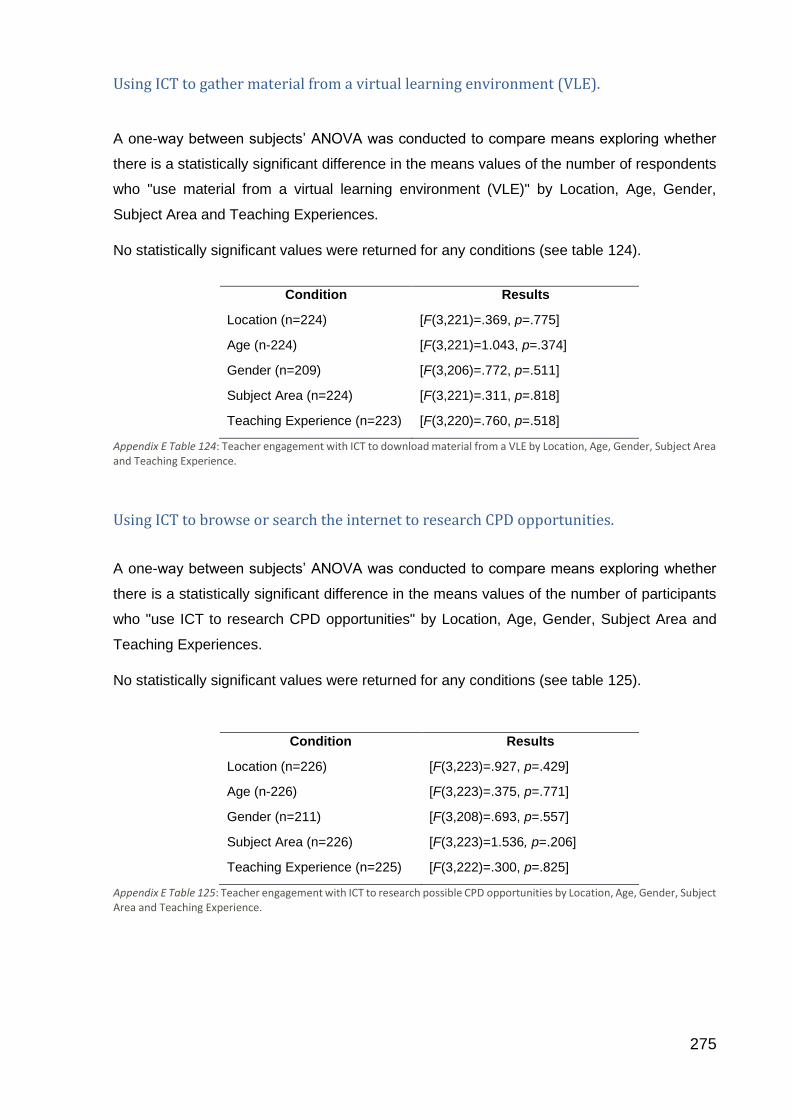
275
Using ICT to gather material from a virtual learning environment (VLE).
A one-way between subjects’ ANOVA was conducted to compare means exploring whether
there is a statistically significant difference in the means values of the number of respondents
who "use material from a virtual learning environment (VLE)" by Location, Age, Gender,
Subject Area and Teaching Experiences.
No statistically significant values were returned for any conditions (see table 124).
Condition Results
Location (n=224) [F(3,221)=.369, p=.775]
Age (n-224) [F(3,221)=1.043, p=.374]
Gender (n=209) [F(3,206)=.772, p=.511]
Subject Area (n=224) [F(3,221)=.311, p=.818]
Teaching Experience (n=223) [F(3,220)=.760, p=.518]
Appendix E Table 124: Teacher engagement with ICT to download material from a VLE by Location, Age, Gender, Subject Area and Teaching Experience.
Using ICT to browse or search the internet to research CPD opportunities.
A one-way between subjects’ ANOVA was conducted to compare means exploring whether
there is a statistically significant difference in the means values of the number of participants
who "use ICT to research CPD opportunities" by Location, Age, Gender, Subject Area and
Teaching Experiences.
No statistically significant values were returned for any conditions (see table 125).
Condition Results
Location (n=226) [F(3,223)=.927, p=.429]
Age (n-226) [F(3,223)=.375, p=.771]
Gender (n=211) [F(3,208)=.693, p=.557]
Subject Area (n=226) [F(3,223)=1.536, p=.206]
Teaching Experience (n=225) [F(3,222)=.300, p=.825]
Appendix E Table 125: Teacher engagement with ICT to research possible CPD opportunities by Location, Age, Gender, Subject Area and Teaching Experience.

276
Types of ICT resources used in classroom delivery or teaching.
Introduction.
A number of one-way between subjects’ ANOVA was conducted to compare means to
exploring whether there is a statistically significant difference in the means values of Location,
Age, Gender, Subject Area and Teaching Experience on the types and source of ICT resources
used in classroom delivery or teaching.
Using resources sources from the internet in classroom delivery and teaching.
A one-way between subjects’ ANOVA was conducted to compare means exploring whether
there is a statistically significant difference in the means values of the number of respondents
who use "resources collected from the internet in classroom delivery" by Location, Age,
Gender, Subject Area and Teaching Experiences.
No statistically significant values were returned for any conditions (see table 126).
Condition Results
Location (n=227) [F(1,226)=.318, p=.573]
Age (n-227) [F(1,226)=2.110, p=.740]
Gender (n=212) [F(1,211)=1.056, p=.305]
Subject Area (n=227) [F(1,226)=.321, p=.572]
Teaching Experience (n=226) [F(1,226)=.236, p=.628]
Appendix E Table 126: Teacher use of resources collected from the internet in classroom delivery and teaching by Location, Age, Gender, Subject Area and Teaching Experience.

277
Using off-line electronic resources in classroom delivery and teaching.
A one-way between subjects’ ANOVA was conducted to compare means exploring whether
there is a statistically significant difference in the means values of the number of respondents
who "use off-line electronic resources" by Location, Age, Gender, Subject Area and Teaching
Experiences.
No statistically significant values were returned for any conditions (see table 127).
Condition Results
Location (n=221) [F(1,220)=.712, p=.400]
Age (n-221) [F(1,220)=3.253, p=.073]
Gender (n=206) [F(1,205)=2.074, p=.151]
Subject Area (n=221) [F(1,221)=.093, p=.761]
Teaching Experience (n=220) [F(1,221)=2.555, p=.111]
Appendix E Table 127: Teacher use of off-line electronic resources by Location, Age, Gender, Subject Area and Teaching Experience.
Using materials of their own creation in classroom delivery and teaching.
A one-way between subjects’ ANOVA was conducted to compare means exploring whether
there is a statistically significant difference in the means values of the number of respondents
who "use material of their own creation" by Location, Age, Gender, Subject Area and Teaching
Experiences.
No statistically significant values were returned for any conditions (see table 128).
Condition Results
Location (n=227) [F(1,226)=.354, p=.553]
Age (n-227) [F(1,226)=1.706, p=.193]
Gender (n=212) [F(1,211)=.340, p=.561]
Subject Area (n=227) [F(1,226)=.025, p=.874]
Teaching Experience (n=226) [F(1,226)=.721, p=.397]
Appendix E Table 128: Teacher use materials of their own creation by Location, Age, Gender, Subject Area and Teaching Experience.

278
Using materials from mainstream websites in classroom delivery and teaching.
A one-way between subjects’ ANOVA was conducted to compare means exploring whether
there is a statistically significant difference in the means values of the number of respondents
who "use material from mainstream websites" by Location, Age, Gender, Subject Area and
Teaching Experiences.
No statistically significant values were returned for any conditions (see table 129).
Condition Results
Location (n=222) [F(1,221)=.015, p=.902]
Age (n-222) [F(1,221)=.701, p=.403]
Gender (n=207) [F(1,206)=.111, p=.739]
Subject Area (n=222) [F(1,221)=1.915, p=.168]
Teaching Experience (n=222) [F(1,221)=1.039, p=.309]
Appendix E Table 129: Teacher use materials from mainstream websites by Location, Age, Gender, Subject Area and Teaching Experience.
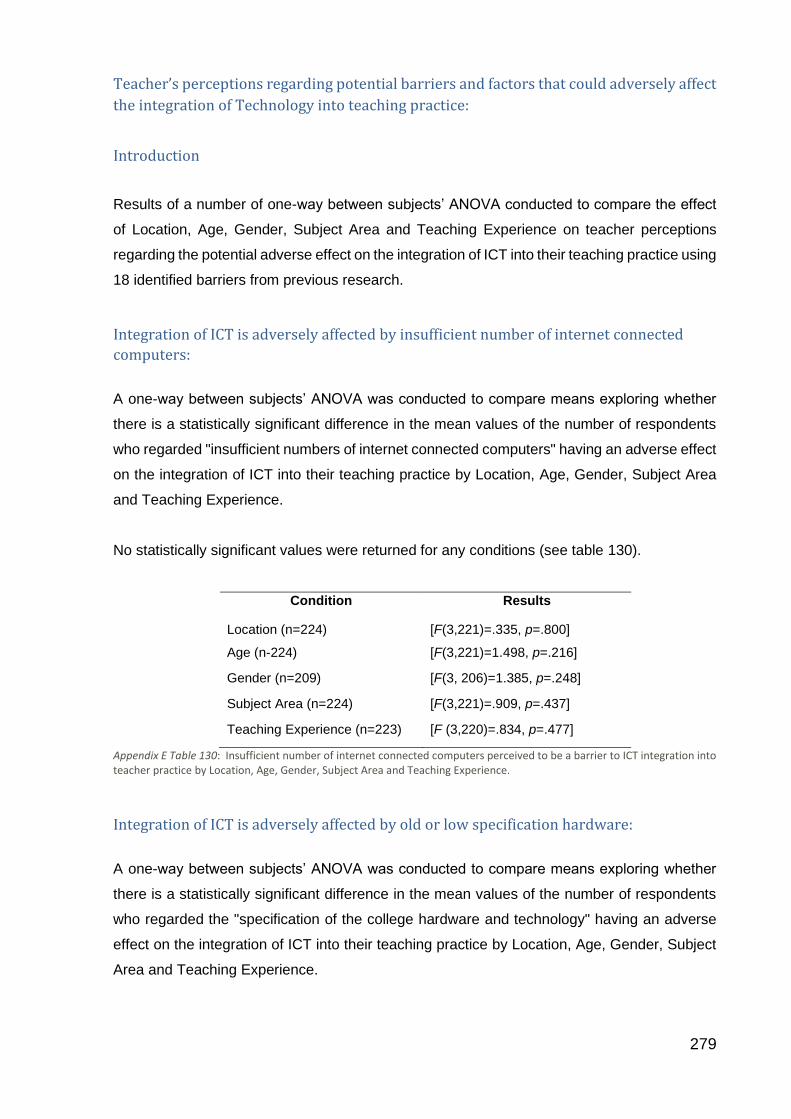
279
Teacher’s perceptions regarding potential barriers and factors that could adversely affect
the integration of Technology into teaching practice:
Introduction
Results of a number of one-way between subjects’ ANOVA conducted to compare the effect
of Location, Age, Gender, Subject Area and Teaching Experience on teacher perceptions
regarding the potential adverse effect on the integration of ICT into their teaching practice using
18 identified barriers from previous research.
Integration of ICT is adversely affected by insufficient number of internet connected
computers:
A one-way between subjects’ ANOVA was conducted to compare means exploring whether
there is a statistically significant difference in the mean values of the number of respondents
who regarded "insufficient numbers of internet connected computers" having an adverse effect
on the integration of ICT into their teaching practice by Location, Age, Gender, Subject Area
and Teaching Experience.
No statistically significant values were returned for any conditions (see table 130).
Condition Results
Location (n=224) [F(3,221)=.335, p=.800]
Age (n-224) [F(3,221)=1.498, p=.216]
Gender (n=209) [F(3, 206)=1.385, p=.248]
Subject Area (n=224) [F(3,221)=.909, p=.437]
Teaching Experience (n=223) [F (3,220)=.834, p=.477]
Appendix E Table 130: Insufficient number of internet connected computers perceived to be a barrier to ICT integration into teacher practice by Location, Age, Gender, Subject Area and Teaching Experience.
Integration of ICT is adversely affected by old or low specification hardware:
A one-way between subjects’ ANOVA was conducted to compare means exploring whether
there is a statistically significant difference in the mean values of the number of respondents
who regarded the "specification of the college hardware and technology" having an adverse
effect on the integration of ICT into their teaching practice by Location, Age, Gender, Subject
Area and Teaching Experience.

280
No statistically significant values were returned for any conditions (see table 131).
Condition Results
Location (n=226) [F(3,223)=.194, p=.901]
Age (n-226) [F(3,223)=2.542, p=.057]
Gender (n=211) [F(3,208)=.375, p=.771]
Subject Area (n=226) [F(3,223)=1.353, p=.258]
Teaching Experience (n=225) [F (3,222)=1.243, p=.295]
Appendix E Table 131: Low or out-dated specification of Technology and computer hardware is perceived to be a barrier to ICT integration into teacher practice by Location, Age, Gender, Subject Area and Teaching Experience.
Integration of ICT is adversely affected by lack of teacher skills:
A one-way between subjects’ ANOVA was conducted to compare means exploring whether
there is a statistically significant difference in the mean values of the number of respondents
who regarded "lack of teacher skills" as having an adverse effect on to the integration of ICT
into their teaching practice by Location, Age, Gender, Subject Area and Teaching Experience.
No statistically significant values were returned for any conditions (see table 132).
Condition Results
Location (n=225) [F(3,222)=.155, p=.926]
Age (n-225) [F(3,222)=.266, p=.850]
Gender (n=210) [F(3,207)=1.370, p=.253]
Subject Area (n=225) [F(3,222)=1.015, p=.387]
Teaching Experience (n=224) [F(3,221)=.150, p=.929]
Appendix E Table 132: Lack of teacher skills is perceived to be a barrier to ICT integration into teacher practice by Location, Age, Gender, Subject Area and Teaching Experience.
Integration of ICT is adversely affected by insufficient technical support:
A one-way between subjects’ ANOVA was conducted to compare means exploring whether
there is a statistically significant difference in the mean values of the number of respondents
who regarded "insufficient technical support" as having an adverse effect on the integration of
ICT into their teaching practice by Location, Age, Gender, Subject Area and Teaching
Experience.
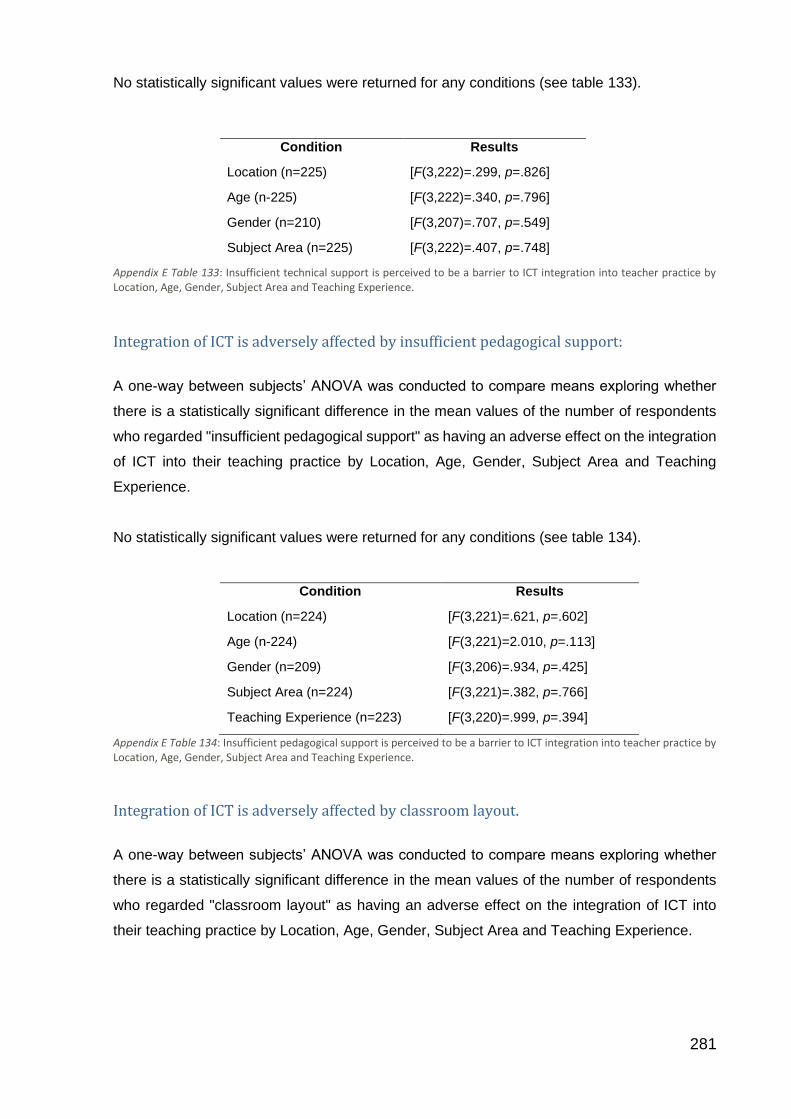
281
No statistically significant values were returned for any conditions (see table 133).
Condition Results
Location (n=225) [F(3,222)=.299, p=.826]
Age (n-225) [F(3,222)=.340, p=.796]
Gender (n=210) [F(3,207)=.707, p=.549]
Subject Area (n=225) [F(3,222)=.407, p=.748]
Appendix E Table 133: Insufficient technical support is perceived to be a barrier to ICT integration into teacher practice by Location, Age, Gender, Subject Area and Teaching Experience.
Integration of ICT is adversely affected by insufficient pedagogical support:
A one-way between subjects’ ANOVA was conducted to compare means exploring whether
there is a statistically significant difference in the mean values of the number of respondents
who regarded "insufficient pedagogical support" as having an adverse effect on the integration
of ICT into their teaching practice by Location, Age, Gender, Subject Area and Teaching
Experience.
No statistically significant values were returned for any conditions (see table 134).
Condition Results
Location (n=224) [F(3,221)=.621, p=.602]
Age (n-224) [F(3,221)=2.010, p=.113]
Gender (n=209) [F(3,206)=.934, p=.425]
Subject Area (n=224) [F(3,221)=.382, p=.766]
Teaching Experience (n=223) [F(3,220)=.999, p=.394]
Appendix E Table 134: Insufficient pedagogical support is perceived to be a barrier to ICT integration into teacher practice by Location, Age, Gender, Subject Area and Teaching Experience.
Integration of ICT is adversely affected by classroom layout.
A one-way between subjects’ ANOVA was conducted to compare means exploring whether
there is a statistically significant difference in the mean values of the number of respondents
who regarded "classroom layout" as having an adverse effect on the integration of ICT into
their teaching practice by Location, Age, Gender, Subject Area and Teaching Experience.

282
No statistically significant values were returned for any conditions (see table 135).
Condition Results
Location (n=226) [F(3,223)=1.734, p=.161]
Age (n-226) [F(3,223)=.302, p=.824]
Gender (n=211) [F(3,208)=1.122, p=.341]
Subject Area (n=226) [F(3,223)=2.188, p=.090]
Teaching Experience (n=225) [F(3,222)=1.681, p=.172
Appendix E Table 135: Classroom layout perceived to be a barrier to ICT integration into teacher practice by Location, Age, Gender, Subject Area and Teaching Experience.
Integration of ICT is adversely affected by teacher resistance.
A one-way between subjects’ ANOVA was conducted to compare means exploring whether
there is a statistically significant difference in the mean values of the number of respondents
who regarded "teacher resistance" as having an adverse effect on the integration of ICT into
teaching practice by Location, Age, Gender, Subject Area and Teaching Experience.
No statistically significant values were returned for any conditions (see table 136).
Condition Results
Location (n=225) [F(3,222)=.917, p=.433]
Age (n-225) [F(3,222)=1.348, p=.260]
Gender (n=210) [F(3,207)=1.206, p=.309]
Subject Area (n=225) [F(3,222)=.745, p=.526]
Teacher Experience (n=224) [F(3,221)=.235, p=.872]
Appendix E Table 136: Teacher resistance is perceived to be a barrier to ICT integration into teacher practice by Location, Age, Gender, Subject Area and Teaching Experience.
Integration of ICT is adversely affected by lack of teacher interest.
A one-way between subjects’ ANOVA was conducted to compare means exploring whether
there is a statistically significant difference in the mean values of the number of respondents
who regarded "lack of teacher interest" as having an adverse effect on the integration of ICT
into teaching practice by Location, Age, Gender, Subject Area and Teaching Experience.

283
No statistically significant values were returned for any conditions (see table 137).
Condition Results
Location (n=225) [F(3,222)=1.574, p=.196]
Age (n-225) [F(3,222)=1.755, p=.157]
Gender (n=210) [F(3,207)=.839, p=.474]
Subject Area (n=225) [F(3,222)=1.378, p=.250]
Teacher Experience (n=224) [F(3,221)=.826, p=.481]
Appendix E Table 137: Lack of teacher interest is perceived to be a barrier to ICT integration into teacher practice by Location, Age, Gender, Subject Area and Teaching Experience.
Integration of ICT is adversely affected by unclear or no benefits.
A one-way between subjects’ ANOVA was conducted to compare means exploring whether
there is a statistically significant difference in the mean values of the number of respondents
who regarded that there are "unclear or no benefits" to the integration as having an adverse
effect on the integration of ICT into teaching practice by Location, Age, Gender, Subject Area
and Teaching Experience.
No statistically significant values were returned for any conditions (see table 138).
Condition Results
Location (n=226) [F(3,223)=.358, p=.783]
Age (n-226) [F(3,223)=.526, p=.665]
Gender (n=211 [F(3,208)=.925, p=.430]
Subject Area (n=226) [F(3,223=.750, p=.523]
Teacher Experience (n=225) [F(3,222)=2.208, p=.088]
Appendix E Table 138: No or unclear benefits is perceived to be a barrier to ICT integration into teacher practice by Location, Age, Gender, Subject Area and Teaching Experience.
Integration of ICT is adversely affected by integration not being considered a goal of the
college.
A one-way between subjects’ ANOVA was conducted to compare means exploring whether
there is a statistically significant difference in the mean values of the number of respondents
who regarded the "integration of ICT not a goal of the college" being as having an adverse
effect on the integration of ICT into teaching practice by Location, Age, Gender, Subject Area
and Teaching Experience.

284
No statistically significant values were returned for any conditions (see table 139).
Condition Results
Location (n=224) [F(3,221)=2.018, p=.112]
Age (n-224) [F(3,221)=.333, p=.802]
Gender (n=209) [F(3,189)=1.262, p=.288]
Subject Area (n=224) [F(3,203)=.552, p=.647]
Teacher Experience (n=223) [F(3,220)=.136, p=.938]
Appendix E Table 139: Not regarded as a goal of the college and therefore is perceived to be a barrier to ICT integration into teacher practice by Location, Age, Gender, Subject Area and Teaching Experience.
Teacher participation in technology related Continued Professional Development (CPD)
courses that produced results showing no statistical significance:
Introduction
A number of one-way between subjects’ ANOVA were conducted to compare means to
exploring whether there is a statistically significant difference in the means values of Age,
Subject Area and Teaching Experience on the participation of teachers in ten identified
Continued Professional Development Courses, (CPD) related to the use and application of
Information Communication Technology, (ICT).
Advanced course on internet use:
A one-way between subjects’ ANOVA was conducted to compare means exploring whether
there is a statistically significant difference in the means values of Location, Age, Gender,
Subject Area and Teaching Experience regarding participation on "advanced courses on
internet usage".
No statistically significant values were returned for any conditions (see table 140).
Condition Results
Location (n=227) [F(1,226)=.249, p=.618]
Age (n-227) [F(1,226)=.724, p=.396]
Gender (n=212) [F(1,211)=.016, p=.899]
Subject Area (n=227) [F(1,207)=.535, p=.465]
Teaching Experience (n=226) [F(1,225)=1.521, p=.219]
Appendix E Table 140: Participation in CPD courses in advanced internet use by Location, Age, Gender, Subject Area and Teaching Experience.

285
Participation in courses on awareness of ICT pedagogy:
A one-way between subjects’ ANOVA was conducted to compare means exploring whether
there is a statistically significant difference in the means values of Location, Age, Gender,
Subject Area and Teaching Experience regarding participation in "courses on ICT Pedagogy".
No statistically significant values were returned for any conditions (see table 141).
Condition Results
Location (n=225) [F(1,225)=1.864, p=.173]
Age (n-225) [F(1,225)=.017, p=.898]
Gender (n=211) [F(1,210)=.567, p=.452]
Subject Area (n=225) [F(1,224)=3.666, p=.057]
Teacher Experience (n=224) [F(1,223)=2.176,p=.142]
Appendix E Table 141: Participation in CPD courses in ICT pedagogy by Location, Age, Gender, Subject Area and Teaching Experience.
Participation in professional on-line communities:
A one-way between subjects’ ANOVA was conducted to compare means exploring whether
there is a statistically significant difference in the means values of Location, Age, Gender,
Subject Area and Teaching Experience regarding participation in "on-line professional
communities".
No statistically significant values were returned for any conditions (see table 142).
Condition Results
Location (n=224) [F(1,223)=.107, p=.744]
Age (n-224) [F(1,223)=.007, p=.932]
Gender (n=211) [F(1,210)=1.326, p=.251]
Subject Area (n=224) [F(1,223)=2.662, p=.104]
Teaching Experience (n=223) [F(1,222)=3.812,p=052]
Appendix E Table 142: Participation in on-line professional communities by Location, Age, Gender, Subject Area and Teaching Experience

286
Results showing a statistical significance with independent variables of Location and
Gender.
Participation in equipment specific courses:
A one-way between subjects’ ANOVA was conducted to compare means exploring whether
there is a statistically significant difference in the means values of Location, Age, Gender,
Subject Area and Teaching Experience regarding participation on "equipment specific training
courses".
There was a significant effect of location shown at the p<.05 level [F(1,206) = 23.053, p=0.001]
and teaching experience shown at the p=<.05 level [F(1,224) =19.264, p=<.001] on
participation in “equipment specific training courses”.
The frequency table indicates that more participants in the Midlands and Yorkshire regions
participated in equipment specific training courses than participants in the North East where
participants were equally split between participation and non-participation. Age, gender or
teaching specialisation were not shown to have a statistically significant influence on whether
or not they had taken such courses. The results are shown in Table 143 below.
Location
Yes No
North East 53 52
Yorkshire 66 26
Midlands 26 4
Appendix E Table 143: Frequency table showing number of participants who attended CPD courses in equipment specific training by location.
Integration of ICT is adversely affected by insufficient bandwidth:
A one-way between subjects’ ANOVA was conducted to compare means exploring whether
there is a statistically significant difference in the mean values of the number of respondents
who regarded "insufficient bandwidth" and speed having an adverse effect on the integration
of ICT into their teaching practice by Location, Age, Gender, Subject Area and Teaching
Experience.

287
There was a significant effect of location indicated shown at the p=<.05 level, [F(3,225)=3.579,
p=.015] on insufficient bandwidth affecting the integration of ICT into teaching practice.
The frequency table indicates that participants in the Yorkshire region considered insufficient
bandwidth a greater barrier to the integration of ICT in to classroom practice, reporting higher
levels of either "partially" or "a lot", than older participants. The results are shown in Table 144
below.
Location Not at all A little Partially A lot
North East 28 26 34 19
Yorkshire 10 25 20 37
Midlands 3 9 10 8
Appendix E Table 144: Frequency table showing number of participants who perceived insufficient bandwidth to be a barrier to the integration of ICT into teacher practice by location.
Integration of ICT is adversely affected by insufficient number of whiteboards:
A one-way between subjects’ ANOVA was conducted to compare means exploring whether
there is a statistically significant difference in the mean values of the number of respondents
who regarded "insufficient number of whiteboards" having an adverse effect on the integration
of ICT into their teaching practice by Location, Age, Gender, Subject Area and Teaching
Experience.
There was a significant effect of location indicated shown at the p=<.05 level [F(3,223)=4.923,
p=.002] on insufficient number of whiteboards affecting the integration of ICT into teaching
practice.

288
The frequency table indicates that participants in the North East region considered insufficient
number of white boards a greater barrier to the integration of ICT in to classroom practice,
reporting higher levels of either "partially" or "a lot", than other participants. No significant
effects were shown in regard to a participant's age, gender, subject area or teaching
experience in whether they regarded insufficient number of whiteboards as adversely affecting
ICT integration into their teaching practice. The results are shown in Table 145 below.
Location Not at all A little Partially A lot
North East 40 16 26 25
Yorkshire 61 14 9 6
Midlands 16 5 7 2
Appendix E Table 145: Frequency table showing number of participants who perceived insufficient number of whiteboards to be a barrier to the integration of ICT into teacher practice by location.
Integration of ICT is adversely affected by insufficient number of portable devices:
A one-way between subjects’ ANOVA was conducted to compare means exploring whether
there is a statistically significant difference in the mean values of the number of respondents
who regarded "insufficient number of portable devices" having adverse effect on the integration
of ICT into their teaching practice by Location, Age, Gender, Subject Area and Teaching
Experience.
There was a significant effect of location indicated shown at the p=<.05 level [F(3,223)=2.869,
p=.037], a significant effect of gender shown at the p=<.05 level [F(3,209)=3.114, p=.027 on
"insufficient number of portable devices affecting the integration of ICT into teaching practice.
The frequency table indicates that participants in the North East region considered insufficient
number of portable devices a greater barrier to the integration of ICT into classroom practice,
reporting higher levels of either "partially" or "a lot", than participants in other regions. The
results are shown in Table 146 below.
Location Not at all A little Partially A lot
North East 18 19 37 33
Yorkshire 23 26 27 14
Appendix E Table 146: Frequency table showing number of participants who perceived insufficient number of portable devices to be a barrier to the integration of ICT into teacher practice by location.

289
The frequency table indicates that female participants considered insufficient portable devices
as possibly having an adverse effect on the integration of ICT in to their teaching practice
reporting a more frequent level of either "partially" or "a lot". The results are shown in Table
147 below.
Gender Not at all A little Partially A lot
Female 15 29 44 27
Male 29 20 28 21
Appendix E Table 147: Frequency table showing number of participants who regarded insufficient number of portable devices to be a barrier to the integration of ICT into teacher practice by gender.
Integration of ICT is adversely affected by lack of suitable content:
A one-way between subjects’ ANOVA was conducted to compare means exploring whether
there is a statistically significant difference in the mean values of the number of respondents
who regarded "lack of adequate content" as having an adverse effect on the integration of ICT
into their teaching practice by Location, Age, Gender, Subject Area and Teaching Experience.
There was a significant effect of gender on ICT integration in regard to "lack of adequate
content" affecting the integration of ICT in their teaching practice at the p<.05 level [F(3,206)=
3.477, p=0.017]. The results presented in Table 42 together with the values in Table 43
suggest that more male participants perceive lack of adequate content possibly having an
adverse effect on ICT integration.
The frequency table indicates that more female participants identified that "lack of adequate
content" was considered to be not at all having an adverse effect on the integration of ICT in
to classroom practice. The results are shown in Table 148 below.
Gender Not at all A little Partially A lot
Female 55 39 16 3
Male 29 38 22 8
Appendix E Table 148: Frequency table showing number of participants who regarded lack of adequate content to be a barrier to the integration of ICT into teacher practice by gender.

290
Using ICT to browse or search the internet for resources to be used during classroom
practice.
A one-way between subjects’ ANOVA was conducted to compare means exploring whether
there is a statistically significant difference in the means values of the number of respondents
who "use ICT to collect resources to be used during lesson" by Location, Age, Gender, Subject
Area and Teaching Experiences.
There was a significant effect of gender at the p<.05 level [F(3,210)=2.971, p=.033]. The
frequency table indicates that female respondents use the internet to source resources for use
during lessons to a greater degree. The results are shown in Table 149 below.
Gender Never
Rarely
Sometimes Often All the time
Female 1 7 40 67
Male 2 10 36 50
Appendix E Table 149: Frequency table showing number of participants who engage with ICT to collect resources to be used in class teaching by age.
Using resources collected from the college network or database in classroom delivery
and teaching.
A one-way between subjects’ ANOVA was conducted to compare means exploring whether
there is a statistically significant difference in the means values of the number of respondents
who use "resources collected from the college network or database in classroom delivery and
teaching" by Location, Age, Gender, Subject Area and Teaching Experiences.
There was a significant effect of location on the use of resources collected from the college
network or database at the p<.05 level [F(1,222)=5.329, p=.022]. The frequency table indicates
that respondents in the Midlands region used resources collected from the college network or
database in their classroom delivery and teaching. The results are shown in Table 150 below.
Location Yes No
North East 81 25
Yorkshire 77 13
Midlands 26 2
Appendix E Table 150: Frequency table showing number of participants who collect resources from the college network or Database in classroom delivery and teaching by location.

291
Confidence in creating or maintaining a blog or website.
A one-way between subjects’ ANOVA was conducted to compare means exploring whether
there is a statistically significant difference in the means values of the number of respondents
who are "confident in maintaining a blog or website" by Location, Age, Gender, Subject Area
and Teaching Experiences.
There was a significant effect of gender at the p=<.05 level [F(3,208)=2.694, p=.047]. The
frequency table indicates that Female participants had most respondents indicating no
confidence, but also had more participants that were somewhat confident or a lot confident
compared to the male participants. The results are shown in Table 151 below.
Gender None A little Somewhat A lot
Female 32 23 32 27
Male 22 28 15 33
Appendix E Table 151: Frequency table showing number of participants who have confidence in creating or maintaining a blog or website by gender.
Confidence in participating in a social network.
A one-way between subjects’ ANOVA was conducted to compare means exploring whether
there is a statistically significant difference in the means values of the number of respondents
who are "confident in participating in social network" by Location, Age, Gender, Subject Area
and Teaching Experiences.
There was a significant effect of gender at the p=<.05 level [F(3,208)=2.784, p=.042].
The frequency table indicates that while female respondents had more self-efficacy in
participating in social networks than did male participants. The results are shown in Table 152
below.
Gender None A little Somewhat A lot
4 2 2 7
Female 11 11 18 74
Male 13 21 17 47
Appendix E Table 152: Frequency table showing number of participants who have confidence in participating in social network by gender.
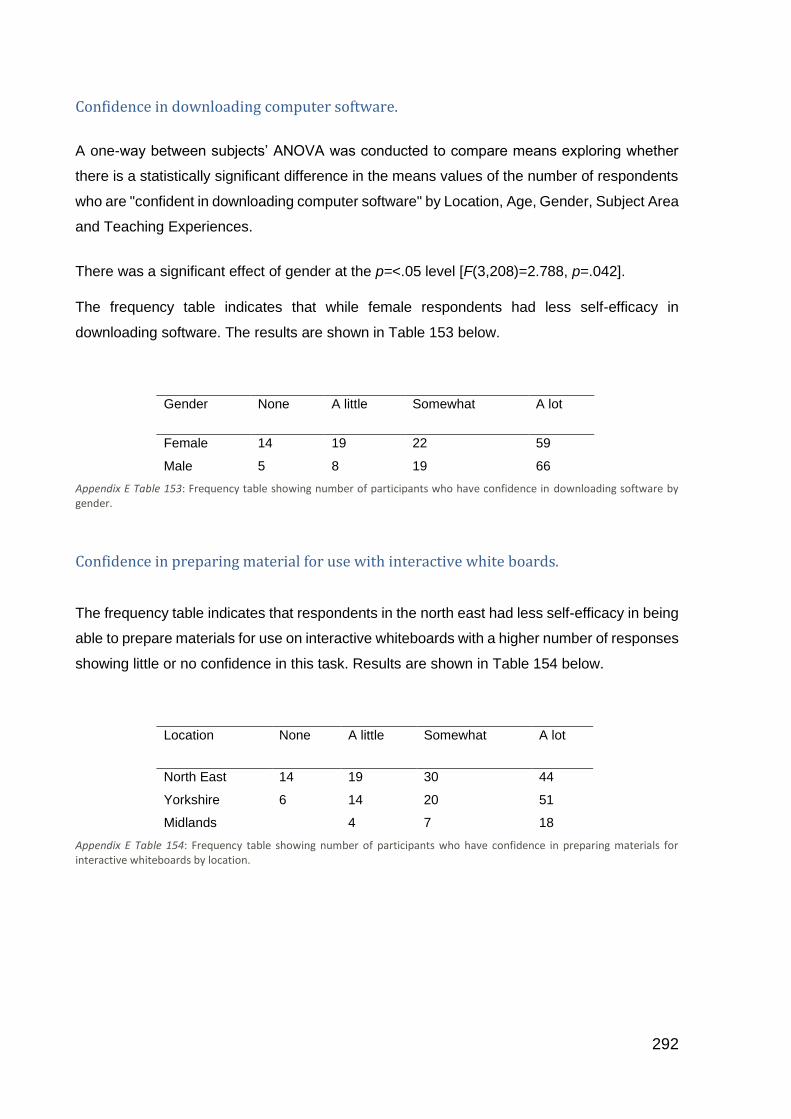
292
Confidence in downloading computer software.
A one-way between subjects’ ANOVA was conducted to compare means exploring whether
there is a statistically significant difference in the means values of the number of respondents
who are "confident in downloading computer software" by Location, Age, Gender, Subject Area
and Teaching Experiences.
There was a significant effect of gender at the p=<.05 level [F(3,208)=2.788, p=.042].
The frequency table indicates that while female respondents had less self-efficacy in
downloading software. The results are shown in Table 153 below.
Gender None A little Somewhat A lot
Female 14 19 22 59
Male 5 8 19 66
Appendix E Table 153: Frequency table showing number of participants who have confidence in downloading software by gender.
Confidence in preparing material for use with interactive white boards.
The frequency table indicates that respondents in the north east had less self-efficacy in being
able to prepare materials for use on interactive whiteboards with a higher number of responses
showing little or no confidence in this task. Results are shown in Table 154 below.
Location None A little Somewhat A lot
North East 14 19 30 44
Yorkshire 6 14 20 51
Midlands 4 7 18
Appendix E Table 154: Frequency table showing number of participants who have confidence in preparing materials for interactive whiteboards by location.
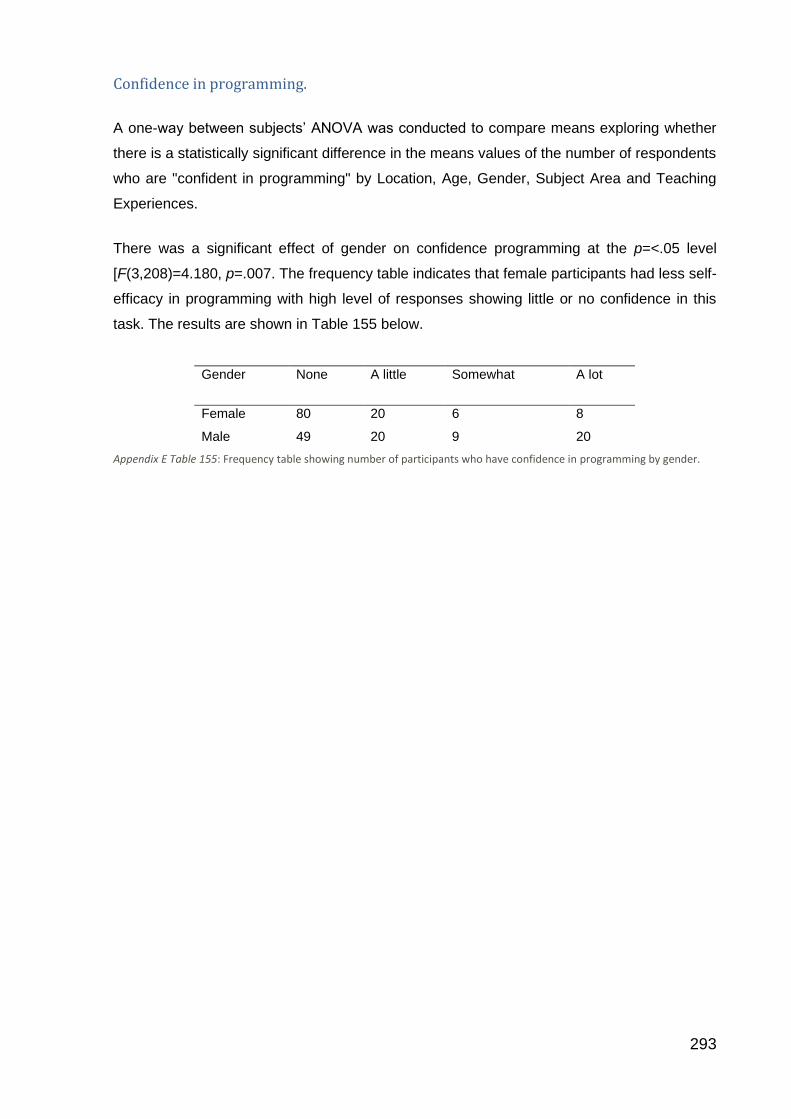
293
Confidence in programming.
A one-way between subjects’ ANOVA was conducted to compare means exploring whether
there is a statistically significant difference in the means values of the number of respondents
who are "confident in programming" by Location, Age, Gender, Subject Area and Teaching
Experiences.
There was a significant effect of gender on confidence programming at the p=<.05 level
[F(3,208)=4.180, p=.007. The frequency table indicates that female participants had less self-
efficacy in programming with high level of responses showing little or no confidence in this
task. The results are shown in Table 155 below.
Gender None A little Somewhat A lot
Female 80 20 6 8
Male 49 20 9 20
Appendix E Table 155: Frequency table showing number of participants who have confidence in programming by gender.
294
Appendix F.
Phase 2 Survey.
Phase 2 Questionnaire
Page 1
You are invited to take part in phase two of the research study in which I will be asking you to provide details about your background from an educational and career perspective. This is to enable me to build a more substantial profile of teachers and tutors working in Vocational Education.
Please read this notice fully and email me or my supervisors (contact details below) if you have any questions before clicking "Next". By clicking "Next" you are agreeing to be part of the study and giving permission for the information you provide to be used in the ways described below.
The study is part of Robert Shedden’s Doctorate in Education with the University of Durham.
* This research project is supervised by Dr Julie Rattray & Dr. Andrew Joyce-Gibbons ([email protected] & [email protected] from the School of Education at Durham University.
Answering this questionnaire should require no more than 20 minutes. All responses will be treated in strict confidence and only the researcher and their direct supervisors will have access to any details that could be used to identify the participants. If you wish to continue participation then once more provide email contact details, the next stage will be an interview that will be conducted at a location and time that is convenient to you.
By completing the questionnaire and pressing the "Finish button" you are agreeing to the information you supply being used in the research project.
You are free to decide whether or not to participate. If you decide to participate, you are free to withdraw at any time without any negative consequences for you.
Thank you once more for your collaboration. Your input is really valuable and important for my study.

295
Top of Form
Page 2: Confidential participant information
Location Required
Name: Contact Details: Email Optional
Page 3: Teacher Academic and Professional autobiography
What is the highest Academic Qualification that you hold? Required
Do you hold a formal teaching qualification or are you working towards this at this time? (Please specify) Required
What is this qualification?
Have you undertaken any formal or informal qualifications or training in Computing or ICT? (Please specify qualification achieved or level of training undertaken)
Please detail previous work, industry or business prior or during your teaching career?
What industry or business related qualifications do you hold?
Would you please give a short breakdown of your working career, there is no need to mention the names of any organisation, but details of length of service in particular roles or positions would be helpful?

296
I have completed a few details to act as a guide, although the detail you provide can be as much or as little as you want.
Royal Air Force 1997-1985 Sergeant
Computer graphics and Food Industry1985 - 1991 Customer Service Engineer
Food Production 1991 - 2001 Engineering Manager etc.
Your details:
Finish & Thank You

297
Appendix G.
Comparison of study data and Education and Training Foundation 2017 Report.
Comparison of data from Survey 1 and 2 and Education and Training
Foundation 2017 Report
Variable Stage 2 sample Education & training
foundation 2016 report
Gender Female 120 (52.4%) 53%
Male 99 (47.6%) 47%
Education Level Level 7 or < 9 (33%) 25%
First Degree 15 (56%) 33%
Level 4 or > 3 (11%) 25%
Teaching Qual. Achieved 23 (85%) 75%
Working toward 4 (15%) 25%
I.T. Qual. Level 4 or < 9 (33%)
Level 3 or > 6 (22%)
None 12 (44%)
Age 50 or < 12 (44%) 36%
40 - 49 11 (38%) 28%
30 - 39 4 (15%) 22%
29 or > 1 (05%) 12%
Table 0.1: Comparison of data from Survey 1 & 2 and Education and Training Foundation 2017 Report

298
Appendix H.
One to One Interview Images & General Questions.
What do you believe to be the value of ICT to teaching and learning?
How would you describe your engagement with ICT in your teaching?
How would you judge your own confidence using ICT?
How do you usually feel when using ICT in your classes?
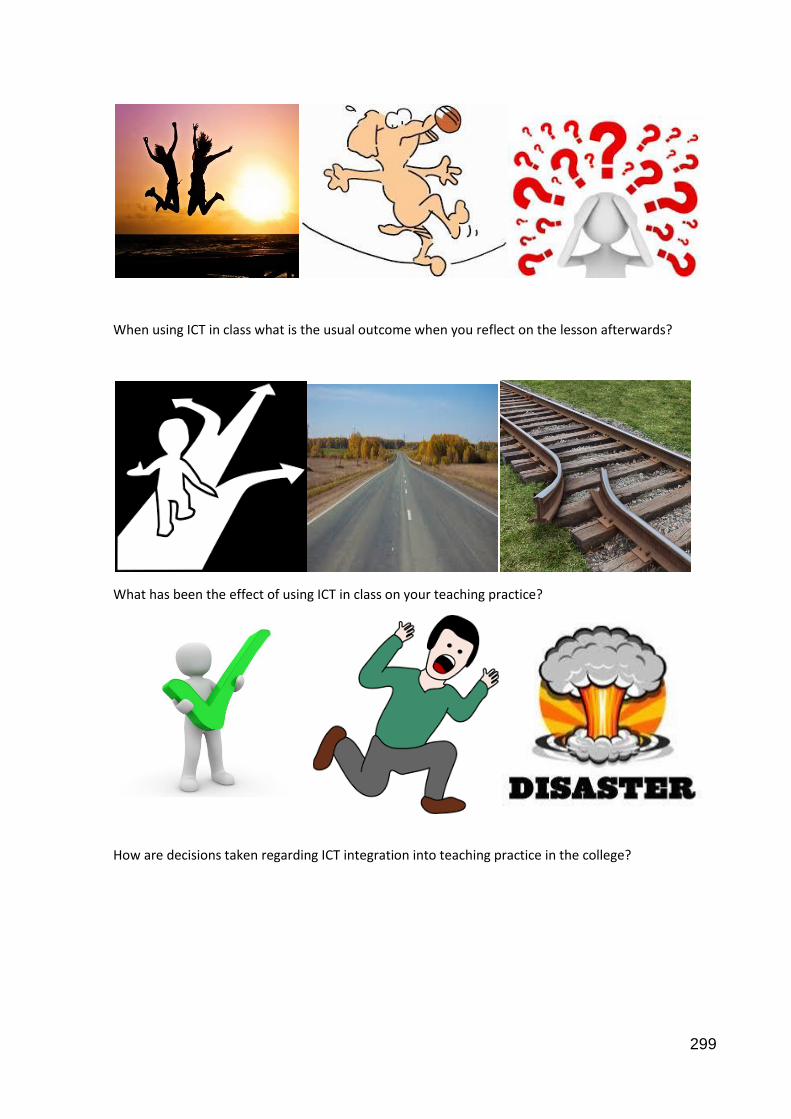
299
When using ICT in class what is the usual outcome when you reflect on the lesson afterwards?
What has been the effect of using ICT in class on your teaching practice?
How are decisions taken regarding ICT integration into teaching practice in the college?

300
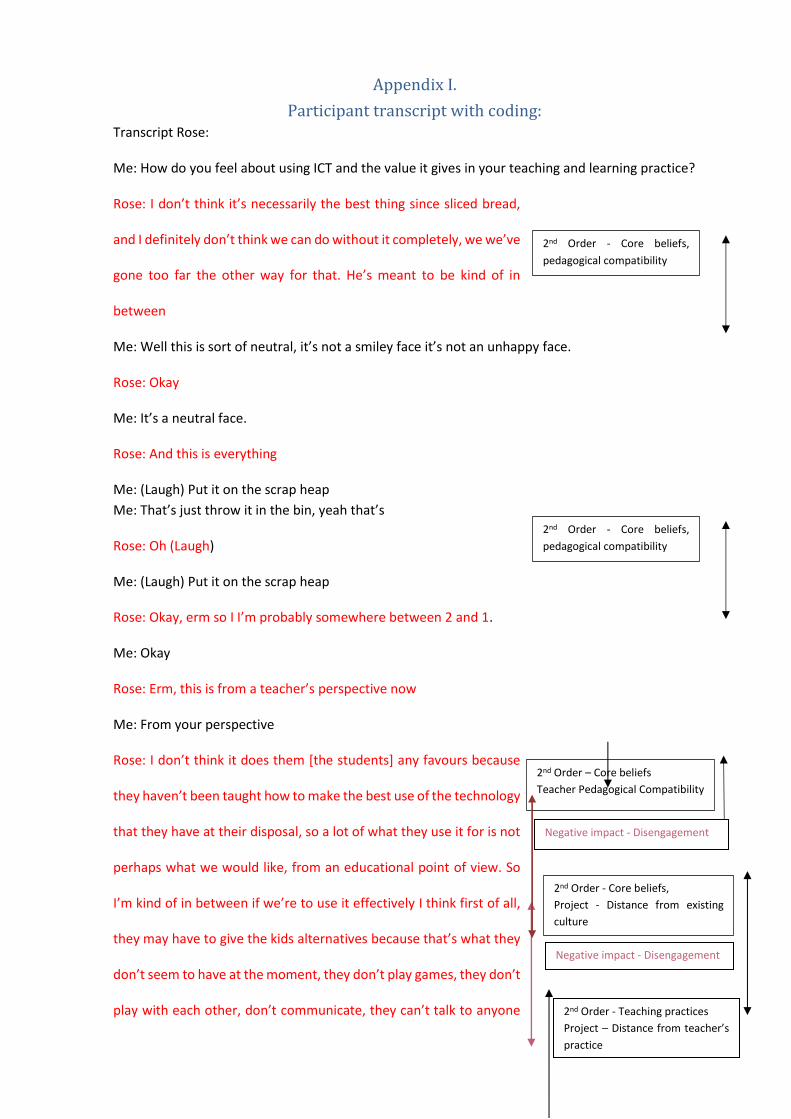
301
Appendix I.
Participant transcript with coding: Transcript Rose:
Me: How do you feel about using ICT and the value it gives in your teaching and learning practice?
Rose: I don’t think it’s necessarily the best thing since sliced bread,
and I definitely don’t think we can do without it completely, we we’ve
gone too far the other way for that. He’s meant to be kind of in
between
Me: Well this is sort of neutral, it’s not a smiley face it’s not an unhappy face.
Rose: Okay
Me: It’s a neutral face.
Rose: And this is everything
Me: (Laugh) Put it on the scrap heap
Me: That’s just throw it in the bin, yeah that’s
Rose: Oh (Laugh)
Me: (Laugh) Put it on the scrap heap
Rose: Okay, erm so I I’m probably somewhere between 2 and 1.
Me: Okay
Rose: Erm, this is from a teacher’s perspective now
Me: From your perspective
Rose: I don’t think it does them [the students] any favours because
they haven’t been taught how to make the best use of the technology
that they have at their disposal, so a lot of what they use it for is not
perhaps what we would like, from an educational point of view. So
I’m kind of in between if we’re to use it effectively I think first of all,
they may have to give the kids alternatives because that’s what they
don’t seem to have at the moment, they don’t play games, they don’t
play with each other, don’t communicate, they can’t talk to anyone
2nd Order - Core beliefs,
pedagogical compatibility
2nd Order – Core beliefs
Teacher Pedagogical Compatibility
2nd Order - Core beliefs,
Project - Distance from existing
culture
2nd Order - Teaching practices
Project – Distance from teacher’s
practice
Negative impact - Disengagement
Negative impact - Disengagement
2nd Order - Core beliefs,
pedagogical compatibility
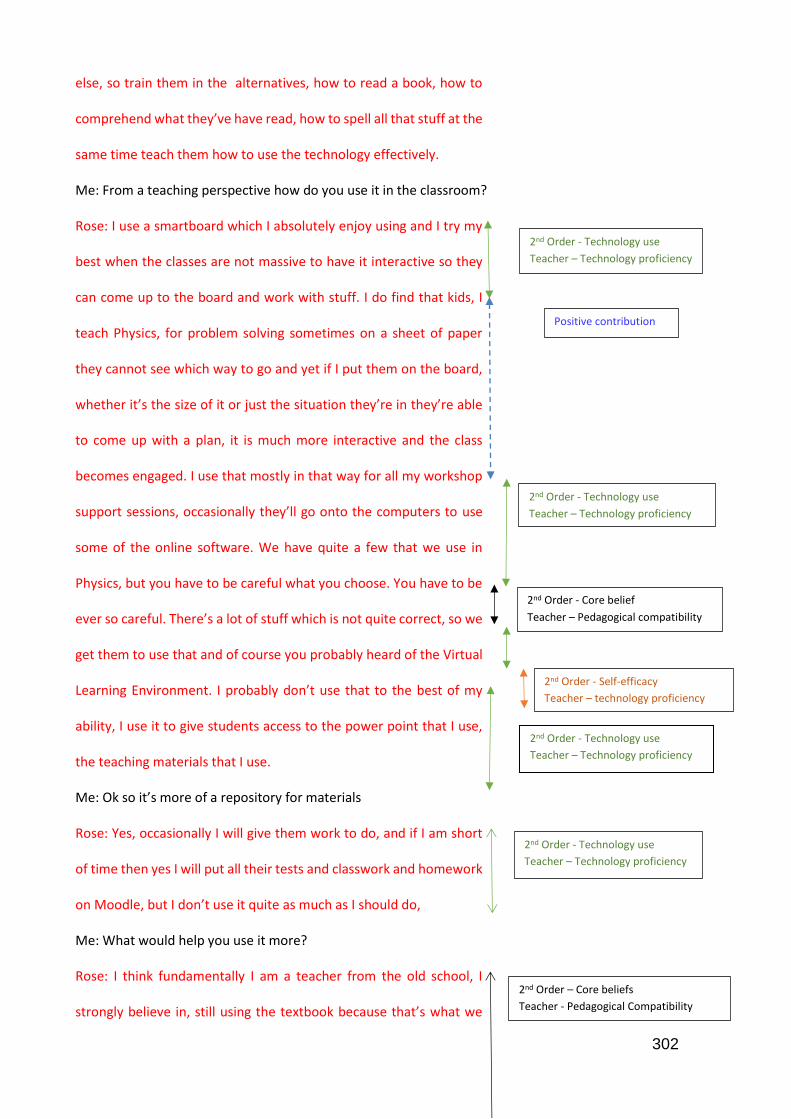
302
else, so train them in the alternatives, how to read a book, how to
comprehend what they’ve have read, how to spell all that stuff at the
same time teach them how to use the technology effectively.
Me: From a teaching perspective how do you use it in the classroom?
Rose: I use a smartboard which I absolutely enjoy using and I try my
best when the classes are not massive to have it interactive so they
can come up to the board and work with stuff. I do find that kids, I
teach Physics, for problem solving sometimes on a sheet of paper
they cannot see which way to go and yet if I put them on the board,
whether it’s the size of it or just the situation they’re in they’re able
to come up with a plan, it is much more interactive and the class
becomes engaged. I use that mostly in that way for all my workshop
support sessions, occasionally they’ll go onto the computers to use
some of the online software. We have quite a few that we use in
Physics, but you have to be careful what you choose. You have to be
ever so careful. There’s a lot of stuff which is not quite correct, so we
get them to use that and of course you probably heard of the Virtual
Learning Environment. I probably don’t use that to the best of my
ability, I use it to give students access to the power point that I use,
the teaching materials that I use.
Me: Ok so it’s more of a repository for materials
Rose: Yes, occasionally I will give them work to do, and if I am short
of time then yes I will put all their tests and classwork and homework
on Moodle, but I don’t use it quite as much as I should do,
Me: What would help you use it more?
Rose: I think fundamentally I am a teacher from the old school, I
strongly believe in, still using the textbook because that’s what we
2nd Order - Technology use
Teacher – Technology proficiency
2nd Order - Technology use
Teacher – Technology proficiency
2nd Order – Core beliefs
Teacher - Pedagogical Compatibility
2nd Order - Core belief
Teacher – Pedagogical compatibility
Positive contribution
2nd Order - Technology use
Teacher – Technology proficiency
2nd Order - Self-efficacy
Teacher – technology proficiency
2nd Order - Technology use
Teacher – Technology proficiency

303
have, but learn how to read, gleam the correct information you need
from what you have read, be able to understand the information
that’s in front of you and then be able to use that information to
answer questions.
Me: So you wouldn’t read a book that I have called “Why do I need a teacher when I have Google”
Rose: Exactly (Laugh)
Me: How would you describe your engagement with ICT in your teaching?
Rose: I think in general I’m okay,
Me: Are you in the forefront, do you take the lead and drag your colleagues along with you?
Rose: No, I’m not a one
Me: Do you require a little bit of a push to use it?
Rose: Not really, I am in between, I’m not averse to using technology
at all however I am not knowledgeable enough to be in the forefront.
Me: Do the college support you with training courses?
Rose: Yea they do, I mean I will probably, eventually be able to work stuff
out, if I’m not sure, but it’s just quite time consuming, so I depend
on other people for helping me with the bits that I can’t do. Some things
I find more difficult than others, I can’t use Excel,
Me: You use what you are familiar and comfortable with?
Rose: Yes
Me: And that’s the boundaries
Rose: I don’t know if that work comes under this, and I think other teachers as well, your personality
makes a big difference in your success as a teacher, I can’t do anything that I find goes against my very
grain, if you like,
Rose: Yes, I am a bit of a mother hen, I like to make sure that
everything is done right and they are going to get it right, I need to
2nd Order - Self-efficacy
Teacher – technology proficiency
1st Order - Lack of training
Teacher – technology proficiency
2nd Order - Core belief
Teacher – Pedagogical compatibility
2nd Order - Self-efficacy
Teacher – technology proficiency
2nd Order - Self-efficacy
Teacher – technology proficiency
1st Order - Lack of time
Context – organisational culture
2nd Order - Self-efficacy
Teacher – technology proficiency
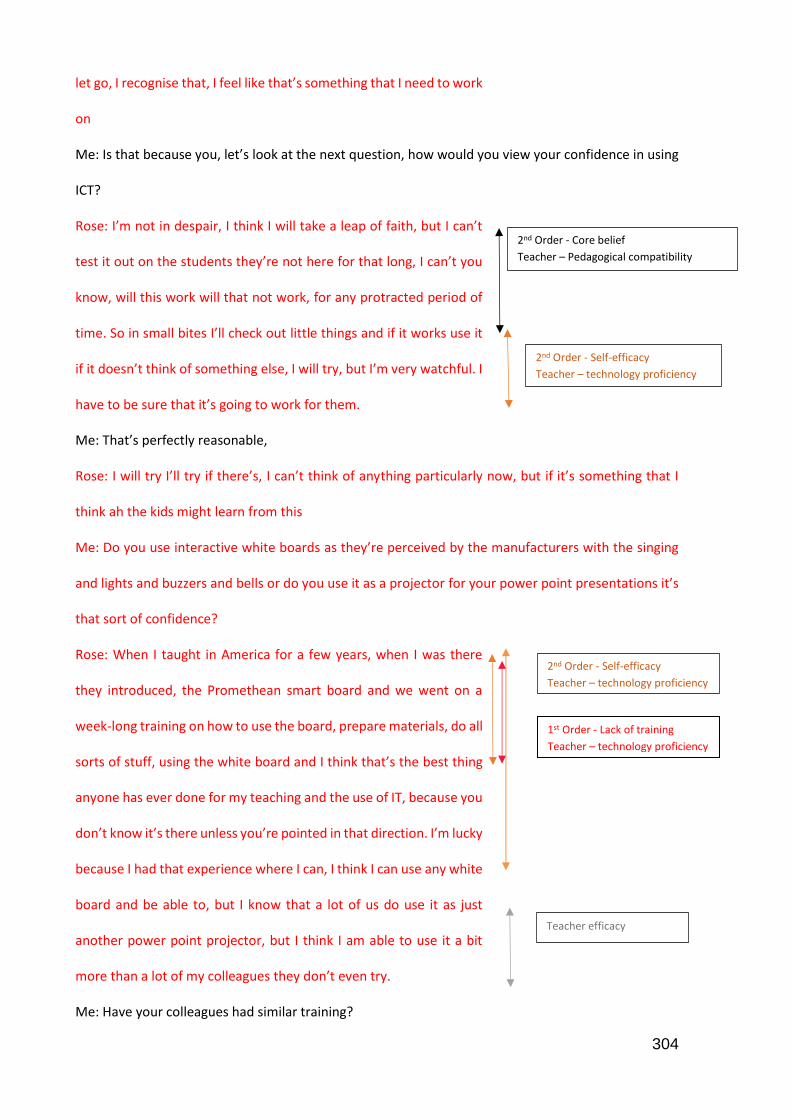
304
let go, I recognise that, I feel like that’s something that I need to work
on
Me: Is that because you, let’s look at the next question, how would you view your confidence in using
ICT?
Rose: I’m not in despair, I think I will take a leap of faith, but I can’t
test it out on the students they’re not here for that long, I can’t you
know, will this work will that not work, for any protracted period of
time. So in small bites I’ll check out little things and if it works use it
if it doesn’t think of something else, I will try, but I’m very watchful. I
have to be sure that it’s going to work for them.
Me: That’s perfectly reasonable,
Rose: I will try I’ll try if there’s, I can’t think of anything particularly now, but if it’s something that I
think ah the kids might learn from this
Me: Do you use interactive white boards as they’re perceived by the manufacturers with the singing
and lights and buzzers and bells or do you use it as a projector for your power point presentations it’s
that sort of confidence?
Rose: When I taught in America for a few years, when I was there
they introduced, the Promethean smart board and we went on a
week-long training on how to use the board, prepare materials, do all
sorts of stuff, using the white board and I think that’s the best thing
anyone has ever done for my teaching and the use of IT, because you
don’t know it’s there unless you’re pointed in that direction. I’m lucky
because I had that experience where I can, I think I can use any white
board and be able to, but I know that a lot of us do use it as just
another power point projector, but I think I am able to use it a bit
more than a lot of my colleagues they don’t even try.
Me: Have your colleagues had similar training?
2nd Order - Core belief
Teacher – Pedagogical compatibility
2nd Order - Self-efficacy
Teacher – technology proficiency
2nd Order - Self-efficacy
Teacher – technology proficiency
Teacher efficacy
1st Order - Lack of training
Teacher – technology proficiency

305
Rose: No, we haven’t, we had a day, an hour, but because I know the
difference between having a whole week and we were taken out, it
was out of school time, so we went in, prepared all our materials. In
August we prepared our materials using the white board that has
helped me quite a bit.
Me: That sounds to me the way to do it
Rose: That’s what’s missing you can’t give someone a board like this
and expect that they’re going to know, there are lots of games,
interactive activities that you can pull up, just from the software of
the smart board, I use smart board for almost all the time. Except it
doesn’t work a lot of the time (Whisper)
Me: Sorry
Rose: It doesn’t work all the time
Me: Why is that?
Rose: Well we had a spate where it was totally not functioning for
about a term,
Me: Infrastructure or bandwidth
Rose: it was the projectors that were being used, they either burnt
out or something had happened, so we went for a long period
without. All my materials had been for the interactive white board so
I had to go back to using power points and basic white board.
Me: How do you feel when you’re using ICT in the class?
Rose: The kids are very aware they don’t need too much direction
when it comes to using ICT so if I’m a bit short, the students can
usually fill up the gap and because I teach students who do A levels
in ICT computing I think I have an advantage. They’ll tell me they
found an app that does this that and the other and we’ll try it and
1st Order - Lack of training
Teacher – technology proficiency
1st Order – Infra-structure &
support
Context – Technological infra-
structure
1st Order - Lack of training
Teacher – technology proficiency
1st Order – Infra-structure &
support
Context – Technological infra-
structure
Positive contribution
Negative impact -
Distraction
2nd Order - Self-efficacy
Teacher – technology proficiency
2nd Order - Self-efficacy
Teacher – technology proficiency
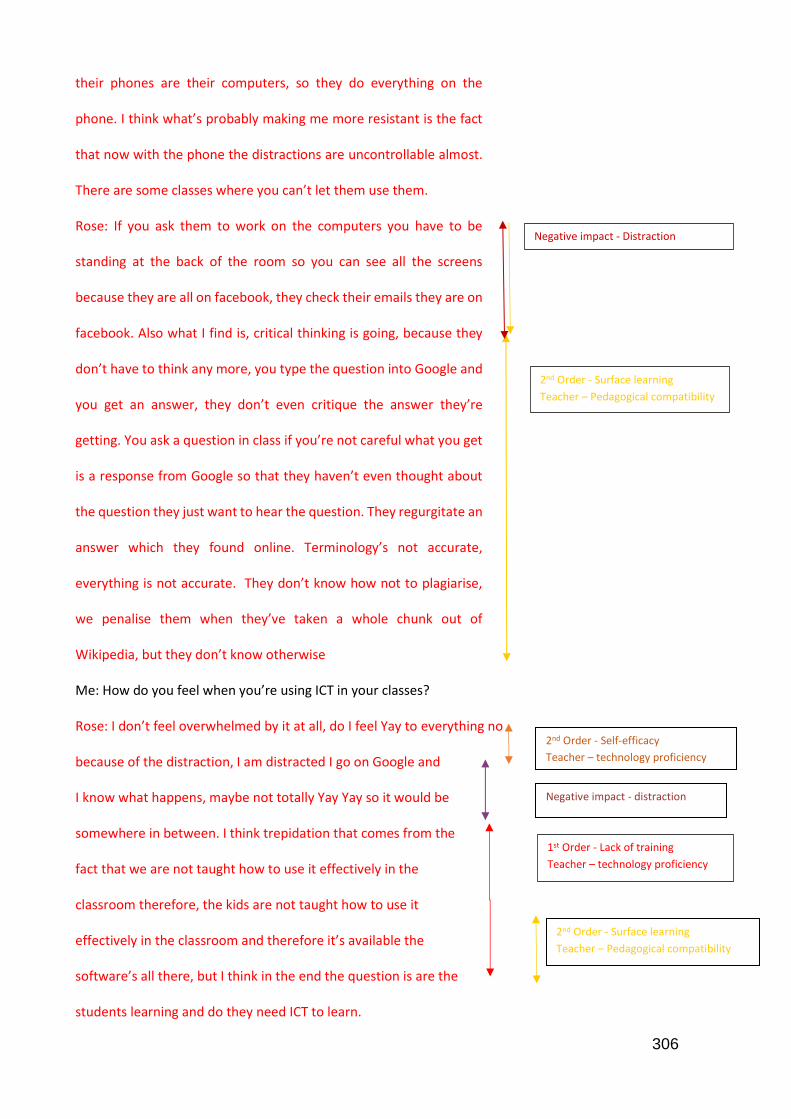
306
their phones are their computers, so they do everything on the
phone. I think what’s probably making me more resistant is the fact
that now with the phone the distractions are uncontrollable almost.
There are some classes where you can’t let them use them.
Rose: If you ask them to work on the computers you have to be
standing at the back of the room so you can see all the screens
because they are all on facebook, they check their emails they are on
facebook. Also what I find is, critical thinking is going, because they
don’t have to think any more, you type the question into Google and
you get an answer, they don’t even critique the answer they’re
getting. You ask a question in class if you’re not careful what you get
is a response from Google so that they haven’t even thought about
the question they just want to hear the question. They regurgitate an
answer which they found online. Terminology’s not accurate,
everything is not accurate. They don’t know how not to plagiarise,
we penalise them when they’ve taken a whole chunk out of
Wikipedia, but they don’t know otherwise
Me: How do you feel when you’re using ICT in your classes?
Rose: I don’t feel overwhelmed by it at all, do I feel Yay to everything no
because of the distraction, I am distracted I go on Google and
I know what happens, maybe not totally Yay Yay so it would be
somewhere in between. I think trepidation that comes from the
fact that we are not taught how to use it effectively in the
classroom therefore, the kids are not taught how to use it
effectively in the classroom and therefore it’s available the
software’s all there, but I think in the end the question is are the
students learning and do they need ICT to learn.
Negative impact - Distraction
1st Order - Lack of training
Teacher – technology proficiency
2nd Order - Surface learning
Teacher – Pedagogical compatibility
2nd Order - Self-efficacy
Teacher – technology proficiency
2nd Order - Surface learning
Teacher – Pedagogical compatibility
Negative impact - distraction

307
Me: When you reflect on the use of ICT how do you usually view the outcome of your class, is it all on
the straight and narrow or do we have a complete train wreck or do you have too many questions or
options at the end of it?
Rose: You have questions and options at the end of it, it’s not one or
the other because the world is definitely not straight, it’s not a train
wreck, although sometimes for some of the kids it might be. For
some kids I think it’s a train wreck not for many would I say it’s a
straight and narrow road, number 3 I guess in the majority of my
lessons.
2nd Order - Core belief
Teacher – Pedagogical
compatibility

308
Me: How are the decisions taken about ICT in the college?
Rose: I have nothing to do with it, since I’m a very small fish, but
there will be consultation a little bit above my head I guess,
there were some things that I ask for like the software that I
use in Physics. At one stage I was the only Physics teacher so
I would be in control of what kind of software we used.
Me: if you a blank piece of paper and we said resources don’t worry about cost, how would you get
more of your colleagues to use and integrate ICT into their teaching?
Rose: I would first of all take these boards off and have the
Promethean, which is a better smart board, and I would train all staff
and not just an hour, switch it on, do this, do that, do a nice long piece
where everyone produces some amount of classroom materials using
the white board. I would have computers available for the students,
but what we have in the Science Lab all the desks have desktops, the
kids are having to look over the desktops to see the board, and it’s
very intrusive when you’re teaching it’s in the way. I would have a
better design where the monitors could be pushed away from the
students until when they needed it, so one you would know when a
student was on the computer if they weren’t meant to be. We’d have
software that monitors what they’re doing from the front we would
definitely have that, we had it before, but for some reason it went,
where you could actually from the front see what each student was
working on and you’re able to give feedback. When the class is full,
it’s very difficult to give feedback.
Me: Does the IT department meet your needs, you said earlier that the projectors went off for a term.
Rose: They do I mean that was slow because I think it had to do with
College management,
1st Order - Lack of training
Teacher – technology proficiency
1st Order – Infra-structure & resources
Context – Technological infra-structure
1st Order – Infra-structure & resources
Context – Technological infra-structure
1st Order – Infra-structure &
resources
Context – Technological infra-
structure
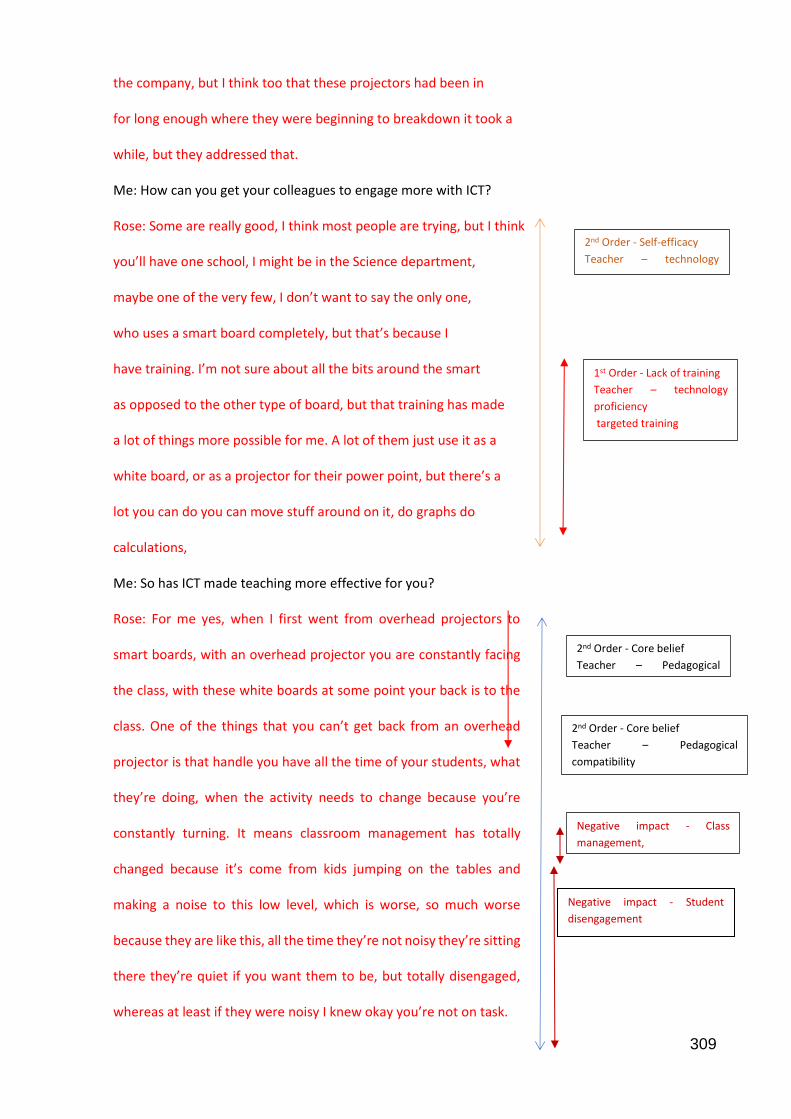
309
the company, but I think too that these projectors had been in
for long enough where they were beginning to breakdown it took a
while, but they addressed that.
Me: How can you get your colleagues to engage more with ICT?
Rose: Some are really good, I think most people are trying, but I think
you’ll have one school, I might be in the Science department,
maybe one of the very few, I don’t want to say the only one,
who uses a smart board completely, but that’s because I
have training. I’m not sure about all the bits around the smart
as opposed to the other type of board, but that training has made
a lot of things more possible for me. A lot of them just use it as a
white board, or as a projector for their power point, but there’s a
lot you can do you can move stuff around on it, do graphs do
calculations,
Me: So has ICT made teaching more effective for you?
Rose: For me yes, when I first went from overhead projectors to
smart boards, with an overhead projector you are constantly facing
the class, with these white boards at some point your back is to the
class. One of the things that you can’t get back from an overhead
projector is that handle you have all the time of your students, what
they’re doing, when the activity needs to change because you’re
constantly turning. It means classroom management has totally
changed because it’s come from kids jumping on the tables and
making a noise to this low level, which is worse, so much worse
because they are like this, all the time they’re not noisy they’re sitting
there they’re quiet if you want them to be, but totally disengaged,
whereas at least if they were noisy I knew okay you’re not on task.
1st Order - Lack of training
Teacher – technology
proficiency
targeted training
2nd Order - Self-efficacy
Teacher – technology
proficiency
2nd Order - Core belief
Teacher – Pedagogical
compatibility
2nd Order - Core belief
Teacher – Pedagogical
compatibility
Negative impact - Class
management,
Negative impact - Student
disengagement

310
Me: It makes it a little bit more obvious
Rose: It was, I know it’s going to come across as though I’m old
fashioned, but it’s not done the kids any favours, when I have a tutor
group you come in in the morning and you chat just chat to each
other, just talk that’s all it is because even that’s gone. My class you’ll
probably find the noise is higher than most.
Me: How do we get this integration of being able to use the
technology from a teaching perspective, from a learning perspective
and not lose what many people believe teaching to be about
which is an interaction between a group of people?
Rose: They’ll take photos at first it was oh that’s a really good
thing the kids take pictures of you know the laws, but what’s
happened now no one wants to write any notes and which means
that you I’ve got a derivation on the board, the only reason that
I want you to write it down as I’m going through it is so that I you
reinforce what I’m going through , but it’s can I take a picture, you
take 10,000 pictures of everything you’ve seen over the term
how do you prepare for an exam I allow some of the time
depends on how important I think the material is, but in Biology
you have to learn how to draw you’re diagrams having a
picture on your phone is not going to help you when you get into the exam,
Me: Okay, do you want to add any more,
Rose: Well not really no unless you have
Rose: I think on the day that you want to be lazy you get your power
point put everything you want to get the kids to know on the power
point and then you can just go from slide to slide. I don’t know if from
a teacher’s perspective also you can use it as a way out, sticking the
2nd Order - Core belief
Teacher – Pedagogical compatibility
2nd Order - Technology use
Teacher – Technology proficiency
Negative impact – surface
learning
311
kids in front of a computer and giving them some software to work
on, is an easy way out I think, I’m not criticizing any teachers because
there are sometimes when we need to step away, but I think in some
schools, it’s way to prevalent where they come in in the morning
there’s virtually no instruction and the kids are put in front of a
screen.
Me: Okay well thank you very much I hope it hasn’t been any traumatic
Rose: No not at all, as long as it’s
Me: Thank you for your time
Rose: Pleasure, I hope it’s been some help
Me: Very much appreciated
Rose: Thank you very much
312
Appendix J.
Profiles of teachers taking part in the one to one interviews.
Lynn:
Female aged over 50 with over 20 years of teaching experience in FE, now working at an
institute in the North East of England. Lynn has a First degree and a Cert Ed. and Post
Graduate Diploma in Education. She teaches on a Vocational Related programme and has
more than six years of experience using technology in her teaching practice. Prior to teaching
Lynn worked as a TAX inspector and within the Tourist Industry. Lynn has no formal
qualifications or training in the use of technology but has undertaken several internal and
external CPD courses in the area.
Lynn uses ICT to search and collect information to prepare lessons, collect resources to be
used in lessons all the time. She often uses applications to prepare presentation for lessons,
but rarely evaluates digital learning resources. Lynn sometimes creates her own digital
learning materials for students, prepares exercises and tasks for students, uses ICT to provide
feedback or assess students’ learning, browse or download material from the college's website
or other learning platforms and identify CPD opportunities. Lynn uses material within her
teaching practice sourced from the internet and existing educational sources as well as
material that she has created as well as from the college intranet and mainstream websites.
Lynn believes technology integration is affected by many factors, access to and availability of
hardware, a lack of training and support in how to integrate and use technology in teaching.
Lynn assesses her own self-efficacy as good in routine tasks, but has little confidence in the
more specialist technical aspects like creating a database of programming
Mike:
Mike is a Male aged over 50 years, or more. He has been teaching in a college of Further
Education in Midlands for over 20 years, teaching in the Computing and Design subject area
on courses offered by the institute. He has been engaged with technology in his teaching
practice for over 6 years. Prior to becoming a teacher Mike worked as a computer services
manager. He has Post Graduate Diploma in Information Systems and a PGCE teaching
qualification. Mike has undertaken CPD courses both internal and externally provided.
Mike uses ICT to search and collect information to prepare lessons and collect resources to
be used during lessons often. He uses applications to prepare presentations for lessons,

313
creates his own digital learning materials and prepare tasks and exercises for students
frequently. He uses ICT to provide student feedback sometimes, but rarely evaluates subject
specific digital learning resources. Mike often researches material from the college website
and other learning platforms. He searches for other CPD opportunities very frequently. Mike
uses materials sourced from the internet, utilizes existing material from established educational
sources and the college’s intranet as well as using electronic offline material. He creates his
own material as well as sourced from mainstream websites.
Mike believes technology integration is adversely affected by bandwidth issues and low
specification hardware as well as external pressure to meet exam targets. He assesses his
self-efficacy as high in all the tasks required for his job.
Ray:
Male aged over 50 has been teaching in a college of Further Education in the Midlands for
between 4 and 6 years, teaching an Academic subject area offered by the institute. He has
engaged with technology in his teaching practice for more than 6 years. Prior to becoming a
teacher Ray worked as a control-systems Engineer. He has a PhD and a BEd (Hons) teaching
qualification. He has undertaken CPD courses in the number of areas both internally and
externally.
Ray sometimes uses ICT to search for and collect information to prepare for and use during
lessons. He uses applications to prepare presentations for lessons and creates his own digital
learning materials sometimes. He rarely uses technology to provide student feedback or
search for CPD opportunities and browse the college website, but sometimes uses technology
to prepare tasks for students, evaluate digital learning resources and browse material from
other learning platforms. Ray uses material during his teaching practice sourced from the
internet, existing online material from established educational sources and mainstream
websites in addition to creating his own material. He doesn’t use material from the college
intranet or any electronic off-line material.
Ray believes technology integration is affected adversely by low specification hardware and
pressure to prepare students for exams. Ray does not use or take part in any form of social
media activities he assesses his self-efficacy as high in all other areas of technology use.

314
Philip:
Philip is a Male aged over 50 has been teaching in an FE institute in the North East of England
for between 4 and 10 years in an Academic subject area. He has a Level 4 qualification and is
at present studying a teaching qualification. He has gained an ECDL IT qualification and has
been using technology in course delivery for more than 6 years. Prior to teaching he was in
the Military and Police Force. Philip has undertaken CPD courses in technology from both
internal and external courses. Philip uses ICT to search and collect information to prepare for
and use in lessons all the time. He sometimes creates his own digital learning materials and
preparing exercises or tasks for students. Philip rarely uses ICT to provide student feedback,
evaluate digital learning resources or browse material from the college website. He often uses
applications to prepare presentations, download material from other learning platforms and
research CPD opportunities. Philip uses material sourced from the internet and existing
educational sources and well as material from the college intranet to create his own material.
He does not use off line electronic material or material from mainstream websites in his
teaching and delivery.
Philip believes technology integration is affected by access or availability of hardware in the
college and lack of support as well as teacher resistance to integration.
Nancy:
Nancy is a Female aged between 40 and 49 she has been teaching in an FE institute in the
North East of England for between 11-20 years delivering courses on a Vocational programme.
She has a First Degree and a Cert. Ed. teaching qualification. Although Nancy has no formal
qualifications in IT she has been using technology in delivery of courses for more than 6 years.
Prior to teaching she worked as a Nursing Assistant in the National Health Service. Nancy:
has undertaken a number of CPD courses provided both internally and externally by the
college.
Nancy uses technology to search and collect information to prepare for and use in lessons all
the time, additionally she uses technology to prepare presentations to use during lessons and
identify professional development opportunities all the time. Nancy sometimes provides
students feedback or assesses student progress sometimes as well sometimes downloading
material from external learning platforms. She often creates her own digital material for
students and sets exercises and tasks using ICT. She browses material from the college
website and evaluates digital learning resources often. During teaching and delivery Nancy
uses material that she has searched and sourced from the internet and existing online

315
educational sources, in addition she utilises the college intranet as well as mainstream
websites, off line electronic materials, such as CD-ROM, and materials of her own creation.
Nancy believes integration of technology is affected by lack of hardware and low specification
equipment in the college and lack of teacher skills. Nancy assesses her self-efficacy as good
in all areas of her job except creating a database or programming
Gill:
Gill is a Female aged over 50, she has been teaching in an FE institute in the Midlands of
England for over 20 years delivering Vocational specific courses at the present time. She has
a Cert. Ed. as her highest qualification. Although Gill has no formal I.T. qualification she has
been using technology as part of her delivery of courses for over 6 years. Prior to working in
F.E. she worked as a Nursery nurse and primary school reading specialist. Gill has undertaken
a range of CPD courses related to technology provided both internally and externally.
Gill uses ICT to search and collect information to prepare for and use in lessons and downloads
material from the college website all the time. She uses ICT some of the time to prepare
presentations, create materials, evaluate digital learning resources and source material from
other learning platforms. Gill rarely uses ICT to feedback to students or create exercises or
tasks for learners. She often uses ICT to prepare tasks and exercises for students. During
teaching and delivery Gill uses material that she has searched and downloaded from the
internet, online educational sources as well as mainstream websites. She utilises the college
intranet and creates her own material, but she does not use off line electronic resource like
CD-ROM during delivery.
Gill believes integration of technology is adversely affected by lack of content and pedagogical
models. Gill assesses her self-efficacy as good except in areas like spreadsheets and
programming.
Peter:
Peter is Male aged between 40 and 49, has worked in an FE institute in the North East of
England for between 11 and 20 years delivering Academic courses. He has an MSc and
Cert.Ed. teaching qualification. Peter has been using ICT in his delivery and teaching form
more than 6 years and has a Level 1 qualification in IT. Prior to working in education he worked
as a farm worker and graduate research technician. He has attended a range of internally
provided CPD courses related to technology. Peter uses ICT to search for and collect

316
information and resources to prepare and use before and during lessons as well as prepare
presentations often. He sometimes creates his own digital material, evaluates digital learning
resource and prepare exercises and tasks for students. Peter uses ICT to provide feedback to
students and browse or download material from the college website all the time. He often
utilises other learning platforms, but rarely researches CPD opportunities related to using ICT.
Peter uses material sourced from the internet, mainstream websites and creates his own
material. He also uses existing established educational sources, the college intranet and offline
electronic materials.
Peter believes that technology integration is adversely affected by infra-structure or access to
portable devices. Peter assesses his self-efficacy as being good in tasks required for
production and use of materials, but low in higher level skills like programming or editing
images.
Dan:
Dan is Male aged over 50 and has worked in an FE institute in the North East of England for
over 20 years delivering Academic courses. He has a first degree and indicated that he has a
teaching qualification. Dan has a Degree in IT and has been using technology in his delivery
for more than 6 years. Prior to teaching he worked as a programmer.
Dan has undertaken CPD in a range of courses provided both internally and externally by the
college. Dan uses ICT to search for and collect information and resources to prepare and use
before and during lessons as well as prepare presentations all the time. He sometimes creates
his own digital learning material, provides feedback to students and researches CPD
opportunities. Dan utilises ICT often to evaluate digital learning resources and browse or
download material from the college website and other learning platforms. He uses ICT to
prepare exercises for students all of the time. Dan uses material that he has searched the
internet and existing educational sources for to use in class during teaching and delivery. Other
sources of material that he uses are the college intranet, mainstream websites and material
he has created, he does not use off-line electronic materials such as CD-ROM.
Dan believes that technology integration can be adversely affected access and availability to
hardware and low specification equipment as well as external pressure to prepare for exams.
Dan assessed his self-efficacy as high in all the identified tasks.

317
Geoff:
Geoff is Male and aged between 30 and 39, he has worked in an FE institute in the North East
of England for between 4-10 years delivering courses in the Vocational related areas. He has
a PGCE teaching qualification. Geoff has a Level 3 qualification in IT and has been using ICT
in his delivery for more than 6 years. Prior to teaching he worked in retail management. Geoff
has undertaken internal CPD courses some areas directly related to the courses he delivers.
Geoff uses technology to search for and collect information and resources to prepare and use
before and during lessons and prepare presentations and his own digital material all of the
time. He prepares exercises and tasks for students all of the time and often uses technology
to provide feedback. Geoff often evaluates digital learning materials, but never browses or
uploads material from the college websites or other learning platforms or to research CPD
opportunities. Geoff uses material sourced from the internet and mainstream websites and
creates his own material. He does not use material from established educational sources or
the college intranet nor offline electronic material such as CD-ROM.
Geoff believes that ICT integration into teaching and learning can be adversely affected by the
lack of adequate content. Geoff assesses his self-efficacy as high except in programming.