durham e-theses cell-bound phosphatase activity in cotton ... · in cv qalandri the optimum ph for...
TRANSCRIPT

Durham E-Theses
Cell-bound phosphatase activity in cotton (gossypiumhirsutum L.) roots
Baloch, Gul Muhammad M.
How to cite:
Baloch, Gul Muhammad M. (1995) Cell-bound phosphatase activity in cotton (gossypium hirsutum L.)roots, Durham theses, Durham University. Available at Durham E-Theses Online:http://etheses.dur.ac.uk/5128/
Use policy
The full-text may be used and/or reproduced, and given to third parties in any format or medium, without prior permission orcharge, for personal research or study, educational, or not-for-pro�t purposes provided that:
• a full bibliographic reference is made to the original source
• a link is made to the metadata record in Durham E-Theses
• the full-text is not changed in any way
The full-text must not be sold in any format or medium without the formal permission of the copyright holders.
Please consult the full Durham E-Theses policy for further details.

Academic Support O�ce, Durham University, University O�ce, Old Elvet, Durham DH1 3HPe-mail: [email protected] Tel: +44 0191 334 6107
http://etheses.dur.ac.uk
2


Cell-bound phosphatase activity in cotton (Gossypium hirsutum L.) roots
by The copyright of this thesis rests with the author.
No quotation from it should be published without
his prior written consent and information derived
from it should be acknowledged.
Gul Muhammad M. Baloch
MSc. (Agri) Hons. (Sindh, Pakistan)
A thesis submitted for the degree of Doctor of Philosophy
Department of Biological Sciences University of Durham
England (UK)
April 1995
a MAY m

2
This thesis is entirely my own work. It has not previously been submitted for any other degree or diploma.
Gul Muhammad M . Baloch

DEDICATED TO MY PARENTS MY WIFE, BROTHERS AND SISTERS
Copyright
by Gul Muhammad M. Baloch The copyright of this thesis rests with the author. No quotation from it should be published without Gul Muhammad M . Baloch's prior permission and information derived from it should be acknowledged.

4
ABSTRACT
A study was made of phosphorus nutrition in cotton cultivars derived from Pakistan with particular reference to phosphatase activity. Cultivars used were Qalandri, Rehmani, Reshami and TH-3/83; Qalandri was used for most of the phosphatase characteristic studies, since this cultivar exhibited the highest germination percentage and seedling establishment.
Investigations of soil parameters from cotton growing region of Pakistan were also carried out. Soil pH was above 8.0 in all sites studied. Soil organic component levels were very variable between sites and within sites at different depths. Soil potassium was found to be at levels regarded as being sufficient for sustaining plant growth at all sites. However, levels of combined nitrogen and inorganic phosphate were in the range of values which could be regarded as being limiting to plant growth. The importance of phosphatase in the mobilization of organic phosphorus was therefore apparent.
Phosphomonoesterase (PMEase) activity, assayed using two substrates p-nitrophenyl phosphate (pNPP) and 4-methylumbelliferyl phosphate (4-MUP), was investigated and was found associated with roots of hydroponically-grown seedlings. Staining studies indicated that the enzymes were present in the cell wall. Phosphodiesterase activity was also detected in roots, using bis-pNPP as the substrate.
PMEase activity was found to have its greatest activity at pH values between 4.0 and 6.0 for all cultivars. In cv Qalandri the optimum pH for PMEase activity was 5 .5 and the optimum temperature was 55°C when assays were incubated over a l h period using pNPP or 4-MUP as the substrate. Levels of activity were higher using pNPP than with 4-MUP, but an absolute direct comparison could not be made since the concentrations of the individual substrates used were different.
Plants grown in phosphate-limitation conditions showed enhanced PMEase activity. Enhancement of PMEase activity was associated with the levels of phosphate in the plant growth nutrient solution rather than with those in the plant itself. This activity was highest in 19-day old seedlings, under the conditions of growth employed here.
A comparison between cultivars showed some differences in the level of PMEase activity and in the specific pH optimum for enzyme activity.
Limitation of combined nitrogen to seedling also resulted in enhanced PMEase even when plants were under phosphate-sufficient conditions. A similar effect of potassium-limitation was also found and this was associated with reduced uptake of phosphate into the seedlings. No effect of magnesium-limitation on PMEase activity was found.
A comparison was also made with other plants; cotton, Primula farinosa, rice, wheat and algae. All had associated phosphatase activity, with cotton showing significantly higher root acid phosphatase activity than the other higher plant species. Acidic phosphatase activity was found in the alga Draparnaldia whilst Stigeoclonium had alkaline phosphatase.

5
ABBREVIATIONS
AMP adenosine monophosphate AMeP 2-amino-2-methyl-l-propanol bis-pNPP bis-(p-nitrophenyl) phosphate °C degrees Celsius cAMP cyclic adenosine monophosphate CAPS 3-(cyclohexylamino)-l-propanesulphonic acid DMG 3, 3-dimethylglutaric acid d. wt dry weight EDTA ethylenediaminetetra-acetic acid (disodium salt) f. wt fresh weight g gramme h hour ha hectare HEPES N-2-hydrxymethyl piperazine-N'-2-ethanesulphonic acid kg kilogramme Km Michaelis-Menten constant 1 litre M molar m metre min minute mg milligramme ml millilitre mM millimolar mm millimetre NNED N-l-naphthylethylenediamine dihydrochloride nm nanometre PAR Photosynthetically Active Radiation Pi inorganic phosphorus PDEase phosphodiesterase PMEase phosphomonoesterase pNP p-nitrophenol pNPP p-nitrophenyl phosphate ppm parts per million s second S.D. standard deviation [ig microgramme ul microlitre u,M micromolar umol micromol 4-MUP 4-methylumbelliferyl phosphate 4-MU 4-methylumbellferone Vmax maximum rate v/v volume per volume

6
ACKNOWLEDGEMENTS
I would like first of all to express my gratitude to Allah, who enabled me to carry out this work, then the people who helped me during the course of this study. I am specially thankful to my supervisors, Dr J. A Pearson and Dr B. A Whitton for their constant encouragement, support, guidance and helpful criticism throughout the course of this work. I am most grateful to Prof. P.R Evans for providing research facilities.
I am also extremely thankful to my parents, my wife, my brothers specially Mr Ghulam Rasool Baloch A.CO, my sisters and my children for their encouragement, inspiration and patience during my studies.
For the financial support during the course of the studies, I would like to thank Sindh Cotton Development project supported by the Asian Development Bank (ADB). In this regard I like to thank Dr Ibad Badar Siddiqui for his generous help.
My warmest thanks to Dr Phil Gates for his guiding remarks on this research. I would like to thanks Dr M.G Kelly and Dr A.Donaldson for their valuable suggestions.
I am extremely grateful to Julia M. Yelloly, Dr Ali Hassan Baloch, Naziha El. Hashani, Mr Haluk Bayrakdar, Mr Muhammad Ruhal Amin, Mr Rizwan M. Ashraf for their cordial help sympathy and generosity throughout my studies. Thanks are due to my research colleagues Dr Abdulrahman M.H. Al-Shehri, Dr Amit Gupta, Mr Paul A.R.J. Stevenson, Miss Heather Luff, Miss Eileen Bresnan, Miss Vanessa J.Mattin, Miss Sarah, Miss Anna, G.Mustafa Chandio, Mr Graham, Miss Gillian, and Dr Charles.
I am also thankful to Mr M.K Baloch, Mr A.Q Panhwer, Mr A.K Jarwar, Mr Lai Muhammad Baloch Mr Muharam Ali Qambrani, Dr David Peries, Miss Amal, Dr Y.S.Gilbert Chan, Mr Juma Hassan, Dr I Marta Evans.
I would like to thank the Graduate Society, University of Durham, Dr M Richardson, and Dr M.J Rowell. I acknowledge David J. Hutchinson and Paul Sidney of the Photography Unit, and the departmental secretarial staff, Mrs J.Mather and Mrs Margaret Creighton.
Many people gave moral support at various times. My particular thanks go to the "Lunch Club" friends Dr A H Baloch, Dr David Peries, Mr. M.K Baloch, Mr. G.M Chandio, Mr. Hojjat, NazihaEl-Hashani, Amal, Dr Lydia, Mirela. I will never forget the advice of Julia, Naziha El-Hashani and Dr Mark Amir Blower.
I would also like to express my gratitude towards my office colleagues in cotton section A.R.I Tandojam, Mr. Ahmad Khan Almani, Mr. Ghulam Murtaza Abro, Dr Qadir Bux Baloch, Mr. Mukhtar Ahmad Shaikh, Mr. M . Qasim Soomro, Mr. Aijaz Ahmad, Mr Nazir Ahmad Chana, Mr. Javid Safdar. Mr. Fateh Muhammad, Mr Magsi Sahib, Mr. Khliquzaman, Ahamed Khaskheli, and Abdullah (Mitho)

7
CONTENTS
ABSTRACT 4 ABBREVIATIONS 5 ACKNOWLEDGEMENTS 6 CONTENTS 7 LIST OF TABLES 11 LIST OF FIGURES 13
1 INTRODUCTION 15 1.1 General introduction 15 1.2 Origin of cotton 15 1.21 Physiology of cotton 16 1.22 Cotton roots 17 1.3 Phosphorus in the environment 18 1.31 Introduction 18 1.32 Phosphorus available in solution 19 1.33 Kinds of phosphorus in soil 20 1.331 Inorganic phosphorus 20 1.332 Organic phosphorus 21 1.4 Function of phosphorus in plants 22 1.41 Phosphorus content of cotton 23 1.5 Phosphatase 25 1.51 Formula of phosphate esters 26 1.52 Sources of phosphatases 27 1.521 Introduction 27 1.522 Bacterial phosphatase activity 28 1.523 Algal and cyanobacterial phosphatase activity 28 1.524 Phosphatase activity in higher plants 29 1.525 Phosphatase activity of plants under conditions of
phosphate limitation 31 1.526 Influence of pH on phosphatase activity 32 1.527 Effect of ions on phosphatase activity 33 1.6 Staining methods for phosphatase 34 1.7 Nitrogen 35 1.71 Nitrogen in the plants 3 5 1.711 Inorganic combination of nitrogen 3 5 1.712 Organic combination of nitrogen 3 6 1.72 Function of nitrogen in plants 36 1.8 Effect of salinity on higher plants 36 1.9 Aims 38
8
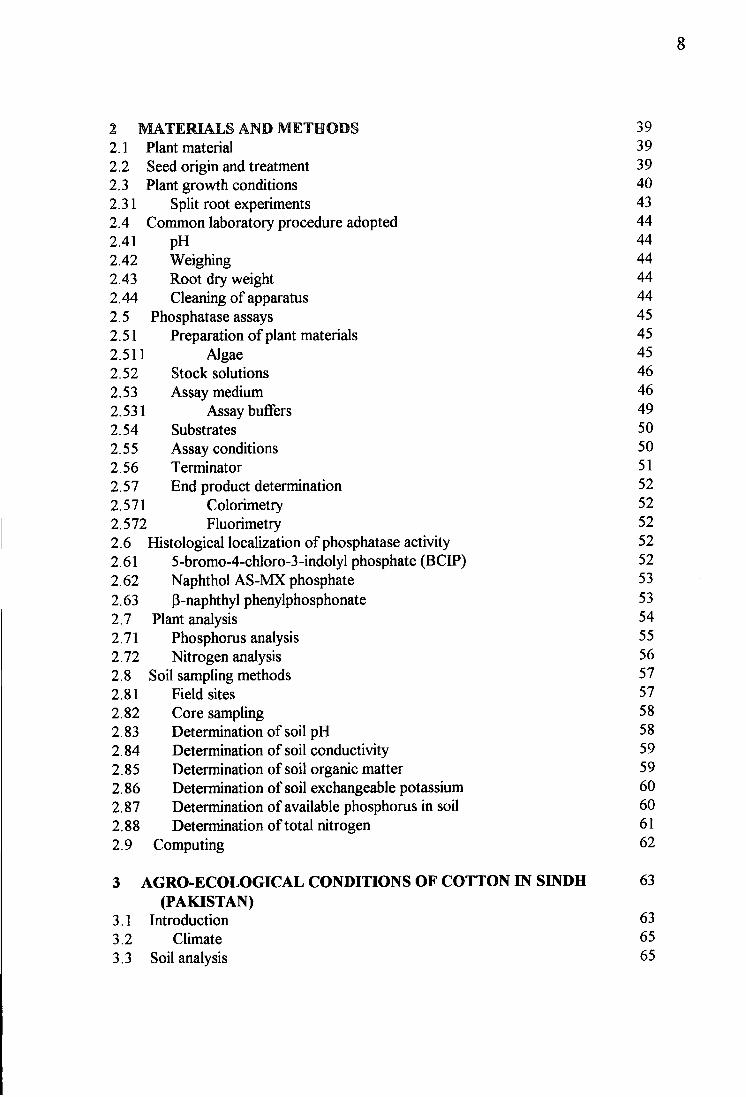
2 MATERIALS AND METHODS 39 2.1 Plant material 39 2.2 Seed origin and treatment 39 2.3 Plant growth conditions 40 2.31 Split root experiments 43 2.4 Common laboratory procedure adopted 44 2.41 pH 44 2.42 Weighing 44 2.43 Root dry weight 44 2 .44 Cleaning of apparatus 44 2.5 Phosphatase assays 45 2.51 Preparation of plant materials 45 2.511 Algae 45 2.52 Stock solutions 46 2.53 Assay medium 46 2.531 Assay buffers 49 2.54 Substrates 50 2.55 Assay conditions 50 2.56 Terminator 51 2.57 End product determination 52 2.571 Colorimetry 52 2.572 Fluorimetry 52 2.6 Histological localization of phosphatase activity 52 2.61 5-bromo-4-chloro-3-indolyl phosphate (BCIP) 52 2.62 Naphthol AS-MX phosphate 53 2.63 p-naphthyl phenylphosphonate 53 2.7 Plant analysis 54 2.71 Phosphorus analysis 55 2.72 Nitrogen analysis 56 2.8 Soil sampling methods 57 2.81 Field sites 57 2.82 Core sampling 58 2.83 Determination of soil pH 58 2.84 Determination of soil conductivity 59 2 .85 Determination of soil organic matter 59 2.86 Determination of soil exchangeable potassium 60 2.87 Determination of available phosphorus in soil 60 2.88 Determination of total nitrogen 61 2.9 Computing 62
3 A G R O - E C O L O G I C A L CONDITIONS OF COTTON IN SINDH 63 (PAKISTAN)
3.1 Introduction 63 3.2 Climate 65 3.3 Soil analysis 65

9
3.4 Results 67 3.41 SoilpH 67 3.42 Conductivity 68 3 .43 Organic matter 68 3 .44 Total nitrogen 69 3 .45 Available phosphorus 70 3 .46 Exchangeable potassium 71
4 C H A P T E R 4 73 4.1 Initial investigation of PMEase activity in cotton 73 4.2 Influence of cutting roots on their PMEase activity 74 4.3 Influence of pH on PMEase activity of cv Qalandri 75 4.4 Relative activities using different substrates 77 4.5 Effect of different phosphate concentrations on PMEase
activity in cotton (cv Qalandri) roots 80 4.6 Influence of substrate concentration (pNPP or 4-MUP) on PMEase
activity of (cv Qalandri) 81 4 .7 Time course of PMEase activity in cv Qalandri 82 4.8 Localization 82 4.9 Effect of temperature on PMEase activity in cotton (cv Qalandri) roots 88 4.10 Effect of ions on the PMEase assay 91 4 .11 Retention of product in, and leaching of activity, from roots of (cv Qalandri) 92 4.12 Influence of plant age on PMEase activity of (cv Qalandri) 95 4.121 13 -day old seedlings 95 4.122 19-day old seedlings 96 4.123 25-day old seedlings 96 4.13 Effect of growth medium conditions on PMEase activity and phosphorus
content in (cv Qalandri) seedlings 99 4.14 Split root system 102 4.15 Comparison of PMEase activity of three cotton cultivars 103 4.151 Overview 103 4.152 cv Qalandri 103 4.153 cvRehmani 105 4.154 cvReshmai 108 4.16 Influence of pH on PMEase and PDEase activities of (cv Qalandri) 109
5 C H A P T E R 5 112 5.1 PMEase activity in cotton seedling roots in relation to plant mineral content 112 5.11 Overview 112 5.12 Phosphorus content of individual parts of cotton seedlings 112 5 .2 Determination of macroelements in seeds of different cultivars 115 5 .3 Nitrogen content of individual parts of seedlings of different cultivars 117 5.4 Potassium and phosphorus content in cv Qalandri seedling parts and
their effect on root PMEase activity 120 5.5 Magnesium and phosphorus content in (cv Qalandri) seedling parts and
their effect on root PMEase activity 122

10
5 .6 Influence of nitrogen on the PMEase activities of three cultivars of cotton 126 5.61 Overview 126 5.611 cv Qalandri 126 5.612 cvRehmani 127 5.613 cvReshami 128 5 .7 Effect of split root system on PMEase activity 132
6 CHAPTER 6 135 6.1 Effect of salinity on PMEase activity of roots (cv Qalandri) 135 6.2 Effect of growth in the presence of specific metallic ions on PMEase
activity in cotton (cv Qalandri) roots 137 6 .3 Effect of different concentrations of ions on the PMEase activity of
cotton (cv Qalandri) 139
7 CHAPTER 7 143 7.1 Comparison of PMEase activity of higher plants of different species 143 7.2 Influence of pH on PMEase activity of Primula farinosa and algae 148
8 DISCUSSION 152 SUMMARY 177 R E F E R E N C E S 180 APPENDIX 201

11
LIST OF TABLES
2.1 Composition of mineral salts in Hoagland growth medium used to raise cotton plans 40
2.2 Concentrations of mineral salts used in assay medium of modified CHU10-D 47
2.3 Elemental concentrations in assay medium 48 2.4 Buffers used to determine the effect of pH on phosphatase activity 49 2.5 Substrates used for assaying phosphatase activity 50 2.6 Stock solutions and reagents used for phosphorus analysis 55 2.7 Stock solutions and reagents used for nitrogen analysis 56 3 .1 pH at different soil depths (cm below surface) 67 3.2 Conductivity (uS cm" 0 at different soil depths (cm below surface) 68 3.3 Organic matter at different soil depths (cm below surface) 69 3 .4 Total nitrogen (ppm) at different soil depths (cm below surface) 70 3.5 Available phosphorus (ppm) at different soil depths (cm below surface) 71 3 .6 Exchangeable potassium (ppm) at different soil depths (cm below surface) 72 4.1 PMEase activity (umol mg d. wt~l h~l) in cotton seedling roots
(cv Rehmani) grown without and with phosphorus added to the growth medium; pNPP substrate was used (n - 4, ± SD) 74
4.2 Influence of root segment size from cv Rehmani seedlings, grown without and with phosphorus added to the growth medium, on PMEase activity, pNPP was used as substrate. Activity is expressed as umolmgd. w t _ 1 h" 1 (n = 4, ±SD) 75
4.3 Summary of statistical analyses of different conditions of the assays 77 4.4 Influence of pH on PMEase activity (umol mg d. wt~l h~l) of
cv Qalandri seedlings growth without and with phosphorus added to the growth medium using pNPP and 4-MUP as the substrates
(n = 4, ± SD) 80 4 .5 Summary of statistical analyses of results of the comparison of PMEase
activity when different concentrations of phosphate were added to the growth medium 81
4 .6 Summary of statistical analyses of effects of different temperatures on PMEase activity of cv Qalandri roots 91
4.7 Effect of different ions on the PMEase assay using 4-MUP as substrate 92 4.8 PMEase activity and its retained percentage in the roots of cotton
which had been assay for 30 min and then for further hour following washing. pNPP (71uM) and 4-MUP (100 uM) were used as the substrates for cv Qalandri 94
4.9 Summary of statistical analyses of effects of different ages of cv Qalandri seedlings on PMEase activity 99
4.10 Effect of growth medium on PMEase activity (umol mg d. wt~l h~l) at pH 5.5, and phosphorus content in cv Qalnandri seedling roots (n = 4 , ± S D ) 101

12
4.11 Split root system of cv Qalandri seedlings PMEase activity (umol mg d. wt~l h"l) and phosphorus content (mg g~l d. wt) (n = 4, ± SD) 103
4.12 Summary of statistical analyses of PMEase activity in three cotton cultivars with range of pH, grown without and with phosphorus added to the growth medium 109
5.1 Phosphorus concentration (mg g~l d. wt) in cv seedlings grown without and with phosphorus added to the growth medium (n = 4, ± SD) and PMEase activity (umol mg d. w t ' l h~l) for root tissues using pNPP and 4-MUP as substrates 113
5 .2 Phosphorus, nitrogen, potassium and magnesiun contents of four different cultivars of cotton data is expressed as a % (n = 4, ± SD) 116
5 .3 Nitrogen concentration (mg g~l d. wt) in roots of different cultivars grown without and with added N to the growth medium (n = 4, ± SD) and PMEase activity (umol mg d. wt~l h~l) of root tissues 119
5.4 Potassium and phosphorus concentration (mg g~l d. wt) in different parts of cotton cv Qalandri seedlings grown without and with potassium added to the growth medium (n = 4, ± SD), and PMEase activity (umol mg d. wt"l h~l) of root tissues 124
5.5 Magnesium and phosphorus concentration (mg g"l d. wt) in different parts of cv Qalandri seedlings grown without and with magnesium added to the growth medium (n = 4, SD), and PMEase activity (umol mg d. wt~l h~l) of root tissues 125
5.6 Summary of statistical analyses for the plants grown without and with nitrogen added to the growth medium 132
5.7 Phosphorus content (mg g~l d. wt) and PMEase activity (umol mg d. wt-1 h-1) in root halves of a split root system. Cotton seedlings were grown without and with phosphorus added to the one half of the split root system (n = 4, ± SD) 134
6.1 Summary of statistical analyses for PMEase activity under salinity treatments 137
6.2 Effect of cations on PMEase activity (umol mg d. wt~l h"l) of cotton cv Qalandri seedlings grown without and with phosphorus added to the growth medium in the presence of Zn, Fe, Mn, Al, Ni. pNPP and 4-MUP were used as substrates (n = 4, ± SD) 138
6 .3 Effect of concentrations of various ions in the plant growth medium on PMEase activity (umol mg d. w t ' l h"*) of cv Qalandri seedlings grown without and with added phosphorus to the growth medium 4-MUP was used as substrate (n = 4, ± SD) 140
6.3 Contd. 141 7.1 Summary of statistical analyses of of PMEase of different plant
species grown without and with phosphorus added to the growth medium 148

13
L I S T OF FIGURES
1.1 The general formula for different phosphate esters 26 1.2 Reaction scheme for the enzyme 27 2.1 Cotton seedlings grown with and without phosphorus added to
the growth medium 41 2.2 Cotton seedlings grown without and with nitrogen added to the
growth medium 41 2.3 Cotton seedlings grown without and with potassium added to the
growth medium 42 2.4 Cotton seedlings grown without and with magnesium added to the
growth medium 42 3 .1 Map of Pakistan showing cotton growing areas 64 4.1 Influence of pH on PMEase activity of roots of cotton (cv Qalandri)
grown without and with phosphorus added to the growth medium pNPP used and 4-MUP used as substrates 78
4.2 Effect of phosphate on PMEase activity of cv Qalandri grown with different phosphorus concentrations added to the growth medium pNPP and 4-MUP used as substrates 79
4.3 Effect of concentrations of pNPP and 4-MUP substrates on PMEase activity of cv Qalandri grown without and with phosphorus added to the growth medium 84
4.4 Influence of incubation on PMEase activity of roots of (cv Qalandri) grown without and with phosphorus added to the growth medium pNPP used as substrate 85
4.5 Influence of incubation on PMEase activity of roots of (cv Qalandri) grown without and with phosphorus added to the growth medium 4-MUP used as substrate 86
4.6 Roots of cotton plants from growth conditions where phosphate were added or omitted stained with BCIP for 30 min 87
4 .7 Localization of PMEase activity in cell walls of cotton roots of plants grown without phosphorus added to the growth medium stained with BCIP. 87
4.8 Localization of PDEase activity in whole tissues of cotton roots of plants grown without phosphorus added to the growth medium stained with P-naphthyl phenyl phosphate 89
4.9 Effect of different temperatures on PMEase activity of roots of (cv Qalandri) grown without and with phosphorus added to the growth medium pNPP and 4-MUP used as substrates 90
4 .10 Effect of plant age on PMEase activity of roots of cotton (cv Qalandri) grown without and with phosphorus added to the growth medium pNPP used as asubstrate 97
4.11 Effect of plant age on PMEase activity of roots of (cv Qalandri) grown without and with phosphorus added to th growth medium 4-MUP used as a substrate 98

14
4 .12 Influence of pH on PMEase activity of roots of three cotton cultivars grown without and with phosphorus added to the growth medium pNPP used as substrate 106
4 .13 Influence of pH on PMEase activity of roots of three cotton cultivars grown without and with phosphorus added to the growth medium 4-MUP used as substrate 107
4.14 Influence of pH on PMEase and PDEase activity of roots of cv Qalandri grown without and with phosphorus added to the growth medium pNPP and bis-pNPP used as substrates 110
5.1 Influence of pH on PMEase activity of roots of three cotton cultivars grown without and with nitrogen added to the growth medium pNPP used as substrate 130
5 .2 Influence of pH on PMEase activity of three cotton cultivars grown without and with nitrogen added to the growth medium 4-MUP used as substrate 131
6.1 Effect of NaCl concentrations on PMEase activity of cv Qalandri grown without and with phosphorus added to the growth medium 136
7.1 Comparison of PMEase activity in different plant species grown without and with phosphorus added to the growth medium pNPP used as substrate 145
7 .2 Comparison of PMEase activity in different plant species grown without and with phosphorus added to the growth medium 4-MUP used as substrate 146
7 .3 Influence of pH on PMEase activity of Primula farinosa pNPP used as substrate 149
7.4 Influence of pH on PMEase activity of two strains of Stigeoclonium (565, 577) and one strain of Draparnaldia (653) pNPP and 4-MUP used as substrates. 150

15
CHAPTER 1 INTRODUCTION
1.1 General introduction Cotton {Gossypium sp.) is an important fibre crop. Prior to the introduction of
man-made artificial fibres, it was the only plant raw material from which human clothing
and other necessary textiles were manufactured. Cotton is generally a nutrient-demanding
crop and therefore the investment in time, resources and fertilizer to maintain it is high.
Phosphate supply is difficult and expensive to maintain with a reliance on importation
which accounts for approximately 70 % of the total expenditure on agriculture of Pakistan
(Salem et ah, 1986). Therefore, it is important to examine the ability of crops to produce
high yield with minimum fertilizer input.
This project was designed to look at phosphatase activity in cotton. In order to do
so, however, it is necessary to consider other plants eg. algae which are well-characterised
for their production of phosphatase in relation to phosphorus content.
1.2 Origin of cotton One of the most important areas for cotton production in Pakistan is Sindh
province. The Indus valley has been well known for its cotton fibre production for
hundreds of years. Santhanam and Hutchinson (1974) stated that herbaceum cotton was
domesticated from the Arabian and Balochistan race acerifolium, and that the Gossypium
arboreum was first brought into cultivation in Gujrat or Sindh. Fryxell (1979) stated that
the development of cotton textile appears to have taken place not in Africa but in the Indus
Valley in Sindh. Excavations of Moin-jo-Daro have shown that before 2700 BC cotton
was grown in the Indus valley, Sindh (Pakistan) (Gulati & Turner, 1928). The first

16
documented record of cotton production was during 1500 BC in the Hindu Rigveda.
Hutchinson et al. (1947) stated that it has only been selected by man as a source of raw
material for textiles. They concluded that the origin, as well as the distribution of
cultivated cotton, is intimately connected with the utilisation of its lint by man. The old
world cotton probably originated somewhere in the southern half of Africa and later spread
eastwards (Hutchinson, 1954).
1.21 Physiology of cotton Cotton is a plant located in the hotter regions of the earth. Like other green
plants, it needs high temperature, water, light and nutrients for efficient growth. The
cotton plant is more complex structurally than any other major field crop. Its yield is
limited drastically by the complex of insect pests and also it is highly responsive to
environmental factors in its growth, development and production. Cotton produces
vegetative and reproductive growth simultaneously over a relatively long period of time
(130-180 days). The plant has a vertical stem with two kinds of branches, called
monopodial and sympodial branches, in addition to a tap root system with lateral roots.
The simple leaves have short stalks and its seed is mostly pear-shaped and varies in size
according to variety and cultural conditions.
Thorp, (1960) considered that the optimum soil temperature for germination is
34°C. It has been observed that large seeds give a higher germination percentage as
compared to the small seeds (Balls, 1910). However, Rogers (1943) found that the light,
medium and heavy seeds did not show consistent differences in terms of the crop yield.
The flowering and fruiting behaviour of upland cotton (Gossypium hirsutum L.) is as a
day-length neutral plant. However, there are short-day cotton plants which develop only
vegetative branches during long days. Cotton plants are very sensitive to growing
temperatures: the minimum and maximum temperature has a great effect on plant

17
behaviour. Extreme temperatures also affect growth, with younger plants being more
susceptible, but more able to recover quickly. Humidity and age of the plant tissue are
important factors determining the cold injury response (McMichael & Powell, 1971).
In terms of cotton plant productivity a considerable proportion of assimilates are
utilized in the formation of the fruit and the seeds Gerik et al. (1994) found that the
accumulation d.wt for the root, stem, leaves, and bolls was 0.4, 12.2, 11.6 and 24.6 g
plant" 1 respectively. Bassett et al. (1970) working with cotton plants reported that the
distribution of dry matter in cotton plants was stem, 23.1%; leaves 17.4%; burs 16.3%;
seed 25.3% and lint 17.9%. However, soil type can have a marked effect on the specific
distribution percentages. Mullins and Burmerster (1990) stated that total dry matter
productions of 35% shoots, 18.5% leaves, 13.5% burs, 19% seed and 14% lint, was found
for plants in Decatur soil, copared with an average of 16% shoot, 14%, leaves, 18% burs,
30% seed and 22% lint for those from Norfolk soil.
1.22 Cotton roots The cotton plant has primarily a tap root system with many laterals called
secondary roots. A study of the root system is very important, because roots not only
anchor the plant firmly in the soil, but also absorb the nutrients from the soil for the
development of the plant. The tap root grows rapidly downwards at 2.5 cm d" 1 for
several weeks after planting (Bassett et al., 1970). The secondary roots grow close to the
surface of the soil and completely fill the soil area around the plant with a network of
lateral roots. These lateral roots run more or less horizontally, and constitute the bulk of
the feeding roots and are concentrated in the moist soil in order to absorb water or
nutrients. The size of the cotton plant root depends on the soil environment, viz. physical
texture, fertility, soil temperature. Soil moisture is a major factor affecting root growth

18
rates and distribution (Grimes & El-Zik, 1982). The depth of the root system depends
upon soil moisture, aerobic status conditions, soil pH and nutrient supply and availability.
1.3 Phosphorus in the environment L31 Introduction
Phosphorus is essential to plant growth and the eleventh most abundant element in
nature. The average concentration of phosphorus available in the environment is
estimated as 0.1% by weight, and it is thus classed as a macro-element, but the
concentration of phosphorus in the plant is usually lower than nitrogen, potassium and
calcium. Phosphorus is a necessary nutrient and is defined as a rate-limiting element, even
more important to plants than potassium or calcium. It mostly occurs in the oxidised
form, either as phosphates or organic phosphorus (P) compounds which can be divided
into following groups:
1. Orthophosphates
2. Polyphosphates (chain phosphates)
3. Metaphosphates (ring phosphates)
4. Ultraphosphates (branched ring phosphates)
Orthophosphates are generated from the weathering of rocks or from biological
metabolism or degradation. Polyphosphates and metaphosphates are produced by
biological activity. Orthophosphates and polyphosphates are frequently introduced into
water by man (Broberg & Persson, 1988). Rigler's (1973) classification of analytical
phosphorus fractions is given below.
Tot P = Total phosphorus
PP = Particulate phosphorus
SP = Soluble phosphorus
SRP = Soluble reactive phosphorus

19
SUP = Soluble unreactive phosphorus
Particulate P (colloidal P) is derived from five sources:
1. Cells of plants bacteria and animals;
2. Weathering products such as primary or secondary minerals;
3. Direct precipitation of inorganic P or adsorption into other precipitates;
4. Degradation and fragmentation of cells providing organic detritus;
5. Flocculation of organic macromolecules, resulting in larger sized aggregates;
Particulate organic P in aquatic ecosystems dominates total organic P, and its
significance has been comprehensively reviewed by Broberg and Persson, (1988). It is not
readily available to plants.
1.32 Phosphorus available in solution The phosphorus most commonly absorbed by plants is largely as the primary and
secondary orthophosphate ions (H2PO4' and HPO42-), which are present in the soil solution.
The amount of each depends largely on the soil solution pH. Many organisms have two
uptake systems for phosphate, one being "diffusive" and the other ' rapid", the latter occurs
when the internal phosphorus concentration is low and is presumably growth-limiting (Ducet et
al., 1977). Both these uptake systems need energy, but Whitton, (1967) observed colonies of
Nostoc which appeared to take up phosphorus passively when the external concentration was
very low. Many different substrates can be utilised as phosphorus sources by algae and
cyanobacteria (blue-green algae) which are capable of phosphatase activity (Livingstone et al.,
1983; Al-Mousawi, 1984; Mahasneh et al., 1990; Whitton et al., 1990; Islam & Whitton,
1992). Broberg (1985) showed that the availability of different phosphorus compounds to
algae is dependent on the algal enzyme pool, the phosphorus status of the algae, the
orthophosphate uptake rate, the nature of the phosphorus compounds and environmental
conditions.

20
1.33 Kinds of phosphorus in the soil Phosphorus in soils may be divided into two major categories, organic and
inorganic. The amounts of phosphorus in these categories varies widely. The extreme
values reported in the surface samples of soils (Ghani & Aleem, 1943) range from 3%
organic and 97% inorganic on the one hand, to 75% organic and 25% inorganic on the
other hand. The content of organic phosphorus in soils increases as the content of
nitrogen increases and as the pH decreases. Manchanda et al. (1982) observed that
fertilization with phosphate under saline conditions increased salt tolerance of barley and
wheat plants.
1.331 Inorganic phosphorus Most inorganic phosphorus occurs characteristically in the clay fraction, from
which it cannot be separated by physical methods. Inorganic phosphorus (Pi) may be
classified according to its physical, mineralogical or chemical nature, or a combination of
these. Only a fractional percentage of the total phosphorus in the environment is
concentrated in deposits consisting of mainly phosphate minerals (Brink, 1978).
Phosphate deposits may be classed into three broad apatite groups [Ca5 (PO4, 003)3 (F>
CI, OH)], apatite deposits of igneous and metamorphic origin, sedimentary phosphorites
and guano-related deposits. The inorganic phosphorus in soils is present principally as
calcium, iron, and aluminium complex deposits. Most phosphorus, possibly as much as
95%, occurs as fluoroapatite [CaioFe2(P04)6] which is a common, stable, accessory
mineral in most rock types. Fluoroapatite is normally present in concentrations of less
than 1% (McKelvey, 1973). The direct evidence regarding the nature of inorganic
compounds of phosphorus in soil has been obtained by microscopic examination of
individual grains from the sand and silt fractions. Apatite accounts for 95% or more of
the phosphorus in igneous rock. The ferrous phosphate, vivianite [Fe3(PO)4 8H2O] has

21
been found on occasion under conditions of poor drainage. Various indirect means have
been employed in investigating the nature of inorganic phosphorus in soils. Phosphorus is
eventually liberated from its so-called resistant minerals and through uptake by plants
enters the biosphere (Jansson et al., 1988). Work on the mineralogical aspects of this
subject was reviewed by Mason and Berggren (1941) who cited work on P-bearing zircon
[ZrSiC«4] in which PO4 groups substituted for as much as 25% of the normal complement
SiC»4 groups. Such phosphate groups are probably incorporated into the mineral during
crystallisation and occur scattered throughout the structure.
1.332 Organic phosphorus In the soil 15-85% of the total phosphorus is organic. With increasing soil depth
the organic phosphorus component declines. At the same time, the proportion of total
phosphorus that is in the organic form is greater at the surface than in subsurface horizons.
Organic phosphorus, which cannot be utilised directly by plants, is reliant on the role of
micro-organisms for its conversion to inorganic forms which can then be absorbed. By
their action, bacteria, fungi, and actinomycetes make the bound element in the remains of
the vegetation and in soil organic matter available to succeeding generations of plants.
The organic phosphorus entering a soil is largely derived from plant litter, though animal
remains and faeces may be important under heavy grazing conditions. The known groups
of organic phosphorus compounds in this material are inositol phosphates, phospholipids,
nucleic acids, nucleotides and sugar phosphates, but only inositol phosphate has been
detected, in quantity, in soil and even this may be of secondary micro-biological origin.
Nucleic acids are the major organic compounds which contain phosphorus in plants and
micro-organisms; Adam et al. (1954) reported the presence of these substances in the soil.
Cosgrove (1967) observed that organisms occur in the soil and rhizophere which are

22
capable of dephosphorylating all known organic phosphorus compounds of plant origin
and that plant roots may also have similar phosphatase activity at their surfaces.
Dissolved organic phosphorus (DOP) can be regarded as the more important
fraction, as it is readily available to the biota and is rapidly turned-over. Some pools of
DOP do not undergo rapid hydrolysis by phosphatases, and these compounds may
constitute a major part of the DOP pool. One such pool of DOP compounds are
nucleotides or polynucleotides. Phillips (1964) reported six DOP fractions from sea
water, three of which were identified as nucleotides or polynucleotides. Broberg and
Persson (1988) stated that up to 4.2% of the total P in bogs could be attributed to nucleic
acids. Minear (1972) noted that up to 50% of high molecular weight DOP excreted from
organisms was DNA or its fragments. Hino (1989) reported that 65% of DOP in lake
waters was composed of compounds between 300-1000 daltons molecular weight.
Addition of phosphodiesterases alone did not show phosphorus release from high
molecular weight DOP compounds, but a combination of phosphodiesterases and
phosphomonoesterases increased the amount of Pi released by 30% when compared to the
release of Pi by phosphomonoesterases alone.
1.4 Function of phosphorus in plants The concentration of inorganic phosphorus in plants is, of course, influenced by the
supply in the soil, and measurements of inorganic phosphorus in plant tissues are
sometimes made to provide an index of the supply of phosphorus in the soil. Phosphorus
plays a vital role in plants, it is absorbed from soil and remains in the oxidised state, and
occurs in both organic and inorganic forms as the central element of the phosphate group.
Inorganic phosphorus is usually determined in extracts obtained by treating plant tissue
with an acid such as trichloracetic acid that removes the orthophosphate present in the
solution or in a water-soluble form as well as the orthophosphate present in sparingly

23
soluble forms. Phosphorus is stored in seeds as phytin, the calcium or magnesium salt of
inositol hexaphosphoric acid. This compound is hydrolysed enzymatically during
germination, and the phosphate is thereby changed to the inorganic form, from which it is
used to develop the seedling. Phosphorus has a major function in plant metabolism as a
carrier of energy. The most important carrier of high energy phosphate is adenosine
triphosphate. Phosphorus is also an important component in photosynthesis, the initial
reaction of which is light energy trapping for the splitting of water, in the presence of
inorganic phosphate, adenosine diphosphate and the coenzyme nicotinamide adenine
dinucleotide phosphate, with the production of the reduced form of nicotinamide adenine
dinucleotide phosphate, adenosine triphosphate, and molecular oxygen.
1.41 Phosphorus content of cotton The phosphorus content of a plant not only varies with species, but changes with
variety and locality. Plant analysis is used as a diagnostic tool and as a guide in planning
crop production programmes. Plant analysis has been used to evaluate fertiliser practices
and to investigate problems of poor growth, it has a promising role in the assessment of
the adequacy of plant nutrient supply. It is therefore essential to understand the growth
and mineral uptake patterns of plant.
Environmental conditions have a definite influence on the rate of nutrient
absorption, hence different nutrient concentrations are found in plants with varying
environmental regimes. Olson and Bledsoe (1942) reported, for non-irrigated cotton, that
dry matter production rates within a given growing season was dependent on the location
of the plant. The cotton plant when growing upon a fertile soil develops its reproductive
tissue largely on the basis of a continued uptake of phosphorus with only minor exhaustion
of the phosphorus of the leaves and stem (Fiske & Subbarow, 1925). Mullins and
Burmester (1990) observed the phosphorus distribution in cotton plant averaged 11.7% in

24
shoots, 19.5% in leaves, 16.0% in burs and 52.8% in seed. Cotton seed has the highest
concentration of P at maturity (Nelson, 1980). Bhatt and Appukuttan (1971) investigated
nutrient uptake by bushy and short branch cotton varieties. The two varieties gave the
same cotton yield, but the short branch variety took up less N P K. The response of plants
to different external ion levels are, however, also due to the inherent growth rate potential
at the seedling stage and to the reserve pool of the element in the seeds (Chapin &
Bieleski, 1982). Schjorring and Pauljensen (1984) reported that the ratio between the
phosphorus concentration in shoots and roots increased with the P status of the seedlings
grown at low to intermediate external phosphorus levels, but decreased at higher
phosphorus levels.
Russell and Martin (1953) showed that the transfer of phosphorus to plant shoots
could be retarded either by a low initial phosphorus status in the plants or by low external
concentration increments in either the phosphorus status of the plants or in the external
concentration could increase upward movement.
Nayakekorala and Taylor (1990) reported that at all growth stages of cotton
plants, total phosphorus uptake from the upper soil layer was greater than that from the
lower soil layer. They further observed that phosphorus flux from either layer was greater
during early growth stages than during later stages. A significant decrease in phosphorus
flux occurred when plant reached the flowering stage.
Cotton requires higher culture-solution concentrations of phosphorus than other
plants. The minimum inorganic phosphate concentration for optimum plant growth in
nutrient solution was found to be between 3 and 13 uM (Asher & Edwards, 1983).
Interaction also occurs between phosphate and other ions within the soil. Award et
al. (1990) stated that increasing the inorganic phosphate content of the growth medium
from 1 to 10 uM increased the growth of tomato plants grown in 100 mM NaCl.
Martinez and Lauchi (1991) studying the short term effects of salinity (150 mM NaCl) on
phosphorus translocation in cotton plants raised in the nutrient solution, reported that

25
salinity inhibited phosphorus translocation from root to shoot. This inhibition was more
evident at higher Pi concentrations in the root medium. Increasing Pi by 33-fold in the
solution resulted in a 4.3-fold increase in phosphorus in the root under saline conditions,
but only in a 1 8-fold increase in the shoot. In older shoot tissue total phosphorus was
elevated in the salinized plants. Salinity decreased phosphorus recirculation from the
cotyledons to the young leaf of cotton seedlings (Martinz & Lauchi, 1991). Salinity is a
threat to oilseed crops in areas with poor quality underground water, as the only source of
irrigation. Seedling emergence in saline conditions has been reviewed by Creda et al.
(1977). Tolerance of salt at emergence and early growth stages are considered desirable
traits in crop production programmes on problem soils (Norlyn & Epstein, 1984).
Marschner and Ismail (1986) reported that with Zn-deficiency the pH of the
nutrient solution decreased from 6.0 to 5.0 and Zn-sufficient cotton plants raised the pH of
the nutrient solution to about 7.0. Phosphorus uptake rate in Zn-deficient plants was
increased by a factor of 2 to 3, whereas the uptake rates of potassium, calcium, and
particularly NO3 decreased (Christensen & Jackson, 1981). Longeragan et al. (1982)
noted that the enhanced phosphorus uptake can induce phosphorus toxicity in older leaves
when phosphorus supplies are relatively high. Christensen and Jackson (1981) stated that
in Zn-deficient plants the uptake and translocation of phosphorus from roots to shoots is
enhanced considerably.
1.5 Phosphatases Phosphatases are enzymes which promote the degradation of a wide variety of
complex phosphorus compounds into orthophosphate (Pi) and an organic moiety (Jansson
et al., 1988). Phosphatases have an essential role and function in the nutrient dynamics of
the environment. The term phosphatase is often used for the enzyme which catalyses the

26
hydrolysis of both esters and hydrates of phosphoric acid and is used synonymously with
phosphomonoesterases, abbreviated to PMEase (Flynn et al., 1986). Similar, but
functionally different, enzymes are the phosphodiesterases, abbreviated PDEase which
hydrolyse a range of compounds including the nucleases.
1.51 Formula of phosphate esters The general formula for different phosphate esters are given below,
Fig. 1.1
0 0 0 I I I I I I
R - 0 - P - 0 H R - O - P - 0 — R' R - O - P — 0 - R ' 1 I I 0 0 0 H H |
R"
PHOSPHOMONOESTER PHOSPHODE5STER PHOSPHOTRTESTER
R denotes the organic part of the phosphate esters. Based on McComb et al. (1979)
reported that phosphatases may be involved in metabolic processes other than
hydrolysis, for example in transport of substances across membranes and
synthesis of new organic phosphates. The most common catalytic breakdown is by
phosphomonoesterase (PMEase). The reaction mechanism is divided into four
steps (McComb et al., 1979).
1. Non-covalent binding of the substrate to the enzyme.
2. Alcohol release from the complex and Pi becomes covalently bound to the enzyme
forming a phosphoryl-enzyme compound.
3. Conversion of the phosphoryl enzyme compound through uptake of water, to a

27
non-covalent complex.
4. Release of Pi and regeneration of free enzyme.
Any of the steps 2-3 can be rate-limiting for all of the reaction (McComb et al.,
1979). Reaction schemes for the enzyme catalysis of phosphate esters as described by
McComb et al. (1979).
Fig. 1.2 Reaction scheme for the enzyme described by McComb et al. (1979)
°\ © \ / © EH + R - 0 - P = 0=^=EH • P = 0 —
I I 0_ 0_
E - P = 0 + R - O H I 0.
I ( D H 0 \ / ° © l E—P = 0 + H 20=^=EH • p = 0 — E H + H 0 - P = 0
I I I 0. o . o .
1.52 Sources of phosphatases 1.521 Introduction
Phosphatases have been observed in bacteria, algae, bryophytes and higher plants
(Siuda, 1984; Press & Lee, 1983).

28
Acid phosphatases are enzymes of wide specificity which cleave phosphate ester
bonds and, thus, play an important role in the mineralization of organic P in the
environment, where their activity may be correlated with a low level of free inorganic ions
(Spiers & McGill, 1979; Appiah & Thomas, 1982). Acid phosphatases generally have
their optimum between pH 4.0-6.0.
1.522 Bacterial phosphatase activity Bacteria are one of the most important contributors to environmental phosphatase
activity. A large number of workers have concentrated on PMEase in hetrotrophic
bacteria, with most research on PMEase structure and function in E. coli (McComb et al.,
1979). PMEase activity in freshwater hetrotrophic bacteria has been demonstrated in lake
waters (Jones, 1972; Chrost etal, 1984).
1.523 Algal and cyanobacterial phosphatase activity Phosphatase activity has been observed in many species of cyanobacteria (blue-
green algae) and algae, though not universally (Healey, 1982). Frequently, the
phosphatase activity has been observed in cultured cyanobacteria and algae (Healey, 1973;
Doonan & Jensen, 1980; Flynn et al., 1986; Grainger et al., 1989; Whitton et al., 1990,
1991; Islam & Whitton, 1992). Phosphatase activity has been located on the cell surface
and in cell membranes (Moller et al., 1975; Flynn et al., 1986). It has been reported that
the extracellular enzyme is released into the algal culture (Wynne, 1981; Siuda, 1984;
Grainger et al., 1989; Whitton et al., 1990, 1991; Islam & Whitton, 1992).
Algae have been used as assay organisms in a number of studies and, whatever
species are used, the assay techniques are similar in theory. It has been reported that algal
species could be used as indicators of clean or polluted water and lists of indicator

29
assemblages have been produced (Palmer, 1959). Whitton (1984) reported that chemical
analyses of algal material could give an integrated picture of pollution and could also give
a better indication of the chemical fraction likely to affect the ecosystem than chemical
water analyses. The presence of Stigeoclonium has often been taken as indicative of
organic pollution (De Vries and Kamphof, 1984). It has been also reported that
Stigeoclonium occurs in many unpolluted and heavy metal polluted waters (McLean,
1974).
Disan et al. (1990) reported that a strain of Calothrix viguieh isolated originally
from the surface of a mangrove root, showed marked morphological and physiological
responses to the salinity of the medium when grown to phosphorus limitation in a fresh
water medium, each trichome ended in a long hair and the culture showed marked cell-
bound phosphomonoestrase and phosphodiestrase activities when grown with various
phosphorus sources (inorganic & organic) to phosphorus limitation in medium including
5.6 g 1 - 1 NaCl, hairs were absent, phosphomonoestrase activity was much lower and
phosphodiestrase activity absent. With five of the seven organic phosphorus sources
tested the yield was also lower in saline medium. Reduction of NaCl concentration led to
development of hairs, whereas increase in NaCl led to the hairs being shed.
1.524 Phosphatase activity in higher plants Enzymatic activity in root soil interfaces maintains soil fertility through complex
bio-chemical processes. In the majority of the soils, organic phosphorus to the extent of
30-80 % of the total phosphorus has to be hydrolysed by phosphatase enzymes to convert
it into available forms. Production and distribution of the enzyme by different crops in
mineral and organic soils (Chhonkar & Tarafdar, 1984) and also in arid soils has been
assessed (Tarafdar et al., 1988). Increased microbial and root activity may have
accounted for higher enzyme activity, including phosphatase (Tarafdar & Chhonnkar,

30
1978). Kumar and Tarafdar (1989) reported that acid and alkaline phosphatase activity in
the rhizospheres of sunflower was many time higher on saline than on control soils.
It has been reported that most plants are rich in non-specific and specific acid
phosphatases, but do not contain any appreciable alkaline phosphatase activities (McComb
et al., 1979; Lee, 1988). It has been observed that many plant tissues contain acid
phosphatase activity, including plant roots. The activity is localised in apical meristems
and outer surface cells (Esterman & McLaren, 1961; McLaren & Gahan, 1970; Shaykh &
Roberts, 1974). Phosphatase activity appears in media in which cells of higher plants have
been grown (Yamaoka et al., 1969).
McLean and Gahan (1970) reported that the hydrolase activities present in the root
cap may help in the breakdown of intracellular material, thereby loosening the cells. In
wheat, comparison of root and leaf phosphatase activity in plants grown in nutrient
solution showed that leaf phosphatase was not necessarily a better measure of phosphorus
status of the growing plants than root phosphatase (McLachlan & DeMarco, 1982).
Besford (1979a) observed acid phosphatase activity in seven plant species, including wheat
in sand culture. Besford (1979b) further suggested that it may be possible to use this
enzyme as an indicator of P-limitation in all the crops tested, except dwarf rice. It has
been reported that acid phosphatase which was secreted by tomato root and suspension
cultured cells, increased under P-limitation (Goldstein et al., 1988). Plant root
phosphatase may be involved in the mineralization of organic phosphorus present in the
soil or in added organic material (Chang & Bundurski, 1964). The amount of organic
phosphorus hydrolysed by clover root phosphatases surpassed the amount of phosphorus
taken up by the plant by a factor of 20 (Tarafdar & Claassen, 1988).

31
1.525 Phosphatase activity of plants grown under conditions of phosphate limitation
When a plant is grown in a P-deficient substrate the intracellular and cell wall
phosphatase activities increase as the tissue phosphorus concentration decreases (Bieleski,
1973). Surface phosphatase activity increases in phosphorus-deficient plants (Boutin et
al., 1981; McLachlan & DeMarco, 1982; Dracup et al., 1984). Besford (1979)
interpreted a strong relationship between the intracellular phosphatase activity and the
phosphorus status of the tomato leaf and suggested that the enzyme activity could be used
for an early detection of P-deficiency in tomato plants. P-deficiency causes a 4-12 fold
increase in phosphatase activity in at least four lower organisms; Escherichia coli
(Torriani, 1960), Saccharomyces (Suomalainan et al., 1960), Euglena gracilis (Blum,
1965), and Neurospora crassa (Nye, 1967). Reid and Bieleski (1970) reported that P-
deficiency caused a 10-50 fold increase in phosphatase activity and the appearance of a
new isoenzyme in the higher plant Spirodela oligorrhiza. The phosphatase activity of cell
walls from Agrostis tenuis was two-fold higher when plants were grown with 1.0 | i M
phosphate than when plants were grown with 100 uM phosphate (Wool house, 1969).
Strother (1980) observed that the increased phosphatase activity in P-deficiency is possibly
a response favouring phosphate homeostasis. Acid phosphatase activity of the intact
roots of the young plants is influenced by the phosphorus status of the growth medium
(Bieleski, 1973). Kummerova (1986) stated that starvation induced an increase in the
activity of phosphatases on the root surface of Zea mays and that this enhancement was
especially pronounced in new roots. McLachlan (1976) noted that increases in inorganic
phosphorus in the resulting medium reduced the phosphatase activity of the plant roots.
Most of the acid phosphatase activity was noted at the surface of wheat roots (Ridge &
Rovira, 1971). Besford (1979b) observed that soluble phosphatase activities also
increased with P-deficiency in the leaves of wheat. P-deficiency in higher plants has been
shown to increase the activity of acid phosphatase in homogenised leaves (Besford,

32
1978a). Phosphatase activities were influenced by water deficit and leaf age as well as by
P-deficiency (Barrett-Lennard et al., 1982). Dracup et al. (1984) suggested that increased
phosphatase activity was localised in P-deficient clover root cell walls.
1.526 Influence of pH on phosphatase activity Jansson et al. (1988) stated that phosphatases typically have maximum hydrolysing
capacity at different pH values. The enzymes can be catagorised as alkaline and acid
phosphatase. It has been reported that the optimum pH measured for Eriophorum
vaginatum at pH 3.5-4.0 is lower than that reported for other plants e.g. between 5.0 and
6.0 for wheat root surface phosphatases (McLachlan, 1980) and between 4.5 and 5 .0 for
Aegilops roots from soil of pH 7.4-7.6 (Silberbush et al., 1981), and clover (Dracup et al.,
1984). The pH optimum for alkaline phosphatase activity has been shown to vary with
the substrate concentration, the type of substrate (Walker & King, 1950), and the buffer
employed (Zittle & Delia, 1950). Since it has been shown that the pH optimum can be
reduced from a non-physiological to physiological pH, it is logical to assume that there is
optimum alkaline phosphatase activity in vivo. It may be that the pH optima of other
enzymes change with variation in substrate concentration e.g. urease (Howell & Summer,
1934).
High pH values have been found necessary for optimum activity of alkaline
phosphatase in vivo. The pH values in the living cell structures on the other hand are near
neutral. McComb et al. (1979) reported that factors affecting phosphatase activity are
temperature, ionic strength, pH and metal ions. Jansson et al. (1988) observed that
external lake water phosphatases mostly have pH optima in the alkaline region.
Acid phosphatases generally seem to be active in the internal cell metabolism.

33
Ross et al. (1951) noted that as the concentrations of the substrates were lowered the pH
optima for alkaline phosphatase activity were found to be nearer neutral pH values.
1.527 Effect of ions and phosphatase Metal ions inhibit enzyme reactions by complexing the substrate, combining with
the active groups of enzymes or by acting with the enzyme substrate complex. Inhibition
also depends on the nature and size of the ions (Alverez, 1962). Juma and Tabatabai
(1988) reported that acid phosphatase activity in higher plant roots of maize and soybean
is inhibited by metal ions. The inhibition of the acid phosphatase in plants by metal ions
revealed that Zn (II) and W (VI) have little effect on acid phosphatase activity in maize
roots, but these ions inhibited activity in soybean roots by 25% and 62%, respectively
(Juma & Tabatabai, 1988). Hasegawa et al (1976) reported that Hg (II), Cu (II), Fe
(III) , Zn (II) and Co (II) inhibited acid phosphatase activity of wheat roots by 100, 82, 82,
46, and 31% respectively. Willett and Batey (1977) noted that in serpentine-tolerant
strains of Festuca rubra the activity of these enzymes in vivo was affected differently by
external Ca^ + concentration, but not by Mg2+ or N i ^ + , which are considered among the
factors responsible for serpentine toxicity.
Johnston and Proctor (1984) observed that when root surface phosphatases of a
serpentine and non-serpentine clones of F. rubra were assayed under a range of ionic
concentrations, based on those in the soil solutions, they were found to be altered. Meikle
Kilrannoch serpentine clones showed greatest activity in culture solutions which had high
concentrations of magnesium and nickel, similar to that in the soil. The phosphatase from
the non-serpentine clone was partially inhibited in the same culture solution.

34
1.6 Staining methods for phosphatase Siuda (1984) observed that the enzyme activity was extracellular and cell-bound in
some organisms. Moller et al. (1975) noted acid phosphatase activity in the cytoplasmic
fraction of marine diatoms. Wynne (1977) suggested that acid phosphatase activity was
located within cells of Peridinium cinctum. Jansson et al. (1981) found four different acid
phosphatases on the basis of their molecular weights. Siuda (1984) has suggested that
acid phosphatases are located within the cells (cellular) rather than in contact with the
surrounding medium. The acid phosphatase synthesis generally is not inhibited by Pi and
acid phosphatases are probably constitutive enzymes produced for internal P metabolism
(Jansson et al., 1988).
Histochemical studies of root apices have been concerned primarily with the
distribution of enzymes in the tissues of different roots (Benes & Opatrna, 1964;
McClurkin & McClurkin, 1967; Hall 1969; McLean & Gahan, 1970; Ashford & McCully,
1970; Benes, 1971; Hall & Davie, 1971 & Onofeghara, 1972). It has been found that
phosphatase activity in some microorganisms increases as a result of phosphorus
deficiency (Torriani, 1960; Price, 1962; Blume, 1965; Nye, 1967). This enhanced
phosphatase activity appears to be located in the cell wall whereas most of the activity in
cells adequate in phosphorus is located only at particular sites in the cytoplasm (Weimberg
& Orton, 1964; Sommer & Blum, 1965). Reid (1968) stated that when sections were
stained to locate phosphatase much of the activity in P-deficient tissue appeared to be
localised in the epidermis. An unspecified amount of acid phosphatase activity is
associated with epidermal cells of many plant roots (Shaykh & Roberts, 1974). DeJong
(1965) found that the bulk of the phosphatase activity in onion roots was located in the
intracellular spaces between the epidermis and the hypodermis.

35
Bieleski and Johnson (1972) reported that specific staining showed phosphatase in
control plants of Spirodela oligorrhiza was located primarily in and around the vascular
strands; in P-deficient plants it was located in the epidermis of the root and under surface
of the frond. Localisation of PMEase activity was carried out using-5-bromo-4-chloro-3-
indolyl phosphate (BCJJP) as an organic phosphorus substrate (Coston & Holt, 1958; Holt
& Withers, 1958). All plants showed high activity in the meristematic zone. This is
associated with the root cap cells (Jensen, 1956; Gahan & Maple, 1966; Benes & Opatrna,
1964).
1.7 Nitrogen 1.71 Nitrogen in cotton plants.
Nitrogen is one of the essential macroelements which is of high importance for the
growth of plants and crop production, and deficiency can occur in crops unless nitrogen is
applied as a fertilizer.
In cotton Gerik et al., (1994) reported that nitrogen content of the root, leaf, stem,
and boll were 0.008, 0.023, 0.141, 0.213 g N plant' 1, respectively. Mullis and Burmester
(1990) observed that the distribution of nitrogen as 15 .9% stem, 27.6% leaves, 14% burs
and 42.4% seed. Bassett et al. (1970) noted that crops of mature cotton plants contained
142 kg N , 19 kg P, and 127 kg K ha"1, they further reported that about 70 kg N , 11 kg P,
and 21 kg K ha - 1 were contained in the seed.
1.711 Inorganic combination of nitrogen In inorganic combined form, nitrogen occurs in soils as nitrous oxide (N2O), nitric
oxide (NO), nitrogen dioxide (NO2), ammonia (NH3), ammonium (NH + 4), and nitrate
(NO"3). The first four of these forms are gases and the last two are ionic forms found in

36
the soil solution. Nitrite and nitrate occur exclusively, or almost exclusively, as freely
diffusible ions in the soil solution. Most of the ammonium occurs in exchangeable and
nonexchangeable forms. Only a little nitrogen occurs in an ionic form in the soil solution.
Ordinarily, the ammonium is exchangeable with soil-solution forms. The nitrite and
nitrate collectively constitute less than 2% of the total nitrogen in soil, however, these
forms are of great qualitative importance, because they are the forms used by plants.
1.712 Organic combination of nitrogen The organic nitrogen added to soil in plant and animal residues is largely
proteinaceous in nature. The microbial attack to which these materials are subjected in
soils probably results in nearly complete disappearance of the original protein and its
partial replacement by microbial protein, with the remainder of the nitrogen being changed
to inorganic or elemental forms. Protein certainly exist in soil, but the only isolation of
protein that appears to have been accomplished is the separation and crystalization of a
mixture of subtances having urease activity (Briggs & Segal, 1963).
1.72 Function of nitrogen in plants As well as its fundamental role as a component of protein, nitrogen and its
metabolism within a plant are also related very closly with phosphate metabolism and it is
likely that factors having an effect on one can alter the other.
1.8 Effect of salinity on higher plants One of the major problems in the cotton growing regions of Pakistan is the
increased levels of salts which can affect yield. The effects of salinity on cotton are similar

37
to those reported from studies on other species of higher plants. Javed et al. (1993)
reported that the number of nodules per plant, nodule weight and nodule size of Cicer
arietinum plants decreased with increasing salinity levels. Javed et al. (1993) compared
growth, seed yield and nodulation of Cicer arietinum at 0, 0.1, 0.2, 0.4, 0.8, 1.2, 1.6 and
2.0 % levels of salinity in sandy clay loam. Fresh weight of shoots and roots after 8, 12,
and 15 weeks salinity treatment generally decreased with increasing salinity levels.
Compared to vegetative growth, reproductive growth was more affected since pods were
formed up to 0.4 % NaCl levels, whereas, seeds were formed at NaCl level of up to 0.1 %
only. Saline soils are common in the regions of arid and semi-arid climate where transport
of soluble salts to the ocean does not occur because of low rainfall (Eaglesham &
Ayanaba, 1984). Gobar et al. (1975) observed that the saline decline in seed cotton yield
due to salinity was generally minimised through the applications of nitrogen fertiliser at the
relatively moderate salinization conditions (compensation effect), but a reverse trend was
noticed at the high salinity.
Microbial activity in saline soils plays an important role in the amelioration of salt
affected soils (Malik, 1978). Mirza and Tariq (1992) compared growth and nodulation of
Sesbania sesban at eight levels (0-2.0 %) of NaCl salinity in sandy clay loam soil. Dry
weight of shoots and roots and numbers of nodules per plant decreased with increasing
salinity levels. Nodule dry weight, however, increased at low levels of salinity (0.1 % &
0.2 % NaCl) and decreased at higher levels. Yousef and Sprent (1983) grew Vicia faba
under salt stress and found that the number of nodules per plant decreased that was
partially compensated by producing larger nodules. Kurth et al. (1986) observed in
hydroponically grown cotton seedlings, both length and weight of the primary root were
enhanced by moderate salinity (25-100 millimolar NaCl) in the presence of 10 millimolar
calcium, but the roots became thinner.

38
1.9 Aims The main aims of the project were
1. To investigate the potential of cotton roots to hydrolyse and use organic phosphates in
their environment through phosphatase activity.
2. To characterise those conditions of phosphate nutrition which influence the production
of phosphatase.
3. To localise phosphatase activity within the root system in relation to altered phosphate
nutrition.
4. To investigate different cotton cultivars for their capacity to produce phosphatase, in
order to assess their suitability for growing in inorganic phosphate-poor soils.
5. To investigate some aspects of the influence of selected soil environmental factors on
phosphatase activity and to relate these to conditions in cotton growing areas of Pakistan.

39
CHAPTER 2 MATERIAL AND METHODS
2.1 Plant material Cotton cultivars used were Qalandri, Rehmani, Reshami, TH 3/83. Whilst these
are all modern cultivars the chronological order of origin and derivations are as follows:
1. Qalandri = (G. hirsutum var M4 x G. anomalum) x G barbadense var Karnak.
2. Rehmani = G. hirsutum 21 x McNair TH-14920.
3. Reshami = Coker 100 A x Latifi (H-61-29).
4. TH-3/83 = H-59-1 (Qalandri) x Acala-1517.
5 Wheat (Triticum aestivum) cv Jauhar = Nayab NF 600 RAD
6 Rice (Oriza sativa) cv Chota Bawalia
2.2 Seed origin and treatment The seeds of cotton were obtained from Cotton Section Agriculture Research
Institute Sindh and prior to use were stored dry in the dark at 20 °C. Healthy, viable
seeds of cotton were surface sterilised by treatment with 5% sodium hypochlorite solution
for 10 minutes. The seeds were then washed 6 times in distilled water to remove traces of
the chemical. The seeds were planted on vermiculite in small plastic trays and incubated
at 25°C, with 100% relative humidity in continuous darkness under automatic water
sprinklers until germination took place, usually after 5 days.
It was observed that the germination ability of the cultivars were different. The most
efficient was Qalandri followed by Reshami, TH-3/83 and Rehmani. This may reflect a
real difference in the physiology of the different cultivars or may mainly have been due to a
differential effect of storage conditions.

40
2.3 Plant growth conditions After germination, uniform cotton seedlings were selected and were grown on in
honey jars. Seedlings were inserted through holes in the plastic lids as shown in Fig 2.1
The jars, containing water initially, were kept at the 25°C growth room temperature with a
16-h photoperiod, light flux was 100 (.imol photon m'2 s"1 PAR, supplied by banks of
Phillips Warm White fluorescent tubes. Dark period temperatures were ambient, usually
around 15°C. After two days the seedlings had adjusted to the culture conditions and
were transferred to aerated Hoagland solution culture (Table 2.1). For various treatments
plants were grown in modified media, Figs. 2.2, 2.3 and 2.4.
Table 2.1 Composition of mineral salts in Hoagland growth medium used to raise cotton
plants.
Salt Concentration
KC1 1.02 g l " 1
Ca(N0 3 ) 2 0.492 "
N H 4 H 2 P 0 4 0.23 "
M g S 0 4 7 H 2 0 0.49 "
H3BO3 2.86 mg l " 1
MnCl2.4H 20 1.81 "
CuS0 4 .5H 2 0 0.08 "
ZnS0 4 . 7H 2 0 0.22 "
H2M0O4.H2O 0.09 "

41
•
Fig. 2.1 Cotton seedlings grown with and without phosphorus added to the growth medium (left +P, right -P)
•
•
Fig. 2.2 Cotton seedlings grown without and with nitrogen added to the growth medium (left -N, right +N)

Fig. 2.3 Cotton seedlings grown without and with potassium added to the growth medium (left -K, right +K)
I Fig. 2.4 Cotton seedlings grown without and with magnesium added to the growth medium (left -Mg, right +Mg)

43
Eight seedlings were placed in each honey jar, containing 500 ml nutrient solution
The pH of the solution was adjusted to pH 6.0 using sodium hydroxide. The glass honey
jars were wrapped with aluminium foil to exclude the light from the roots of the plants and
to prevent growth of algae. The nutrient solution was changed weekly. Plants were
harvested for experimental purposes as required. In most of the experiments plants grown
for 19 days in the honey jar culture system were used. For experimental treatment
purposes the nutrient solution was replaced with one of specific composition. For P-
limitation, Hoagland solution was modified by omitting NH4H2PO4 and replaced it with
NH4CI, Fig 2.1.
Light measurements were taken with a Macam Q 101 light meter (Macam Photometries
Ltd., Scotland). All incident light was measured as photosynthetically active radiation
(PAR). The readings were recorded as photon flux density (|xmol photon m"2 s"*).
2.31 Split root experiments For the split root experiments seedlings were maintained in honey jar cultivation,
using water only, for two days after germination. The water was then replaced with
culture solution without added phosphorus. After six days secondary roots developed and
at this stage the seedlings were used for further treatments.
Seedlings were taken and arranged so that each half of the complete root system
was immersed in culture solution in individual glass tubes supported side by side. In this
way each half of the root system could be treated as a separate unit by manipulation of the
culture solutions. Seedlings were grown on with one set of roots in solution with added
phosphorus and the other without added phosphorus. After fourteen days of growth the
two sets of roots were harvested individually and used for phosphatase activity as
described later.

44
2.4 Common laboratory procedures adopted 2.41 pH
All pH measurements were carried out using an Ingold Combination WTW E50
Electrode and EEL Meter (model 7050). The probe was calibrated with BDH standard
buffer solutions, prepared in MilliQ water. Immediately before a measurement was taken
the pH meter was calibrated using buffer solutions, one higher and another lower than the
pH of the solution required. The standard buffer solutions were used at room
temperature.
2.42 Weighing Measurements were carried out on Electronic ER-182 A Balance (A & D
Company Limited Japan).
2.43 Root dry weight After recording the phosphatase data roots were washed with distilled water,
blotted dry and transferred to (5 x 2 cm) glass vials. The vials were put in the oven at 105
°C overnight and then cooled in the desiccator for at least 30 min before recording the dry
weight. Dry weights were used to convert the calorimetric readings to a weight basis
(umol mg-1 d. wt) and depending on the incubation time used, the above value is
converted into rate of enzyme activity per hour (umol mg-1 d. wt h"l).
2.44 Cleaning of apparatus All the glassware was washed in tap water containing 2% Decon phosphate-free
detergent (Decon Laboratories Ltd., England) for 12 h and then rinsed six times in distilled

45
water. All the volumetric glassware was dried at room temperature, plastics were dried at
40°C. Universal and snap-top bottles were dried in an oven at 105°C. The plastic
cuvettes were washed three time in tap water and rinsed six times in distilled water.
2.5 Phosphatase assays 2.51 Preparation of plant materials
The secondary healthy, clean and white roots were excised 0.5 cm below the
hypocotyl from the seedlings for the assay. The roots from different seedlings were
bulked and washed four times thoroughly in assay medium to remove contaminants. The
roots were then separated into bunches of equivalent size for addition to assay bottles and
were kept in dishes of assay medium until required.
In the preliminary experiments roots of Primulas were treated and prepared in the same
way.
2.511 Algae Two species of algae (1) Stigeoclonium and (2) Draparnaldia were chosen for
preliminary study. Each species required individual treatment. The material was
harvested using a silicon rubber tube on a glass rod to remove the culture from the walls of
the conical flask. Specimens were centrifuged at 8000 x g for 10 min and washed with
assay medium. They were then harvested again by centrifugation. The material was
suspended in a small amount of assay medium and homogenized with a Virtis 45
homogeniser. For the homogenisation there was no standard fixed time, for the different
cultures, therefore, separate timings were noted for each culture until a uniform fine
suspension was obtained. After homogenisation a simple assay was carried out to check
how much material was needed. Assay medium was then added to the homogenised

46
material up to the required quantity. The assays were terminated by removing the
organism by filtration and then the terminator was added to the filtrate. The 30-40 ml of
diluted organism was taken for dry weight determination.
2.52 Stock solutions All salts were from BDH Analar grade stock and were prepared in MilliQ water
and then kept in the refrigerator at 4.0°C until required. The stock solutions were
renewed every 3 months.
2.53 Assay medium The assay media were made up from stock solutions which were prepared and
stored in a refrigerator, the dilution of the stock solution was made using Milli-Q water.
The media were used for up to one week before being discarded.

Table 2.2 Concentrations of mineral salts used in assay medium of modified CHU 10-D
(1942)
Stocks g l " 1 Volume ml"l Saltmgl" 1 umoles 1
NaHC0 3 15.85 1.0 15.85 188.60
C a C l 2 2 H 2 0 35.83 1.0 35.83 243.70
MgS0 4 . 7H 2 0 25.0 1.0 25.0 101.43
KC1 4.28 0.5 2.14 28.70
FeEDTA stock 0.125
FeCl 3 .6H 2 0 9.70 1.21 4.28
Na 2EDTA 13.35 1.67 4.78
Microelement stock 0.25
MnCl 2 . 2H 2 0 0.181 0.045 0.23
ZnS0 4 .7H 2 0 0.222 0.056 0.19
C u S 0 4 5 H 2 0 0.079 0.020 0.08
CoS0 4 .7H 2 0 0.042 0.011 0.039
H3BO3 2.86 0.715 11.56
NaMo0 4 0.027 0.0068 0.028

48
Table 2.3 Elemental concentrations in assay medium
Element mg 1"1 uM
Ca 9.78 244.01
Na 4.45 193.59
Mg 2.47 101.63
S 3.26 101.67
K 1.12 28.64
EDTA 1.56 4.78
Fe 0.25 4.48
B 0.125 11.56
Zn 0.013 0.199
Mn 0.012 0.218
Cu 0.005 0.079
Mo 0.003 0.031
Co 0.002 0.034
For the preparation of one litre of assay medium 1 ml NaHCC<3, 1 ml MgSC«4.7H20, 1 ml
CaCl2.2H 20, 0.5 ml KC1, 0.25 ml Fe EDTA and 0.125 ml of micro nutrient low Mn+N
were added to a volumetric flask, then the final volume was made up to one litre with
Milli-Q water. Trace elements were used as chelating agents in order to prevent the
precipitation of iron in the medium.

49
2.531 Assay buffers
All the chemicals used in the buffer solution were obtained from British Drug
House Ltd (BDH), except HEPES and CAPS which were supplied by Sigma Co, USA.
Buffers were prepared in the Chu 10-D assay medium to a final concentration of 50 raM
and were stored in the refrigerator at 4°C until required, the buffer solutions were made up
fresh every three months.
Table 2.4 Buffers used to determine the effect of pH on phosphatase activity
pH Buffer Buffering capacity pka at. 20°C
3.0 DMG-NaOH 3.0-7.6 3.66 and 6.20
3.5 DMG-NaOH 3.0-7.6 3.66 and 6.20
4.0 DMG-NaOH 3.0-7.6 3.66 and 6.20
4.5 DMG-NaOH 3.0-7.6 3.66 and 6.20
5.0 DMG-NaOH 3.0-7.6 3.66 and 6.20
5.5 DMG-NaOH 3.0-7.6 3.66 and 6.20
6.0 DMG-NaOH 3.0-7.6 3.66 and 6.20
6.5 DMG-NaOH 3.0-7.6 3.66 and 6.20
7.0 HEPES-NaOH 6.8-8.2 7.50
8.0 HEPES-NaOH 6.8-8.2 7.50
9.0 Glycine-NaOH 8.6-10.6 9.60
10.0 Glycine-NaOH 8.6-10.6 9.60
11.0 CAPS-NaOH 9.8-11.1 10.40

50
2.54 Substrates
Phosphatase activity was assayed using three different substrates in order to
investigate a wide range of enzyme activity (Table 2.4).
Table 2.S Substrates used for assaying phosphatase activity.
Reagent Supplier
p-nitrophenyl phosphate disodium (pNPP)
bis p-nitrophenyl phosphate sodium salt (bis pNPP)
4-Methylumbelliferyl phosphate (MUP)
It was intended that a direct comparison should be made between pNPP and 4-
MUP as suitable substrates for phosphatase assays. However, the calculated
concentration of pNPP was based on the molecular weight of the chemical where no
account was made for water of crystalization. Consequenctly the pNPP and 4-MUP
concentrations are not directly comparible; the standard concentrations used were 71 uM
as a corrected value of pNPP, and 100 uM for MUP.
2.55 Assay conditions
All experimental containers required for the experiment were oven dried at 105°C
before initiating the experiment. The snap-caps vials were properly labelled as required.
Modified assay medium as formulated by CHU-10D was used (Table 2.2). The roots
harvested from cotton plants were washed with assay medium four times and transferred to
sterilised Petri dishes in assay medium. The previously-prepared assay medium, buffer and
substrates, placed under 4°C in a fridge, were taken out before starting the experiment and
Sigma Chemical Co., U.S.A
Sigma Chemical Co., U.S.A
Sigma Chemical Co., U.S.A

51
left for 10 min to equilibrate to room temperature. Into every labelled snap-cap bottle 1.4
ml of assay medium was pipetted and roots were added. The relevant buffers, 1.5 ml from
each, were then added to each snap-cap bottle. Assays were initiated by the addition of 0.1
ml of required substrate, including to the control bottles, (without root material). The
bottles then were immediately transferred to a shaking water bath and were incubated at 25°
C for 30 min. The experiment was terminated by the addition of 0.3 ml of the appropriate
terminator. After termination of the assay the organism was taken out from the snap-cap
vials with forceps and were kept in pre-weighed vials for dry weight determination as
described. The assays solutions for pNPP and 4-MUP were poured into the cuvettes and
the relevant absorbances were then recorded in the spectrophotometer or fluorimeter.
2.56 Terminator
The terminator was made up in assay medium and kept at room temperature.
When pNPP was used as the substrate the terminator was 5M NaOH. For bis-pNPP
substrate 1 M NaOH terminator was used.
For 4-MUP substrate the terminator consisted of different concentrations of K2HPO4 +
NaOH + EDTA used according to the pH of the assay buffer. For p f f s from 3 .0 to 5 .5
the concentration of terminator used was 100 mM NaOH plus 100 mM K2HPO4 and 2.5
mM EDTA. Above pH 6.0 a mixture of 50 mM NaOH, 50 mM K2HPO4 and 2.5 mM
EDTA was used.

52
2.57 End product determination
2.571 Colorimetry
All colorimetric analyses on phosphatase activity were carried out using a
Shimadzu Digital-Double-beam spectrophotometer (model-150-2). Quartz cuvettes with
a path length of 1.0 cm were used to read absorbance of the assay solutions at 405 nm.
The yellow colouration was the result of the hydrolysis of pNPP to pNP.
2.572 Fhiorimetry
A Baird-Atomic Fluoripoint spectrofluorimeter was used for fluorescence
measurements of phosphatase activity when using 4-MUP as a substrate. Plastic cuvettes,
with a path length 1.0 cm, were used for all fluorescence readings at wavelengths of 444
nm for emission, 356 nm for excitation.
2.6 Histological localization of phosphatase activity
For the cellular location of phosphatase activities three staining techniques were
used, with different organic phosphate substrates.
2.61 5-bromo-4-chloro-3-indolyl phosphate (BCIP)
The localisation of PMEase activity by staining was carried out by using 5-bromo-
4-chloro-3-indolyl phosphate (BCIP) as an organic substrate (Coston & Holt, 1958; Holt
& Withers, 1958). The white clean roots of cv Qalandri, with and without phosphorus,
were washed four times in assay medium. Assay medium, 1.4 ml, was pipetted into snap-
cap vials and roots were added. 1.5 ml of pH 5.5 assay buffer (DMG-NaOH) was then
added to each snap-cap vial. The assay was started with addition of 0.1 ml of BCIP. The
vials were transferred immediately to a water bath at 32°C and shaken for 15 min.

53
Following incubation the roots were then washed three times in assay medium prior to
examination of segments under the high power [x 400 or x 1000] of a microscope.
2.62 Naphthol AS-MX phosphate
Localization of PMEase activity was also investigated by microscopy using 3-
hydroxy-2-naphtholic acid 2, 4-dimethylanilide phosphate sodium salt (naphthol AS-MX
phosphate) as the organic P source and diazotized 4-benzylamino-2,5-dimethoxyanilide
zinc chloride (Fast Blue RR diazonium salt) as the coupling agent; the product is a violet
insoluble dye. The staining medium consisted of 12 ml of assay medium plus 0.5 ml of 1
mM naphthol AS-MX phosphate alkaline solution (Sigma Chemical co, 1984) and 7.5 mg
of Fast Blue RR diazonium salt. The mixture was stirred continuously using a magnetic
stirrer during the preparation. The staining medium was adjusted to pH 5 .5 using 1 M
NaOH and then filtered through a GF/C glass microfibre filter and was used immediately
after preparation. Plant roots were washed three times in assay medium, resuspended in
the staining medium, left for 15 min at 32°C, washed three times in assay medium and
were examined under a high powered microscope (x 400 or x 1000) to locate staining.
2.63 p-naphthyl phenylphosphonate.
PDEase activity was tested using P-naphthyl phenylphosphonate as the organic P
source and diazotized 2-methyl-4-[(2-methyphenyl) azo] benzendiazonium sulphate salt
(Fast Garnet GBC sulphate salt) as the coupling agent; the product is deep red organic
insoluble dye. The staining medium consisted of assay medium at pH 5 .5, 1 mM naphthyl
phenylphosphonate and 0.1% Fast Garnet GBC sulphate salt. The staining medium was
filtered through 0.22 uM nitro-cellulose filter and used immediately after preparation.
Material was washed three times in assay medium and resuspended in the staining medium,

54
left for 15 min at 32°C, washed three times and examined under a high powered
microscope (x 400 or xlOOO). Microtouch medical gloves were used throughout as Fast
Garnet GBC sulphate salt is a possible carcinogen.
2.7 Plant analysis
Plant analysis is the determination of the concentration of an element or extractable
fraction of an element in a sample from a particular part or portion of crop sampled at a
certain time or stage of morphological development (Munson & Nelson 1973).
According to Fageria (1984) plant analysis, in simplest terms, is a study of the relationship
of the nutrient content of the plant to its growth. Plant analysis is a valuable tool in the
diagnosis of nutrient-related yield limitations. Interpretation of plant analysis requires a
knowledge of the ideal composition or critical nutrient levels for a given crop when its
growth or yield is at a maximum; however, critical plant compositon criteria must be
obtained for specific sampling period during the plants development, because the
concentrations of most elements vary with the maturity of the crop (Evanylo et al. 1988).
The critical concentration is defined as the minimal concentration in a specific plant part
from plants producing 90 to 95 % of maximum dry matter (Morghan 1985).
Phosphorus concentration in cotton plants may be increased by P fertilization
(Cope 1984; Khasawned & Copeland 1973; Sharpley & Reed 1982; Stelley & Morris
1953). In greenhouse sand culture trials, an increase in P in the solution had a direct
effect on the level of P in the plants (Ergle & Eaton 1957; Joham 1951). From the
information provided by Bassett et al. (1970) and Kapp et al. (1953) cotton tissue can be
listed in order of increasing P concentration: roots, stems, leaves, immature leaves, fruiting
parts, and finally seed. Root growth and P uptake were found to be closely related
(Khasawneh & Copeland 1973). The amount of P taken up per unit length of root was
the same regardless of P concentration in solution.

55
2.71 Phosphorus analysis
Four stock solutions were prepared for phosphorus analysis. From these
solutions, three reagents were prepared daily for use. The following stock solutions and
reagents were used for phosphorus analysis.
Table 2.7 Stock solutions and reagents used for phosphorus analysis
Stock solution Reagent
1. Phosphate standard 1 in Digestion Reagent (K208S2,D)
2. H2S04_Antimony Mixed Reagent (C6H806,B,C)
3. Molybdate
4. Digestion acid (cone. H2SO4)
Stock solutions were stored in 1000 ml bottles and wrapped with aluminium foil.
Additionally, a stock solution of 16M HNO3, Spectrosol grade, was used for the digestion
of the cotton material. Stock solutions were made as communal stocks approximately
every two months and were stored at 4°C, with the exception of HNO3.
Cotton seeds, roots and leaves were prepared for dry weight determinations,
before analysis. After the dry weights were recorded approximately 0.25 g of each
replicate was digested in 5 ml 4M HNO3 in snap-cap vials in a test tube boiling rack in a
fume cupboard for 1 h at 100 °C. Bubble flasks were placed on the snap-cap vials after
10 minutes digestion. The roots and leaves were ground with a glass rod prior to
digestion because of the fibrous components. After digestion, distilled water was used to
rinse the condensed liquid which had settled on the bubble flasks, into the snap-caps vials.
Each sample was then transferred to an Erlenmeyer flask, diluted to 35 ml with distilled
water, and the pHs adjusted to pH 7.0 using 1M NaOH. Phosphate standard solutions did

56
not have their pH adjusted. The samples were transferred to a measuring cylinder, diluted
to 50 ml with distilled water, and then 25 ml returned to the Erlenmeyer flask and 25 ml
was discarded. To each sample, including the standards, 5 ml of digestion reagent was
added and then 5 ml of mixed reagent value of each sample was measured on a Shimadzu
double beam Spectrophotometer UV 150-02 against a MilliQ water blank, at 882 nm. A 4-
cm cell was used for each sample. The detection limit for each reading was 0.009 OD
units.
2.72 Nitrogen analysis
For the nitrogen analysis three solutions were prepared as communal stocks and
oxidising reagent solution was prepared daily, Smart et al. (1983). The following stock
solutions and reagent were used for nitrogen analysis (Table 2.6).
Table 2.6 Stock solution and reagent used for nitrogen analysis
Stock solution Reagent
1. Nitrogen standard (Nitrate)
2. Phosphate standard in digestion ( K / ^ O g and NaOH)
3. Ammonium chloride (buffer) (NH4CI)
4. NNED
5. Sulphanilamide reagent
Stock solutions were made up and kept at 20 °C room temperature. The NNED was put
in brown bottles. Bottles containing sulphanilimide were wrapped with aluminium foil to
exclude light.
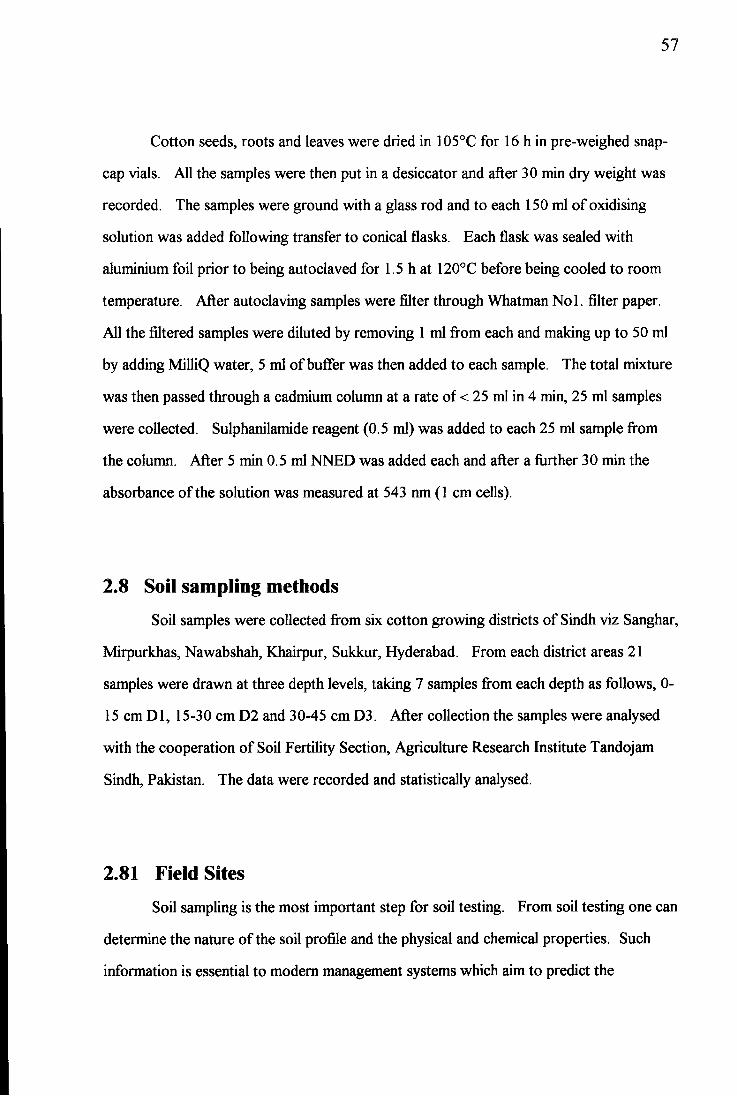
57
Cotton seeds, roots and leaves were dried in 105°C for 16 h in pre-weighed snap-
cap vials. All the samples were then put in a desiccator and after 30 min dry weight was
recorded. The samples were ground with a glass rod and to each 150 ml of oxidising
solution was added following transfer to conical flasks. Each flask was sealed with
aluminium foil prior to being autoclaved for 1.5 h at 120°C before being cooled to room
temperature. After autoclaving samples were filter through Whatman No l . filter paper.
All the filtered samples were diluted by removing 1 ml from each and making up to 50 ml
by adding MilliQ water, 5 ml of buffer was then added to each sample. The total mixture
was then passed through a cadmium column at a rate of < 25 ml in 4 min, 25 ml samples
were collected. Sulphanilamide reagent (0.5 ml) was added to each 25 ml sample from
the column. After 5 min 0.5 ml NNED was added each and after a further 30 min the
absorbance of the solution was measured at 543 nm (1 cm cells).
2.8 Soil sampling methods
Soil samples were collected from six cotton growing districts of Sindh viz Sanghar,
Mirpurkhas, Nawabshah, Khairpur, Sukkur, Hyderabad. From each district areas 21
samples were drawn at three depth levels, taking 7 samples from each depth as follows, 0-
15 cm D l , 15-30 cm D2 and 30-45 cm D3. After collection the samples were analysed
with the cooperation of Soil Fertility Section, Agriculture Research Institute Tandojam
Sindh, Pakistan. The data were recorded and statistically analysed.
2.81 Field Sites
Soil sampling is the most important step for soil testing. From soil testing one can
determine the nature of the soil profile and the physical and chemical properties. Such
information is essential to modern management systems which aim to predict the

58
productivity of soil. The success or failure of soil analysis depends on collecting the
representative soil samples. For this study the following steps were taken:
(1) The field was divided into different areas. The samples were collected from the area
which represented uniformity in topography, texture, colour of the soil, depth, drainage
and crop management.
(2) Soil samples were taken from different positions to take into account soil variability.
(3) Particulars of the area sampled, location, crop grown, manuring history were
recorded on an information sheet.
(4) All the samples were labelled with sample number, Village, Taluka and District.
The following characters were determined:
(a) SoilpH
(b) Electrical conductivity
(c) Organic matter exchangeable potassium
(d) Available phosphorus
(e) Total nitrogen
2.82 Core sampling
For the soil sampling a soil auger, with a cavity of 12" long and 4" diameter, was
used. Each soil depth sample consisted of a mixture of seven soil cores.
2.83 Determination of soil pH
Samples of 30 g air-dried soil were taken in 250-ml shaking bottles and 150 ml
distilled water was added. The suspensions were shaken on a mechanical shaker for 30
min and then filtered through Whatman filter paper No. 40. The filtrate were transferred
to a 100-ml beaker for pH measurements. The pH meter was calibrated with standard

59
buffer solution tablets pH 4.0, 7.0 and 9.0. The temperature of the pH meter was also
maintained at 20°C. The glass electrode was rinsed with distilled water, and readings
were recorded.
2.84 Determination of soil conductivity
The soil and water were mixed together at a ratio 1:5, shaken on the mechanical
shaker for 30 min, and a clear extract was obtained by filtration. All the samples were
measured by using a conductivity meter. The conductivity was expressed as uS cm~l at
30°C.
2.85 Determination of soil organic matter
Reagents used for standard of Soil Fertility Dept., Sindh, Pakistan:
1. I N K^C^Oy: 49.04 g in one 1, of distilled water.
2. Diphenylamine indicator: 0.5 g of reagent grade indicator was dissolved in 20 ml
distilled water and 100 ml of concentrated H2SO4
3. Ferrous solution: A. 0.05 N ferrous solution was made up by dissolving 196.1 g Fe
(NH4)2 (804)2- 6H2O in 800 ml distilled water to which was added 20 ml concentrated
H2SO4 and the mixture was diluted to one litre.
4. 85%H 3 P0 4 .
5. NaFsalt.
6. Concentrated H2SO4 not less than 96% purity.
A 2 g soil sample was taken and 10 ml of 1 N K2Cr207 solution was pipetted onto it and
both were mixed by swirling and shaking the flask. 20 ml of concentrated H2SO4 was
then added and mixed by gentle rotation for 1 min to ensure the complete contact of the

60
reagents with the soil. The mixture was allowed to stand for 20-30 min. The standard
blank (without soil) was run in the same way.
Back titration: Ferrous solution (3) diluted to 200 ml with distilled water and 10 ml of
H3PO3, 0.2 g NaF salt and 30 drops of diphenylamine indicator were added. The
solution was back titrated with ferrous solution. In the beginning, the colour was dull
green with chromous salts then this colour changed to turbid blue as the titration
proceeded. At the end point this colour sharply changed to green.
2.86 Determination of soil exchangeable potassium
5 g soil samples were taken in 150-ml shaking bottles, and 100 ml of I N
ammonium acetate solution were added to each. The bottles were stoppered and shaken
for 30 min. The suspension was filtered/ centrifuged. The potassium content of filtrates
was determined by flame photometer at a wavelength of 770 mu.
2.87 Determination of available phosphorus in soil
Reagents
1. Sodium bicarbonate 0.5 N , pH 8.5: Dissolved 42.0 g of NaHCC«3 in one 1 of distilled
water and adjusted the pH to 8 .5 with 1.0 N NaOH.
2. Activated charcoal: Phosphorus-free activated charcoal was used.
3. Sulphuric acid 0 .5 N: 14 ml of concentrated sulphuric acid diluted to one 1 with distilled
water.
4. Solution A:
(i) Potassium antimony tartarate 0.124 g, added with 400 ml of distilled water and 70 ml
of concentrated H2SO4.
(ii) 6 g ammonium molybdate dissolved in 300 ml of distilled water.

61
(iii) When the antimony-acid solution was cold, then one 1 ammonium molybdate solution
was added to it.
5. Solution B: 1.056 g Ascorbic acid was added to every 200 ml solution A. (fresh solution
was made up each time).
6. Standard phosphorus solution: Potassium dihydrogen phosphate (KH2PO4) 2. 195 g
was dissolved in a 1 of distilled water, this was the 500 ppm stock solution. 5 drops of
toluene were added to prevent microbial activity. The standard was made up by diluting
this stock as required.
5 g of soil sample was taken in a 250 ml flasks to which was added 100 ml of
reagent 1 then mixed with one teaspoon of reagent 2. The suspensions were shaken for
30 min on a mechanical shaker and were then filtered through Whatman filter paper No.
40. 10 ml aliquots of the each filtrate were transferred to 25 ml volumetric flasks to which
were added 10 ml of reagent 3 to neutralise the NaHC03. The flasks were left overnight
for removal of CO2 4 ml of reagent 5 and 1 ml of distilled water were added and
contents of the flasks were immediately shaken. A blue colour appeared in 1-2 min which
reached its maximum intensity in about 10-15 min. Finally readings of the standard and
samples were recorded on a spectrophotometer at 680 nm wavelength.
2.88 Determination of total nitrogen
Reagents
1. N/10 sulphuric acid
2. N/10 NaOH
3. Methyl red indicator solution
4. Salt mixture containing K2SO4 (10 parts) FeSC"4 (1 part) CUSO4 (0.5 parts)
10 g of soil samples were transferred to clean dry Kjeldhal flasks, moisten with 10 ml of
distilled water, shaken well and allowed to settle for 30 min. Samples were supplemented

62
with 35 ml concentrated sulphuric acid and 10 g of a mixture of K2SO4, FeSC<4 and
CUSO4, and 1 g of salicylic acid and 5 g Na2S2C>2 The samples were heated on a low
flame which was then gradually raised to high. The samples were continuously digested
by boiling until the mixture was colourless. After cooling 50 ml of distilled water was
added in each flask; these were swirled well and the samples were cooled under a tap.
The solution was transferred to a 800-ml flask by decantation. Contents of the digestion
flask were washed with distilled water. The volume was made to 400 ml and a few
pieces of porcelain were added to prevent bumping. The distillation was made in presence
of a known quantity of ammonia N/10 sulphuric acid (20 ml). Excess acid was titrated
with N/10 NaOH using methyl red indicator. The same procedure was carried out with a
blank, absorbance was recorded on a spectrophotometer at a wavelength of 680 nm.
2. 9 Computing
Four computer programs were used for this study. All the routine calculations
were performed on Microsoft Excel. The text was written up on the Word for Windows
version 2.0. The graphic output was carried out under the Sigma Plot (4.1) suite of
software.
The statistical analyses were carried out on Minitab using 2-way ANOVA. In the
analyses comparison was made between single variables and the interaction between the
variables, eg. Chapter 6, section (6.1) condition = ± , concentration = different
concentrations of NaCl, condition x concentration =i nteraction between the two variables.

63
CHAPTER 3 A G R O - E C O L O G I C A L COTTON CONDITIONS IN SINDH
(PAKISTAN)
3.1 Introduction
Cotton is one of the most important commercial crops worldwide and Pakistan
usually ranks as the fifth biggest producer of cotton in the world. Pakistan is situated
between 24° and 27° N and 62° E and stretches over 1600 km north to south and 885 km
east to west with a total area of 796,095 km^. Out of 20 million hectares of cultivated
area in Pakistan, 14 % is devoted to cotton production. Cotton, therefore, plays a vital
role in the economy of Pakistan, and the country earns substantial foreign exchange from
the export of both cotton fibre and its products. In 1992, Pakistan produced 1.85 xlO^ t
cotton, from which 0.51 x l O 6 1 were exported (Cotton World Statistics, 1992)
The country comprises four provinces Punjab, Sindh, Balochistan and North west
frontier province, of which Punjab and Sindh are well known for their crop productions.
Sindh province is situated in the south-west of Pakistan. The Indus river flows through
Sindh making the province the main source of the agricultural production in Pakistan.
The total land area of Sindh is 14.09 million hectares, the cultivated area is 5.45 million
hectares of which the total area under cotton crop (1991-92) was 548 thousand hectares
(Cotistics, 1992).
The main cotton growing areas of Sindh are shown in Fig. 3.1. Many different
cultivars are grown locally. The soil conditions vary in pH, nutrient, matrix and water
availibility. A study was made to obtain information on the soil environment from which
the specific cotton seeds were obtained.

64
N
i.
.mm.
s
57JV0
KARACHI
Fig. 3 .1 Map of Pakistan showing cotton growing areas.
Cotton growing areas.

65
3.2 Climate
Cotton is grown under the temperature range of40-45°C in the northern area, and
38-43°C in the southern area of Sindh. The mean annual rainfall varies from 18 to 50 mm
with mean humidity of 60 and 85 % in the south and north respectively.
Sindh has been divided in to three cotton growing zones according to agro-climatic
condition and soil types. It includes northern, middle areas and southern zones. In the
northern zone cotton is grown in two distrticts called Sukkur and Khairpur. In the middle
zone cotton is grown in Nawabshah and Sanghar districts, while in south cotton is
cultivated in the districts of Hyderabad and Mirpurkhas.
3.3 Soil analysis
Soil analysis is one of the important factors in the diagnoses of weak plant growth
and the suitability of a site for crop production. The main purpose of soil analysis is to
determine the quantity of fertilizer required to prevent economic loss of crop value
because of nutrient deficiency. Soil tests provide an index of the available nutrients in the
soil. The second purpose of soil testing is to monitor the quantity of available nutrients
present over time. This information is useful for evaluation of fertilization, crop zoning
and in making decisions about waste.
The uptake of nutrients by plants is known to depend on soil pH. Generally,
plants grown in solution have highest nutrient uptake at about pH 5 to 6. At higher and
lower pH values the nutrient uptake decreases dramatically. Dunlop and Bowling (1978)
found that the external pH affected the electrical potential difference between the roots and
the solution, and that this factor was closely related to phosphate uptake. The soil pH is
also believed to increase the microbiological activity (Halstead et al. 1963).
Nitrogen (N) availability indices are a measure of the potential of a soil to supply
nitrogen to plants when conditions are ideal for mineralization. Surface soil usually

66
contains 0.08 to 0.4 % total nitrogen, mostly in the organic form (Bremner 1965a). The
amount of nitrogen that is mineralized each year is commonly in the range of 1 to 3 %
(Broadbent, 1984). Most of the nitrogen being mineralized in soil obviously comes from
a fraction of the soil organic matter that is easily decomposed. Therefore, it is likely that a
mild acid or alkaline extractant could make a suitable chemical isolation medium (Keeney
& Bremner, 1966).
The purpose of testing soil for phosphorus is to examine the quantity of
supplemental phosphorus required to prevent economic loss of crop value because of
phosphorus deficiency. A soil test indicates an index of the available phosphorus in the
soil which in turn can be used to predict the amount of supplemental phosphorus needed.
Generally 1 % of the soil volume is occupied by the plant roots (Barber, 1984), therefore,
influencing the root system, size or morphology will likely effect the quantity of the soil
phosphorus that is available to a plant. Simulated sensitivity analysis has demonstrated
the large impact that the rate of root elongation has on phosphorus uptake (Silberbush &
Barber, 1983).
The exchangeable potassium is also one of the most important elements in crop
development, commonly, its insufficient supply in the soil limits crop yield. Potassium
plays a specific role in the mechanism of opening and closing of stomata. When nitrogen
and potassium are in short supply, the plants are stunted, their leaves are small and rather
ashy grey in colour, they die prematurely, and the fruit and seed are small in quantity and
size (Drew, 1975; Hackett, 1978). Nitrogen and potassium deficiency effects are general
and are seen in crops on all soils,however, deficiency is most common on sandy soil. The
soil texture also affects the amount of water retained at field capacity (McGowan, 1984).
The effect of soil structure is the most important factor in determining the soil water
retention.
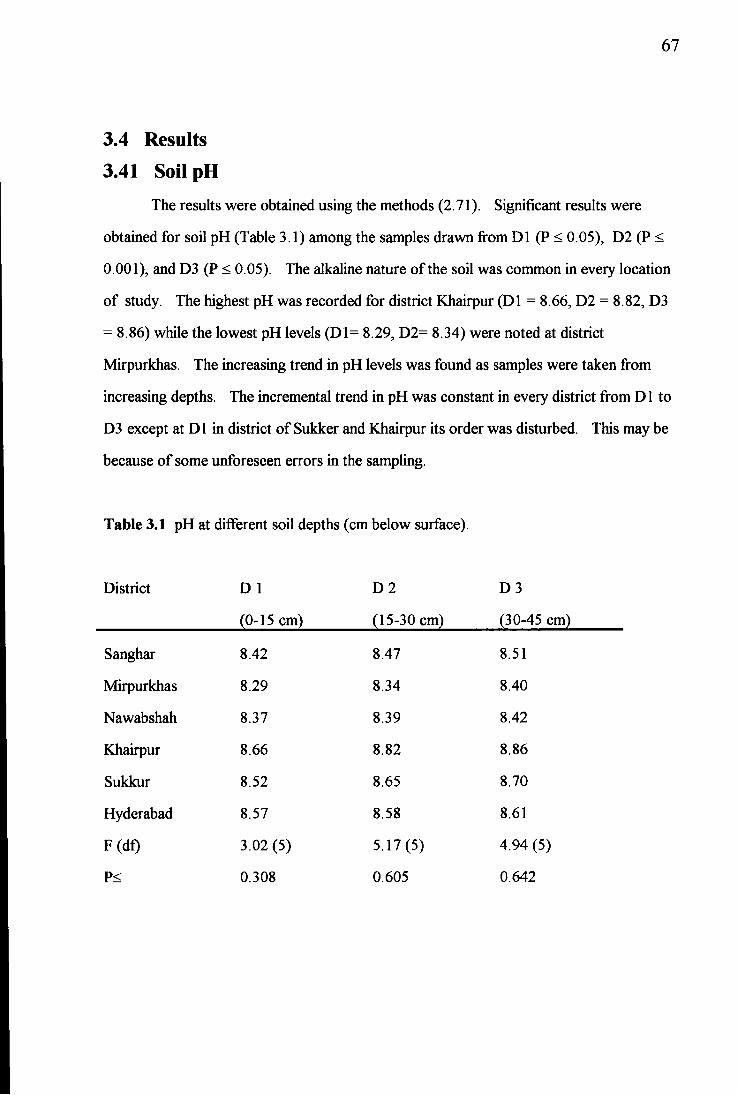
67
3.4 Results
3.41 SoilpH
The results were obtained using the methods (2.71). Significant results were
obtained for soil pH (Table 3.1) among the samples drawn from D l (P < 0.05), D2 (P <
0 .001), and D3 (P < 0.05). The alkaline nature of the soil was common in every location
of study. The highest pH was recorded for district Khairpur (D l = 8.66, D2 = 8.82, D3
= 8.86) while the lowest pH levels ( D l = 8.29, D2= 8.34) were noted at district
Mirpurkhas. The increasing trend in pH levels was found as samples were taken from
increasing depths. The incremental trend in pH was constant in every district from D l to
D3 except at D l in district of Sukker and Khairpur its order was disturbed. This may be
because of some unforeseen errors in the sampling.
Table 3.1 pH at different soil depths (cm below surface).
District D 1
(0-15 cm)
D 2
(15-30 cm)
D 3
(30-45 cm)
Sanghar 8.42 8.47 8.51
Mirpurkhas 8.29 8.34 8.40
Nawabshah 8.37 8.39 8.42
Khairpur 8.66 8.82 8.86
Sukkur 8.52 8.65 8.70
Hyderabad 8.57 8.58 8.61
F(df) 3.02 (5) 5.17(5) 4.94 (5)
P< 0.308 0.605 0.642

68
3.42 Conductivity
Highly significant results for conductivity (Table 3 .2) among districts were noted
(P < 0.001). The depth levels were also highly significant (P < 0.001). Conductivity
varied from district to district and at different soil depths within and between their districts.
The highest conductivity was observed in samples of Sanghar (451), and lowest
conductivity was noted for Khairpur (224).
Table 3.2 Conductivity (uS cm"l) at different soil depths (cm below surface).
District D 1
(0-15 cm)
D 2
(15-30 cm)
D3
(30-45 cm)
Sanghar 451 360 393
Mirpurkhas 429 385 346
Nawabshah 347 351 310
Khairpur 274 224 244
Sukkur 450 341 305
Hyderabad 263 326 281
F(df) 1250 (5) 73 (5) 68 (5)
P< 308 605 642
3.43 Organic Matter
Significant differences were recorded among districts for organic matter (O.M.)
(Table 3,3) content present at different sampling depths, D l (P < 0.05), D2 (P < 0.01), and
D3 (P < 0.05). Highest O.M. was found at district Khairpur (1.47) while the least was at
Hyderabad (0.29). The O.M. declined for the increasing depth in every district except for

69
Sukkur where it increased in D2 with respect to, D l . This unpredictable result may again
have been the result of disparity in collecting the soil samples.
Table 3.3 Organic matter (ppm) at different soil depths (cm below surface).
District D 1
(0-15 cm)
D 2
(15-30 cm)
D3
(30-45 cm)
Sanghar 1.32 1.16 1.03
Mirpurkhas 1.17 1.06 0.89
Nawabshah 1.07 0.89 0.59
Khairpur 1.47 1.20 0.92
Sukkur 0.86 0.92 0.80
Hyderabad 0.88 0.42 0.29
F(df) 2.45 (5) 4.07 (5) 2.97 (5)
P < 0.052 0.005 0.024
3.44 Total Nitrogen
For the nitrogen content (Table 3 .4) non-significant results obtained for all
districts. Significant results were noted for the depth levels, D3 (P < 0.05) and significant
results also obtained for D2 (P < 0.01). The data showed highest nitrogen levels in
Sanghar (0.066) while the lowest were in Hyderabad (0.015).

70
Table 3.4 Total nitrogen (ppm) at different soil depths (cm below surface).
District D 1
(0-15 cm)
D 2
(15-30 cm)
D3
(30-45 cm)
Sanghar 0.066 0.058 0.052
Mirpurkhas 0.059 0.054 0.041
Nawabshah 0.053 0.048 0.033
Khairpur 0.061 0.062 0.047
Sukkur 0.044 0.042 0.040
Hyderabad 0.046 0.024 0.015
F(df) 2.34 (5) 3.93 (5) 2.66 (5)
P < 0.061 0.006 0.038
3.45 Available Phosphorus
Analysis of soil samples showed non-significant variation for available phosphorus
(Table 3.5) among districts. Significant differences (P < 0.05) were observed for depth
levels. The highest available phosphorus was detected in Sanghar districts (1.93) at D l
and the lowest available phosphorus level was found in Hyderabad (0.48).

71
Table 3.5 Available phosphorus (ppm) at different soil depths (cm below surface).
District D 1
(0-15 cm)
D 2
(15-30 cm)
D 3
(30-45 cm)
Sanghar 1.93 1.28 0.56
Mirpurkhas 1.31 1.11 0.53
Nawabshah 1.81 0.88 1.66
Khairpur 1.93 1.08 1.00
Sukkur 1.58 1.18 0.53
Hyderabad 0.63 0.67 0.48
F(df) 0.94 (5) 0.57 (5) 0.56 (5)
P < 0.469 0.724 0.729
3.46 Exchangeable Potassium
Highly significant results among districts for exchangeable K (Table 3.6) were
recorded (P < 0.001). Also highly significant differences (P < 0.001) were noted for
depth levels. The highest exchangeable K of 184 ppm and lowest 42 ppm for Sukker
district were recorded. The exchangeable K also declined with increasing depth levels

Table 3.6 Exchangeable potassium (ppm) at different soil depths (cm below surface).
District D 1
(0-15 cm)
D 2
(15-30 cm)
D3
(30-45 cm)
Sanghar 153 127 116
Mirpurkhas 145 125 101
Nawabshah 162 126 95
Khairpur 154 127 104
Sukkur 110 92 74
Hyderabad 184 156 129
F(df) 4.77 (5) 6.80 (5) 4.38 (5)
P < 0.002 0.0 0.003

73
CHAPTER 4
4.1 Initial investigations of PMEase activity in cotton
Initial experiments were carried out in order to establish the existence of PMEase
activity in cotton roots and to characterise some of the properties of the system. In order
to achieve this plants of select cultivars were grown as described in the Materials and
Methods and PMEase activity was assayed using systems which had already been
successful with other plant species. In order to maximise PMEase activity and regulate its
production cotton seedlings were grown with and without phosphorus added to the
growth medium.
For these initial experiments only pNPP was used as the substrate and the cv
Rehmani was used as the experimental plant. A narrow range of pH values for the assay
medium was also employed. It should be noted, however, that in subsequent experiments
two substrates were used for the assay of PMEase activity, pNPP and 4-MUP. As stated
in Materials and Methods (Chapter 2) the actual absolute concentrations of these two
substrates used were different therefore a direct comparison between rates can not be
made when a fiil l concentration range of substrate has not been used. This anomaly will
be discussed further in Chapter 8.
Table 4.1 shows that PMEase activity was present in the roots of cv Rehmani.
The data indicate that the plants grown without phosphorus added to the growth medium
gave more PMEase activity at all the pH values, with the lowest rate at pH 7.0 and the
highest at pH 6.0. In contrast it was noted that plants grown with phosphorus added to
the growth medium showed lower activities but the least activity was at pH 7.0 and the
highest at pH 6.0. The ratio of PMEase activity was recorded as 1.34 at optimum pH.
Highly significant differences (P = < 0.001) were obtained between the plant growing
conditions. Highly significant differences (P = < 0.001) were found between pH values.
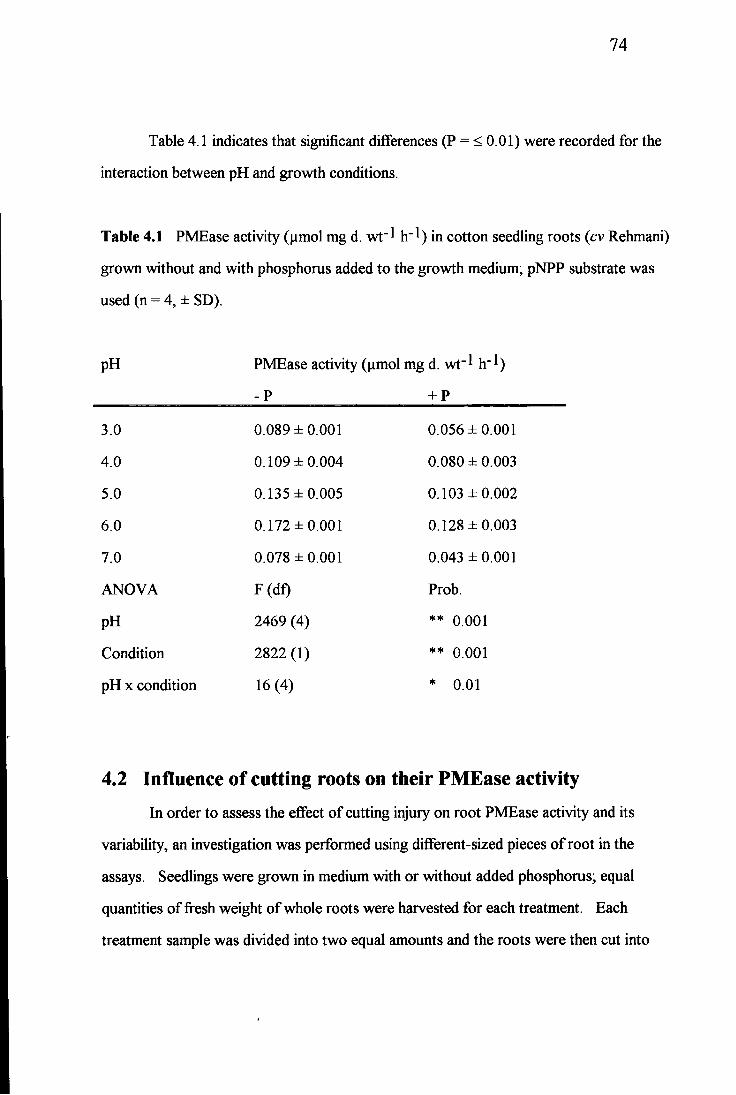
74
Table 4.1 indicates that significant differences (P = < 0.01) were recorded for the
interaction between pH and growth conditions.
Table 4.1 PMEase activity (umol mg d. wt" l h~l) in cotton seedling roots (cv Rehmani)
grown without and with phosphorus added to the growth medium; pNPP substrate was
used (n = 4, ± SD).
pH PMEase activity (umol mg d. wt" 1 h" 1)
-P + P
3.0 0.089 ±0.001 0.056 ± 0 001
4.0 0.109 ±0.004 0.080 ± 0 003
5.0 0.135 ±0.005 0.103 ± 0 002
6.0 0.172 ±0.001 0 .128±0 003
7.0 0.078 ± 0.001 0.043 ± 0 001
ANOVA F(df) Prob.
pH 2469 (4) ** 0.001
Condition 2822 (1) ** 0.001
pH x condition 16(4) * 0.01
4.2 Influence of cutting roots on their PMEase activity
In order to assess the effect of cutting injury on root PMEase activity and its
variability, an investigation was performed using different-sized pieces of root in the
assays. Seedlings were grown in medium with or without added phosphorus; equal
quantities of fresh weight of whole roots were harvested for each treatment. Each
treatment sample was divided into two equal amounts and the roots were then cut into

75
batches of either 1-cm or 4-cm segments. The 1-cm and 4-cm segment samples were then
assayed for PMEase activity at pH 6.0 which was indication as giving the highest rate.
Table 4.2 shows that 1-cm length of roots gave higher PMEase activity than the-4
cm length in both treatments. Plants grown without added phosphorus displayed higher
activity in all cases. The results indicate that some PMEase activity was being detected in
the cut cells as well as on the surface of the roots. To minimise this effect 4-cm segments,
including root tips, were used routinely in subsequent experiments. Also the variability of
activity between replicates was less in the larger segments.
Table 4.2 Influence of root segment size from cv Rehmani seedlings, grown without and
with phosphorus added to the growth medium, on PMEase activity, pNPP was used as
substrate. Activity is expressed as umol mg d. wt"* h~l (n = 4, ± SD).
Segment size Root weight PMEase activity
and f wt (mg) d. wt (mg) (umol mg d. wt" l h ' l )
-P + P -P +P
l c m , 80 2.1 ±0.14 2.05 ±0.13 0.172 ±0.013 0.116 ±0.005
4 cm, 80 2.35 ±0.06 2.35 ± 0.06 0.142 ±0.003 0.089 ±0.003
ANOVA F (df) Prob.
Root types 53(1) * 0.01
Condition 187(1) ** 0.001
Rtyp x condition N.S
4.3 Influence of pH on PMEase activity of cv Qalandri Once PMEase activity had been shown to be associated with cotton roots, further
characterisation was undertaken. Because cv Qalandri gave better and more consistent

76
germination, and because of a greater availability of seeds, this was used as the standard
test plant.
A more precise range of pH activity was investigated in order to establish the
relative amounts of acid and alkaline PMEase present. In addition pNPP and 4-MUP
were utilized in order to assess the range of substrate specificity and sensitivity of the
activity (Fig. 4.1)
With both substrates acid PMEase activity was observed. The activity increases
from pH 4.0 reaches at its maximum 5.5 and declined after pH 6.5 onward. The
maximum rate of activity was noted at pH 5 .5 with both the substrates. pNPP showed
higher PMEase activity than 4-MUP at all pH levels.
The plants grown without phosphorus added to the growth medium also showed
higher PMEase activity than the plants grown with phosphorus added to the growth
medium. However, the peak pH for activity with both plant growth conditions was
similar with both substrates.
The data in Table 4.3 show highly significant differences (P = < 0.001) between pH
values. Highly significant differences (P = < 0.001) were observed for the plants grown
with and without phosphorus added to the growth medium. Highly significant differences
(P = < 0.001) were obtained between substrates. The interaction of pH, substrates and
conditions was also highly significant (P = < 0.001).
PMEase activity appears to be primarily acidic; however, some activity was
detected above pH 7.0.

77
Table 4.3 Summary of statistical analyses of different conditions of the assays.
ANOVA F (df) Probability
pH values 1454(11) ** 0.001
Conditions 5199(1) ** 0.001
Substrates 626(1) ** 0.001
pH x conditions 102(11) ** 0.001
pH x substrates 28(11) ** 0.001
Conditions x substrates 217(1) ** 0.001
pH x subs x conditions 9(11) ** 0.001
4.4 Relative activities using different substrates
PMEase activity in cv Qalandri roots was assayed at the optimum of pH 5 .5 using
the two substrates in order to assess their relative utilisation. Initially both substrates
were used at 71 uM (pNPP) and 100 uM ml-1 (4-MUP). Table 4.4 indicates that in both
the conditions of plant growth acid PMEase activity was observed, with both substrates.
The highest PMEase activity, (0.150 umol mg d. wt~l h"l) was noted with pNPP in the
plants grown without phosphorus added to the growth medium, and the lowest acid
PMEase activity, 0.058 umol mg d. w t ' l h~l was obtained with 4-MUP substrate in the
plants grown without phosphorus in the growth medium. However, as indicated earlier
no direct comparison can be made between rates with the two substrates because of
differences in concentration.
Highly significant differences (P = < 0.001) were found between the substrates.
Also highly significant differences (P = < 0.001) were noted between the plant growth
conditions.

78
Fig. 4.1 Influence of pH on PMEase activity of roots of cotton cv Qalandri grown without and with phosphorus added to the growth medium pNPP and 4-MUP used as substrates
pNPP (71 uM
0.1
u)
0 </> 0.2 (0 4-MUP (100 uM LU
i 1 1 1 1 Y"~ 9
0.1
10 8 PH

79
Fig.4.2 Effect of phosphate on PMEase activity of cv Qalandri grown with different phosphorus concentrations added to the growth medium pNPP and 4-MUP used as substrates
pNPP (71 MM)
0.1
(A 4-MUP (100 uM) CO
LU
0.1
0 1 2 3 4 5 7.5 10
Phosphorus g l~1

80
Table 4.4 Influence of pH on PMEase activity (nmol mg d. wt" 1 h - 1 ) of cv Qalandri
seedlings grown without and with phosphorus added to the growth medium using pNPP
and 4-MUP as the substrates (n = 4, ± SD).
Substrates PMEase activity (nmol mg d. wt"l h"l)
-P +P
pNPP
4-MUP
ANOVA
Substrates
Conditions
0.150 ±0.001
0.105 ±0.005
F(df)
694 (1)
1412(1)
0.089 ± 0.004
0.058 ± 0.003
Prob.
** 0.001
** 0.001
Substrate x condition. 25(1) * 0.05
These results indicate that the phosphatase activity is greater with pNPP as the
substrate than with 4-MUP.
4.5 Effect of different phosphate concentrations on PMEase
activity in cotton (cv Qalandri) roots
In order to assess the most suitable level of phosphate to be added to the plant
growth medium in order to suppress PMEase activity the effects of different phosphate
concentrations were investigated. For this experiment eight concentrations of phosphate
and two substrates (pNPP, 4-MUP) were used.
The effect of different concentrations of phosphate measured using 71 \iM pNPP and 100
\iM 4-MUP are shown in Fig. 4.2. When pNPP was used as a substrate the maximum
activity (0.142 |amol mg d. wt"l h~l) was recorded in P-deficient plants. A similar result
was obtained when 4-MUP was used as substrate, the highest rate of activity was 0.108
nmol mg d. wt"l h"l. When the concentration of P was increased in the growth medium,

81
the rate of PMEase activity decreased. When concentrations of phosphate in excess of
0.8 g 1~1 were used PMEase activity was suppressed for both substrates. The differences
between substrates (Table 4.5) were highly significant (P = < 0.001). The highly
significant (P = < 0.001) differences were recorded among the concentrations of P
Table 4.5 Summary of statistical analyses of results of the comparison of PMEase activity
when different concentrations of phosphate were added to the growth medium.
Source F (df) Prob.
Concentrations 49 (7) 0.001
Substrates 17(1) 0.001
Concentration x substrates N.S
4.6 Influence of substrate concentration (pNPP or 4-MUP) on
PMEase activity of cv Qalandri
The objective of this experiment was to standardise the particular concentration of
substrate for further study. Also it was important to investigate the capability of the
enzyme to hydrolyse the organic phosphate. For this experiment two substrates pNPP &
4-MUP, at optimum pH of 5.5, and one cv were used.
Fig. 4.3 indicates that when pNPP was used as the substrate the highest PMEase
activity (0.490, 0.249 umol mg d. wt" 1 h - 1 ) was found with the 354 uM concentration,
for both growing conditions (without and with phosphorus added to the growth medium)
respectively. It was observed the activity increased from a substrate concentration of 18
uM and reach its highest level at 354 uM, afterward the PMEase activity was the same up
to 710 uM.

82
Fig. 4.3 shows that the similar trend of PMEase activity was noted with 4-MUP
substrate, while the rate of activity was lower than for the pNPP substrate at all the
concentration levels.
4.7 Time course of PMEase activity in cv Qalandri
For these experiments three concentrations of pNPP (71, 177 , 710 uM) and 4-
MUP (100, 250, 1000 uM), one pH and one cv were used.
The PMEase activity was measured using pNPP and 4-MUP substrates over a 50
min period with readings being taken every 10 min. The time course was started when
the substrate was added to the assays which were carried out at pH 5.5. The rate of
activity was calculated at half time of the intervals and showed a linear increase over the
incubation period for pNPP, Fig.4.4. The rate of activity was still linear up to 50 min in
both the conditions P-limited and P-sufficient at the highest concentration of substrate.
However, the activity entered a stationary phase for the lower phosphate concentration
treatment.
In the case of 100 uM 4-MUP substrate the PMEase activity showed a linear
increase over the incubation time (Fig.4.5). At lower concentrations the maximum rate of
activity was noted at 50 min in both the conditions, P-limited and P-sufficient.
4.8 Localization
The previous experiments established that cotton roots had PMEase activity
associated with them and it was observed that the activity present was acidic. The
purpose of this investigation was to assess the location of the PMEase activity in the
tissues of the roots of cv Qalandri seedlings grown with and without phosphorus added to
the growth medium. In order to do this experiments were carried out using different

83
organic phosphate substrates as described in Materials and Methods which would allow
localization by staining.

84
Fig. 4.3 Effect of concentrations of pNPP & 4-MUP substrates on PMEase
activity of cv Qalandri seedlings grown without and with phosphorus
added to the growth medium
^ 0.6 n pH 5.5
£ 0.4 •
D) E
0.2 O 3 "D O Q. 0 O E o
LU
0.6 i
pNPP
0- 0.4 -
0.2 -
T 1 1 1
250 500 750 1000 4-MUP

85
Fig.4.4 Influence of incubation on PMEase activity of roots of cv Qalandri grown without and with phosphorus added to the growth medium pNPP used as substrate
pH 5.5
710 uM 1.0 ° 177 uM o 71 u
O) 0.5
(0 03
1.0 LLI 710 uM • 177 UM • 71 uM ^ ^ ^ ^ ^ ^ ^ ^ ^ ^ ^ ^ ^ ^ ^ ^ ^ ^
0 10 20 30 40 50 Time (min)
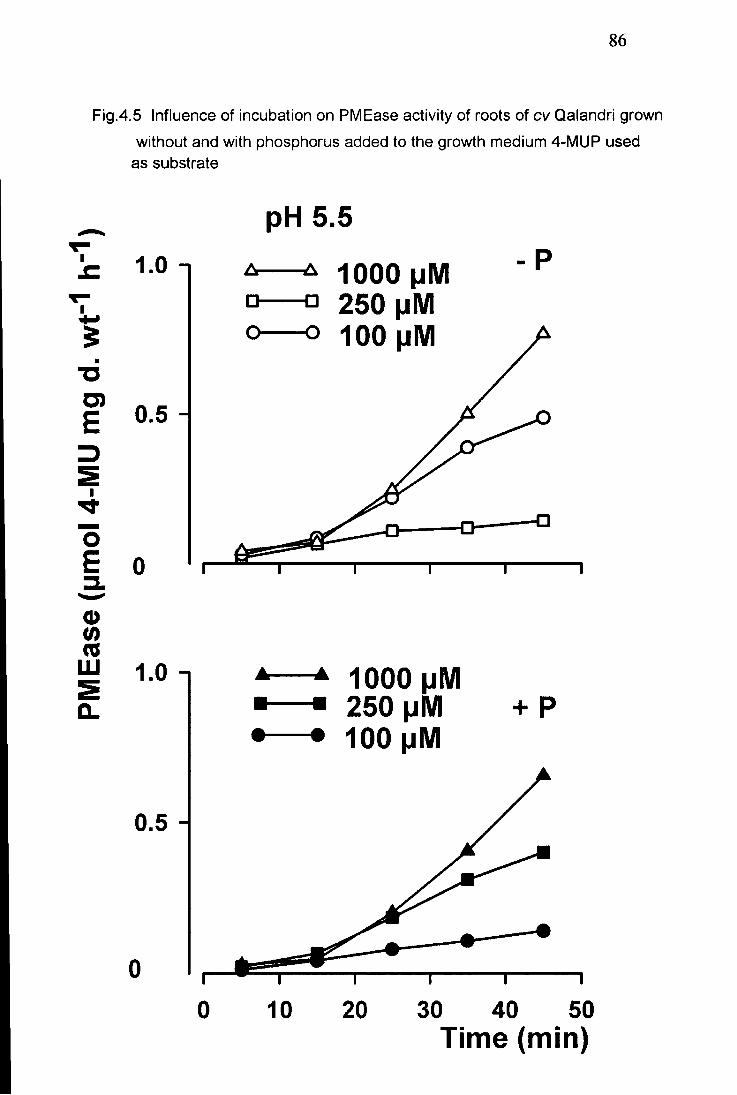
86
Fig.4.5 Influence of incubation on PMEase activity of roots of cv Qalandri grown
without and with phosphorus added to the growth medium 4-MUP used as substrate
pH 5.5
1.0 * 1000 uM 250 uM • • •
o 100 uM
0 CO 03
LU 1.0 1000 uM 250 uM
• 100 uM
I 1 1 1
0 10 20 30 40 50 Time (min)

8 7
0
9
Fig. 4.6 Roots of cotton plants from growth conditions where phosphate were added or omitted stained with BCIP for 30 min.
Stained cell wall
x400
Fig. 4.7 Localization of PMEase activity in cell walls of cotton roots of plants grown without phosphorus added to the growth medium stained with BCIP.

88
Fig. 4.6 shows that by staining with BCIP it was possible to observe PMEase
activity at the root surface, especially in the cell walls. After 30 min of incubation at 25
°C temperature in BCIP the P-limited plant roots exhibited strongly stained tissues. In
these plants the roots contained high PMEase activity. When the lateral roots were
examined at 400 x magnification, the stained cells were found to contain a small amount of
stain. In the case of P-sufficient plants roots were very lightly stained.
When Fast Garnet GBC salt fi-naphthyl phenyl phosphate was used the PDEase
activity was clearly visible as staining in the whole tissue Fig. 4.7.
No enzyme activity was observed with naphthol AS-MX phosphate and Fast blue
RR salt. No staining was found in either P-limited or P-sufficient growth conditions.
4.9 Effect of temperature on PMEase activity in roots of cv
Qalandri
An experiment was carried out to determine the influence of temperature on
PMEase activity of cv Qalandri seedlings grown with and without phosphorus added to
the growth medium in order to establish optimum conditions and range of activity.
For this experiment six different temperatures, two substrates (pNPP, 4-MUP),
and two phosphorus conditions were used.
The influence of temperature on PMEase activity of cv Qalandri was quantified by
using pNPP and 4-MUP (Fig. 4.8). Temperature optima of 55°C for PMEase activity
with both the substrates were recorded. The maximum rate of activity (0.177 umol mg d.
wt" 1 h" 1 ) was observed in roots of plant grown under P-limited condition while using
pNPP as substrate. With the same substrate less activity (0.144 umol mg d. w t _ 1 h _ 1 )
was noted in the roots of plants grown under P-sufficient conditions. While a lower rate
of activity (0.126 umol mg d. wt"l h"l) was observed with 4-MUP substrate in P-
sufficient plant roots.

8 9
Fig.4.8 Localization of PDEase activity in whole tissues of cotton roots of plants grown without phosphorus added to the growth medium stained with (3-naphthyl phenyl phosphate

90
Fig.4.9 Effect of different temperatures on PMEase activity of roots of cv Qalandri grown without and with phosphorus added to the growth pNPP and 4-MUP used as substrates
5 •
E o 3 o
0.18 n
0.12 H
0.06 H
O 0
E
pNPP(100 pM)
+ P
(0
LU 0.18 n
0.12 H
0.06 H
4-MUP (100 MM)
i 1 1 1 1 1 1
20 30 40 50 60 70 80 Temperature

91
Table 4.6 indicates that there were highly significant differences (P = < 0.001)
between activities at different temperatures. The interaction between temperature and
growth conditions were statistically significant differences (P = < 0.05). The data also
indicate that interactions among temperature, growth conditions and substrates were
significant (P = < 0.05).
Table 4.6 Summary of statistical analyses of effects of different temperatures on PMEase
activity of cv Qalandri roots.
ANOVA F (df) Probability
** 0.001
** 0.001
** 0.001
* 0.05
** 0.001
* 0.01
4.10 Effect of ions on PMEase assay
It has been shown that PMEase activity in a number of organisms is influenced by
the levels and types of ions included in the assay medium.
In order to study this an investigation of the effect of ions on the PMEase assay
was made. In order to do so Na, Ca, Mg or K was omitted individually from the assay
medium. The effects of individual ions on PMEase activity of cv Qalandri roots was
Temperature 542 (5)
Conditions 1797 (1)
Substrates 625 (1)
Temperature x condition 4 (5)
Temperature x substrate 55 (5)
Condition x substrate N. S
Temp, x condition x substrate 5 (5)

92
assayed on plants grown with and without phosphorus added to the growth medium. For
this experiment one substrate and an assay pH of 5.5 was used.
The activity was measured using 4-MUP as the substrate (Fig.4.9). The highest
activity (0.209 umol mg d. wt"l h~l) was recorded in control P-deficient plants where all
ions were present in the assay. The differences between conditions (Table 4.7) were
highly significant (P = < 0.001). Non-significant differences were noted among the ions.
The interaction between conditions x ions also were non-significant
Table 4.7 Effect of different ions on the PMEase assay using 4-MUP as substrate.
Ions PMEase activity (umol mg d. w t - 1 h"1)
-P _ +P
Na 0.146 ±0.01 0.085 ±0.01
Ca 0.143 ±0.01 0.073 ±0.01
Mg 0.147 ±0.02 0.091 ±0.00
K 0.165 ±0.01 0.078 ±0.01
Control 0.209 ± 0.02 0.082 ± 0.00
ANOVA F (df) Probability
Treatment N.S ** 0.001
Condition 60 (1)
Treatment x condition N.S
4.11 Retention of product in, and leaching of activity, from roots
of (cv Qalandri)
In order to assess the retention of PMEase activity in the roots, assays were carried
out using a range of pH values, and two substrates. During normal assay procedures

93
surface PMEase in particular was measured, however, the probability exists that the
substrate entered the cells and then was hydrolysed by cellular PMEase. Also the
secretion of cellular phosphatase activity onto the cell surfaces could cause erroneous and
variable surface PMEase activities. In order to clarify these probabilities the following
assay was performed.
Seedlings were grown without phosphate added to the growth medium to
maximise PMEase activity, and were assayed in the normal way over range of pH values
with pNPP and 4-MUP substrates. At the end of 30-min incubation the tissue was
removed from the assay tube and was washed in assay medium, and the PMEase activity
was assayed again as before for one h.
Table 4.7 shows that less then 1 % of original activity was found during the second
assay. However with 4-MUP at pH 7.0 and above there was increase up to 11 % at pH
10.0. This could reflect leaching of enzyme or reaction product and may be related to the
higher pH values altering root permeability problems. No such responses was seen for
pNPP.
Since assays were performed routinely at pH 5.5 it is unlikely that product
retention or enzyme leaching would be of any significance since only 0.13 % of the
original assay activity was detected at this pH.

P b o 0 0 ©
- J
o O N O N
b © 4 ^ 4*>
O o >T3
o o t s ) 0 0
H-o © o
o b 4 ^
o H-
o o
o ON
H-o b o
o N O
H-
o b o to
t o
H-o b o t O
H-O
b o to
N O O N
4-
o © o O N
© © © © ©
4 ^ _ - J NO ^ O O N
H- H- H- H- H-o o o © o b b o © b o o o o o >—* 1 — 1 u> U>
2; o
o o o o o o o o o o o o © b © © b ' © b b b b b b o o o o o o o o o o o o o o o o o o o o o o o o - J - J O N v \ -&> u > t o t o N O u > - o •£> O N O N 0 0 - o o
H- H- H- H- H- t f H- H- H- H- H- H-o o o o o o o o o p p o
b b b o b b b b b b f—1
b b o o o o o o o o o ^ — ' o o o o o o o o o o o ^ — ' o o o t o o t o o 1—1 M >—» >—*
1—* o 0 0 t o l O 0 0 N U 0 0 N O
o o p p p o © o o o o o - J 0 0 i — > t o t o t o t o t o 0 0 4 ^ 00 o O N N O o
B.
a .
o
O N
B. 3 fl> a .
CP
o o o O O o O O o o O O
© b b b b i — • I — * i — • b b b b o o «—» t o 0 0 o I—» O N O N O O N >—* i—1 ^o u » N O t o i—1 O N t o U ) •~J
H- H- H- H- H- H- H- H- H- H- H- H-o o o o o o o o o o p o
o (—\
b b b b b b b b b b b f—\ o o o o o o o o o o o *—'
o o t o u » »—» t o t o t o
o o o o o o o o o o o o b b © b b b b b b b b b o o o o o o o o o o o o o o o o o o o o o o o o o i—» 4 ^ O N 0 0 O N O N t o » N O t o O N O N o N O 4 ^ 0 0 O N t o
H- H- 4- H- H- H- W K- 4- H- H- H-o o O o o o o o o o p o
b b b b b b b b b b b b o o o o o o o o o o o o o o o o o o o o o o o o o o o o o o o o o o o o i — » t o u > t o t o t—* u > t o 4 ^
- o t o t o o p o o o o o o
o b 4 ^ t o t o O N O N O N 4 ^ t o N O 0 0 O 4 ^ N O O N O t o
oo
o
fi.
B. 3 a -
3
3* CD 3
s> & 3 *
O
c NO 4 ^

412 Influence of plant age on PMEase activity of cv Qalandri As plants grow their nutritional status changes and with this so could the
requirement for PMEase activity. In order to assess the magnitude of this effect PMEase
activity was assayed in plants of different ages. Also it was important to standardise plant
age; plants which were grown for three different times were utilized here for further
experiments. Seedlings were grown with and without phosphorus added to the growth
medium. A range of 12 pH values (3-10) and two substrates were used for this study.
4.121 13-day old seedlings
Seeds were germinated and after five days seedlings were transferred to water
culture (see Materials and Methods). After a further 2 days the water was replaced with
growth medium, with or without added phosphorus. Assay for PMEase was carried out
after a further period of six days. The PMEase activity was measured using the two
substrates pNPP and 4-MUP as shown in Fig. 4.10. The maximum rate of activity was
observed at pH 3.0 with both substrates being 0.099, 0.086 umol mg d. wt~l h"* was
noted in the plants grown without phosphorus added to the medium with pNPP and 4-
MUP substrates respectively. However, another peak of activity was also noted at pH 6.0,
(0.092 umol mg d. wt"l h~l) with pNPP substrate while with 4-MUP substrate the second
peak was shifted to pH 5.5 (0.082 umol mg d. wt~* h"*) after which the activity gradually
declined to pH 7.0. Above that pH limit the PMEase activity was negligible. pNPP
showed a slightly higher activity compared with 4-MUP at pH 3 .0. The overall activity
was higher at all pH levels for pNPP compared with 4-MUP. The PMEase activity of
roots of P-sufficient plants was less than that of P-limited plants for both the substrates.
However, the optimum pH for activity peaks of P-sufficient and P-limited seedlings was
similar with both substrates. The statistical differences between (Table 4.9) the plants
grown under P-limited and P-sufficient conditions were highly significant (P = < 0.001).
Highly significant differences (P = < 0.001) were recorded for the age of plants.

96
4.122 19-day old seedlings PMEase activity was detected between pH 3-7 (Fig. 4.10) with optimal activity at
pH 5.5. These seedlings were grown for 12 days following transfer to nutrient solution.
The maximum rate of activity (0.194 umol mgd.wt" lh~l ) was noted in plants grown
under P-limited condition at pH 5 .5, with pNPP as substrate. However, when the activity
was tested using 4-MUP as substrate the same results were observed in that the maximum
rate of activity (0.157 umol mg d. wt~l h"l) occurred at pH 5 .5. Highly significant
differences (P = < 0.001) were found between substrate (Table 4.9). The ratio of
PMEase activity of pNPP to 4-MUP was recorded as 1.23 at their peak pH. Highly
significant differences (P = < 0.001) were noted among pH. levels. It was noted that
PMEase activity in these plants was higher for both substrates when compared with the
13-day old seedlings. No peak of activity was detected at pH 3 .0 as for the 13-day old
seedlings.
4.123 25-day old seedlings These seedlings were grown for 18 days following transfer to nutrient solution.
Over the range of pH values tested, the maximum rate of activity was observed at pH 5 .5
with both P-limited and P-sufficient conditions (Fig 4.10). A rate of 0.09 umol mg d. wt~
1 h~l was observed in roots of P-limited plants and 0.07 umol mg d. wt ' l h"l was noted
in roots of P-sufficient plants while using pNPP substrate.
In the case of 4-MUP different results were noted. Again the peak of activity was
recorded at pH 5 .5 in both P-limited and P-sufficient conditions. The rates of activity
observed were 0.08, 0.07 umol mg d. wt"l h~l P-limited and P-sufficient conditions
respectively.
Table 4.9 shows that the interactions of substrate and phosphorus conditions were
highly significant (P = < 0.001). Highly significant differences (P = < 0.001) were
recorded for interactions among pH and the age of plants. The data also indicate highly

97
Fig. 4.10 Effect of plant age on PMEase activity of roots of cv Qalandri grown without and with phosphorus added to the growth medium pNPP used as substrate
*T 0.2 n
G) E
Q.
O E
o 0)
LU
0.1 H
o 0.2
0 0.2
0.1 H
0.1 H
pNPP (71 MM) o - P
+ P
13-day
19-day
25-day
7 8 9 10
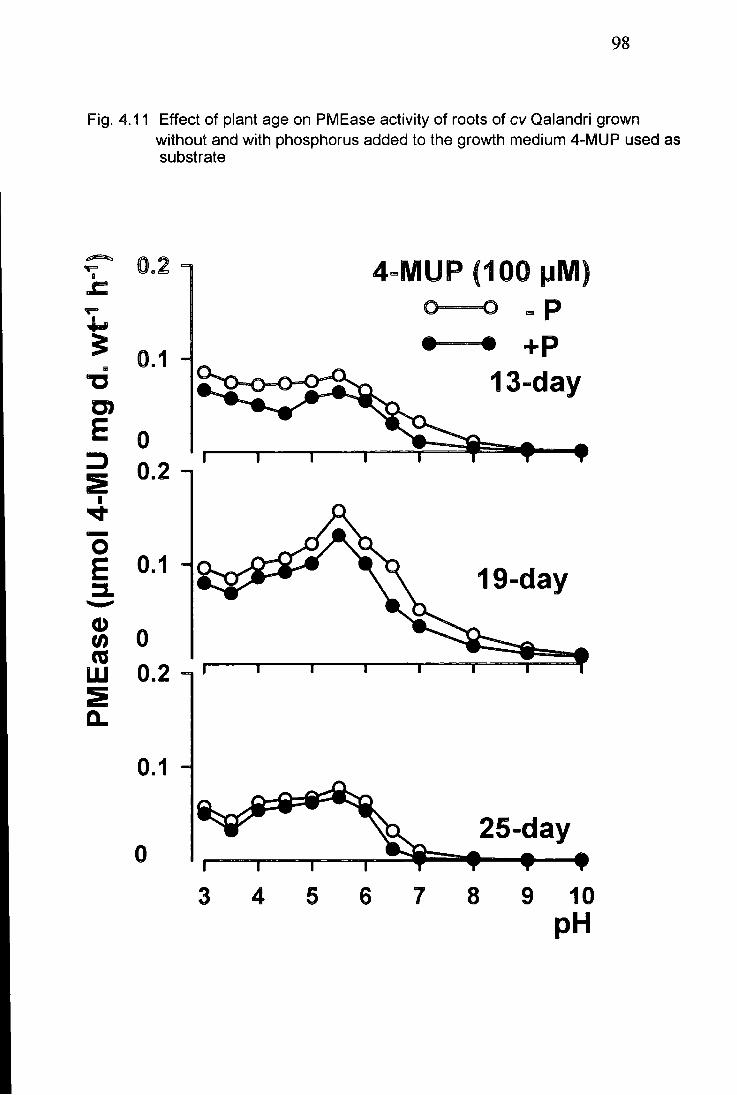
98
Fig. 4.11 Effect of plant age on PMEase activity of roots of cv Qalandri grown without and with phosphorus added to the growth medium 4-MUP used as substrate
0 4-MUP (100 uM o- o
0=1 13-day
D)
E 0.1 19-day
(0 0 (0 1 111 0.2
0.1
25-day
6 8 10 PH

99
significant differences (P = < 0.001) were observed between phosphorus conditions and
the age of plants. Interactions of substrate, pH and age of the plants were highly
significant (P = < 0.001).
These data show that PMEase activity increased from 13-day old seedlings to the
19-day old seedling and then decreased in the 25-day old seedlings. This was observed
for both substrates and both growing conditions.
Table 4.9 Summary of statistical analyses of effects of different ages of cv Qalandri
seedlings on PMEase activity.
ANOVA F(df) Probability
Age 1288 (2) ** 0.001
pH 775(11) ** 0.001
Substrate 197(1) ** 0.001
Condition 522 (1) ** 0.001
Age x pH 35(22) ** 0.001
Age x substrate 17(2) ** 0.001
Age x condition 32 (2) ** 0.001
Age x pH x substrate 4(22) ** 0.001
Age x substrate x condition 3(2) * 0.05
4.13 Effect of growth medium conditions on PMEase activity and phosphorus content in cv Qalandri seedling roots
The increase in PMEase activity between the 13-and 19-day old seedlings could
result from a build up of phosphate deficiency in the plant as a whole. This would be

100
particularly the case for the plants grown with phosphate added where phosphorus supply
could become limiting.
In order to test this possibility were experiments set up where the level of
phosphate in the growth medium was renewed or replaced with medium without added
phosphate at times during the 19-day growth period. To do this seedlings were grown for
the 12-day treatment period with or without added phosphorus but for some plants the
medium was changed at 6 days of treatment. Here the plants were transferred to fresh
medium which contained no added phosphorus or phosphorus added to the normal level.
Table 4.10 indicates that when pNPP was used as a substrate the highest PMEase
activity 0.15 umol mg d. wt"* h~l was noted in the plants grown 6 days without
phosphorus added to the growth medium followed by 6 days in fresh medium (-P).
Fig.4.1 shows clearly that the longer treatment period for seedlings resulted in an increase
in PMEase activity both in the media with and without added phosphate (Treatments 1 &
2 and 5 & 6). In both cases highest activity was found in the plants grown without added
phosphorus.
Plants which were grown without added phosphate for 6 days followed by a
further 6 days in fresh medium without phosphate (7) had higher activity than those grown
similarly with media containing phosphorus (8). However, both of these sets of plants
had higher activity than those grown in the same type of medium but without it being
changed (5 & 6).
When plants were grown in medium without added phosphorus for 6 days
followed by a further 6 days in medium with phosphorus (3) there was a supression of
PMEase activity. The transfer of plants from conditions of phosphorus addition to those
of no phosphorus addition related in a increased PMEase activity (4).
The important determination was that the PMEase activity built up in plants here
when the level of phosphate in the plant medium was maintained (8). This indicates that
PMEase level is related to the age of the plant rather than phosphate limitation in the
growth medium

101
Root internal phosphate levels are not closely converted with surface PMEase
activity. It therefore, is probable that phosphatase activity is modulated by phosphate
conditions at the surface of the roots. This is shown in Table 4.10 where under treatment
2 there is a high phosphate level but low PMEase activity compared with 3 where there is
a similar PMEase activity but a low phosphate level. Similar effects were seen in a
comparison of 4 and 8. The assays using 4-MUP, however, did not show these effect as
clearly as in those where pNPP was used.
Table 4.10 Effect of growth medium on PMEase activity (umol mg d. wt ' l h"l) at pH
5.5, and phosphorus content in cv Qalandri seedling roots (n = 4, ± SD).
Treatments Phosphorus content PMEase activity (umol mg d. wt~l h"l)
mg g-1 d. wt d. wt pNPP 4-MUP
1 19.17 ± 1.26 0.02 ± 0.00 0.06 ± 0.00 0.04 ± 0.00
2 56.44 ± 1.13 0.03 ± 0.00 0.05 ± 0.00 0.03 ± 0.00
3 14.48 ± 0.75 0.05 ± 0.00 0.05 ± 0.00 0.05 ± 0.00
4 14.64 ± 1.18 0.05 ± 0.00 0.10 ±0.00 0.05 ± 0.00
5 15.62 ± 1.52 0.03 ± 0.00 0.13 ±0.00 0.08 ± 0.00
6 52.18 ±2.37 0.06 ± 0.00 0.08 ± 0.00 0.05 ± 0.00
7 13.57 ±0.46 0.03 ± 0.00 0.15 ±0.00 0.09 ± 0.00
8 53.75 ±0.85 0.07 ±0.01 0.10 ±0.00 0.05 ± 0.00
ANOVA F (df) F.Prob. F (df) F.Prob.
Treatment 920(7) ** 928(7) **
Substrates - 3771(1)**
Treat x subs - 78 (7) **
1 = 6 days without phosphorus added to the growth medium
2 = 6 days with phosphorus added to the growth medium

102
3 = 6 days without phosphorus added to the growth medium, followed by 6 days with
phosphorus added to the growth medium
4 = 6 days with phosphorus added to the growth medium, followed by 6 days without
phosphorus added to the growth medium
5 = 1 2 days without phosphorus added to the growth medium
6 = 1 2 days with phosphorus added to the growth medium
7 = 6 days without phosphorus added to the growth medium, followed by 6 days in fresh
medium (-P)
8 = 6 days with phosphorus added to the growth medium, followed by 6 days in fresh
medium (+P)
4.14 Split root system In order to investigate further the influence of phosphate in the root in contrast to
that in the medium split root experiments were set up. Here one half of the root system
was incubated in a medium to which phosphate was added while the other half was
maintained in medium without added phosphorus. PMEase activity was then assayed and
compared for the two sets of root tissues.
For this experiment the optimum pH of 5 .5, two substrates pNPP & 4-MUP, and
cv Qalandri were used.
The results in Table 4.11 indicate that the half set of roots without phosphorus
added to the medium gave higher PMEase activity with both the substrates pNPP, 4-MUP
respectively. The other set of roots grown with phosphorus added to the growth medium
gave less PMEase activity also with both the substrates pNPP, 4-MUP. The phosphorus
content in the roots which were grown up with phosphorus added to medium showed a
higher phosphorus concentration (13.92 mg g"̂ d. wt) in comparison to the roots grown
without phosphorus added to the medium (8.02 mg g~l d. wt).

103
Table 4.11 Split root system of cv Qalandri seedlings, PMEase activity (umol mg d. wt"1
h"l) and phosphorus content (mg g~l d. wt) (n = 4, ± SD).
Substrate PMEase activity Phosphorus content
(umol mg d. wt~l h~l) Leaf Stem Root
-P +P - -P +P
pNPP 0.195 0.081 19.44 6.99 8.02 13.92
4-MUP 0.080 0.034 - . . .
4.15 Comparison of PMEase activity of three cotton cultivars 4.151 Overview
The PMEase activity of three different cotton cultivars, from different (origin)
parents grown in different ecological zones of Sindh Pakistan were used as detailed in
Chapter 2. Each cv was assessed for its PMEase activity in terms of pH range, peak
activity and substrate utilization. These assessments were carried out on plants which had
been grown both without and with phosphate added to the growth medium.
A comparison was made to estimate PMEase activity of the different cultivars in
order to assess their potential for utilising of soil organic phosphate with particular
reference to soil conditions in Pakistan.
4.152 cv Qalandri The results in Fig. 4.12, where pNPP was used as the substrate, show the
maximum PMEase activity at pH 5.5. The activity increased after pH 4.0 to the
maximum at pH 5.5 and started to decrease from pH 6.5 to 10.0. Table 4.12 shows that
the plants raised without and with phosphorus added to the growth medium showed a
highly significant difference in activity (P = < 0.001). The roots of plants grown without

104
phosphorus in the medium showed more PMEase activity at all pH levels, the range being
0.009 (pH 10.0) to 0.215 umol mg d. wt _ 1 h _ 1 (pH 5.5) in comparison with the plant
roots grown with phosphorus added to the medium where the range was 0.002 (pH 10.0)
to 0.151 umol mg d. wt"l h -* (pH 5 .5). In terms of percentage, the roots of plants
grown without phosphorus added to the growth medium yielded 29 % more activity than
those with phosphorus, at their peak pH level. Highly significant differences (P = <
0.001) (Table 4.12) were found among pH levels. It is clear (Fig. 4.12) that the peaks of
PMEase activity for without and with phosphorus added plant roots were observed at pH
5 .5. Statistically highly significant results were found for the interaction of P-condition
and pH levels (Table 4.12).
Fig. 4.12 shows that when the substrate 4-MUP was used acid PMEase activity
was recorded with the peak activity at pH 5.5. The activity increased from pH 4.0 and
reached its climax at pH 5.5. Activity declined from pH 6.5 onwards. The data (Table
4.12) for the plants grown with and without phosphorus added to the growth medium
conditions were highly significant (P = < 0.001).
The plants grown without phosphorus added to the growth medium showed higher
PMEase activity at all pH levels ranging from 0.004 (pH 10.0) to 0.184 umol mg d. wt"l
h ' l (pH 5.5) against plants grown with phosphorus added to the growth medium having
0.002 (pH 10.0) to 0.138 umol mg d. wt" 1 h"1 (pH 5.5). The ratio of PMEase activity of
the plants grown without phosphorus added to the growth medium and the plants grown
with phosphorus to the growth medium was recorded as 1.33 at peak pH. Highly
significant differences (P = < 0.001) were noted between pH s.
Highly significant differences (P = < 0.001) were recorded in interaction between pH
and phosphorus status condition. For both conditions of the phosphorus a straight line
slope (Fig. 4.13) was obtained.
Activity declined from pH 6.5 onwards. The data (Table 4.12) for the plants
grown without or with phosphorus added to the growth medium were both highly
significant (P = < 0.001).
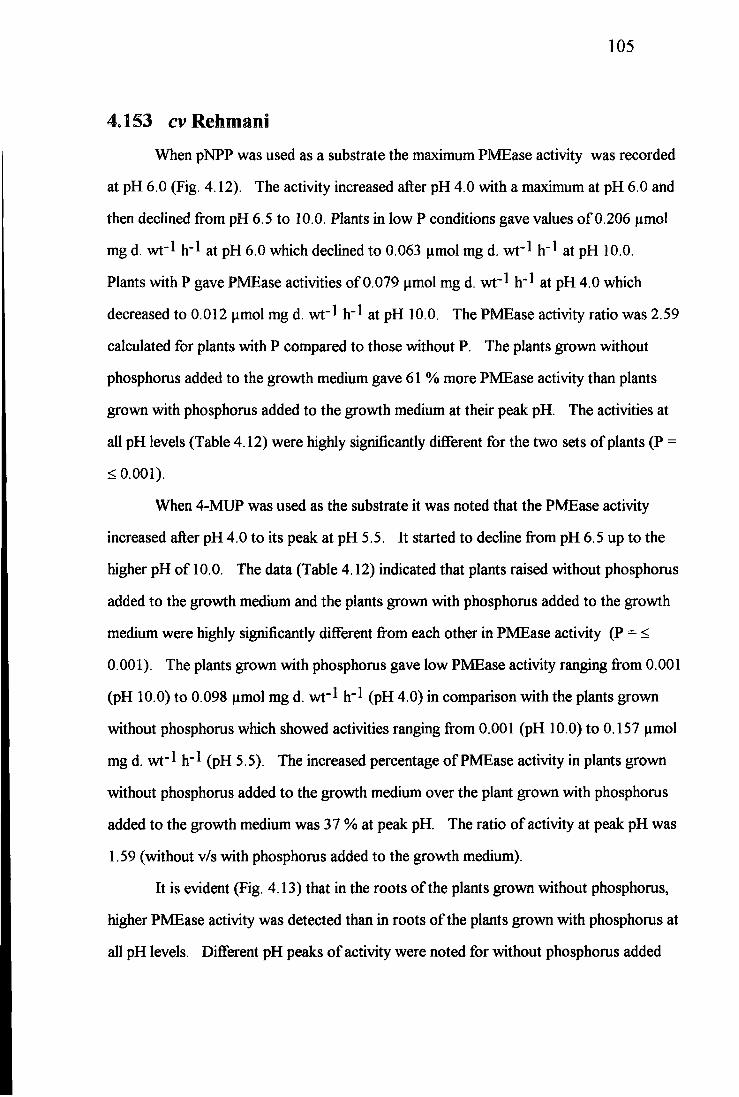
105
4153 cv Rehmani When pNPP was used as a substrate the maximum PMEase activity was recorded
at pH 6.0 (Fig. 4.12). The activity increased after pH 4.0 with a maximum at pH 6.0 and
then declined from pH 6.5 to 10.0. Plants in low P conditions gave values of0.206 umol
mg d. wt"l h"l at pH 6.0 which declined to 0.063 umol mg d. wt'* h"1 at pH 10.0.
Plants with P gave PMEase activities of 0.079 umol mg d. wt~l h"l at pH 4.0 which
decreased to 0.012 umol mg d. wt~l h~l at pH 10.0. The PMEase activity ratio was 2.59
calculated for plants with P compared to those without P. The plants grown without
phosphorus added to the growth medium gave 61 % more PMEase activity than plants
grown with phosphorus added to the growth medium at their peak pH. The activities at
all pH levels (Table 4.12) were highly significantly different for the two sets of plants (P =
< 0.001).
When 4-MUP was used as the substrate it was noted that the PMEase activity
increased after pH 4.0 to its peak at pH 5.5. It started to decline from pH 6.5 up to the
higher pH of 10.0. The data (Table 4.12) indicated that plants raised without phosphorus
added to the growth medium and the plants grown with phosphorus added to the growth
medium were highly significantly different from each other in PMEase activity (P = <
0.001). The plants grown with phosphorus gave low PMEase activity ranging from 0.001
(pH 10.0) to 0.098 umol mg d. wt~l h~l (pH 4.0) in comparison with the plants grown
without phosphorus which showed activities ranging from 0.001 (pH 10.0) to 0.157 umol
mg d. wt"l h"l (pH 5.5). The increased percentage of PMEase activity in plants grown
without phosphorus added to the growth medium over the plant grown with phosphorus
added to the growth medium was 37 % at peak pH. The ratio of activity at peak pH was
1.59 (without v/s with phosphorus added to the growth medium).
It is evident (Fig. 4.13) that in the roots of the plants grown without phosphorus,
higher PMEase activity was detected than in roots of the plants grown with phosphorus at
all pH levels. Different pH peaks of activity were noted for without phosphorus added

106
Fig. 4.12 Influence of pH on PMEase activity of roots of three cotton cultivars grown without and with phosphorus added to the growth medium pNPP used
as substrate
pNPP 71 uM 0.3
0.2 cv Qalandn
c 0.1
cv Rehmam 9 0.1 (0
LU
cv Reshami
0.1
3 4 5 6 7 8 9 10 PH

107
Fig. 4.13 Influence of pH on PMEase activity of roots of three cotton cultivars grown without and with phosphorus added to the growth medium using pNP as a substrate
4-MUP 100 uM) 0.24 o—o
0.16 cv Qalandri
0.08
0.24 8 10
0.16
cv Rehmani 03 0.08 LU
0.24
0.16
cv Reshami 0.08
8 10 PH

108
plants (pH 5.5) and with phosphorus added plants (pH 4.0). For pH the differences were
significant (P = < 0.01) Table 4.12.
4.154 cv Reshami The peak of PMEase activity with pNPP substrate was noted at pH 4.5 (Fig. 4.12).
It started to decline slightly after pH 5.0 up to pH 10.0. The data (Table 4.12) show that
the plants raised in without phosphorus and with phosphorus were highly significantly
different from each other with regard to PMEase activity (P = < 0.001).
The plants grown without phosphorus added to the growth medium showed
higher PMEase activity at all pH levels. Plants grown without the addition of phosphate
to the culture media showed PMEase activities of 0.080 umol mg d. wt~l hr* and 0.245
umol mg d. wt~l h~l at pH 10.0 and 4.5 respectively. In contrast the plants grown with
phosphorus added to the medium culture had PMEase activities of 0.023 umol mg d. wt"
1 h"l and 0.100 umol mg d. wt~l h~l at pH 10.0 and pH 5.0 respectively. The increased
percentage of activity of plants without phosphorus over the plants with phosphorus was
58 % at the peak pH. Interaction between pH levels and phosphorus conditions were
highly significant (P = < 0.001).
When 4-MUP was used as the substrates to detect the PMEase activity in cotton
cv. Reshami (Fig. 4.13) the peak PMEase activity was recorded at pH 6.0. The activity
increased after pH 4.0 and reached its climax at pH 6.0. activity and then started to
decrease again from pH 6.5. The data (Table 4.12) indicate that plants grown without
phosphorus added to the growth medium and the plants grown with phosphorus added to
the growth medium were highly significantly different from each other (P = < 0.001).
The plants grown without phosphorus added to the growth medium produced
higher PMEase activity at all pH levels ranging from 0.1957 (pH 6.0) to 0.0028 umol mg
d. wt~l h~l (pH 10.0). The plants grown with phosphorus added to the growth medium
showed 0.0988 (pH 6.0) to 0.0009 umol mg d. wt" 1 h"1 (pH 10.0). The plants grown

109
without phosphorus added to the growth medium gave 49 % more PMEase activity than
the plants grown with phosphorus added to the medium. The pH values shown (Table
4.12) were highly significant (P = < 0.001). The interaction of between pH and
phosphorus conditions were also highly significant (P = < 0.001).
Table 4.12 Summary of statistical analyses of PMEase activity in three cotton cultivars
with range of pH, grown without and with phosphorus added to the growth medium.
ANOVA F(df) Probability
Cultivars 27(2) ** 0.001
pH 99(11) ** 0.001
Conditions 564(1) ** 0.001
Substrate 106(1) ** 0.001
cvx pH 5(22) ** 0.001
cv x condition 38(2) ** 0.001
cv x substrates 17(2) ** 0.001
cv x pH x condition N.S
cv x condition x substrate 11(2) ** 0.001
4.16 Influence of pH on PMEase and PDEase activities of cv Qalandri
The results in Fig. 4.14 indicate that when pNPP was used as substrate the
maximum PMEase activity was recorded at pH 5 .5 in both growing conditions, the activity
declined after pH 6.5. While bis-pNPP was used as substrate a similar trend of PDEase
activities were observed. However, the rate of activity was lower than with pNPP at all
pH values in both plant growing conditions. The ratio of optimum pH activity of

110
Fig.4.14 Influence of pH on PMEase & PDEase activity of roots of cv Qalandri grown without and with phosphorus added to the growth medium pNPP and bi-pNPP used as substrates
pNPP (71 pM) 0 P o o
n P • +
£ 0.1
3
o o
0.2 m bis pNPP (100 pM)
0 1
0 8 9 10 6 3 4 5
PH

I l l
PMEase v/s PDEase 1.8 and 2.0 were recorded in the plants which were grown without
and with phosphorus added to the growth medium respectively. There ratios were
obtained even though the concentration of bis-pNPP was higher than the pNPP. The
results indicate that PMEase activity is more dominant in cotton roots.

112
CHAPTER 5
5.1 P(VI Ease activity in cotton seedling roots in relation to plant
mineral content
5.11 Overview
The purpose of this study was to determine the concentrations of phosphorus,
nitrogen, potassium and magnesium in the leaves, stem and roots of different cultivars of
cotton seedlings. In the case of root tissues as well as mineral determination, PMEase
activity was also assayed. To do this seedlings were grown in growth media where the
element was either added or omitted.
5.12 Phosphorus content of individual parts of cotton seedlings
The phosphorus content of the leaves, stems and roots of cotton cultivars seedlings
are shown in Table 5.1. In all cases the level of phosphate was higher in those seedlings
which were grown in medium which contained the phosphorus. However, phosphate
content of the different cultivars showed obvious differences.
For leaf tissue, cv Rehmani showed the highest amount of phosphorus (41.72 mg
g-1) whereas cv Qalandri showed the lowest amount (37.93 mg g - 1 ) for plants grown
without added phosphorus. In contrast, where plants were grown with phosphorus added
to the growth medium cv Reshami showed the highest concentration of phosphorus (86 .62
mg g" 1) and cv TH-3/83 showed the lowest concentration of phosphorus (72.85 mg g" 1).
Table 5.1 shows highly significant values for differences between the cultivars (P < 0.001).
There was a highly significant difference between the plants grown with and
without phosphorus added to the growth medium (P < 0.001). There were also highly
significant differences between the cultivars and the conditions < 0.001).

E T3
s X !
O 60 <D
43 OH +
o p-« o s <=>' <-» - H
•3-o
o o © - H
VO VO O
O O
© -H
wo o
o o o -H
X> o
o o o o o o
© O
2 o "H
oo o
o o o -H
o o o o -H
o o o o -H
r° oo ( N CO O W
—< ON >-i r--
PH +
© m o § d © "H
co o
o o © -H
o I—I ©
o o d -H
VO o
o o d -H
o t-c
PH
O O
O O
o r-< O 2 d r S - H
VO ( N
O O d +1
o o d -H
CO o o d -H
-a CO ON
R — C N co ON CO CN
on
PH +
vo VO O ^ h -
IT) -H < N
CN oo -H
vo o\ 00 -H
vo o vb
CO -H
X o
o o o o o o
C 43
o
i C/3
•a i-4
PH +
PH +
vo 00 ON VO 00 uri
ro d d >/-i i—i vb -H ON -H -H vb -H
00 ON
o -H
o o CO
ON 00 - H
ON O C N
o < N CN -H
ON O CN -H
CO 00 CN 00 o VO VO ON ,_; ,_; ON d -H
IT)
-H
ir>
CN 41
t--
-H
CO CO >n (N <N CN o IT) 1-o o VO CN 00 ^_<'
vb -w
CO
iri r~- -H
< N
vb 00
-H CN r-~
-H
ON CN 00 CO vO <—< ON d ,—i NO f-' CO
-H 5 -H 00 CO -H 00 CO -H
•8
X ) o
T3
r—H —̂ CO t—t CO ""•»' VO —̂" o 00 CN
wo o o o o o d d d / N
i—i —̂s CN CO CO —' —̂
ON i—i
O o o O o o d d d i—(
-\ —̂̂ CO CO co —̂' o CN CO CN
•c T3
13 a> Pi
CO oo co SCS H
> o
CO 1
c
cs o
c o o

114
For stem tissues Table 5 .1 shows that the highest phosphorus concentration,
(15.97 mgg-1), was detected in the cv TH-3/83 and the lowest concentration (12.76 mg
g"l) was noted in cv Reshami grown without phosphorus added to the growth medium.
While with phosphorus added to the growth medium, the highest phosphorus
concentration (49.09 mg g"l) was recorded in cv Reshami and the lowest (37.00 mg g~l)
was noted in the cv Rehmani.
Table 5.1 shows significant differences between the cultivars (P < 0.05). Highly
significant differences (P < 0.001) were observed between plants, from all cultivars, grown
with and without phosphorus added to the growth medium. Highly significant differences
(P < 0.001) were recorded for the interaction between cultivars and conditions.
In root tissues Table 5.1 indicates that when plants were grown without
phosphorus added to the growth medium, the highest phosphorus concentration (19.58 mg
g ' l ) was noted in cv Rehmani, and the lowest phosphorus concentration (11.50 mg g~l)
was noted in cv Reshami. While plants grown with phosphorus added to the growth
medium, the highest phosphorus concentration, (56.96 mg g~l) was detected in cv
Reshami. and the lowest phosphorus concentration (46.06 mg g~l) was detected in cv TH-
3/83.
Table 5.1 shows a highly significant differences (P < 0.001) for the cultivars and
highly significant differences (P < 0.001) were recorded between the plants grown with
and without phosphorus added to the growth medium. Highly significant differences (P <
0.001) were found in the interaction between plants grown in different conditions (with
and without phosphorus added) and plants from different cultivars.
Table 5.1 shows a comparison of PMEase activity for different cultivars at the
previously ascertained optimum of pH 5 .5 for cv Qalandri when pNPP was used as the
substrate. The highest PMEase activity of 0.157 umol mg d. wt" l h~l was recorded in
the cv Reshami, and the lowest activity, 0.122 umol mg d. wt"* h - * was noted in the cv
Rehmani, when phosphorus was not added to the growth medium. The data also show
that the highest PMEase activity, 0.101 umol mg d. wt"l h~l was observed in cv Reshami,

115
while the lowest PMEase activity, 0.073 umol mg d. wt~l h~l was recorded in cv Rehmani
when phosphate was added to the medium. In both treatments cv Reshami displayed the
highest overall activity.
The data (Table 5.1) for the cultivars are highly significant (P = < 0.001). Highly
significant differences (P = < 0.001) were noted in plants grown with and without
phosphorus in the growth medium whereas non-significant differences were noted in the
interaction between cultivars and conditions.
Table 5.1 indicates that when 4-MUP was used as substrate, the highest PMEase
activity, 0.104 umol mg d. wt~l h~l was observed in cv Qalandri and the lowest PMEase
activity, 0.073 umol mg d. wt"l h"l was in cv Rehmani, in growth medium lacking added
combined phosphorus. The results show that when the plant is grown with combined
phosphorus to the growth medium, the maximum PMEase activity, 0.066 umol mg d. wt~l
h~l was recorded in cv Reshami and the lowest PMEase activity 0.045 umol mg d. wt~l h"
1 was noted in the cv TH-3/83.
The data (Table 5.1) for all the cultivars were highly significant (P < 0.001).
Highly significant differences (P < 0.001) were noted in conditions. The highly significant
differences (P < 0.001) were recorded for the interaction between cultivars and conditions.
5.2 Determination of macroelements in seeds of different
cultivars
In order to assess their availability for seedlings the levels of various minerals were
measured in seeds of different cultivars
The data shown in Table. 5.2 indicate non-significant differences among cultivars
for seed phosphorus levels. The highest seed phosphorus was 0.53 % in cv TH-3/83 and
lowest was 0.49 % in cv Reshami. Any manipulation of phosphate levels in the growth
media would therefore be independent of initial plant phosphate levels.

116
The results show highly significant differences (P < 0.001) for nitrogen between
the cultivars. The highest nitrogen content, 3 .43 % was recorded in the cv Qalandri and
the lowest 1.14% was noted in the cv Reshami.
The data (Table. 5.2) indicate non-significant differences among cultivars for
potassium. The highest seed potassium, 5 .42 % was observed in cv Reshami and the
lowest potassium, 5.11 % in cv Qalandri.
The results show that non-significant differences among the cultivars for
magnesium content in the seed. The highest magnesium content, 1.20 % was recorded in
cv Qalandri and lowest 1.14% was recorded in cv Rehmani and TH-3/83.
Table 5.2 Phosphorus, nitrogen, potassium and magnesium contents of seeds of four
different cultivars of cotton, data is expressed as a %, (n = 4, ± SD).
Cultivars Phosphorus Nitrogen Potassium Magnesium
Qalandri 0.52 ± 0.00 3.43 ±0.13 5.11 ±0.07 1.20 ± 0 . 0 9 %
Rehmani 0.50 ±0.02 2.16 ± 0.11 5.15 ±0.22 1.14 ±0.03
Reshami 0.49 ± 0.03 1.14 ±0.08 5.42 ± 0.48 1.15 ±0.23
TH-3/83 0.53 ±0.03 1.86±0.17 5.25 ±0.17 1.14 ±0.03
ANOVA F(df) Prob.
Cultivar N.S 198 (3) 0.001 N.S N.S

117
5.3 Nitrogen content of individual parts of seedlings of different
cultivars
Nitrogen content was determined in the individual parts of cotton seedlings when
the plants were grown in conditions where nitrogen was added to or omitted from the
growth medium Fig 2.2. Results of the analyses are shown in Table 5 .3.
For leaf tissues Table 5.3 indicates that in plants grown without nitrogen added to
the growth medium, the highest nitrogen concentration (84.85 mg g"l) was noted in cv
Reshami and the lowest concentration (48.02 mg g"l) was noted in cv Rehmani. While in
plants grown with nitrogen added to the growth medium, plants from the cv TH-3/83 had
the highest (96.33 mg g~l) concentration of nitrogen and the lowest concentration of
nitrogen (56.87 mg g"*) were found in the cv Rehmani.
Table 5.3 shows highly significant differences (P < 0.001) were found among the
cultivars. Highly significant differences (P < 0.001) were noted in plants grown with and
without nitrogen added to the growth medium. Non-significant differences were noted
for the interaction between cultivars and plants grown in the two conditions (with and
without nitrogen added to the growth medium).
For the stem tissues, Table 5.3 indicates that the plants grown without N added to
the growth medium, the highest nitrogen concentration (65.00 mg g~l) was recorded in cv
Reshami and the lowest concentration (38.75 mg g~l) was observed in cv Rehmani.
When plants were grown with nitrogen added to the growth medium, the highest nitrogen
concentration (68.99 mg g~l) was noted in cv Reshami and the lowest concentration,
(38.33 mg g"l) was recorded in cv Qalandri.
Table 5.3 shows that highly significant differences (P = 0.001) were noted among
the cultivars. Highly significant differences (P < 0.001) were found for the plants grown
with and without nitrogen added to the growth medium. Non-significant differences were
found in the interaction between cultivars and conditions.
For root tissues, Table 5.3 indicates that the plants grown without combined
nitrogen in the growth medium, the highest (38.60 mg g~l) was found in cv TH-3/83 and

118
the minimum, (17.56 mg g _ 1 ) was obtained in cv Rehmani. When the plants were grown
with combined nitrogen in the medium, the highest nitrogen (144.60 mg g"^) was recorded
in cv Reshami and the lowest (90.41 mg g~l) was found in cv Rehmani.
Table 5.3 shows highly significant differences (P < 0.001) were noted among the
cultivars. The highly significant differences (P < 0.001) were obtained in plants grown
with and without combined nitrogen in the growth medium. The interaction between
cultivars and conditions were highly significant (P < 0.001)
The results in Table 5 .3 show a comparison of PMEase activity for different
cultivars at the previously ascertained optimum of pH 5.5 when pNPP was used as the
substrate, and plants grown without nitrogen added to growth medium. The maximum
PMEase activity 0.203 umol mg d. wt~l hf* was noted in cv Rehmani, and the lowest
PMEase activity 0.142 umol mg d. wt~l h~l was observed in cv Reshami. With the plants
grown with nitrogen added to the growth medium the highest PMEase activity 0.129 umol
mg d. wt"l h"l was observed in cv Qalandri and the lowest PMEase activity 0.115 umol
mg d. wt"l h"l was recorded in cv Reshami. Highly significant differences (P < 0.001)
were found among cultivars.
For the plants grown with and without nitrogen added to the growth medium
differences were highly significant (P < 0.001). The interaction for cultivar and conditions
were significant (P < 0.05).
The data in Table 5.3 indicate that when 4-MUP was used as a substrate and plants
were grown without nitrogen added to the growth medium a PMEase activity of 0.100
umol mg d. wt~l h"l was noted in cv Rehmani. The lowest recorded PMEase activity
was 0.058 umol mg d. wt"* h~l found in cv Reshami. When the plants were grown with
N added to the medium, the highest PMEase activity of 0.074 umol mg d. wt" 1 h _ 1 was
noted in the cv Rehmani and the lowest PMEase activity, 0.042 umol mg d. wt"l h"l was
recorded in the cv Reshami.

o <
a o 3
o o 3 9t 5' 3
00 t o
i — • U )
2 C/3
O O
t o
O O
o o
4*. -J
ON
o b ©
o o
t o -J. 00
o o
o b o
4^ ON u> o
— '
o o o
© o o o o
ON 4^ t o ^ ^ 4^ > o ON t o
— ' ^—^ i — i
' '
o o o
o b o o o
o
3
Cu
o
/5 £5
a-
o or
a. >2>
o c r
H -
4*-
ON
*0 H -o t o a -
H -
ON
H -
t o
b o
H -
t o b
3 ^ o
o b
H -
o b
o b o
H -
o b o
H
00
00 t o
VO
VO ON
4^ 00
ON ON 00
00 ON o
4i . t o
00 o
ON ON
t o
ON
o b -J
o
ON
0>
H -u> VD o
H -
4*.
H -
o o 4^
H -
t o
4^ ON
H -
vO ON
H -
b o
H -O b
H -
o
© o
H -
o
© o
H -
o
b o
00 4^. 00
v o t o
t o o o
ON © o
ON 00 VO
NO
00
4^ 4 ^ ON o
4 ^ t o
o
b o o
o b 4 ^ t o
H -
4a. b t o
H -
4^ -O ON
H -
ON t o
o b o
re
00 b t o
ON 00 - o
ON
o
©
4i
H -
vO
(f u> t o VO
t o
H -o
a-a.
ON 00
~ o - J
b ON 4s.
H -4^
H -U ) 00
t o L o - o 00 b 4s- 00
H -i — *
H -t o - J
t o
UJ ON w vO t o
hf- o H - u> 4i . t o o
t o i—. NO t o ~ o ON
H -O O
o t o o o
b b
H -p
H -O
o o t—* t o
b t o o VO o
p K -
p o o o b
- o
b o b o o
o b o -J o
+ 2
+ 2
+ 2
1 ro
'•3
+
+
r fa
C/3
o 3
o
n c < •
d 00 <5 3 O o 3 n> 3
3 (TO era
9~ H II § •
V
< 3
g § 8 8 8 3-
^ g ^ N — N
T= 3 3 £ - 0 0 ,
^ 3 '
I c 1 — 1 £
O p
O <n o n>
ft- Q, S?. " 52 OQ C izi 8 CPQ • "i
O
3
3* O c
o
OQ 3
a.
3 -
«Q o
21 3 -3 a.

120
Highly significant differences (P < 0.001) were found between the cultivars.
Highly significant differences (P < 0.001) were noted in the plants grown without nitrogen
added to the growth medium. Significant differences (P < 0.05) were noted in the
interaction between cultivars and conditions.
5.4 Potassium and phosphorus content in cv Qalandri seedling
parts and their effect on root PMEase activity
The seedlings were grown without and with potassium added to the growth
medium. In addition a study was made to investigate the potassium and phosphorus
content (mg g-1 d. wt), and their effect on PMEase activity, of root tissues. For this
experiment one ion, two substrates (pNPP, 4-MUP) and one cultivar were selected.
For leaf tissues, Table 5.4 indicates that the maximum potassium (213.25 mg g~l d.
wt) was observed in the plants grown with potassium added to the growth medium, while
(206.25 mg g~l d. wt) was noted in the plants grown without potassium added to the
medium. When the influence of potassium was determined on plants grown with
phosphorus the maximum phosphorus content (73.07 mg g ' l d. wt) was observed in the
plants grown without potassium added to the growth medium. In contrast, a
concentration of 72.61 mg g"l d. wt was noted in the plants grown with potassium to the
growth medium.
Table 5.4 shows that the plants grown without and with potassium in the growth
medium had significant differences in their potassium levels (P = < 0.05). Highly
significant differences (P ~ < 0.001) were found between the concentration of potassium
and phosphorus in the leaves. Significant differences (P = < 0.05) were recorded between
interactions of conditions and ions. However, no significant differences were seen in the
phosphorus contents between the leaves of those plants grown without or with added
potassium to the growth medium.

121
For the stem tissues, maximum potassium (63.25 mg g" 1 d. wt) was recorded in
the plants grown with potassium added to the growth medium and the lowest (51.5 mg g"
1 d. wt) was obtained in the plants grown without potassium added to the growth medium.
The maximum phosphorus (17.38 mg g"^ d. wt) was found in the plants which were
grown with potassium added to the growth medium, and 13.81 mg g~l d. wt phosphorus
was noted in the plants grown without potassium added to the growth medium.
Table 5 .4 shows that stems of plants grown without and with potassium added to
the growth medium had highly significant differences in their potassium levels (P = <
0.001). Highly significant differences (P = < 0.001) were observed between the
concentration of potassium and phosphorus in the tissues. Highly significant differences
(P = < 0.001) were found between interaction of conditions and ions.
For root tissues, the maximum potassium concentration (16.75 mg g~l d. wt) was
recorded in the plants grown with potassium added to growth medium, and 9.5 mg g'^ d.
wt potassium was recorded in the root of the plants grown without potassium added to the
medium.
When plants were grown with added phosphorus the highest phosphorus (30.71
mg g"l d. wt) was observed in the plants grown with potassium added to the growth
medium, whereas a concentration of 16.21 mg g~l d. wt was found in the plants grown
without potassium added to the growth medium.
Table 5 .4 shows that roots of plants grown without and with potassium added to
the growth medium were highly significant for the levels of phosphorus (P = < 0.001).
Highly significant differences (P = < 0.001) were found between the potassium and
phosphorus levels. Highly significant differences (P = < 0.001) were noted for the
interaction between conditions and ions. A significant difference was observed between
the levels of root phosphorus for plants grown without or with added potassium.
Table 5 .4 shows that when pNPP was used as a substrate the highest PMEase
activity 0.08 umol mg d. wt~l h~l was recorded in the root of plants grown without
potassium added to the growth medium, and 0.04 umol mg d. wt~* h~l was noted in roots

122
of plants grown with potassium added to the growing media. When 4-MUP was used as
a substrate the maximum PMEase activity 0.05 umol mg d. wt~* h f l was observed in
roots of plants grown without potassium added to the medium and 0.03 umol mg d. wt~l
h"l was found in root of plants were grown with potassium added to the growth medium.
5.5 Magnesium and phosphorus content in cv Qalandri seedling
parts and their effect on root PMEase activity
The seedlings were grown without and with magnesium added to the growth
medium. In addition a study was made to investigate the magnesium and phosphorus
content (mg g~l d. wt) and their combined effects on PMEase activity of root tissues. For
this experiment one ion, two substrates (pNPP and 4-MUP) and one pH were used .
Table 5.5 shows the magnesium concentration for plants grown without and with
magnesium added to the growth medium were just significant (P = < 0.05) probably
because magnesium pools in these plants are high. Highly significant differences (P = <
0.001) were found between the concentrations of magnesium and phosphorus, while non
significant differences were noted for interaction between condition and ions. However,
the overall pattern of ion concentrations was not seen for all of the plant parts.
For the leaf tissues, Table 5 .5 shows that the maximum magnesium content (31.45
mg g"l d. wt) was recorded in leaves of plants grown with magnesium added to the
growth medium, and 27.53 mg g~l d. wt magnesium was obtained in leaves of plants
grown without magnesium added to the growth medium.
When the influence of magnesium was determined on plants growth with
phosphorus the highest phosphorus content (69.32 mg g"l d. wt) was recorded in leaves
of plants grown with magnesium added to the growth medium, and 64.86 mg g~l d. wt
phosphorus was observed in leaves of plants grown without magnesium added to the
growth medium.

123
For the stem tissues, Table 5.5 shows that the maximum stem magnesium content
(5.08 mg g"l d. wt) was found in stems of plants grown without magnesium added to the
medium and 4 .63 mg g'^ d. wt magnesium was noted in stems of plants grown with
magnesium added to the growth medium.
The maximum phosphorus content (14.44 mg g~l d. wt) was recorded in stems of
plants grown with magnesium added to the growth medium, and a phosphorus content of
12.43 mg g"l d. wt was found in stems of plants grown without magnesium added to the
medium.
Table 5 .5 shows that stem of plants grown without and with magnesium added to
the growth medium were significantly difference (P = < 0.01). Highly significant
differences (P = < 0.001) were obtained between the magnesium and phosphorus content
of stem. Significant differences (P = < 0.05) were found for the interaction between
conditions and ions.
For the root tissues, Table 5.5 shows that the maximum magnesium (5.3 mg g~l d.
wt) was noted in roots of plants grown without magnesium added to the medium, and 2.93
mg g"l d. wt magnesium was found in roots of plants which were grown with magnesium
added to the growth medium. The maximum phosphorus (27.89 mg g"l d. wt) was
observed in roots of plants grown with magnesium added to the growth medium, with
17.90 mg g"l d. wt phosphorus being recorded in roots of plants which were grown
without magnesium added to the growth medium.
Table 5 .5 shows that root of plants grown without and with magnesium added to
the growth medium were significant (P = < 0.05). Highly significant differences (P = <
0.001) were observed between the magnesium and phosphorus content of root. Highly
significant differences (P = < 0.001) were noted for the interaction between condition and
ions. Table 5.5 shows that higher PMEase activity was detected with substrate pNPP and
lower PMEase activity was found with 4-MUP substrate. However, no differences were
found for both conditions, without and with added magnesium to the growth medium with
both the substrates.

o o 3 O -X I—> • o 3
o 3 V I
o O 3 a. r-t-'
5' 3
I—> 1—1 ON o --a / — V
* o o
* o o
-J NO ON - J
-J /—,. , — „ U\ 1—' 1—» y — V
' ' w
* * # * * * o o o o o o o o o 1—'
ON NO -J ON o NO -J u> ON ' N
s— t — ' ^ — N
1—1
* * * * * o o o o o o o o o
o U\ o cr
o a*
o cr
a->2>
o cr
a->2>
o cr
cr o 1/3
T3 3* O
2
O
P V I
H- -J H- ls> o i — ' o o ON
-J NO to u>
H- —1 ts) H- to
o ON © I—* is)
-J o
l>J H-© 00 © bo 1—1
H- 1—> -J H- ON
o IK) o to 00 l/l
ON o
H- ON p to p
In ON O
H- o H-o -J p i — *
o
H-o b o
o '© o
o b o
H-o b o
ON
-J
O ' © 00
o o 4̂
O
o
r
+
1 t / )
+
* 8
+
+
1 4^
+
s i s O
w 3 a> o o 3 o a
o 3
I 1!
OQ
en 55
a. o. (t a.
3*
o
3 -
3 n o. E' 3
o
O
VI VJ E' 3 P 3 a-
T3 3" O V5
•a 3* O
3 V3 o o 3 O fD
3 •i o 3
? OQ
3 a. I >-» to 3 s 1/1 o •-h o o <-•• r-+-o 3 C5 ri o
a-3.
2. E2-. C t
K' 3* 3 2 ( R
O . VJ CTQ
3* O
c P 3 Ci
ts)

o o 3
O 3
2 in
o 3 co
o o 3 & O * 3
o < >
to o - J
#
o o
to ^
8" en "3 3* O
2 CO
I f 2 P bo vo ON
* o ©
"1 o a*
* o ©
to o 00
* * o d o
* *
o o
VO
VO
* *
o o
* o
T l 43
2 3
- J T l
o d o a*
'—> a.
O
a*
T1
o cr
era 3 CO
E' 3
if ^ P L« ON U>
1 1 Tl H- i—» H-00 00 H- to H-23 (1
o p 1—1
23 (1
1—» >2> -o. to
H- i — * H-O o
to ~ U l
H- - j H-o VO • ON O
-o
H- to ;-o
H-o bo O © vo © i — 1
H-o d o
If o d o
H-p d o
H-© d o
o oo
to 'vo
o ON
o ON
O
O
30
H- ON VO H- (—> +
»— — (—» to to era
00
o 3 co
30
+
Kra
30
+
30
era
+
30
r CD
3
o o
W ?T 3 CD
B o o 3 O CD
a & O 3
I OQ
3
CO
E' 3 $» o-CD
o-
H a; S" tn in
to
CD
CO
E' 3
T3 3* O co Tt 3* O
2 CO O o 3 C3 n 3
3* CD
(ra
1 3* 3 CD o. E' 3 •9s
11 4̂ if £ on o" O 3 >^ ^ » 3 g. <E r ~ era
3 a.
I ft 3
CO
O
("1 n O B. 3 a. a. CO CP CD
a.
o •-*> o o
co o
3* O c
to

126
5.6 Influence of nitrogen on the PMEase activities of three
cultivars of cotton
5.61 Overview
A study was made of the influence of nitrogen nutrition on PMEase activity of
three cotton cultivars in order to assess any differential effect among them. A comparison
of PMEase activity among the cultivars, was made using two substrates over a range of
pH for roots of plants grow in media where phosphate was present but in the absence or
presence of combined nitrogen.
A full statistical analysis for all cultivars and all conditions is shown in Table 5.6.
5.611 cvQalandri
The results in Fig. 5.1 show when pNPP was used as the substrate the pattern of
activity for phosphate was the same as reported earlier (4.7,8 ). The PMEase activity of
the plants grown without nitrogen added to the growth medium and with nitrogen added
differed in a highly significant fashion (P = < 0.001). Plants grown without nitrogen
added showed higher PMEase activity at all pH levels ranging from 0.023 (pH 10.0) to
0.224 umol mg d. wt~l h~l (pH 6.0). In comparison the plants grown with nitrogen
added had activities of 0.016 (pH 10.0) to 0.212 umol mg d. wt" 1 h" 1 (pH 5.5). The
ratio of PMEase activity between the two nitrogen states was recorded as 1.15 at optimum
pH.
Highly significant differences (P < 0.001) were obtained between pH values. The
highly significant differences (P < 0.001) were noted in interaction between pH and
nitrogen status condition when plants with added nitrogen showed lower PMEase activity
at all pH's values tested.
The results in Fig. 5 .2 show that when 4-MUP was used as the substrate the
optimum of acid PMEase activity was at pH 5 .5. Plants grown without nitrogen added to
the growth medium and plants grown with nitrogen added showed highly significant

127
differences (P = < 0.001) between their PMEase activity. The plants grown without
nitrogen added gave higher PMEase activity at all pH levels ranging from 0.015 umol mg
d. wt" l h~l (pH 10.0) to 0.174 umol mg d. wt"l h~l (pH 5.5) against plants grown with
nitrogen added having 0.009 umol mg d. wt"l h"l (pH 10.0) to 0.092 umol mg d. wt~l h"
* (pH 5 .5). The ratio of PMEase activity was recorded 1.89 at optimum pH.
Highly significant differences (P = < 0.001) were recorded for PMEase activity
between all pH values. Highly significant differences (P = < 0.001) were obtained for the
interaction between pH and nitrogen status conditions
5.612 cv Rehmani
Fig 5.1 shows that with pNPP the PMEase activity was detectable between pH 3 .0
to 8.0 with a optimum at pH 5.0. The differences in PMEase activity between plants
grown without nitrogen added and plants grown with nitrogen added differed highly
significantly (P = < 0.001). Plants grown without nitrogen added showed higher PMEase
activity at all pH levels ranging from 0.024 umol mg d. wt~l h~l (pH 10.0) to 0.226 umol
mg d. wt"l h"l (pH 5.0) against plants grown with N added having an activity of 0.011
umol mg d. wt" 1 h" 1 (pH 10.0) to 0.196 umol mg d. wt" 1 h" 1 (pH 4.0). The ratio of
PMEase activity at the pH optima for plants without nitrogen v/s with nitrogen was 1.15.
Highly significant differences (P = < 0.001) were recorded for PMEase activity
between all pH values. Highly significant differences (P = < 0.001) were obtained for
interaction between pH and nitrogen conditions.
The data in Fig. 5.2 show that when 4-MUP was used as the substrate optimum
activity was reached at pH 5.5. The plants grown without nitrogen added to the growth
medium and the plants grown with nitrogen added were highly significantly different (P =
< 0.001) with regard to PMEase activity. The plants grown without nitrogen added
yielded higher PMEase activity at all pH levels ranging from 0.005 (pH 10.0) to 0.081
umol mg d. wt~l h"l (pH 5 .5) in comparison to the plants grown with nitrogen added

128
having activity of 0.004 (pH 10.0) to 0.065 umol mg d. w f 1 h" 1 (pH 4.0). The ratio of
PMEase activity was noted 1.23 at optimum pH.
Highly significant differences (P = < 0.001) were noted for PMEase activity
between all pH values. The highly significant differences (P = < 0.001) were obtained for
the interaction between pH and nitrogen status conditions.
5.613 cv Reshami The results in Fig. 5.1 show PMEase activity with pNPP reached its optimum at
pH 5 .5. The level of PMEase activity between plants grown without nitrogen added and
plants grown with nitrogen added in the growth medium showed highly significant
differences (P = < 0.001). Plants grown without nitrogen added gave higher PMEase
activity at all pH levels ranging from 0.014 (pH 10.0) to 0.185 umol mg d. wt~l h~l (pH
5.5) in comparison to the plants grown with nitrogen added having 0.009 (pH 10.0) to
0.146 umol mg d. wt~l h~l (pH 5.0). The ratio of PMEase activity was recorded as being
1.26 at the pH optima.
Highly significant differences (P = < 0.001) were noted for PMEase activity
between all pH values. Highly significant differences (P = < 0.001) were obtained for the
interaction between pH and nitrogen status conditions.
The results in Fig. 5 .2 show that when 4-MUP was used the acid PMEase activity
in this cultivar reached its optimum at pH 5 .5. Again, PMEase activity of plants grown
without nitrogen added and the plants grown with nitrogen added were highly significantly
different(P = < 0.001). The plants grown without nitrogen added gave higher PMEase
activity at all pH levels ranging from 0.017 umol mg d. w t - 1 h _ 1 (pH 10.0) to 0.103 umol
mg d. wt"l h"l (pH 5.5) against plants grown with nitrogen added with 0.008 umol mg d.
w f 1 h" 1 (pH 10.0) to 0.069 umol mg d. wt" 1 h" 1 (pH 5.5). The ratio of PMEase activity
was recorded as 1.46 at optimum pH.

129
Highly significant differences (P = < 0.001) were noted for PMEase activity
between all pH values. The highly significant differences (P = < 0.001) were recorded to
the interaction between pH and nitrogen status conditions.

130
Fig.5.1 Influence of pH on PMEase activity of roots of three cotton cultivars grown without and with nitrogen added to the growth medium using pNPP as a substrate
pNPP 71 uM N
• + N cv Qalandn
0.1
cv Rehmani 0.1
(0 L U
cv Reshami 0.1
3 4 5 6 7 8 9 10 PH

131
Fig.5.2 Influence of pH on PMEase activity of roots of three cotton cultivars grown without and with nitrogen added to the growth medium 4-MUP used as substrate
0.3
£ 0.2-1 •
O) 0.1 H E
^ 0.3
" I 0.2
05 0 LU
0.1 H
0.3 n
4-MUP (100 MM) o o _N
+ N cv Qalandri
cv Rehmani
cv Reshami 0.2 H

132
Table 5.6 Summary of statistical analyses for the plants grown without and with nitrogen
added to the growth medium.
Cultivars pH condition pH x condition Substrate
F(df) P F(df) P F(df) P
Qalandri 1715(11) < 0.001 869(1) < 0.001 9(11) < 0.001 pNPP
Qalandri 1942(11) < 0.001 4709 (1) < 0.001 191(11) < 0.001 4-MUP
Rehmani 153 (11) < 0.001 352 (1) < 0.001 71(11) < 0.001 pNPP
Rehmani 1786(11) < 0.001 4070 (1) < 0.001 185(11) < 0.001 4-MUP
Reshami 2823 (11) < 0.001 1700(1) < 0.001 49(11) < 0.001 pNPP
Reshami 2027(11) < 0.001 3053 (1) < 0.001 47(11) < 0.001 4-MUP
5 .7 Split root systems and PMEase activity Initial experiments using a split root system indicated that phosphate content within
the plant was partitioned and that this was related to PMEase activity. A similar set of
experiments were conducted to investigate this effect in different cultivars.
For this experiment four cultivars, two substrates and two phosphorus growth conditions
were used.
The results in Table 5 .7 show that when pNPP was used as the substrate the
highest PMEase activity, 0.213 umol mg d. wt~l h~l was noted in cv Reshami, and lowest
PMEase activity 0.152 umol mg d. wt~l h'* was observed in cv Rehmani, for the plant
roots grown without phosphorus added to the growth medium. When half of the plant
roots grown with phosphorus added to the growth medium, the maximum PMEase
activity, 0.081 umol mg d. wt~l h~l was recorded in cv Qalandri and the minimum
PMEase activity 0.058 umol mg d. wt"l h~l was found in cv Rehmani. Overall cv
Rehmani gave lowest PMEase activity in both conditions.

133
When 4-MUP was used as the substrate the highest PMEase activity was also
found in cv Reshami, and the lowest activity was noted in cv Rehmani, in the roots which
were grown without phosphorus added to the growth medium. Where plant roots were
grown with phosphorus added to the growth medium, the highest activity was recorded in
cv TH-3/83 and the minimum 0.033 umol mg d. w t ' l h~l was noted in cv Reshami.
The data in Table 5.7 show that highly significant differences (P = < 0.001) were
recorded in activity of cultivars, while pNPP was used as the substrate. Highly significant
differences (P = < 0.001) were noted for conditions. Highly significant differences (P = <
0 .001) were observed for interaction of cultivars and conditions. While 4-MUP was used
as the substrate N.S results were noted in cultivars and conditions.
The results (Table 5.7) indicate that the highest leaf phosphorus was observed in cv
Reshami, and the minimum was noted in cv TH-3/83. Highly significant differences (P = <
0.001) were noted among the cultivars.

134
Table 5.7 Phosphorus content (mg g - 1 d. wt) and PMEase activity (umol mg d. wt" 1 h" 1)
in root halves of a split root system. Cotton seedlings were grown without and with
phosphorus added to one half of the split root system (n = 4, ± SD).
Cultivars Phosphorus content (mg g~l d. wt) PMEase activity (umol mg d. w t ' l h"*)
- Leaf Stem Root pNPP MUP
- - - -P + P -P + P -P + P
Qalandri 19.44 6.99 8.02 13.92 0.195 0.081 0.080 0.034
Rehmani 21.77 6.27 7.52 11.79 0.152 0.058 0.074 0.039
Reshami 24.61 5.83 4.49 15.35 0.213 0.066 0.085 0.033
ANOVA F(df) F(df) F(df> Prob. F(df) Prob. F(df)
Culti. 567 (3) 5(3) 9(3) * 0.01 33(3) ** o.oo: N.S
Condi. - - 680(1) ** 0.00 2124(1) ** o.oo: N.S
cvx cond - - 26(3) ** 0.00 16(3) ** o.oo: N.S
Prob. ** 0.001 *0.01
The maximum stem phosphorus was detected in cv Qalandri, and the lowest was
found in cv Reshami. Significant differences (P = < 0.01) were noted among the cultivars.
The plant roots grown with phosphorus added to the growth medium showed
highest root phosphorus in cv Reshami, and lowest was noted in cv Rehmani. Where
plants were grown without phosphorus added to the growth medium, the highest root
phosphorus was recorded in cv Qalandri and the lowest was recorded in cv Reshami.
Significantly differences (P = < 0.01) were noted among cultivars. Highly
significant differences (P = < 0.001) were noted for the conditions. Highly significant
differences (P = < 0.001) were obtained between interaction of cultivar and condition.

135
CHAPTER 6
6.1 Effect of salinity on PMEase activity of roots of cv Qalandri As was indicated in Chapter 1 salinity is an important factor in mineral nutrition in
Pakistan. The purpose of this study was to investigate the response of increasing
concentrations of NaCl on acid PMEase activity of the roots of cotton cv Qalandri, and to
determine what level of salinity is detrimental.
Plants were grown as described in Materials and Methods except that NaCl was
added into the growth medium at concentrations ranging from 100 mM-300 mM. 300
mM was found to be toxic to the extent that the plants died, therefore the highest
concentration used for PMEase manipulation was 250 mM.
For this experiment five concentrations of NaCl, two substrates (pNPP, 4-MUP)
and one cultivar were used. The enzyme activity was assayed at the previously
determined pH optimum of 5 .5
The results of assay using pNPP and 4-MUP as substrates are shown in Fig. 6.1.
For both substrates the responses to increased NaCl concentration in the growth medium
are essentially the same. For plant grown without phosphate present, there was a gradual
decline in PMEase activity up to 150 mM NaCl. However , from 200 mM to 250 mM
there was a marked increase in activity. These responses to NaCl are highly significant (P
= < 0.001) and indicate that surface phosphatase activity may be suppressed by increasing
NaCl. At high concentrations of salt, however, PMEase activity is increased and this may
be due to a release of cellular PMEase activity in response to salt injury to the root tissues.
When phosphate was added to the plant growth medium the levels of PMEase
activity were initially lower than with phosphate omitted, but then increased with
increasing salt concentrations. This response also was highly significant (P = < 0.001) and
may reflect the fact that NaCl interferes with phosphate uptake into the roots with the
result that PMEase activity increases. Alternatively a combination of phosphate and NaCl
could induce the release of cellular PMEase onto the root surfaces. The second
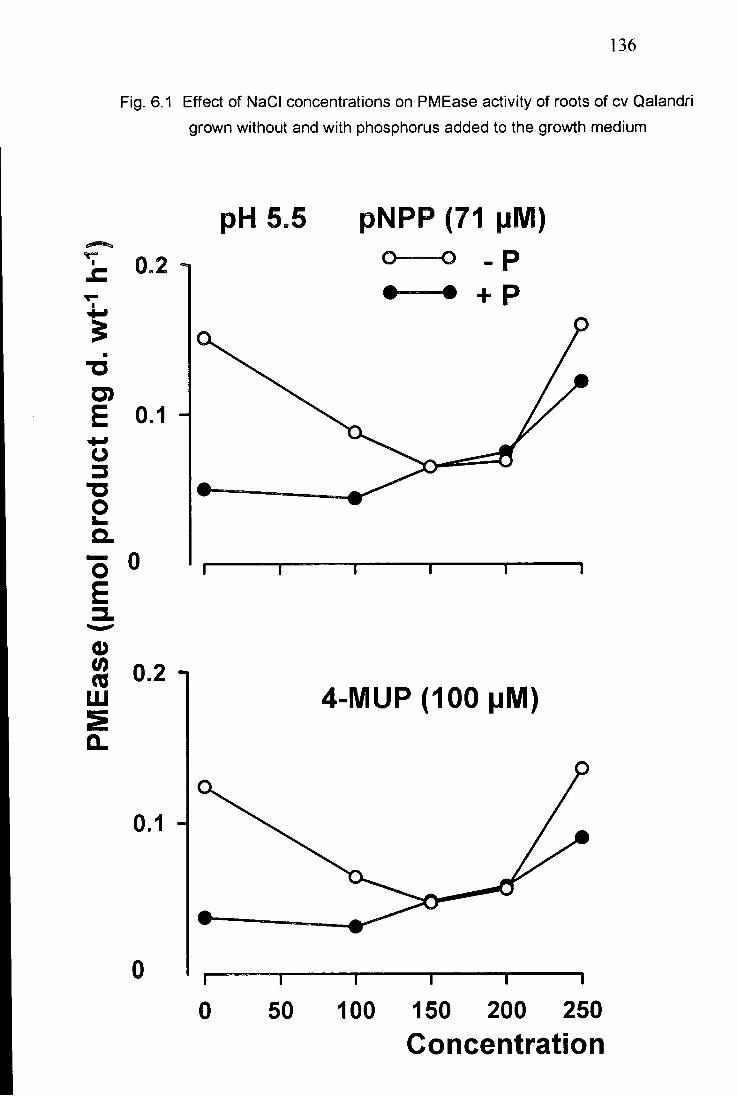
136
Fig. 6.1 Effect of NaCI concentrations on PMEase activity of roots of cv Qalandri
grown without and with phosphorus added to the growth medium
pH 5.5 pNPP (71 pM)
E 0.1
CO 03
4 - M U P ( 1 0 0 JJM) LLI
0.1
o i 1 1 1 1 1
0 50 100 150 200 250 Concentration
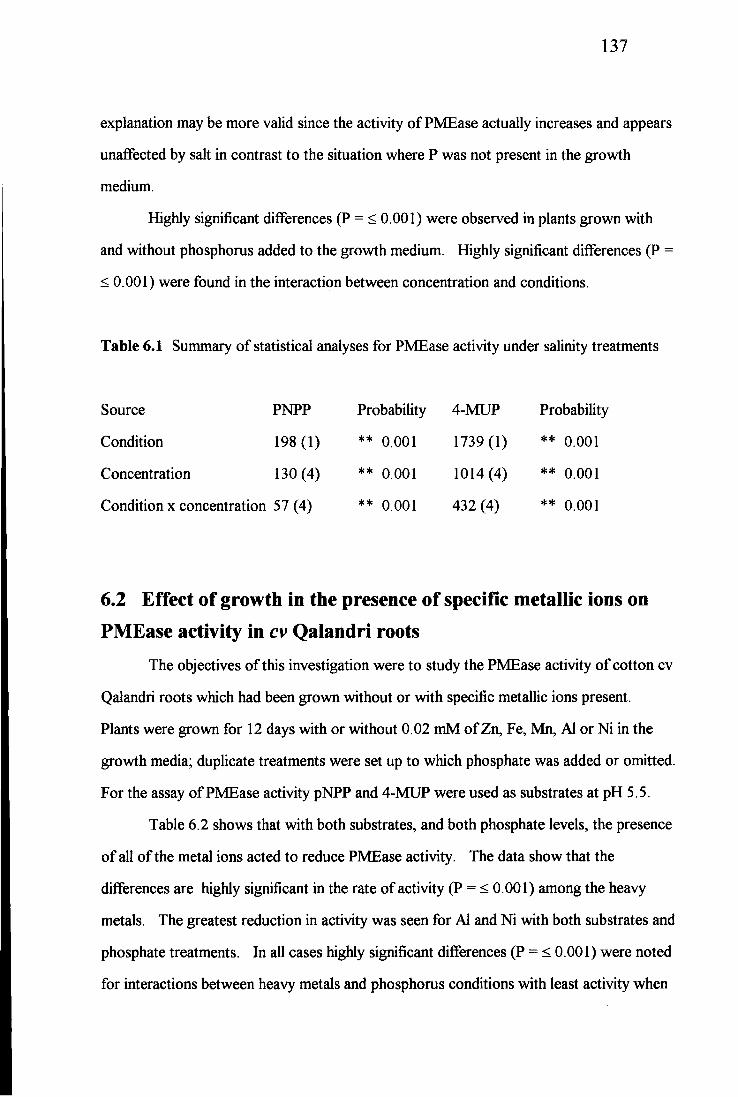
137
explanation may be more valid since the activity of PMEase actually increases and appears
unaffected by salt in contrast to the situation where P was not present in the growth
medium.
Highly significant differences (P = < 0.001) were observed in plants grown with
and without phosphorus added to the growth medium. Highly significant differences (P =
< 0.001) were found in the interaction between concentration and conditions.
Table 6.1 Summary of statistical analyses for PMEase activity under salinity treatments
Source PNPP Probability 4-MUP Probability
Condition 198(1) ** 0.001 1739(1) ** 0.001
Concentration 130 (4) ** 0.001 1014 (4) ** 0.001
Condition x concentration 57 (4) ** 0.001 432 (4) ** 0.001
6.2 Effect of growth in the presence of specific metallic ions on PMEase activity in cv Qalandri roots
The objectives of this investigation were to study the PMEase activity of cotton cv
Qalandri roots which had been grown without or with specific metallic ions present.
Plants were grown for 12 days with or without 0.02 mM of Zn, Fe, Mn, Al or Ni in the
growth media; duplicate treatments were set up to which phosphate was added or omitted.
For the assay of PMEase activity pNPP and 4-MUP were used as substrates at pH 5 .5.
Table 6.2 shows that with both substrates, and both phosphate levels, the presence
of all of the metal ions acted to reduce PMEase activity. The data show that the
differences are highly significant in the rate of activity (P = < 0.001) among the heavy
metals. The greatest reduction in activity was seen for Al and Ni with both substrates and
phosphate treatments. In all cases highly significant differences (P = < 0.001) were noted
for interactions between heavy metals and phosphorus conditions with least activity when

138
phosphorus was present. The data also indicated highly significant (P = < 0.001)
interactions among heavy metals, phosphorus conditions and substrates.
Table 6.2 Effect of cations on PMEase activity (umol mg d. wt"l h -*) of cv Qalandri
seedlings grown without and with phosphorus added to the growth medium in the
presence of Zn, Fe, Mn, Al , Ni. pNPP & 4-MUP were used as substrates (n = 4 ± SD)
Salt added PMEase activity (umol mg d. wt"' h"
pNPP 4-MUP
-P + P -P + p
ZnSC>4 0.101 0.083 0.074 0.057
FeS0 4 0.090 0.076 0.067 0.045
M n S 0 4 0.111 0.106 0.093 0.075
A1 2 (S0 4 ) 0.064 0.057 0.052 0.031
MSO4 0.054 0.046 0.043 0.033
Control 0.144 0.128 0.112 0.092
ANOVA F value - Probability -
Cation 304 (5) ** 0.001 -
Condition 5030(1) ** 0.001 -
Substrate 212(1) ** 0.001 -
Cation x condition 56(5) ** 0.001 -
Cation x substrate 204 (5) ** 0.001 -
Condition x substrate N.S - - -
Metal x condition x substrata 38 (5) ** 0.001 -

139
6.3 Effect of different concentrations of ions on the PMEase activity of cv Qalandri
A study was carried out to investigate the individual influence of ion
concentrations on PMEase activity. To do this plants were grown under conditions
where phosphate was added to or omitted from the growth medium. A series of cultures
were set up using a range of concentrations of different ions as indicated to the two
conditions described above see Fig.2.3 and 2.4 (Chapter 2). The levels of PMEase
activity detected following these treatments are shown in Table 6.3.
Sodium
No discernible trend was seen for the effects of added sodium at low concentration
either with cultures from which phosphate was omitted or added. The highest activity
0.201 umol mg d. wt"* h"* was noted at 1.0 mM and the lowest activity 0.160 umol mg d.
wt~l h"l was recorded at 0.1 mM of sodium.
Potassium
A trend was seen for the effects of increased potassium in the plant growth
medium where increase of the ion caused a decreases in activity. For cultures without
phosphate the maximum activity (132 umol mg d. w t ' l h~^) was noted at 10 mM
potassium. A similar trend was seen when potassium was added to cultures which
contained phosphate.

o < ft c
* 4^
O © o
* I — '
o © o
• z
i/3
*
o o
* * o © o
ON
ts)
o
4*.
o >
o c a n
o 3
o O a o n " i ft 5 3
o o 3
a. 5" 3
O 3
O
o 3 O n> 3
O 3 X
o o 3
O O O
to u> 00 w
o 3
5 3
H- H-o o "o
o ©
KM
H-o ©
- J H-o ©
o b
© p © O © p i ON KM 4*. KM NO K ) ts) 4^ to H- H- H- H- H- H-o o o o o o b b b b b b o o o »—»
o o o o o o + © b b b b b 00 00 00 ON 4* KM o ON NO ON u> H- H- H- H- H- H-o o o o o o b b b © b b o o i — * o o
o o o o o o •
i__> to i — '
NO 00 ON ON o ON 00 NO NO O ts) H- H- H- H- H- H-o p o o o o b b b b b b ts) o o
© p © o p o + 00 ON u< 4^ KM
ON 4*. - j - J t o
H- H- H- hf H-o p o o o © b b b b b b o ts)
p p p O p o i
ON ts) ts) 00 o - J 4s. KM
H- H- hf H- H-O o o o o o b b b b b b o I s ) ts ) o
p p © O o o + 4> 00 00 H- H-o o b b O i - 1
o o 3 O
o 3
2
5
O ft. a. 3. (/i a> a> £: M • 3
0Q </> 4 ^
O

1 < >
o o !
o o O O H-O 'h- © o
© O o s o
OS cr. o 53
o O 3 3
o o I
o p p p p o ©
o to to u> ^£> VD o MS +-H- H- H- H- H-o O o O O o © b b b b b
o o * o
o 65
„ to O O O w
o 13 o 3
o o g.
o o © © p © b b VO o O t-J ON »—' VO 4̂ VO H- H- H- H- H- H-o o O O O O b b b b b b o to o o
+
p o © © © © i— b © © b ©
NO 00 »—* © o U) *> as -o. vo H- tf H- H- H-o o © © © © b b © b © © *>• © © ©
O © © © © © b © © © b '© 00 00 00 vO 00 © to 4* - J © 00 oo H- H- H- H- H- H-o © © © © © b © © © b '© o © © © © ©
+
N 3
ST m
O
a. 3.

142
Magnesium
A partial trend of increased PMEase activity with increased magnesium for plants
grown without phosphate was seen. However, in the presence of phosphate there was a
marked stimulation of PMEase activity by magnesium up to 1 mM.
The highest PMEase activity 0.148 umol mg d. w t ' l h~l was noted at 1.0 mM and
lowest activity 0.118 umol mg d. wt~l h~l was obtained at 10.0 mM. The data (Table
6.3) indicate that for different ions the differences were highly significant (P = < 0.001).
Highly significant differences (P = < 0.001) were obtained for concentrations. Highly
significant differences (P = < 0.001) were recorded between interactions of ions and
conditions. Highly significant differences (P = < 0.001) were recorded between
interactions of ions and concentrations. Non-significant results were obtained for
interactions between concentrations and conditions.
Calcium
The results (Table 6.3) showed that in plants grown without phosphorus added to
the growth medium the highest PMEase activity (0.134 umol mg d. wt"l h~l) was
obtained at 10.0 mM concentration of calcium, and lowest activity 0.099 umol mg d. wt - *
h"l was recorded in plants which were grown without added calcium in the medium. A
consistent increase in PMEase, both without and with added phosphorus, was noted for
increased concentrations of calcium.
Zinc
Zinc, at all concentrations, was shown to be highly inhibitory to the build up of
phosphatase activity in roots of plants with or without added phosphate. Activity at 10
mM zinc was more than 100 times less than in the controls where phosphate was not
added. Where phosphate was added to the growth medium at 10 mM was highly
inhibitory, effects at lower concentrations were not seen.

143
CHAPTER 7
7.1 Comparison of PMEase activity of different plant species As a part of an understanding of the relative levels of PMEase activity in cotton a
comparison between the cv Qalandri and other crop plants was made. The seedlings of all
the species used were grown with and without phosphorus added to the growth medium.
For this experiment wheat, rice and cotton plant were used with two substrates pNPP, 4-
MUP. In addition an assay pH range was utilized.
Cotton
When pNPP was used as the substrate (Fig. 7 .1) the peak of PMEase activity was
noted at pH 5.5. The activity increased after pH 4.0 to the maximum at pH 5.5 and
started to decrease from pH 6.5 to 10.0. The data showed (Table 7.1) that the plants
grown with and without phosphorus added to the growth medium, had highly significant
differences in activity (P = < 0.001). The plants grown without phosphorus added to the
growth medium showed more PMEase activity at all pH levels, the range of PMEase
activity was 0.011 (pH 10.0) to 0.195 umol mg d. wt~l h" 1 (pH 5.5) in comparison with
the plants grown with phosphorus added to the growth medium where the range of
PMEase activity was 0.005 (pH 10.0) to 0.160 umol mg d. wt" 1 h" 1 (pH 5.5).
When 4-MUP was used as the substrate (Fig.7.2) the maximum PMEase activity
was noted at pH 5.5. The activity increased after pH 4.0 to the peak at pH 5.5 and
started to decrease from pH 6.0 to 10.0. The data showed (Table 7.1) that the plants
grown with and without phosphorus added in the growth medium, highly significant
differences (P = < 0.001) between their activities. The plants grown without phosphorus
added to the growth medium showed more PMEase activity at all pH levels, the range of
PMEase activity 0.004 (pH 10.0) to 0.153 umol mg d. w t _ 1 h _ 1 (pH 5.5) was recorded, in
comparison with the plants grown with phosphorus added to the growth medium, where
the range of PMEase activity 0.003 (pH 10.0) to 0.132 umol mg d. wt" 1 h" 1 (pH 5.5) was
noted.

144
Wheat
Wheat plants (Fig.7.1) showed maximum PMEase activity at pH 6.0. The activity
increased after pH 3.5 reached its optimum at pH 6.0 and started decline from pH 6.5 to
10.0. The data showed (Table 7.1) that for the plants grown with and without
phosphorus added to the growth medium had highly significant differences in activity (P =
< 0.001). The plants grown without phosphorus added to the growth medium, yielded
more PMEase activity at all pH levels, the lowest PMEase activity was at pH 10.0 with the
highest at pH 6.0. Plants grown with phosphorus added to the growth medium, showed
lower PMEase activity at pH 10.0 but the pattern of phosphatase to pH was the same as
for when phosphate was omitted.
Fig.7.2 shows the peak PMEase activity was found at pH 5.0. The activity
increased after pH 3.5, reached its peak at pH 5.0 and started to decrease from pH 5.5 to
10.0. The results show (Table 7.1) that the plants grown with and without phosphorus
added to the growth medium highly significant differences (P = < 0.001) were recorded.
The plants grown with no phosphorus added to the growth medium gave more PMEase
activity at all pH levels. The lowest PMEase activity was at pH 10.0 with the highest at
pH 5.0 when plants grown with phosphorus added to the growth medium, where the
plants were grown without phosphorus added to the medium the same trend of PMEase
activity was also observed.
Rice
Rice plants showed maximum PMEase activity at pH 5.0. The activity increased
from pH 3.5, reaching its maximum at pH 5.0 and started to decrease from pH 5.5 to 10.0.
The data showed (Table 7.1) that the plants grown with and without phosphorus in the
growth medium had highly significant differences (P = < 0.001) between them in activity.
The plants grown without phosphorus added to the growth medium, showed more
PMEase activity at all pH levels, the lowest PMEase activity was at pH 10.0 and the
highest at pH 5.0 in the plants grown without phosphorus added to the growth medium,

145
Fig.7.1 Comparison of PMEase activity in different plant species grown without and with phosphorus added to the growth medium pNPP used as
substrate
pNPP (71 uM 0.24
0.16 Cotton
0.08 D)
0.24 Q. O 0.16 -E
Wheat 0.08
LLI 0.24
0.16
Rice 0.08
3 4 5 6 7 8 9 10 PH

146
Fig.7.2 Comparison of PMEase activity in different plant species grown without and with phosphorus added to the growth medium 4-MUP used as substrate
0.24 4-MUP (100 uM
0.16 • + P Cotton
0.08 u )
0.24 •
0.16
Wheat 0.08
<D CO CO
LU 0.24
0.16
Rice 0.08
3 4 5 6 7 8 9 10 PH

147
while the same pattern of activity observed when the plants were grown with phosphorus
added to the growth medium.
At all pH values it was noted that rice had higher PMEase activity when
phosphorus was omitted from or added to the plant growth medium.
In the case of rice plants (Fig. 7.2) the peak PMEase activity was found to be at pH
4.5. The activity increased after pH 3 .5 to the maximum at pH 4.5 and started to decrease
from pH 5.0 to 10.0. The data showed (Table 7.1) that the plants grown with and
without phosphorus added to the growth medium were highly significantly different in
their activities (P = < 0.001). Highly significant differences (P = < 0.001) were noted for
pH's.
The differences in PMEase activity between species were also highly significant (P
= < 0.001). The highly significant differences (P = < 0.001) were also noted in activity
for the two substrates. The data (Table 7.1) indicate highly significant differences
between the interaction for species and substrates (P = < 0.001). The results showed
highly significant differences (P = < 0.001) were noted for the interaction of pH,
conditions and species. The data also showed highly significant differences (P = < 0.001)
, for interaction of conditions, species and substrates.
When a comparison was made between the PMEase activity for the different
species using pNPP with and without phosphorus added to the growth medium, it was
found that cotton was 68 % and 69 % higher than rice respectively. Also the values for
cotton were 55 % and 56 % higher than for wheat. When 4-MUP was used as the
substrate cotton was found to have PMEase activity which was 68 % and 70 % higher
then rice and 61 %, 62 % higher then wheat. As with pNPP, the PMEase activity in
cotton plants was higher than that for wheat or rice.

148
Table 7.1 Summary of statistical analyses of PMEase activity of roots of different plant
species grown without and with phosphorus added to the growth medium.
Source F value Probability
pH 1249(11) ** 0.001
Condition 908 (1) ** 0.001
Species 8814(2) ** 0.001
Substrate 892 (1) ** 0.001
pH x condition 9(11) ** 0.001
pH x species 301 (22) ** 0.001
pH x substrate 85(11) ** 0.001
Condition x species 188 (2) ** 0.001
Condition x substrate 32(1) ** 0.001
Species x substrate 17(2) ** 0.001
pH x species x condition 4(22) #* 0.001
Condi.x species x substrate 16(2) ** 0.001
7.2 Influence of pH on PMEase activity in roots of Primula farinosa and algae
In order to establish the methodology preliminary experiments were carried out on
Primula farinosa and algae (which had been already tested in the laboratory at Durham),
before detailed studies started on cotton root PMEase activity. The purpose was to
investigate the PMEase activity of these organisms with range of pH values used 71 uM
pNPP and 100 uM 4-MUP as substrates.
The results in Fig. 7.3 show that when Primula farinosa was assayed with narrow
range of buffer pH 4-7, acid PMEase activity was observed. The maximum activity

149
Fig.7.3 Influence of pH on PMEase activity of Primula farinosa using pNPP as
substrate
pNPP (71 MM) 0.10
0.05
as LU
PH

150
Fig.7.4 Influence of pH on PMEase activity of two strains of Stigeoclonium (565 and 577 one strain of Draparnaldia (653) using pNPP and 4-MUP as substrates
T 0.6
U)
* o O 3 •o O
0.3 H
pNPP (71 JJM) • • 6 5 3 • • 5 7 7 A A 5 6 5
i 1 1 r
O E
(0 LU
0.6 -r
0.3 H
4-MUP ( 1 0 0 MM)
10 11

151
0.083 umol mg d. wt" 1 h~* was recorded at pH 5.0, and after pH 5.5 PMEase activity
declined.
In the case of algae the results in Fig. 7.4 indicate that when pNPP was used as
substrate alkaline PMEase activity was observed in both the strains of Stigeoclonium and
the maximum activity was noted at pH 10.0. While acid PMEase activity was observed in
the strain of Draparnaldia 653 at pH 5.0.
Similar results were obtained when 4-MUP was used as substrate.

152
CHAPTER 8 DISCUSSION
Soil conditions of cotton growing area of Sindh (Pakistan) Soil pH
Soil pH is an important factor in determining the solubilities of elements that tend
to equilibrate with a solid phase. Soil pH is a factor affecting the growth of crops and
pastures, and the distribution of native plant species (Epstein, 1972). This is particularly
important when considering minerals which may be limiting in agricultural systems. The
results presented in this work, Chapter 3 (3.41), indicate that the soil pH's of cotton
growing ecological zones of Sindh (Pakistan) vary considerably from site to site and depth
to depth. It was noted that soils studied had values above pH 8.0. Cotton tolerates a
wide range of soil acidity and alkalinity; the optimum pH for growth lies between 5.0-8.0.
Robinson etal., (1969) reported that for the Gezira and Sabi Valley soils
(Zimbabwe) the soil pH was 8.5 in cotton growing regions and produced up to 5600 kg
ha"* seed cotton, which is a higher than average yield. Data from experiments in the Lake
Victoria region of Tanzania showed that soil pH was mostly between 5 .0-6.0 in the cotton
growing region (Le Mare, 1974). In the same region, however, the application of lime to
a long-term fertilizer trial increased the seed yield from 400-1200 kg ha - 1 ' while raising
the pH from 4.5 to 6.2 (Le Mare, 1972). Comparing the results of early workers with the
present study, it is reasonable to believe that the soils of the cotton growing zones of
Sindh are within the most suitable pH range for growing cotton crops. It could therefore
be recommended that most probably pH is not an absolute limiting factor responsible for
relative low yields in Sindh province. However, it needs detailed study by conducting
yield trials on different soil pH levels which is not within the scope of this study. Of
importance to this study in the fact that it has been reported that the availability of soil

153
phosphorus to the plant may be influenced by the root enviroments eg. soil pH (Murrmann
&Peech, 1969)
Soil organic matter Soil organic matter is a major component in the biochemical cycling of major
nutrient elements and the quantity and quality of soil organic matter both reflects and
constrains primary productivity (Burke et al., 1989). The data presented in Chapter 3
(3 .43) demonstrate that across the districts of the cotton growing zones of Sindh, depths
1, 2, 3 have an average organic matter of 1.12, 0.94 and 0.75 % respectively. These soil
organic content levels could be classified as being in range of adequate to medium levels.
The trend of organic matter decreased with increasing depth of soil profile. Cotton is a
deep-rooted plant, its root penetration in the soil is up to 300 cm and it may be possible
that the deep level of soil, where new root growth takes place, may be deficient in organic
matter and this may in turn be the cause of yield losses. This is particular possible since
young roots are mostly responsible for nutrient uptake.
It is widely reported in the literature that continuous cropping of land leads to
depletion of organic matter (Haas et ah, 1957; Burke et al., 1989). The extent of soil
organic matter depletion depends upon the same variables as those controlling soil organic
matter formation, such as parent material, time, climate and biota (Jenny, 1980) and this in
turn would lead to a depletion of inorganic mineral availability.
Soil phosphorus 80-90 % of soils from arid and semi arid regions of the World, including Pakistan,
are deficient in phosphorus (Memon et al., 1992), eventually it needs to be supplemented
to obtain the required yield. The results in Chapter 3 (3.45) indicate that the phosphorus
status of the soils of cotton growing areas of Sindh can be regarded as

154
being deficient, also they vary considerably. For cotton crops the levels of phosphorus
present in the soil are probably such as to limit growth significantly. Soil solution
phosphorus is the immediate source for plants (Holford, 1989), this is regarded as
available phosphorus. The results of this study show that maximum soil phosphorus
levels were noted at the surface of the soil (0-15 cm). These results are in agreement with
the findings of Tarafdar et al., 1988 who also found that surface soil (0-15cm) had
significantly higher available phosphorus. Soils vary greatly in the amount of fertilizer
phosphorus required to provide an adequate supply of available phosphorus to plants and
plants also vary in the phosphorus requirements for optimum growth (Memon & Fox,
1983; Fox 1981). Phosphorus plays an important role in promoting early growth and
establishment of cotton in Pakistan. The general recommendations for the phosphorus in
the Sindh soils are 67 kg ha"l for the maximum yield expectation (Saleem et al., 1986).
This amount of phosphorus supplementation is economically-demanding and, therefore,
the ability of cotton plants to mobilize organic phosphorus becomes an important
consideration. Of particular importance are the relative abilities of different cultivars to
mobilize organic phosphates which makes them suitable for growing in soils with variable
available phosphate contents.
Soil nitrogen content Nitrogen availability indices of the soil are a measure of the potential of a soil to
supply N to plants, when conditions are ideal for mineralization. The results reported in
this study, Chapter 3 (3.44), show that the average N % in the cotton growing soils of
Sindh is variable. It varies considerably from site to site with the lowest at average
rooting depth being present in Hyderabad and the highest in Sanghar. The overall levels,
however, are considered to be low when compared with soil from other agricultural
systems. Hearn (1981) reported the minimum nitrogen level in the soil 10 ppm below
which deficiency symptoms are likely to appear. There is also considerable variation in
155
nitrogen content with soil depth at any one site. The quantity of N % generally varies
with season or year to year depending upon the amount and type of plant residue applied
and environmental conditions. Bramer (1965b) and Stevenson (1982) reported that
between 0.08 and 0.4 % of total soil nitrogen is mostly in the organic form in surface soils.
Birch (1964) has shown that alternate wetting and drying cycles in tropical soils cause the
release of mineral nitrogen from organic matter. This may be adequate for the cotton
crop, but Jones (1976) has shown that in a wet season the mineral nitrogen may be leached
down beyond the root zone before the plant can take it up and use it. Globally soils are
deficient in nitrogen and are supplemented with artificial fertilizers. Similarly Sindh soils
are also supplied with nitrogen fertilizer for sustained high yields. The added nitrogen
requirement for Sindh soils varies from 84-112 kg ha."1 (Saleem et ai, 1986). Ramig and
Rhoades (1963) working on the fine sandy loam soil samples drawn from 7 depths (0-183
cm) concluded that the nitrogen drastically decreased at increasing depth levels and was
only available up to the depth of 61 cm. Since cotton has the capacity for rooting down
to 300 cm this indicates that these plants are physiologicaly acting below their full
potential. Since the nitrogen supply will be limiting this could have implications for
phosphate availability.
Soil potassium According to Baligar and Bennett (1986), for tropical soils, the efficiency of
applied potassium is anywhere from 20-40 %. According to Tisdale and Nelson (1966)
only a small proportion, 2-10 %, of the total potassium in the soil is available to plants. It
has been suggested that potassium deficiency is not likely to develop until after a number
of years of arable cropping (Stephens, 1969; Foster, 1972). As indicated in this study
Chapter, 3 (3 .46), the average exchangeable potassium ranges from 151.10 (DI) to 103 .16
(Di l i ) in the cotton growing soils of Sindh. The potassium in crop residues is held in the
soil in a readily available form after decomposition or burning. Hearn (1981) quotes

156
figures ranging from 3-6 kg per bale of lint for the potassium lost by the removal of seed
cotton at harvest. As the present results indicate Sindh soils are rich in potassium
content, therefore it is unlikely that they will be K-deficient. However, in light textured
soils applications of 30-50 kg ha ~1 K2O at planting are recommended (Saleem et al.,
1986). It seems unlikely therefore that potassium availability should be have a significant
an effect on plant potassium content and on availabiblity of other minerals.
Mineral content of cotton seeds The levels of minerals within a seed are of great significant because they will
determine the success of seedling establishment follow germination and prior to the
seedling becoming self-sufficient. Variation in cultivar success could therefore be due to
differences in seed mineral content. The results presented in this work show that non
significant differences were noted among cultivars for phosphorus, potassium and
magnesium contents so it is unlikely that these are important in determining cultivars'
differences. In terms of the minerals estimated, potassium was present in the highest
percentage in all cultivars. In contrast, phosphorus was present in the lowest amounts
and so may reflect a limitation for this mineral. However, very marked and significant
differences were noted for nitrogen content in seeds from cultivars. These differences
may reflect variation in the level of stored nitrogen present as protein, however, individual
chemical components were not analysed. The results are partially in agreement with the
findings of Bassett et al., 1970 for cotton seed who observed that the nitrogen was most
abundant and that phosphorus content was the lowest. The contradiction in the results
with regard to nitrogen v/s potassium could be due to several reasons. The above
workers used fresh seed from mature plants, while the seed used in the present studies
were three years old and it may be that nutritional value of old seeds diminishes over the
time period with respect to organic nitrogen content.

157
Since seeds were similar in the overall phosphorus content this indicates that the
seedlings were dependent on absorbed phosphorus from the medium. In the growing
plants differences were seen in phosphorus content therefore these differences indicate
varying phosphate uptake and utilization by the different cultivars.
Phosphorus in cotton seedlings. The distribution of phosphorus within a plant is important in order to maintain
physiological activity which will be specific to specific tissues. The results of this study
indicate that the highest phosphorus levels were detected in the leaf followed by the root
and then the stem. The results support the findings of Mullins and Burmerster (1990)
who reported the maximum phosphorus distribution in the cotton plant to be in the leaves.
These results are consistent with those of Bassett et al., (1970) who provided the evidence
that tissues can be listed in order of increasing phosphorus concentration as: roots, stem,
mature leaf, immature leaf fruiting parts and finally seed. Working on different varieties
of field-grown cotton Mullins and Burmerster (1990) did not find any consistent
differences among the varieties studied, these findings are contrary with the results of the
present study, where significant differences were observed among cultivars. The
differences in results to those of Mullins and Burmerster (1990) could be due to the
different plant genotypes used in both sets of studies. However, unlike the study by
Mullins and Burmerster (1990), the cultivars used here were all grown in the same nutrient
systems and therefore ecological variables were discounted. This indicates that cultivars
differ in their activity to absorb and distribute phosphorus..
As may be expected the results indicate that the amount of phosphorus was higher
in all plants grown with phosphorus added to the growth medium than the plants grown
without phosphorus added to the growth medium. These results are in agreement with
the findings of other workers (Coupe, 1984; Khasawnch & Copeland, 1973; Sharplley &

158
Reed, 1982; Stelley & Morris, 1953) who found that phosphorus concentration in cotton
plants may be increased by phosphorus fertilization.
In greenhouse and culture trials with cotton, an increase in phosphorus in the
culture solutions had a direct effect on the level of phosphorus in the plants (Ergle &
Eaton, 1957). However, other research has not been able to demonstrate such a
relationship (Janat & Strochlein 1986).
Nitrogen in cotton seedlings The results presented here show that the plants of all the cultivars, when grown
with N added to the growth medium, showed higher nitrogen concentrations in their parts
than plants grown without nitrogen added to the growth medium. These results are in
agreement with the findings of Hearn, (1981) who stated that the concentrations of total-
nitrogen in leaves and petioles of low-nitrogen plants were in the deficient range.
Thompson et al., (1976), while working with cotton, reported that the nitrogen
concentrations declined with age in vegetative organs of the plant. They further stated
that changes in tissue concentrations of total-N in low-N control plants due to ageing and
depletion of soil nitrogen reserves were not as pronounced as in plants from the high-N
controls as found in earlier work. The results collected here show that 130, 77, and 48
mg g"l d.wt nitrogen was observed in the roots, leaves and stem respectively. The results
are in agreement with the findings of Mullins and Burmester (1990) while working with
cotton plants who observed similar results.
Roots of cotton reduce only sufficient NO"3N for their requirements and export
the rest to the shoot (Radin, 1977; Radin, 1978). The relationship between growth rate
and plant nitrogen concentrations provide valuable information about the way in which
plants utilized nitrogen and the efficiency with which they convert it into dry matter
(Greenwood etal., 1991).

159
The nitrogen status of a plant also has been an effect upon the uptake and
utilization of other mineral elements. Joham (1951) found that nitrogen fertilizer
increased magnesium levels, that phosphate had no effect on magnesium levels and that
potassium fertilization decreased leaf magnesium levels.
Cole et al., (1963) found that pretreatments with nitrogen stimulated phosphorus
uptake to more than a tenfold increase in phosphorus concentration in the root system.
Blanchar and Caldwell (1966) found that ammonium fertilizer increased phosphorus
uptake in the absence of significant increases in root growth or water soluble phosphate
and concluded that metabolic stimulation was the operating mechanism.
Nitrogen is most effective in increasing phosphorus absorption when the fertilizers
are placed together in soil (Miller & Ohlrogge, 1958). Ammonium fertilizer, which are
not easily leached, frequently caused greater phosphorus uptake in soil studies than nitrate
nitrogen (Blanchar & Caldwell, 1966; Leonce & Miller, 1966; & Olsen & Dreier, 1956).
Potassium in cotton seedlings All plant parts contained higher potassium concentrations when plants were grown
with potassium added to the growth medium than the plants grown without potassium
added to the growth medium. The results are in agreement with the findings of Mullins et
al., (1994) who also obtained similar results in the leaves, stem and burs of cotton plant.
Magnesium in cotton The results presented here show that the plants grown with magnesium added to
the growth medium yielded higher magnesium concentration in the leaves, stem and roots
than the plants grown without magnesium added to the growth medium. Phosphorus

160
levels in the plant appeared not to be influenced by the levels of magnesium in the growth
medium.
Phosphatase in cotton
Since phosphate nutrition is of such importance to plants in general, and cotton in
particular, the studies reported here on root surface phosphatase activities are of
significance in an agro-economic context. These enzyme systems are important in
maintaining the phosphorus status of plants in soils and conditions where phosphate levels
are limiting. In addition, as has been shown, many environmental factors associated with
growing cotton eg., other ions, have marked effects on the levels of phosphate in cotton,
therefore, it was important to investigate the effect of these also on phosphatase activity.
Initial experiments were performed with a single cv of cotton, Rehmani, in order to
establish the presence of the phosphatase enzyme systems. Further in-depth studies
involved use of other cultivars. The laboratory studies were carried out on phosphatase
activity, to characterise the properties, the influence of environmental factors on
phosphatase activity, and the field ecological investigations were also made to understand
the original nutritional situations of the plant area from which the cultivars derived.
As has been reported for other higher plant species (McLachlan, 1980) roots of
cotton have associated with them phosphatase activty. This can be detected in whole
roots which indicates that it is surface cell-bound. The results presented in Table 4.1
indicate that the phosphatase activity was present in the root of cotton cv Rehmani.
The results in Chapter 4 (Table 4.2) indicate that some of the phosphatase activity
was detected in the cut cells as well as on the surface of the roots. However, experiments
designed to wash away contaminant cellular phosphatases indicated that less than 1 % of
the activity appeared to be cellular. However, Luff (1993) found retention of pNP by
roots of Typha latifolia.
The data collected suggest that the injured root released some quantity of
phosphatase activity. The results are not fully in agreement with Chang and Bandurski

161
(1964) who reported that any injury to a root releases considerable phosphatase activity.
Other workers have stated that activities measured with excised roots might bear little
relation to activities in the root which may affect the external solution. Activity is
mediated only by enzymes shown histochemically to be attached to the surfaces of outer
cells of the root ( Estermann & McLaren, 1961; Hall, 1969 ).
Washing of the roots did not reduce significantly the associated phosphatase, as
would be expected had their micro-flora accounted for the enzyme activity. Further
indications that the phosphatase derives from the root are discussed where staining of
roots was employed.
Tarafdar and Claassen (1988) found acid phosphatase activity in clover, barley,
oats and wheat. Helal and Saucerbeck (1984) also found acid phosphatase activity in
maize roots. Roma, Bhargava and Sachar (1983), while working with 48-hour old
germinated cotton embryos found acid phosphatase activity. Further they also noted
strong inhibition in the activity by the addition of phosphate . Plekhanova et al. (1991)
while working with highly purified microsome fraction of primary roots of 3-day cotton
seedling (Gossypium hirsiitum L ), detected significant ATPase activity.
Most higher plants appear to have phosphatase activity associated with their roots.
Besford, (1979 b) observed acid phosphatase activity in seven higher plant species in sand
culture. Tarafdar and Claassen (1988) while working with clover, barley, oats and wheat
also found that phosphatase activity is associated with the roots of tested species. It has
been reported that most plants are rich in non-specific and specific acid phosphatase, but
do not contain any appreciable alkaline phosphatase activities (McComb et al., 1979; Lee,
1988; Adam, 1989; Gabbrielli et al., 1989). It has been reported that many plant tissues
contain acid phosphatase activity in their roots. McLachlan (1976) reported that
differences in phosphatase activity of roots between plant genera have been demonstrated
and related to the ability of the plants to take up phosphorus from low available
phosphorus situations. Soil phosphorus may also be present as organic phosphates, and

162
phosphatase activity at the surface of some roots has been shown to catalyse the hydrolysis
of these to other forms including orthophosphate (Bartlett & Lewis, 1973).
The result presented here show PMEase activities of different species of higher
plants; cotton, Primula, rice and wheat. The highest root PMEase activity was observed
in cotton plants as compared to the other species. It was also noted that with both
substrates and with both plant-growing conditions, without or with phosphorus added to
the growth medium, the rate of PMEase activity was higher. This is consistent with the
findings of other workers (Bieleski, 1973; Boutin et al, 1981; McLachlan & DeMarco,
1982; Dracup et ai, 1984) who observed maximum phosphatase activity under conditions
of phosphate depletion. In higher plants phosphatases associated with the cell surface
have been shown to increase in activity during phosphate starvation (Reid & Bieleski,
1970; Bieleski, 1974; Clark, 1975).
Localization of phosphatase in roots In order to establish that the activity was associated with the surface of roots, and
not with contaminating organisms it was necessary to perform phosphatase staining
experiments. The results described in Chapter 4 (Fig. 4.2) show that BCIP staining of
phosphatase activity was observed at the root surface, especially in the cell walls. The
plant roots grown without phosphorus added to the growth medium exhibited strongly
stained tissues. In contrast, plants grown with added phosphorus showed minimal
staining.
The results presented here are in agreement with the findings of Dracup et al.
(1984) who reported that the phosphatase activity was localized in phosphorus deficient
clover root cell walls. Also Preston (1974) stated that considerable amounts of enzymes
from higher plants are associated with the cell wall.
The results are also in agreement with the findings of Hall and Davie (1971), who
while working with Zea mays L. root tips, found that, by observations using electron

163
microscopy, the highest activity for p-glycerophosphatase was found in the cell wall and
associated with the vacuoles. They also concluded that the staining for p-
glycerophosphatase of fixed root sections showed highest activity in the cell walls of
cortical cells.
Lamport and Northcote (1960), using cultured sycamore cells, and Nakagawa et
al., (1974), using tomato and cultured rice cells, showed that large amounts of acid
phosphatases were tightly bound to the cell wall fraction and not released easily by
chemical or physical treatment. Bieleski (1973) suggested that the large increases in
phosphatase activity associated with phosphorus deficiency were not associated with
increases in the turn-over of cytoplasmic phosphate-ester, since phosphatases appear to be
located either in cell walls or in the vacuoles.
Other workers also reported that the enhanced phosphatase activity appears to be
localised in the cell wall whereas most of the activity in cells adequate in phosphorus
activity is located only at particulate sites in the cytoplasm (Malamy & Horecker, 1961;
McLellan & Lampen, 1963; Weimberg & Orton, 1964; Sommer & Blum, 1965).
Given the specific staining of root cells it appears that any microbial contamination
was not an important problem. In addition, microscopic observation on root systems of
plants grown without and with phosphate did not show visually obvious fungal mycelia or
bacterial contamination.
Time course and substrate concentrations The results presented in this studies show that with both substrates and both plant
growing conditions the maximum enzyme activity was found at highest concentrations of
the substrates. The results also indicates that up to 50 min, the rate of enzyme activity
was linear. At the lower concentrations of the substrate the enzyme activity increased
over the time.

164
The results presented here indicate that the enzyme in cotton roots hydrolized 354
uM pNPP, up to maximum rate of activity, above this concentration the rate of activity
was similar with both plants growing conditions without and with phosphorus added to the
growth.
Similarly, 250 uM 4-MUP was hydrolyzed at the highest rate of PMEase activity,
after this concentration the enzyme activity was not seen to increase. It could be
suggested that at high concentrations the enzyme limitation may be occurring with both
substrates and both conditions. During the course of this study it was found that an
incorrect value had been used for the determination of the pNPP substrate. This resulted
from the fact that no allowance was made for the presences of water of crystallization, this
also was not indicated on the literature provided with the chemical itself. It is therefore
not possible to make a direct comparison between pNPP and 4-MUP activity since whilst
it was assumed that both were used at the same concentrations the levels of pNPP was in
fact approximately 25 % lower.
Temperature optima A number of studies have shown that phosphatase enzymes are particularly heat
stable and that their optimum temperatures are higher than normal growth temperatures of
plants. In these study PMEase activity in roots of cotton cv Qalandri seedlings was tested
over a wide range of temperatures (Chapter 4, Fig.4.6). The optimum temperature was
found to be 55° C with both of the substrates used, pNPP and 4-MUP. These results
were obtained with the optimum pH, for roots of plants grown in nutrient solution with
either phosphate added or omitted. These results show that in cotton phosphatases are
particularly stable enzymes. The optimum is higher than those found for yeast (Watorek
et al, 1977) where it was reported that maximum phosphatase rate of activity of
Rhodotorula rubra was seen at 50° C. However, Lane and Puckett (1979) found
maximum phosphatase activities in the lichen Cladonia rangifera at 61° C. Al-Shehri,

165
(1992) working with the moss, Hydrogonium fontanum, found an optimum temperature of
60° C for PMEase activity and 65 °C for PDEase.
Similar observations of high temperature optima for phosphatases were made on
Calothrix parietina (Grainger et al, 1989) and Calolhrix strain D 764 (Islam & Whitton,
1991).
Effect of ions in the phosphatase assay medium The results presented indicate that when specific ions, Na, Ca, Mg and K, were
omitted from the assay medium the rate of cotton PMEase activity was reduced. The
highest PMEase activity was recorded in the control plants where all the ions were
present. It was also noted that there was no significant differential reduction in PMEase
activity among the ions. As in previous results the plants grown without phosphorus
added to the growth medium showed greater PMEase activity.
Effect of ions in the plant growth medium The results presented here indicate that Na ion had no significant effects on
PMEase activity of cv Qalandri up to 10 mM, either with cultures from which phosphate
was omitted or added. Potassium had effects the PMEase activity of cv Qalandri, the
increased potassium in growth medium decreases PMEase activity in both the conditions
where plants were grown without or with phosphorus added to the growth medium. This
may indicate enhanced uptake of phosphate or redistribution within the plant.
Calcium stimulated slightly the PMEase where plants were grown without
phosphorus added to the medium in both conditions except 10 mM calcium which is
reduced slightly the activity in the plant roots grown with phosphorus added to the growth
medium. The results presented are in agreement with the findings of other workers

166
(Healey, 1973; Doonan & Jenson, 1980; Grainger et al., 1989) who reported that calcium
had stimulatory effects on alkaline phosphatase activity of Cyanobacteria species.
Zinc at all concentrations inhibited highly the PMEase activity in both growing
conditions without or with phosphorus added to the growth medium. The results
presented are in agreement with the findings of Grainger et al., (1989) and Whitton et al.,
(1990) who stated that zinc at 10 mM had a marked inhibitory effect on PMEase activity
in a blue-green algae.
Hasegawa et al. (1976) while working with wheat reported that zinc inhibited wall
enzymes 23-32 % and showed a 36-39 % inhibition towards cytoplasmic enzymes. Zinc
is an important micro-nutrient for growth metabolism in plants (Price et al., 1972).
Influence of plant age on phosphatase activity As plants age and develop their requirements for specific minerals can change.
Szabo et al., (1987) showed that the total phosphorus level in plants increased with
increasing phosphate concentration in the growth medium, however, the overall level
decreased with plant age. In relation to the phosphate levels it has also been shown that
phosphatase activity is not always the same at all ages of plant. At one level the activity
of phosphatase builds up to a peak of activity following depreciation of phosphate.
McLachlan (1980), working with wheat plants, found that the phosphatase activity
increased within the first four days of the plants being deprived of phosphorus and reached
its maximum in 8 days before declining. These results were essentially the same as those
of Takijima (1953) who found that on the 3rd day after P-limited treatment of wheat roots,
phosphatase activity was 20 times higher than just before the treatment and remained high
for about 9 days followed by a decline.
In this present study on cotton PMEase activity increased from 13-day old
seedlings to 19-day old seedlings and then decreased in 25-day old seedlings. The low
phosphatase activity in a 13-day old plant in comparison to a 19-day old plants could be

167
due to high concentrations of phosphorus in the roots of the younger plants and low
concentration of phosphorus in the roots of the 19 day-old plants. The decline in the 25-
day old plants could be due to senescence of the roots after this time period. It appears,
therefore, that phosphatase activity is greatest during the early stages of seedling growth.
The capacity for plants to show phosphatase activity also has been shown to
change as the plant ages. Onofeghara and Koroma (1974) reported that acid phosphatase
and alkaline phosphatase activity also increased with plant age.
Similarly Barrett-Lennard and Greenway (1982) reported that the total P level in
plants increased with increasing phosphate concentration in the growth medium solution,
however, levels inside the plant decreased with age. Alternatively Greaves and Webley
(1965) concluded that older plants growing in soil would lose considerable amounts of
root material including phosphatase to the soil where they could stimulate the growth of
micro-organisms, so that the age of the plant could also be important in retention of
enzyme activity.
The amount of the Na-soluble wall acid phosphatases probably depends on such
factors as plant species, tissues and age (Stafford & Bravinder-Bree, 1972).
Influence of plant growth conditions on phosphatase Whilst levels of phosphate in the cotton root growth medium have been shown
clearly to influence the amount phosphatase activity it is unclear as to what is the influence
of internal phosphate status on the activity of the enzyme. Pakarinen (1978) has
suggested that the concentration of elements in the plant tissues provide an accurate
record of the nutritional status of the environment and hence acid phosphatase activity may
be related to the tissue phosphorus concentration. Roux (1970) showed that the
hydrolysis of phosphate complexes is unconnected to the absorption of released Pi by
studying the hydrolysis of potassium tripolyphosphate by tomato roots at 10° C, or in the
presence of 2, 4-dinitrophenyl: in both cases the absorption of Pi is inhibited but the

168
hydrolysis continues. Whole phosphate-starved roots show an increasing surface
phosphatase activity (Roux, 1971 ; Bieleski & Johnson, 1972), and the renewal of the
phosphorus supply involves a decrease in the surface phosphatase activity. Within a short
term, phosphate status is restored by the increased phosphate influx and decreased
phosphate efflux which resulted in a declined phosphatase activity (Bieleski & Ferguson
1983). Bouton et at., (1981) while working with tomato roots reported that the surface
phosphatase in different parts depends on phosphorus status during their primary growth
Results presented here for cotton indicate that the phosphatase activity build up in
the plants under phosphate limitation conditions is maintained when plants are returned to
high phosphate status (Chapter 4, 4.13). Since the phosphatase level increased in the
older plants this indicates that phosphatase level is related to the age of the plant rather
than the phosphatase limitation in the growth medium.
The results also suggested that the phosphatase activity is not closely connected
with the levels of phosphate inside the root system.
Split root system In order to further distinguish between the phosphate status within a plant and the
phosphate levels in the medium a phosphatase activity split root experiment was
performed. Here one half of a root system could be supplied with phosphate and the
other without phosphate but the phosphate status of the plant should be regulated
independently of the roots. The results presented here show that the roots grown without
phosphate added to the growth medium gave higher surface phosphatase activity than the
roots grown with phosphate added to the growth medium. This indicates that the
presence of external phosphate in the medium decreases the phosphatase activity of the
roots even through the plant itself may have sufficient phosphorus.
The results are in agreement with the findings of Boutin et al. (1981) who,
working with tomato roots, reported that split root systems show increases in surface

169
phosphatase activity locally, i.e. only in the parts of the root system which are phosphorus
deficient. They further stated that under phosphorus deficiency conditions, the root
surface phosphatase activity depends only on the tissue phosphorus concentrations i.e. the
root does not bear any cell wall phosphatase which would be activated when the medium
become phosphorus deficient.
Similar results (Bieleski, 1973) concluded that when a plant is grown in a
phosphorus deficient substrate, the intracellular and cell wall phosphatase activities
increase as the tissue phosphorus concentration decreases.
Excised tomato roots grown in a -P medium show a negative linear relation
between their surface phosphatase activity and their tissue concentration (Boutin & Roux,
1973). Brouder and Cassman (1993) while working with split roots of cotton reported
that K acquisition is strongly influenced by the quantity and distribution of NC>3~N in the
root zone through its effects on root proliferation, and that distinct culture differences
associated with crop performance on low potassium soils can be detected in short term
solution culture growth system. Zinc deficiency depressed whole plant dry matter,
enhanced P concentration in whole plants and enhanced P concentration in leaves to toxic
levels (Webb & Loneragan et al., 1988; Christensen & Jackson 1981; Loneragan et al.,
1982).
Webb and Loneragan (1990) while working with wheat reported that when the
supply of zinc to the wheat shoots was adequate, omitting zinc from the environment of
only half the root system did not affect dry matter or enhance the phosphorus
concentration or accumulation in the shoot, or shoot parts; however the translocation of
zinc to its paired root system not supplied with zinc may have been adequate to maintain
all root functions.

170
Influence of pH on PMEase activity of three cotton cultivars Phosphatase activity in plants has been detected over a wide range. However,
most higher plants exhibit acid phosphatase activity in their root systems. Hall and Davie
(1971) reported phosphatase activity in maize roots, also Ridge and Rovira (1971) showed
that most crops plant roots have associated phosphatase activity. In cotton it was
similarly found that the activity was associated with the range of acidic buffers used in the
assays. Most activity was found in the pH range 4-6. The optimum pH of activity for
the cultivars studied varied slightly from 5.5 in cv Qalandri to pH 6.0 in Rehmani and pH
4.5 for cv Reshami. These results indicate clearly that cotton roots have predominating
acidic phosphatase activity. However, some slight activity was also detected in the basic
range of pH's. In all except one cv there was no difference in pH optimum of phosphatase
activity between those plants grown without and with addition of phosphate. The
exception was Reshami when pH optimum changed from 4.5 to 5 .0 on the addition of
phosphate. No difference was seen in pH optimum when either of the two substrates
were used. The results are in conformity with earlier workers who described that
phosphorus deficiency in the growth medium can produce increased acid phosphatase
activity (Soumalainen et ah, 1960; Nye, 1967). To play an effective role in increasing
inorganic phosphorus supply in P-deficient plants, phosphatase should be capable enough
for the operation at the pH of the environment in which their associated organism
commonly functions.
The results are in disagreement with the findings of Bieleski (1974), who using the
pNPP substrate, showed the presence of both acid and alkaline phosphatases in Spirodela
in homogenates and a marked shift in favour of alkaline phosphatase activity with
phosphorus deficiency in plants. His test in intact plants showed relatively greater alkaline
than acid phosphatase activity in both conditions and phosphorus deficient plants having
more of both forms present under phosphorus deficient conditions.
The results reported here for cotton are supported by the studies of McLachlan
(1980) while working with roots of rye, wheat, buckwheat and subterranean clover plants

171
who concluded that optimum pH for phosphatase activity lay in the range of pH 5-6. P-
deficient plants had greater activity than the P-sufficient ones. The results are also in
agreement with Besford (1979) who observed that an increase in leaf acid phosphatase
activity associated with phosphorus deficiency in terrestrial plants.
Effect of salinity on phosphatase activity One of the major problem in the cotton growing regions of Pakistan is the
accumulation of salt in the soil as a direct result of irrigation and the high evaporative rate.
This accumulation of salt causes marked reduction in cotton production. Mehta and
Desal (1959) observed marked reductions in cotton yield under salinization conditions.
As a part of this study on phosphatase the effect of salinity on the enzyme system was
investigated. The phosphatase activity was investigated in the intact root of cotton
seedlings cv Qalandri grown with and without added phosphorus to the growth medium in
relation to the addition of different concentrations of NaCl.
Results in Chapter 6 (6.1) indicate that salinity has a marked effect on the acid
phosphatase activity of cotton roots. However, this effect is complex in that 100-200 mM
NaCl reduced phosphatase activity in the plant roots grown without added phosphorus to
the growth medium. These levels of NaCl obviously have a deleterious effect on
phosphate metabolism. However, at higher concentrations of salt a stimulation of
phosphatase activity was noted. This effect could be due these levels of NaCl causing
cellular damage with a subsequent leaching out of cellular phosphatase onto the root
surface. 250 mM NaCl showed enhanced phosphatase activity with both of the substrates
used (pNPP and 4-MUP).
In the case of roots of plants grown with added phosphorus to the growth medium
similar effects were seen. It can be hypothesised that increased NaCl concentrations
decrease phosphate uptake into cotton plants particularly through an inhibition of organic
phosphate mobilization.

172
The results are in agreement with the findings of Kumar and Tarafdar (1989) who
suggested that the acid and alkaline phosphatase activity in the rhizospheres of sunflower
was many times higher on saline than in control soils. Similar results were reported by
Rai and Abraham (unpublished), for Anabaena doliolum, where they observed that
extracellular alkaline phosphatase activity increased proportionally with increased NaCl
level in the growth medium.
The overall effects on phosphate status of cotton are in agreement with Martinez
and Lauchli (1991) who while working with cotton, found an inhibition of phosphorus
transport from root to shoot due to salinity.
Effect of nitrogen on phosphatase activity It has been reported that soil nitrogen was able to stimulate phosphorus uptake
more than tenfold and increased the phosphorus concentration in the root zone (Cole et
al., 1963). Interactions have been observed between elements when consideration has
been made of their uptake into root system. Stimulatory effects on the uptake of one
element have been noted in the presence of an other. However, the exact mechanism
behind this is unclear and may involve direct or stimulation of uptake increased availability.
Leonce and Miller, (1966) suggested that ammonium increased the dissociation rate of the
phosphate-carrier complex at the xylem where NH4 + ions were shown to give an
increased phosphorus concentration in corn. Blanchar and Caldwell (1966) found
ammonium increased fertilizer phosphorus uptake in the absence of significant increases in
root growth or water soluble phosphorus and concluded that metabolic stimulation was
the operating mechanism. Ammonium fertilizers, which are not easily leached, frequently
caused greater phosphorus uptake in soil studies than did nitrate nitrogen (Blanchar, 1966;
& Olsen & Dreier, 1956).Due to the increased yield of biomass on high nitrate, the
demand for phosphate will be increased, which is the conditions in the bacterium
Escherichia coli favouring high phosphatase activity (Torriani, 1960). Growth of

173
Anabaena flos-aquae at high concentrations of nitrate results in nitrogen rich cells (Bone,
1971) and high phosphatase activity.
In this study the influence of combined nitrogen on phosphate nutrition of cotton
was studied with particular reference to stimulation of availability. As has been shown in
Chapter 5 .(5 .3), the inclusion of combined nitrogen in the plant growth medium had the
effect of decreasing phosphatase activity in cotton root systems. This was seen in all the
cultivars studied.
These results indicate that the overall nutritional status of plants influences the
activity to mobilize and absorb another particular ion. In this case decreases of
phosphatase was observed by increased combined nitrogen. It is unclear, however,
whether this was a direct effect on the enzyme activity or on indirect effect on protein and
enzyme synthesis due to the enhanced nitrogen status of the plant. These results are of
particular interest i f the phosphatase activity is the result of a stimulation of the genes for
enzyme synthsis. It would appear that there is a non-specific induction system operating.
Effect of cations on phosphatase A more extensive study of the effects of ions on phosphatase activity was made
using manipulation of the levels of Zn, Fe, Mn, Al and Ni. In all cases these ions had
inhibitory effects on phosphatase activity of cotton roots from plants grown without and
with phosphorus added to the culture medium.
A number of other studies have been made on the effects of ions on phosphatase
activity. Naganna et al. (1955) observed that As (v), Mo (vi) and W (vi) are competitive
inhibitors of acid phosphatase of potato. Studies by Juma and Tabatabai, 1977 showed
that many elements, including heavy metals, inhibited acid phosphatase activity of soil.
Other studies by Roberts (1956) on wheat leaves found that Cu (ii), Zn (ii), Ni (ii), Co(ii)
and Fe(iii) were strong inhibitors of acid phosphatase activity.

174
In particular the response of the acid phosphatase activity to zinc seems to be
greatly dependent on the tissue, organ and plant species and also on the assay condition
(Cox & Thurman, 1978 ; Lane & Puckett, 1979 ; Mathys, 1980). Zinc acts as a non
competitive inhibitor of the cell wall acid phosphatase in the root of Anthoxanthum
odoratum (Cox & Thurman, 1978). This effect is not always consistent since acid
phosphatase is regarded as being fairly tolerant of zinc (Mathys, 1980). Juma and
Tabatabai (1988) found that using 250 uM final metal concentrations of Zn, Fe, Ni, Mn,
and Al had marked 21 to 62 % inhibitory effects on acid phosphatase activity in roots.
However, these inhibitions were species specific and variable.
The results presented in this work on cotton showed 34, 40, 17, 53, and 61 %
inhibition of phosphatase activity roots of cotton by Zn, Fe, Mn, Al and Ni respectively,
when MUP was used as the substrate. Similar trends of inhibition were seen when pNPP
was used as the substrate. Clearly these ions are not all equally active at the same range
in inhibiting phosphatase. Zinc has a medium to low effect whereas Ni is the most
effective.
Phosphatase of higher plants and algae Whilst phosphatase activity was shown to be a component of cotton roots,
particularly in the absence of phosphate in the plant growth medium, it was essential that
this activity be related to that in other plants. A comparison was therefore made between
cotton and a range of other species; Primula farinosa, rice, wheat and two species of
algae Stigeoclonium and Draparnaldia. In all cases phosphatase was found to be
associated with these organisms, with roots of the higher plants and the whole organism in
the case of the algae. Acid phosphatase activities were detected with a pH range 4-6 in all
except Stigeoclonium where the activity was optimum at pH 10.0.
These results are in disagreement with those of Bieleski (1974) who, showed using
the same substrate the presence of both acid and alkaline phosphatases in Spirodela

175
homogenates and a marked shift in favour of alkaline phosphatase activity with
phosphorus deficiency in the plant.
Wynne (1977) also reported an increase in alkaline phosphatase activity in algal
cells with a decrease in phosphorus supply to them, and others (Lien & Knutson, 1973)
have shown similar effect with phosphorus deficiency in a culture of micro-organisms.
However, phosphorus deficiency in the growth medium have also been seen to produce
increased acid phosphatase activity (Soumalamen et al., 1960 ; Heredia et al., 1963; Nye,
1967).
Higher phosphatase activity was noted in cotton roots than in wheat and rice plants
at all pH levels, this may be due to nutrient uptake capacity of the plant roots. The results
described here show different rate of phosphatase activity in the species examined, this
could be due to the different phosphate content in plant tissues. Plant tissues often
contain high activity non-specific phosphatases (Bieleski, 1973), and the activity of the
enzymes has been shown to be related to the phosphate nutrition of the organism.
The results reported are also in agreement of the findings of Pakarinen (1978) who,
concluded that the concentration of elements in the plant tissue provide an accurate record
of the nutritional status of the environment and hence acid phosphatase activity may be
related to the tissue phosphorus concentration. Clearly the phosphatase status of cotton
is higher than the other species of higher plant studied. This indicates that the cotton crop
has the capacity to utilize organic phosphates in soils to a relatively efficient level.
The results presented here showed that the roots Primula farinosa had acid surface
phosphatase activity with maximum at pH 5.0, like other higher plants. The results are in
agreement with the findings of other workers who found the phosphatase activity at range
of pH from 4.0-6.0. Woolhouse (1969) while working with Agrostis tenuis roots found
acid phosphatase bound to cell walls. Suzuki and Sato (1973) found acid phosphatase
derived from walls of cultured cells of tobacco. Igaue et al. (1976) while working with
rice also found phosphatase activity in the same range of pH.

176
In the case of StigeocIonium results indicate both the strains (565, 577) showed
alkaline phosphatase activity with optimum at pH 10.0. The results are in agreement with
the findings of (Martin et al., 1987) who stated that the pH optimum of three
Stigeoclonium strains was near 10.0. The results showed that the optimum pH 5.0 was
noted for the strain 653 of Draparnaldia.
The results of this study are important with regard to the phosphate nutrition of
cotton, and the economic aspect of this, in Pakistan. Phosphate deficiency in soils of
Pakistan is a major factor in contributing to low crop yields in many areas. Deficiency
may arise because of lack of phosphate in the soil and /or its unavailability to plants.
Selection of cotton cultivars for enhanced ability to mobilize organic phosphate is
therefore very important. Currently this could be achieved by screening for maximum
phosphatase activity in present-day cultivars. In future, however, it should be possible to
enhance this capacity through selective breeding programmes. These selections may be
made by conventional genetic selection or, once genes for phosphatase have been
identified, by selective genetic transformation protocols.
This project should also be continued as an investigation into the phosphatase activity of
cotton cultivars no longer in use. Many of these cultivars were used extensively prior to
the application of modern phosphate fertilizers and therefore may have retained their
capacities for mobilization of organic soil phosphates. These cultivars may well serve as a
source of important genomic material. Current cultivars from a wide range of soil types
could also be screened. This could be very useful to the Breeder or Agronomist for
zoning of specific cultivars for particular phosphate-deficient soils according to the
phosphatase capacities of the cultivars.
177
SUMMARY
1) Seeds of cotton were brought from Sindh Pakistan and were used as a source of
seedlings for laboratory studies. A soil survey at the sites of seed origin was carried out
in 1992 as a part of this study. It was found all the cotton zones of Sindh had alkaline soil
pH, above 8.0. Conductivity of soil varied from 263 to 451 uS cm~l within the districts.
The soil organic matter also varied from 1.47 ppm at Khairpur to 0.29 ppm at Hyderabad.
2) The soil nitrogen did not differ significantly in each district, whereas soil phosphorus
was found to vary markedly; both of the elements were found to be at limiting levels for
plant growth. Potassium content of the soils was sufficient, although marked differences
were observed among the districts, and soil depths. In relation to the phosphate
nutritional levels of the plants phosphatase activity of seedling roots was investigated.
3) The roots of cotton cultivars were tested over a range of pH values; all the cultivars
showed acid phosphatase activity in the optimum pH range of 4-6. The plants grown
without phosphorus added to the growth medium yielded higher phosphatase activity than
the plants grown with phosphorus added to the growth medium.
4) Two substrates were used for measurement of PMEase activity, pNPP and 4-MUP.
No direct comparison between the rates was possible due to different concentrations being
used. It was observed that pNPP gave higher phosphatase activity than 4-MUP even
though it was used at a lower concentration.
5) Histological studies were carried out with the roots of cotton cv Qalandri grown
without and with phosphorus added to the growth medium. The plant roots grown
without phosphorus added to the growth medium exhibited strong PMEase staining
activity with BCIP, at the root surface, and in the cell walls. Fast Garnet GBC salt and P-
naphthyl phenyl phosphate was used and it was found that whole tissues stained indicating
PDEase. Staining and a marginal change in phosphatase activity on thorough washing of
roots indicated that the PMEase activity was from the roots not from contaminant micro
organism. Microscopy revealed no significant contamination.

178
6) A range of temperatures were tested for cotton root phosphatase activity, the
optimum was observed at 55°C with two substrates pNPP 71 uM and 4-MUP 100 uM, in
both growing conditions; without and with phosphorus added to the growth medium. It
was noted the exclusion of Na ,Ca, Ma, and K, from the assay medium reduced the
PMEase activity of roots of cv Qalandri.
7) Three ages (13,19, and 25 days) of cv Qalandri roots were tested for PMEase
activity and it was found that the phosphatase activity increased from 13-day old plants to
reach its peak in 19-day old plants and decreased in 25-day old plants. This was seen with
both substrates and both growing conditions, without and with phosphorus added to the
growth medium.
8) Phosphorus, nitrogen, potassium and magnesium mineral contents were individually
studied, in the different parts of cotton cultivars. In all cases the level of phosphate was
found higher in those seedlings which were grown with phosphorus added to the growth
medium than the plants grown without phosphorus added to the growth medium. A
similar trend was observed with the other minerals tested, nitrogen, potassium and
magnesium. However, the PMEase activity was found to be higher in roots of plants
which were grown without phosphorus or nitrogen added to the growth medium.
9) It was found that omitting magnesium from the plant growth medium had no effect
on PMEase activity of cv Qalandri roots, whereas roots of plants grown without
potassium added to the growth medium showed stimulated PMEase activity in comparison
to the plant grown with potassium added to the growth medium.
10) Experiment were performed where the concentrations of ion in the growth medium
were increased and the influence on phosphatase activity was limited. It was found up to
10 mM sodium added to the growth medium had no effect on PMEase activity cv Qalandri
roots, potassium showed marked reduction of PMEase activity, whereas calcium
stimulated the activity on lower concentrations, but 10 mM calcium reduced the PMEase
activity. Zinc inhibited highly the PMEase activity.

179
11) Phosphatase activity, increased in the plants under phosphate limitation conditions,
was maintained when plants were returned high phosphate status. It was observed
phosphatase increased in the older plants, this showed phosphatase level was related to the
age of the plant. Use of split root growth conditions indicated that the phosphorus status
of the whole plant was not important in regulation of root phosphatase activity. Levels of
phosphate at the individual roots were regulating, and particularly at their surfaces.
12) A comparison of different higher plants indicated that cotton was able to maintain a
relating high activity of phosphatase activity in its roots.

180
R E F E R E N C E S
Adam A.P., Bartholomew W.V.B. and Clark RE. (1954) Measurement of nucleic acid components in soil. Soil Sci. Soc. Am. Proc. 18, 40-46.
Al-Moissawi A . H . (1984) Biological studies on Algal in Rice-field Soil from the Iraqi Marshes. Ph.D. Thesis, University of Durham, England.
Al-Shehri A.R. (1992) An ecophysiological study on the moss Hydrogonium fontamim from the Asir Mountains, Saudi Arabia. Ph D Thesis, University of Durham, England.
Alverez E . F . (1962) Kinetics and mechanisms the hydrolysis of phosphoric acid esters by potato acid phosphatase. Biochim. Biophys. Acta. 59, 663-672.
Amin J.V. and Joham H.E. (1960) Growth of cotton as influenced by low substrate molybdenum. Soil Sci. 89, 101-107.
Appiah M.R. and Thomase R . L . (1982) Inositol phosphate and organic phosphorus contents and phosphatase activity of some Canadian soils. Can. J. Soil Sci. 62, 31-38.
Arnon D.I., Stout P.R. and Sipos F. (1940) Radioactive phosphorus as an indicator of phosphorus absorption of tomato fruits at various stages of development. Am. J. Bot. 27, 791-798.
Asher C .J . and Edwards D.G. (1983) Modern solution culture techniques. In: Encyclopedia of Plant Physiology, New Series A. Lauchli and R.L. Bieleski, (eds.),Vol. 15 A, pp. 94-119. Springer-Verlag, New York, NY. ISBN 0-387-12103-X.
Ashford A .E . and McCuIly M.E. (1970) Localization of naphthol AS-B1 phosphatase activity in lateral and main root meristem of pea and corn. Protoplasma 70, 441-456.
Award A.S., Edwards D.G. and Campbell L . C . (1990) Phosphorus enhancement of salt tolerance of tomato. Crop. Sci. 30, 123-128.
Baligar V.C. and Bennett O.L. (1986) NPK-Fertilizer efficiency-a situation analysis for the tropics. Fert. Res. 10, 147-164.
Balls W.L. (1990) The effect of seed weight on the field germination of cotton seed Cairo. Sci. J. 4, 185-187.

181
Baloch A.H. (1994) Studies on the effect of salinity and heavy meatals on the sporophytic and gametophytic generation of Arabidopsis thaliana L. Heynh. Ph.D Thesis, University, Durham, England.
Barber S.A. (1984) Soil nutrient bioavailability: A mechanistic approach. John Wiley & Sons, New York.
Barrett-Lennard E . G . , Robson A.D. and Greenway H. (1982) Effect of phosphorus deficiency and water deficit on phosphatase activity from wheat leaves. J. Exp. Bot. 33, 682-693.
Bartlett E .M. and Lewis D.H. (1973) Soil Biol Biochem 5, 249
Bassett D .M. , Stokton J .R and Dickens W.L. (1970b) Root growth of cotton as measured by P^^ uptake. Agron. J. 60, 200-203.
Benes K . and Opatrma J . (1964) Localization of acid phosphatase in differentiating root meristems. J. Exp. Bot. 6, 8-16.
Benes K. (1971) Histogenesis and localization of non-specific esterase in root tip. Biologia Pi. 13, 110-121.
Besford R.T. (1978) Effect of phosphorus supply on phosphatase in the leaves of tomato plants. Sci. Hort. 9, 303-309.
Besford R.T. and Syred A.D. (1979) Effect of phosphorus nutrition on the cellular distribution of acid phosphatase in the leaves of Lycopersicon esculentumL. Ann. Bot. 43, 431-435
Besford R.T. (1979a) Quantitative aspects of leaf acid phosphatase activity and phosphorus status of tomato plants. Ann. Bot. 44, 153-161.
Besford R.T. (1979b) Phosphorus nutrition and phosphatase activity in the leaves of seven plant species. J. Sci. Fd Agric. 30, 281-285.
Bhatt J .G. and Appukuttan E . (1971) Nutrient uptake in cotton in relation to plant architecture. Plant and Soil. 35, 381-388.
Bieleski R X . (1968) Effect of phosphorus-deficiency on levels of phosphorus compounds in Spirodela. Plant Physiol. 43, 1309-1316.
Bieleski R . L . (1974) Development of an exocellular alkaline phosphatase as a response to phosphorus deficiency by wheat seedlings. Mechanism of regulation of plant growth. R. Soc. N.Z. Bull. 65, 165-170.
Bieleski R . L . and Johnson P.N. (1972) The external location of phosphatase activity in phosphorus-deficient Spirodela oligorrhiza. Aust. J. Biol. Sci. 25, 707-720.

182
Bieleski R L . (1973) Phosphate pools, phosphate transport and phosphate availability. Ann. Rev. Plant Physiol. 24, 225-252.
Blanchar R.W. and Caldwell A .C . (1966) Phosphate-ammonium-moisture relationship in soil: I I . Ion concentration in leached fertilizer zones and effects on plants. Soil Sci. Soc. Am. Proc. 30, 43-48.
Blum J .J . (1965) Observations on the acid phosphatase of Euglena gracilis. J. Cell Biol. 24 , 223-233.
Bone D.H (1971) Nitrogenase activity and nitroge assimilation in Anabaena flos-aquae growing continuous culture. Arch. Microbiol. 80, 234-241.
Boutin J.P. Provot M. and Roux L . (1981) Effect of cycloheximide and renewal of phosphorus supply on surface phosphatase activity of phosphorus deficient tomato roots. Physiol. PI. 51, 353-360.
Bowen G.D. (1970) The early expression of phosphate difficiency in plants. Soil Sci. Plant Anal. 1, 293-299.
Bremner J.M. (1965a) Nitrogen availability indexes. Agronomy 9, 1324-1345.
Bremner J.M. (1965b) Organic nitrogen in soil. In: Soil Nitrogen Agronomy Monograph JO. M.W.Bartholomew and F.E. Clark (eds), ASA, Madison, M I . pp 93-149.
Birch H.F. (1964) Mineralization of plant nitrogen following alternate wet and dry conditions. Plant and Soil 20, 43-49.
Brink J.W. (1978) World resources of phosphorus. In: Phosphorus in the Environment, its Chemistry and Biochemistry. A Ciba Foundation Symposium pp. 23-48.
Broadbent F . E . (1984) Plant use of soil nitrogen. In: Nitrogen in Crop Production. R.D. Hauck (ed ), ASA, CSSA, and SSSA, Madison, M I . pp. 171-182.
Broberg B. (1985) Biological availability of different fractions of dissolved phosphorus in two natural waters, algal assay experiments. Ver. Int. Verein. Limnol. 22, 2898-2903.
Broberg O. and Persson G. (1988) Particulate and dissolved phosphorus forms in freshwater composition and analysis. Hydrobiolgia 170, 61-90.

183
Brouder S.M. and Cassman K . G . (1990) Root development of two cotton cultivars in relation to potassium uptake and plant growth in a vermiculitic soil. Field Crop Res. 23, 187-203.
Brouder S.M. and Cassman K . G . (1994) Evaluation of mechanistic model of potassium uptake by cotton in a vermiculitic soil. Soil Sci. Soc. Am. J
Burke I .C . , Yonker C M . , Par ton W.J., Cole C.V., Finch k and Schimel (1989) Texture, climate and cultivation effects on soil organic matter content in U S grassland soils. Soil Sci Soc. Am. J. 53, 800-805.
Chang C.W. and Bandurski R.S. (1964) Exocellular enzymes of corn root. Plant Physiol. 39, 60-64.
Chandru R., Prasad T.G. , Giriraj K. and Merwade N.N. (1987) Effect of salinity on germination and seedling growth of sunflower genotypes. J of Oilseeds Research 4, 136-138.
Chapin F.S. and Bieleski R X . (1982) Mild phosphorus stress in barley and a related low phosphorus adapted barleygrass. Phosphorus fractions and phosphate absorption in relation to growth. Physiol. PI. 54, 309-317.
Carson P.L. (1975) Recommended nitrate-nitrogen tests. In W.C Dahnke (ed.) Recommended central region. North Dakota Agric. Exp. Stn Bull. 499.
Chrost R.J . , Siuda W. and Halemejko G. (1984) Long term studies on alkaline phosphatase activity (APA) in a lake with fish-aquaculture in relation to lake eutrophication and phosphorus cycle. Arch. Hydrobiol. Suppl. 70, 1-32.
Chhonkar P.K. and Tarafdar J .C . (1984) Accumulation of phosphatases in soils. J. Indian Soc. Soil Sci. 32, 256-272.
Christensen N.W. and Jackson T . L . (1981) Potential for phosphorus toxicity in zinc-stressed corn and potato. Soil Sci. Soc. Am. J. 45, 904-909.
Chu S.P. (1942) The influence of the mineral composition of the medium on the growth of planktonic algae I . Methods and culture media. J. Ecol. 30, 284-325.
Clarkson D.T., Sanderson J . and Scattergood C.B. (1978) Influence of phosphate -stress on phosphate absorption and translocation by various parts of the root system of Hordeum vulgare L. (barley). Planta 139, 47-53.

184
Cole C.V., Grunes D.L., Porter L . K . and Olsen S.R. (1963) The effect of nitrogen on short-term phosphorus absorption and translocation in corn (Zeamays). Soil Sci Soc. Am. Proc. 27, 671-674.
Colwell J.D. (1967) The calibration of soil test. J. Aust. Inst. Agric. Sci. 33, 321-330.
Cope J .T. (1984) Relationship among rates of N , P and K, soil test values, leaf analysis and yield of cotton at six locations. Commun. Soil Sci. Plant Anal. 15, 253-376.
Cosgrove D.J. (1967) Metabolism of organic phosphates in soil In: Soil Biochemistry. McLaren, A D. and Peterson, G.H. (eds), Chap. pp. 216-228. Marcel Dekker Inc. New York.
Coston S. and Holt S.J. (1958) Kinetics of aerial oxidation of indolyl and its halogen derivatives. Proc. Roy. Soc. B148, 506-510.
Cotton: World Statistics (1992) Bulletin of the International Cotton Advisory Committee. 45,(2).
Cox R.M. and Thurman D.A. (1978) Inhibition by zinc of soluble and cell-wall acid phosphatases of zinc-tolerant and non-tolerant clones of Anthoxanthum odoratum New Phycologist 80, 17-22.
Crime J.P. and Hodgson J .G. (1969) An investigation of the ecological significance of lime-chlorosis by means of large scale comparative experiments. In: Ecological Aspects of the Mineral Nutrition of plants. I . H. Rorison. (ed.), pp. 67-100. Blackwell Sci. Publ., Oxford and Edinburgh.
Czernik C.A. and Avers C .J . (1964) Phosphatase activity and cellular differentiation in Phleum root meristems. Am. J. Bot. 51, 424-431.
Dahnke W.C. and Vasey E .H. (1973) Testing soils for nitrogen. In: Soil Testing and Plant Analysis. L.M. Walsh and J.D Beaton (ed.), pp. 97-114 SSSA, Madison, WI.
Dawson R.M.C., Elliott D.C., Elliott W.H. and Jones K . M . (1986) pH, buffers and physiological media. In: Data for Biochemical Research. 3rd. Edn. pp. 417-448. Clarendon Press, Oxford.
De Jager A. (1982) Effects of localized supply of H2PO4, NO3, SO4, Ca, and K on the production and distribution of dry matter in young maize plants. Neth. J. Agric. Sci. 30, 193-203.
DeJong D.W. (1965) Histochemical demonstration of extracellular distribution of acid phosphatase in onion roots. Phyton (Vicent Lopez, Argent.) 22, 141-146.

185
De Vries P. J. R. and Kamphof G.J. (1984) Growth of some strains of Stigeoclonium (Chlorophyta) on nitrate, ammonium nitrate and urea. Br. phycol. J. 19, 349-356.
Doonan B .B. and Jensen T .E (1979) Effects of ions on the activity of the enzymes alkaline phosphatase from Plectonema boryanum. Microbios. 25, 177-186.
Doonan B.B. and Jensen T .E . (1980) Physiological aspects of alkaline phosphatase in selected cyanobacteria. Microbios 29, 185-207.
Dracup M.N.H. (1981) Phosphorus nutrition and extracellular phosphatase activity of roots of subterranean clover {Trifolium subterraneum L ) . Honours Dissertation. Dept. Agron., Univ. of Western Australia.
Dracup M.N.H., Barrett-Lennard E . G . , Greeway H. and Robson A.D. (1984) Effect of phosphorus deficiency on phosphatase activity of cell walls from roots of subterranean clover. J. Exp. Bot. 35, 466-480.
Drew M.C (1975) Comparison of the effects of localized supply of phosphate, nitrate, ammonium, and potassium on the growth of the seminal root system, and the shoot, in barley. New Phytol. 75, 479-490.
Dubey R.S and Sharma K.N. (1990) Behaviour of phosphatases in germinating rice in relation to salt tolerance. Plant Physiology and Biochemstry 28, 17-28.
Ducet G. Blasco F. and Jeanjean R. (1977) Regulation of phosphate transport in Chlorella pyrensoidosa and Candida tropicalis. In. Regulation of Cell Membrane activities in Plants. E. Marre and O .Ciferri (eds ), pp. 55-62. Elsevier/North Holland Biomedical Press, Amsterdam.
Dunlop J . and Bowling D.J.F. (1978) Uptake of phosphorus by white clover. J. Exp. Bot. 29, 1174.
Eaglesham A.R.J. and Ayanaba A. (1984) Tropical stress ecology of rhizobia, root nodulation and nitrogen fixation. In: Current Development in Biological Nitrogen Fixation. N.S. Suba Rao (ed.) pp. 1-36 Edward Arnold Publishers, London.
Epstein E . (1972) Mineral Nutrition of Plants: Principles and Perspectives. John Wiley and Sons, Inc., New York. pp. 412.
Ergle D.R. and Eaton F.M. (1957) Aspect of phosphorus metabolism in the cotton plant. Plant Physiol. 32, 106-113.

186
Esterman T.F. and Mclaren A.D. (1961) Contribution of rhizo-plane organism to the total capacity of plants to utilize organic nutrients. Plant and Soil 15, 243-260.
Evanylo G.K., Grove J.H. and Sims J . L . (1988) Effect of sampling period on nutrient diagnostic indicies for burley tobacco. Agron. J. 80, 615-619.
Fageria N.K. (1984) Fertilization and mineral nutrition of rice. EMBRAPA-CNPAF / Editora campus, Rio de Janeiro.
Feuillade J., Feuillade M. and Blanc P. (1990) Alkaline phosphatase activity fluctuations and associated factors in a eutrophic lake dominated by Oscillotoria nibescens. Hydrobiol. 207, 233-420.
Fiske C.H. and Subbarow Y. (1925) The colorimetric determination of phosphorus. J. Biol. Chem. 66, 375-400.
Flowers T.J . , Troke P.F. and Yeo A.R. (1977) The mechanism of salt tolerance in halophytes. Annual Rev. Plant Physiol. 28, 89-121.
Flynn K . J . , Opik H. and Syrrett P.J. (1986) Localization of alkaline phosphatase and 5-nucleotidase activities of the diatom Phaeodactylum tricomutum. J. Gen. Microbiol. 132, 289-298.
Foster H.L. (1972) The Identification of potentially potassium deficient soils in Uganda. E. Agric. For. J. 37. 224-233.
Fox R . L . (1981-1982) Using phosphate sorption curves to determine P requirements. Better Crops Plant Food 66, 24-26.
Fryxell P.A. (1979) The natural history of the cotton tribe. Texas A and M University Press College Station London.
Gabar A.I., El-Kadi M., El-Saidi M.T. and Kortam M.A. (1975) The combined effect of soil salinity and nitrogen levels on dry matter accumulation and yield of cotton of plants. Z. Acker- und Pflanzenban 141, 151-159.
Gahan P.B. and Maple A.J. (1966) The behaviour of lysosome-like particles during cell differentiation. J. Exp. Bot. 17, 151-155.
Ghani M.O. and Aleem S.A. (1943) Studies on the distribution of different forms of phosphorus of some Indian soils. I . Surface distribution. Indian J. Agric. Sci. 13, 283-288.

187
Gelderman R.H., Dahanke W.C. and Swenson L . (1988) Correlation of several soil N indicies for wheat. Commun. Soil Sci. Plant. Anal. 19, 755-772.
Gerik T.J., Jackson B.S., Stockle C O . and Rosenthal W.D (1994) Plant nitrogen status and boll load of cotton. Agron. J. 86, 514-518
Gibson M.T and Whitton B.A. (1987) Hair phosphatase activity and environmental chemistry in freshwater Stigeoclonmm, Chaetophora and Draparnaldia (Chaetophorales). Br. Phytol. J. 22, 11-22.
Glass A .D.M. (1977) Regulation of K influx in barley roots evidence for direct control by nutrient K. Aust. J. Plant Physiol. 4, 313-318.
Goldstein A .H. , Baertlein D.A. and Me Daniel R.G. (1988) Phosphate starvation inducible metabolism in L. esculentum.l. Excretion of acid phosphatase by tomato plant and cells. Plant Physiol 87: 711-715.
Grainger S.L.J . , Peat A., Tiwari D.N. and Whitton B .A. (1989) Phosphomonoesterase activity of the cyanobacterium (blue-green alga) Calothrixparietina. Microbios 59, 7-17.
Granato T .C and Raper C D . Jr (1989) Proliferation of maize roots in response to localized supply of nitrate. J. Exp. Bot. 40, 263-275.
Greaves M.P. and Webley D.M. (1965) A study of the breakdown of organic phosphates by microorganisms from the root region of certain pasture grasses. J, Appl. Bact. 28, 454.
Greenwood D.J., Gastall F . , Lemaire G. , Draycott A., Millard P., and Neeteson J .J . (1991) Growth rate and % N of field grown crops. Theory and
experiments Annals of Botany 67, 181-190.
Grimes D.W. and EL-Zik K . M . (1982) Water management for cotton. Univ. California Div. Agric. Sci. Bull. 1904.
Gulati A .M. and Turner A .J . (1928) A note on the early history of cotton. Tech. Lab. Bull. No 17. Indian Central Cott. Cttee. (Quoted by Hutchinson etal 1947).
Gulick S.H., Cassman K . G . and Gratten S.R. (1989) Exploitation of soil potassium in layered profiles by root system of cotton and barley. Soil Sci. Soc. Am. J. 53, 146-253.
Haas H.J., Evans C E . and Miles E.R. (1957) Nitrogen and carbon changes in soil as influenced by cropping and soil treatments. USDA Tech. Bull. Govt. Print. Office, Washington, D C.

188
Hackett C. (1968) Study of the root system of barley. NewPhytol. 67, 287-299.
Hackett C . (1972) A method of applying nutrients locally to roots under controlled conditions and some morphological effects of locally applied nitrate on the branching of wheat roots. Aust. J. Biol. Sci. 25, 1169-1180.
Hagen C .A. and Hopkins H.T. (1955) Ionic species in orthophosphate absorption by barley roots. Plant. Physiol. 30, 193-199.
Halemejko G.Z. and Chrost R.J . (1984) The role of phosphatases in phosphorus mineralization during decompositon of lake phytoplankton blooms. Arch. Hydrobiol. 101, 489-502.
Hall J . L . and Butt V.S. (1968) Localization and kinetic properties of P-glycerophosphate in barley roots. J. Exp. Bot. 19, 276-287.
Hall J . L . (1969) Histochemical localization of (5-glycerophosphate in young root tips. Ann. Bot. 33, 399-406.
Hall J . L . (1969) Adenosine triphosphatase activity in cell wall preparations and excised roots of barley. J. Exp. Bot. 20, 751-762.
Hall J . L . and Davie C . A . M . (1971) Localization of acid hydrolase activity in Zea mays L. root tips. J. Exp. Bot. 33, 399-406.
Halstead R . L . , Lapensee J.M. and Ivarson K . C . (1963) Mineralization of soil organic phosphorus with particular reference to the effect of lime. Can. J. Soil Sci. 43, 97-106.
Hasegawa Y. Lynnk R. and Brockbank W.J. (1976) Isolation and partial characterization of cytoplasmic and wall-bound acid phosphatase from young wheat roots. Can. J. Bot. 54, 1163-1169.
Healey F.P. (1973) Characteristics of phosphorus deficency in Atrabaena. J. Phycol. 9, 383-394.
Healey F.P. (1982) Phosphate. In: The Biology of Cyanobacteria. N.G. Carr and B.A. Whitton (eds.), pp. 105-124. Blackwell Oxford.
Hearn A .B. (1981) Cotton nutrition Field Crop Abstr 34, 11-34.
Helal H.M. and Sauerbeck D.R. (1984) Influence of plant roots on C and P metabolism in soil. Plant Soil 76, 175-182.

189
Hino S. (1989) Characterization of orthophosphate release from organic phosphorus by gel filtration and several hydrolytic enzymes. Hydrobiologia 174, 49-55.
Hoagland D.R. and D.I. Arnon (1938) The water-culture method for growing plants without soil. Univ. Cal. Agric. Exp. Sta. Circ. 347.
Holford I . (1989) Phosphorus behaviour in soils. Agric. Sci. 12, 15-20
Holt S.J. and Witheres R.J.F. (1958) An appraisal of indigogenic reactions for esterase localization. Pro. Roy. Soc. B 148, 510-526.
Hutchinson J.B. (1954) New evidence on the origin of old World cottons. Heredity 8, 225-241.
Hutchinson J.B., Silow R.A. and Stephen S.G. (1947) The Evolution of Gossypium. Oxford Univ. Press, London.
Igaue I . , Yamanobe T. and Kurasawa F . (1975) Multiple forms and specificities of acid phosphatase from rice bran: Multiplicity and structure of rice plant acid phosphatase. Nippon Nogei Kagaku Kaishi 49, 353-362.
Ihsan A., Mahasneh, Graiger S.L.J , and Whitton B.A. (1990) Influence of salinity on hair formation and phosphatase activity of the blue-green alga (cyanobacterium) Calothrix viguieri D 253. Br. Phytol. 25, 25-32.
Islam M.R. and Whitton B.A. (1992) Phosphorus content and phosphatase activity of the deep water rice-field cyanobacterium (blue green algae) Calothrix D764. Microbios. 69, 7-16.
Jansson M., Olsson H. and Broberg O. (1981) Characterization of acid phosphatases in the acidified lakes, Gardsjon, Sweden. Arch. Hydrobiol. 92, 77-395.
Jansson M., Olsson H. and Pettersson K. (1988) Phosphatase origin, characteristics and function in lakes, Hydrobiologia 170, 157-175.
Javed I . Mirza and Robina Tariq (1993) Effect of salinity on growth , seed yield and nodulation of Cicer arietirmm. Pak. J. Bot. 25, 47-50.
Jenny H. (1980) The Soil Resource. Ecological Studies 37. Springer-Verlag, New York.
Jensen W.A. (1956) The histochemical localization of acid phosphatase in root tip cells. Am. J. Bot. 43, 50-54.

190
Jeschke W.D. and Wolf O. (1988) External potassium supply is not required for root growth in saline conditions: experiments with Ricimis communis L. grown in a reciprocal split-root system. J. Exp. Bot. 39, 1149-1167.
Jones J . G. (1972) Studies on freshwater bacteria: Association with algae and phosphatase activity. J. Ecol. 60, 59-75.
Johnston W.R. and Proctor J . (1984) The effects of magnesium, nickel, calcium and micronutrients on the root surface phosphatase activity of a serpentine and non-serpentine clone of Festuca rubra L. New Phytol. 96, 95-101.
Juma N.G. and Tabatabai M.A. (1988) Phosphatase activity in corn and soyabean roots conditions for assay and effects of metals. Plant and Soil 107, 39-47.
Kamprath E . J . (1972) Soil acidity and liming. In: Soil of the Humid Tropics. pp. 136-149, Nat. Acad Sci.-Nat. Res. Council Committee on Tropical Soils, Washington, D C.
Keeney D.R. and Bremner J . M . (1966) A chemical index of soil nitrogen availability. Nature, London 211, 892-893.
Khasawneh F . E . and Coleland J.P. (1973) Cotton root growth and uptake of nutrients: Relation of phosphorus uptake to quantity, intensity and buffering capacity. Agron. J. 37, 250-254.
Kivilaan A., Beaman T.C. and Bandurski R.S. (1961) Enzymatic activities associated with cell wall preparations from corn coleoptiles. Plant Physiol. 36, 605-610.
Kumar D. and Tarafdar J .C . (1989) Genetic variation of salt tolerance in seedling emergence, early growth characters and phosphatase activity of sunflowers growing on acid soils. Journal of Arid Environments 16, 263-269.
Kummerova M . (1986) Localization of acid phosphatase in maize root under phosphorus deficiency. Biol. Plant. 28, 270-274.
Kummerova M . , Zatezalo S. and Stankovic Z.S. (1989) Acid phosphatase activity of three wheat cultivars depending on phosphate nutrition. Acta Biol. Med. Exp. 14, 167-172.
Lamport D.T.A., and Northcote D.H. (1960) The use of tissue cultures for the study of plant-cell walls. Biochem. J. 76, 52.

191
Lane I. and Puckett K . J . (1979) Response of the phosphatase activity of the lichen Cladonia rangiferina to various environmental factors including metals. Can. J. Bot. 57, 1534-1540
Lee R.B. (1982) Selectivity and kinetics of ions uptake of barley plants following nutrient deficiency. Ann. Bot. 50, 429-449.
Lee R.B. (1988) Phosphate influx and extracellular phosphatase activity in barley roots and rose cells. New Phytol. 109, 141-148.
Lefebvre D.D. and Glass A.D.M. (1982) Regulation of phosphate influx in barley roots: Effects of phosphate deprevation and reduction of influx with provision of orthophosphate. Physiol. PI. 54, 199-206.
Le Mare P.H. (1972) Long term experiments on soil fertility and cotton yield in Tanzania. Exp. Agric. 8, 299-310.
Le Mare P.H. (1974) Response of cotton to ammonium sulphate and superphosphate and relationships between yield and same soil constituents in Tanzania. J. Agric. Sci. Camb. 83, 47-56.
Leonce F.S. and Miller M.H. (1966) A physiological effect of nitrogen on phosphorus absorption by corn. Agron. J. 58, 245-249.
Livinston D.C., Fisher S.W., Greenoak G.E . and Maggi V. (1970) A new procedure of ultrastructural localization of acid phosphatases. Histochimie. 24, 159-167.
Livingston D., Khoja T.M. and Whitton B.A. (1983) Influence of phosphorus on physiology of a hair-forming blue-green algae (Calothrix parietina) from an upland stream. Phycologia 22, 345-350.
Longergan J .F . , Grunes D.L., Welch R.M., Aduayi E.A., Tengah A., Lazar V.A and Cary E . E . (1982) Phosphorus acummulation and toxicity in
leaves in relation to zinc supply. Soil Sci. Soc. Am. J. 46, 345-352.
Lovato A. (1981) Germination of seeds. In: Advances in Research and Technology of Seeds, Part 6. JR. Thomson,(ed), pp. 86-119. Centre for Agriculture Publishing and Documentation, Wageningen, The Netherland.
LufT H (1993) A study of the root surface phosphatase activities of three species of higher plants: Junciis ejfusus, Phragmites australis, and Typha latifolia. MSc. Dissertation, University, Durham, England.
Magdoff F.R., Ross D., and Amadon J . (1984) A soil test for nitrogen availability to corn. Soil Sci. Soc. Am. J. 48, 1301-1304.

192
Mahasneh I.A., Grainger S.L.J. and Whitton B.A. (1990) Influence of salinity on hair formation and phosphatase activities of the blue-green alga (cyanobacterium) Calothrix viguieri D 253. Br. Phycol. J. 25, 25-32.
Malamy M. and Horecker B. (1961) The localization of alkaline phosphatase in E. coli K-\2. Biochem. Biophys. Res. Com. 5, 104-108.
Malik K.A. (1978) Biological methods of reclamation of salt affected soils. In: Technology for increasing food production. J.C. Holmes, (ed), pp. 105-109. Proc.of2nd FAO/SIDA.
Manchanda H.R., Sharma S.K. and Bhandari D.K. (1982) Response of barley and wheat to phosphorus in the presence of chloride and sulphate salinity. Plant and Soil 66, 233-241.
Marcum K.B. and Murdoch C . L . (1992) Salt tolerance of the coastal salt marsh grass, Sporobolus virginicus L. Kunth. New Phytol. 120, 281-288.
Marschner H. and Cakmak I. (1986) Mechanism of phosphorus-induced zinc deficency in cotton. I I . Evidence for impaired shoot control of phosphorus uptake and translocation under zinc deficiency. Physiol. PI. 68, 491-496.
Martin T., Gibson M.T. and Whitton B.A. (1987) Influence of phosphorus on morphology and physiology of freshwater Chaetophora, Draparnaldia and Stigeoclonium (Chaetophorales, Chlorophyta). Phycologia 26, 59-69.
Martinez V. and Lauchi A. (1991) Phosphorus translocation in salt-stressed cotton. Physiol. PI. 83, 627-632.
Mason B. and Berggren T. (1941) A phosphate bearing spessartite from Wodgina W. Australia. Geologiska Foreningens, Stockholm, Fozhan dlingar 63, 413-418.
McChurkin I .T. and McChurkin D.C. (1967) Cytochemical demonstration of sodium activated and potassium activated adenosine triphosphatase in lobolly pine seedling root tips. Plant. Physiol. 42, 1103-1110.
McComb R.B., Bowers G .N. and Posen S. (1979) Alkaline Phosphatases. p 986.Plenum Press, New York, USA.
McGowan M. (1984) Soil water regimes of soils developed on keuper marl J. ofSoilSci. 35, 317-321.
McLachlan K.D. (1976) Comparative phosphorus responses in plants to a range of available phosphorus situations. Aust. J. Agric. Res. 27, 323-341

193
McLachlan K.D. (1980) Acid phosphatase activity of intact roots and phosphorus nutrition in plants. I . Assay conditions and phosphatase activity. Aust. J. Agric. Res. 31, 429-440.
McLachlan K.D. and DeMarco D.G. (1982) Acid phosphatase activity of intact roots and phosphorus nutrition in plants. I I I . Its relation to phosphorus garnering by wheat and comparison with leaf activity as a measure of phosphorus status. Aust. J. Agric Res. 33, 1-11.
McLean J . and Gahan P.B. (1970) The distribution of acid phosphatases and esterases in differentiating root of Viciafaba. Histochimie 24, 41-49.
McLellan W.L. and Lampen J.O. (1963) The acid phosphatase of yeast localization and secretion by protoplasts. Biochem. Biophys. Acta 67, 324-326.
McKelvey V . E . (1973) Abundance and distribution of phosphorus in the lithosphere. In: Environmental Phosphorus Handbook, E.J. Griffith, A. Beston, J.M Spencer and D.T Mitchell (eds ), pp. 13-31 J. Wiley and sons, New York USA.
Mclean R.O. (1974) The tolerance of Stigeoclonium tennue Kutz. to heavy metals in South Wales. Br. Phycol. J. 9, 91-95.
McMichael B .L . and Powell R.D. (1970) Effect of temperature regimes on flowering and boll development in cotton. Cotton Gr. Rev. 48, 125-130.
Mehta B.V. and Desal R.S. (1959) Salt tolerance studies. Effect of soil salinity on the growth and chemical composition of plants. J. Soil Water Conserv. India 7, 101-105.
Memon K.S. and Fox R . L . (1983) Utility of phosphate sorption curves in estimating the phosphorus requirements of cereal crops wheat (Triticum aestivum), In: Proceeding 3rd International Congress on Phosphorus Compound, pp. 217-236 Brussels, Belgium.
Memon K.S. , Rashid A. and Puno H.K. (1992) Phosphorus deficiency diagnosis and P soil test calibration in Pakistan. In: Proceding Phosphorus Decision Support System College Station, TX, pp. 125-147
Minear R .A. (1972) Characterization of naturally occurring dissolved organophosphorus compounds. Envir. Sci. Technol. 6, 432-437.
Miller M.H. and Ohlrogge (1958) Principles of nutrient uptake from fertilizer bands. Effect of placement of nitrogen fertilizer on the uptake of band-

194
placed phosphorus at different soil phosphorus levels. Agron. J. 50, 95-97.
Mirza J .I . and Tariq R. (1992) Effect of sodium chloride on growth and nodulation of Sesbania sesban. Pak.J.Bot., 24(2), 209-212..
Moller M., Myklestad S. and Haug A. (1975) Alkaline and acid phosphatases of the marine diatoms Chaetoceras affinis var. Willei (Gran) Hustedt and Skeletonema costatum (Grev). Cleve. J. Exp. Mar. Biol. Ecol. 19, 217-226.
Moraghan J.T. (1985) Plant tissue testing for micronutrients deficiencies and toxicities. Fert. Res. 7, 201-219.
Munson R.D. and Nelson W.L. (1973) Principles and practices in plant analysis, In: Soil Testing and Plant Analysis. L.M. Walsh and J.D. Beaton (eds.),pp. 223-248 Soil Sci. Soc. Am., Madison. Wisconsin.
Mullins G.L . and Burmester C.H. (1990) Dry matter, nitrogen, phosphorus and potassium accumulation by four cotton varieties. Agron. J. 82, 729 -736.
Mullins G . L , Reeves D.W, Burmester C.H and Bryant H.H. (1994) In-row subsoiling and potassium placement effects on root growth and potassium content of cotton. Agron. J 86, 136-139.
Murrmann R.P. and Peech M. (1969). Effect of pH on labile and soluble phosphate in soils. Soil Sci. Am. Proc. 33, 205.
Naganna B., Venugopal B. and Stripathi C . E . (1955) Occurrence of alkaline pyrophosphatase in vegetable tissues. Biochem. J. 60, 224-225.
Nayakekorala H. and Taylor H.M. (1990) Phosphorus uptake rates of cotton roots at different growth stages from different soil layers. Plant and Soil 122, 105-110.
Nelson L . E . (1980) Phosphorus nutrition of cotton, peanuts, rice, sugarcane and tobacco. In: The Role of Phosphorus in Agriculture, F.E Khasawneh (ed.), pp. 693-736 ASA, CSSA, and SSSA, Madison, WI.
Norlyn J.D., Epstein E . (1984) Variability in salt tolerance of four triticale lines at germination and emergence. Crop Science. 24, 1090-1092.
Nye J .F . (1967). A repressible acid phosphatase from Neurospora. Biochem. Biophys. Res.Commun. 27, 183.
Onofeghara F.A. (1972) Histochemical localization of enzymes in Tapnanthus bengwensis. Acid phosphatase. Am. J. Bot. 59, 549- 556.

195
Onofeghara F.A. and Koroma (1974) Histochemical localization of alkaline phosphatases and p-Glucosidases in Cucurbitaceae. Ann. Bot 38, 705-710.
Olsen R.A. and Dreier A.F. (1956) Nitrogen, a key factor in fertilizer phosphorus efficiency. Soil Sci. Soc. Am. Proc. 20, 509-514.
Olson L . C . and Bledsoe R.P. (1942) The chemical composition of the cotton plant and the uptake of nutrients at different stages of growth. Georgia Agric. Exp. Stn. Bull. 222.
Ostenfeld E .H. and GrontvedJ. (1934) The Flora of Iceland and the Faeroes. Williams and Norgate Ltd. London.
Pakarinen P. and Tolonen K. (1977) Nutrient contents of Sphagnum mosses in relation to bog water chemistry in northern Finland. Lindbergia 41, 27-34.
Phillips J . E . (1964) The ecological role of phosphorus in waters with special reference to micro-organisms. In: Principles and Applications in Aquatic Microbiology, H. Heukelekian andN.C. DenderoN.C. (eds), pp. 61-81. J. Wiley and Sons, N Y. USA.
Pitman M.G. (1972) Uptake and transport of ions in barley seedlings I I I . correlation between trasport to the shoot and relative growth ratio. Aust. J. Biol. Sci. 25,906-919.
Plekhanova L.S . , Ivleva L.B . , Azimov R.A. and Ibragimova E.A. (1991) Adinosine triphosphate activity of plasma membranes from cotton roots. Soviet Plant Physiol. 38, 193-199.
Press M.C. and Lee J.A. (1983) Acid phosphatase activity in Sphagnum species in relation to phosphate nutrition. NewPhytol. 93, 567-573.
Preston R.D. (1974) The physical biology of plant cell walls. Chapman and Hall. London.
Price C.A. (1962) Repression of acid phosphatase synthesis in Euglena gracilis. Science, 135, 46.
Radin J.W. (1977) Contribution of the root system to nitrate assimilation in whole plants. Aust. J.Plant Physiol. 4, 811-819
Radin J .W. (1978) A physiological basis for the division of nitrate assimilation between roots and leaves. Plant Sci. Letters 13,21-25.

196
Ramig R . E . and Rhoades J . (1963) Interrelationships of soil moisture level at planting time and nitrogen fertilization on winter wheat production. Agron. J. 55, 123-127.
Reid M.S. (1968) Response of Spirodela to phosphorus deficiency. Ph D Thesis, University of Auckland, Australia.
Reid M.S. and Bieleski R . L . (1970) Changes in phosphatase activity in phosphorus deficient Spirodela. Planta 94, 273-281.
Ridge E . H . and Rovira A.D. (1971) Phosphatase activity of intact young wheat roots under sterile and non-sterile conditons. New Phytol. 70, 1017-1026.
Rigler F.H. (1973) A dynamic view of the phosphorus cycle in lakes. In: Environmental Phosphorus Handbook. E.J Griffith, A. Beston, J.M. Spencer and T.D. Mitchell (eds.), pp. 539-568. J. Wiley and sons, N Y, USA.
Robinson G.H., MagarW.Y. and Rai K.D. (1969) Soil properties in relation to cotton growth. In: Sidding and Hughes (1969) pp. 5-16.
Robson A.D. (1969) Soil factors affecting the distribution of annual Medicago species. J. Aust. Inst. Agric. Sci. 35, 154-167.
Roberts D.A. (1956) The wheat leaf phosphatases. I . A survey of the inhibitors atpH5.7 J. Biol. Chem. 219, 711-718.
Rogers C.H. (1943) Cotton seed treatment studies at the Black Land Experiment Station, Texas. Agric. Exp. Sta. Bull., 634.
Roma Bhargava and Sachar R.C . (1983) Chloramphenicol stimulates acid phosphatase activity in germinating cotton {Gossypium hirsutum L.) embryo. Biochem. J. 212, 73-77.
Rorison I .H. (1969) Ecological inferences from laboratory experiments on mineral nutrition. In: Ecological Aspects of the Mineral Nutrition oj Plants. I . H. Rorison. (ed ), pp. 155-176. Blackwell Sci. Pub. Oxford and Edinburgh.
Ross M.H., Ely J .O. and Archer J .G. (1951) Alkaline phosphatase activity and pH optima. Biochem. J. 192, 561-568.
Roux L . (1970) Le tripolyphosphate comme source de phosphore pour les plantes. Son hydrolyse rapide par les racinees de tomate cultivee sur solution nutritive. C.R Acad. Agric. Fr. 56, 946-960.

197
Russel R.S. and Martin R.P. (1953) A study of the absorption and utilization of phosphate by young barley plants. J. Exp. Bot. 4, 108-127.
Saleem M.T., Ahmad N. and Davide J .G. (1986) Fertilizers and their use in Pakistan. National Fertilizer Development Centre Planning and Development Division Govt of Pakistan, Islamabad p. 120.
Schjorring J .K. and Jensen P. (1984) Phosphorus nutrition of barley, buckwheat and rape seedlings. 1. Influence of seed-borne P and external P levels on growth, P content and P-fractionation in shoots and roots. Physiol. PI. 61, 577-583.
Sharpley A.N., and Reed L.W. (1982) Effect of environmental stress on the growth and amounts and forms of phosphorus in plants. Agron. J. 74, 19-22.
Shaykh M.M. and Roberts L.W. (1974) A histochemical study of phosphatases in root apical meristems. Ann. Bot. 38, 165-174.
Silberbush M. and Barber S.A. (1983) Sensitivity analysis of parameters used in simulating potassium uptake with mechanistic mathametical model. Plant and Soil 75, 851-854.
Silberbush M., Shomer-llan A. and Waisel Y . (1981) Root surface phosphatase activity in ecotypes of Aegilopsperegrina. Physiol. PI. 53, 501-504.
Siuda W. (1984) Phosphatases and their role in organic phosphorus transformation in natural waters. A review. Pol. Arch. Hydrobiol. 31, 207-233.
Sommer A . L . (1936) The relationship of the phosphate concentration solution cultures to the type and size of root system and the time of maturity of certain plants. J. Agr. Research 52, 133-148.
Sommer J.R. and Blum J .J . (1965) Cytochemical localization of acid phosphatases in Euglena gracilis. J. Cell Biol. 24, 235-251.
Smart M.M., Rada G.R., and Donnermeyer N.G. (1983) Determination of total nitrogen in sediments and plants using persulfate digestion. Water Res. 17, 1207-1211.
Spain J.M., Francis C.A., Howeler R.H. and Calvo F . (1975) Differential species and varietal tolerance to soil acidity in tropical crops and pastures. In: Soil Management in Tropical America, E. Bornemisza and A. Alvarado.(eds), pp. 308-329. Soil Sci. Dept., N. Carolina State University. Raleigh. N.C., U.S.A.

198
Spiers G.A. and McGill W.B. (1979) Effect of phosphorus addition and energy supply on acid phosphatase production activity in soils. Soil Biol. Bioch. 11, 3-8.
Stafford H.A. and Bravinder-Bree (1972) Peroxidase isozymes of the first internode of sorghum. Tissue and intracellular localization and multiple peaks of activity isolated by gel filtration chromotography. Plant Physiol. 49, 950-956.
Stelley M. and Morris H.D. (1953) Residual effect of phosphorus on cotton grown on cecil soil as determined with radioactive phosphorus. Soil Sci. Soc. Am. Proc. 17, 267-269.
Stephen D. (1969) Changes in yields and fertilizer responses with continous cropping in Uganda. Exp. Agric. 5, 263-269.
Strolher S. (1980) Homeostasis in germinating seeds. Ann. Bot. 45, 217-218.
Suomalainen H., Linko M. and Oura £ . (1960) Changes in the phosphatase activity of bakers yeast during the growth phase and the location of the phosphatases in the yeast cell. Biochim. Biophys. Acta 37, 482-490.
Suzuki T. and Sato S. (1973) Properties of acid phosphatase in the cell wall of tobacco cells cultured in vitro. Plant Cell Physiol. 14, 585-596
Szabo-Nagy A., Olah Z. and Erdei L . (1987) Phosphatase induction in roots of winter wheat during adaptation to phosphorus deficiency. Physiol. Plant. 70, 544-552
Tarafdar J .C . and Jungk A. (1987) Phosphatase activity in the rhizosphere and its relation to the depletion of soil organic phosphorus. Biol. Fertil. Soils 3, 199-204.
Tarafdar J .C . and Classen N. (1988) Organic phosphorus compounds as a phosphorus source for higher plants through the activity of phosphatases produced by the plant roots and micro-organisms. Biol. Fertil. Soils. 5, 308-312.
Tarafdar J .C. , Kiran B. and Rao A.V. (1989) Phosphatase activity and distribution of phosphorus in arid soil profiles under different land use patterns. J. Arid Environments 16, 26-34.
Tarafdar J C , and Chhonkar P.K. (1978) States of phosphatases in the root soil interface of leguminous and non-leguminous crops. Zutschrift fur Pflanzenernadehuruna und Bodenknde, 141, 347-351.

199
Thorp W.H. (1960) The Cotton Plant. USD A Agric. Handbook No. 178.
Thompson A C , Lane H C , Jones J W and Hesketh J D (1976) Nitrogen concentrations of cotton leaves, buds and bolls in relation to age and nitrogen fertilization. Agron. J. 68,617-621.
Tisdle S.L. and Nelson W.L. (1966) Soil Fertility and Fertilizers. Macmillan: London.
Torriani A. (1960) Influence of inorganic phosphate in the formation of phosphatases by Escherichia coli. Biochem. Biophys. Acta 38, 460-469.
Vanden Bergh J.P. (1969) Distribution of pasture plants in relation to chemical properties of the soil. In: Ecological Aspects of the Mineral Nutrition of Plants. I . H. Rorison (ed), pp. 11-24. Blackwell Sci. Pub., Oxford and Edinburgh.
Van Dijk W. (1943) La decouverte 1' heterostylie chez Primula pas Ch. de 1' Echuse et P. Reneaulme. Nederlandsch Kruidkundig Archief, 53, 81-85.
Walker P.G. and King E . J . (1950) Biochem J 47, 93
Watorek W., Morawiecka B. and Korczak B. (1977) Acid phosphatase of the yeast Rhodotorula rubra. Purification and properties of the enzymes. Acta Biochim. Pol. 25, 153-162.
Weimberg R. and Orton W.L. (1964) Evidence for an exocellular site for the acid phosphatase of Saccharomyces mellis. J. Bact. 88, 1743-1754.
Whitton B .A. (1967) Phosphate accumulation by colonies of Nostoc. Plant. Physiol., Tokyo 8, 293-296.
Whitton B .A. (1984) Algae as monitors of heavy metals in freshwaters. In: Algae as Ecological Indicators. Shubert L.E., (ed.) pp. 257-280. Academic Press, London.
Whitton B.A., Potts M., Simon J.W. and Grainger S.L.J . (1990) Phosphatase activity of the blue-green alga (cyanobacterium) Nostoc commune UTEX 584. Phycologia 29, 139-145.
Whitton B .A., Grainger S.L.J. , 11 aw ley G.R.W. and Simon J.W. (1991) Cell-bound and extracellular phosphatase activity of cyanobacterial isolates. Microb. Ecol. 21, 85-98.

200
Willett I.R. and BateyT. (1977) The effect of metal ions on the root surface phosphatase activity of grasses differing in tolerance to serpentine soil. Plant and Soil 48, 213-221.
Williams R .F. (1955) Redistribution of mineral elements during development. Ann. Rev. Plant Physiol. 6, 25-42.
Wilmott A.J. (1935) Discussion on the origin and relationships of the British Flora. Proc. Roy. Soc. B. 118, 197-241.
Woolhouse H.W. (1969) Differences in the properties of acid phosphatases of plant roots and their significance in the evolution of edaphic ecotypes. In: Ecological Aspects of the Mineral Nutrition of Plants. I .H. Rorison, (ed), pp. 357-380. Blackwell Scientific Oxford.and Edinburgh.
Wynne D. (1977) Alternation in activity of phosphatases during the Peridinium bloom in Lake Kinneret. Physiol. PI. 40,219-224.
Wynne D. (1981) The role of the phosphatase in the metabolism of Peridinium cinctum from Lake Kinneret. Hydrobiologia 83, 93-99.
Yamaoka T. T., Hayashi T and Sato S. (1969) Secretion of enzymes by plant cells cultred in vitro. J. Fac. Univ. Tokyo, Sect. 3, 10 117-127.
Yousef A.N. and Sprent J.I . (1983) Effect of NaCl on growth, nitrogen incorporation and chemical composition of inoculated and NH4N03 fertilized Vicia faba L. plants. J.Exp. Bot., 34, 941-950.
Zittle C.A. and Monica D. (1950) Arch Biochem 26, 112

201
A P P E N D I X A
The raw data for phosphatase assays carried out and reported in the body of this dissertation are included here. Appendix A indicates figure data for Chapter 4.
Fig 4.1 Influence of pH on PMEase activity (umol mg d. wt"* h"l) of cv Qalandri seedlings grown with and without phosphorus to the growth medium (n = 4, ± SD)
pH pNPP 4-MUP P + P - p + p
3.0 0 096 ± 0 004 0.051 ± 0.003 0.058 ± 0 001 0.035 ± 0 001 3.5 0 107 ± 0 001 0.056 ± 0.002 0.087 ± 0 001 0.046 ± 0 001 4.0 0 117± 0 003 0.057 ± 0.001 0.091 ± 0 001 0.051 ± 0 002 4.5 0 119 ± 0 014 0.060 ± 0.004 0.093 ± 0 002 0.057 ± 0 002 5.0 0 127 ± 0 003 0.066 ± 0.003 0.096 ± 0 002 0.058 ± 0 001 5.5 0 148 ± 0 004 0.080 ± 0.001 0.104 ± 0 002 0.068 ± 0 001 6.0 0 105 ± 0 003 0.060 ± 0.009 0.091 ± 0 002 0.051 ± 0 002 6.5 0 091 ± 0 003 0.031 ± 0.005 0.084 ± 0 001 0.035 ± 0 001 7.0 0 053 ± 0 001 0.019 ± 0.001 0.035 ± 0 001 0.023 ± 0 000 8.0 0 029 ± 0 004 0.008 ± 0.001 0.029 ± 0 001 0.005 ± 0 000 9.0 0 014 ± 0 001 0.004 ± 0.000 0.008 ± 0 000 0.003 ± 0 000
10.0 0 009 ± 0 001 0.003 ± 0.000 0.003 ± 0 000 0.001 ± 0 000
Fig.4.2 Effect of phosphate on PMEase activity (umol mg d. wt" 1 h - 1 ) of 12-day cv Qalandri grown with different P concentrations added to the growth medium pNPP & 4-MUP was used as substrates (n = 4, ± SD)
Concentration pNPP 4-MUP 1 g-1 0.108 ±0.001 0.086 ±0.001 2 g-1 0.085 ± 0.000 0.073 ± 0.001 3 g-1 0.076 ±0.001 0.064 ±0.001 4 g-1 0.064 ±0.000 0.056 ±0.001 5 g-1 0.059 ±0.000 0.051 ±0.001 7.5 g-1 0.028 ± 0.000 0.009 ± 0.000 10.0 g-1 0.006 ±0.000 0.001 ±0.000 Control 0.142 ±0.001 0.107 ±0.001

202
Fig 4.3 Influence of different concentrations of pNPP substrates on PMEase activity (umol mg d. wt~l h~*) of cv Qalandri seedlings grown without and with phosphorus added to the growth medium
Concentrations - P +_P 18 uM 0.078 ±0.005 0.029 ± 0.003 35 uM 0.101 ± 0.009 0.045 ± 0.003 53 uM 0.145±0.008 0.066±0.001 71 uM 0.162 ± 0.006 0.073 ± 0.001 177 uM 0.264 ±0.013 0.141 ±0.004 354 uM 0.490 ± 0.007 0.249 ± 0.003 532 uM 0.486 ± 0.003 0.247 ± 0.000 710 uM 0.485 ±0.026 0.247 ± 0.008
Fig 4.3 Influence of different concentrations of 4-MUP substrate on PMEase activity (umol mg d. wt~l h~l) of cv Qalandri seedlings grown without and with phosphorus added to the growth medium
Concentrations -P + P 0.5 uM 0.006 ± 0.000 0.003 ± 0.000 5.0 uM 0.010 ±0.001 0.006 ± 0.000 10.0 uM 0.026 ± 0.000 0.021 ±0.001 50.0 uM 0.071 ± 0.004 0.062 ± 0.004 100.0 uM 0.142 ±0.028 0.083 ± 0.009 250.0 uM 0.223 ± 0.003 0.166 ±0.026 500.0 uM 0.222 ± 0.023 0.192 ±0.013 750.0 uM 0.222 ± 0.002 0.186 ±0.031 1000.0 uM 0.221 ± 0.079 0.183 ±0.006
Fig 4.9 Influence of temperature on PMEase activity (umol mg d. wt" 1 h - 1 ) of cv Qalandri seedlings grown with and without phosphorus added to the growth medium (n = 4, ± SD)
Temperature pNPP 4-MUP -P ± P ±_P
25 0.129 ±0.001 0.096 ±0.003 0.087 ± 0.002 0.061 ± 0.003 35 0.137 ±0.001 0.111 ±0.001 0.132 ±0.003 0.096 ± 0.003 45 0.167±0.003 0.137±0.001 0.134±0.002 0.114±0.001 55 0.177 ±0.003 0.144 ±0.001 0.162 ±0.005 0.126 ±0.000 65 0.151 ±0.002 0.117± 0.002 0.144 ±0.005 0.110±0.001 75 0.133 ±0.002 0.104 ±0.003 0.127 ±0.002 0.096 ± 0.004
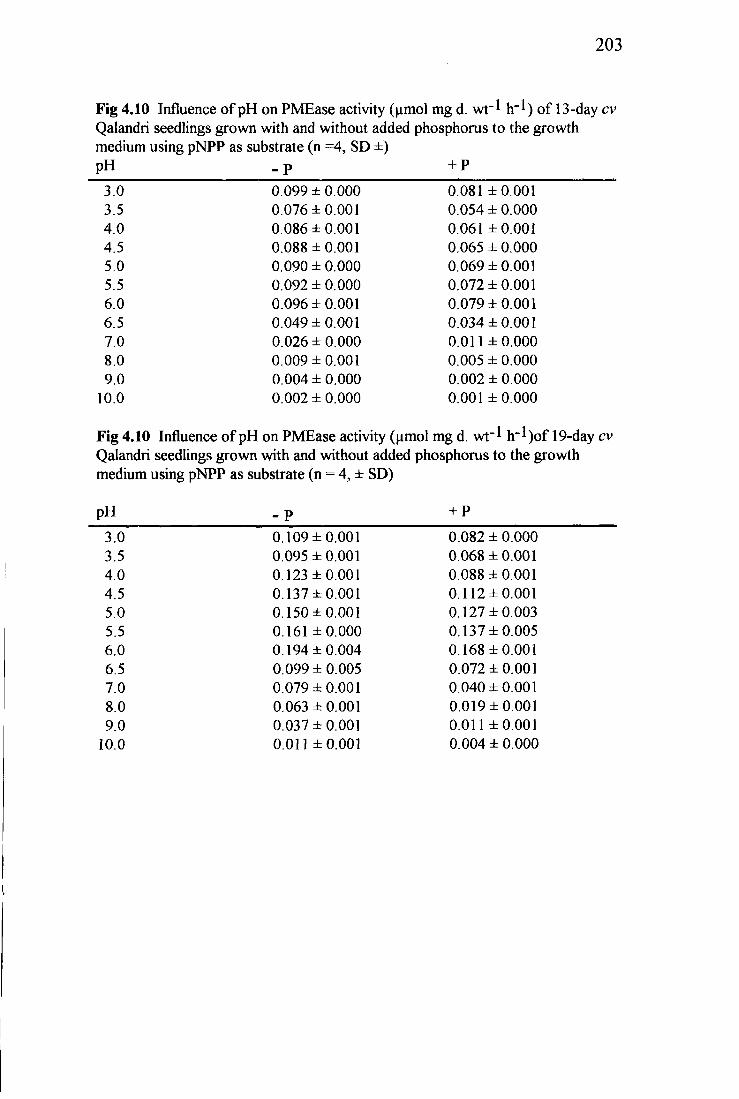
203
Fig 4.10 Influence of pH on PMEase activity (umol mg d. wt"^ h"*) of 13-day cv Qalandri seedlings grown with and without added phosphorus to the growth medium using pNPP as substrate (n =4, SD ±) pH - P + P
3.0 0.099 ±0.000 0.081 ±0.001 3.5 0.076 ±0.001 0.054 ± 0.000 4.0 0.086 ±0.001 0.061 ±0.001 4.5 0.088 ±0.001 0.065 ± 0.000 5.0 0.090 ±0.000 0.069 ± 0.001 5.5 0.092 ±0.000 0.072 ±0.001 6.0 0.096 ±0.001 0.079 ±0.001 6.5 0.049 ±0.001 0.034 ± 0.001 7.0 0.026 ± 0.000 0.011 ±0.000 8.0 0.009 ±0.001 0.005 ± 0.000 9.0 0.004 ± 0.000 0.002 ± 0.000
10.0 0.002 ± 0.000 0.001 ±0.000
Fig 4.10 Influence of pH on PMEase activity (umol mg d. wt" 1 h - 1 ) o f 19-day cv Qalandri seedlings grown with and without added phosphorus to the growth medium using pNPP as substrate (n = 4, ± SD)
pH - P + P
3.0 0.109 ±0.001 0.082 ± 0.000 3.5 0.095 ± 0.001 0.068 ± 0.001 4.0 0.123 ±0.001 0.088 ±0.001 4.5 0.137 ±0.001 0.112±0.001 5.0 0.150 ±0.001 0.127 ±0.003 5.5 0.161 ±0.000 0.137 ±0.005 6.0 0.194 ±0.004 0.168 ±0.001 6.5 0.099 ± 0.005 0.072 ± 0.001 7.0 0.079 ±0.001 0.040 ±0.001 8.0 0.063 ±0.001 0.019 ±0.001 9.0 0.037 ±0.001 0.011 ±0.001
10.0 0.011 ±0.001 0.004 ± 0.000

204
Fig 4.10 Influence of pH on PMEase activity (umol mg d. wt" 1 h _ 1 )o f 25-day cv Qalandri seedlings grown with and without added phosphorus to the growth medium using pNPP as substrate (n = 4, ± SD)
PH -P + P 3.0 0.071 ±0.000 0.051 ±0.001 3.5 0.049 ± 0.000 0.025 ± 0.001 4.0 0.077 ±0.001 0.053 ± 0.001 4.5 0.080 ± 0.000 0.058 ± 0.000 5.0 0.084 ± 0.000 0.061 ±0.000 5.5 0.085 ± 0.000 0.065 ± 0.001 6.0 0.090 ± 0.001 0.075 ± 0.001 6.5 0.046 ± 0.000 0.028 ±0.001 7.0 0.021 ± 0.001 0.010 ±0.000 8.0 0.007 ± 0.000 0.003 ± 0.000 9.0 0.003 ± 0.000 0.001 ± 0.000
10.0 0.001 ±0.000 0.001 ±0.000
Fig 4.11 Influence of pH on PMEase activity (umol mg d. wt" 1 h _ i ) of 13-day cv Qalandri seedlings grown with and without added phosphorus to the growth medium using 4-MUP as substrate (n = 4, ± SD)
pH -P + P 3.0 0.086 ±0.001 0.067 ± 0.002 3.5 0.075 ± 0.001 0.058 ± 0.001 4.0 0.072 ± 0.000 0.050 ±0.001 4.5 0.073 ± 0.001 0.042 ±0.001 5.0 0.076 ± 0.001 0.059 ±0.001 5.5 0.082 ±0.002 0.064 ±0.001 6.0 0.066 ± 0.002 0.055 ± 0.002 6.5 0.047 ± 0.002 0.031 ±0.001 7.0 0.032 ± 0.001 0.011 ±0.001 8.0 0.011 ±0.000 0.005 ± 0.000 9.0 0.003 ± 0.000 0.002 ± 0.000
10.0 0.001 ± 0.000 0.001 ±0.000

205
Fig 4.11 Influence of pH on PMEase activity (umol mg d. wt" ' h~l) of 19-day cv Qalandri seedlings grown with and without added phosphorus to the growth medium using 4-MUP as substrate (n = 4, ± SD)
pH -P + P 3.0 0.096 ± 0.001 0.080 ±0.001 3.5 0.085 ±0.001 0.069 ± 0.002 4.0 0.100 ±0.001 0.086 ±0.001 4.5 0.106 ±0.001 0.091 ±0.001 5.0 0.122 ±0.000 0.101 ±0.002 5.5 0.157 ±0.000 0.131 ±0.003 6.0 0.122 ±0.000 0.108 ±0.001 6.5 0.098 ±0.001 0.056 ±0.001 7.0 0.052 ±0.001 0.034 ±0.001 8.0 0.025 ± 0.001 0.012 ±0.000 9.0 0.009 ± 0.000 0.005 ± 0.000
10.0 0.003 ± 0.000 0.001 ± 0.000
Fig 4.11 Influence of pH on PMEase activity (umol mg d. wt" 1 h ' ^ o f 25-day cv Qalandri seedlings grown with and without added phosphorus to the growth medium using 4-MUP as substrate (n = 4, ± SD)
PH -P + p 3.0 0.057 ± 0.002 0.050 ± 0.000 3.5 0.043 ± 0.001 0.033 ± 0.001 4.0 0.062 ± 0.002 0.054 ±0.001 4.5 0.066 ± 0.000 0.058 ± 0.000 5.0 0.067 ±0.001 0.062 ±0.001 5.5 0.078 ± 0.000 0.068 ±0.001 6.0 0.063 ± 0.000 0.054 ±0.001 6.5 0.032 ±0.001 0.012 ±0.001 7.0 0.010 ±0.001 0.003 ± 0.000 8.0 0.003 ± 0.000 0.001 ±0.000 9.0 0.001 ±0.000 0.001 ±0.000
10.0 0.001 ±0.000 0.001 ±0.000

206
Fig 4.12 Influence of pH on PMEase activity (umol mg d. wt~l h~l)of cv Qalandri seedlings grown with and without added phosphorus to the growth medium, pNPP was used as the substrate (n = 4, ± SD)
pH -P +P
3.0 0.143 ±0.004 0.086 ±0.002 3.5 0.147 ±0.005 0.088 ± 0.003 4.0 0.159 ±0.010 0.097 ±0.001 4.5 0.166 ±0.012 0.126 ±0.005 5.0 0.185 ±0.011 0.133 ±0.006 5.5 0.216±0.006 0.152 ±0.011 6.0 0.192 ±0.008 0.133 ±0.005 6.5 0.128 ± 0.003 0.098 ± 0.002 7.0 0.044 ±0.001 0.036 ±0.001 8.0 0.032 ±0.003 0.015 ±0.003 9.0 0.015 ±0.001 0.007 ±0.000
10.0 0.009 ± 0.000 0.002 ±0.000
Fig 4.13 Influence of pH on PMEase activity (umol mg d. wt" 1 h" 1) of cv Qalandri seedlings grown with and without added phosphorus to the growth medium 4-MUP was used as the substrate (n = 4, ± SD)
pH -P +P
3.0 0.118 ±0.006 0.071 ±0.010 3.5 0.128 ±0.017 0.077 ±0.002 4.0 0.141 ±0.012 0.104 ±0.003 4.5 0.147 ±0.005 0.116 ±0.002 5.0 0.169 ±0.004 0.135 ±0.012 5.5 0.184 ±0.006 0.138 ±0.004 6.0 0.163 ±0.003 0.133 ±0.016 6.5 0.119 ±0.001 0.103 ±0.003 7.0 0.055 ±0.001 0.053 ±0.001 8.0 0.046 ±0.002 0.027 ±0.001 9.0 0.006 ±0.001 0.003 ±0.001
10.0 0.005 ±0.000 0.002 ±0.000

207
Fig 4.12 Influence of pH on PMEase activity (umol mg d. wt" 1 h" 1) of cv Rehmani seedlings grown with and without added phosphorus to the growth medium pNPP was used as the substrate (n = 4, ± SD)
pH -P +P
3.0 0.164 ±0.013 0.068 ±0.002 3.5 0.163 ±0.012 0.075 ±0.002 4.0 0.172 ±0.004 0.079 ±0.009 4.5 0.169 ±0.012 0.068 ±0.003 5.0 0.194 ±0.018 0.068 ±0.009 5.5 0.187 ±0.009 0.065 ± 0.003 6.0 0.267 ± 0.029 0.062 ± 0.004 6.5 0.117 ±0.005 0.042 ±0.003 7.0 0.084 ±0.012 0.041 ±0.001 8.0 0.084 ± 0.002 0.022 ± 0.002 9.0 0.082 ±0.010 0.022 ±0.002
10.0 0.063 ±0.012 0.012 ±0.006
Fige 4.13 Influence of pH on PMEase activity (umol mg d. wt"-1 h" ]) of cv Rehmani seedlings grown with and without added phosphorus to the growth medium 4-MUP was used as the substrate (n = 4, ± SD)
pH -P +P
3.0 0.092 ± 0.003 0.086 ± 0.005 3.5 0.098 ±0.011 0.086 ±0.002 4.0 0.106 ±0.019 0.099 ±0.004 4.5 0.108 ±0.028 0.066 ± 0.002 5.0 0.125 ±0.004 0.056 ±0.001 5.5 0.157 ±0.004 0.071 ± 0.001 6.0 0.149 ±0.017 0.082 ±0.011 6.5 0.085 ±0.004 0.058 ± 0.009 7.0 0.057 ± 0.007 0.032 ± 0.003 8.0 0.026 ±0.000 0.012 ±0.001 9.0 0.005 ± 0.001 0.002 ± 0.000
10.0 0.002 ±0.000 0.001 ±0.000

208
Fig 4.12 Influence of pH on PMEase activity (umol mg d. wW h~l) of cv Reshami seedlings grown with and without added phosphorus to the growth medium pNPP was used as the substrate (n = 4, ± SD)
pH -P +P
3.0 0.174 ±0.011 0.069 ± 0.009 3.5 0.181 ±0.008 0.074 ± 0.004 4.0 0.189 ±0.012 0.079 ± 0.009 4.5 0.245 ±0.018 0.099 ±0.011 5.0 0.223 ±0.011 0.101 ±0.007 5.5 0.204 ± 0.004 0.082 ± 0.005 6.0 0.203 ± 0.037 0.049 ± 0.006 6.5 0.183 ±0.027 0.048 ± 0.003 7.0 0.156 ±0.016 0.046 ± 0.007 8.0 0.154± 0.011 0.036 ± 0.005 9.0 0.096 ±0.010 0.023 ± 0.003
10.0 0.081 ±0.007 0.024 ± 0.007
Fig 4.13 Influence of pH on PMEase activity (umol mg d. wt" 1 h - 1 ) of cv Reshami seedlings grown with and without added phosphorus to the growth medium 4-MUP was used as the substrate (n = 4, ± SD)
pH -P +P
3.0 0.118±0.010 0.075 ± 0.004 3.5 0.110 ±0.002 0.065 ± 0.003 4.0 0.133 ±0.006 0.077 ±0.001 4.5 0.162 ±0.010 0.089 ± 0.006 5.0 0.171 ±0.011 0.071 ±0.009 5.5 0.162 ±0.008 0.074 ± 0.005 6.0 0.196 ±0.007 0.099 ± 0.008 6.5 0.107 ±0.004 0.048 ± 0.003 7.0 0.079 ± 0.006 0.038 ± 0.002 8.0 0.040 ±0.001 0.009 ± 0.000 9.0 0.005 ± 0.000 0.003 ± 0.000
10.0 0.003 ± 0.000 0.001 ±0.000

209
A P P E N D I X B Indicates the raw figure data for Chapter 5.
Fig.5.1 Influence of pH on PMEase activity (umol mg d. wt"l h~l) of cv Qalandri seedlings grown with and without nitrogen in the growth medium using pNPP as substrate (n = 4, ± SD)
pH -N +N
3.0 0.117±0.001 0.094 ±0.010 3.5 0.103 ±0.00 4 0.081 ±0.002 4.0 0.102 ±0.004 0.085 ± 0.003 4.5 0.105 ±0.002 0.087 ± 0.004 5.0 0.137 ±0.001 0.114 ±0.003 5.5 0.164 ±0.005 0.144 ±0.006 6.0 0.244 ±0.010 0.211 ±0.005 6.5 0.131 ±0.004 0.106 ±0.006 7.0 0.085 ± 0.00 3 0.048 ± 0.002 8.0 0.072 ± 0.001 0.041 ±0.001 9.0 0.049 ±0.001 0.030 ±0.001
10.0 0.023 ± 0.003 0.016 ±0.002
Fig.5.2 Influence of pH on PMEase activity (umol mg d. wt"1 h" *) of cv Qalandri seedlings grown with and without nitrogen combined in the growth medium using 4-MUP as substrate (n = 4, ± SD)
pH -N +N
3.0 0.063 ± 0.001 0.050 ±0.006 3.5 0.057 ± 0.003 0.040 ±0.001 4.0 0.067 ±0.001 0.044 ± 0.003 4.5 0.075 ± 0.000 0.045 ±0.001 5.0 0.093 ±0.011 0.063 ± 0.001 5.5 0.174 ±0.005 0.092 ± 0.006 6.0 0.113 ±0.004 0.069 ±0.003 6.5 0.083 ± 0.002 0.039 ± 0.002 7.0 0.065 ± 0.001 0.031 ±0.001 8.0 0.036 ± 0.003 0.016 ±0.001 9.0 0.026 ± 0.001 0.013 ±0.001
10.0 0.015 ±0.001 0.008 ± 0.000

210
Fig.5.3 Influence of pH on PMEase activity (\xmol tng d. wt" 1 h - 1 ) of cv Rehmani seedlings grown with and without nitrogen combined in the growth medium using pNPP as substrate (n = 4, ± SD)
pH -N +N
3.0 0.122 ±0.002 0.084 ± 0.002 3.5 0.113 ±0.006 0.076 ±0.001 4.0 0.134 ±0.004 0.196 ±0.008 4.5 0.138 ±0.005 0.119 ±0.004 5.0 0.226 ± 0.007 0.111 ±0.004 5.5 0.159 ±0.000 0.090 ±0.005 6.0 0.133 ±0.004 0.089 ± 0.002 6.5 0.104 ±0.004 0.081 ±0.003 7.0 0.088 ± 0.003 0.063 ± 0.007 8.0 0.069 ± 0.003 0.049 ±0.001 9.0 0.051 ±0.003 0.026 ±0.003
10.0 0.024 ±0.001 0.011 ±0.001
Fig.5.2 Influence of pH on PMEase activity (umol mg d. wt" 1 h"1) of cv Rehmani seedlings grown with and without nitrogen combined in the growth medium using 4-MUP as substrate (n = 4, ± SD)
PH -N +N
3.0 0.050 ±0.002 0.037 ±0.002 3.5 0.057 ±0.001 0.046 ± 0.002 4.0 0.068 ± 0.002 0.065 ± 0.002 4.5 0.069 ±0.001 0.047 ± 0.001 5.0 0.073 ± 0.002 0.042 ± 0.001 5.5 0.081 ± 0.002 0.036 ± 0.002 6.0 0.064 ± 0.001 0.033 ±0.001 6.5 0.046 ± 0.001 0.029 ±0.001 7.0 0.036 ±0.001 0.017 ±0.001 8.0 0.030 ±0.011 0.012 ±0.001 9.0 0.012 ±0.001 0.008 ± 0.000
10.0 0.005 ± 0.000 0.005 ± 0.000

211
Fig.S.l Influence of pH on PMEase activity (umol mg d. wt ' l h-*) of cv Reshami seedlings grown with and without nitrogen combined in the growth medium using pNPP as substrate (n = 4, ± SD)
pH -N +N
3.0 0.064 ± 0.002 0.077 ±0.001 3.5 0.088 ± 0.002 0.080 ±0.001 4.0 0.096 ± 0.004 0.081 ±0.001 4.5 0.102 ±0.002 0.083 ±0.001 5.0 0.116 ±0.001 0.091 ± 0.003 5.5 0.134 ±0.001 0.098 ±0.001 6.0 0.185 ±0.001 0.146 ±0.010 6.5 0.112 ±0.001 0.089 ± 0.002 7.0 0.065 ± 0.000 0.043 ± 0.002 8.0 0.051 ±0.001 0.033 ±0.001 9.0 0.032 ±0.001 0.023 ± 0.001
10.0 0.014 ±0.000 0.009 ± 0.000
Fig.5.2 Influence of pH on PMEase activity (umol mg d. wt" 1 h - 1 ) of cv Reshami seedlings grown with and without nitrogen combined in the growth medium using 4-MUP as substrate (n = 4, ± SD)
pH -N +N
3.0 0.045 ± 0.001 0.033 ±0.004 3.5 0.051 ±0.001 0.036 ± 0.002 4.0 0.057 ±0.004 0.040 ±0.001 4.5 0.067 ±0.001 0.053 ±0.010 5.0 0.087 ± 0.002 0.062 ±0.005 5.5 0.103 ±0.003 0.070 ± 0.004 6.0 0.052 ± 0.002 0.038 ± 0.003 6.5 0.045 ± 0.001 0.032 ± 0.002 7.0 0.038 ±0.001 0.027 ±0.001 8.0 0.030 ±0.001 0.015 ±0.002 9.0 0.024 ±0.001 0.012 ±0.002
10.0 0.017 ±0.001 0.008 ±0.001

212
A P P E N D I X C Indicates the raw figure data for Chapter 6.
Fig.6.1 Effect of NaCl on PMEase activity (umol mg d. wt"1 h"1) of cotton cv Qalandri seedlings grown with and without added phosphorus to the growth medium used pNPP substrate (n = 4, ± SD)
Concentrations - P + P 100 mM 0.088 ±0.013 0.044 ±0.601 — " 150 mM 0.065 ±0.001 0.065 ± 0.002 200 mM 0.069 ±0.001 0.075 ± 0.014 250 mM 0.160 ±0.003 0.122 ±0.001 Control 0.151 ±0.021 0.050±0.002 ANOVA F (df) F.Probability Concentrations 130.40 ** 0.001 Conditions 198.21 ** 0.001 Con x Condi 56.80 ** 0.001
Fig.6.2 Effect of NaCl on PMEase activity (umol mg d. wt" 1 h"1) of cotton cv Qalandri seedlings grown with and without added phosphorus to the growth medium used 4-MUP substrate (n = 4, ± SD) Concentrations -P + P 100 mM 0.064 ± 0.003 0.031 ±0.001 150 mM 0.047 ±0.001 0.048 ± 0.002 200 mM 0.056 ±0.001 0.058 ± 0.004 250 mM 0.136 ±0.004 0.090 ±0.010 Control 0.124 ±0.002 0.037 ±0.001 ANOVA F(df) F.Probability Concentrations 1014.08 (4) ** 0.001 Conditions 1739.44(1) ** 0.001 Con x Condi 432.54 (4) ** 0.001

o NO 00 -o ON ON 4^. 4^ © b b b b b b b
o o o o © © © o p p o o b b
to © ON
b 00
o NO ON 00
to to
*—» ~o
b 00 to
o
H- H- H- H- H- H- I f H- H- H- H- H-o o O o o o O o o O o o b o
© o
b o
b o >—*
b o to
© o
b o i—'
© o
© o
b o
b o
b o o
o o o o o © o p o o o o + b o
© © to oo
b b ON - J
i—i ON O
to 00
b NO
b 00 U J
b
NO
b -o u>
H- H- o hf H- w- H- H- H- H- H-o o b o o o o p o o o o © o o
b o
»
o to H-
b o
© o
b o to
b o to
b o
b o
b o u»
b o
o o o o o o o o o o o o b o ON
b b K> • ~ J
b
o
b
o
b 00 -o
b oo
b
NO
b
ON
b b to
b
o H- H- tt- H- H- H- H- H- H- H- tt-O o O o o o o o o o o o © o o
b o »—»
© o to
b o to
b o
© o to
b o
© o o
b o to
b o to
b o
b o
o o o o o o o o o o o o + © o u>
b
o
b
- j
b b 45-u>
b I—*
b
o
b 4^
b b
ON
b u>
b u>
H- H- H- H- H- H- H- H- H-o o o o O p o o o o o o © o o
© o
» b o »—*
b o
b o
© o
b o
b o o
b o
b o
b o to
b o to
o o o o o o o o o o o o •
© o
b o ON
b to O
b to to
b to
b to
©
o
b ON U »
©
o
b U J oo
b b u>
H- H- H- H- H- H- K- H- hf H- H- H-o O o O o o o o o o o o © o o
© o o
b o o
© o
© o
© o
© o
© o to
© o i—»
b o
b o o
b o o
o o o o o o o o o o o o + © o
b o -t̂
© b
NO
b to to
b to 4^
b
o ©
o
b to 00
b to ON
b to
b to o
H- H- K- H- H- H- H- H- H- H- H- H-O o o o o o o o o p o o © o o
b o
b o
b o o
b o to
b o to
b o to
b o
b o
b o
b o
b o o
T3 X
o o 3
s o
o
cr
o op
o co O s» 3 a- *a a . p 5 3 . Q- co
O §
f S , =r
6 | ^ tr
5 <*> 2 o 6 P C o
3 5-
? 3
cu 3 p OQ CO
11 sr
4^
H-
O
o
3 CO
a> o, ft" CO O •-+>
B: OQ
a CO CD n &
<g CO
o 3
3 9*. o' & co *-»• 3* ft)
3
"t f D
n 3" P T3 r-f-a •-i -o
o
3* O
&
i—> LO

o NO 00 ON ON 4i . 4^ '© b b b b b \j\ b b
o o o o © © © © O o © o b o 4^
b o NO
b tO
b
©
b NO 4^
»—•
-o 00 © -o
© NO 00
b -o -o
© NO t o
H- H- H- H- K- H- H- H- H- H-o o o o © © © © © © o © © o o
b o o
b o
© © lO
© ©
© o
b © t o
b ©
b © t o
b o t o
© ©
© © t o
o o O © o © © © o © © o b o
b o
b ©
-O
b
4^
b NO
t o b NO
b NO o
b 00
b ON
b
H- H- H- H- H- H- H- H- H- H- H- H-o o o © © o o © o © © © b o
b o o
b o o
b o
b o o
b ©
b o t o
b ©
b © t o
b ©
b o ©
© ©
o o o © © © © o © © © © © o t o
b o NO
b
NO
b t o
© t o 00
b b
4*.
© ON O
b 4^
b 4^ o
b
- j
b
4^ H- H- H- H- H- H- H- H- H-o O © © © o © © © © o © b o
b o
© © t o
b o
© © t o
b © o
o © ©
o ©
b o
© o 42>
b © t o
b © t o
o o © © o © © © © © o © © o 4^
b o
© b
ON
© t o t o
b t o 00
©
t o
b
o
© 4*. ©
b
ON
b © t o 00
H- H- H- H- H- H- H- H- H- H- H- H-o o © © © © © © © © © © b o o
b o o
b o
b © ©
b ©
b o ©
o © o
b © t o
b o i—i
© o
b © ©
b ©
o o o © o © © o © © o o b o t o
b o
© ©
b o 00
b t—* t o
b
-o.
b t o
b t o -o
b 4^ NO
b
ON
b b t o -o
H- H- H- H- hf H- H- H- H- 14-o o © © o © o © © o o o b o o
b o o
b o
b o ©
b o o
b ©
b © t o
b ©
b o t o
b © t o
b ©
b ©
o o © © © © © © © o © © b o 1—I
b o t o
© ©
© © 4*.
© © ON
b o NO
b b
O
b
o
b t o ON
b t o
b »—• NO
H- H- H- H- H- H- H- H- H- H-o o © © © o © © © © © o b o o
b o
b o
b ©
b ©
b © >—*
'© ©
b © o
b ©
o ©
b o
b © t o
o 3
+
+ 13
^ o
+
0) n a . »—' • 3
OQ OQ >-i O
3
3" O
& SB 3 a* 1 3*
to