durham e-theses an analysis of the determinants of total
TRANSCRIPT

Durham E-Theses
An Analysis of the Determinants of Total Factor
Productivity in China
TOCCO, CLAUDIO
How to cite:
TOCCO, CLAUDIO (2015) An Analysis of the Determinants of Total Factor Productivity in China,Durham theses, Durham University. Available at Durham E-Theses Online:http://etheses.dur.ac.uk/11361/
Use policy
The full-text may be used and/or reproduced, and given to third parties in any format or medium, without prior permission orcharge, for personal research or study, educational, or not-for-pro�t purposes provided that:
• a full bibliographic reference is made to the original source
• a link is made to the metadata record in Durham E-Theses
• the full-text is not changed in any way
The full-text must not be sold in any format or medium without the formal permission of the copyright holders.
Please consult the full Durham E-Theses policy for further details.

Academic Support O�ce, Durham University, University O�ce, Old Elvet, Durham DH1 3HPe-mail: [email protected] Tel: +44 0191 334 6107
http://etheses.dur.ac.uk
2

AN ANALYSIS OF THE DETERMINANTS OF TOTAL FACTOR PRODUCTIVITY
IN CHINA
by
Claudio Tocco
Doctor of Philosophy in Economics
Durham University Business School
Durham University
December 2015
Abstract
In this study, I analyse total factor productivity (TFP) and its determinants in Chinese
industrial firms. The results from the system-GMM estimation indicate the existence of
increasing returns to scale and a positive impact on firms’ TFP arising from technological
change. Moreover, the following factors were found to be determinants of higher TFP levels
in most industries: lack of political affiliation, paid-in capital share owned by investors other
than the State, Marshallian and Jacobian spillovers, age, marketing capabilities, internal
liquidity and industrial competition. The results from the TFP growth decomposition indicate
an annual average TFP growth of 9.68% across Chinese industrial firms during the period of
1998-2007. This was largely determined by the reallocation of resources across existing
firms. From a policymaking perspective, measures targeting the previously mentioned
determinants are likely to spur firms’ TFP and consequently drive national long-run
economic growth.

2
1. INTRODUCTION ..................................................................................................................... 7
2. TOTAL FACTOR PRODUCTIVITY ............................................................................................. 12
2.1. AN INTRODUCTION TO TOTAL FACTOR PRODUCTIVITY ....................................................................... 12
2.2. A DISCUSSION OF THE IMPORTANCE OF TFP .................................................................................... 14
2.3. A REVIEW OF THE MAIN TFP MEASUREMENT METHODS................................................................... 15
2.3.1. Ordinary Least Squares (OLS) ........................................................................................... 16
2.3.2. Fixed Effects (FE) .............................................................................................................. 19
2.3.3. Instrumental Variables (IV) .............................................................................................. 20
2.3.4. Generalised Method of Moments (GMM) and SYS-GMM ............................................... 23
2.3.5. Olley and Pakes’ (1996) Semi-parametric Estimation ...................................................... 26
2.3.6. Levinsohn and Petrin’s (2003) Semiparametric Estimation ............................................. 28
2.3.7. Choosing the Right TFP Estimator .................................................................................... 33
2.4. A REVIEW OF THE DETERMINANTS OF TFP ...................................................................................... 34
2.4.1. Internal and External Knowledge ..................................................................................... 34
2.4.2. Political Affiliation ............................................................................................................ 43
2.4.3. Foreign Direct Investment ................................................................................................ 46
2.4.4. Economies of Scale ........................................................................................................... 59
2.4.5. Competition ...................................................................................................................... 63
2.4.6. Spatial Spillovers .............................................................................................................. 68
2.4.7. City Location ..................................................................................................................... 74
2.4.8. Export Activities ............................................................................................................... 77
2.4.9. Managerial Ability ............................................................................................................ 85
2.4.10. Marketing Capabilities ................................................................................................... 89
2.4.11. Other Studies.................................................................................................................. 91
2.4.12. Studies Analysing Multiple Determinants ...................................................................... 92
2.4.13. The Contribution of this Study ....................................................................................... 95
3. AN ANALYSIS OF THE DETERMINANTS OF TFP LEVELS ............................................................. 97
3.1. DATASET .................................................................................................................................... 98
3.2. SYSTEM-GMM ESTIMATION ......................................................................................................... 99
3.3. TWO-SAMPLE KOLMOGOROV-SMIRNOV (KS) TEST ......................................................................... 103
3.4. VARIABLES, DESCRIPTIVE STATISTICS AND HYPOTHESES ................................................................... 104
3.4.1. Ownership ...................................................................................................................... 105
3.4.2. Political Affiliation .......................................................................................................... 106
3.4.3. Exporting ........................................................................................................................ 107
3.4.4. Competition .................................................................................................................... 107
3.4.5. Marshallian (or MAR) Spillovers .................................................................................... 108
3.4.6. Jacobian Spillovers ......................................................................................................... 108
3.4.7. City Location Spillovers................................................................................................... 109
3.4.8. Liquidity .......................................................................................................................... 109
3.4.9. Age ................................................................................................................................. 110
3.4.10. R&D Spending as a Source of Knowledge .................................................................... 111
3.4.11. Time Trend or Hicks-neutral Technical Change............................................................ 111
3.4.12. Marketing Capabilities ................................................................................................. 112
3.5. RESULTS OF THE SYS-GMM ESTIMATION ..................................................................................... 114
3
3.6. RESULTS OF THE SEMIPARAMETRIC ESTIMATION ............................................................................. 127
3.7. RELATIVE IMPORTANCE OF TFP DETERMINANTS ............................................................................. 137
3.8. RESULTS OF THE KS TESTING ....................................................................................................... 139
4. AN ANALYSIS OF THE DETERMINANTS OF TFP GROWTH ...................................................... 152
4.1. HALTIWANGER’S (1997) DECOMPOSITION .................................................................................... 152
4.1.1. Results of the Haltiwanger (1997) Decomposition ........................................................ 155
4.1.2. Results for Industry, Province and Political Affiliation/Ownership Decompositions ...... 157
4.2. MELITZ AND POLANEC (2012) DECOMPOSITION ............................................................................ 162
4.2.1. Results of the Melitz and Polanec (2012) Decomposition. ............................................. 164
4.2.2. Results for Industry Sub-sectors, Provinces and Ownership/Political Affiliation ........... 166
5. CONCLUSION AND POLICY IMPLICATIONS ........................................................................... 171
6. REFERENCES ...................................................................................................................... 177
7. APPENDIX .......................................................................................................................... 209

4
Statement of Copyright
The copyright of this thesis rests with the author. No quotation from it should be published
without the author's prior written consent and information derived from it should be
acknowledged.

5
Acknowledgements
I am deeply indebted to Prof Richard Harris and Dr Rebecca Stratling for their guidance in
writing this dissertation. The conversations I had with them have been a valuable source of
inspiration and insight into this topic.

6
Dedication
This thesis is dedicated to my parents, Giancarlo and Luciana, and my brother Michele.

7
1. Introduction
Total factor productivity (TFP) growth refers to growth in output that is not attributable to
factor inputs. This can be further decomposed into efficiency increases and technological
changes. TFP is important because it generates benefits, both within a firm and beyond.
Firstly, from the firm’s perspective, TFP growth enables the firm to become more
competitive and to increase people’s living standards. Beckman and Buzzell (1958) describe
a connection between productivity and living standards delivered through the wage and price
channels. On the one hand, a more productive firm can afford to pay higher wages to its
workers, hence increasing the employees’ living standards through increased consumption
ability. At the same time, productivity can lower the firm’s output prices or allow the firm to
provide greater value to consumers at a given price, hence increasing their products’ utility.
Secondly, TFP growth also generates benefits that go beyond the firm, as suggested by the
following quote: “In the long run, living standards depend on the efficiency with which our
economic resources are utilized” (Beckman and Buzzell, 1958, p. 26). At the national level,
TFP plays a major role in raising living standards and spurring economic growth. Besides the
accumulation of factor inputs, TFP is the main driver behind differences in long-run within-
and cross-country economic growth. This has been suggested by the empirical results of
Easterly and Levine (2001), Klenow and Rodriguez-Clare (1997), and Benhabib and Spiegel
(1994).
Analysing TFP and its determinants enables the understanding of which factors policymakers
should target in order to achieve TFP growth, leading to long-run national economic growth
and higher living standards for citizens. “In models that emphasize TFP growth, national
policies that enhance the efficiency of capital and labour or alter the endogenous rate of
technological change, can boost productivity growth and thereby accelerate long-run
economic growth” (Easterly and Levine, 2001, p. 180). This quote indicates that sustainable,
long-run economic growth can be achieved through national policies aimed at efficiency
improvements and technological upgrades, the sub-components of TFP. Macro-level analyses
of TFP, such as the ones mentioned above, are particularly important in cross-country studies.
Despite this importance, such analyses often ignore the fact that firms are heterogeneous in
many respects, TFP being one of them.
A micro-level analysis of TFP, on the other hand, would enable to infer what determines TFP
levels and growth rates across firms, thus providing information on how policymakers and
firm managers can target such determinants to improve TFP. Since they are more targeted,
micro-level measures are more likely to lead to more successful results than macro-level

8
ones, which would tend to adopt a “one size fits all” approach. Thus, the use of micro-level
measures would potentially contribute to more competitive firms, the raising of citizens’
living standards and sustainable long-run economic growth.
The Chinese economy is an important area of study, as its performance has been relatively
strong over the last three decades. Firstly, figures from the Chinese Statistical Yearbook
(2012), expressed in constant prices, report an average annual output growth rate of about 9%
since 1978, while IMF (2013) figures suggest a global output growth of about 3% since 1980.
Secondly, according to World Bank figures (World Bank, 2013), China has become the
second largest contributor, after the United States, to global economic output, contributing
with a 14.25% share as of 2012. Thirdly, the country constitutes an exceptional case in terms
of its slow and gradual reform path undertaken as it has moved from a socially planned
economic system to a market-oriented one.
The achievement of strong economic growth in China has resulted in an improvement in
living standards for its citizens. According to figures from the World Bank (2013), real GDP
per capita has increased from $523.95 in 1980 to $7,957.62 in 2012, representing a 15-fold
increase. However, the gap between China and the high-income countries remains high, as
these record an average real GDP per capita of $32,166 as of 2012. According to the World
Bank (2013), China is still classified as an upper-middle income country, since its income per
capita lies within the $4,086 to $12,615 band. The move to a high-income country status
could be achieved by adopting national policies aimed at raising TFP.
Considering the importance of TFP for the Chinese economy, the study conducted in this
thesis aims to answer the following research questions:
- What factors determine TFP levels and TFP growth in Chinese industrial firms during
the period of 1998-2007?
- How does TFP growth differ across firms differentiated by industry, province and
ownership/political affiliation?
The study therefore belongs to the literature analysing TFP and its determinants in China at
the firm level. There are four important studies on this topic (Yao et al., 2007; Li et al., 2010;
Brandt et al., 2012; Shen and Song, 2013) that are similar to this one, as they analyse multiple
determinants of productivity. However, the current study differs from these in four respects.
Firstly, compared to most existing studies, this study adopts a more comprehensive set of
TFP level determinants in the estimation. The following determinants are included: political
affiliation, ownership, exporting activity, competition, Marshallian (or MAR) spillovers,
Jacobian (or Jacob) spillovers, city spillovers, liquidity, firm age, R&D, time trend, and
9
marketing capabilities. The inclusion of such variables is important because omitting them
would generate biased estimates of the production function, and of TFP as a result. The
choice of determinants is also motivated by the empirical results from the literature and the
information available in the Chinese National Bureau of Statistics (NBS) dataset from which
the sample is sourced. A more detailed discussion of the motivation for their inclusion, their
measurement and their expected effects on TFP is presented in Section 3.3.
Secondly, the set of industries analysed from the sample taken from the Chinese NBS is
wider than in most existing studies, as it includes 26 industries belonging to the mining,
manufacturing and public utilities sectors. This allows for differences in technology between
firms, avoiding the assumption that all firms operate using a standard technology. The sample
adopted in this study includes both State-owned and non-State-owned firms with at least
RMB 5mn in annual sales. Firms are located in 31 provinces, or province-equivalent
municipal cities. This unbalanced sample comprises 2,183,709 firm-year observations,
corresponding to a wide number of firms ranging from 148,474 in 1998 to 331,453 in 2007.
Thirdly, while most existing studies have relied on the semiparametric methodologies of
Olley and Pakes (1996) or Levinsohn and Petrin (2003) to analyse the determinants of TFP
levels, this study adopts SYS-GMM. The major advantage of this methodology, in
comparison with the previously mentioned semiparametric ones, is the allowance for firms’
fixed effects. Previous studies have indicated that firms have unmeasured productivity
advantages that remain constant over time and that need to be captured. Moreover, SYS-
GMM has the advantage of tackling endogeneity in the right-hand-side variables (including
the lagged dependent variable) as well as selection bias by using lagged values of the
endogenous variables as instruments in the first differences equation and first-differences of
the same variables as instruments in the levels equation (Blundell and Bond, 1998). SYS-
GMM is particularly preferable over the semiparametric methodologies of Olley and Pakes
(1996) and Levinsohn and Petrin (2003) because the latter do not allow for fixed effects and
are based on strong and unintuitive assumptions that generate collinearity problems in the
first stage of estimation (Ackerberg et al., 2006).
Fourthly, compared to most existing studies, this study analyses the determinants of TFP
growth by using the Haltiwanger (1997) decomposition approach. Such an approach
decomposes aggregate TFP growth into the contributions provided by the following: a
within-firm component representing the impact of the resource reallocation within existing
firms, according to their initial shares of output in their related industries; a between-firm
component indicating a change in the output share of firms, weighted by the deviation of the
10
firm’s initial productivity from the initial industry index; a covariance component, measuring
whether a firm’s increasing productivity corresponds to an increasing market share; an
entering component indicating the contribution of entrant firms to their related industry’s TFP
growth, measured with respect to the initial industry index; an exiting component indicating
the contribution of exiting firms to their related industry’s TFP, measured with respect to the
initial industry index. Since Melitz and Polanec (2012) find this decomposition to be
characterized by biases, their methodology is also adopted in order to understand which set of
results is the most appropriate.
This study has been built by taking these four distinctions into account, which distinguishes it
from existing studies on firm-level TFP estimation in China.
The results of the SYS-GMM estimation indicate the existence of increasing returns to scale
in most industries, suggesting that firms produce a higher proportion of output from a given
proportion of factor inputs. Moreover there is a positive impact on firms’ TFP arising from
technological change. In terms of political affiliation/ownership, a lack of politically
affiliation with any level of government and a lack of State paid-in capital ownership share
positively affect TFP. Such factors are likely to enable the firms to undertake decisions aimed
at maximising TFP rather than satisfying political motives. Regarding spatial variables, there
is evidence of positive effects on TFP from both Marshallian and Jacobian spillovers. Despite
such benefits, TFP tends to be hampered by the high costs incurred when firms are based in
large urban areas. In terms of knowledge variables, the results indicate that younger firms
tend to be more productive than their older counterparts, suggesting that the former are likely
to be more dynamic and to use the latest technology available. Moreover, in contrast with the
initial expectations, R&D expenditures do not seem to lead to higher TFP levels. Likewise,
export activity does not seem to lead to higher TFP in most industries, suggesting that most
exporting firms are engaged in processing trade activities. As initially expected, industrial
competition is found to result in higher TFP, as it pushes firms’ managers to increase their
efforts and to reduce slack. Firms’ marketing capabilities are also found to be beneficial to
TFP, indicating that firms are able to differentiate products from their competitors and build
successful brands. The positive relationship between firms’ liquidity and their TFP indicates
that Chinese firms are financially constrained and that they must rely on their internal
liquidity to undertake productive investment activities.
Results obtained using the SYS-GMM estimation are found to be more valid than results
from the semiparametric estimation following Levinsohn and Petrin (2003), since the latter
are characterized by inconsistencies in some relationships (e.g. in the case of political

11
affiliation), low coefficients on both the capital and labour inputs, and the indication of
decreasing returns to scale in most industries, which are unlikely for the dynamic and fast
growing Chinese economy.
The analysis of the relative importance of the determinants of TFP levels indicates that
exogenous technological improvements have the largest positive effect on firms’ TFP levels.
The effect of an increasing proportion of firms’ paid-in capital owned by either individuals or
corporates is also found to be large. In contrast, large negative effects on TFP levels are
found for an increasing proportion of firms’ paid-in capital owned by the State, and firms’
high level of political affiliation with either the central or local government. This indicates
that State influence on firms, through either ownership of paid-in capital or political
affiliation, is not conducive to higher TFP. In addition, the large negative effect for the
variable representing city spillovers indicates that the advantages that firms enjoy from being
based in cities are outweighed by the disadvantages.
The results from the Kolmogorov-Smirnov tests and the related cumulative empirical TFP
distributions are in line with the SYS-GMM results, since they indicate that TFP distribution
differs across firms with different political affiliations, paid-in capital share ownership, R&D
and export activities. These also emphasize the importance of estimating TFP separately for
each industry and taking into account geographical differences. Moreover, they point to the
existence of TFP growth between 1998 and 2007.
Chinese firms have recorded an annual average TFP growth of 9.68%, based on the
Haltiwanger (1997) and the Melitz and Polanec (2012) decompositions. The former
decomposition indicates that such growth is mainly due to the net entry of more productive
firms, in line with the findings of Brandt et al. (2012). The latter decomposition, which is
more appropriate because it addresses the measurement biases included in the former,
indicates that TFP growth largely results from a between-firm effect representing the
reallocation of resources through the contraction and expansion of output shares between
firms characterized by different productivity levels.
The structure of the paper is as follows. Chapter 2 covers total factor productivity. The first
section discusses what TFP is and its importance. The second section reviews the main
methods for measuring TFP at the firm level. The third section discusses the determinants of
TFP and reviews the related studies in the literature. The fourth section discusses how the
current study contributes to the literature.

12
Chapter 3 analyses the determinants of TFP levels in the Chinese industrial sector. The first
section presents the dataset utilized. The second section introduces the SYS-GMM
methodology for analysing TFP levels, and briefly mentions the Levinsohn and Petrin
semiparametric methodology. The third section introduces the Kolmogorov-Smirnov
methodology for testing the equality of empirical cumulative TFP distributions across firms.
The fourth section explains the variables utilised, discusses the related descriptive statistics,
and formulates the hypotheses underlying the estimation of TFP levels. The fifth section
discusses the results from the SYS-GMM estimation. This is followed in the sixth section by
a discussion of the results from the semiparametric estimation following Levinsohn and
Petrin (2003). In the seventh section, an analysis of the relative importance of determinants of
TFP is conducted. Finally, the results of the Kolmogorov-Smirnov test are discussed.
Chapter 4 analyses the determinants of TFP growth across firms in the Chinese industrial
sector. The first section introduces the methodology developed by Haltiwanger (1997), which
decomposes TFP growth, and discusses the related results. Since Melitz and Polanec (2012)
find that Haltiwanger’s (1997) methodology generates biases that lead to over-measurement
of the contribution of entering and exiting firms to aggregate TFP growth, their methodology
is introduced in the second section. This is followed by a discussion of the related results.
Chapter 5 concludes the thesis by summarizing the findings and discussing the related policy
implications.
2. Total Factor Productivity
The previous chapter introduced the thesis. This chapter discusses total factor productivity
and its importance, followed by a discussion of the main TFP measurement methods and its
determinants.
2.1. An Introduction to Total Factor Productivity
In a firm’s production process, factor inputs, such as labour and capital, are used in order to
produce output. In other words: “The production function describes the technical relationship
between the inputs and outputs of a production process” (Coelli et al., 1998, p. 12). A typical
production function can be represented by the following equation:
𝑌𝑖𝑡 = 𝐴𝑖𝑡 𝑓(𝐿𝑖𝑡, 𝐶𝑖𝑡, ) (1)

13
In (1), 𝑌𝑖𝑡 is the output of firm 𝑖 at time 𝑡, 𝐿𝑖𝑡 is the labour input, and 𝐶𝑖𝑡 is the capital input.
𝐴𝑖𝑡 is the level of output not attributable to factor inputs, also known as total factor
productivity (TFP), which can also be represented as an index:
𝑇𝐹𝑃𝑖𝑡 ≡ 𝐴𝑖𝑡 =𝑌𝑖𝑡
𝑓(𝐿𝑖𝑡, 𝐶𝑖𝑡, ) (2)
TFP, as expressed in (2), is the ratio of output produced to inputs utilised in the production
process. Graphically, a production function can be represented by an isoquant. Nishimizu and
Page (1982) decomposed the TFP change into technological change and technical efficiency
change. Taking the best production function frontier, which is the maximum output attainable
based on a given level of input, technological change represents the shift in the best frontier
resulting from technological progress. A change in technical efficiency, on the other hand,
represents the effect of actions undertaken by the firm, such as an improvement in managerial
practices in order to “catch up” with industry best practices. Firms having a relatively high
TFP will produce higher amounts of output with the same set of inputs than firms with a
relatively low TFP.
TFP represents the most suitable definition for productivity, compared to, for example, partial
factor productivity. The latter is given by the ratio of output to a specific factor input such as
labour, capital, or intermediate materials. The most used among partial factor productivity
indices has been labour productivity. This is because it has a prominent position in
organisational debates between labour unions and management concerning changes in
employment conditions like wage increases. Stigler (1947) argues that attributing changes in
output to just one input is likely to lead to a limited understanding of productivity and a
consequent misuse of economic resources. Productivity within a firm is determined by a
combination of more than one input and the interactions between them. In addition, a partial
factor productivity index can be affected by the intensity of input use. For example, two
similar firms adopting the same production processes and the same technology may record
different labour productivities if one of them uses its capital input more intensively.
Therefore, considering the limitations of the partial factor productivity measure, productivity
can be better expressed by a broader definition that encompasses all inputs and outputs
involved in the production process. Moreover, such a definition is not affected by the usage
intensity of factor inputs (e.g. capital), which is ignored in a partial productivity measure such
as labour productivity. TFP, also referred to as multi-factor productivity, is given by the ratio
of gross firm output to all inputs adopted in the production process. This is because “only by

14
relating output to all tangible inputs can it be determined whether there has been a net saving
in real costs per unit of output, or conversely, a gain in productivity” (Kendrick, 1956, p. 2).
TFP is the most suitable definition of productivity for this study, as it can be used to analyse
firms that combine various different inputs to produce a certain amount of output. In this
thesis, when the terms “productivity” and “TFP” are used, they refer interchangeably to total
factor productivity.
2.2. A Discussion of the Importance of TFP
Having analysed what productivity is, the next step is to understand its importance.
Productivity is a widely discussed concept, not only in the academic literature but also among
political leaders, trade unions and industry leaders. In other words, “productivity isn’t
everything, but in the long run is almost everything” (Krugman, 1997, p.9). This is because
increased productivity generates benefits for firms, individuals and, consequently, the overall
economy. It can also be said “it is only in the long term that productivity growth makes a
large difference to the welfare of a country, and it is only in the long term that the rate of
productivity growth is subject to fundamental change” (Wolff, 2014, p.12). Within a firm, an
increase in TFP generates a higher level of output based on a given level of input. Therefore,
it allows a firm to achieve better economic performance by reducing unit costs. As a
consequence, the firm becomes more competitive. This idea suggests that increased
productivity leads to better firm performance. In addition, productivity has benefits that go
beyond the firm. For example, “in the long run, living standards depend on the efficiency
with which our economic resources are utilized” (Beckman and Buzzell, 1958, p. 26).
Beckman and Buzzell (1958) suggest a connection between productivity and living standards
that is delivered through the wage and price channels. A more productive firm is likely to pay
its employees better wages in order to reward them for their performance, thus enabling the
employees to increase their living standards by spending more. Concerning the price channel,
a more productive firm can lower the prices of its products, making the products more
affordable to consumers. The consumers can thus receive higher utility by consuming more.
Therefore, higher productivity is a key factor in improving levels of consumption and, hence,
standards of living. In addition, productivity is not only related to better firm performance
and living standards, but also to overall benefits to the public. “At the national level,
productivity growth has been of paramount importance in raising levels of living, in
strengthening potential national security, and in the provision for future economic growth”
(Kendrick, 1956, p. 1). When it is more productive, a firm has a greater ability to compete

15
internationally, leading to increased exports. The earnings obtained by selling products both
locally and internationally are likely to be reinvested or paid out to shareholders. In summary,
higher TFP leads to a combination of higher exports, investments and consumption, which
are likely to generate a positive effect on a country’s national income and living standards.
2.3. A Review of the Main TFP Measurement Methods
In the first section of this chapter, TFP was defined within the context of a production
function, explaining the relationship between output and factor inputs in a firm’s production
process. TFP was expressed as the level of output produced based on a given level of factor
inputs. The second section discussed the importance of TFP, not only as a measure of a firm’s
economic performance but also for national living standards and the nation’s economic
growth and prosperity. This section describes how TFP is measured.
Methods for measuring TFP can be categorised into macro-level and micro-level methods.
Macro-level methodologies measure aggregates that relate to country-, region- or industry-
level productivity. Micro-level methodologies, in contrast, measure firm- or plant-level
productivity. While it is not in the scope of this analysis to review all methodologies for
micro-level productivity measurement in depth, Van Beveren (2012) and Del Gatto et al.
(2011) have provided comprehensive surveys of such methodologies. For the set of micro
panel data that will be adopted in this work, macro methodologies are not suitable. This is
because in a macro-level analysis, an economy is viewed as being constituted by only one
aggregate sector. However, such is not the case in an economy that can be disentangled into
different sectors, which can then be decomposed further into firms. Each firm is characterised
by different characteristics, such as different production processes, outputs, inputs, and TFP.
Therefore, macro-level analyses of production functions do not take into account the
heterogeneity existing across firms. Micro-level methodologies, on the other hand, analyse
TFP differences among firms having different characteristics. This enables us to understand
what determines this heterogeneity and, therefore, how productivity can be improved through
targeted microeconomic policy measures that are likely to be more successful than their
macro-level counterparts. Among the micro-level measures of TFP, the first presented in this
section is ordinary least squares (OLS). The description of OLS is accompanied by a
discussion of the main methodological issues arising in TFP estimation. This is followed by a
review of the main methodologies aimed at addressing the endogeneity issue: fixed effects
(FE), instrumental variables (IV), generalised method of moments (GMM) and system-GMM
16
(SYS-GMM), as well as the semi-parametric estimations developed by Olley and Pakes
(1996) and Levinsohn and Petrin (2003).
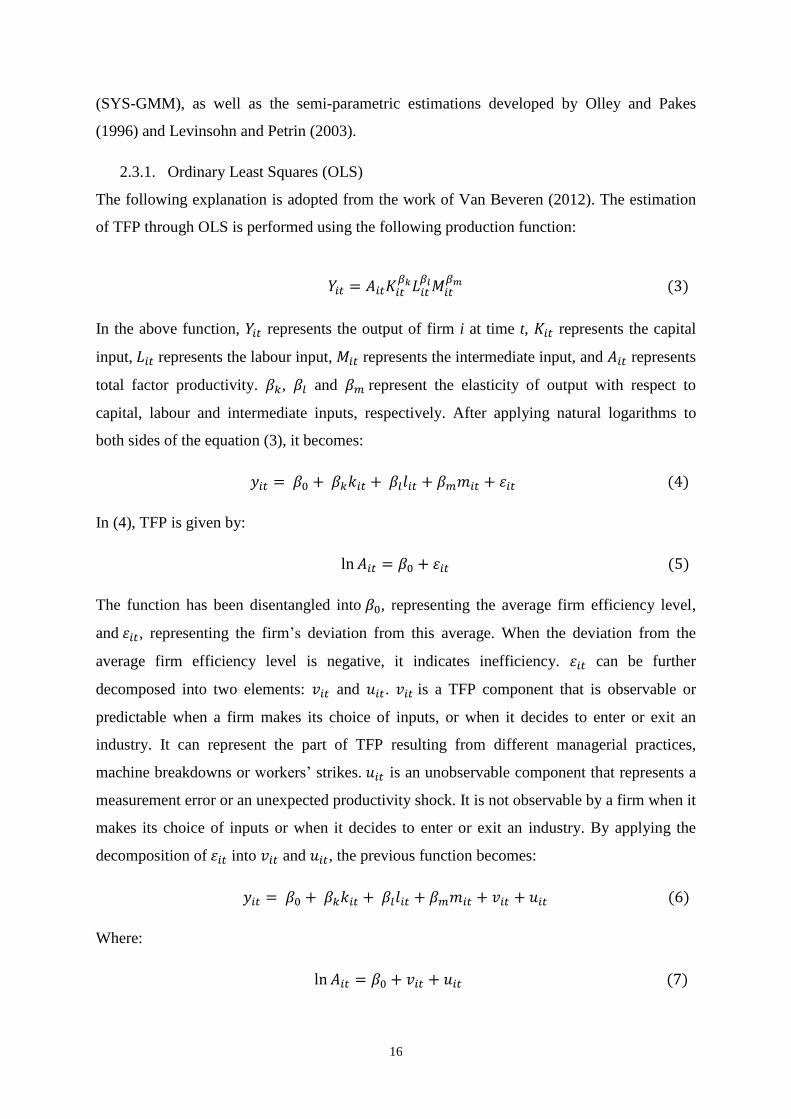
2.3.1. Ordinary Least Squares (OLS)
The following explanation is adopted from the work of Van Beveren (2012). The estimation
of TFP through OLS is performed using the following production function:
𝑌𝑖𝑡 = 𝐴𝑖𝑡𝐾𝑖𝑡𝛽𝑘𝐿𝑖𝑡
𝛽𝑙𝑀𝑖𝑡𝛽𝑚 (3)
In the above function, 𝑌𝑖𝑡 represents the output of firm i at time t, 𝐾𝑖𝑡 represents the capital
input, 𝐿𝑖𝑡 represents the labour input, 𝑀𝑖𝑡 represents the intermediate input, and 𝐴𝑖𝑡 represents
total factor productivity. 𝛽𝑘, 𝛽𝑙 and 𝛽𝑚 represent the elasticity of output with respect to
capital, labour and intermediate inputs, respectively. After applying natural logarithms to
both sides of the equation (3), it becomes:
𝑦𝑖𝑡 = 𝛽0 + 𝛽𝑘𝑘𝑖𝑡 + 𝛽𝑙𝑙𝑖𝑡 + 𝛽𝑚𝑚𝑖𝑡 + 𝜀𝑖𝑡 (4)
In (4), TFP is given by:
ln 𝐴𝑖𝑡 = 𝛽0 + 𝜀𝑖𝑡 (5)
The function has been disentangled into 𝛽0, representing the average firm efficiency level,
and 𝜀𝑖𝑡, representing the firm’s deviation from this average. When the deviation from the
average firm efficiency level is negative, it indicates inefficiency. 𝜀𝑖𝑡 can be further
decomposed into two elements: 𝑣𝑖𝑡 and 𝑢𝑖𝑡. 𝑣𝑖𝑡 is a TFP component that is observable or
predictable when a firm makes its choice of inputs, or when it decides to enter or exit an
industry. It can represent the part of TFP resulting from different managerial practices,
machine breakdowns or workers’ strikes. 𝑢𝑖𝑡 is an unobservable component that represents a
measurement error or an unexpected productivity shock. It is not observable by a firm when it
makes its choice of inputs or when it decides to enter or exit an industry. By applying the
decomposition of 𝜀𝑖𝑡 into 𝑣𝑖𝑡 and 𝑢𝑖𝑡, the previous function becomes:
𝑦𝑖𝑡 = 𝛽0 + 𝛽𝑘𝑘𝑖𝑡 + 𝛽𝑙𝑙𝑖𝑡 + 𝛽𝑚𝑚𝑖𝑡 + 𝑣𝑖𝑡 + 𝑢𝑖𝑡 (6)
Where:
ln 𝐴𝑖𝑡 = 𝛽0 + 𝑣𝑖𝑡 + 𝑢𝑖𝑡 (7)
17
A firm’s observed TFP is given by the average firm efficiency level 𝛽0 and the observed
component 𝑣𝑖𝑡 of the deviation 𝜀𝑖𝑡 from this average:
𝑇𝐹𝑃 ≡ 𝜔𝑖𝑡 = 𝛽0 + 𝑣𝑖𝑡 (8)
This is estimated through OLS and calculated as a residual representing the level of output
not attributable to the capital, labour and material inputs:
𝑇𝐹𝑃 = �̂�𝑖𝑡 = �̂�0 + 𝑣𝑖𝑡 = 𝑦𝑖𝑡 − �̂�𝑘𝑘𝑖𝑡 − �̂�𝑙𝑙𝑖𝑡 − �̂�𝑚𝑚𝑖𝑡 (9)
The TFP level can be obtained by solving for exp (�̂�𝑖𝑡). OLS estimation is adopted because
of its practical and theoretical advantages, its ease of implementation in various statistical and
econometric software applications, and its numerous desirable properties, such as
unbiasedness, consistency, homoscedasticity and efficiency.
However, in the context of a production function, the OLS estimation has one main issue. In
principle, OLS should only work when the inputs are assumed to be exogenous. This means
that inputs in the production process are chosen independently of a firm’s TFP. Since the
decision makers within a firm make the choice of inputs according to various factors, among
them being the observable part of TFP, the assumption of the inputs’ exogeneity is too strong.
Marschak and Andrews (1944) argue that factor inputs are determined within a firm rather
than exogenously. This means that the levels of input into the production process are also
determined according to the observable part of TFP, which itself is also influenced by the
inputs chosen. Therefore, there is a two-way relationship between factor inputs and
productivity, generating a simultaneity or endogeneity issue. Such endogeneity is given by
the inputs’ correlation with �̂�𝑖𝑡. Ignoring this issue in the OLS estimation leads to estimates
that are biased and inconsistent. In this specific case, the bias is known as “endogeneity bias”
or “simultaneity bias.”
In the context of TFP estimation, three other issues need to be considered. One concerns the
unavailability of data regarding physical inputs and outputs and their respective prices at the
firm level. If one assumes the existence of perfect competition, where all firms are subject to
the same input and output prices, and considering that individual firms’ prices are not
available, output quantities can be substituted for by sales deflated by an industry price index.
At the same time, input quantities can be proxied by their deflated values. However, firm-
level prices are likely to differ from those proxied using the industry deflators. If markets are
assumed to be imperfectly competitive and individual firms’ prices are not available, the use

18
of firm level prices as instruments is likely to cause an omitted price bias. De Loecker (2007)
argues that if inputs and outputs are positively correlated while output and price are
negatively correlated, a negative correlation might be generated between variable inputs and
firm-level prices. The ultimate result of these relationships is bias in the factor input
coefficients.
For the Colombian manufacturing sector, Foster et al. (2008) found TFP to be underestimated
when deflated values of sales were used as a proxy for output. This was particularly true for
entering firms, which are likely to charge lower prices than existing firms within the industry.
Therefore, if a firm’s output is represented by deflated sales, it will be underestimated, as will
TFP. At the same time, if a firm charges higher prices than its industry competitors, output
will be overestimated, as will TFP (Van Beveren 2012). Van Beveren (2012) furthermore
suggests that no explicit solution exists for addressing the bias caused by the absence of
specific firm-level price data.
A second issue concerns firms belonging to the same industry but producing multiple
different products, as they are likely to differ in production technology and the nature of the
demand. Bernard et al. (2009) suggest that biased estimates of TFP are likely to result from
the assumption that firms use the same technology and have the same nature of demand for
their products. Therefore, in order to generate consistent estimates of TFP, data on single
inputs and outputs is needed. This enables the accounting for technological differences across
firms that produce various outputs (Bernard et al., 2009). Van Beveren (2012) argues that the
assumption that a firm produces only a single output it is likely to lead to the underestimation
of TFP, as the synergies generated in producing multiple outputs are likely to be ignored.
A third issue in the estimation of TFP concerns the self-selection of firms into and out of an
industry, an issue that was first discussed by Wedervang (1965). Firms are also likely to
make the decision to enter or exit an industry according to their TFP. Ackerberg et al. (2007)
argue that if firms know their productivity before exiting an industry, there should be a
correlation between productivity and the capital stock, as firms with higher capital but lower
productivity are more likely to survive than firms with a lower capital stock. Such a selection
bias is likely to generate a downward bias in the capital input coefficient due to the negative
correlation between productivity and capital stock. Van Beveren (2012) furthermore argues
that ignoring this issue or coping with it using a balanced sample that excludes entering and
exiting firms is likely to cause TFP estimates to be biased upwards.
This section has introduced the measurement of productivity and the main issues arising from
it. The discussion has suggested that, in estimating productivity, the following potential

19
biases must be taken into account: the endogeneity of inputs in the production process; the
unavailability of firm output and input prices; the unavailability of data on single inputs and
outputs; and the self-selection of firms into and out of an industry. Among these issues the
simultaneity issue has been most widely discussed within the methodological literature (Van
Beveren 2012). The methodologies reviewed in the following sections mainly focus on
addressing this issue. The methodologies include the following: the fixed effects (FE)
approach; the instrumental variables (IV) approach; the generalised method of moments
(GMM) methodology; the system-GMM (SYS-GMM) approach; and the semi-parametric
estimation methods developed by Olley and Pakes (1996) and Levinsohn and Petrin (2003).
2.3.2. Fixed Effects (FE)
The simultaneity issue arising from the estimation of TFP through OLS can be addressed by
adopting the fixed-effects (FE) estimation methodology proposed by Mundlak (1961) and
Hoch (1962). One may consider a fixed effects regression model where the 𝑣𝑖𝑡 component of
TFP observed by the firm varies across firms but does not change over time (firm fixed-effect
regression model). The constancy of 𝑣𝑖𝑡 over time represents the main assumption of this
estimation methodology. Since the time index is removed by 𝑣𝑖𝑡, the production function
becomes:
𝑦𝑖𝑡 = 𝛽𝑘𝑘𝑖𝑡 + 𝛽𝑙𝑙𝑖𝑡 + 𝑣𝑖 + 𝑢𝑖𝑡 (10)
Another assumption used in fixed effects estimation is the strict exogeneity of the factor
inputs included within the vector 𝑥𝑖𝑡, which is thus uncorrelated with 𝑢𝑖𝑡:
𝐸[𝑥𝑖𝑡|𝑢𝑖𝑡] = 0 (11)
One can apply the fixed effects regression model the firm: first-differencing, mean-
differencing, or least squares dummy variables (LSDV) estimations. In the case of the mean-
differencing estimation:
(𝑦𝑖𝑡 − 𝑦�̅�) = 𝛽𝑘(𝑘𝑖𝑡 − 𝑘�̅�) + 𝛽𝑙(𝑙𝑖𝑡 − 𝑙�̅�) + (𝑣𝑖 − 𝑣�̅�) + (𝑢𝑖𝑡 − 𝑢�̅�) (12)
In equation (12), 𝑣𝑖 − 𝑣�̅� = 0 because 𝑣𝑖 = 𝑣�̅�. The equation thus becomes:
(𝑦𝑖𝑡 − 𝑦�̅�) = 𝛽𝑘(𝑘𝑖𝑡 − 𝑘�̅�) + 𝛽𝑙(𝑙𝑖𝑡 − 𝑙�̅�) + (𝑢𝑖𝑡 − 𝑢�̅�) (13)

20
In the second step, an OLS regression is performed in order to obtain estimates of the input
coefficients. Ackerberg et al. (2007) suggest that the fixed effects estimation has the
advantage of addressing the simultaneity bias by considering just the time invariant
productivity. Van Beveren (2012) furthermore argues that as long as the decision to enter or
exit an industry is made according to the time invariant productivity, firms’ self-selection bias
is addressed. However, despite being useful for addressing both the simultaneity and self-
selection biases, the fixed effects estimation methodology is characterised by four main
weaknesses. First, as Griliches and Mairesse (1995) note, the method yields low and
insignificant capital coefficients, as well as low estimates of returns to scale. Second,
according to Del Gatto et al. (2011), the assumption of constant unobserved TFP over time
does not rest on strong theoretical grounds. The authors suggest that such an assumption is
more suitable when analysing a short sample period. Thirdly, Del Gatto et al. (2011) also
argue that the fixed effects methodology only exploits the variation of TFP across time and
does not consider the cross-sectional information. Fourth, according to Wooldridge (2009),
the fixed effects estimation requires a strong assumption of strict exogeneity of inputs in
order to achieve unbiased and consistent estimates. Strict exogeneity means that the current
and future input choices are not affected by TFP. This is a strong assumption, as TFP can
affect the decisions of a firm regarding the quality and quantity of inputs to process, and the
decisions to enter or exit an industry. Fifth, Olley and Pakes (1996) found that fixed effects
estimation leads to widely different estimates when applied to a balanced and an unbalanced
sample. For these five reasons, the fixed effects estimation is unsatisfactory for addressing
the simultaneity issue.
2.3.3. Instrumental Variables (IV)
The simultaneity issue can also be addressed by applying the instrumental variables (IV)
estimation. Compared to the fixed effects estimation, this methodology can be performed
without the assumption of the strict exogeneity of inputs, which Wooldridge (2009) regards
as too strong. In the instrumental variables estimation, the variation of each input variable can
be decomposed into two different parts: one, whose correlation with the TFP component 𝑣𝑖𝑡
generates the simultaneity bias as well as inconsistent estimates, and another that is
uncorrelated with 𝑣𝑖𝑡. Understanding the variation of each input variable that is uncorrelated
with 𝑣𝑖𝑡 enables us to ignore the variation that generates biased estimates. Such information
can be obtained through instrumental variables estimation, which simulates the variation in
21
the independent variables that is uncorrelated with the 𝑢𝑖𝑡. It must be stressed that
instruments should not enter directly into the production function (Van Beveren, 2012).
The instrumental variables approach tends to produce consistent and unbiased estimators.
However, it must also be stressed that a valid IV estimation must satisfy two conditions. One
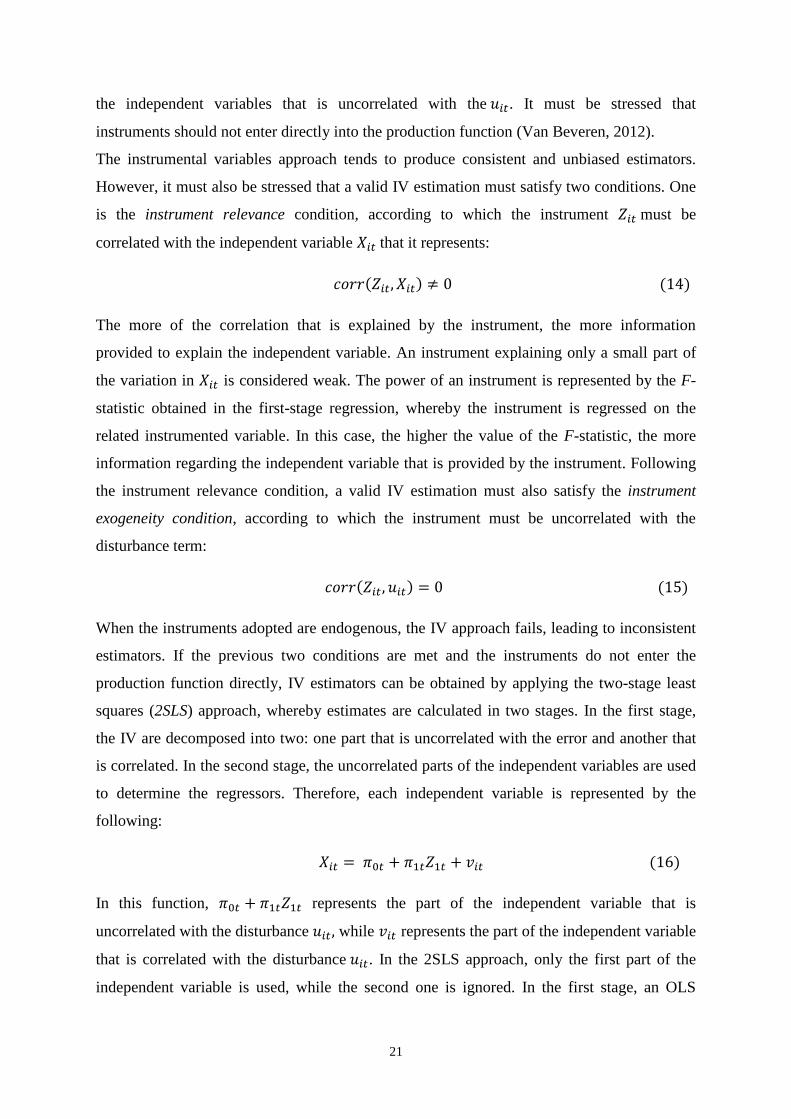
is the instrument relevance condition, according to which the instrument 𝑍𝑖𝑡 must be
correlated with the independent variable 𝑋𝑖𝑡 that it represents:
𝑐𝑜𝑟𝑟(𝑍𝑖𝑡, 𝑋𝑖𝑡) ≠ 0 (14)
The more of the correlation that is explained by the instrument, the more information
provided to explain the independent variable. An instrument explaining only a small part of
the variation in 𝑋𝑖𝑡 is considered weak. The power of an instrument is represented by the F-
statistic obtained in the first-stage regression, whereby the instrument is regressed on the
related instrumented variable. In this case, the higher the value of the F-statistic, the more
information regarding the independent variable that is provided by the instrument. Following
the instrument relevance condition, a valid IV estimation must also satisfy the instrument
exogeneity condition, according to which the instrument must be uncorrelated with the
disturbance term:
𝑐𝑜𝑟𝑟(𝑍𝑖𝑡, 𝑢𝑖𝑡) = 0 (15)
When the instruments adopted are endogenous, the IV approach fails, leading to inconsistent
estimators. If the previous two conditions are met and the instruments do not enter the
production function directly, IV estimators can be obtained by applying the two-stage least
squares (2SLS) approach, whereby estimates are calculated in two stages. In the first stage,
the IV are decomposed into two: one part that is uncorrelated with the error and another that
is correlated. In the second stage, the uncorrelated parts of the independent variables are used
to determine the regressors. Therefore, each independent variable is represented by the
following:
𝑋𝑖𝑡 = 𝜋0𝑡 + 𝜋1𝑡𝑍1𝑡 + 𝑣𝑖𝑡 (16)
In this function, 𝜋0𝑡 + 𝜋1𝑡𝑍1𝑡 represents the part of the independent variable that is
uncorrelated with the disturbance 𝑢𝑖𝑡, while 𝑣𝑖𝑡 represents the part of the independent variable
that is correlated with the disturbance 𝑢𝑖𝑡. In the 2SLS approach, only the first part of the
independent variable is used, while the second one is ignored. In the first stage, an OLS
22
regression is applied for each endogenous variable. Eventual exogenous variables, 𝑊𝑖𝑡, are
included in the regression. However, since the values of 𝜋0𝑡and 𝜋1𝑡 are unknown, they are
estimated in the first stage. In the second stage, the predicted values of the previous
regression are used:
�̂�𝑖𝑡 = �̂�0𝑡 + �̂�1𝑡𝑍1𝑡 (17)
The 𝑌𝑖𝑡 is then regressed on the predicted values of the �̂�𝑖𝑡:
𝑌𝑖𝑡 = 𝛽0 + 𝛽�̂�𝑖𝑡 + 𝑢𝑖𝑡 (18)
This process enables us to obtain estimators that are unbiased and consistent. Despite this, the
difficulty of the IV approach lies in finding the right instruments. Ackerberg et al. (2007) do
not recommend using input prices as instruments, since they claim it could potentially
generate four issues. The first is related to the competitive nature of both the input and output
markets in which the firm operates. In the case of inputs, when markets are perfectly
competitive, input prices are uncorrelated with TFP because the firm has no power to set
prices. In that case, input prices can be used as instrumental variables. However, when a firm
has market power, input prices are likely to be set according to input quantities and the firm’s
productivity (van Beveren, 2012). In such a case, the input prices would be endogenous
variables correlated with TFP, thus resulting in biased and inconsistent estimates. Based on
the arguments presented above, it can be inferred that input prices are a valid instrument only
when one assumes that firms operate in perfectly competitive markets.
The second issue is related to the lack of reporting of input prices by firms. It is difficult to
find firms that report prices and who report them with a high level of precision. The third
issue arises when input prices are reported. In this case, prices must vary across firms in order
to reflect the different input market conditions faced by each firm in particular, rather than
reflecting different input qualities. This is because input qualities are likely to enter the
production function through the unobservable 𝑢𝑖𝑡 (representing TFP) and are, therefore,
likely to be correlated with the instruments used. Ackerberg et al. (2007), for example, argue
that if wages are related to the quality of employees’ work rather than labour market
conditions, this would be reflected in productivity, generating a correlation with instruments
and resulting in inconsistent and biased estimates. The fourth issue is related to the
assumption of the exogenous evolution of TFP across time (Ackerberg et al., 2007). This is a
strong assumption, since the choice of inputs within a firm affects TFP. In summary, the

23
existence of the above four issues does not seem to support the use of input prices as
instruments for estimating TFP. Other than input prices, the instruments that have been
suggested in the literature include output prices and variables affecting the output demand or
supply of inputs. Such instruments might have greater validity according to the competitive
structure of the relative market, although they tend to be more difficult to find in comparison
to other instruments.
2.3.4. Generalised Method of Moments (GMM) and SYS-GMM
Apart from the ordinary least squares, fixed effects and instrumental variables methodologies,
an alternative proposed for addressing the issue of simultaneity is the use of lagged input
levels as instruments for input changes, after applying a first-differentiation to the production
function. Such a methodology is adopted, for example, by Mairesse and Hall (1996) in their
GMM estimation, in which they control for both the endogeneity of inputs and heterogeneity
across firms. GMM does not require the assumptions of zero autocorrelation of the error term
across years and homoscedasticity across firms in order to obtain efficient estimates.
Moreover, the standard error estimates arising from the GMM estimation are robust in the
presence of correlation across equations and heteroscedasticity conditions. The explanation of
the GMM estimator methodology provided here follows Blundell and Bond (1998). Taking
an individual effect autoregressive model with unobserved firm-specific effects,
𝑦𝑖𝑡 = 𝛼𝑦𝑖,𝑡−1 + 𝜂𝑖 + 𝑣𝑖𝑡 (19)
𝑤ℎ𝑒𝑟𝑒 𝑖 = 1, … , 𝑁 𝑎𝑛𝑑 𝑡 = 2, … , 𝑇
In (19), 𝛼 is the parameter of interest, and 𝜂𝑖 is the firm fixed effect, which is potentially
correlated with 𝑥𝑖𝑡. Following Mairesse and Hall (1996), lagged levels of the 3-year variables
are used as instruments for the labour, capital and R&D capital variables in the first-
differenced equation.
Mairesse and Hall (1996) subsequently impose (𝑇−1)(𝑇−2)
2 orthogonality conditions, which
are:
𝐸[𝑦𝑖,𝑡−𝑠, ∆𝑣𝑖𝑡] = 0 (20)
Where:
𝑡 = 3, … , 𝑇
24
𝑠 = 2, … , 𝑇
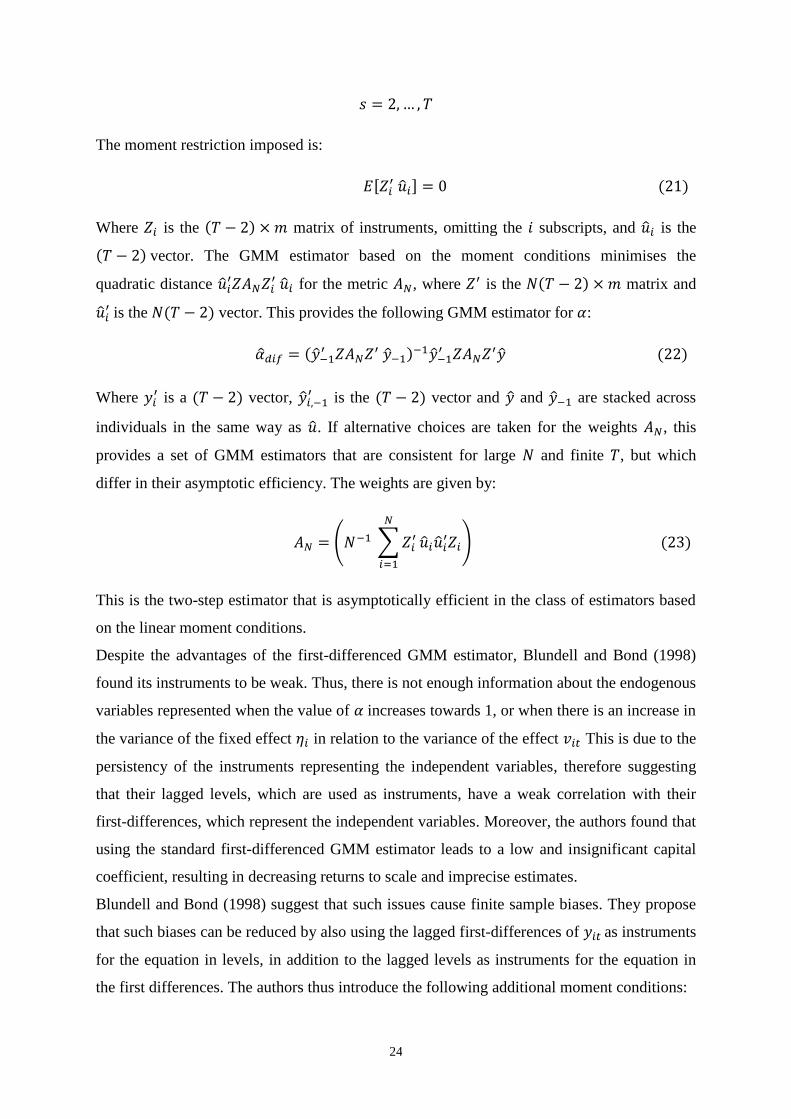
The moment restriction imposed is:
𝐸[𝑍𝑖′ �̂�𝑖] = 0 (21)
Where 𝑍𝑖 is the (𝑇 − 2) × 𝑚 matrix of instruments, omitting the 𝑖 subscripts, and �̂�𝑖 is the
(𝑇 − 2) vector. The GMM estimator based on the moment conditions minimises the
quadratic distance �̂�𝑖′𝑍𝐴𝑁𝑍𝑖
′ �̂�𝑖 for the metric 𝐴𝑁, where 𝑍′ is the 𝑁(𝑇 − 2) × 𝑚 matrix and
�̂�𝑖′ is the 𝑁(𝑇 − 2) vector. This provides the following GMM estimator for 𝛼:
�̂�𝑑𝑖𝑓 = (�̂�−1′ 𝑍𝐴𝑁𝑍′ �̂�−1)−1�̂�−1
′ 𝑍𝐴𝑁𝑍′�̂� (22)
Where 𝑦𝑖′ is a (𝑇 − 2) vector, �̂�𝑖,−1
′ is the (𝑇 − 2) vector and �̂� and �̂�−1 are stacked across
individuals in the same way as �̂�. If alternative choices are taken for the weights 𝐴𝑁, this
provides a set of GMM estimators that are consistent for large 𝑁 and finite 𝑇, but which
differ in their asymptotic efficiency. The weights are given by:
𝐴𝑁 = (𝑁−1 ∑ 𝑍𝑖′
𝑁
𝑖=1
�̂�𝑖�̂�𝑖′𝑍𝑖) (23)
This is the two-step estimator that is asymptotically efficient in the class of estimators based
on the linear moment conditions.
Despite the advantages of the first-differenced GMM estimator, Blundell and Bond (1998)
found its instruments to be weak. Thus, there is not enough information about the endogenous
variables represented when the value of 𝛼 increases towards 1, or when there is an increase in
the variance of the fixed effect 𝜂𝑖 in relation to the variance of the effect 𝑣𝑖𝑡 This is due to the
persistency of the instruments representing the independent variables, therefore suggesting
that their lagged levels, which are used as instruments, have a weak correlation with their
first-differences, which represent the independent variables. Moreover, the authors found that
using the standard first-differenced GMM estimator leads to a low and insignificant capital
coefficient, resulting in decreasing returns to scale and imprecise estimates.
Blundell and Bond (1998) suggest that such issues cause finite sample biases. They propose
that such biases can be reduced by also using the lagged first-differences of 𝑦𝑖𝑡 as instruments
for the equation in levels, in addition to the lagged levels as instruments for the equation in
the first differences. The authors thus introduce the following additional moment conditions:

25
𝐸(𝑢𝑖𝑡, ∆𝑦𝑖,𝑡−1) = 0 𝑓𝑜𝑟 𝑡 = 4,5, … , 𝑇 (24)
And
𝐸(𝑢𝑖3, ∆𝑦𝑖2) = 0 (25)
The new GMM estimator, called system-GMM (SYS-GMM), is based on the previous
conditions, which themselves are based on a stacked system comprising the (𝑇 − 2)
equations in first differences and the (𝑇 − 2) equations in levels, corresponding to the
periods 3, … , 𝑇 for which the instruments are observed. As in the previous case, the GMM
estimator deteriorates as 𝛼 moves towards 1. However, since |𝛼| < 1, the moment condition
provides information about the endogenous variables it represents. The two-step estimator is
calculated in the same way as previously defined. Blundell and Bond’s (1998) framework
differs from the standard first-differenced GMM in that it allows for an autoregressive
(AR(1)) component in the production function error term, enabling serial correlation in order
to obtain valid lagged internal instruments for equations in first-differences or equations in
levels.
Using a panel of 509 US manufacturing firms, Blundell and Bond (2000) found that there are
finite sample biases in the first-differenced GMM estimator resulting from the existence of
weak instruments and that these biases diminish with the imposition of constant returns to
scale. The authors also report higher and more significant capital coefficients resulting from
the SYS-GMM approach, in comparison with the first-differenced GMM estimator, with no
rejection of the assumption of constant returns to scale. Moreover, compared to the
instruments in the standard first-differenced GMM estimator, the new instruments are not
rejected, thus suggesting that they are informative for the endogenous variables in levels that
they represent, with the imposition of constant returns to scale generating even better results.
Performing a Monte Carlo simulation, Blundell and Bond (1998) demonstrate that the SYS-
GMM has better finite sample properties and is more efficient than the standard first-
differenced GMM estimator, which was characterised by large finite sample bias and low
precision. Van Biesebroeck (2007) found SYS-GMM to be the most suitable parametric
methodology when there is measurement error or technological heterogeneity among firms,
compared to the following methodologies: index numbers, data envelopment analysis,
instrumental variables estimation, stochastic frontiers and semiparametric estimation. This is
because SYS-GMM was found to generate the most robust estimates for both total factor
productivity levels and growth rates compared to other estimators. Van Biesebroeck (2007)
26
also argues that when technological heterogeneity between firms is absent but there are
constant productivity differences over time, SYS-GMM provides the most reliable results.
2.3.5. Olley and Pakes’ (1996) Semi-parametric Estimation
The explanation of this methodology follows Olley and Pakes (1996). The achievement of
consistent and unbiased estimates by this approach relies on three main assumptions. The first
is the assumption of the existence of only one unobserved state variable at the firm level,
evolving according to a first-order Markov process. This variable is productivity. The second
is the assumption of monotonicity for the investment variable, meaning that investment
increases in productivity and only positive values of investment are used in the analysis. The
third is the assumption that all firms belonging to the same industry are subject to the same
input and output prices, meaning that they operate in perfectly competitive markets.
Therefore industry deflators are used for both inputs and outputs.
In the Olley and Pakes (1996) estimation methodology, since a firm maximises the expected
discounted value of future cash flows at the beginning of each period, the firm will compare
its sale (or liquidation) value with the expected return it can generate by continuing to
operate. If it is not worth operating, the firm will liquidate. Otherwise, the firm will decide to
pursue a positive investment, a choice that is also based on the perception of future market
structure and input factor prices.
These decisions can be expressed by an exit rule and an investment demand function,
respectively:
𝜒𝑡 = {1 𝑖𝑓 𝜔𝑡 ≥ 𝜔𝑡⏟ (𝑎𝑡, 𝑘𝑡), 0 𝑜𝑡ℎ𝑒𝑟𝑤𝑖𝑠𝑒} (26)
𝑖𝑡 = 𝑖𝑡(𝜔𝑡, 𝑎𝑡, 𝑘𝑡) (27)
Where 𝑖𝑡 is the investment, 𝜔𝑡 is TFP, 𝑎𝑡 is the age of the firm and 𝑘𝑡 is the capital stock. In
(27), investment is a function of productivity, age and the capital stock. Here, the production
function is represented by the following:
𝑦𝑖𝑡 = 𝛽0 + 𝛽𝑎𝑎𝑖𝑡 + 𝛽𝑘𝑘𝑖𝑡 + 𝛽𝑙𝑙𝑖𝑡 + 𝜔𝑖𝑡 + 𝜂𝑖𝑡 (28)
In this equation, 𝜂𝑖𝑡 represents measurement error or an unexpected productivity shock. In
Olley and Pakes’ (1996) estimation algorithm, labour is the only variable factor, and is hence
affected by the current 𝜔𝑖𝑡 value, while the other inputs, 𝑘𝑡 and 𝑎𝑡, are relatively fixed and
are affected by the distribution of 𝜔𝑖𝑡 depending on the information at time 𝑡 − 1 and past
27
values of 𝜔𝑖𝑡. Olley and Pakes (1996) impose a strict monotonicity condition for investment,
which means it increases in 𝜔𝑡 when 𝜔𝑡 is not equal to zero. A positive productivity shock is
thus likely to result in a positive shock in the future, hence leading to an accumulation of
capital. The previous two assumptions enable the inversion of the unobservable term 𝜔𝑡 thus
addressing the endogeneity issue by controlling for 𝜔𝑖𝑡. Investment is thus used as a proxy to
control for the correlation between input levels and the unobserved firm-specific productivity
shock, hence addressing the simultaneity bias. With investment increasing in 𝜔𝑖𝑡, the
previous investment function can be inverted to become:
𝜔𝑖𝑡 = ℎ𝑡(𝑖𝑡, 𝑎𝑡, 𝑘𝑡) (29)
By substituting the inverted investment function into the production function, it becomes:
𝑦𝑖𝑡 = 𝛽𝑙𝑙𝑖𝑡 + 𝜙𝑡(𝑖𝑖𝑡, 𝑎𝑖𝑡, 𝑘𝑖𝑡) + 𝜂𝑖𝑡 (30)
Where:
𝜙𝑡(𝑖𝑖𝑡, 𝑎𝑖𝑡, 𝑘𝑖𝑡) = 𝛽0 + 𝛽𝑎𝑎𝑖𝑡 + 𝛽𝑘𝑘𝑖𝑡 + ℎ𝑡(𝑖𝑖𝑡, 𝑎𝑖𝑡, 𝑘𝑖𝑡) (31)
The equation is estimated with OLS, resulting in consistent estimates for 𝛽𝑙 but not for 𝛽𝑎
or 𝛽𝑘, thus not allowing the measurement of their effect on a firm’s investment decision. In
order to estimate, 𝛽𝑎 and 𝛽𝑘, the following relation on productivity at time 𝑡 + 1 is taken:
𝜔𝑖,𝑡+1 = 𝐸[𝜔𝑖,𝑡+1|𝜔𝑖𝑡] + 𝜉𝑡+1 (32)
Where 𝜉𝑡+1 represents the innovation component in 𝜔𝑖𝑡+1. The relation means that TFP at
𝑡 + 1 follows a first-Markov process given by the expected value of productivity at 𝑡 + 1,
conditional on the information on TFP at time 𝑡, plus the innovation component at 𝑡 + 1.
Firms will decide to operate if:
𝜒𝑡 = 1 𝑖𝑓 𝜔𝑡 ≥ 𝜔𝑡⏟ (𝑎𝑡, 𝑘𝑡) (33)
Since the innovation component 𝜉𝑡+1 is correlated with the variable inputs 𝛽𝑙𝑙𝑖𝑡, this is
subtracted from the output:
𝑦𝑖𝑡 − 𝛽𝑙𝑙𝑖𝑡 = 𝜙𝑡(𝑖𝑖𝑡, 𝑎𝑖𝑡, 𝑘𝑖𝑡) + 𝜂𝑖𝑡 (34)
The TFP expectation at time 𝑡 + 1 now becomes:
𝐸[𝜔𝑖𝑡+1|𝑘𝑖𝑡+1, 𝜒𝑡+1 = 1] = 𝛽0 + 𝛽𝑘𝑘𝑖𝑡+1 + 𝐸[𝜔𝑖𝑡+1|𝜔𝑖𝑡+1, 𝜒𝑡+1 = 1] (35)
28
The second stage of the estimation algorithm is:
𝑦𝑖𝑡+1 − 𝛽𝑙𝑙𝑖𝑡+1 = 𝛽𝑎𝑎𝑖𝑡+1 + 𝛽𝑘𝑘𝑖𝑡+1 + 𝑔(𝑃𝑡, 𝜙𝑡 − 𝛽𝑎𝑎𝑡 − 𝛽𝑘𝑘𝑡) + 𝜉𝑡+1 + 𝜂𝑡+1 (36)
In this function, 𝐸[𝜔𝑖𝑡+1|𝜔𝑖𝑡+1, 𝜒𝑡+1 = 1] = 𝑔(𝑃𝑡, 𝜙𝑡 − 𝛽𝑎𝑎𝑡 − 𝛽𝑘𝑘𝑡) is the firm’s
expectation of productivity at time 𝑡 + 1, 𝑃𝑡 = 𝑃𝑟 [𝜒𝑡+1 = 1| 𝜔𝑡+1⏟ (𝑎𝑡+1, 𝑘𝑡+1), 𝐽𝑡] is the
probability of the firm’s survival at time t, and 𝜉𝑡+1 = 𝜔𝑡+1 − 𝐸[𝜔𝑡+1|𝜔𝑡, 𝜒𝑡+1 = 1] is the
innovation component. The coefficients for the capital and age inputs can be obtained by
executing a non-linear least squares regression on the previous equation. Because 𝜉𝑡+1 and
𝜂𝑡+1 are not correlated with 𝑘𝑖,𝑡+1 and 𝑎𝑖,𝑡+1, this estimation leads to unbiased and consistent
estimates of 𝛽𝑎 and 𝛽𝑘.
2.3.6. Levinsohn and Petrin’s (2003) Semiparametric Estimation
The explanation of this methodology follows the structure of Levinsohn and Petrin (2003).
The previous section demonstrated how Olley and Pakes (1996) use investment as a proxy to
control for the simultaneity between the input choice and productivity. Although investment
seems to represent a valuable proxy, Levinsohn and Petrin (2003) indicate that intermediate
inputs constitute a better proxy. This is mainly because of the monotonicity condition
imposed in Olley and Pakes’s (1996) methodology, which results in the consideration of only
positive investment observations. Since firms do not always invest, such a condition is likely
to cause an efficiency loss in the estimation, since observations in which investment is equal
to zero would not be considered in the methodology. Firstly, Levinsohn and Petrin (2003)
suggest that since firms always report a positive value for their use of intermediate inputs, it
constitutes a better proxy. Secondly, when non-convex adjustment costs lead to twists in the
investment demand function, plants might not properly respond to shocks by adjusting
investment, leaving the correlation between endogenous variables and the unobservable term.
This is because investment is costly and relatively difficult for firms to adjust in response to a
shock. In contrast, intermediate inputs are likely to be easier to adjust. This consideration
provides further support for the use of intermediate inputs as a proxy. Levinsohn and Petrin
(2003) adopt intermediate inputs as a proxy rather than investment because it is less
susceptible to zero values and due to efficiency losses arising in the estimation using
investment as a proxy. The monotonicity condition is more likely to hold than in the Olley
and Pakes (1996) method. Moreover, intermediate inputs can be adjusted at a lower cost than
investments when productivity shocks occur, hence removing the correlation between the

29
independent variables and the disturbance. As in the case of Olley and Pakes’s (1996)
method, 𝜔𝑡 is the only unobservable term that enters into the function for intermediate
inputs 𝑚𝑡. The intermediate inputs (e.g. materials and energy) are added into the production
function:
𝑦𝑖𝑡 = 𝛽0 + 𝛽𝑘𝑘𝑡 + 𝛽𝑠𝑙𝑡𝑠 + 𝛽𝑢𝑙𝑡
𝑢 + 𝛽𝑒𝑒𝑡 + 𝛽𝑓𝑓𝑡 + 𝛽𝑚𝑚𝑡 + 𝜔𝑡 + 𝜂𝑡 (37)
In this function, 𝑙𝑡𝑠 is the log of skilled labour input, 𝑙𝑡
𝑢 is the log of unskilled labour, 𝑒𝑡 is the
log of electricity input, 𝑓𝑡 is the log of fuel inputs, and 𝑚𝑡 is the log of material inputs. A firm
index is not adopted in the function because both input and output prices are assumed to be
the same across all firms. Because of the monotonicity condition, the material input demand
function can be inverted as follows:
𝜔𝑡 = 𝜔𝑡(𝑚𝑡, 𝑘𝑡) (38)
Therefore:
𝜙𝑡(𝑚𝑡, 𝑘𝑡) = 𝛽0 + 𝛽𝑘𝑘𝑡 + 𝛽𝑚𝑚𝑡 + 𝜔𝑡(𝑚𝑡, 𝑘𝑡) (39)
This equation can be estimated by OLS, as Olley and Pakes (1996) have done. However,
Levinsohn and Petrin (2003) also use a different approach. By regressing output on capital
and material input, the authors estimate the following conditional moments:
- 𝐸(𝑦𝑡|𝑚𝑡, 𝑘𝑡),
- 𝐸(𝑙𝑡𝑠|𝑚𝑡, 𝑘𝑡),
- 𝐸(𝑙𝑡𝑢|𝑚𝑡, 𝑘𝑡),
- 𝐸(𝑒𝑡|𝑚𝑡, 𝑘𝑡),
- 𝐸(𝑓𝑡|𝑚𝑡, 𝑘𝑡).
These are then subtracted from the production function, where no intercept is used to obtain
the first stage estimates:
𝑦𝑖𝑡 − 𝐸(𝑦𝑡|𝑚𝑡 , 𝑘𝑡)
= 𝛽𝑠(𝑙𝑡𝑠 − 𝐸(𝑙𝑡
𝑠|𝑚𝑡, 𝑘𝑡)) + 𝛽𝑢(𝑙𝑡𝑢 − 𝐸(𝑙𝑡
𝑢|𝑚𝑡, 𝑘𝑡)) + 𝛽𝑒(𝑒𝑡 − 𝐸(𝑒𝑡|𝑚𝑡, 𝑘𝑡))
+ 𝛽𝑓(𝑓𝑡 − 𝐸(𝑓𝑡|𝑚𝑡, 𝑘𝑡)) + 𝜂𝑡 (40)
30
In the second stage of the estimation algorithm, it is assumed that capital and the innovation
component of productivity are uncorrelated:
𝐸[𝑘𝑡𝜂𝑡∗] = 0 (41)
In addition, innovation in productivity at time t is uncorrelated with the choice of material
inputs at time 𝑡 − 1:
𝐸[𝑚𝑡−1𝜂𝑡∗] = 0 (42)
The residual is obtained by the following:
𝜉𝑡 + 𝜂𝑡(𝛽∗) = 𝑦𝑡 − 𝛽𝑠𝑙𝑡𝑠 − 𝛽𝑢𝑙𝑡
𝑢 − 𝛽𝑒𝑒𝑡 − 𝛽𝑓𝑓𝑡 − 𝛽𝑚∗ 𝑚𝑡 − 𝛽𝑘
∗𝑘𝑡 − 𝐸[𝜔𝑡|𝜔𝑡−1] (43)
In this function, 𝛽∗ = (𝛽𝑚∗ , 𝛽𝑘
∗), 𝐸[𝜔𝑡|𝜔𝑡−1] is estimated by using the estimates of 𝜔𝑡
obtained from the results of the first stage estimation and the (𝛽𝑚∗ , 𝛽𝑘
∗).
The authors, by adding six over-identifying conditions to the two already existing ones, arrive
at the following expectation vector:
𝐸[(𝜉𝑡 + 𝜂𝑡)𝑍𝑡] (44)
Where 𝑍𝑡 is a vector:
𝑍𝑡 = {𝑘𝑡, 𝑚𝑡−1, 𝑙𝑡−1𝑠 , 𝑙𝑡−1
𝑢 , 𝑒𝑡−1, 𝑓𝑡−1, 𝑘𝑡−1, 𝑚𝑡−2} (45)
Estimates of (�̂�𝑘, �̂�𝑚) are obtained by minimising the following function with the GMM
approach, which uses 𝑡 − 1 values of the materials variable as instruments for the t variable:
𝑄(𝛽∗) = 𝑚𝑖𝑛𝛽∗ ∑(∑ ∑ (𝜉𝑖,𝑡 + 𝜂𝑖,𝑡(𝛽∗))𝑍𝑖,ℎ𝑡
𝑇𝑖1
𝑡=𝑇𝑖0𝑖
8
ℎ=1
)2 (46)
In this function, 𝑖 represents the firm index, ℎ represents the instrument index, 𝑇𝑖 represents
the time index.
According to the above explanation, Levinsohn and Petrin’s (2003) semiparametric approach
differs from Olley and Pakes’s (1996) in four respects. Firstly, Levinsohn and Petrin (2003)
adopt intermediate inputs rather than investment to control for the simultaneity between input
choice and productivity. Secondly, Levinsohn and Petrin (2003) obtain the coefficient for the
intermediate inputs’ proxy variable in the second stage of the estimation, rather than in the

31
first stage. Thirdly, while Olley and Pakes (1996) adopt an unbalanced panel and consider the
survival probability in the second stage of the estimation, Levinsohn and Petrin (2003) do not
include it since Olley and Pakes’s (1996) results showed very small efficiency gains (Van
Beveren, 2012). Fourth, when a revenue production function is estimated instead of a value-
added function, an additional moment condition is needed to obtain the estimate for
intermediate inputs. Therefore, the second stage of estimation in Levinsohn and Petrin’s
(2003) methodology utilises the GMM approach.
In order to demonstrate the usefulness of the intermediate input proxy, Levinsohn and Petrin
(2003) adopt plant-level annual data from manufacturing firms in the period of 1979-1986,
focusing on metals, textiles, food products and wood products. As described above, their
methodology uses intermediate inputs to control for the correlation between input levels and
unobserved firm-specific productivity shocks (i.e. the simultaneity issue). The addition of
these inputs brings some relevant benefits. Firstly, the investment proxy can only be used for
firms reporting a positive level of capital investment. As many firms report zero or negative
capital investment, this leads to an efficiency loss. In comparison, the intermediate input
proxy allows this problem to be avoided, as firms almost always report positive intermediate
inputs. Secondly, when a productivity shock occurs, it is costly for a firm to respond by
changing its capital investment. This maintains the correlation between the firm-specific
productivity shocks and the regressors. Intermediate inputs are less costly to adjust than
investment when a productivity shock occurs, thus leading to a weakening correlation
between inputs and TFP. Thirdly, as intermediate inputs are not state variables, the use of
intermediate inputs creates a better link between the economic theory and the strategy of
estimation than does capital investment.
Despite representing a step forward compared to the Olley and Pakes (1996) model,
Levinsohn and Petrin’s (2003) approach has its shortcomings. Ackerberg et al. (2006) argue
that, as with Olley and Pakes’s (1996) method, the approach suffers from serious collinearity
problems arising in the first stage of estimation and given this condition, the method requires
strong and unintuitive assumptions to be made in order for it to be correctly identified. The
following discussion of such assumptions is based on Ackerberg et al. (2006).
The first assumption is strict monotonicity. While for Olley and Pakes (1996), investment
must be strictly monotonic in 𝜔𝑖𝑡, Levinsohn and Petrin (2003) also require that intermediate
inputs be strictly monotonic in 𝜔𝑖𝑡. This condition is necessary for the non-parametric
inversion of 𝜔𝑖𝑡, since the endogeneity issue would otherwise not be addressed.

32
The second assumption states that 𝜔𝑖𝑡 is the only unobservable term in the functions for
investment, as carried out by Olley and Pakes (1996), and those for intermediate inputs, as
carried out by Levinsohn and Petrin (2003). Like the previous assumption, this condition is
required in order to invert 𝜔𝑖𝑡.
The third assumption regards the timing of input choices in the two methodologies. In the
Olley and Pakes (1996) methodology, 𝑘𝑖𝑡 is decided at 𝑡 − 1, while in the Levinsohn and
Petrin (2003) methodology, it is decided at or before 𝑡 − 1. If such were not the case, the
moment condition would be violated, as 𝑘𝑖𝑡 would not be orthogonal to 𝜉𝑖𝑡. In Olley and
Pakes’s (1996) approach, the first-stage estimation would be complicated by a choice of 𝑘𝑖𝑡
earlier than 𝑡 − 1, as 𝑖𝑖𝑡−1 could not be used to invert 𝜔𝑖𝑡−1 thus complicating the estimation
in the first stage.
The fourth assumption regards the use of the labour input in the two methodologies. For
example, in Olley and Pakes’s (1996) method, 𝑙𝑖𝑡 cannot have dynamic implications, while in
Levinsohn and Petrin’s (2003) approach, it can. Moreover, in Levinsohn and Petrin’s (1996)
model, 𝑙𝑖𝑡 and 𝑚𝑖𝑡 are assumed to be perfectly variable inputs, meaning that they are defined
when 𝜔𝑖𝑡 is observed by the firm’s decision maker. If 𝑚𝑖𝑡 was chosen before knowing 𝜔𝑖𝑡,
then 𝑚𝑖𝑡 cannot be used for the inversion in the first stage of 𝜔𝑖𝑡. If 𝑙𝑖𝑡 was chosen before
knowing 𝜔𝑖𝑡, then 𝑙𝑖𝑡 would be chosen before 𝑚𝑖𝑡, and thus its choice would be based on 𝑙𝑖𝑡,
which would not enable us to identify the labour coefficient in the first stage by entering into
the function.
Ackerberg et al. (2006) argue that these four assumptions, upon which the semiparametric
methods are based, are strong and unintuitive, therefore generating serious collinearity issues
in the first stage of estimation. Based on the ideas of Olley and Pakes (1996) and Levinsohn
and Petrin (2003), Ackerberg et al. (2006) presented a new estimator that has the advantage
of not suffering from collinearity issues. In addition, it can be compared with dynamic panel
data estimators. On the one hand, this is similar to estimators developed by Olley and Pakes
(1996), as well as Levinsohn and Petrin (2003), as it uses investment or intermediate inputs,
respectively, in order to control for productivity shocks. On the other hand, it estimates the
labour coefficient in the second stage. While it is not the aim of this section to review this
methodology, it is important to note that by using the same dataset as the one used by
Levinsohn and Petrin (2003), Ackerberg et al. (2006) demonstrate that their method is more
stable across various potential variables. Other methodologies have recently been developed

33
by Wooldridge (2009), De Loecker (2007) and Katayama et al. (2009). Despite their
usefulness, discussing them is beyond the scope of this thesis.
2.3.7. Choosing the Right TFP Estimator
The previous sections analysed how TFP is measured and the main issues arising from such
measurements. Following that analysis, it is important to highlight which method constitutes
the most valuable estimator for analysing TFP determinants at the firm level. Van Beveren
(2012) reviewed various issues in the estimation of TFP at the firm level, such as the
endogeneity of input choices (also known as simultaneity bias), the omitted variable bias (due
to the lack of available data on physical inputs and outputs and their respective prices), the
sample selection bias (which results from not allowing for firm entry and exit), and the
production of multiple products by a firm (resulting in differences in production technology
across products produced by single firm). In tackling such issues, the author compares the
performance of different estimators, such as fixed effects, GMM, and the semi-parametric
estimators of Olley and Pakes (1996) and Levinsohn and Petrin (2003). Based on the results
obtained, Van Beveren (2012) argues that the choice of a specific TFP estimator should be
based on the data utilised and the related assumptions imposed.
SYS-GMM represents the most suitable estimator for analysing TFP determinants at the firm
level, especially compared to the widely used semiparametric approaches, since it has the
advantage of allowing for firms’ fixed effects. As previous studies have indicated that firms
have unmeasured productivity advantages that remain constant over time and that need to be
captured, the SYS-GMM approach enables the consideration of such fixed effects. Moreover,
SYS-GMM has the advantage of addressing the endogeneity of the right-hand-side variables
(including the lagged dependent variable) as well as selection bias by using lagged values of
the endogenous variables as instruments in the first differences equation, and first-differences
of the same variables as instruments in the levels equation (Blundell and Bond, 1998). SYS-
GMM is particularly preferable to the semiparametric methodologies of Olley and Pakes
(1996) and Levinsohn and Petrin (2003), as these do not allow for fixed effects and are based
on strong and unintuitive assumptions, which generate collinearity problems in the first stage
of estimation (Ackerberg et al., 2006). Van Biesebroeck (2007) compared the sensitivity of
five different productivity estimators (index numbers, data envelopment analysis, stochastic
frontiers, GMM, and semi-parametric estimation) using a Monte-Carlo simulation. Although
each method has its own advantages and disadvantages, the system GMM estimator was
34
found to be the most robust technique in presence of measurement errors and technological
heterogeneity.
In summary, the main total factor productivity estimation methodologies have been discussed
in this section: ordinary least squares, fixed effects, instrumental variables, GMM and its
variation, SYS-GMM, and the semiparametric methodologies of Olley and Pakes (1996) and
Levinsohn and Petrin (2003). The conditions in which each of them is most suitable approach
have also been discussed. The next section presents the main determinants of total factor
productivity.
2.4. A Review of the Determinants of TFP
The first section of the chapter reviewed TFP in the context of the production function. The
second section discussed the importance of TFP for a firm’s economic performance, people’s
standards of living and national economic growth. The third section analysed how TFP is
measured and explained why micro-level measures are more valuable than macro-level ones.
This section will review the determinants of TFP at the micro level. A micro-level analysis of
TFP enables us to understand what determines the differences in TFP across firms. As a
result, it offers a better understanding of TFP than that attainable with aggregate data. The
determinants of TFP examined in this section are the following: internal and external
knowledge, political affiliation, foreign direct investment, economies of scale, competition,
spatial spillovers, city location, export activity, managerial ability and marketing capabilities.
This is followed by a review of studies analysing multiple determinants of TFP and a
discussion of the contribution of the study in this thesis.
2.4.1. Internal and External Knowledge
“Knowledge can be defined as a dynamic framework or structure from which information
can be stored, processed and understood” (Howells, 2002, p. 872). This definition suggests
that knowledge is taken up and accumulated, and that rather than being static, it increases as a
result of new knowledge gained. According to Polanyi (1962), knowledge can be explicit or
tacit. Explicit knowledge can be transmitted in a direct and explicit way. For example, when
new machinery is installed, workers are provided with instructions on how it functions.
Workers then acquire tacit knowledge by learning processes and procedures, that are not
directly or explicitly communicated. For example, a worker who learns a firm’s processes,
routines, ideals and values without having been provided with any explicit guidance on the
topics develops tacit knowledge. The importance of knowledge can be exemplified by the
following quote: “Knowledge is crucial in helping to create innovation which in turn

35
stimulates economic growth and development. It also plays a more specific role in
establishing and sustaining the long-term capabilities and performance of firms and
organisations and in enhancing the success and well-being of individuals and communities”
(Howells, 2002, p. 871). This description suggests that knowledge is crucial in order for firms
to flourish, while also having effects that go far beyond a firm’s boundaries. Harris and
Moffat (2013) argue that knowledge is part of a firm’s intangible assets. “Intangible assets
are a firm’s dynamic capability created by core competence and knowledge resources,
including organizational structure, employee expert skills, employment centripetal force,
R&D innovation capability, customer size, recognizable brand, and market share” (Tsai et al.,
2012, p. 67). This definition suggests that intangible assets comprise knowledge that can be
disentangled into various components, including R&D. These assets are seen as critical
drivers for knowledge creation, innovation and, consequently, economic growth (Kramer et
al., 2011, p. 447).
From the above definitions and descriptions of knowledge, one might infer that, ceteris
paribus, a firm with a high relative level of knowledge is likely to show greater productivity
compared to a firm with a relatively low level. However, this is not always the case, as the
firm must be able to use its knowledge for productive purposes by developing absorptive
capacity. Absorptive capacity can be explained as follows: “The ability of a firm to recognise
the value of new, external information, assimilate it, and apply it to commercial ends is
critical to its innovative capabilities. We label this capability a firm’s absorptive capacity and
suggest that is largely a function of the firm’s level of prior related knowledge” (Cohen and
Levinthal, 1990, p.128). Although this definition provides an insight into what absorptive
capacity is, a more comprehensive definition might also include the ability of the firm to use
internal knowledge. Eustace (2000, p. 6) suggests that “increasingly, the capacity to combine
external and internal sources of knowledge to exploit commercial opportunities has become a
distinctive competency.” Therefore, it is important to develop knowledge and to use it for
productive purposes, the extent of which is determined by a firm’s absorptive capacity.
Additional insight into the importance of knowledge for productivity is provided by the
resource-based theory, of which Barney (1991) is a proponent. He argues that a firm is made
up of resources, among them knowledge, which are used to implement strategies aimed at
improving a firm’s efficiency. This suggests that knowledge can contribute to higher TFP
within a firm. According to Barney (1991), such resources can constitute a source of
sustainable competitive advantage when they are valuable, rare, imperfectly imitable, and
without substitute. Thus, knowledge can add further value when it is a source of competitive
36
advantage, hence improving a firm’s position with respect to its competitors. In addition,
Teece et al. (1997) state that a competence can constitute a competitive advantage and thus be
a source of higher TFP only when it is difficult to replicate by competitors and when it can be
applied from one setting to another.
The resource-based view of the firm, despite providing a valuable insight into the nature of
the firm, does not consider the external environment where the firm operates. As discussed
earlier, the external environment can constitute an additional source of knowledge. In
addition, “few firms possess all the inputs required for successful and continuous
technological development” (Almeida et al., 2003, p. 302). For example, a firm can have
specific relationships with suppliers, with whom it collaborates in improving inputs, or
customers, with whom it collaborates in improving its products. Rosenkopf and Nerkar
(2001) decompose knowledge into two parts. The first is the knowledge developed by a firm
using its own resources. The authors call this first-order competence and suggest that it can
constitute a source of competitive advantage but can also result in rigidity. The other is called
second-order competence, or knowledge acquired outside the firm’s boundaries. In summary,
both internal and external knowledge can be determinants of TFP when a firm possesses
absorptive capacity and when the knowledge is a source of competitive advantage.
Having stressed the importance of knowledge, it is important to discuss how knowledge is
measured. As described above, one approach is to focus on absorptive capacity. Eustace
(2000) suggests that absorptive capacity comprises R&D, know-how, intellectual property,
workforce skills, world-class supply networks and brands. Some of these, such as R&D
expenditure, can be quantified. Others, such as workforce skills, supply network and brands,
are not easily quantifiable. Romijn and Albaladejo (2002) and Vinding (2006) propose the
use of human capital measures, while Schmidt (2005) created a knowledge measure that
combines R&D activities, related prior knowledge, individuals’ skills, organisational
structure, and human resources management practices. Among the potential measures
suggested in the literature, one may wonder which is the most valuable. Most studies seem to
have followed the suggestion of Cohen and Levinthal (1989), in which R&D is used as a
proxy for absorptive capacity. The authors describe a dual role for R&D. Firstly, it develops
absorptive capacity, which enables the firm to identify, absorb and exploit external
knowledge for productive purposes, which are likely to indirectly result in higher TFP.
Secondly, R&D generates products and process improvements within a firm, which are likely
to directly lead to higher TFP. This dual role suggests that R&D is the most valuable proxy
for absorptive capacity because it has both a direct and indirect effect on TFP.

37
However, some R&D investment is unsuccessful and is thus unlikely to result in higher TFP.
Some R&D expenditures can result in TFP-improving innovations, while others may be a
waste of resources. In their subsequent paper, Cohen and Levinthal (1990) suggest that
absorptive capacity is path-dependent, or mostly a function of the prior knowledge that a firm
has accumulated. This means that by already having a certain level of knowledge, a firm is
able to better process and exploit new knowledge for innovative purposes, compared to firms
without that level of knowledge. In contrast to Cohen and Levinthal (1990), Schmidt (2005)
argues that R&D does not represent a valuable proxy for absorptive capacity because of its
path-dependent characteristics. In response to this issue, Harris and Li (2009) measured
absorptive capacity through a factor analysis on 36 variables representing the following: the
firm’s ability to exploit external knowledge, the knowledge generated by its networking
relationships with external bodies, the implementation of new organisational structures and
human resource management strategies, partnerships built with enterprises or institutions at
the international level, and the acquisition and absorption of codified scientific knowledge
from research partners. Harris and Li (2009) argue that their measure of absorptive capacity
is the most direct and comprehensive. However, the difficulty in using such a measure lies in
having access to the entire set of 36 variables. Harris and Li (2009) constructed this measure
for firms based in the UK, for which information is more likely to be available than for those
in developing countries such as China. Thus, despite the path-dependency issue suggested by
Schmidt (2005), R&D constitutes the most reliable measure of absorptive capacity.
Empirically, the positive effect of R&D investment on TFP has been demonstrated by various
studies. Lokshin et al. (2008) examined the impact of internal and external R&D on labour
productivity in a sample of 301 Dutch firms during the period of 1996-2001. The change in
knowledge stock was measured as a function of the investment into both internal and external
R&D, where internal R&D represented absorptive capacity and external R&D represented the
acquisition of external technology. The authors’ results prove that both internal and external
R&D positively affect labour productivity. Their most interesting finding, however, is that
external R&D only has a positive impact when there is an adequate level of internal R&D.
This suggests that a firm may particularly benefit from knowledge acquired externally when
it has a strong level of absorptive capacity, which would enable it to exploit external
knowledge for productive purposes. Other studies have analysed the relationship between
R&D and productivity but without separating the two channels by which R&D impacts
productivity.
38
Griliches (1986), for example, analysed the relationship between R&D expenditures and TFP
growth in a sample of 1,000 large US manufacturing firms during the period of 1957-1977. A
knowledge variable was inserted into a standard production function as a factor of
production. This was measured with the variable K = ∑ wiRt−i, where Rt−i represents the
lagged effect of real gross investment in R&D on TFP. Griliches’s findings suggest a positive
and significant contribution of R&D to TFP growth, and this was found to last over time. In
addition, a larger effect on TFP was found for company-financed research compared to
federally funded research, and for basic research compared to other types of research.
In line with Griliches’s (1986) study, Lichtenberg and Siegel (1991) analysed the relationship
between R&D and TFP growth by comparing company-financed research with federally-
funded research. The analysis looked at over 2,000 US firms during three different periods
between 1972 and 1985. In the study, R&D was measured in terms of its intensity, given by
the ratio of R&D expenditure to sales. Consistent with Griliches’s (1986) findings,
Lichtenberg and Siegel’s (1991) results demonstrate a positive contribution of R&D
investment to TFP growth. In particular, company-financed research was found to provide a
higher return in terms of TFP than federally funded research. On the one hand, this suggests
that firms benefit more from internally generated knowledge rather than externally generated
knowledge. On the other hand, this points to a likely low level of absorptive capacity in the
firms within the sample.
As with Lichtenberg and Siegel (1991), Griliches and Mairesse (1991) used an R&D intensity
variable. However, instead of measuring the variable’s contribution to TFP growth, they
adopted labour productivity growth as a dependent variable. Although this is a valuable
proxy, a more valuable one would have been TFP, as it considers all inputs utilized within the
production process. In their study, Griliches and Mairesse (1991) assessed the contribution of
R&D to labour productivity growth in both the United States and Japan by using firm-level
data for the period of 1973-1980. In contrast to previous studies, the data only comprised
company-financed R&D. Despite being minor, R&D contribution was found to be similar in
the US and Japan. Moreover, the findings suggest that R&D contributed 0.4-0.6% to labour
productivity growth during the period analysed. However, as Griliches and Mairesse (1991)
point out, the Japanese R&D data is characterized by missing and inaccurate values,
suggesting that the results should be interpreted cautiously.
Regarding the Chinese context, two studies have examined the effect of R&D on productivity
at the firm level. Hu (2001) analysed the relationship between R&D spending and the
productivity of 813 high-tech Chinese firms in the Haidian District of Beijing in 1995. The

39
impact of R&D was measured in terms of its share of sales, thus representing its intensity. On
the one hand, the results indicate the existence of a positive effect of privately financed R&D
on Chinese firms’ productivity. On the other hand, the results indicate the existence of a
negative relationship between government financed R&D and firms’ productivity. Despite
this, the results also suggest that government financed R&D indirectly affects firms’
productivity in a positive manner, as it stimulates private R&D expenditure.
While Hu’s (2001) study focused on high-tech firms, Wu et al. (2007) examined 145 firms
belonging to the watch and clock manufacturing industry in Southern China. Apart from
R&D intensity, knowledge was also examined in terms of capital intensity (the ratio of a
firm’s capital expenditure to its number of employees) and level of product differentiation
(the ratio of a firm’s advertising expenditure to its gross output). The results suggest that
technical efficiency is positively affected by knowledge expressed as R&D and capital
intensity, but negatively by knowledge expressed as product differentiation.
Based on the above discussion and empirical results from the literature, knowledge creation
in the form of R&D investment is likely to have a positive effect on firms’ TFP. This positive
effect is likely to be exerted through two channels: a direct channel, as R&D expenditure is
undertaken for product and process improvements, and an indirect channel, as R&D develops
absorptive capacity, which enables firms to absorb external knowledge and use it for
productive purposes. The empirical literature analysing Chinese firms indicates that privately
financed R&D directly and positively affects TFP. Government financed R&D, on the other
hand, directly and negatively affects TFP but provides an indirect positive effect by
promoting private R&D expenditure.
Other than through R&D investment, knowledge can be also obtained through experience.
This is because a firm is expected to become more productive as it ages, according to the so-
called “survival effect.” As it matures, a firm accumulates knowledge according to a process
defined by Arrow (1962) as “learning by doing,” which is likely to generate improvements in
TFP. “Learning is the product of experience. Learning can only take place through the
attempt to solve a problem and therefore only takes place during activity” (Arrow, 1962,
p.155). This suggests that a firm’s acquisition of knowledge does not just occur through mere
repetition in production, but also through solving the problems encountered. In addition, “as
plants age, managers accumulate experience, gain from learning by doing, undertake new
investments, or achieve economies of scale, all of which can improve plant-level
productivity” (Jensen et al., 2001, p. 323). Moreover, over time, firms become more
knowledgeable about the market in which they operate, and learn how to better satisfy their

40
customers’ needs, source inputs and process them. These developments are likely to result in
higher TFP. Jensen et al. (2001) also suggest another aspect of the relationship between TFP
and firm age. The authors argue that new firms entering an industry might have higher
productivity than existing ones. This is because the new firms might utilize more recent and
innovative capital that represents technological best practices. Thus, older firms are expected
to be less productive than younger firms because of the so-called “vintage effect.” Marshall
(1890) also suggests that older firms might be subject to inertia, rendering them unable to
adjust as quickly to the dynamic market environment as their younger counterparts. Hannan
and Freeman (1984) also argue that a firm’s negative performance is often due to the so-
called “inertia effect,” by which firms are unable to adjust their structures and strategies to
the dynamic environment, making them unable to exploit the opportunities the environment
offers. In summary, the above arguments suggest there is no unilateral relationship between
firm age and TFP. There can be a positive relationship due to the “survival effect,” or a
negative relationship due to either the “vintage” or “inertia” effects.
Jensen et al. (2001) studied the evolution of US labour productivity in manufacturing plants
from 1963 to 1992. The vintage effect was measured as the change in labour productivity of
newer plants compared with older ones when entering their respective industry. The survival
effect was measured as the change in labour productivity of existing plants over time. Both
effects were found to contribute to the overall growth in manufacturing industry labour
productivity. In particular, the higher productivity of newer plants compared to older plants
suggests that newer plants bring with them the latest best practice technology, pointing to the
existence of the vintage effect. At the same time, Jensen et al. (2001) also demonstrate the
existence of the survival effect, as plants that were already in an industry became more
productive over time.
Majumdar (1997) looked at a sample of 1,020 Indian firms to analyse the impact of firm size
and age on productivity and profitability over the period of 1998-1994. Firm age was
measured as the number of years that a firm’s data had been recorded in the database. The
findings suggest that older firms are more productive than younger ones, while being less
profitable. From these results, one would infer that the more a firm matures, the more
productive it becomes. This suggests that older firms learn by doing as they become more
experienced. Consistent with Jensen et al.’s (2001) study, this suggests the existence of a
survival effect. However, India has a different institutional setting than the US that is
characterised by greater barriers to entry and exit.

41
In another study in a developing country, Fernandes (2008) looked at 575 large
manufacturing firms in Bangladesh belonging to five different manufacturing industries and
found a non-linear relationship between firm age and TFP. This finding suggests that firms
are likely to start at a low productivity level that then increases over time as the firms “learn”
by undertaking investments, entering into new markets, and updating their technology. At a
certain age, the firms reach a “maturity stage,” from which their productivity decreases as
their stock of knowledge erodes and becomes obsolete.
In the developed country context, and using a much wider sample than the above studies,
Coad et al. (2013) analysed the relationship between firm age and various measures of
performance. This was done with a sample of 62,259 Spanish manufacturing firms over the
years of 1998-2006. Similar to Fernandes (2008), Coad et al. (2013) find that as firms age,
they improve their productivity level in addition to experiencing increased profits, growth in
size and lower leverage. On the other hand, at a certain age, firms start to experience
worsening performance in terms of productivity growth, sales, and profitability.
Within the Chinese context, only two studies have examined the relationship between firm
age and TFP. Zheng et al. (2003) analysed the technical efficiency performance of 600 State-
owned enterprises belonging to 17 two-digit industries located in four provinces during the
period of 1990-1994. The estimation was conducted using both a Data Envelopment Analysis
approach and a Malmquist index of productivity growth. Among the explanatory variables
analysed, firm age was included. This was found to significantly and positively affect firms’
technical efficiency.
While Zheng et al. (2003) focused only on Chinese firms, Hsieh and Klenow (2009)
compared Chinese and Indian firms to US firms. In examining the impact of resource
misallocation on firms’ TFP, the impact of firm age on productivity was also considered.
Their results indicate an inverted U-shaped relationship between firm age and productivity, as
productivity rose in the youngest 10% of Chinese firms and then remained flat before falling
for the oldest 10% of Chinese firms.
The above empirical evidence on the relationship between firm age and TFP suggests that
firms enter an industry with the best practice technology available, which is likely to result in
higher productivity. Then, up to a certain point, the effect of age on TFP is likely to be
positive as firms learn by experience. By solving issues in the production process, and
learning from them, firms are likely to experience enhanced TFP. In addition, a firm is likely
to better understand the market environment in which it operates over time. Such
understanding enables the firm to better satisfy customer needs and to source better inputs,
42
both of which are likely to result in higher TFP. However, as firms mature, the effect of age
on TFP becomes negative due to struggles in adapting to the dynamic and uncertain external
environment and keeping up with both industry best practices and new technologies. While
the literature related to China is scant, it indicates the existence of a positive relationship
between age and TFP for State-owned enterprises, and a non-linear relationship for firms
with other kinds of ownership structures.
Until now, knowledge has been represented by R&D expenditure and age. Alternatively,
knowledge can be also represented by a time trend, or Hicks-neutral technical change. This
refers to the positive impact on TFP arising from an exogenous technological change that
affects all firms at the same time. Such a situation generates an increase in TFP while the
ratio of the marginal product of capital to the marginal product of labour remains constant for
a given capital to labour ratio. The Hicks-neutral technical change must not be confused with
either the Harrod or Solow-neutral changes. A Harrod-neutral technical change is labour
augmenting, where relative factor shares are constant for any capital to output ratio. A Solow-
neutral technical change is capital augmenting, whereby relative factor shares are constant for
any labour to output ratio.
In summary, the above discussion suggests that knowledge is a valuable determinant of total
factor productivity. Knowledge can be represented in various ways. Firstly, a firm can
commit funds to R&D, which would result in higher TFP in two distinctive ways. One is
through product and process improvements. The second is through the development of
absorptive capacity, which enables a firm to exploit external knowledge for productive
purposes. The empirical literature analysing Chinese firms indicates that privately financed
R&D directly affects TFP in a positive manner, while government financed R&D directly
affects TFP negatively but indirectly affects it positively by promoting private R&D
expenditure. Secondly, a firm is expected to acquire more knowledge and therefore become
more productive over time through experience. This is according to the process of “learning
by doing,” whereby a firm becomes better at production by solving issues encountered in the
process. In addition, the firm becomes more knowledgeable about the market in which it
operates, enabling it to better satisfy its customers’ needs and to source better inputs, both of
which are likely to result in higher TFP. However, a positive effect of a firm age on TFP is
not always present. An older firm might become slower to adapt its characteristics and
strategies to the market or to keep its technology up to date with industry best practices. Such
conditions are likely to result in lower TFP. Moreover, new industry entrants are more likely
to utilize the latest technology available, thus making them more productive than firms
43
already established within an industry and forcing the older firms to exit. This suggests that
the relationship between age and TFP can also be negative. In the Chinese context, the
literature is still scant but it indicates the existence of a positive relationship between age and
TFP for State-owned enterprises, and a non-linear relationship for firms with other kinds of
ownership structures. In addition to R&D and age, knowledge can be also represented by the
time trend, or the Hicks-neutral technical change, which is the impact on TFP of exogenous
technology that affects all firms at the same time.
This section has discussed knowledge as a determinant of firms’ total factor productivity. The
next section discusses firms’ political affiliation.
2.4.2. Political Affiliation
“A company is connected with a politician if one of the company’s large shareholders or top
officers is: a member of parliament, a minister or the head of state, or closely related to a top
official” (Faccio, 2006, p. 370). In the literature, politically affiliated firms have been found
to enjoy significant advantages over non-politically affiliated ones.
Firstly, politically connected firms tend to benefit in terms of preferential access to credit.
Such was suggested by Johnson and Mitton (2003), who looked at a sample of 424 Malaysian
firms over the period of 1997-1998 and found that the imposition of capital controls
following the onset of the Asian financial crisis largely benefited firms linked to the country’s
then prime minister. Dinç (2005) compared the actions of government-owned banks with
those of private banks in 43 major emerging markets during general elections in the years of
1994-2000. The results suggest that government-owned banks increase their lending during
election years compared to private banks. Such increases were mainly attributed to political
motivations.
Secondly, politically affiliated firms tend to benefit from government contracts. Goldman et
al. (2013) examined the importance of political connections in the United States by analysing
a sample of companies belonging to the S&P500 before and after the 1994 midterm and 2000
general US elections. Their results show that companies with connections to the winning
party tend to experience an increase in procurement contracts.
Thirdly, politically connected firms also benefit in terms of regulatory protection. This is
suggested by the results of Kroszner and Stratmann (1998), who investigated the relationship
between competition among three rival interests groups and its effect on contributions made
to legislators from the US financial services industry. While abovementioned studies are
focused on single countries, Faccio (2010) analysed the differences between politically

44
connected and non-politically connected firms in a sample of 16,191 companies across 47
countries. Her findings suggest that politically connected firms, in comparison with non-
connected ones, have higher leverage, lower taxation, poorer accounting, greater market
power, lower ROA and lower market valuation. Moreover, differences with non-politically
corrected firms were found to be wider when the firms are based in countries characterised by
high corruption, and when political connections are closer, as it is the case for connections
with company owners and ministers.
The above empirical results suggest that politically connected firms are likely to benefit from
preferential access to credit, government contracts, regulatory protection, and lower taxation.
Since such benefits make it easier for a firm to operate, political connections are likely to
result in higher TFP levels.
China can be distinguished from other transition economies due to its continuous Communist
Party leadership, whose membership includes connections with key figures, both political and
economic (Li et al., 2008). In the Chinese context, a political affiliation is a lishu relationship
between a firm and any level of government (Li, 2004; Tan et al., 2007; Xia et al., 2009). The
empirical evidence is mixed, suggesting that political affiliations have both positive and
negative effects on Chinese firms’ performance.
Li et al. (2008) studied more than 2,000 private Chinese firms to examine whether
Communist Party membership positively affects firms’ profitability. Their results indicate
that membership in the Communist Party positively affects private firms’ profitability,
particularly in regions with less developed markets and legal systems. Political affiliation
enables private firms to overcome the legal, institutional and ideological barriers that are set
up against private ownership in China. Moreover, the results suggest that politically
connected private firms benefit in terms of higher availability of loans. Although this study
provides an insight into the effect on of political connections firm performance, it is limited
to private firms. A following study might also consider analysing such an effect on other
kinds of firms, such as State-owned firms. In addition, the study only analysed the effect of
political connections on firms’ profitability measures, not considering TFP.
While the above study focused only on private enterprises, Wu et al. (2012) also analysed
State-owned enterprises (SOEs). Specifically, they examined the effect of political affiliation
on the performance of both SOEs and private firms (as measured by Tobin’s Q and ROA) for
1,408 firms between 1999 and 2007. In their study, a firm’s political connectedness was
represented by a dummy variable taking the value of 1. A firm was regarded as politically
connected if either the Chairman or CEO had worked in the Chinese government or the

45
military. The results indicate that private firms with politically connected managers tend to
record better performance than firms without such connections. In contrast, local SOEs with
connected managers recorded worse performances than those with non-connected managers.
In addition, private firms with connected managers tend to benefit from tax incentives, while
local SOEs with connected managers tend to be subject to overinvestment issues.
Although the two measures of performance adopted in the previous two studies are valuable,
TFP could have also been considered, as it indicates the extent to which inputs are
transformed into valuable output. Du and Girma (2010) evaluated the effect of political
connections on the survival and growth prospects, as well as the TFP growth, of 106,000
private Chinese enterprises. The authors represented the extent of political connectedness
through a vector of three binary variables representing affiliation with local, prefecture or
town level, and regional or central government agencies. Their findings suggest that
politically connected Chinese firms have a higher chance of survival and higher employment
growth. Moreover, firms associated with local and high levels of government, and which
belong to capital-intensive industries, seem to benefit most from political connections.
However, firms without political affiliation seem to display better productivity growth. This
suggests that there might be cases in which political connections are not beneficial to a firm’s
performance. It might be that a political affiliation makes a firm less likely to focus on
maximising productivity than pursuing objectives that are politically motivated.
This section has discussed political affiliation as a determinant of a firm’s TFP. The
discussion indicates that politically affiliated firms tend to enjoy substantial benefits over
non-politically affiliated ones. The empirical results from the literature suggest that politically
connected firms are likely to benefit through preferential access to credit, government
contracts, regulatory protection, and lower taxation. Such benefits make it easier for a firm to
operate, likely resulting in higher TFP. For Chinese firms in particular, the empirical
evidence is mixed, suggesting that political affiliation has both positive and negative effects
on performance. The only study concerning the effect of political affiliation on Chinese
firms’ TFP documents a negative relationship, although the analysis was limited to private
firms. While the consideration of firms with other kinds of ownership structures would
provide additional insights into this relationship, the study points that political affiliation
might not be beneficial to a firm’s productivity.

46
2.4.3. Foreign Direct Investment
While the previous two sections reviewed the importance of knowledge and political
affiliation as determinants of TFP, this section discusses a firm’s ownership and focuses on
foreign direct investment (FDI). A foreign-owned firm is expected to have a higher TFP than
firms with other kinds of ownership. According to the internalisation or transaction cost
theory developed by Coase (1937) and Williamson (1981), foreign-owned firms enter into
new markets when they have firm-specific advantages to exploit. A foreign-owned firm will
be likely to make such a decision if it expects the future benefits to outweigh the related costs
of entry. Suyanto et al. (2009) argue that domestic firms have a better performance within
their domestic markets than foreign-owned firms. Thus, foreign-owned firms require a
comparative advantage in order to compensate for the lack of experience within a new market
and the sunk costs of entry. Such advantages can include better technology, know-how,
superior managerial practices, and innovative marketing techniques, among others. For
example, a foreign-owned firm may use more innovative machinery than local firms, or have
managers who are able to select a better combination of factor inputs. For these reasons,
foreign-owned firms are likely to be more productive than local ones.
For example, a foreign-owned firm’s investment into a domestic firm is likely to either
directly or indirectly lead to higher productivity in the domestic firm. The effect is direct
when the local plant or firm in which the foreign-owned firm has invested benefits directly
from the comparative advantage brought by the foreign owner. One instance is when a local
plant benefits from the adoption of more advanced technology that the foreign owner has
brought as part of the investment contract.
Caves (1974) suggests that, in addition to its direct effects, FDI can also indirectly affect
domestic firms’ TFP. This occurs when there are spillovers from foreign-owned plants to
domestically owned ones. Regarding the channels through which FDI is transmitted
indirectly through spillovers, Crespo and Fontoura (2007) mention five:
imitation/demonstration, labour mobility, exports, competition and linkages with domestic
firms. Firstly, imitation/demonstration concerns local firms’ adoption of the innovations used
by foreign firms. These innovations can take various forms, such as innovative machinery,
better managerial practices or improved input allocation. Such improvements enable a local
firm to reduce costs and produce more and better output, which might ultimately result in
higher TFP. Secondly, labour mobility concerns the development of a highly-skilled labour
force by a foreign owner, which will improve TFP through the spread knowledge to other
parts of the business. Thirdly, local plants can also benefit from the export activity that a

47
foreign owner brings, as it is most likely to be a multinational firm. Since a foreign-owned
firm has knowledge of international markets, local firms can follow its lead, for example, in
learning about trading strategies or setting up new trading ventures. Fourthly,
competitiveness increases for a plant or firm, as managers undertake measures to address
threats from both potential and actual competitors. Moreover, the entrance of a new firm
causes a reallocation of output shares within an industry. This is because the least productive
firms will exit an industry, while the most productive ones will survive and even capture
higher market share. This could result in increased TFP for the entire industry. Lastly,
spillovers can also be transmitted through the development of commercial relationships, or
linkages, between foreign-owned and local firms. Such relationships can include backward
linkages, where the local firms are suppliers to the foreign-owned ones. Local firms, for
example, can benefit in terms of learning from the feedback provided by foreign customers
concerning the products supplied. Commercial relationships can also involve forward
linkages in which foreign-owned firms are suppliers to the local firms. In this example, the
local firms can benefit from the higher quality of inputs supplied. In addition, in any
commercial relationship, foreign-owned and local firms can share both tangible and
intangible assets, such as know-how and R&D efforts, in order to improve not just their
products but also their work processes and techniques.
Based on the above discussion, it seems that FDI is likely to benefit firms in terms of higher
TFP levels. In some cases, this benefit can be direct, for example, in those firms that a foreign
owner has invested in. In other cases, the benefit can be indirect through spillovers, which
manifest themselves through different channels such as imitation/demonstration, labour
mobility, exports, competition, and backward or forward linkages.
The empirical research has provided mixed results. Some studies suggest that FDI positively
affects productivity. For example, Harris (2002) studied the direct effect of foreign ownership
on the TFP of firms belonging to the motor vehicle industry and four other British
manufacturing industries (Pharmaceuticals, Electronic Data and Processing Equipment,
Aircraft Equipment Manufacture and Repair, and Miscellaneous Foods) for the years 1980-
1992, using both plant and establishment data. In the study, foreign ownership was measured
as a vector of dummies, each taking a value of 1 according to the geographical origin of each
firm’s owner (US, EU, or Old Commonwealth Enterprise). The results indicate that foreign-
owned plants are more productive than UK-owned plants. In particular, at both the
establishment and plant levels, plants owned by US and EU firms were more productive than
local ones within the motor vehicles sector. In the other four industries, plants owned by US

48
firms were found to be more productive than local plants, while those owned by EU firms
were not found to be more productive than local plants.
Harris and Robinson (2002) analysed plants in the UK manufacturing sector during the
period of 1987-1992. They looked at the difference in TFP performance between plants that
had changed ownership and plants that had not, and particularly at the difference in TFP
performance between foreign-owned and domestic-owned plants. In the estimation
methodology used, foreign ownership was indicated by a dummy variable that took the value
1 if a firm was foreign-owned and 0 otherwise. Surprisingly, the findings indicate that foreign
owners acquired the most productive domestic plants, whose TFP subsequently decreased
after the acquisition. The authors suggest that this decline in TFP might be due to post-
acquisition organisational difficulties. From this study, one can infer that foreign ownership
of a plant may not always result in higher TFP. Foreign firms might acquire plants that have
higher efficiency and better technology than their own plants, which will likely benefit the
foreign owner. However, it might prove difficult for foreign owners to integrate their
operations, organisation, and culture with those of the new plant, likely resulting in a
decrease in TFP.
A more general study was done by Harris and Robinson (2003), where they analysed the
direct effects of foreign ownership on TFP using plant-level data from firms belonging to 20
UK manufacturing industries in the period of 1974-1995. In general, foreign-owned plants
were found to be more productive than UK-owned ones. Foreign-owned plants were found to
positively impact TFP within the UK manufacturing sector by pushing local plants to “catch
up” with best practices. While plants owned by US firms were found to be more productive
than local ones in most sectors, this productivity advantage seemed to decline over time. EU-
owned plants were found to record better performance than UK-owned ones in some
industries, while showing poorer performance in others. In addition, the TFP of EU-owned
plants was found to decline over time, suggesting that they do not necessarily have better
performance than UK-owned ones. Mixed effects were found for plants owned by Old
Commonwealth and South East Asian countries. These results suggest that foreign-owned
firms bring with them a comparative advantage that enables them to become more productive
than local firms.
Regarding the Chinese context, Zhou et al. (2002) analysed the direct effect of FDI on
Chinese firms’ productivity during the period of 1992-1995. The sample was taken from the
NBS and comprised 450,000 firms representing 90% of China’s total national industrial
output. However, the sample only included medium and large firms. Firm performance was
49
measured as value added per employee. Despite the usefulness of this measure, a more
valuable measure would have been TFP, as it considers all inputs utilized within a firm’s
production processes. Using OLS estimation, their results suggest that firms based in
geographical regions characterised by higher levels and a longer presence of FDI tend to have
higher productivity than firms in areas with lower levels and a shorter existence of FDI. On
the other hand, firms belonging to industries characterised by high levels and a longer
existence of FDI tend to have lower productivity. Based on these results, FDI seems to exert
opposing effects on domestic firms, depending on whether they belong to a high-FDI region
or a high-FDI industry.
Zhang et al. (2001) compared productivity levels between SOEs and firms with other
ownership structures in a sample of 2,000 firms from 22 industries during the period of 1996-
1998. The empirical analysis was conducted using the data envelopment analysis (DEA)
methodology, which computes firms’ efficiency scores and compares them with the best
practice in each related industry. Their results indicate that foreign-owned firms and firms
owned by investors based in Hong Kong, Macao and Taiwan recorded the highest efficiency
scores, while State-owned firms recorded the lowest. The effect of ownership on changes in
efficiency was also analysed using the Malmquist index, with the results showing that State-
owned firms recorded faster efficiency growth than both collectively-owned firms and firms
owned by investors from Hong Kong, Macao and Taiwan.
Jefferson et al. (2003) analysed the changing profile, in terms of composition and
performance, of a sample of 22,000 Chinese industrial large and medium-size firms during
the 5-year period between 1994 and 1999. In terms of productivity growth, the statistical
results indicate that State-owned shareholding firms recorded the lowest performance,
followed by overseas, other domestically owned, collectively owned, foreign owned and
privately owned firms. In terms of TFP levels, at the end of 1999, the least efficient firms
were SOEs, followed by shareholding, privately owned, collectively owned, overseas and
foreign owned firms.
Zhang et al. (2003) examined the effect of ownership on the R&D efficiency of 8,341
Chinese industrial firms. Ownership was found to play an important role in both R&D and
production efficiency. The findings indicate that foreign owned firms are the most efficient,
while SOEs are the least efficient. Foreign owned firms and firms owned by investors from
Hong-Kong, Macao and Taiwan seemed to record both higher technical efficiency and
productive efficiency than collectively owned and joint-stock owned firms. The higher R&D

50
efficiency that characterises foreign-owned firms seems to be due to higher R&D intensity,
and tends to result in higher firm productivity.
The above literature review has suggested that FDI has a positive effect on firms’ TFP. This
means that foreign-owned firms are more productive than domestically owned firms due to
the advantages brought to the firm by the foreign owner, such as better technology, know-
how, superior managerial practices, and innovative marketing techniques. While the
abovementioned studies have analysed the direct effect of FDI on firms’ TFP, other studies
have analysed the indirect effects that occur through spillovers from foreign-owned plants to
the local ones. Crespo and Fontoura (2007) suggest that FDI spillovers can be transmitted
through five channels: imitation/demonstration, labour mobility, exports, competition, and
through commercial relationships, or linkages, with domestic firms. In general, the empirical
research seems to provide support for the existence of an indirect effect of FDI on TFP.
Harris and Robinson (2004) used the same dataset as in their previous study (Harris and
Robinson, 2003) to analyse the indirect effect of FDI on the TFP of firms belonging to 20 UK
manufacturing industries. They considered both intra-industry effects through competition,
inter-industry effects through forward and backward linkages, and spatial agglomeration
effects. Their results suggest that for most industries, there are no effects of FDI on TFP
through spatial agglomeration spillovers. In the industries where the effect does exist, it is
both positive and negative, suggesting the existence of both economies and diseconomies of
scale. Inter-industry indirect FDI spillover effects due to backward and forward linkages were
positive for some industries and negative for others. Regarding intra-industry indirect FDI
spillover effects, no significant impact was seen in more than a third of industries. Where an
impact did exist, it was in some cases positive and in other cases negative. These results seem
to question the impact of indirect FDI spillovers on firm TFP, as there is no clear effect seen.
Further analysis is needed to confirm these results.
Girma and Wakelin (2007) analysed the indirect effect of FDI on TFP in the UK electronics
sector in 1980 and 1992. They separated FDI by the nationality of the multinational firm,
which was either American or Japanese. Moreover, they evaluated the different effects of
FDI in regions where government assistance was available compared to those where it was
not. The type of FDI was denoted by a variable with three variants: one denoting regional
intra-industry spillovers; one denoting inter-regional intra-industry spillovers; and one
denoting local inter-industry spillovers. Their findings suggest a generally positive indirect
effect of FDI on TFP through regional spillovers, both intra-industry and inter-industry.
However, they did not find any evidence of inter-regional spillovers on plants belonging to

51
the same sector. In addition, plants located in areas where government assistance was
provided were not found to particularly benefit from FDI, suggesting that the domestic plants
do not possess adequate absorptive capacity to benefit from FDI spillovers.
In addition to horizontal FDI spillovers, Suyanto et al. (2009) considered the effect of the
competition channel in their investigation of the indirect effect of FDI spillovers for 568
firms belonging to the Indonesian chemical and pharmaceutical sectors from 1988 to 2000.
FDI was represented by a dummy variable that was equal to 0 when there was no foreign
ownership share and 1 if there was a positive share of foreign ownership. Their results
suggest the presence of intra-industry spillovers, which benefit firm TFP. Moreover, firms
that commit funds to R&D expenditures were found to benefit more so than those who do
not. This suggests that a firm with a relatively high level of absorptive capacity, as measured
by the stock of R&D, is likely to benefit more from spillovers than a firm with a relatively
low level. In addition, productivity spillovers were found to be higher in the presence of
competition, which was measured by an index representing the concentration of sales among
producers. These results suggest that competition stimulates firm managers to undertake TFP-
enhancing actions in response to threats from both actual and potential competitors.
Concerning the imitation/demonstration channel of FDI, Ben Hamida and Gugler (2009)
analysed the intra-industry spillovers from FDI using Swiss firm-level data on manufacturing
and services firms’ productivity in 1998 and 2001. Their focus was mainly on analysing the
effect of the demonstration channel of FDI spillovers on productivity, which was measured
by foreign firms’ sales share within an industry. In particular, how these shares of sales
varied according to the firm’s level of absorptive capacity was analysed. When the
heterogeneity of the firms in terms of absorptive capacity was not considered, the results did
not suggest the existence of spillovers. However, when this heterogeneity was taken into
account, FDI spillovers were shown to manifest themselves through the demonstration
channel for firms investing in R&D, which builds up absorptive capacity. This underlines the
idea that in order to benefit from FDI spillovers through the demonstration channel, firms
should aim to build high levels of absorptive capacity, for example, through R&D
investments.
Concerning the FDI spillover effect on productivity through the labour mobility channel,
Todo et al. (2009) analysed how multinational enterprises’ (MNEs) employment of workers
determined the spillover of knowledge to local firms. The analysis was conducted in a
Chinese high tech cluster using panel data for 798 manufacturing firms during the period of
2000-2003. The knowledge spillovers from MNEs were measured in two ways: the MNEs’

52
total labour force, and the number of educated workers. The results indicate the existence of
within-industry FDI spillovers through a labour-mobility channel, represented by the
employment of educated workers. The results suggest that labourers can learn by working for
technologically advanced MNEs, and when these workers move to domestic firms or set up
their own firms, they can apply their innovative knowledge and skills, resulting in higher
TFP. Despite providing interesting results, the analysis in this paper only concerned a
technology cluster, thus offering limited insight into the overall effect of FDI spillovers on
TFP through the labour mobility channel.
Also in the Chinese context, Liu (2008) examined the effect of FDI spillovers on the TFP of
medium and large Chinese manufacturing firms. Intra-industry spillovers were measured as
the sum of the average foreign equity share owned by foreign investors in each firm,
weighted by the firm’s share of sectorial output. Inter-industry spillovers were divided into
backward and forward linkages. Backward linkages were measured as the sum of firms’ FDI
within a sector, weighted by the share of intermediate output in another sector from which the
firms source their inputs. Forward linkages were given by the sum of firms’ FDI within a
sector, weighted by the share of intermediate output in another sector to which the firms sell
their inputs. The results of the study suggest that both intra-industry and inter-industry
spillovers have a positive effect on TFP. In particular, backward linkages were found to have
the strongest positive effect on firms’ TFP. This suggests that local firms can learn by
supplying foreign-owned firms with intermediate inputs, about which they might be asked to
provide very detailed specifications, and about which they will receive important feedback
from which to learn.
Xu and Sheng (2012) analysed how FDI spillovers affect the productivity of Chinese
manufacturing firms during the period of 2000-2003. Spillovers were divided into three
categories: horizontal (arising from firms within the same industry), backward (generated
when a firm supplies a multinational firm) and forward (generated when a firm sources its
inputs from a foreign supplier firm). Results from the estimation suggest that forward FDI
spillovers have a positive effect on firm productivity through the import of qualitative
intermediate goods and equipment by foreign firms belonging to the upstream sectors.
However, horizontal and backward FDI spillovers were found to negatively affect TFP.
Therefore, the overall results were not as positive as one might expect. Interestingly, the
firms that benefitted the most from a foreign presence were the large and medium-sized firms
not belonging to the state sector, and which were engaged in export activities. It would be

53
interesting to extend the time period of study, as firms might require more time to assimilate
knowledge gained from FDI.
A different approach to studying the effect of FDI spillovers was adopted by Fu and Gong
(2009). They included in their model R&D spillovers from innovation activities undertaken
by foreign-invested firms, measured by the industry average R&D intensity according to
ownership type, and international R&D spillovers, measured as the world R&D stock. FDI
intensity was measured at both the firm and industry levels. As in previous studies, the
dataset was taken from the Chinese National Bureau of Statistics. However, in this case, the
sample was much smaller, comprising 53,981 firms, while considering a wider period, from
2001 to 2005. The study’s results show that TFP grew at about 4.8% per year during the
period, mainly driven by technical change rather than changes in efficiency. Such growth
confirms the findings of previous studies. Moreover, the strong technical change occurred
particularly in industries dominated by domestic firms, suggesting that foreign-owned firms
possess advantages, such as better managerial practices and knowledge, that result in higher
TFP. In terms of R&D, investment activities undertaken by foreign-invested firms were
found to negatively affect TFP, while those by domestic firms at the industry level were
found to positively affect technical change.
In a later study, Wei and Liu (2006) adopted a much different approach. The effect of FDI on
productivity was measured together with spillovers from R&D and exports, which represent
valuable sources of knowledge. FDI spillovers were measured as the share of foreign-owned
firms’ capital in the total capital in an industry, region, or industry within a region. Secondly,
the authors only focused on the impact of spillovers on domestic firms, rather than combining
firms with different origins. The sample comprised 9,900 Chinese manufacturing firms
during the period of 1998-2001, with the data taken from the Chinese National Bureau of
Statistics. In order to address the issue of endogeneity, the authors adopted one-year lags of
potential endogenous variables as instruments. In addition, the estimation was corrected for
both heteroskedasticity and autocorrelation. Interestingly, their results suggest a positive
effect on productivity of inter-industry spillovers from R&D and exports, and a positive
effect on productivity of both inter- and intra-industry spillovers from the presence of foreign
firms. Moreover, firms in which investors from OECD countries were major shareholders
were found to have higher productivity than those in which the investors were from Hong
Kong, Macao and Taiwan. This suggests that Chinese firms benefit in terms of spillovers
from firms in which investors from developed countries are the major shareholders, as these
firms are likely to have more advanced technology and up-to-date knowledge.

54
A study that found differing results from the previous ones was conducted by Hale and Long
(2011). They used a data set of Chinese domestic firms taken from a 2001 World Bank
survey that provides information on 1,500 firms located in 5 cities and 10 industries for the
year 2000. The presence of FDI within a specific city or industry was measured as the
average of foreign ownership share in the same city-industry as the domestic firm, weighted
by firm employment. Upstream FDI spillovers were measured as the sum of FDI presence in
all other industries in the same city, weighted by the input coefficients corresponding to the
firm’s industry. Downstream FDI presence was computed as the sum of FDI presence in all
other industries, weighted by the output coefficients of the firm’s industry to these other
industries. The results suggest that foreign-owned firms tend to be more productive than
domestically owned ones. The study represents a step forward from past studies analysing the
impact of FDI spillovers on productivity since it adopts different methodologies. However, its
limitation lies in not having a time dimension. It only provides a snapshot of productivity
performance at a specific point in time, rather than analysing a trend. Therefore, it would
have been better to extend the study over more years.
Another study by Wei et al. (2008) differs from the previous study in that it examined the
effect of reverse productivity spillovers in China, which refer to the positive effect of
knowledge from domestic firms on the productivity of multinational firm. The investigation
consisted of an econometric analysis of more than 10,000 firms belonging to 193 industries,
including both domestic and foreign-invested firms, during the period of 1998-2001. To
measure spillovers, the authors used R&D, capital investment and employment. Moreover,
the firms were differentiated according to their origin: Chinese domestic firms; Hong Kong,
Macau and Taiwan-invested firms; and OECD-invested firms. The results from the
econometric estimation suggest that foreign-invested firms exert a positive but diminishing
spillover effect on the productivity of local Chinese firms. These local firms, in turn, tend to
exert a positive but diminishing spillover effect on the productivity of foreign-invested firms.
Therefore, the results suggest that domestic and foreign-invested firms complement one
other. Although the study provides an innovative insight into reverse spillovers in a
developing country by using a wide sample, the time period considered seems short, as firms
might need more time to learn and productively implement the knowledge acquired.
While the abovementioned studies have looked at the spillover effect arising in a variety of
industries, Motohashi and Yuan (2010) analysed the spillover effects arising from the
innovative activities of multinational firms in two industries: automobiles and electronics.
Data from 22,000 firms was taken from the annual Survey of Science and Technology

55
Activities, which includes medium and large firms from 1995 to 2004. Spillovers were
measured using four variables: (i) the sum of technology stock of multinational firms in the
assembly sector of each province in a specific year; (ii) the sum of technology stock of local
firms in the assembly sector of each province in a specific year; (iii) the sum of technology
stock of multinational firms in the supply sector of each province in a specific year, excluding
one of the firms considered; and (iv) the sum of the technology stock of local firms in the
supply sector of each province in a specific year, excluding one of the firms considered. The
automobile industry showed vertical spillovers from multinational and local firms in the
assembly industry to local suppliers. In the electronics industry, on the other hand, vertical
spillover effects were only seen only from local firms in the assembly industry to local
suppliers. The presence of horizontal spillovers was not detected. Among the control
variables, the import of technology and research collaboration were found to positively affect
the value of firms. This study, like previous ones, suggests a mixed effect of vertical
spillovers. However, in contrast to the previous studies, it does not suggest the existence of
horizontal spillovers. This finding may an anomaly due to the study limiting its analysis to
two industries.
Li et al. (2001) analysed the indirect effect of FDI spillovers and competition arising from the
presence of foreign firms on labour productivity. Data for the manufacturing sector was taken
from the 1995 Industrial Census of the National Bureau of Statistics. Since labour
productivity is not an ideal measure, it would have been better to adopt TFP. In the equation,
FDI spillovers from demonstration and contagion effects were represented by two variables
measuring the ratio of the foreign firms’ employment to total employment, and the ratio of
foreign firms’ assets to total assets. Moreover, FDI spillovers through competition were
measured by the labour productivity of the other firms in the sample. The study’s results
suggest that spillovers have different positive effects on firms. Spillovers positively affect
SOEs through competition effects, and positively affect the other local firms through
demonstration and contagion effects.
Lin et al. (2009) studied the effects of both horizontal and vertical FDI spillovers through
backward and forward linkages on Chinese manufacturing firms’ TFP during the period of
1998-2005. Horizontal spillovers were measured as the foreign share in the total output of
each industry. Backward spillovers were measured by the proportion of the output of one
industry purchased by another industry. Forward spillovers were measured as the foreign
share of an industry’s intermediate input that was supplied by another industry. The results
support the existence of vertical forward spillovers, meaning that local firms are likely to

56
benefit indirectly in terms of higher TFP from FDI spillovers through relationships with
foreign-owned suppliers. However, vertical backward spillovers seemed only to exist for
firms whose foreign owners were not from Hong Kong, Macao or Taiwan. This result
suggests that local firms are likely to benefit indirectly from FDI spillovers in terms of higher
TFP by supplying foreign-owned firms. Moreover, foreign-owned firms from countries
belonging to the Organisation and Economic Co-operation Development (OECD) are likely
to have higher requirements for products supplied, pushing local firms to improve their
products and processes and thus increasing TFP. Regarding horizontal spillovers, FDI
spillovers generated by owners from Hong Kong, Macao or Taiwan negatively affected TFP,
while spillovers generated by owners from OECD countries positively affected TFP. The
results indicate that Chinese firms learn from OECD foreign-owned firms belonging to the
same industry, which are likely to be more advanced technologically.
The studies described above, from both outside and within the Chinese context, suggest that
FDI indirectly contributes to TFP through intra-industry and inter-industry spillovers, R&D
and other innovative activities, and competition. The empirical evidence complements
previous evidence suggesting a positive direct contribution of FDI to firms’ TFP. It could
thus be inferred that FDI is a positive determinant of TFP. However, this does not seem to
always be the case. According to Driffield and Love (2007), FDI might result in lower
productivity for the following reasons.
Firstly, FDI might be aimed at accessing technology owned by local firms belonging to
R&D-intensive sectors or to research centres through a process of technology sourcing. This
suggests that a foreign firm may extract local technology through FDI, transferring it to its
home country and thus not generating any direct or indirect benefits to local firms in terms of
TFP. Secondly, a foreign-owned firm might undertake FDI in a particular country due to
location advantages such as low taxes. Thirdly, a foreign-owned firm might undertake FDI to
seek efficiency by exploiting cheaper local factor inputs, through an “efficiency seeking”
process. For example, a firm might invest in a firm based in a developing country because of
low labour costs. Fourthly, FDI could also result in lower TFP due to the “market stealing”
effect discussed by Aitken and Harrison (1999). This occurs when a foreign firm generates
higher TFP in its related industry through positive spillovers effects, but which is negatively
offset when the foreign firm steals market share from local competitors, leading to lower
industry TFP. Fifthly, Harris and Robinson (2003) argue that in the short run, difficulties can
be caused by cultural differences between foreign owners and local workers. For example, a
foreign firm that acquires a plant is likely to bring a new culture and management practices

57
that contrast with the existing ones, which might negatively impact TFP in the short run.
Harris and Moffat (2011) also argue that TFP performance might differ according to the form
of investment the foreign firm undertakes, which can be through a “greenfield” or a
“brownfield” plant. Greenfield plants provide the firm with the freedom to bring its own
management practices, culture and production techniques, among the various factors.
However, they do not enable a firm to source any technology. Brownfield plants, on the other
hand, provide a firm with local technology. However, a foreign owner will bring a new
culture that is likely to contrast with the existing one. Lastly, when a firm acquires new
technology, it must devote its resources to assimilating the technology and learning to use it
productively. For example, when a local automotive firm adopts the working processes of a
foreign-owned firm, these processes are not likely to be implemented immediately. There
might be a period of adjustment in which all of the parties involved learn about the new
procedure. Moreover, even when a new technology is implemented, it might take additional
time for workers to become familiar with it. Thus, in the short term, FDI can have a negative
effect on firms’ TFP. This idea is supported by some results in the empirical literature.
Driffield and Love (2007) analysed this topic using a dataset of FDI flows from 30 different
countries to 11 manufacturing sectors over the period of 1987-1997. A lagged measure of
FDI was used to represent the effect of FDI externalities on TFP. This was then combined
with four binary dummy variables, each representing a different motivation for undertaking
the FDI. The findings indicate that inward FDI in the UK manufacturing industry has a
positive effect on firms’ TFP, but only when the motive for undertaking the FDI is the
ownership advantage. Inward FDI motivated by local technology sourcing or efficiency
seeking was found to have a negative impact on TFP.
Other empirical results indicate the existence in some cases of the previously mentioned
“market stealing” effect, according to which the positive spillover effect exerted by FDI is
negatively counterbalanced by the foreign firm stealing market share from local competitors.
This might ultimately lead to decreased TFP. Aitken and Harrison (1999) looked at a sample
of 4000 Venezuelan firms over the years of 1976-1989 and analysed whether foreign-owned
firms display higher productivity than local firms and whether FDI spillovers to other firms
occur. The direct effect of FDI was measured as the share of foreign equity at the plant level.
The indirect spillover effect was measured as the average share of foreign equity for all the
plants within each sector, weighted by each plant’s contribution to employment in the sector.
In addition, the authors included a variable combining FDI at the plant and sectorial levels in
order to measure the effect of FDI on joint ventures. A positive direct effect of FDI was

58
found only for small firms, while a negative indirect effect was found for large firms,
suggesting that foreign firms invest in the most productive local firms. It seems that the
higher the FDI, the lower the productivity of domestic firms, suggesting the existence of a
market-stealing effect. Since they are more productive, foreign-owned firms might gain
market share at the expense of local firms, thus “stealing” customers and causing a decrease
in the productivity of the overall industry.
FDI also negatively affects firms’ TFP when it takes time to assimilate foreign-brought
technology and to use it productively. This idea is supported by the study of Liu (2008),
which analysed the effect of FDI spillovers through the imitation channel on Chinese
manufacturing firms’ rate of growth and level of TFP. Liu’s findings suggest a positive
indirect effect of FDI on firms’ TFP level in the long run and a negative effect on TFP growth
in the short run. These results indicate that there are cases in which firms take time to
assimilate a new technology and use it productively.
In summary, this section has analysed the importance of ownership, and especially FDI, for
firms’ productivity. The results from the empirical literature suggest that FDI has both direct
and indirect effects. The effect is direct when a local firm in which a foreign firm has
invested benefits from the technology brought, superior know-how, or innovative managerial
practices and machinery. The effect is indirect when a local firm in which a foreign firm has
not invested but is based in the same geographical area benefit from technology spillovers.
These seem to occur through five different channels: imitation/demonstration, labour
mobility, exports, competition, and commercial relationships, or backward and forward
linkages, with domestic firms. It has also been suggested that in order for a firm to receive the
greatest benefit from the indirect effects of FDI, it must have absorptive capacity, or the
ability to absorb and utilise knowledge for productive purposes. A firm with a higher level of
absorptive capacity is likely to be more productive than a firm with a lower level.
However, there are cases in which FDI does not generate a positive effect on TFP. For
example, such is the case when a foreign firm is more interested in sourcing superior local
technology, seeking efficiency from low input costs or placing its plants in an advantageous
low-tax location. In addition, it has been suggested that FDI might have short-term negative
effects on productivity due to the “market stealing” and “technology learning” effects.
Moreover, a clash of cultures between a foreign owner and local foreign-invested firm might
hinder improvements in productivity.
59
2.4.4. Economies of Scale
In general, a firm can achieve economies of scale by increasing the quantity of output
produced while decreasing the cost per unit of output. Differing from economies of scale are
economies of scope. These are achieved by a firm when, by jointly producing a range of
different products, the costs per unit of output are lower than would be if each kind of output
was produced individually. Economies of scale can be distinguished between internal (related
to a firm having an individual plant) and external (related to a firm having multiple plants).
Internal economies of scale do not directly affect TFP, but rather do so indirectly. In equation
(2), TFP is expressed as the ratio of output produced to inputs utilised in the production
process. TFP is not affected directly by internal returns to scale (𝛽𝑙 + 𝛽𝑐) because any change
in the denominator on the right-hand side of (2), which represents a change in factor inputs
utilised, is reflected by a change in the related numerator, which represents a change in output
produced, maintaining 𝐴𝑖𝑡 unchanged.
Internal economies of scale mainly arise from indivisibilities, specialisation, and greater
efficiency of large machines. Indivisibilities refer to the fact that a minimum quantity of
indivisible inputs is required for a plant to function. These constitute fixed costs because,
regardless of the input level, the plant must pay for them in order to operate. When a plant
increases the amount of output it produces, these fixed costs can be spread over more output,
thus reducing the cost per unit of output. Specialisation concerns the role of workers within a
plant. When a plant has a relatively low scale, a worker is likely to undertake many different
tasks, reducing his or her efficiency and leading to higher costs per unit of output. For
example, in a small plant, the director is likely to perform both manual and administrative
tasks. When a plant’s scale increases, the director might focus on just the administration
while delegating the manual tasks to a deputy. This is likely to result in higher efficiency and,
therefore, lower costs per unit of output. Economies of scale can arise from the greater
efficiency of large machines because they can transform inputs into more outputs. This
allows the plant to operate at higher capacity, reducing the costs per unit of output. For
example, if an automotive plant increases its scale by raising the number of vehicles it
produces, the increased output of its large machinery will lower the costs per units of output.
However, a plant can also experience diseconomies of scale if increasing the quantity of
output produced causes the costs per unit of output to rise. When they occur within a specific
plant, diseconomies of scale are internal. They might be due, for example, to the inability of
managers to lead a plant that has become either too large or complex, indirectly causing a
decrease in productivity.

60
External economies of scale can arise when a firm has multiple plants. According to Baldwin
et al. (2010), “multi-establishment firms may be better able to collect and analyse information
that can improve management practices and thus raise productivity” (p. 921). Harris and
Moffat (2011) suggest five other additional reasons why multiple plants lead to economies of
scale. Firstly, a multi-plant firm has plants located in its clients’ markets; thus, by being
closer to clients, transportation costs are reduced. A multi-plant firm is also likely to adapt
more quickly to the market in which it operates and to better respond to client needs,
compared to single-plant firms. Secondly, central services such as human resources, research
and development, marketing, and sales are likely to be shared across plants, thus providing
the benefit of spreading fixed costs across plants. Thirdly, the burden of excess capacity is
likely to be spread across plants rather than being concentrated within a single plant, thus
benefiting the firm as a whole. Fourth, as they are more geographically diversified, multi-
plant firms are likely to have access to less costly sources of funding than single-plant ones.
Lastly, as Harris and Moffat (2011) argue, Jarmin’s (1999) “Government Technical
Assistance Programs and Plant Survival: The Role of Plant Ownership Type” suggests that
multi-plant firms have easier access to information compared to single-plant ones since
technology is shared among multiple plants. For example, a technological advancement
achieved in one plant might be successfully applied in another plant.
However, there are also reasons why multi-plant firms may be at a disadvantage with respect
to single-plant firms. Firstly, since single-plant firms concentrate production in one
geographical location, they are likely to have higher productivity than multi-plant firms.
Secondly, as argued by Leibenstein (1966), managers of multi-plant firms might face
difficulties in allocating resources among plants. For example, resources that would
otherwise be used more effectively by the most productive plants might instead be allocated
to the least productive ones. Thirdly, as multi-plant firms are likely to be multinational
enterprises (MNEs) in which ownership and control is separated, managers might not have
the right motivations in terms of remuneration and incentives, making them less likely to
make decisions aimed at improving productivity. Managers of single-plant firms, on the other
hand, are more likely to also be owners who bear more risk, and thus their decisions would be
aimed at improving productivity. Fourth, the greater complexity of multi-plant firms makes
them more difficult to manage. Such can be the case when a firm has plants based in different
markets, or produces a wide product range. Fifth, since they are less complex from an
organisational point of view, single-plant firms are likely to be faster in decision making and
adjusting production to client needs, resulting in higher productivity.
61
Productivity is one of the factors that managers must take into account when considering
whether to enter, thrive within or exit an industry. This is because “efficient firms grow and
survive; inefficient firms decline and fail” (Jovanovic, 1982, p. 649). Concerning exiting, the
empirical research has looked at differences in the probability of survival between single and
multi-plant firms. Bernard and Jensen (2007), for example, studied the impact of firm
structure on the probability of plant closure in two panels of about 170,000 US manufacturing
plants during the periods of 1987-1992 and 1992-1997. A dummy variable was used to
represent whether a plant was part of a multi-plant firm. A plant was deemed part of a multi-
plant firm if there was at least one other plant with the same ownership in the sample. The
study’s results suggest that the probability of shutting down is the lowest for plants belonging
to multi-plant firms, those owned by US multinationals (compared to plants owned by
domestic firms), and those having changed ownership. These plants were also found to have a
range of characteristics (larger, older, more productive, more likely to export, more capital
intensive, employing more highly skilled workers and operating in industries characterised by
lower probability of shutdown). Once these characteristics were controlled for, the results
were the opposite. Thus, the study concludes that the probability of shutting down is higher
for plants belonging to multi-plant firms compared to single-plant firms.
The above results differ from those of Dunne et al. (1989). Using a larger US sample (about
200,000 plants) and an “older” time period (1967-1977), the authors analysed the
relationships between plant characteristics and its employment growth and failure rate. Plants
were differentiated according to two ownership categories, single-unit plants and multi-unit
plants, to which the estimation methodology was applied separately. The relationship
between age and failure rate was found to be negative and did not seem to differ between the
two kinds of plants. The relationship between size and failure rates was also negative,
particularly for plants that belonged to multi-plant firms. Accounting for the failure rate,
plants owned by single-plant firms were characterized by a negative effect of size on
employment growth. Plants owned by multi-plant firms, on the other hand, showed a positive
effect of size on employment growth. The results suggest that plants owned by multi-plant
firms are less likely to fail and more likely to employ more people as they increase the scale
of their operations, compared to plants owned by single-plant firms.
Lieberman (1990) studied how divestment occurs within the chemical industry by analysing
US data on 30 different chemical products and different forms of divestment, such as cutting
capacity or exiting. To analyse the effect of a plant’s scale and size on its closure, a dummy
variable was included that took the value of zero if the firm operated with a single plant and a
62
value of one if a firm had multiple plants. The results show that during industry decline,
multi-plant firms that represent a large share of industry capacity are more likely to close
individual plants than single-plant firms. This suggests that during a downturn, multi-plant
firms might decide to close their least productive plant rather than keeping it alive and
reducing the support provided to the other plants.
Disney et al. (2003) studied establishment entry and exit in UK manufacturing. By applying
an exit hazard function separately to single and group establishments, they found the single
establishments to have a higher hazard exit rate in comparison with group establishments.
However, when single establishments were conditioned on the average characteristics of the
group establishments, they were found to have a lower hazard exit rate than group
establishments conditioned on the average characteristics of the single ones. This implies that
the hazard exit rate is determined by an establishment’s characteristics rather than by its
organisational structure. Based on this study and that of Bernard and Jensen (2007), it thus
seems that single and multi-plant firm structures do not directly determine plant failure rate.
However, there are other characteristics that play a role in this relationship, such as a firm’s
size and age.
Using the same database as Disney et al. (2003), Harris and Hassaszadeh (2002) adopted a
large number of explanatory variables and conducted their analysis at the plant level (rather
than the establishment level) to analyse the effect of plant ownership and age on the
probability of plant closure, using a hazard function. Plants were differentiated using a
dummy variable that indicated whether they belonged to a single-plant or multi-plant firm.
Their findings contrast with those of Disney et al. (2003), suggesting that single-plant firms
are much less likely to fail compared to multi-plant firms. This likelihood was found to
increase with plant age.
This section has reviewed the importance of economies of scale as a determinant of higher
TFP. Economies of scale are achieved by an economic unit if the costs per unit of output
decrease when the quantity of output produced is increased. Internal economies of scale are
related to an individual plant and external ones are related to firms with multiple plants. In
contrast to economies of scale, economies of scope are obtained when different outputs are
produced and costs per unit of output are lower than would be by producing each kind of
output individually. Internal economies of scale mainly arise due to indivisibilities,
specialisation, and greater efficiency of large machines. However, a plant can also experience
diseconomies of scale, both internal and external, if its costs per unit of output rise when it
increases the quantity of output produced. Concerning external economies of scale, Harris
63
and Moffat (2011) suggest five reasons why they arise in a multi-plant context: reduction in
transportation costs; ease in adapting to client markets and needs; spread of costs such as
R&D, human resources and marketing across different plants; spread of excess capacity
across plants; access to less costly funding sources due to the diversified structure; and easier
access to information, as technology is shared across plants. However, such benefits are not
always the case: single-plant firms have more concentrated production and are thus likely to
be more productive; managers of multi-plant firms might misallocate resources; in multi-
plant firms, managers might not be provided with the right motivation in terms of
remuneration and incentives; multi-plant firms are likely to be more complex and thus more
difficult to manage than single-plant firms; and single-plant firms are likely to have a more
flexible organisational structure and thus respond more quickly to changes in the market
environment. The empirical research has looked at the difference in the probability of
survival between single and multi-plant firms. Productivity is one of the factors that
determine whether a firm enters, thrives within or exits an industry. The empirical findings do
not clearly suggest a specific relationship between whether a plant is from a single-plant or
multi-plant firm and its probability of survival. Some studies have documented that single-
plant firms are more likely to survive than multi-plant ones. Others have documented an
opposite effect. However, in this relationship, certain plant characteristics, such as size and
age, need to be considered, as these play a critical role in the achievement of economies of
scale.
2.4.5. Competition
A fifth determinant of TFP is the competitive structure of the market in which a firm
operates. Nickell (1996) suggests that an industry is more competitive if there are less
monopoly rents. In this case, a firm’s managers are likely to increase their efforts and to
reduce slack, thus leading to an increase in productivity. It is also because the higher the
competition, the more likely a firm is to exit an industry if its productivity is relatively low.
In addition, Nickell (1996) argues that monopoly rents benefit workers in the form of higher
wages and reduced efforts. In this case, higher competition would lead to reduced wages
within an industry, consequently lowering labour costs and increasing workers’ efforts,
resulting in higher productivity. Meyers and Vickers (1997) argue that since firms within an
industry can be compared to one another, investors reward the relatively high-performing
ones by providing them with a lower cost of capital while withdrawing capital from or
increasing its cost for the relatively low-performing ones. This pushes firms to improve their
64
productivity. Tang and Wang (2005) state that an increase in product market competition
leads to higher demand elasticity, which is likely to result in higher potential profits and thus
increased managerial efforts. Lastly, a firm not only responds to increased competition by
increasing its “efforts” in order to improve productivity; it might also pursue the opportunity
to innovate by upgrading its technology to match industry best practices.
One would therefore infer that competition benefits a firm’s total factor productivity.
However, this does not seem to always be the case. Hermalin (1992) argues that increased
competition is likely to diminish a firm’s profits and a manager’s income, which might result
in a reduction in effort (Schumpeterian effect) due to a risk-adjustment effect, changing the
risk profile of different kinds of actions and resulting in lower productivity. In addition, Horn
et al. (1994) argue that there exists a negative relationship between competition and the effort
incentives provided to managers by their working contract. By examining three different
settings, each characterised by a different level of competition, the authors argue that
managerial effort is the greatest when the extent of competition is the lowest. Moreover,
according to Tang and Wang (2005), Kamien and Schwartz (1982) suggest in Market
Structure and Innovation that a firm in a monopoly position is more able to finance
innovative projects and dominate its market than a firm without such power. From the above
discussion, it appears that the relationship between competition and productivity has two
different directions.
One of the first studies to consider the effect of competition on TFP was done by Nickell et
al. (1992). The authors analysed the connection between product, labour and financial market
effects, and the change in TFP for 100 UK manufacturing companies for the period of 1972-
1986. Competition, or the product market structure, was represented by three variables:
market share, or the share of a company’s sales in the three-digit industry sales;
concentration, or the five-firm concentration ratio in the industry according to domestic sales;
and import penetration, given by imports as a proportion of industry production. An increase
in market share was found to cause a long-run reduction in TFP levels. This suggests that, as
a firm increases its monopoly power, the managers and workers do not improve their
“efforts” because they are enjoying monopoly rents. On the other hand, increased market
share was found to result in higher TFP growth, suggesting that firms with a relatively large
market share have a higher TFP than those with a small market share, and indicating that
large firms are more incentivised or have a higher capacity to innovate.
In a subsequent study, Nickell (1996) looked at 670 UK manufacturing companies to
examine the relationship between competition and productivity. The effect of competition on

65
productivity was measured using a variable to indicate a firm’s market share within an
industry. The effect of competition on productivity growth was proxied by two dummy
variables, the first taking the value of 1 when the manager stated that there were more than
five competitors in the product’s market, and 0 otherwise; and the second measuring rents, as
given by the average of profits minus capital costs during the sample period, divided by the
value added. Two-digit industry dummies, namely average firm size, industry concentration
and industry import penetration, were included to measure the effect of competition on
productivity growth. Consistent with the findings of Nickell et al. (1992), the higher a firm’s
market share, the lower its productivity level. Moreover, higher competition, represented by a
higher number of competitors and lower rents, was found to be beneficial to productivity
growth. From these results, one could infer that higher competition pushes managers and
workers to reduce slack and improve their efforts in order to survive, thus stimulating higher
productivity.
Sjöholm (1999) analysed the effects of regional characteristics, among them competition, on
labour productivity growth for Indonesian manufacturing plants in 1980 and 1991. The
variable representing competition was constructed using the Herfindahl index. High values of
this index suggest that a high level of concentration and thus a low level of competition
characterize an industry, while the opposite is the case for low index values. The results
indicate that the effect of competition on labour productivity growth is insignificant, not
affecting productivity growth. However, its effect on the labour productivity level was found
to be positive and statistically significant. This means that as competition increases,
productivity decreases.
Inui et al. (2008) measured the effect of market competition, represented by the inverted-
Herfindahl and inverted-Lerner indices, on TFP growth and R&D intensity for Japanese
manufacturing firms during the period of 1997-2003. Here, the inverted-Herfindahl index
measures a firm’s share of sales in its industry at a given time. As this refers only to domestic
competition, the import ratio, or the percentage of the import of the total production in a
specific industry, was also adopted as a proxy for international competition. The results show
a positive effect of competition in terms of the inverted-Herfindahl index, the inverted-Lerner
index and the import ratio on firms’ TFP. This suggests that as competition increases, firms
are more likely to improve their efficiency and undertake innovations, both of which are
TFP-enhancing actions. An inverted U-shaped relationship was found between competition,
as measured by the inverted-Herfindahl index, and productivity. Subsequently, the authors
added the square terms of the competition measures in order to understand whether
66
competition and productivity were characterised by an inverted-U relationship. The existence
of such a relationship was only supported when the inverted-Herfindahl index was used as the
competition measure. This would suggest that productivity increases as competition
increases, thus pushing firms to improve their efficiency as well as to innovate. This effect
occurs up to a certain point, after which increased competition causes firms’ incentive to
innovate to decline. This study provides a valuable insight into the relationship between the
Herfindahl index and TFP. However, the insight is limited since the authors perform the
estimation using the index method. Although the authors acknowledge that using the Olley
and Pakes’ (1996) semiparametric methodology takes into account both the simultaneity
issue and the selection bias due to firm entry and exit, the methodology does not consider
fixed effects and is based on strong assumptions.
Tang and Wang (2005) studied the effect of competition and skill shortages on labour
productivity for 5,320 Canadian firms in the manufacturing sector, using a survey covering
the years of 1997-1999. Innovation was represented by the firms’ perception of their
competitive environment, both domestic and international, upon which their effort and
innovation activities would depend. The perception of the competitive environment was
based on four different factors: easy substitution of products, constant arrival of competing
products and competitors, and obsolescence of products. These seem to provide a better
indicator of competition compared to those used in the previously-mentioned studies. The
existence of high competition, measured in terms of market share or number of competitors,
does not mean that competition poses a threat to a firm’s performance. However, a survey
providing such detailed information might not be possible in every country; one would
consequently need to rely on standard measures of competition. The study’s results suggest
that the higher the degree of competition perceived by a firm, the higher the productivity
level achieved, an effect that is likely to occur through higher innovation or improved efforts.
Further evidence regarding the effect of competition on TFP is provided by Griffith (2001),
who studied how changes in competitive pressures affect managers’ and workers’ efforts in
UK manufacturing firms during the period of 1980-1996, and how these pressures affect both
TFP levels and growth rates. Here, managerial firms, which are characterised by the
separation of ownership and control and, consequently, by agency costs, were compared to
single or entrepreneurial firms, in which owners and managers are the same person and which
are thus not characterised by agency costs. The results suggest that as a consequence of the
increase in product market competition, increased TFP is only found for managerial firms but
not entrepreneurial ones. This suggests that an increase in competition arising from product
67
market reforms is likely to lead to reduced agency costs for firms in which there is a
separation of ownership and control, ultimately resulting in higher TFP.
In the Chinese context, Perkins (1996) examined the effect of enterprise, market and
ownership reforms on the productivity of 300 State-owned, collective and foreign funded
Chinese firms based in three coastal provinces in 1993. Among the determinants of TFP
considered in the analysis, the firm’s exposure to international competition, measured as the
ratio of exports to output for each firm, was used. The results suggest that firms that are more
exposed to international competition are 22-34% more productive than firms that are not
exposed.
Zhang et al. (2001) analysed the effect of both ownership and competition on the productive
efficiency of 1,989 Chinese industrial firms located in Shanghai. In contrast with Perkins’s
(1996) approach, the authors decomposed competition into international and domestic. The
extent of the firms’ exposure to international competition was measured as the ratio of the
firm’s export revenue to its total assets. The extent of domestic market competition was
measured using the Herfindahl index of industrial concentration. The results suggest a
positive effect of international competition on firm productivity. Moreover, it seems that
firms belonging to industries characterised by higher concentration, as suggested by the
Herfindahl index, have higher efficiency scores, indicating that they are more productive.
In estimating the effect of productivity spillovers from FDI to between 124,944 and 143,974
domestic Chinese firms during 1998-2005, Lin et al. (2009) included in their model a variable
representing the intensity of domestic industrial concentration within each industry. This was
found to have a significant and negative coefficient, suggesting that a higher extent of
domestic competition within an industry positively affects firms’ TFP.
This section has reviewed the importance of competition as a determinant of higher total
factor productivity. The findings from the empirical research suggest that competition is a
positive determinant of productivity. Firstly, competition is likely to reduce monopoly rents,
resulting in reduced slack and higher managerial efforts. Secondly, it lowers the wages within
an industry, reducing the cost of labour and improving firms’ TFP. Thirdly, it represents a
threat, causing least productive firms to exit while the most productive firms thrive and
survive. Fourth, it enables the most productive firms to be rewarded with a lower cost of
capital from investors, compared to the least productive ones. Lastly, higher competition
leads to higher demand elasticity, which is likely to result in higher potential profits and thus
increased managerial efforts. Theoretically, a manager would be incentivised by these
reasons not just to increase his or her efforts and reduce slack, but also to innovate, thus

68
improving the firm’s productivity. However, there are some reasons why higher competition
might not lead to productivity improvements. This is because competition might reduce a
firm’s profits and the manager’s income, thus reducing the manager’s efforts and propensity
to innovate. In contrast, a firm in a monopoly position might be more able to finance
innovative projects that could ultimately result in higher TFP. Therefore, from a theoretical
perspective, the effect of competition on TFP might have different directions. Despite this,
the empirical results indicate that competition has positive effects. It seems that the higher a
firm’s market share, the lower is its TFP, as managers enjoy the rents provided by the
monopoly condition. In addition, the higher the number of competitors, the higher the firms’
productivity, as managers feel threatened, and thus pushed, to increase their efforts and
pursue innovative projects. In the empirical studies discussed above, the managers’
perception of competition seems to be more representative variable than the actual
competition itself, as represented by the market share, import penetration and industry
concentration. This is because the potential TFP-enhancing measures undertaken by
managers in a situation of increased competition are likely to depend on their perceptions of
the competition. In addition, an increase in product market competition has been found to
increase TFP, particularly for managerial firms characterised by agency costs, as a result of
the separation between ownership and control. Overall, the results from the empirical
research indicate the existence of a positive effect of competition on firms’ productivity.
2.4.6. Spatial Spillovers
Ornaghi (2006) defines spillovers, or technological externalities, as the pool of general
knowledge to which a firm has access. A firm can obtain this knowledge in the following
ways: by being based in a particular location (spatial spillovers); from its industrial relations
(intra and inter-industry spillovers); from its export activities (export spillovers); from R&D
activities (R&D spillovers); and from FDI (FDI spillovers). In order to obtain a higher benefit
from spillovers, a firm needs to have absorptive capacity, or “the ability of a firm to recognise
the value of new, external information, assimilate it, and apply it to commercial ends” (Cohen
and Levinthal, 1990, p.128). Therefore, in order to further improve its TFP, a firm must be
able to use the knowledge available for the most productive purposes.
“Spatial spillovers or agglomeration externalities are benefits that accrue to plants from being
located in the vicinity of a large concentration of other plants” (Harris and Moffat, 2012a, p.
763). In general, such spillovers can be classified as either Marshallian or Jacobian. In
addition, spillovers can also manifest differently according to whether a firm is based in a

69
city, or not. City spillovers will be discussed in the following section (2.4.7.), while this
section will focus on Marshallian and Jacobian spillovers.
Marshallian spillovers, also known as agglomeration, location or specialisation externalities,
were first suggested by Marshall (1890), who described them as a range of benefits for a firm
arising from being in close proximity to industry peers. This effect occurs because “if one
man starts a new idea, it is taken up by others and combined with suggestions of their own;
and thus it becomes the source of further new ideas” (Marshall 1890, p. 271). Marshall’s
statement suggests that these externalities manifest themselves through imitation and
adoption of ideas among firms. Subsequently, Glaeser et al. (1992) combined the ideas of
Marshall (1890) with those of Arrow (1962) and Romer (1986) in the Marshall-Arrow-Romer
model, which proposes the existence of knowledge spillovers across firms that ultimately
benefit intra-industry growth. Therefore, as suggested by Marshall (1890), if a firm develops
an TFP-enhancing innovation such as a new working practice or an innovative product, other
firms are likely to imitate and adopt it. A contagion thus develops from one firm to another,
which is likely to result in higher TFP growth for the industry as a whole. Other than
imitation/demonstration, Marshallian spillovers can manifest themselves in other ways. The
close geographical distance of firms belonging to the same industry fosters cooperation,
potentially resulting in higher industry TFP. Firstly, firms can exploit synergies, for example,
by collaborating on R&D projects to improve products and processes. Secondly, firms
located at different levels within an industry supply chain can develop commercial
relationships. In this case, spillovers manifest themselves through backward and forward
linkages. In backward linkages, a supplier firm obtains knowledge by learning from its
customers through feedback concerning the products it provides. In forward linkages,
customer firms obtain knowledge by using innovative products from their suppliers. Thirdly,
firms based in the same geographical area can benefit from sharing assets. For example, two
firms can reduce their input transportation costs by jointly leasing or renting trucks. Fourth,
as Marshall (1890) suggests, externalities can be manifested through the development of an
industry-related labour market pool. This means that in an industry-specific geographical
area, workers will develop industry-specific skills. This provides two benefits. On the one
hand, workers benefit in terms of the ease of mobility from one firm to another. On the other
hand, firms benefit from the opportunity to more easily hire specialised workers than in the
case of a more industry-diverse geographical area. These four cases represent the ways in
which Marshallian externalities manifest themselves among firms based in a specific location
and belonging to a specific industry. These spillovers are likely to result in higher TFP for the
70
industry as a whole. It must be stressed that spatial spillovers and FDI spillovers are not
mutually exclusive, but rather are complementary. This means that they can interact with
each other to facilitate the transmission of knowledge among firms, thus contributing to TFP
growth.
Different from Marshallian spillovers are Jacobian spillovers, also known as diversification
or urbanisation externalities. According to Harris and Moffat (2011), these occur when plants
located in an industry-diverse area benefit from the economies of scope such a location
provides. Compared to Marshallian externalities, Jacobian externalities manifest themselves
across economic units belonging to different industries. As Jacob (1970) states: “The greater
the sheer numbers and varieties of divisions of labour already achieved in an economy, the
greater the economy’s inherent capacity for adding still more kinds of goods and services” (p.
59). Therefore, it seems that plants with different knowledge and capabilities can complement
each other’s skills sets, resulting in mutual benefits. Moreover, Jacob (1970) suggests that the
diversity in terms of industry and occupation that characterises urban economies favours the
spillover of innovations across different industries. For example, an automotive firm can
benefit from knowledge acquired by interacting with scientists from a university’s
mechanical engineering research department. This interaction generates knowledge spillovers
from the research department to the firm, bringing benefits in terms of product or process
improvements and ultimately being likely to result in higher TFP. Jacobian externalities can
also occur, for example, when a firm involved in the production of aluminium, absorbs
knowledge from a food production firm located nearby. This example suggests that by being
located in the same geographical area, firms belonging to different industries can obtain
mutually benefits that are likely to result in higher TFP.
The above discussion suggests that spillovers, both Marshallian and Jacobian, are likely to be
positive determinants of a firm’s TFP. Micro-level empirical results seem to support the
existence of Marshallian externalities, while no significant evidence has been found for
Jacobian externalities.
López and Südekum (2009) looked at data on 4,911 plants belonging to the Chilean
manufacturing sector during the period of 1990-1999 to examine the impact of spatial
spillovers on TFP. Attention was also paid to the spillovers that might arise from the vertical
relationships between suppliers and customers. Intra-industry spillovers were measured by
the number of plants belonging to a firm’s industry and region at the same time. Moreover, as
intra-industry spillovers are not necessarily localised, a variable representing the number of
plants from the same sector but based in different regions was included. Inter-industry

71
spillovers were represented by the number of firms belonging to different industries based in
the same region. While no effect was found for Jacobian spillovers on plants’ TFP,
Marshallian spillovers were found to exert a positive impact on plants’ TFP. It might be that
plants do not productively exploit, or do not find worth exploiting, the knowledge pool
created by plants located in the same area but belonging to different industries. However, the
plants were found to benefit from the presence of suppliers. Therefore, it seems that plants
benefit from forward linkages, through which spillovers can manifest themselves.
Cingano and Schivardi (2010) provide further evidence from Italian manufacturing firms
belonging to 784 local labour systems. In their study, localisation economies in a local labour
system were measured as the share of the sectorial city employment in the total
manufacturing employment. Urbanisation economies were measured by the Hirschman-
Herfindahl index. The results indicate a positive effect of Marshallian externalities and city
size on local TFP growth, while no evidence for an impact of Jacobian externalities was
found, thus confirming the results of the previous study.
Baldwin et al. (2010) used plant-level data for the Canadian manufacturing sector over the
period of 1989-1999. In order to measure localisation economies, they adopted the following
multiple variables: a variable representing the industry mix in a metropolitan area (as a proxy
for industry labour pool); an upstream supplier-weighted location quotient (as a proxy for the
density of upstream suppliers in a specific location); and the density of plants in a
geographical area (as a proxy for intra-industry knowledge spillovers). Urbanisation
economies were measured as the population of the metropolitan area or agglomeration where
the plant was located. On the one hand, their findings suggest a positive effect of localisation
economies on productivity. On the other hand, urbanisation economies were found to have a
negative effect on productivity, suggesting that firms do not benefit from Jacobian
externalities.
In the case of France, Martin et al. (2011) analysed the effect of geographical spillovers on
manufacturing plant and firm-level TFP over the period of 1996-2004. Marshallian spillovers
were measured for each plant as the number of other workers employed in the same industry
and in the same area. Jacobian spillovers for a plant were calculated as the difference between
the numbers of workers in other industries based in the same area as the plant. The study’s
results support the existence of Marshallian externalities that make a positive contribution to
TFP in the short run. A 10% increase in the number of plant workers from the same industry
was found to increase firms’ TFP by 0.55%. Therefore, one would infer that having firms
belonging to the same industry in the same area would be beneficial in terms of TFP.

72
However, this relationship was found to be bell-shaped, meaning that when a plant is based in
an area with a high number of workers (i.e. the area is overcrowded), TFP is likely to suffer.
In addition, the results do not indicate the existence of Jacobian externalities, at least in the
short run. However, since Jacobian externalities manifest themselves across plants belonging
to different industries, it might take longer for them to spread and for the related knowledge
to be applied productively than with Marshallian externalities because the plants need to
complement their diverse set of skills and knowledge.
Within the Chinese context, Lin et al. (2011) examined the effect of spatial agglomeration,
measured in terms of concentration of manufacturing activity, on firms’ labour productivity.
The firms analysed belonged to the textile industry, during the period of 2000-2005. The
dataset comprised 22,152 firms taken from the National Bureau of Statistics, including all
SOEs and large and medium-sized non-State-owned textile enterprises having sales higher
than RMB 5mn. Although this was a highly representative sample, small firms were not
included. In the estimation, the spatial agglomeration variable was measured using the Ellison
and Glaeser (1997) index, which compares the actual geographical distribution of firms and
their expected distribution in the absence of agglomeration in a city. The index figures
suggest that spatial agglomeration has an increasing trend and differs among sub-industries.
Estimation was conducted using both fixed and random effects and their validity was tested
using the Hausman test, which tends to favour the fixed effects model. Overall, the findings
suggest that industrial agglomeration has a significant positive impact on productivity. The
relationship between industrial agglomeration and productivity showed an inverted U-shape:
the higher the concentration of firms, the higher the firms’ productivity through positive
externalities, although this effect declines if the extent of agglomeration is excessively high.
Li (2004) analysed the effect of agglomeration and privatisation on the labour productivity of
80,000 foreign-owned firms between 1994 and 1996. Output per employee was used as a
measure of productivity, despite not being as valuable as TFP. The advantage of having
access to the labour force and product markets was represented by an index measured at the
provincial level. Moreover, agglomeration economies were measured through two variables
representing the concentration of foreign firms and the industry concentration of domestic
firms, respectively. Results from a multiple linear regression model suggest that foreign firms
benefit from location advantages such as infrastructure and factor inputs. The concentration
of foreign firms and the effect of reforms were found to positively affect firms’ productivity.
In contrast, concentration of domestic firms was found to negatively affect firms’
productivity. This study provides interesting insights into the effects of location and

73
agglomeration externalities on foreign firms’ productivity. However, it would have been
interesting for this study to consider other kinds of firms.
Yang et al. (2013) examined the effect of spatial concentration of manufacturing and R&D
activities on a price-adjusted measure of labour productivity for Chinese firms belonging to
the electronics industry during the years of 2005-2007. As a measure of spatial concentration,
the Ellison and Glaeser (1997) index was adopted. The index values obtained suggest that
both production and R&D activities are highly concentrated, particularly R&D. The effect of
spatial concentration was examined through fixed and random effects techniques. These do
not take into account the simultaneity issue, suggesting that the estimates may be biased and
inconsistent. Despite the presence of this issue, production agglomeration was found to be
positively related with firm productivity, particularly for smaller firms, while R&D
agglomeration seemed to have a negative relationship, suggesting the overcrowding of R&D
activity.
This above paragraph examined spatial spillovers or agglomeration externalities, which are
benefits that a plant obtains by being geographically close to other plants. These are
differentiated between Marshallian and Jacobian spillovers. Marshallian spillovers relate to
firms that are in close proximity to their industry peers. They are manifest through the
channels of imitation/demonstration, synergies, commercial relationships, asset sharing, and
labour pooling. Other than Marshallian, externalities can also be Jacobian, which occur when
plants are located in an area characterised by different industrial activities, allowing the plants
to benefit from the economies of scope this provides. For example, a firm in one industry can
absorb and exploit knowledge from a firm in another industry, likely resulting in higher TFP.
Therefore, compared to Marshallian externalities, Jacobian externalities manifest themselves
across economic units belonging to different industries. Based on the above discussion, one
would expect both Marshallian and Jacobian externalities to be positive determinants of firm
TFP. Some of the most recent studies concerning agglomeration externalities have been
examined. While Marshallian externalities have been found to exert a positive effect on
firms’ TFP, Jacobian externalities have not. Therefore, one would infer that by placing firms
belonging to the same industry in the same geographical area, TFP will improve as a result of
positive mechanisms (imitation/demonstration, synergies, commercial relationships, asset
sharing, and labour pooling). However, locating firms belonging to different industries in the
same area might not lead to higher firm TFP. It may take longer for Jacobian spillovers to be
transmitted within a geographical area because of the firm diversity and the greater difficulty
of applying the diverse knowledge productively compared to Marshallian spillovers. In
74
addition, plants might not find it worthwhile to explore the knowledge of plants from
different industries, or they may not even be able to exploit such knowledge productively.
Regarding the Chinese context, empirical evidence is still scant. The evidence available
points to the existence of location and agglomeration economies, although the relationship
does not seem to be linear. Another study suggests that firms owned by foreign investors
benefit from a higher concentration of foreign firms but suffer from a higher concentration of
domestic firms. Although these represent valuable results, further investigation is required to
both extend and confirm the findings.
2.4.7. City Location
Knowledge spillovers can also manifest differently depending on whether a firm is based in a
city, as cities are likely to have a higher population density than other locations such as towns
or villages. “By facilitating face-to-face contact, the concentration of people in a particular
area will facilitate the transfer of knowledge. In addition, workers will find it easier to move
from one firm to another. This process will cause the transfer of knowledge across firms. The
same diffusion of knowledge will occur when plants are better able to learn from their
customers and suppliers when they are located in cross proximity” (Harris and Moffat, 2012a,
p.764).
By being based in a city, a firm is likely to reap benefits for four different reasons. Firstly, a
firm benefits in terms of knowledge spillovers, which are likely to be higher in comparison to
smaller locations. This is because, in such a location, people are likely to interact more with
each other, thus enabling a faster transfer of knowledge than would be possible elsewhere.
Moreover, as Borowiecki (2013) argues, the cost of transmitting knowledge rises with
distance. A city is therefore an environment where knowledge can be spread relatively
quickly and where new ideas are constantly created. “The new impressions and new ideas
that are the heart of technological progress are probably most likely to occur in such a
setting” (Sveikauskas, 1975, p.394). Using a 2007 survey of 6000 French workers concerning
workplace communication, Charlot and Duranton (2004) suggest that city size and urban
schooling positively impact workplace communication. Therefore, the larger the city, the
higher the workplace communication is likely to be. If a firm’s workers live within the city
and interact with fellow citizens, they are likely to bring outside knowledge to the firm, likely
resulting in higher TFP. Secondly, when a firm is based in a city, it is more able to obtain
important insights into its customer base. In this way, it can better adapt its products to
customer needs. Moreover, since the customers are in close proximity, the firm has the

75
opportunity to reduce transportation costs and respond more quickly to customer feedback
and to any issue that might arise from product sales. Thus, the closer level of interaction of a
firm with its customers would enable the firm to undertake TFP-enhancing actions such as
product improvements. Thirdly, another benefit that a firm might reap by being based within
a city is the availability of a wider labour pool. A firm would therefore have to struggle less
to find an employee with the right skills for a specific job. In addition, the larger the city, the
higher the availability of a more skilled labour force than in a smaller city. This was found by
Bacolod et al. (2009) for a sample of US cities. In addition, using a survey of US
establishments, Elvery (2010) demonstrated that companies based in large metropolitan
statistical areas (MSAs) have a more skill-intensive workforce than those based in small
MSAs. Therefore, the availability of a large and more highly skilled labour pool in a city is
likely to benefit a firm in terms of higher TFP. Fourth, another advantage a city might
provide to local firms is the high availability of business services such as accounting, legal
and financial services.
Despite the abovementioned benefits, companies might face other issues from being based in
a city. Carlino (1987) argues that in a city, the time and cost of transporting goods and
commuting are likely to be high, along with the high commercial and residential rents. The
extra time and costs of commuting experienced by a firm’s workers is likely to result in a
demand for higher salaries. In addition, the relatively high rent paid by a firm to be located in
a city results in additional costs. These two aspects are, therefore, likely to negatively impact
a firm’s TFP.
From the above analysis, it seems that being based in a city is likely to bring firms more
advantages than disadvantages. The empirical evidence on this matter is mostly at the
aggregate level, while the research at the micro-level remains scant.
In one of the first micro-level studies on the topic Mitra (1999) analysed how the size of a
city impacted the efficiency index of Indian firms belonging to the electric machinery (212
firms) and cotton textiles (294 firms) industries, using a cross-sectional sample for the year
1992-1993. The estimation was performed using both a production function and a stochastic
frontier analysis (SFA). In the production function, the impact of city agglomeration
economies was measured through a function representing the total city population, or its total
workforce. In the SFA, agglomeration economies were measured as the difference in
efficiency between firms based in large cities and firms based in small ones, followed by an
examination of the relationship between efficiency and agglomeration externalities. The
results obtained using the production function were not highly significant. However, the SFA
76
analysis suggests a positive impact of city size and workforce size on firm efficiency,
although this effect declines for very large cities. These results imply that firms might
generally benefit in terms of higher efficiency from being located in a city. However, after a
city reaches a certain size, it might not have a sufficient infrastructure to support firms’
activities, thus making it costly for firms to be based there. Although these results provide a
useful insight into city spillovers, they should be interpreted with caution. Firstly, the sample
size was very small. Secondly, the analysis was limited to two sectors. Thus, the results
represent a specific case in point that cannot be extended to other sectors or countries.
Pan and Zhang (2002) studied the relationship between urban productivity and city size using
data on 119,790 firms across 28 Chinese industries and 224 cities. Thus, they used a larger
sample and considered a wider industrial base than Mitra (1999). For the study’s urban
production function, a shift function for city size was used to proxy the urban population. By
using OLS, the authors found evidence of significant positive agglomeration effects across 19
out of 28 industries. The elasticity of agglomeration was 0.051, suggesting that as a city size
doubles, the corresponding increase in productivity is 3.6%. Thus, one would infer that firms
located in a city are likely to become more productive as city size increases. In addition, these
agglomeration gains were found to derive from localisation economies. Therefore, the
benefits that a firm gains by being located in a city come mainly from the presence of firms
belonging to the same industry. While the authors did take into account the effects of
ownership and geography on firm performance, they ignored other issues that compromise
their results, such as the endogeneity of inputs, and firm fixed effects.
Harris and Moffat (2012a) measured the determinants of TFP using a UK plant-level panel
dataset for the years 1997-2006 for almost all industries in both the manufacturing and
service sectors. City spillovers were measured using a dummy variable that took the value of
1 if the plant was located in a major city and 0 otherwise. In addition, they used the SYS-
GMM estimation methodology, which accounts for firms’ fixed effects. Their results suggest
that plants based in cities have higher TFP than plants based in the same region, but outside
of cities.
In the Chinese context, Pan and Zhang (2002) examined the effect of city size on the
productivity of 119,970 firms spread across 28 industries in 224 cities. The city’s size was
proxied by its urban population. The results suggest that as the city size doubles, a firm’s
productivity increases by 3.6%. When this effect was decomposed, it was found that the
productivity increase was mainly due to the concentration of firms belonging to the same
industry, as measured by the total district industry sales, rather than urban development, as

77
measured by the urban population. Although this study is the only one that has been done at
the firm level for China, it suggests that being based in a city brings firms a wide range of
benefits that will likely result in higher TFP. In summary, despite being scant at this stage,
this empirical evidence suggests that a plant or a firm based in a city is likely to benefit in
terms of higher TFP.
This section has analysed the benefits gained by plants or firms based in cities that are likely
to result in higher TFP. Firms seem to enjoy four main benefits that cities provide. One is the
relatively high transfer of knowledge that occurs among people and workers, and the creation
of new ideas arising from their interactions. This knowledge is likely to result in TFP-
enhancing actions, such as product and process improvements. The second is the insight into
its customers that a firm can obtain through close proximity to them, enabling it to adapt its
products and respond more quickly to customers’ needs, as well as reducing transportation
costs. The third is the availability of a wide labour pool and, specifically, a skilled labour
force, from which a firm can hire those employees who are likely to contribute the most to
the firm. The fourth is the relatively high availability of business services, such as legal,
accounting and financial services, which might not be as available elsewhere, thus providing
the firm with support for its needs.
Based on the empirical results from the literature, it seems that being located in a city is likely
to positively impact firms’ TFP. However, the benefits of cities might be counterbalanced by
high costs, such as transportation of goods, building rentals or purchasing, and the costs to
workers of commuting or living in the city. Despite these negative aspects, the benefits of
cities seem to prevail. Regarding the Chinese context, although the empirical evidence is
scant, the available findings suggest that cities positively impact firms’ TFP.
2.4.8. Export Activities
Another factor that is expected to be a determinant of TFP is export activities. Regarding this
relationship, there seems to be two contrasting views. One suggests that TFP is likely to
determine a firm’s decision to export and hence to self-select into a new market. This is
because only the most productive firms might be able to afford the sunk costs that entering
into an export market entails. Roberts and Tybout (1997) analysed the entry and exit of plants
in four industries in the Colombian manufacturing sector during the years 1981-1989, using a
model in which a plant’s current exporting status was a function of its prior export experience
(a proxy for sunk costs), its observable characteristics (age, capital stock and corporate
ownership, which influence its profits from export activities), and unobserved serially

78
correlated shocks. The study’s results suggest that a plant’s decision to export in the current
year is influenced by whether it exported in the past year. Specifically, a plant has a 60%
higher probability to export in the current year if it exported in the past year, compared to a
plant that has never exported. This suggests that after a firm has overcome the cost of entry, it
is more likely to keep exporting than a firm that still is facing such costs. In addition, the
authors found that once a plant exits from foreign markets, its costs for re-entering are not
much different from those faced by new exporters. The study suggests that sunk costs
constitute a hurdle that a firm must overcome in order to enter into foreign markets. Only the
most productive firms are able to overcome such a hurdle and thus they self-select into the
export market. In making the decision of whether to export, a firm is likely to consider
different factors, among them TFP. Therefore, TFP might determine whether or not a firm
self-selects into a new market.
In contrast to the “self-selection” view is “learning by exporting.” According to this view, a
firm learns how to become more productive and competitive through actually exporting. The
more a firm exports, the more it is able to increase its productivity. This is because by
participating in foreign markets in addition to the domestic market, a firm faces a larger
number of competitors. In order to survive in such an environment, the firm would need to
constantly improve its productivity by undertaking TFP-enhancing measures. Moreover,
exporters are likely to benefit from the commercial interactions that exporting entails, as
suggested by Grossman and Helpman (1991). For example, an entrepreneur that trades
internationally has the opportunity to increase his stock of knowledge by interacting with
foreign economic agents, learning from customer feedback, and observing more innovative
technologies, more advanced products and better working practices. This knowledge might
be adopted and exploited by the entrepreneur to increase the firm’s TFP. Among the many
possible actions an exporter can undertake, improving products and processes and adopting
innovative machinery are likely to increase the firm’s TFP. Therefore, according to the
learning by exporting view, a firm learns how to improve its productivity by engaging in
exporting activities.
After having examined both the self-selection and the learning by exporting views, it is
reasonable to ask which one prevails, or whether both occur and to what extent. Do firms
self-select into export markets after they have improved their productivity? Or do firms
become more productive by actually exporting? Alternatively, do both effects coexist and to
what extent? The empirical results from the literature seem to support the self-selection view,

79
which indicates that the most productive firms are more capable of affording the sunk costs
that entering into an export market entails.
Clerides et al. (1998) provided support for this view by looking at plant-level data for firms
belonging to export-oriented industries in Colombia, Mexico and Morocco over the period of
1984-1991. The authors analysed whether the firms’ productivity growth improved after
exporting and whether this led to positive spillovers to domestic industry non-exporters. To
do this, they built a system of two equations: one testing a firm’s self-selection into an export
market, and the other testing whether exporting determines learning. The authors found that
prior to exporting, firms had relatively low average variable costs, while those who stopped
exporting had relatively high average variable costs. At the same time, the firms were found
to have relatively high labour productivity prior to exporting, while those who stopped
exporting had relatively low labour productivity. Apart from Colombian firms’ labour
productivity, these figures did not improve after the firms started exporting. Therefore, these
findings support the self-selection of the most productive firms into export markets.
Bernard and Jensen (2004) analysed the role of export activities in determining US TFP
growth rates in the manufacturing sector for the period of 1983-1992 at the plant and industry
levels. The independent export variable was represented by the export status of a firm at
time 𝑡, which was expected to affect productivity growth at time 𝑡 + 1. The authors adopted a
different methodology than Clerides et al. (1998), a cross-sectional regression of the TFP
growth rate to some independent variables, among them a variable representing exporting. At
the aggregate and industry levels, export growth was found to result from higher productivity,
while the opposite was not the case. At the plant level, no strong evidence was found for the
existence of a “learning by exporting” effect, thus confirming the results of the previous
study. In addition, the TFP of plants was found to increase before entering into an export
market and during its entry. This suggests that the most productive plants self-select into the
export market. Employment and output growth rates were found to be much higher for
exporters, and this process continued after exporting started. Therefore, it seems that export
activity supports the TFP growth of exporting firms. In addition, at the industry level, it was
found that 42% of TFP growth during the years 1983-1992 was due to reallocation of output
across plants, as relatively high-TFP exporters had grown at faster rates in terms of
employment and output than relatively low-TFP non-exporters. Therefore, a reallocation
effect occurred whereby exporting firms contributed more to their industry aggregate TFP
growth than non-exporting firms. In the results of Bernard and Jensen (2004), exporting did
not seem to affect TFP directly. Since exporting firms had higher employment and output
80
growth, the reallocation of output shares from less productive plants to more productive ones
led to a higher aggregate TFP, where exporters provided the largest share of the contribution.
Thus, there seems to be an indirect effect of exporting on TFP at the industry level. It can be
inferred that exporting benefits productive plants the most, enabling them to grow in terms of
output and employment.
Another study by Arnold and Hussinger (2009) used firm-level data for 389 German
manufacturing firms over the years 1992-2000. In the study, export activity was represented
by a firm’s export status. The findings suggest that larger, more R&D intensive, and more
productive firms are more likely to become exporters. Thus, firms with a relatively high TFP
are more likely to start exporting than those with a relatively low TFP. Using both a Granger
causality test and a matching technique, exporting was not found to improve the firms’ TFP
and there were no evident differences in terms of TFP between exporting and non-exporting
firms. Thus, it seems that the “learning by exporting” effect does not exist, thus providing
additional support for the existence of only the “self-selection” view.
In comparison with the relatively small sample used by Arnold and Hussinger (2009), Kim et
al. (2009) examined the relationship between exporting and TFP for 1,335 Korean
manufacturing firms belonging to eight industries during the years 1997-2003. Exporting was
represented by a firm’s exporting status. Using the same method as Clerides et al. (1998),
they found that exporting did not lead to higher productivity, except for in the machinery and
equipment industry. Therefore, the effect of “learning by exporting” was almost non-existent.
The self-selection effect was measured following Roberts and Tybout (1997), with the
finding that productivity led to exporting for just three industries out of eight, namely
machinery and equipment, computers and office machinery, and electronic components.
Since they were limited to these industries, the existence of these relationships cannot be
extended to the manufacturing sector as a whole.
This section has thus far discussed the possibly two-sided relationship between exporting and
TFP. On the one hand, there may be a self-selection effect, whereby more productive firms
self-select into new markets and start exporting. On the other hand, there may be “a learning
by exporting” effect, whereby firms learn how to increase their productivity by getting
involved in export activities. The studies analysed above were focused on gaining a better
understanding of these effects in both developed and developing countries. Most of the
studies document the existence of a self-selection effect and the absence of a “learning by
exporting” effect. One study found that both effects are irrelevant, while two others suggest
that exporting has an indirect effect on aggregate industry productivity. This is because

81
exporting firms have a higher employment and output growth and the reallocation of output
shares from the least productive plants to those that are the most productive leads to a higher
aggregate TFP, where exporters provide the largest share of the contribution. Thus, there
seems to be an indirect effect of exporting on TFP at the industry level. It can be inferred that,
in some cases, exporting benefits the most productive plants, enabling them to grow in terms
of output and employment. In general, one can infer from the literature reviewed that
exporting does not determine higher productivity at the firm level.
However, there have also been studies demonstrating the existence of a positive effect of
export activity on TFP, supporting the idea that firms “learn by exporting.” Castellani (2002)
argues that most studies supporting the self-selection view have adopted variables that are not
representative of export behaviour. This is because they all use a variable where export
behaviour can either take a value of 1 or 0, which does not represent the intensity of a firm’s
involvement in export activities. Thus, he uses the ratio of a firm’s foreign to total sales as a
measure of export intensity. Using firm-level data for about 5,000 Italian manufacturing firms
in the years 1989-1994, Castellani (2002) found that export intensity has a positive effect on
labour productivity. Therefore, the higher the export intensity, as measured by the ratio of
foreign to total sales, the higher a firm’s labour productivity growth. “Learning requires
experience of foreign markets, which comes with time and specific investments, and can be
very much correlated with the share of foreign exports” (Castellani, 2002, p.625).
Blalock and Gertler (2004) take a different view from Castellani concerning the prevalence of
findings supporting the self-selection thesis. They argue that the previous studies
documenting the existence of a self-selection effect mainly focused on developed countries,
which are likely to be as productive as their trading counterparts. In contrast, firms in
developing countries might still have room for learning from their trading partners and
experiencing technological transfers, that give them a greater opportunity to improve their
TFP. By adopting a dichotomous variable for exporting in a sample of 20,000 Indonesian
manufacturing plants during the period of 1990-1996, they found that plants experienced a 2-
5% gain in productivity after starting export activities. Their findings thus support the view
that firms learn by exporting.
De Loecker (2007) introduced the destinations where firms export their goods by splitting the
sample into destination markets. He also used a dichotomous dummy variable as proxy for
the firm’s probability to start exporting. By using firm-level data for 7,915 Slovenian
manufacturing firms during the period of 1994-2000, he found that firms experienced
productivity increases after starting to export, an effect that increased in the following years.

82
Exporting firms were found to be 8.8% more productive on average and to learn by exporting
in 13 out of 16 sectors. In particular, firms that exported to regions characterised by high
income, such as Western Europe and North America, were found to achieve the largest
improvements in productivity. Therefore, it seems that firms achieve a higher TFP as a result
of learning and technology transfers by exporting to developed countries. Moreover,
consistent with Blalock and Gertler (2004), firms in developing countries might still have
room for learning from their trading partners and experiencing technological transfers, which
improve their capacity to increase TFP. De Loecker (2007) also suggests that the existence of
the learning effect in Slovenia was motivated by the country’s economic transition from
socialist to market-oriented, and by the fall in 1990 of the CMEA trading system, which
provided firms with the opportunity to export towards developed regions.
Greenaway and Kneller (2007) analysed the effect of learning by exporting in a sample of
UK manufacturing firms during the period of 1989-1998. The authors compares TFP between
exporters with non-exporters having similar observable characteristics, focusing on whether it
differed according to firms’ existing level of exposure to foreign firms within their domestic
market. The rationale is that firms, by operating in export markets, are likely to benefit in
terms of TFP growth from competition and technology transfers arising from the presence of
foreign firms. In the analysis, exporters were differentiated from non-exporters using dummy
variables. The exposure to foreign firms was expressed by three measures, two representing
international competition and one knowledge: one was the Grubel and Lloyd index,
representing the extent of the similarity between imported and exported products; the second
was a combination of the share of industry exports in the related output and the Grubel and
Lloyd index; and the third was the ratio of industry R&D expenditure to related industry
output. The results suggest the existence of a learning-by-exporting effect. However, this
effect was found to be lower for those industries whose firms already had a high exposure to
foreign firms through international competition. From these results, it seems that firms learn
and increase their TFP once they start exporting. However, firms that have already been
exposed to foreign firms, and thus whose TFP has already increased as a result of competition
and technology transfers, are likely to experience less of a “learning by exporting” effect and
lower TFP growth as a result.
García et al. (2012) took a different approach from the previous studies by considering how
firms with different levels of absorptive capacity, measured as R&D expenditure, benefit
from learning by exporting. The measure of exporting used was the export status, which took
the value of 1 if a firm was exporting and 0 otherwise. From a sample of 1,534 Spanish

83
manufacturing firms during the period of 1990-2002, the results indicate that firms learn by
exporting. In particular, the firms benefiting the most from learning by exporting, in terms of
both labour productivity and TFP, were those with a relatively high level of absorptive
capacity, measured in terms of R&D and, hence, technological advancement. Firms having
relatively high levels of R&D investment were found to have better performance than those
having relatively low levels.
The findings of the above-mentioned studies suggest that firms that engage in exporting
benefit in terms of higher TFP, supporting the learning by exporting view.
In the Chinese context, Sun and Hong (2011) analysed how exporting affects productivity by
looking at a firm-level dataset spanning 2001-2005. Exporting was represented by a measure
of export intensity. The data came from the National Bureau of Statistics of China (NBS) and
considered about 70,000 SOEs and non-SOEs with at least RMB 5mn of sales. In order to
analyse how various ownership types interact with the export premium, the export variable
was combined with ownership variables. In addition, in order to analyse how firms belonging
to different industries are exposed to export markets, an industrial export intensity variable
was included. The authors subsequently investigated the learning-by-exporting effect by
adding a variable representing experience (the number of years since a firm started exporting)
and another representing the interaction between experience and export intensity. The results
from their fixed effects’ estimation suggest the existence of a positive effect of export
intensity on firm productivity. However, since this analysis was likely to be characterised by
the presence of the endogeneity issue, they also adopted an instrumental variable approach.
The coefficients for ownership variables suggest that SOEs are less productive, while
foreign-owned companies are the most productive. However, it appears that as the share of
foreign ownership increases, the positive effect of exporting decreases. When the variables
representing export experience and its interaction with export intensity were added to the
model, exporting experience was found to have a positive effect on productivity, while the
interaction variable had a negative effect. These results suggest that firms with longer
exporting experience are more productive. However, the positive effect decreases with the
length of export experience. When the instrumental variables approach was adopted, the
effect of export intensity became insignificant.
Yu (2010) examined the effect of exporting on Chinese firms’ TFP in terms of processing
trade and import competition through tariff reduction policies. Firm-level production data for
2000-2006 was taken from China’s National Bureau of Statistics of manufacturing
enterprises, which covers both SOEs and non-SOEs. The number of firms studied ranged

84
from 162,885 in 2000 to 301,961 in 2006. TFP was estimated using the Olley and Pakes
(1996) approach. As this approach tends to overestimate the coefficient on capital, the author
also adopted the system-GMM developed in Blundell and Bond (1998). A 10% tariff
decrease was found to generate a 12% productivity gain.
Du et al. (2012b) examined how Chinese firms’ TFP is impacted by entry into and exit from
export markets. In contrast with previous studies on the effect of exporting on productivity,
the study separated exporting firms into domestic and foreign-owned. The number of firms
studied varied from about 150,000 at the end of the 1990s to over 240,000 in 2005. In order
to deal with the potential endogeneity issue, the authors adopted the OP (1996) approach and
some variants, while the matching technique was adopted to isolate the impact of export
participation on firm productivity. The results suggest that domestic firms achieve
productivity gains once they start exporting, an effect that increases in the following years.
Foreign firms, on the other hand, do not show any significant productivity increase once they
start exporting or when they continue to export. When domestic firms exit from export
markets, their productivity slows, while the same effect is not seen in foreign-owned firms.
Interestingly, after classifying firms according to their technology level, it appears that the
productivity gains achieved by firms that were starting to export were more significant in
industries characterised by high and medium technology levels than for firms with low
technology levels. It might be that foreign-owned firms do not need significantly improve
their efficiency or innovate by exporting. Domestically owned firms might have more room
for productivity improvements. Based on above results, it seems that exporting has a positive
effect on firms’ TFP.
This section has analysed the relationship between a firm’s engagement in export activities
and its TFP. In this regard, there exist two main contrasting views. One suggests that TFP is
likely to determine a firm’s decision to export, and hence to self-select into a new market.
This is because only the most productive firms are able to afford the sunk costs that exporting
activity entails (e.g. spending time collecting information on export markets, structuring a
platform to support potential exporting activities, sustaining distribution and marketing
costs). Therefore, the benefits gained from the export activity should outweigh its costs. In
such a decision, a firm will consider various factors, among them TFP, which is a measure of
the firm’s economic performance and competitiveness. Therefore, TFP is likely to determine
whether a firm self-selects into the export market.
In contrast to the “self-selection” view is the “learning by exporting” view. According to this
view, a firm learns by engaging in exporting how to become more productive and thus more
85
competitive. The more a firm exports, the higher its productivity becomes. This is because by
participating in foreign as well as domestic markets, the firm faces a larger number of
competitors. In order to survive in such an environment, the firm would have to constantly
improve its productivity by undertaking TFP-enhancing measures. Moreover, exporters are
likely to benefit from the commercial interactions that exporting entails (e.g. interacting with
foreign economic agents, learning from customer feedback, and observing innovative
technologies, competing products and competitors’ working practices). However, the learning
by exporting effect is likely to be lower in those industries whose firms have already had high
exposure to foreign firms through international competition. The knowledge of international
markets and competition is adopted by the entrepreneur and can be exploited to increase the
firm’s TFP through product and process improvements and the adoption of innovative
machinery. Therefore, according to the learning by exporting view, a firm learns how to
improve its productivity the more it exports. Some studies support the self-selection view, in
which the most productive firms enter into the export markets. Most of these studies
document the existence of a self-selection effect along with the absence of a “learning by
exporting” effect. However, by focusing on developing countries and using different proxies,
other studies have found that once firms start exporting, they learn how to improve their
productivity. The empirical results indicate that exporting has a positive effect on TFP.
2.4.9. Managerial Ability
Managerial ability can be defined as “the knowledge, skills and experience, which is often
tacit, residing with and utilized by managers” (Holcomb et al., 2009, p.459). Managerial
ability represents the combination of manager characteristics that, through interaction, results
in decisions that shape how a firm operates. It can be further decomposed into general, firm-
specific and industry-specific managerial ability, leading to differences among decision
makers. Since all managers are unlikely to possess the same characteristics, some might be
more skilled than others. Holcomb et al. (2009) suggest that managerial ability results from
domain and resource expertise. Domain expertise is the ability of managers to understand
their industry and the main components of their firms, such as products, markets and
strategies. Resource expertise represents the ability of managers to best use the resources they
possess, such as labour and capital. Concerning domain expertise, a manager at an
automotive firm might be more knowledgeable than his competitors regarding consumer
preferences, and thus more capable of adapting the company’s products accordingly.
Moreover, concerning resource expertise, the same manager might be more capable than

86
others of devising strategies to match the firm’s workforce with its physical assets. In
particular, it is crucial for managers to foster creativity and innovation among employees,
which is likely to result in higher TFP. Managers with higher managerial ability are expected
to achieve superior firm performance, which can be seen in terms of TFP growth. Managers
play a prominent role within firms. “Managers are conductors of an input orchestra. They
coordinate the application of labour, capital, and intermediate inputs. Just as a poor conductor
can lead to a cacophony rather than a symphony, one might expect poor management to lead
to discordant production operations” (Syverson, 2011, p.336). Although a firm may possess
qualitative inputs, employ the most highly-skilled employees, and possess the best production
techniques and most innovative machinery, managers have the ultimate power to combine the
available resources in the best possible way for productive purposes. Koprowski (1981)
argues that good management practice occurs when the management is focused on increasing
productivity. For example, rewarding or promoting high performing employees within a firm
is likely to generate TFP growth. If this does not occur, such employees are likely to leave the
firm, possibly resulting in a TFP decrease. A manager has the opportunity to make the best
use of the available resources to achieve TFP growth. The manager’s decisions can also allow
the firm to simply survive, or, in the worst case, lead the firm to exit its industry due to low
TFP. The empirical results from the literature seem to support a positive effect of good
managerial practices on TFP.
For example, Ichinowski et al. (1997) studied the effect of human resource management
(HRM) variables on the productivity of 36 finishing lines owned by 17 different steel
companies. Productivity was measured as the percentage of the operating time that a
production line was running. In this study, the HRM variables provide a measure of the work
practices adopted by steel firms in their management of personnel: incentive pay, recruiting
and selection, teamwork, employment security, flexible job assignments, skills training and
communication. As the authors acknowledge, examining the impact of a single practice on
productivity would produce biased estimates since practices interact and form synergies.
Therefore, the practices were grouped into four different combinations, or “systems”, based
on their level of innovation. The study’s results provide an interesting insight, as HRM
systems were found to be determinants of productivity. However, the effects on productivity
of single HRM practices were found to be small. This suggests that within a firm, the
introduction of a single HRM practice is not likely to cause a significant TFP improvement.
However, its effect is more likely to be significant when combined with other complementary
practices due to the creation of synergies. From these results, one would infer that the
87
introduction of HRM systems leads to productivity improvements. However, the results
should be interpreted with caution since the study only looked at steel companies. Therefore,
such an analysis should be extended to more sectors. Moreover, the size of the sample
adopted was small, with only 36 production lines examined.
Lazear (2000) analysed improvements in productivity due to a change in pay practices by
examining the output produced by 3,000 workers within an auto glass company over a period
of 19 months. Rather than analysing many practices or systems of practices as did Ichinowski
et al. (1997), the study focused on just the pay practice. When it was switched from an hourly
wage to piece-rate pay, the output per worker was found to improve by 44%. This was due to
the incentive effects associated with the new pay practice, which pushed workers to increase
their efforts and increased the ability of the firm to hire and retain the most productive
workers. Although there was a strong increase in productivity, it would be interesting to see
whether this was accompanied by a decrease in quality as workers shifted their focus to
output quantities. Since the observed unit was the worker, the study had a much larger sample
than Ichinowski et al.’s (1997). In addition, it focused on a specific management practice.
Although the pay practice had a positive effect on productivity, it does not mean that other
potential management practices are likely to be successful in raising productivity. Moreover,
since the results are focused on a specific activity in a firm, the results cannot be extended to
other industries.
A more comprehensive study than the above two was done by Bloom and Van Reenen
(2007), who examined 18 management practices through a survey of 732 medium-sized
manufacturing firms across the US, France, Germany and the UK. Management practices
were measured using answers provided by firm managers regarding five different categories
concerning operations monitoring, targets and incentives. The study found the measures of
management practice to be positively associated with measures of firm performance, among
them TFP, for all the countries. Therefore, it seems that good management practices are
positively associated with productivity. Poorly managed firms were found to be mainly
family-owned and to operate in environments characterised by low competition. The former
effect might be because family-owned firms, which often choose their CEOs from among
their primogeniture, are less likely to be well managed. In the latter effect, an environment
characterised by low competition would enable the least productive firms to survive and
disincentivise managers to upgrade their practices by reducing slack and pursuing innovation,
which are supposed to increase TFP. In a more competitive environment, on the other hand,
the least productive firms are likely to exit the industry while allowing the most productive
88
firms to thrive and gain market share. It must be noted that the authors of the study measured
the correlations between management practices and the various measures of firm
performance and not the causal effects of management practice changes on firm performance.
In a subsequent study, Bloom and Van Reenen (2010) extended the same methodology to a
larger sample of 5,850 firms across 17 countries. Their results suggest that the US, Japan and
Germany have the highest management scores, while countries such as China, Brazil and
India have the lowest scores. By measuring the correlation between measures of firm
performance, among them productivity, and management practices, their results suggest a
positive association. However, being correlations, the results could indicate that good
management practices result in high productivity, or that high productivity results in the
adoption of good management practices.
The studies by Ichinowski et al. (1997) and Lazear (2000) suggest that when firms adopt
good managerial practices, productivity is likely to improve. However, since these analyses
were limited to one sector each, the results cannot be extended to other industries. The studies
by Bloom and Van Reenen (2007; 2010), on the other hand, cover more firms, sectors and
countries. They suggest that there is a positive association between management practices
and productivity. However, since the relationship is represented by a correlation, no direction
of causality from one factor to the other can be inferred.
In this section, the relationship between managerial ability and productivity has been
discussed. Managerial ability represents the combination of a manager’s characteristics,
which, by interacting with one another, result in decisions that shape how a firm operates.
The term can be further decomposed into general, firm specific and industry specific.
Managers might differ in their abilities because of different domain and resource expertise. In
particular, within resource expertise, it is crucial for managers to foster creativity and
innovation among employees, which is ultimately likely to result in higher TFP. Managers
with greater abilities are expected to achieve superior firm performance, which can be
measured in terms of TFP growth. Thus, managers have a prominent role within firms.
Although a firm may use qualitative inputs, employ the most skilled employees, possess the
best production techniques and the use most innovative machinery, managers have the
ultimate power and responsibility to combine the available resources in the best possible way.
Koprowski (1981) argues that good management practice occurs when the management is
focused on increasing productivity. The empirical results from the literature support a
positive effect of good managerial practices on TFP, although the studies are focused on
specific sectors and small samples. Other studies that have extended the analysis to a large

89
number of firms, sectors and countries suggest a positive correlation between managerial
practices and productivity. However, since these studies do not look at the direction of
causality, further investigation is needed.
2.4.10. Marketing Capabilities
Barney (1991), a proponent of the resource-based view of the firm, argues that firms within
an industry differ according to the resources they possess. This suggests that each firm has a
set of resources that are unique. A resource can, therefore, represent a firm-specific advantage
(FSA), that is “a unique capability proprietary to the organization. It may be built upon
product or process technology, marketing or distributional skills. The FSAs are based
ultimately on a firm’s internalization of an asset, such as production, knowledge, managerial,
or marketing capabilities over which the firm has proprietary control” (Rugman, 2005, p.34).
According to this definition, among the various firm-specific advantages are the firm’s
marketing capabilities. Vorhies and Morgan (2005) argue that these represent the capacity of
a firm to transition resources into valuable output. It can also be said that the “marketing
capability of a firm is reflected in its ability to differentiate products and services from
competitors and build successful brands. Thus, a firm that spends money on advertising and
promoting its products can increase sales both by expanding the sales of the product category
and by getting customers to switch to their brands. Firms with strong brand names can charge
premium prices in foreign markets to enhance their profitability as well” (Kotabe et al., 2002,
p.82). Vorhies and Morgan (2005) identify the following marketing capabilities: product
development, pricing, channel management, marketing communications, selling, market
information management, marketing planning, and marketing implementation. These may
therefore constitute a crucial determinant of a firm’s performance. The findings from the
literature seem to support this view.
Morgan et al. (2009) analysed a cross-industry sample of 114 US firms to examine the effect
of three marketing capabilities (market sensing, brand management, and customer
relationship management) on the firms’ revenue and margin growth rates. The three
marketing measures were assessed through a survey, using a point scale. Market-sensing
capabilities had a significant positive effect on the revenue growth rate, while having a
negative effect on the margin growth rate. Customer relationship management capabilities
had a significant negative effect on revenue growth rate and a positive effect on margin
growth rate. Brand management capabilities were found to have a significant positive effect
on revenue growth rate and a negative effect on margin growth rate. Therefore, the results
90
point to the different effects of each capability on the various measures of firm performance.
Although the results of this study provide an insight into the relationship between marketing
capabilities and firm performance, the measurement of capabilities might be too subjective,
as it is scored from questions asked to firms’ managers. The use of a more objective measure
of marketing capabilities would have been preferred.
For the UK, Nath et al. (2010) examined the impact of firms’ functional capabilities
(marketing and operations) and diversification strategies (product/service and international
diversification) on financial performance. The sample comprised 102 UK-based logistics
companies over the period of 2005-2006. Given the importance of marketing and operational
capabilities and diversification strategies in logistics, the industry is valuable for analysing
the effect of these factors on financial performance. However, it would have been preferable
to extend the analysis to many other sectors. Despite this limitation, the authors adopted a
valuable measure of marketing capabilities, with the variables being marketing expenditures,
intangible resources, relationship expenditures and installed customer base. The result of the
estimation, conducted through a Data Envelopment Analysis (DEA), indicate that marketing
capabilities strongly affect the financial performance of firms.
Yu et al. (2014) examined the impact of marketing capabilities and operational capabilities on
firms’ financial performance. This relationship was studied by applying an input-oriented
constant return to scale DEA model on a sample comprising 186 retail firms in the UK during
2010. To measure marketing capabilities, they followed Nath et al.’s (2010) approach,
whereby sales were used as an output measure of marketing activity, while marketing
resources were measured by the following three inputs: stock of marketing expenditure,
intangible resources and relationship expenditure. Their results suggest that marketing
capabilities have a significant positive effect on operational capability, consequently
improving efficiency in the financial sector.
While the above studies looked at firms based in developed markets, Wu (2013) looked at
19,653 firms spread across 73 emerging economies to examine the effect of the firms’
marketing capabilities on their performance. The geographic breadth of the sample enabled
the author to shed light on the overall effect of marketing capabilities on firm performance in
emerging economies. In the study, marketing capabilities were proxied by an indicator that
averaged the following three items: the number of months the firm took to plan its product
mix and target markets; the number of months it took for the firm to allocate the necessary
human resources; and the number of months in which the investment was made. Although the
proxy for marketing capabilities was comprehensive, adopting time measures does not seem
91
ideal, as time might not indicate the true extent of firms’ marketing capabilities. Despite this
shortcoming, the results suggest that marketing capabilities positively affect firm
performance. It also appears that marketing capabilities have a stronger effect on firm
performance in countries with higher levels of economic development, individualistic
societies and weak legislative systems.
Also in the developing country context, Lee and Rugman (2012) analysed the impact of
firms’ specific advantages on performance by looking at a sample of 150 Korean
multinational enterprises for the year 2004. The firm-specific advantages considered were
innovation capabilities measured by R&D, and marketing capabilities measured by selling,
general and administrative expenses. Specifically, a firm’s marketing capabilities were
measured as the total amount of selling, general, and administrative expenses divided by the
number of employees. The extent of the relationships was examined using a two-stage
feasible generalised least square regression model. The results suggest that both marketing
and innovation capabilities affect the performance of firms in a non-linear, U-shaped manner.
Moreover, it seems that Korean firms can exploit their firm-specific advantages when they
attract FDI from the Asian Pacific region, enabling them to strengthen these advantages.
The empirical results from research at firm level seem to suggest that marketing capabilities
positively affect a firm’s performance. However, the studies have not considered the impact
of marketing capabilities on any specific productivity measure. Despite this, the relationship
between marketing capabilities and productivity is expected to be negative.
2.4.11. Other Studies
This section differs from the previous sections in that it covers different determinants rather a
single specific determinant. Since significant research on these determinants has not been
done for Chinese firms, they are discussed together in this section.
Chen and Guariglia (2013) looked at the relationship between Chinese firms’ financial factors
and productivity. In particular, they analysed the link between the availability of internal
finance and productivity by examining this relationship from different perspectives:
ownership, liquidity level and involvement in exporting. Firms in the sample belonged to the
manufacturing sector, according to annual accounting reports filed with the National Bureau
of Statistics during the period of 2001-2007. The sample included 130,840 SOEs and non-
SOEs from 31 provinces, and which had at least RMB 5mn sales. The empirical analysis of
TFP was conducted using the SYS-GMM approach. The results show that the firms’ TFP was
positively affected by their cash flow, suggesting that the firms were financially constrained
92
and mainly relied on internal funds. In terms of ownership, private and foreign-owned firms’
TFP was positively affected by their cash flow, while SOEs’ TFP was not, suggesting that
only the first two categories of firms were financially constrained. For both private and
foreign firms, the effect was found to be worse for those firms characterized by negative
liquidity. This suggests that firms use their liquidity in order to pursue productivity-
enhancing activities when there are fluctuations in their internal finance. In terms of
exporting, foreign-owned firms that did not export had a higher sensitivity of TFP to cash
flows than those who did, although the difference in sensitivity with private firms was not
significant.
Zhang and Liu (2013) examined the relationship between wages and labour productivity in
the manufacturing sector. This was analysed using a dataset of manufacturing enterprises for
the period of 1998-2007 taken from the Chinese National Bureau of Statistics. The sample
covered both SOEs and non-SOEs having sales of more than RMB 5mn. Therefore, the
sample was the same as used by Chen and Guariglia (2013). Two labour productivity
variables were used as measures of performance. The main difference with the previous
studies in the area was the use of productivity as an independent variable, while previous
ones used it as a dependent variable. The results suggest a positive correlation between wages
and labour productivity, although this effect decreases over time.
This section has reviewed studies on different determinants of productivity. For each
determinant, significant research at the firm level for the Chinese context is still lacking.
Thus, further evidence is needed to confirm the extent of the relationship of the main
determinants discussed (liquidity and wages) with productivity. The studies discussed in the
following section consider multiple determinants of productivity.
2.4.12. Studies Analysing Multiple Determinants
The studies discussed in the previous sections focused on analyzing how firm-level
productivity was affected by one or a few determinants. Although they provide a valuable
insight, they suffer from one major limitation. Productivity has many more determinants that
interact together and generate synergies. Ignoring the other important determinants of
productivity would generate biased estimates of the production function and of productivity.
Moreover, productivity-enhancing actions undertaken by a firm according to such results are
likely to be limited. A few studies have addressed this issue by considering multiple
determinants of productivity. A firm can implement better TFP-enhancing decisions by
considering a wider range of potential factors determining TFP. Only four studies have

93
analysed TFP at the firm level in China by considering multiple determinants. These studies
differ in terms of their estimation methodologies, the samples adopted, and the determinants
analysed.
For example, Yao et al. (2007) considered the following determinants of TFP: size,
ownership, direct sales, and human capital. In order to calculate the efficiency scores of
firms, they adopted a Data Envelopment Analysis approach. TFP growth was subsequently
measured using the Malmquist index, while a Tobit regression was adopted to estimate the
effects of TFP determinants. The sample size was small, comprising a panel of only 22 firms
belonging to the insurance industry during the period of 1999-2004. Despite the small sample
size, the empirical results suggest that size, direct sales and human capital have a positive
effect on firms’ productivity. Interestingly, in contrast to what has been suggested by
previous studies regarding ownership, State-owned firms showed better performance than
non-State-owned ones. The authors suggest that such performance is the result of the
dominance of State-owned enterprises within the industry, as the firms are backed by the
government, and by the characteristics of the industry itself, in which customers emphasize
brand name, trust and reliability.
Li et al. (2010) looked at effect of the following institutional factors on firms’ productivity:
regional differences in commercialisation and the existence of market segmentation. They
also considered the following determinants of productivity: exporting, R&D, interest
payments, age, size, management level, and ownership. Moreover, they analysed the
relationship between TFP, exporting, financing and innovation. This study was conducted
using a sample of 647,987 firms belonging to 30 industries over the period of 1999-2007.
This data was taken from the Chinese NBS, and included medium and large-sized firms
having at least RMB 5mn in sales. Although the sample seems to be representative of the
Chinese industrial sector, it would have been better to also consider smaller firms, as this
would have provided additional insight into the determinants of small firms’ TFP. In the
study, TFP was estimated using a translog production function and the Levinsohn and Petrin
(2003) semi-parametric approach. The results suggest that firms based in regions
characterized by a faster commercialisation process record higher productivity. On the other
hand, firms based in more segmented regions tended to record lower productivity. Overall,
the results of the study indicate that regional imbalances and differences in commercialisation
and market segmentation have different effects on productivity.
Brandt et al. (2012) analysed TFP growth for a panel of firms representing 90% of Chinese
manufacturing output during the period spanning 1998-2007. The number of firms studied

94
ranged from 148,685 in 1998 to 313,048 in 2007. The dataset was obtained from the National
Bureau of Statistics, and included SOEs and non-SOEs having sales above RMB 5mn. In
comparison with other studies using the same dataset, the analysis also included industry
deflators, industry agreements and programmes to match firms over time and capital stock
series. In the estimation, productivity growth was measured using the Tornqvist index
number. Productivity levels were measured using a Caves’ index, which allows the
comparison of a firm’s productivity to the industry average. In order to confirm the
robustness of their results, the authors also estimated productivity using the Olley and Pakes
(1996) and Ackerberg et al. (2006) approaches. According to the estimation results, TFP
growth was 2.85% on average when a gross output production function was utilized, and
7.96% when a value added production function was utilized. In comparison with the previous
studies, productivity growth was decomposed following the methodology developed by
Foster et al. (2001), enabling an understanding of the extent to which TFP growth is
determined by “within-firm” productivity growth, “between-firm” productivity growth, the
entrance of relatively high productive firms or the exit of low productive ones. The empirical
results indicate that the entry of relatively high productive firms contributed to two-thirds of
the productivity growth in the Chinese industrial sector during the period. Moreover, the
results indicate that the growth of value added in the Chinese industrial sector was largely
due to improvements in existing firms and the entry of relatively high productive firms.
Despite providing valuable findings, the methodologies adopted by Brandt et al. (2012) did
not allow for fixed effects, and did not include the vector 𝑋𝑖𝑡 of TFP determinants, making
them unable to explain what determines TFP levels.
While the above two studies analysed TFP across a wide range of industries, Shen and Song
(2013) focused only on the iron and steel industry during the period of 1998-2007. In the
study, the following determinants of TFP were considered: capital intensity, the share of total
revenues generated by new products, the market share within the iron and steel industry, the
Herfindahl index of industrial concentration, firm scale, a marketization index, and the share
of exports in total revenue. While the sample source was the same as in previous studies, its
size was considerably smaller, with the number of firms ranging from 1,654 in 1998 to 4,929
in 2007. In order to estimate TFP, the authors adopted the one-step Wooldridge (2009) GMM
method and tested the robustness of their results using the Olley and Pakes (1996), Levinsohn
and Petrin (2003) and Ackerberg et al. (2007) methodologies. Their results showed that TFP
increased during the period analysed and was positively affected by R&D investment, firm
size, market share and marketization reform. On the other hand, TFP was negatively affected
95
by market monopoly power and capital intensity. Moreover, determinants of productivity
varied across firms having different characteristics, such as size, ownership and location. It
seems that, for small firms, productivity is positively affected by market share, while R&D
negatively affects it. In contrast, for large SOEs, productivity is not sensitive to market share
or R&D. For large private firms, productivity is determined by their intensity of export
activities, measured as the share of exports in total revenue.
This section has reviewed firm-level productivity studies, which, compared to those
presented in the previous sections, consider the effect of multiple determinants on TFP rather
than focusing on only one determinant. This approach is important because TFP is
determined jointly by a combination of factors rather than just one. By interacting with one
another, these factors are likely to generate a different effect on productivity than when they
are considered individually. For this reason, these studies provide better insight into the
potential determinants of productivity at the firm level. The next section discusses how the
study conducted in this thesis differs from the previous ones, and how it contributes to the
existing literature.
2.4.13. The Contribution of this Study
The study conducted for this thesis belongs to the literature analysing TFP and its
determinants in China at the firm level. Previous studies in this area differ from one another
in terms of their aims, estimation methodologies, datasets, determinants and the time periods
considered. There are four important studies that analyse Chinese TFP at the firm level (Yao
et al., 2007; Li et al., 2010; Brandt et al., 2012; Shen and Song, 2013). The study conducted
for this thesis differs from them in four respects.
The first distinction is the use of a more comprehensive set of determinants of TFP in the
estimation, providing a better and broader understanding of the potential determinants of total
factor productivity in China. Such determinants are included in the estimation of TFP because
their omission would produce biased estimates of the production function, and hence biased
estimates of TFP. The choice of determinants is also motivated by the empirical results from
the literature and the information available in the Chinese National Bureau of Statistics
(NBS) dataset from which the sample used in this study has been sourced. Thus, although the
previous studies have provided valuable insights, the current study has extended the set of
TFP determinants studied to include the following: political affiliation, ownership structure,
engagement in exporting, extent of competition, Marshallian (or MAR) spillovers, Jacobian
96
(or Jacob) spillovers, city spillovers, liquidity, age, R&D expenditure, time trend, and
marketing capabilities.
The second major distinction from the studies reviewed above is the analysis of a wider set of
26 industries. In this study, the sample is taken from the yearly accounting reports filed by
industrial firms to the Chinese National Bureau of Statistics. Such a sample considers all
industrial medium- and large-sized firms, both State-owned and non-State-owned, having
annual sales above RMB 5mn. These belong to the entire manufacturing and mining sectors
and are located in 31 provinces or municipalities. The estimation of TFP determinants across
a wide range of industries allows the accounting for differences in technology, thus avoiding
the assumption that firms operate using a standard technology shared across all industries.
While most previous studies have used the Olley and Pakes (1996) or Levinsohn and Petrin
(2003) methodologies to analyse the determinants of TFP at the firm-level in China, this
study adopts SYS-GMM, an approach developed by Arellano and Bond (1991) and Blundell
and Bond (1998), and subsequently applied in a production function by Blundell and Bond
(2000). SYS-GMM is a system of estimated equations, comprising an equation in first-
differences, instrumented by its lagged levels, and an equation in levels, instrumented by its
lagged first-differences. The major advantage of this methodology, compared to the widely
used semiparametric approaches, is the allowance for firms’ fixed effects. As previous studies
have indicated that firms have unmeasured productivity advantages that remain constant over
time and that need to be captured, the SYS-GMM approach enables the consideration of such
fixed effects. Moreover, SYS-GMM has the advantage of addressing the endogeneity of the
right-hand-side variables (including the lagged dependent variable) as well as selection bias
by using lagged values of the endogenous variables as instruments in the first differences
equation, and first-differences of the same variables as instruments in the levels equation
(Blundell and Bond, 1998). SYS-GMM is particularly preferable to the semiparametric
methodologies of Olley and Pakes (1996) and Levinsohn and Petrin (2003), as these do not
allow for fixed effects and are based on strong and unintuitive assumptions, which generate
collinearity problems in the first stage of estimation (Ackerberg et al., 2006). Van
Biesebroeck (2007) compared the sensitivity of five different productivity estimators (index
numbers, data envelopment analysis, stochastic frontiers, GMM, and semi-parametric
estimation) using a Monte-Carlo simulation. Although each method has its own advantages
and disadvantages, the system GMM estimator was found to be the most robust technique in
presence of measurement errors and technological heterogeneity.

97
The fourth major distinction from most of the previously mentioned studies is the
decomposition of TFP growth using the approach developed by Haltiwanger (1997). These
methods separate TFP growth into the contribution provided by the following: a within-firm
component representing the impact of the resource reallocation within existing firms,
according to their initial shares of output in their related industries; a between-firm
component indicating a change in the output share of firms, weighted by the deviation of the
firm’s initial productivity from the initial industry index; a covariance component, measuring
whether a firm’s increasing productivity corresponds to an increasing market share; an
entering component indicating the contribution of entrant firms to their related industry’s TFP
growth, measured with respect to the initial industry index; an exiting component indicating
the contribution of exiting firms to their related industry’s TFP, measured with respect to the
initial industry index. In order to gain an additional understanding into the determinants of
TFP growth, this decomposition is also performed at the industry, province and political
affiliation/ownership levels. Since Melitz and Polanec (2012) have found this decomposition
to be characterized by biases, their approach is also adopted in order to understand which set
of results is the most appropriate.
In summary, most of the existing studies on this topic do not use multiple covariates in their
models to explain what determines TFP in China, do not include firm-level fixed effects, do
not cover the broad range of industries studied in the present paper, and do not decompose
TFP growth. Therefore, this study builds on the existing literature by taking these four issues
into account, thus distinguishing this study from previous studies on firm-level TFP
estimation in China and contributing to the literature in that way. Overall, this study aims to
understand what has determined TFP levels and growth rates across Chinese firms during the
period of 1998-2007, and how total TFP growth has differed across firms belonging to
different industries, based in different provinces, and characterised by different combinations
of ownership structures and political affiliations. The results can be used to infer potential
microeconomic productivity-enhancing reforms targeting the most relevant determinants of
TFP.
3. An Analysis of the Determinants of TFP Levels
Chapter 1 introduced the thesis. Chapter 2 discussed TFP, its importance, its measurement
and its determinants. It also reviewed the existing studies on Chinese firm-level TFP and
proposed the contribution provided by the current study. This chapter analyses what
determines TFP levels across Chinese industrial firms.
98
Section 3.1 describes the dataset adopted, while Section 3.2 describes the SYS-GMM
estimator. Section 3.3 introduces the two-sample Kolmogorov-Smirnov test. Section 3.4
describes the variables adopted, the related descriptive statistics and the hypotheses to be
tested. Section 3.5 presents the results of the SYS-GMM estimation. In order to check which
set of results is the most valid, the Levinsohn and Petrin (2003) semiparametric estimation is
also applied, and its results are discussed in Section 3.6. Section 3.7 analyses the relative
importance of the determinants of TFP levels. The results of the Kolmogorov-Smirnov tests
are discussed in Section 3.8.
3.1. Dataset
The dataset adopted in this study is taken from the yearly accounting reports filed by
industrial firms with the Chinese National Bureau of Statistics. In this dataset, the unit
observed is the firm, which is defined as a legal unit and identified by a unique ID. Brandt et
al. (2012) point out that large Chinese firms might include many subsidiaries that would be
represented as additional firms if they were registered as legal units. Moreover, a firm
receives a new ID any time it changes its legal registration, for example, after a restructuring,
merger or acquisition. In order to address this issue, Brandt et al. developed an algorithm that
makes possible to match firms’ IDs over time using both their code and other identifying
information. The same algorithm is adopted in this study and is available online.1 Where
possible, Brandt et al. (2012) tracked firms using other types of information, such as their
name, industry and address. 95.9% of firms’ matches were performed using their IDs, while
4.1% using other identifying information. The sample adopted in the current study includes
both State-owned firms and non-State-owned firms with at least RMB 5mn in annual sales.
The firms are located in 31 provinces, or province-equivalent municipal cities, and belong to
the mining, manufacturing and public utilities sectors. The related industries are classified
according to two-digit Chinese Industrial Classification (CIC) codes. A firm’s membership in
an industry is defined according to the sales generated by its major product. The industries
are the following: Other Mining (SIC10+80), Food Production (SIC14), Tobacco (SIC16),
Textile (SIC17), Apparel & Footwear (SIC18), Leather (SIC19), Timber (SIC20), Furniture
(SIC21), Papermaking (SIC22), Printing (SIC23), Cultural (SIC24), Petroleum Processing
(SIC25+70), Chemical (SIC26+28), Medical (SIC27), Rubber (SIC29), Plastic (SIC30), Non-
metal Products (SIC31), Metal Products (SIC32+33+34), Machinery & Equipment
1 The complementary information needed to use the NBS dataset developed by Brandt et al. (2012) can be
downloaded from the following link: http://www.econ.kuleuven.be/public/N07057/CHINA/appendix/
99
(SIC35+36), Transport Equipment (SIC37), Measuring Instruments (SIC41), Other
Manufacturing (SIC42+43), Electronic Power (SIC44), Gas Production (SIC45), Water
Production (SIC46) and Coal Mining (SIC60).
Since the National Bureau of Statistics dataset does not consider firms having annual sales
lower than RMB 5mn, 80% of industrial firms are excluded from the sample. Despite this
exclusion, Brandt et al. (2012) found that by using the full census of firms periodically
carried out in China, the omitted firms only accounted for about 9.9% of output and 2.5% of
exports. In addition, Brandt et al.’s (2012) comparison between the 1995 National Bureau of
Statistics dataset and the 2004 census indicate that the former has similar coverage, which
enabled them to argue that the exclusion of small firms with annual sales lower than RMB
5mn in the NBS dataset did not generate systematic bias in their estimates.
The unbalanced sample adopted in this study comprises 2,183,709 firm-year observations,
which correspond to a wide number of firms, ranging from 148,474 in 1998 to 331,453 in
2007. The sample’s structure can be seen in Table A of the appendix. Only 5.4% of firms,
corresponding to 14.8% of firm-year observations, are included in the accounting information
for the entire sample period. 14% of firms, corresponding to 16.7% of firm-year observations,
have data for one to two years before exiting from the sample. Brandt et al. (2012) suggest
that this is due to ownership restructuring caused by the economic reforms implemented
during the 1990s. Some firms also do not have information on variables used to calculate
TFP. According to Brandt et al. (2012), this is because the information was not originally
reported, or because variables such as real capital stock or value added have negative values.
Moreover, firms with less than eight employees are not considered because they fall into a
different legal regime. This implies that 17% of the original number of firms is removed from
the sample in 1998, and the ratio falls by 6% each year after 2001.
3.2. System-GMM Estimation
Total factor productivity is the level of output that is not attributable to the level of factor
inputs, and is thus measured as a residual. Section 2.3 discussed the estimation of TFP
through different approaches: ordinary least squares, fixed effects, instrumental variables,
GMM and system-GMM, and the semiparametric methods developed by Olley and Pakes
(1996) and Levinsohn and Petrin (2003).
Each of these approaches adopts different statistical analyses and is based on different
assumptions. Moreover, each is appropriate under specific circumstances. Van Beveren
(2012) compared the following estimators: fixed effects, instrumental variables and SYS-
100
GMM, and the semiparametric methods of Olley and Pakes (1996) and Levinsohn and Petrin
(2003). These were evaluated under the existence of the following estimation issues:
endogeneity of inputs, omitted variable bias, sample selection bias, and multiple-output
producing firms. Based on the results obtained, Van Beveren (2012) argues that the choice of
a specific TFP estimator should be based on the data utilised and the related assumptions
imposed.
The estimation approach adopted in this study is the SYS-GMM. Roodman (2006) suggests
that this estimator is designed for panel data analyses, such as the one conducted in this study,
having the following characteristics:
- A relatively short time period and many units considered. In this study, the time
period spans 1998-2007 and the sample ranges from 148,474 firms in 1998 to 331,453
in 2007.
- A linear functional relationship. In the production function adopted in this study, there
is a functional relationship between outputs produced, factor inputs adopted, and TFP.
- A left-hand side variable dependent on its own past realisations. In this study, this is
the case for firm output, since decision makers are likely to choose each year’s output
according to the previous year’s output.
- Independent variables that are not strictly exogenous. This indicates that independent
variables can be correlated with the past and possibly current realisations of the error.
In this study, output, employment, capital, intermediate inputs, the R&D dummy and
the exporting dummy are treated as endogenous, since firm managers are likely to
make decisions according to both the past and current realisations of the error, in this
case TFP. Because it seems that causality runs in both directions, from endogenous
variables to productivity and vice versa, the independent variables might be correlated
with the error term, represented by TFP.
- Fixed individual time-invariant effects, also known as fixed effects. Such a
consideration in this study is based on the findings of Baily (1992), Bartelsman and
Dhrymes (1998), Haskel (2000) and Martin (2008), who demonstrated that firms are
heterogeneous in terms of productivity and tend to spend long periods of time in the
same area of the productivity distribution. This suggests that firms tend to have fixed
characteristics that do not change significantly over time. As explained earlier,
productivity is likely to be correlated with the explanatory variables, potentially
generating biased and inconsistent estimates.

101
- Idiosyncratic errors, except for fixed effects, that are characterised by
heteroskedasticity and autocorrelation within firms but not across them. In this study,
productivity shocks represented by 𝜀𝑖𝑡 are serially correlated, and relative factor
inputs are likely to respond to these shocks.
In this study, TFP is measured through a log-linear Cobb-Douglas firm production function,
which includes fixed effects:
𝑦𝑖𝑡 = 𝛼𝑖 + 𝛼𝐸𝑒𝑖𝑡 + 𝛼𝑀𝑚𝑖𝑡 + 𝛼𝐾𝑘𝑖𝑡 + 𝛼𝑋𝑋𝑖𝑡 + 𝛼𝑇𝑡 + 𝜀𝑖𝑡 (47)
Here, y, e, m and k are the natural logarithms of real gross output, employment, intermediate
inputs and the capital stock, respectively, for each firm i at time t (whereby
𝑖 = 1, … , 𝑁 and 𝑡 = 1, … 𝑇). 𝑋𝑖𝑡 is a vector that includes all the variables determining TFP:
political affiliation, ownership, exporting, competition, Marshallian spillovers, Jacobian
Spillovers, city spillovers, liquidity, age, R&D and marketing capabilities. All of these
variables are included in the model because the empirical results from the literature indicate
that they either positively or negatively affect TFP. Although some of these variables might
be correlated, not including them would generate the issue of omitted variable bias, which
results in biased and inconsistent estimates. In equation (47), 𝑡 is a time trend representing
exogenous gains in TFP over time. 𝛼𝑖 is a time-invariable, unobserved, firm-specific fixed-
effect, and 𝜀𝑖𝑡 is an observation-specific error term.
Measuring TFP requires the adoption of price deflators for both inputs and outputs. Since
deflators at the firm level are not available in the dataset adopted, industry deflators are taken
from various Chinese statistical yearbooks, while the investment, or capital stock, deflator is
adopted from Brandt et al. (2012). The deflator is built through a procedure that converts the
estimates at original purchase prices into real values that are comparable across both time and
firms.
Once TFP is estimated according to equation (47) for each industry, the elasticity of output
with respect to each of the three inputs (employment, intermediate inputs and capital stock) is
obtained. This enables the measurement of TFP as a residual, or the level of output that is not
attributable to the level of factor inputs:
𝑙𝑛𝑇�̂�𝑃𝑖𝑡 = 𝑦𝑖𝑡 − �̂�𝐸𝑒𝑖𝑡 − �̂�𝑀𝑚𝑖𝑡 − �̂�𝐾𝑘𝑖𝑡 = �̂�𝑖 + �̂�𝑋𝑋𝑖𝑡 + �̂�𝑇𝑡 + 𝜀�̂�𝑡 (48)

102
In measuring TFP as a residual, the above approach should be the preferred one. Harris and
Moffat (2013) argue that a common mistake in existing TFP studies lies in excluding the
vector 𝑋𝑖𝑡 as a regressor when estimating the equation (47) and subsequently using (48) in
order to measure TFP. In such a case, the vector 𝑋𝑖𝑡 would become part of the error term 𝜀�̂�𝑡.
TFP tends to be subsequently regressed on the vector 𝑋𝑖𝑡 in order to obtain the determinants
through a two-stage estimation. Since 𝑋𝑖𝑡 is initially omitted, this would cause estimates to be
biased, generating an “omitted-variable” bias. This is the reason why the former approach for
measuring TFP is preferred to the latter.
The initial equation (47) is estimated through SYS-GMM. In comparison with other
approaches, SYS-GMM allows for the presence of fixed effects. Moreover, SYS-GMM
addresses the endogeneity and selection bias issues by using lagged first-differences as
instruments for the equation in levels, in addition to lagged levels as instruments for the
equation in first-differences2. The use of additional instruments enables the efficiency of the
estimation to be increased. Moreover, SYS-GMM allows for both endogenous regressors and
a first-order autoregressive error term, and also provides results for three additional
diagnostic tests: the Hansen test regarding the validity of the set of instruments used, and the
tests for autocorrelation, namely AR(1) and AR(2).
SYS-GMM exploits more moment conditions than other GMM approaches and can still face
the issue of weak instruments. This suggests that the parameter estimates and the related
diagnostic tests are sensitive to the instrument set adopted. An important assumption for the
validity of SYS-GMM is the joint exogeneity of instruments. The Hansen test of
overidentifying restrictions tests the null hypothesis that the instruments are distributed
independently of the production function and are uncorrelated with the residuals. Thus, a
strong rejection of the null hypothesis of the test would strongly counter the estimates’
validity.
The Arellano and Bond (1991) test for autocorrelation has the null hypothesis of zero
autocorrelation in the 𝜀𝑖𝑡 disturbances. The test for AR(1) in the first differences usually
rejects the null hypothesis. This is because the ∆𝜀𝑖𝑡 = 𝜀𝑖𝑡 − 𝜀𝑖,𝑡−1 is likely to be correlated
with ∆𝜀𝑖,𝑡−1 = 𝜀𝑖,𝑡−1 − 𝜀𝑖,𝑡−2, as the two equations share the same 𝜀𝑖,𝑡−1 item. One should pay
greater attention to the test for AR(2) in the first-differenced residuals 𝜀𝑖𝑡, as this potentially
detects autocorrelation in levels. This test analyses the relationship between 𝜀𝑖,𝑡−1 in
2 A lagged value of the dependent variable is included for SIC30, SIC32 and SIC44. For these industries, the
short-run coefficients are transformed into long-run coefficients.

103
the ∆𝜀𝑖𝑡 and 𝜀𝑖,𝑡−2in the ∆𝜀𝑖,𝑡−2. According to Arellano and Bond (1991), the presence of
first-order autocorrelation does not imply that the estimates are inconsistent, while the
presence of second-order autocorrelation does.
Since the validity of lagged levels dated 𝑡 − 2 in the first-differenced equations tends to be
rejected by the Hansen test, lagged levels dated 𝑡 − 3 (and earlier) are used, as these tend to
be accepted. This is combined with lagged first-differences dated 𝑡 − 2, which are used as
instruments in the levels equations, and tend to be accepted by the Hansen test.
In the set of variables adopted in the estimation conducted in this study, year, industry and
province dummies are included in order to control for year, industry and location effects,
respectively.
SYS-GMM is applied using Stata by performing the command xtabond2 developed by
Roodman (2006).
In order to check whether the SYS-GMM results are the most appropriate, the Levinsohn and
Petrin (2003) semiparametric approach is also used to analyse the relationship between TFP
and its determinants. Its choice is based on its widespread use in previous studies on TFP
estimation.
This section has discussed the SYS-GMM estimation approach adopted in this study to
analyse what determines TFP levels in Chinese industrial firms. The following section
discusses the two-sample Kolmogorov-Smirnov test.
3.3. Two-sample Kolmogorov-Smirnov (KS) Test
This section discusses how the Kolmogorov-Smirnov (KS) tests of equality of empirical
cumulative distributions of TFP levels are conducted and the related distributions plotted.
In the KS test, the calculated two-sample case D-statistic represents the highest horizontal
distance, or highest difference, between the empirical cumulative distributions of TFP levels,
representing the two groups compared. In the test, a binary variable with two distinctive
values is taken. Subsequently, the empirical cumulative distribution of a random variable, in
this case the natural logarithm of TFP, is compared for the first value of the group variable
with the empirical cumulative distribution of TFP level for the second value of the group
variable. Thus, the Kolmogorov-Smirnov test D-statistic is based on the maximum horizontal
deviation between two plotted curves representing the two groups’ empirical cumulative
distributions of TFP levels.

104
In the Kolmogorov-Smirnov test, the null hypothesis (H0) states that two groups have the
same empirical cumulative TFP distributions. The p-value indicates whether the maximum
horizontal deviation, or gap, between the two empirical cumulative distributions of TFP
levels is statistically significant. Therefore, a relatively small p-value is preferred to a
relatively high one, since this would reject the null hypothesis of equality of empirical
cumulative distributions of TFP levels.
Calculating a two-sided KS statistic and plotting the related empirical cumulative
distributions of TFP levels enables to test whether the distribution for one sub-group of firms
lies to the right of the distribution for another sub-group. In such case, there is first-order
stochastic dominance between such (random) variables.
One of the advantages of using the two-sample Kolmogorov-Smirnov test is that it does not
assume that the analysed data has a specific distribution. Compared to the t-statistic, the value
of the D-statistic and the related p-value cannot be influenced by scale changes such as
logged values or reciprocal ones. This means that its results do not differ when the data
values are transformed. A transformation only modifies the distribution’s frequency,
represented on the x-axis, while keeping the maximum distance between the two empirical
cumulative TFP distributions unchanged. Therefore, the Kolmogorov-Smirnov test focuses
on the relative distribution of data, and is thus robust to outliers.
In this section, KS tests are implemented and empirical cumulative distributions of TFP
levels are plotted for Chinese manufacturing firms according to the following determinants:
industry, time, political affiliation, paid-in capital ownership, province, R&D expenditure,
and exporting.
This section has introduced the Kolmogorov-Smirnov test of equality of empirical cumulative
TFP distributions. The next section describes the variables adopted, the related descriptive
statistics, and the underlying hypotheses.
3.4. Variables, Descriptive Statistics and Hypotheses
In the empirical analysis conducted in this study, different sets of variables are used. Nominal
variables, except for capital stock, are transformed to enable their comparison over the
sample period. They are thus expressed in constant year prices by adopting the industry-
specific price deflators developed by Brandt et al. (2012). As part of the production function,
the following determinants of TFP are included within the vector of variable 𝑋𝑖𝑡: political
affiliation, ownership, exporting, competition, MAR spillovers, Jacobian spillovers, city
spillovers, liquidity, age, R&D expenditure, time trend and marketing capabilities. A more
105
detailed motivation for their inclusion, their measurement and the expected effects on
productivity are discussed in this section.
3.4.1. Ownership
Various major firm shareholders might be driven by different motivations, which would be
reflected in decisions impacting firm performance, and hence TFP. The consideration of
political affiliation also considers the potential political impact that State influence might
have on a firm performance through ownership of paid in capital. Forms of ownership other
than State ownership are likely to be characterised by a relatively low impact of political
influence arising from an affiliation. This suggests that firms whose major owners differ from
the State are likely to record higher TFP. In the set of variables comprising vector 𝑋𝑖𝑡 in
equation (48), a determinant representing firm ownership structure is included. The National
Bureau of Statistics database, from which the dataset used in this study is sourced, includes a
measure of firm ownership based on the fraction of paid-in capital contributed by the
following owners: the State (p_capstate), collective firms3 (p_capcoll), legal entities
4 or
corporate investors (p_capcorporate), individual investors (p_capindividual), foreign
investors from Hong Kong, Macao and Taiwan (p_caphkmactai), and all other foreign
investors excluding those from Hong Kong, Macao and Taiwan (p_capforeign). Following
Ding et al. (2013), investors from Hong Kong, Macao and Taiwan are separated from other
foreign investors in order to take into account the “round-tripping” FDI effect described in
Huang (2003). According to Ding et al. (2013), Huang’s (2003) “Selling China: Foreign
Direct Investment During the Reform Era” points out that domestic Chinese firms might
register as foreign entities in nearby regions in order to exploit various benefits, such as tax
and legal benefits, which are provided by the Chinese government to foreign entities.
The descriptive statistics in Table 1 suggest that the majority of sample firm’s paid-in capital
over the entire time period is owned by individuals (37.9%). This is followed by
corporations/legal entities (20.9%), the State (14.5%), collective firms (12.5%), foreigners
(6.9%) and investors from Hong Kong, Macao and Taiwan (7.4%). The figures point to a
decreasing role of the State over the sample period, since the proportion of paid-in capital
owned diminishes from 33.5% in 1998 to 3.7% in 2007. The same trend occurs for the
3 Collective firms are typically owned by communities in either urban or rural areas. Those in rural areas are
also commonly known as township and village enterprises (TVEs). 4 Legal entities refer to industrial enterprises, construction and real estate firms, development companies,
transportation and power companies, security companies, trust and investment companies, foundations and
funds, banks, technology and research institutions, and so on.
106
proportion of paid-in capital owned by collective firms, which decreases from 28.4% in 1998
to 4.6% in 2007. In comparison, the trend moves in the opposite direction for
corporations/legal entities (from 12% in 1998 to 26.9% in 2007), individuals (from 14.2% in
1998 to 49.4% in 2007), investors from Hong Kong, Macao and Taiwan (from 6.5% in 1998
to 7.5% in 2007) and foreigners (from 5.4% in 1998 to 7.9% in 2007). Overall, the figures
point to a decreasing role of the State in the manufacturing sector, accompanied by an
increasing role of other forms of owners, including individuals, corporations/legal entities,
and foreign investors.
Based on the empirical results of Zhang et al. (2001), Jefferson et al. (2003) and Zhang et al.
(2003), an increasing share of State-owned paid-in capital is expected to have a negative
effect on firms’ TFP. At the same time, an increasing share of firms’ paid-in capital owned by
other investors, such as collective firms, legal entities or corporations, individuals and foreign
investors, is expected to have a positive impact on firms’ TFP.
3.4.2. Political Affiliation
As was discussed in Section 2.4.2, politically connected firms are likely to benefit through
preferential access to credit, government contracts, regulatory protection, and lower taxation.
As these benefits would make it easier for a firm to operate, they are likely to result in higher
TFP. However, there are cases in which political affiliation might not be beneficial to firms’
TFP, since a firm’s managers might make decisions that are politically motivated, which
might negatively affect TFP.
The vector of variables 𝑋𝑖𝑡 in equation (48) include a determinant representing the extent of a
firm’s political affiliation. Firms are classified as highly politically affiliated when the
affiliation is with the central or provincial governments (high_politics); medium politically
affiliated when the affiliation is with the local government (medium_politics); and not
politically affiliated when there is no affiliation with any level of government (no_politics). A
firm’s political affiliation is proxied by a dummy variable that takes the value of 1 when it
belongs to one of the previous groups and 0 otherwise.
Table 1 presents the descriptive statistics for political affiliation. It is interesting to note that
during the sample period, 51.6% of firms on average are not politically affiliated. Strikingly,
only 15.5% of firms were not politically affiliated in 1998, while 75.8% of firms were not
politically affiliated in 2007. While 71.5% of firms had a political affiliation with local
governments in 1998, only 21% had such a relationship in 2007. At the same time, only 3.2%
of firms were affiliated with a central or provincial government in 2007, while 13% were

107
affiliated in 1998. Overall, these figures point to a declining trend in the political affiliation of
firms. Based on the empirical results of Li et al. (2008) and Du and Girma (2010), a negative
relationship between high_politics and firms’ TFP is expected. Moreover, a positive
relationship between no_politics and firms’ TFP is expected.
3.4.3. Exporting
A variable representing a firm’s exporting activity is included in the vector of variables 𝑋𝑖𝑡 in
equation (48). This variable captures the “learning by exporting” effect discussed in Section
2.4.8. By exporting, a firm is expected to become more productive since it faces a larger
number of competitors, which will push it to undertake TFP-enhancing measures. Moreover,
the firm is also likely to benefit in terms of higher TFP from the commercial interactions that
exporting entails. Such interactions include contact with foreign economic agents, learning
from customer feedback, and observing competitors’ innovative technologies, products and
working practices.
In order to measure the effect of exporting on TFP, a firm’s exporting status is proxied by a
dummy variable (no_exporter). This takes the value of 1 when a firm does not export abroad
and 0 otherwise.
Table 1 presents the descriptive statistics for the two exporting variables used as determinants
of exporting. Interestingly, it seems that the share of non-exporting firms does not change
significantly over the years, as it was 78.4% in 1998 and 76.3% in 2007. Based on the
empirical results obtained by Sun and Hong (2011) and Du et al. (2012b), no_exporter is
expected to have a negative effect on firms’ TFP, which would suggest that Chinese firms are
likely to benefit in terms of higher TFP from exporting.
3.4.4. Competition
Section 2.4.5 discussed how competition can positively affect productivity. This is because
by facing an increasing number of competitors, managers are incentivised not just to increase
their efforts but also to innovate, hence increasing firms’ TFP.
The vector of variables 𝑋𝑖𝑡 in equation (48) includes a variable representing the extent of
competition faced by the firm within its industry. In this study, the extent of competition is
proxied by the natural logarithm of the Herfindahl index (lherf). This measures the extent of
industrial concentration by the two-digit industry Standard Industrial Classification (SIC).
Since it is important to look at the percentage change in competition resulting in a change in
productivity, or elasticity between the two variables, the natural logarithm is applied to the
value of the index. Based on the empirical results discussed in Section 2.4.2, lherf is expected

108
to have a negative coefficient, meaning that a higher extent of industrial concentration is
expected to have a negative impact on firms’ TFP.
The descriptive statistics for the Herfindahl index presented in Table 1 show that industrial
concentration diminishes over the sample period, pointing to increased competition in the
market. This is suggested by the decrease in the Herfindahl index from 0.004 in 1998 to
0.002 in 2007. Overall, markets do not seem to be concentrated, since the average Herfindahl
index during the period of 1998-2007 is 0.003. Based on the empirical results obtained by
Zhang et al. (2001) and Lin et al. (2009) in the literature for Chinese firms, lherf is expected
to negatively affect firms’ TFP, suggesting that Chinese firms are not likely to benefit from a
high level of industrial concentrations. In other words, they are likely to benefit from the
presence of industrial competition.
3.4.5. Marshallian (or MAR) Spillovers
The vector of variables 𝑋𝑖𝑡 in equation (48) includes a determinant representing Marshallian
spillovers (lagglom). This is because, as discussed in Section 2.4.6, Marshallian spillovers
provide a wide range of benefits to firms arising from being in close proximity to its industry
peers, and these benefits are likely to result in higher firm TFP levels. Such spillovers can
manifest through the channels of imitation/demonstration, synergies, commercial
relationships, asset sharing, and labour pooling.
In this study, Marshallian spillovers are measured by the percentage share of industry output
in the province where a firm is based. Since we are looking at the percentage change in MAR
spillovers resulting in a change in productivity, or the elasticity between the two variables,
the natural logarithm is applied to their values.
As seen in Table 1, Marshallian or MAR spillovers increase from 1998 to 2007. This is
shown by the increase in the percentage of industry output for each province, which was
7.98% in 1998 and 10.06% in 2007, while having an average of 9.31% over the sample
period. Based on the empirical results obtained by Lin et al. (2011) and Yang et al. (2013), a
positive relationship between lagglom and firm TFP is expected.
3.4.6. Jacobian Spillovers
In contrast to Marshallian spillovers, Section 2.4.6 discussed how Jacobian spillovers occur
when plants are located in an area characterised by different industrial activities and benefit
from the economies of scope this provides. Firms are likely to benefit in terms of higher TFP
from the industrial diversity because it favours the transmission of innovations across
different industries.

109
A variable representing Jacobian spillovers, also known as diversification or urbanisation
externalities, is included in the vector of variables 𝑋𝑖𝑡 in equation (48). In this study, Jacobian
spillovers (ldivers) are measured as the natural logarithm of the proportion of three-digit
industries (maximum 226) located in 208 city areas where the firms are based. Since we are
looking at the percentage change in Jacobian spillovers resulting in a change in productivity,
or the elasticity between the two variables, the natural logarithm is applied to their values.
Jacobian spillovers seem to decrease over the sample period, as seen in the descriptive
statistics in Table 1. The proportion of three-digit industries located in the city areas where a
firm is based is, on average, 55.3% over the entire period, decreasing from 66% in 1998 to
54.6% in 2007. Based on the discussion in this section, ldivers is expected to have a positive
effect on firms’ TFP, meaning that Chinese firms are expected to benefit in terms of higher
TFP from being based in areas characterized by industrial diversity.
3.4.7. City Location Spillovers
The discussion in Section 2.4.7 suggested that firms are likely to benefit in terms of higher
TFP by being based in a major city, as this can potentially provide firms with the following
benefits: high transfer of knowledge among workers and city residents; deeper insight into
the customer base; availability of a large, skilled labour pool; and high availability of
business services, such as legal, accounting and financial services. These positive aspects
conferred by cities are likely to positively impact TFP. Despite this, there are cases in which
the benefits might be counterbalanced by the high costs of being in a city, including the costs
of transporting goods and renting or purchasing buildings, and commuting or living in the
city, which would result in lower TFP. In this study, a dummy variable representing city
location spillovers is included in the vector of variables 𝑋𝑖𝑡 within the equation (48). City
location spillovers are proxied by a dummy variable (city200) that is equal to 1 if a firm is
located in the largest 200 cities according to population size, and 0 otherwise.
The descriptive statistics presented in Table 1 show that firms have increasingly located
themselves within the major Chinese cities. In 2007, 87.4% of firms were based in the top
200 cities, compared to 27.1% in 1998. Based on the empirical results of Pan and Zhang
(2002), city200 is expected to have a positive effect on TFP, suggesting that Chinese firms
are expected to benefit in terms of higher TFP levels by being based in a major city.
3.4.8. Liquidity
Following Chen and Guariglia (2013), two variables representing liquidity as a determinant
of TFP are included in the vector of variables 𝑋𝑖𝑡 in equation (48). The first variable (lliquid)

110
is the ratio of working capital divided by total assets. This variable is used as an indicator of
internal sources of finance. This is because if firms are facing difficulties in obtaining
external financing, they must rely on their own internal funds. Such a situation would
constrain firms’ ability to pursue productivity-enhancing projects such as R&D expenditures
and capital investments. Therefore, the higher the availability of internal funds, the more
likely a firm is to purse productivity-enhancing projects and thus to achieve higher TFP
levels.
The second variable (neg_liquid) is a dummy variable that is equal to 1 if a firm has a
negative liquidity, and 0 otherwise. It is expressed as the natural logarithm of working
capital, or the difference between current assets and current liabilities divided by total assets.
Since we are looking at the percentage change in liquidity resulting in a change in
productivity, or the elasticity between the two variables, the natural logarithm is applied to
their values. Moreover, the constant 1 is added to each firm’s liquidity value, expressed in
RMB billions, in order to handle related values between 0 and 1 that, if naturally logged,
would become negative. Hence, adding 1 enables us to obtain positive values from the natural
logarithm. This variable is adopted because negative liquidity could make it difficult for firms
to raise external funds, as it increases the cost of bankruptcy. Thus, firms with negative
liquidity are likely to be more dependent on their cash flow to finance productivity-enhancing
activities. This suggests that the higher the level of liquidity recorded by firms, the higher
TFP is expected to be.
The descriptive statistics presented in Table 1 show that the share of firms having a negative
working capital to total assets ratio (neg_liquid) decreases from 51.7% in 1998 to 37.9% in
2007, while averaging 42.6% during the sample period. At the same time, the ratio of
working capital to total assets (lliquid) increases from 11.2% in 1998 to 16.2% in 2007. The
figures suggest that firms have become more liquid over the sample period.
Based on the empirical results of Chen and Guariglia (2013), neg_liquid is expected to be
significant and to have a negative effect on TFP, while lliquid is expected to be significant
and to have a positive effect.
3.4.9. Age
As was discussed in Section 2.4.1, a firm is expected to acquire more knowledge and
therefore become more productive over the years as a product of experience, according to a
“learning by doing” process. However, as a firm becomes older, it can also become slower to
adapt its characteristics and strategies to the markets in which it operates and to keep its

111
technology up to date with the industry best practices, likely resulting in lower TFP. In this
study, a variable representing the age of the firm (lage), measured as the natural logarithm of
the firm’s age based on its year of inception, is included in the vector of variables 𝑋𝑖𝑡 in
equation (48).
Since we are looking at the percentage change in age resulting in a change in productivity, or
the elasticity between the two variables, the natural logarithm is applied to the variables’
value.
As seen in the descriptive statistics in Table 1, the age of the firms in the sample decreases
over the time period considered. Firm age, calculated according to the year it was founded, is,
on average, 15 years during the sample period, decreasing from 19 in 1998 to 12 in 2007. The
figures suggest that new firms might have entered the market, thus reducing the average age
of firms in the sample. According to the empirical results of Zheng et al. (2003) and Hsieh
and Klenow (2009), lage is expected to have a negative effect on firms’ TFP.
3.4.10. R&D Spending as a Source of Knowledge
Section 2.4.1 discussed how R&D expenditure enables a firm to build up absorptive capacity,
or the ability to absorb and utilize knowledge for productive purposes. Moreover, it enables a
firm to undertake both product and process improvements. Those are two channels through
which R&D expenditure can result in higher firm TFP.
In the vector of variables 𝑋𝑖𝑡 in equation (48), a dummy variable proxying the firm’s R&D
expenditure is included. The variable takes the value of 1 if the firm has undertaken any R&D
spending, and 0 otherwise.
The descriptive statistics in Table 1 show that only 10.9% of firms in the sample have
undertaken R&D expenditure during the sample period, although the share increases from
9.5% in 1998 to 10.6% in 2007. Based on the discussion in Section 2.4.1 and the empirical
results of Hu (2001) and Wu et al. (2007), R&D spending is expected to have a positive
effect on Chinese firms’ TFP.
3.4.11. Time Trend or Hicks-neutral Technical Change
It was stressed in Section 2.4.1 that, other than age, intangible assets and R&D, knowledge
can be represented by a time trend, or a Hicks-neutral technical change. In the vector of
variables 𝑋𝑖𝑡 in equation (48), a variable representing the time trend or the Hicks-neutral
technical change (t_trend) is included. This represents the impact on TFP resulting from
exogenous technological improvements affecting all firms over time. Based on the discussion
in Section 2.4.1, t_trend is expected to have a positive impact on firms’ TFP. In other words,

112
firms are expected to become more productive over time as a result of Hicks-neutral technical
change.
3.4.12. Marketing Capabilities
Section 2.4.10 argued that marketing capabilities represent a firm’s ability to distinguish its
products and services from competitors and to build successful brands, enabling the firm to
charge higher prices and increase its productivity as a result.
In this study, in the vector of variables 𝑋𝑖𝑡 in equation (48), a variable representing the firm’s
marketing capabilities is included. The availability of data does not enable us to construct
broad measures of marketing capabilities such as those used by Nath et al. (2010) and Yu et
al. (2014). Therefore, marketing capabilities are proxied by the value of selling and
distribution costs as a share of sales. The resulting variable (lfc) is similar to the one adopted
by Lee and Rugman (2012). Since we are looking at the percentage change in marketing
capabilities resulting in a change in productivity, or the elasticity between the two variables,
the natural logarithm is applied to their values.
As shown by the descriptive statistics in Table 1, the firms improve their marketing
capabilities during the sample period. This is indicated by the decrease in selling and
distribution costs as a percentage of sales from 5.6% in 1998 to 3.9% in 2007. More efficient
firms are expected to have a lower ratio of selling and distribution costs as a percentage of
sales, meaning that they are more able to transform their resources into valuable output, to
distinguish their products and services from the competition, and to forge successful brands.
Although there is no empirical evidence for China at the firm level, the discussion and the
empirical results presented in Section 2.4.11 lead us to expect a negative relationship between
lfc and firms’ TFP.
This section has discussed the variables adopted in the empirical analysis of this study, the
related descriptive statistics, and the underlying hypotheses. The next section discusses the
results of the SYS-GMM estimation.

113
Table 1: Descriptive statistics for variables used in TFP estimation, China 1998-2007
1998-2007 1998 2007
Variable Definition Mean SD Mean SD Mean SD
y Sales (billion RMB 2002 prices) 0.074 0.716 0.042 0.386 0.107 1.017
m Intermediate inputs (billion RMB 2002 prices) 0.050 0.448 0.034 0.241 0.065 0.607
e Employment 286.482 1331.806 405.083 1891.556 235.527 1149.528
k Real net tangible fixed assets (billion RMB 2002 prices) 0.031 0.442 0.027 0.275 0.033 0.538
age Firm age (based on year-of-inception) 15.858 68.807 19.952 85.590 12.141 44.387
no_politics Proportion of firms with no political affiliation 0.516 0.500 0.155 0.362 0.758 0.428
med_politics Proportion of firms with medium political affiliation with local governments 0.421 0.494 0.715 0.451 0.210 0.407
high_politics Proportion of firms with high political affiliation with central or provincial governments 0.063 0.243 0.130 0.336 0.032 0.175
p_capstate Proportion of paid-in capital owned by the State 0.145 0.341 0.335 0.456 0.037 0.181
p_capcoll Proportion of paid-in capital owned by collective firms 0.125 0.314 0.284 0.421 0.046 0.200
p_capcorporate Proportion of paid-in capital owned by corporations/legal entities 0.209 1.179 0.120 0.289 0.269 2.892
p_capindividual Proportion of paid-in capital owned by individuals 0.379 1.209 0.142 0.318 0.494 2.902
p_caphkmactai Proportion of paid-in capital owned by HK/Macao/Taiwan 0.074 0.247 0.065 0.223 0.075 0.251
p_capforeign Proportion of paid-in capital owned by foreigners 0.069 0.235 0.054 0.200 0.079 0.255
no_exporter Dummy variable for non-exporting firms 0.749 0.434 0.784 0.411 0.763 0.425
herf Herfindahl index of industrial concentration (by 2-digit SIC) 0.003 0.005 0.004 0.006 0.002 0.004
divers % of 3-digit industries (max 226) in city areas where a firm is based (Jacob) 0.553 0.158 0.660 0.198 0.546 0.128
agglom % of industry output (2-digit SIC) in the province where a firm is based (MAR) 9.307 8.101 7.975 7.513 10.060 8.210
rd Dummy variable for firm undertaking R&D spending 0.109 0.311 0.095 0.293 0.106 0.307
lfc Selling & distribution costs as % of sales 4.729 6.588 5.561 8.084 3.924 4.814
neg_liquid Dummy variable for negative working capital to total assets 0.426 0.494 0.517 0.500 0.379 0.485
lliquid Ratio of working capital to total assets 0.144 0.195 0.112 0.177 0.162 0.203
city200 Dummy variable for firm located in top 200 cities according to population size 0.780 0.414 0.271 0.445 0.874 0.331
N No. of observations 2,183,709 148,474 331,453

114
3.5. Results of the SYS-GMM Estimation
Table 2 presents the results of the SYS-GMM estimation of the determinants of total factor
productivity levels for 26 industries. The table also includes the diagnostic tests associated
with each estimated equation: the Hansen test of the validity of the instrument set used, and
two Arellano and Bond (1991) tests for autocorrelation in differenced residuals (AR(1) and
AR(2)).
The results of the test for AR(1) in first differences reject the null hypothesis of zero
autocorrelation in differenced residuals since there is a negative first-order serial correlation
in the first-differenced residuals for all models. The results of the test for AR(2) point to the
existence of second-order serial correlation in first-differenced residuals for most models.
Despite this issue of autocorrelation, the models pass (at the 5% level or better) the Hansen
test of over-identification and this provides the basis for treating the models estimated as
adequate.
The elasticities of output with respect to labour, intermediate inputs and capital vary across
industries, but they are positive and significant for most. The results also indicate the
existence of increasing returns to scale for most industries (18 out of 26), with an average
sum of output elasticities equal to 1.2, suggesting that firms produce a higher proportion of
output from a given proportion of inputs utilised.
The results for the parameter estimates associated with 𝑋𝑖𝑡 will be discussed by grouping
them into variables related to political affiliation/ownership, spatial variables (Marshallian,
Jacobian and city spillovers), internal and external knowledge variables (age, R&D and time
trend), and all other variables (exporting, competition, liquidity and marketing capabilities).
Regarding the political affiliation/ownership variables, for most industries the coefficients for
the “high level of political affiliation” variable (high_politics) are statistically significant and
negative, while the coefficients of the “no political affiliation” variable (no_politics) are
statistically significant and positive. Such is the case for typically competitive industries, such
as metal and non-metal products, machinery and equipment, and furniture. These results
suggest that a high level of political affiliation has a negative effect on firm TFP while the
lack of political affiliation has a positive effect. Consistent with the initial expectations,
Chinese industrial firms do not seem to benefit in terms of a higher TFP level from a political
affiliation with the central or provincial governments. This could be because politically
affiliated firms are unlikely to focus on maximising TFP, but rather on pursuing politically
motivated objectives. The finding suggests that an increasing role of the markets, and a
decreasing influence of the government, both central and provincial, on firms’ activities, is
115
conducive to increased firm TFP. These findings are similar to those of Du and Girma
(2010), who found that politically unaffiliated firms perform better in terms of TFP growth
than politically affiliated ones. However, in industries typically characterized by a high level
of industrial concentration, such as gas and water production, a high level of political
affiliation positively affects TFP. A potential explanation for this finding could be that, in
sectors with national strategic importance, political affiliation would provide firms with
benefits such as ease in access to credit, regulatory protection, lower taxation and greater
market power, resulting in higher TFP.
The consideration of political affiliation also involves the potential political impact that State
influence might have on firms’ TFP by being a major shareholder. The results suggest that
forms of ownership other than the State one are likely to be characterised by a relatively low
impact of political affiliation. In general, the coefficients for the variable representing the
proportion of paid-in capital owned by the State (p_capstate) are statistically significant and
negative, while the coefficients of the variables representing the proportion of paid-in capital
owned by collective investors (p_capcoll), corporations (p_capcorporate), individuals
(p_capindividual) and foreigners (p_capforeign) are positive for most industries. As initially
expected, firms do not seem to benefit in terms of higher TFP from an increasing proportion
of paid-in capital owned by the State, but rather from an increasing proportion of paid-in
capital possessed by other types of owners. It can be inferred that decreases in State
ownership and increases of other forms of ownership in Chinese industrial firms is conducive
to higher firm TFP. Different types of paid-in capital owners might have different
motivations for their ownership, which is ultimately reflected in decisions that impact the
firms’ TFP. Compared to other owners of paid-in capital, the State might be driven by
political motivations, such as maximising employment, which in some cases might be
inconsistent with maximising TFP levels. However, the findings are different for the medical,
electronic power and water production sectors, in which an increasing share of paid-in capital
owned by private investors is associated with a decrease in TFP, and an increasing share of
paid-in capital owned by the State is associated with increased TFP. This suggests that in
strategic or monopolistic sectors, State ownership is conducive to higher TFP. In a large
number of sectors, Chinese industrial firms seem to positively benefit from a higher
proportion of paid-in capital owned by foreigners (p_capforeign). In line with the view of
Hymer (1976), this finding suggests that foreign owners are likely to have more favourable
characteristics than domestic owners, such as more advanced managerial practices, highly
innovative technology and better marketing capabilities, which would lead to higher TFP

116
levels. In summary, the findings for the relationship between firms’ TFP levels and
ownership variables indicate that private forms of ownership are more conducive to higher
TFP levels than State forms of ownership. These results are similar to those of Zhang et al.
(2001), Jefferson et al. (2003) and Zhang et al. (2003), who found that State-owned
enterprises are the least efficient and have achieved the lowest rate of TFP growth.
Spatial variables are included in the vector 𝑋𝑖𝑡 in order to measure whether firms benefit in
terms of higher TFP levels from the spillovers arising from the location where they are based.
These spatial variables are Marshallian spillovers (lagglom), Jacobian spillovers (ldivers) and
city spillovers (city200). For 16 out of the 26 industries, the coefficients for the variable
representing Marshallian spillovers (lagglom) are statistically significant and positive. The
effects are particularly strong in the non-metal products, other mining and medical industries.
In line with the arguments of Marshall (1890), the existence of positive Marshallian
spillovers indicates that firms are likely to benefit in terms of higher TFP levels from the
externalities arising from being geographically close to industry peers. In such a situation,
firms are likely to undertake TFP-enhancing actions, such as imitating and adopting ideas
from other firms, cooperating through sharing assets, pursuing joint R&D projects or
engaging in joint ventures. Moreover, by being based in the same area, firms are likely to
develop commercial relationships with suppliers and customers and to enjoy the higher
availability of an industry-specialised labour pool, enabling them to improve their
productivity. From these results, it can be inferred that policy measures aimed at increasing
industrial agglomeration within specific geographical areas are conducive to higher firm TFP.
These findings are in line with those of Lin et al. (2011) and Yang et al. (2013), who found
that industrial agglomeration has a significant and positive impact on firms’ TFP.
The coefficients for the variable representing Jacobian spillovers (ldivers) are statistically
significant and positive for 23 out of 26 industries. The effects are the strongest in the
machinery & equipment, other manufacturing, and apparel & footwear industries. These
results suggest that Chinese industrial firms are likely to benefit in terms of higher TFP from
the spillovers arising by being located in an area characterised by different industrial
activities. This is in line with Jacob’s (1970) argument that plants having different knowledge
and capabilities can complement each others’ skills sets, resulting in mutual benefits, and that
the industrial and occupational diversity that characterises urban economies favours the
spillover of innovations across different industries, ultimately resulting in higher TFP. The
results indicate that policy measures aimed at increasing industrial diversity within specific
geographical areas are likely to result in higher firm TFP. These findings are similar to those

117
of Liu (2002) and Batisse (2002), who found a positive effect of Jacobian spillovers on firms’
TFP.
While Chinese industrial firms based in geographical areas where they are close to their
industry peers, or which are characterized by industrial diversity, seem to benefit in terms of
higher TFP, they do not seem to benefit from being based in the major Chinese cities. This is
suggested by the statistically significant and negative coefficients for the variable
representing city spillovers (city200) for 17 out of 26 industries. A city was expected to
provide several benefits to firms, such as insight into the customer base, the availability of a
wide labour pool, and plenty of business services, which would have resulted in higher TFP.
However, in most industries, other aspects of cities probably dominate these, hence
hampering TFP. For example, as argued by Carlino (1987), the time and cost of transporting
goods and commuting are likely to be high in cities, as well as both the commercial and
residential rents, which would result in higher costs and thus lower TFP levels. Based on
these results, it can be inferred that policy measures aimed at increasing firms’ presence
within cities are not likely to result in higher TFP. This suggests that it might be better to
locate firms outside cities, in areas characterised by industrial agglomeration or diversity,
where firms are more likely to benefit in terms of higher TFP. These results contrast with
those of Pan and Zhang (2002), who found that firms based in larger cities have higher TFP.
In order to measure both internal and external knowledge, which a firm can take advantage of
in order to become more productive, three variables are included in the vector 𝑋𝑖𝑡: a firm’s
age (lage), an R&D dummy (rd_dum) indicating whether a firm invests in R&D, and a time
trend (t_trend). Chinese industrial firms are expected to acquire more knowledge and,
therefore, to become more productive over the years as a product of experience according to a
“learning by doing” process. However, for most industries, it seems that this is not the case,
as suggested by the statistically significant and negative coefficients for the age variable in 17
out of 26 industries. A potential explanation for this negative relationship is that older firms
are likely to be overtaken by more productive younger firms, which adopt more innovative
technology, according to what Jensen et al. (2001) describe as the “vintage effect.” Another
potential explanation is that older firms are slower to adjust to the dynamic environment in
which they operate than their younger peers, as a result of the “inertia effect” postulated by
Hannan and Freeman (1984). From these results, it can be inferred that policy measures
aimed at favouring the entrance of younger and more dynamic firms into their respective
industries, are likely to result in higher TFP. These results contrast with those of Zheng et al.

118
(2003) and Hsieh and Klenow (2009), who found a positive effect of firms’ age on their total
factor productivity.
In only 6 industries out of 26, the results indicate that productivity improves by undertaking
R&D expenditures, as indicated by the statistically significant and positive coefficients for
those industries. This positive finding might be explained by the ability of R&D expenditures
to positively and directly affect firms’ TFP levels by allowing both product and process
improvements. In line with the arguments of Cohen and Levinthal (1989), R&D expenditure
might also have a positive and indirect effect on firms’ TFP levels through the development
of absorptive capacity, or a firm’s ability to identify, absorb and exploit external knowledge
for productive purposes. For these 6 industries, the results indicate that policy measures
aimed at incentivizing firms’ R&D expenditure, for example, via tax cuts or subsidised
funding, are likely to generate higher firm TFP. However, there is only limited evidence for
the positive effect of R&D and TFP, hence suggesting that Chinese firms do not make a
productive use of their R&D expenditure.
In addition to R&D expenditures and age, knowledge is represented by the time trend, or
Hicks-neutral technical change. The results indicate that Chinese firms are likely to become
more productive over time as they are affected by positive exogenous technological
improvements. This is indicated by the statistically significant and positive coefficients for
the variable (t_trend) in 24 out of 26 industries. The effect is particularly strong in industries
such as the non-metal and metal products, and transport equipment, as these tend to be more
dynamic and closer to the technological frontier.
In summary, regarding internal and external knowledge variables, Chinese firms in most
industries seem to benefit from the positive effect on TFP of the time trend, while they tend
to become less productive as they age. Furthermore, R&D does not seem to result in higher
firm TFP.
In addition to ownership/political affiliation, spatial and knowledge variables, other variables
are included in the vector 𝑋𝑖𝑡 as potential determinants of TFP in Chinese industrial firms.
These are variables proxying for firms’ export activity, industrial competition, liquidity and
marketing capabilities.
For only 6 out of 26 industries, the results indicate that Chinese firms engaged in export
activities are likely to be more productive than those not engaged, as suggested by the
statistically significant and negative coefficients on the variable representing a non-exporting
firm (no_exporter). A potential explanation for the positive relationship is that, by
participating in foreign markets in addition to the domestic market, firms are likely to face a

119
larger number of competitors. In order to survive in such a competitive environment, firms
would need to constantly increase their efficiency and undertake technological
improvements, both of which are TFP-enhancing measures. Moreover, in line with the
arguments of Grossman and Helpman (1991), firms are also likely to benefit from the
commercial interactions that exporting entails, including interacting with foreign economic
agents, learning from customer feedback, and observing the innovative technologies,
products and working practices of competitors – all activities that would stimulate firms to
undertake additional TFP-enhancing actions. However, this view is not supported by the data.
This could potentially be explained by the “processing trade” argument. According to Wang
and Yu (2011), between 2000 and 2006, 60% of Chinese exports were in the form of
“processing trade.” Jarreau and Poncet (2012) argue that exporting is beneficial to firm
performance only when it is in the form of ordinary exports and not in the form of
“processing trade.” The empirical results of Dai et al. (2011) indicate that Chinese firms that
only engage in processing trade are 4% to 30% less productive than non-exporters. When
processing exporters are removed from the sample, Dai et al.’s (2011) findings indicate that
exporters record higher productivity than non-exporters. From these results, it can be inferred
that policy measures supporting firms’ export activities, such as tax incentives, government
subsidies, or the provision of market intelligence, are likely to be successful only when firms
are not processing exporters.
For 14 out of 26 industries, the statistically significant and negative coefficients for the
variable representing the Herfindahl index of industrial concentration (lherf) indicate that the
higher an industry’s concentration is, the lower the related firms’ TFP. This effect is the
strongest in the petroleum processing, coal mining and medical industries. For these
industries, the findings indicate that policy measures aimed at increasing the level of
industrial competition can augment firms’ TFP levels. These results are in line with the view
of Nickell (1996), who suggests that by facing an increasing number of competitors in their
industries, firms might be more inclined to undertake measures aimed at improving their TFP
in order to survive. Moreover, a higher level of competition is also likely to reduce monopoly
rents, which would result in increased managerial efforts. Competition can also lower the
wages within an industry, thus reducing the cost of labour and improving firms’ TFP.
However, in this study, a higher level of competition does not result in higher firm TFP for 9
industries. The negative effect of competition on TFP is especially strong for the cultural,
textile and gas production industries. This might be explained by Hermalin’s (1992)
argument that increased competition is likely to diminish a firm’s profits and managers’

120
income, resulting in reduced managerial effort and lower TFP. In general, for the majority of
industries, the findings are similar to those of Zhang et al. (2001), who found a negative
effect of industrial concentration on firms’ productivity, although that analysis was limited to
firms based in Shanghai. The findings are also similar to those of Lin et al. (2009), who found
that industrial concentration negatively affects firms’ productivity, although that study
adopted a smaller sample over a shorter time period.
Among the variables included in the vector 𝑋𝑖𝑡 as potential determinants of TFP in Chinese
industrial firms, two variables measure firms’ liquidity. The first variable is the negative
working capital to total assets dummy (neg_liquid), for which the coefficients are statistically
significant and negative for all industries, except for tobacco and coal mining. The effect is
particularly strong for the metal products, non-metal products and measuring instruments
industries. The second variable is the natural logarithm of the working capital to total assets
ratio (lliquid), for which the coefficients are statistically significant and positive for all
industries, except for electronic power. The effect is the strongest for the non-metal products,
metal products and tobacco industries. These results indicate that firms with a higher level of
liquidity tend to record higher TFP. In line with the arguments of Chen and Guariglia (2013),
when firms experience difficulties in raising external funds, they must rely on internal funds.
Such funds might be vital for pursuing productivity-enhancing projects. Hence, the
availability of liquid internal assets is likely to improve the firms’ capacity to obtain cash on
short notice to be used to finance highly productive investments. Moreover, liquidity might
also be used to finance activities such as product and process improvements, which are likely
to cause a shift in firms’ efficiency frontier, or best practice technology, resulting in higher
TFP. From these findings, it can be inferred that policy measures aimed at facilitating
Chinese firms’ access to external sources of liquidity, would enable them to pursue
investments and improve their productivity. The results are consistent with those of Chen and
Guariglia (2013), who found that Chinese firms’ TFP is positively and significantly affected
by the availability of internal liquid assets.
The statistically significant and negative coefficients for the variable representing firms’
marketing capabilities (lfc) in 23 out of 26 industries suggest that firms with lower selling and
distribution costs as a percentage of sales tend to be more productive. A potential explanation
for this finding might be that such firms are more able to transform their resources into
valuable output, to distinguish their products from competitors, and to build brands that allow
them to charge higher prices, all of which would lead to higher TFP levels. These results are

121
in line with those of Morgan et al. (2009), Nath et al. (2010), Lee and Rugman (2012) and Yu
et al. (2014).
In summary, although the Arellano and Bond (1991) tests point to the issue of
autocorrelation, the SYS-GMM results indicate that the estimates obtained are economically
sensible since they pass the Hansen test, pointing to the validity of the instrument set adopted,
and providing the basis for treating the models estimated as adequate. The elasticity of output
with respect to labour, intermediate inputs and capital vary across industries, but are positive
and significant for most. The results also indicate the existence of increasing returns to scale,
suggesting that firms produce a higher proportion of output from a given proportion of inputs.
In addition, these indicate that the inclusion of multiple determinants of TFP in the vector 𝑋𝑖𝑡
does not generate a multicollinearity issue, since there are not insignificant small parameters
estimates and not large standard errors. The SYS-GMM results suggest that Chinese
industrial firms tend to benefit in terms of higher TFP levels from a lack of political
affiliation, an increasing proportion of paid-in capital owned by shareholders other than the
State, the presence of Marshallian and Jacobian spillovers, age, time trend, industrial
competition, the availability of internal liquid assets and marketing capabilities. Policy
measures aimed at targeting positive determinants of TFP are likely to result in higher TFP
levels across Chinese industrial firms.
Following the above discussion of the results of the SYS-GMM estimation, the next section
will review the results from the estimation done using the semiparametric approach of
Levinsohn and Petrin (2003).
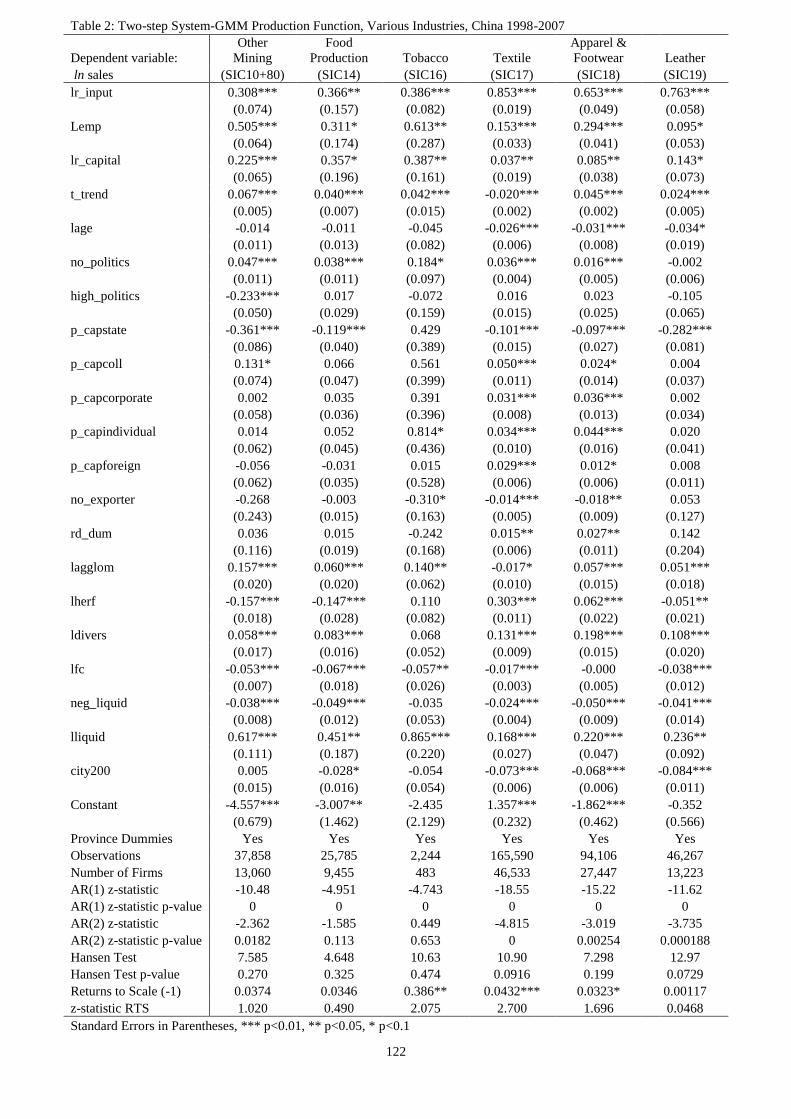
122
Table 2: Two-step System-GMM Production Function, Various Industries, China 1998-2007
Dependent variable:
Other
Mining
Food
Production Tobacco Textile
Apparel &
Footwear Leather
ln sales (SIC10+80) (SIC14) (SIC16) (SIC17) (SIC18) (SIC19)
lr_input 0.308*** 0.366** 0.386*** 0.853*** 0.653*** 0.763***
(0.074) (0.157) (0.082) (0.019) (0.049) (0.058)
Lemp 0.505*** 0.311* 0.613** 0.153*** 0.294*** 0.095*
(0.064) (0.174) (0.287) (0.033) (0.041) (0.053)
lr_capital 0.225*** 0.357* 0.387** 0.037** 0.085** 0.143*
(0.065) (0.196) (0.161) (0.019) (0.038) (0.073)
t_trend 0.067*** 0.040*** 0.042*** -0.020*** 0.045*** 0.024***
(0.005) (0.007) (0.015) (0.002) (0.002) (0.005)
lage -0.014 -0.011 -0.045 -0.026*** -0.031*** -0.034*
(0.011) (0.013) (0.082) (0.006) (0.008) (0.019)
no_politics 0.047*** 0.038*** 0.184* 0.036*** 0.016*** -0.002
(0.011) (0.011) (0.097) (0.004) (0.005) (0.006)
high_politics -0.233*** 0.017 -0.072 0.016 0.023 -0.105
(0.050) (0.029) (0.159) (0.015) (0.025) (0.065)
p_capstate -0.361*** -0.119*** 0.429 -0.101*** -0.097*** -0.282***
(0.086) (0.040) (0.389) (0.015) (0.027) (0.081)
p_capcoll 0.131* 0.066 0.561 0.050*** 0.024* 0.004
(0.074) (0.047) (0.399) (0.011) (0.014) (0.037)
p_capcorporate 0.002 0.035 0.391 0.031*** 0.036*** 0.002
(0.058) (0.036) (0.396) (0.008) (0.013) (0.034)
p_capindividual 0.014 0.052 0.814* 0.034*** 0.044*** 0.020
(0.062) (0.045) (0.436) (0.010) (0.016) (0.041)
p_capforeign -0.056 -0.031 0.015 0.029*** 0.012* 0.008
(0.062) (0.035) (0.528) (0.006) (0.006) (0.011)
no_exporter -0.268 -0.003 -0.310* -0.014*** -0.018** 0.053
(0.243) (0.015) (0.163) (0.005) (0.009) (0.127)
rd_dum 0.036 0.015 -0.242 0.015** 0.027** 0.142
(0.116) (0.019) (0.168) (0.006) (0.011) (0.204)
lagglom 0.157*** 0.060*** 0.140** -0.017* 0.057*** 0.051***
(0.020) (0.020) (0.062) (0.010) (0.015) (0.018)
lherf -0.157*** -0.147*** 0.110 0.303*** 0.062*** -0.051**
(0.018) (0.028) (0.082) (0.011) (0.022) (0.021)
ldivers 0.058*** 0.083*** 0.068 0.131*** 0.198*** 0.108***
(0.017) (0.016) (0.052) (0.009) (0.015) (0.020)
lfc -0.053*** -0.067*** -0.057** -0.017*** -0.000 -0.038***
(0.007) (0.018) (0.026) (0.003) (0.005) (0.012)
neg_liquid -0.038*** -0.049*** -0.035 -0.024*** -0.050*** -0.041***
(0.008) (0.012) (0.053) (0.004) (0.009) (0.014)
lliquid 0.617*** 0.451** 0.865*** 0.168*** 0.220*** 0.236**
(0.111) (0.187) (0.220) (0.027) (0.047) (0.092)
city200 0.005 -0.028* -0.054 -0.073*** -0.068*** -0.084***
(0.015) (0.016) (0.054) (0.006) (0.006) (0.011)
Constant -4.557*** -3.007** -2.435 1.357*** -1.862*** -0.352
(0.679) (1.462) (2.129) (0.232) (0.462) (0.566)
Province Dummies Yes Yes Yes Yes Yes Yes
Observations 37,858 25,785 2,244 165,590 94,106 46,267
Number of Firms 13,060 9,455 483 46,533 27,447 13,223
AR(1) z-statistic -10.48 -4.951 -4.743 -18.55 -15.22 -11.62
AR(1) z-statistic p-value 0 0 0 0 0 0
AR(2) z-statistic -2.362 -1.585 0.449 -4.815 -3.019 -3.735
AR(2) z-statistic p-value 0.0182 0.113 0.653 0 0.00254 0.000188
Hansen Test 7.585 4.648 10.63 10.90 7.298 12.97
Hansen Test p-value 0.270 0.325 0.474 0.0916 0.199 0.0729
Returns to Scale (-1) 0.0374 0.0346 0.386** 0.0432*** 0.0323* 0.00117
z-statistic RTS 1.020 0.490 2.075 2.700 1.696 0.0468
Standard Errors in Parentheses, *** p<0.01, ** p<0.05, * p<0.1

123
Table 2: PANEL B
Dependent variable: Timber Furniture Papermaking Printing Cultural
Petroleum
Processing
ln sales (SIC20) (SIC21) (SIC22) (SIC23) (SIC24) (SIC25+70)
lr_input 0.493*** 0.494*** 0.843*** 0.634*** 0.754*** 0.265*
(0.118) (0.068) (0.032) (0.046) (0.051) (0.145)
lemp 0.483*** 0.446*** 0.166*** 0.230** 0.239*** 0.743***
(0.114) (0.078) (0.045) (0.104) (0.067) (0.145)
lr_capital 0.130* 0.169*** 0.040*** 0.174*** 0.059* 0.245**
(0.076) (0.046) (0.009) (0.049) (0.031) (0.100)
t_trend 0.054*** 0.030*** 0.034*** 0.051*** 0.074*** -0.005
(0.009) (0.004) (0.004) (0.006) (0.005) (0.008)
lage -0.022** -0.058*** -0.018** -0.105*** -0.005 -0.080***
(0.011) (0.013) (0.008) (0.027) (0.013) (0.027)
no_politics 0.025* 0.018 0.014*** 0.035*** 0.004 0.053***
(0.013) (0.012) (0.005) (0.008) (0.008) (0.020)
high_politics -0.223*** -0.093* -0.000 0.064*** -0.008 -0.034
(0.085) (0.050) (0.019) (0.019) (0.035) (0.070)
p_capstate -0.160* -0.219*** -0.114** 0.080 -0.164** -0.214**
(0.085) (0.065) (0.050) (0.065) (0.078) (0.087)
p_capcoll 0.181*** 0.202*** -0.042 0.259*** -0.054 -0.031
(0.050) (0.047) (0.047) (0.069) (0.047) (0.089)
p_capcorporate 0.126*** 0.223*** -0.048 0.215*** -0.041 -0.018
(0.035) (0.041) (0.045) (0.062) (0.039) (0.077)
p_capindividual 0.124*** 0.201*** -0.045 0.222*** -0.030 0.011
(0.040) (0.043) (0.046) (0.065) (0.041) (0.082)
p_capforeign 0.050** 0.059*** 0.016 0.051* 0.023* 0.185**
(0.025) (0.017) (0.015) (0.027) (0.013) (0.086)
no_exporter -0.091 -0.074 0.169 -0.339** 0.261 -0.563***
(0.057) (0.064) (0.127) (0.148) (0.160) (0.185)
rd_dum 0.592* -0.008 0.168** 0.106** 0.023 0.005
(0.348) (0.018) (0.072) (0.042) (0.015) (0.046)
lagglom 0.133*** 0.119*** 0.076*** 0.091*** -0.005 0.106***
(0.034) (0.024) (0.014) (0.020) (0.021) (0.032)
lherf 0.036 -0.174*** -0.141*** 0.092*** 0.347*** -0.323***
(0.025) (0.036) (0.012) (0.026) (0.059) (0.078)
ldivers 0.207*** 0.223*** 0.200*** 0.264*** 0.127*** 0.147***
(0.034) (0.030) (0.014) (0.018) (0.024) (0.054)
lfc -0.058*** -0.061*** -0.019*** -0.037*** -0.010 -0.045***
(0.013) (0.011) (0.005) (0.006) (0.006) (0.013)
neg_liquid -0.042*** -0.052*** -0.023*** -0.062*** -0.026*** -0.078***
(0.013) (0.011) (0.005) (0.009) (0.009) (0.023)
lliquid 0.348** 0.408*** 0.195*** 0.465*** 0.197*** 0.740***
(0.136) (0.075) (0.027) (0.087) (0.056) (0.179)
city200 -0.034* -0.073*** -0.096*** -0.149*** 0.002 0.019
(0.020) (0.014) (0.008) (0.016) (0.013) (0.029)
Constant -3.128*** -4.049*** -1.707*** -0.546 0.107 -5.308***
(0.841) (0.779) (0.297) (0.821) (0.743) (1.121)
Province Dummies Yes Yes Yes Yes Yes Yes
Observations 38,762 22,234 57,792 39,503 24,427 12,378
Number of Firms 12,942 6,980 15,111 10,452 6,963 4,129
AR(1) z-statistic -10.55 -5.504 -13.63 -14.05 -9.141 -5.800
AR(1) z-statistic p-value 0 0 0 0 0 0
AR(2) z-statistic -1.765 -2.385 -4.454 -2.994 -1.081 -2.379
AR(2) z-statistic p-value 0.0776 0.0171 0 0.00275 0.280 0.0174
Hansen Test 12.84 13.83 6.341 22.17 12.47 11.79
Hansen Test p-value 0.117 0.129 0.386 0.0752 0.188 0.108
Returns to Scale (-1) 0.106* 0.109*** 0.0496*** 0.0383 0.0526* 0.253***
z-statistic RTS 1.702 3.263 2.244 0.699 1.741 3.745
Standard Errors in Parentheses, *** p<0.01, ** p<0.05, * p<0.1

124
Table 2: PANEL C
Dependent variable: Chemical Medical Rubber Plastic Nonmetal Products Metal Products
ln sales (SIC26+28) (SIC27) (SIC29) (SIC30) (SIC31) (SIC32+33+34)
lr_input 0.850*** 0.550*** 0.555*** 1.039*** 0.191*** 0.752***
(0.022) (0.040) (0.112) (0.054) (0.040) (0.067)
lemp 0.203*** 0.768*** 0.249* 0.133** 0.700*** 0.587***
(0.052) (0.102) (0.146) (0.059) (0.182) (0.070)
lr_capital 0.016** 0.065** 0.153* 0.079*** 0.449*** 0.788***
(0.006) (0.027) (0.080) (0.031) (0.133) (0.114)
t_trend 0.017*** 0.047*** 0.051*** 0.028*** 0.098*** 0.137***
(0.003) (0.005) (0.013) (0.005) (0.013) (0.008)
lage -0.040*** -0.162*** -0.052* -0.014 -0.132*** -0.251***
(0.014) (0.027) (0.026) (0.014) (0.027) (0.024)
no_politics 0.031*** 0.071*** 0.030*** 0.002 0.068*** 0.077***
(0.005) (0.013) (0.011) (0.006) (0.009) (0.013)
high_politics 0.001 -0.015 -0.005 -0.021 -0.130*** -0.541***
(0.020) (0.018) (0.053) (0.024) (0.034) (0.074)
p_capstate -0.131*** -0.219*** -0.150* -0.054 -0.296*** -0.029
(0.028) (0.037) (0.083) (0.036) (0.061) (0.070)
p_capcoll -0.015 -0.028 0.121 0.034 0.168* 0.749***
(0.014) (0.033) (0.099) (0.042) (0.093) (0.098)
p_capcorporate -0.035** -0.077*** 0.099 0.031 0.136* 0.601***
(0.014) (0.029) (0.089) (0.038) (0.072) (0.080)
p_capindividual -0.030** -0.023 0.100 0.027 0.175** 0.725***
(0.013) (0.029) (0.095) (0.041) (0.088) (0.093)
p_capforeign 0.051*** 0.079** 0.025 0.028*** 0.091 0.043
(0.010) (0.032) (0.028) (0.009) (0.055) (0.039)
no_exporter -0.027 0.079 -0.149 0.042 0.221 0.089
(0.037) (0.110) (0.173) (0.066) (0.145) (0.147)
rd_dum 0.043 0.222* 0.261 0.163* -0.247*** 0.002
(0.061) (0.129) (0.196) (0.097) (0.062) (0.021)
lagglom 0.025*** 0.155*** -0.011 0.041* 0.203*** 0.005
(0.006) (0.024) (0.025) (0.022) (0.017) (0.035)
lherf -0.051*** -0.234*** -0.201*** -0.041** -0.187*** 0.200***
(0.008) (0.029) (0.068) (0.017) (0.020) (0.028)
ldivers 0.138*** 0.165*** 0.198*** 0.163*** 0.266*** 0.407***
(0.008) (0.018) (0.030) (0.020) (0.022) (0.030)
lfc -0.028*** -0.129*** -0.046*** -0.022** -0.059*** -0.157***
(0.005) (0.015) (0.012) (0.009) (0.008) (0.015)
neg_liquid -0.028*** -0.046*** -0.053*** -0.021** -0.100*** -0.183***
(0.004) (0.010) (0.018) (0.009) (0.008) (0.022)
lliquid 0.194*** 0.495*** 0.337*** 0.317*** 1.192*** 1.610***
(0.026) (0.055) (0.096) (0.052) (0.215) (0.172)
city200 -0.092*** -0.094*** -0.114*** -0.129*** -0.047*** -0.153***
(0.006) (0.015) (0.018) (0.013) (0.011) (0.018)
Constant -1.259*** -5.495*** -3.005*** -0.768* -6.030*** -1.590***
(0.347) (0.468) (1.042) (0.426) (1.407) (0.592)
Province Dummies Yes Yes Yes Yes Yes Yes
Observations 154,348 33,367 22,894 55,225 173,374 93,059
Number of Firms 42,297 8,952 6,611 18,323 47,034 32,965
AR(1) z-statistic -21.29 -12.44 -5.941 -8.279 -16.28 -11.34
AR(1) z-statistic p-value 0 0 0 0 0 0
AR(2) z-statistic -2.047 -3.147 -1.431 -2.315 -7.577 -5.068
AR(2) z-statistic p-value 0.0406 0.00165 0.152 0.0206 0 0
Hansen Test 7.224 13.92 14.18 10.33 12.06 15.98
Hansen Test p-value 0.614 0.0838 0.116 0.412 0.0606 0.100
Returns to Scale (-1) 0.0686** 0.383*** -0.0432 0.0352* 0.340*** 0.247***
z-statistic RTS 2.140 4.584 -0.767 1.778 4.592 9.940
Standard Errors in Parentheses, *** p<0.01, ** p<0.05, * p<0.1

125
Table 2: PANEL D
Dependent variable:
Machinery &
Equipment
Transport
Equipment
Measuring
Instruments
Other
Manufacturing
Electronic
Power
Gas
Production
ln sales (SIC35+36) (SIC37) (SIC41) (SIC42+43) (SIC44) (SIC45)
lr_input 0.626*** 0.640*** 0.562*** 0.649*** 0.169*** 0.265***
(0.035) (0.071) (0.142) (0.045) (0.044) (0.092)
lemp 0.450*** 0.383*** 0.460** 0.162*** 0.392** 0.348***
(0.065) (0.104) (0.197) (0.053) (0.153) (0.110)
lr_capital 0.104** 0.094* 0.202* 0.135*** 0.086 0.461***
(0.046) (0.050) (0.117) (0.030) (0.052) (0.117)
t_trend 0.078*** 0.068*** 0.072*** 0.024*** 0.032*** 0.081***
(0.006) (0.007) (0.008) (0.005) (0.009) (0.012)
lage -0.109*** -0.076*** -0.186** -0.073*** -0.062 -0.042
(0.011) (0.017) (0.078) (0.016) (0.039) (0.052)
no_politics 0.031*** 0.012** 0.040** -0.015*** 0.090*** 0.140**
(0.004) (0.005) (0.018) (0.006) (0.027) (0.059)
high_politics -0.063*** -0.030 -0.046 0.034 0.031 0.324***
(0.016) (0.028) (0.042) (0.026) (0.044) (0.121)
p_capstate -0.208*** -0.049 -0.333* -0.050 -0.155* -0.226**
(0.032) (0.047) (0.193) (0.062) (0.092) (0.092)
p_capcoll 0.116*** 0.059 -0.001 0.170*** -0.057 0.297**
(0.034) (0.047) (0.152) (0.049) (0.074) (0.132)
p_capcorporate 0.075*** 0.065 -0.040 0.164*** -0.067 0.088
(0.026) (0.041) (0.144) (0.042) (0.064) (0.085)
p_capindividual 0.098*** 0.067 0.010 0.166*** -0.095 0.206*
(0.029) (0.044) (0.156) (0.042) (0.074) (0.113)
p_capforeign 0.084*** 0.037* 0.096** 0.045*** -0.025 0.062
(0.016) (0.020) (0.042) (0.014) (0.038) (0.094)
no_exporter -0.039 -0.116* 0.622 -0.361** -0.519* -0.578
(0.052) (0.069) (0.428) (0.180) (0.275) (0.580)
rd_dum 0.000 -0.308* 0.076 0.009 0.085*** 0.005
(0.051) (0.177) (0.242) (0.012) (0.025) (0.078)
lagglom -0.016 -0.003 -0.061** -0.007 0.046*** 0.138***
(0.014) (0.011) (0.028) (0.016) (0.015) (0.043)
lherf -0.054*** -0.080*** 0.061*** 0.062*** -0.028 0.205**
(0.015) (0.021) (0.021) (0.015) (0.033) (0.089)
ldivers 0.241*** 0.166*** 0.181*** 0.223*** 0.006 0.188***
(0.010) (0.017) (0.041) (0.022) (0.015) (0.065)
lfc -0.057*** -0.033*** -0.069*** -0.034*** -0.019*** -0.100***
(0.006) (0.009) (0.026) (0.006) (0.007) (0.023)
neg_liquid -0.052*** -0.043*** -0.117*** -0.072*** -0.046*** -0.022
(0.006) (0.008) (0.029) (0.010) (0.014) (0.035)
lliquid 0.437*** 0.301*** 0.613** 0.351*** 0.236 0.789***
(0.053) (0.053) (0.250) (0.055) (0.163) (0.238)
city200 -0.119*** -0.084*** -0.057** -0.072*** -0.002 0.057
(0.009) (0.012) (0.024) (0.008) (0.015) (0.057)
Constant -3.431*** -2.785*** -2.631* -0.854** -2.084** -1.198
(0.569) (0.798) (1.407) (0.427) (0.879) (0.886)
Province Dummies Yes Yes Yes Yes Yes Yes
Observations 276,450 72,401 42,265 60,473 36,854 2,238
Number of Firms 84,449 22,159 14,731 19,250 7,845 695
AR(1) z-statistic -29.24 -10.37 -10.01 -15.56 -6.976 -3.176
AR(1) z-statistic p-value 0 0 0 0 0 0.00149
AR(2) z-statistic -5.363 -2.587 -2.118 -2.329 2.312 -1.438
AR(2) z-statistic p-value 0 0.00968 0.0341 0.0199 0.0208 0.150
Hansen Test 18.33 13.40 6.520 6.529 12.67 27.83
Hansen Test p-value 0.106 0.0629 0.480 0.367 0.0806 0.114
Returns to Scale (-1) 0.181*** 0.117** 0.224* -0.0547 0.437** 0.0739
z-statistic RTS 8.258 2.556 1.710 -1.420 2.227 0.710
Standard Errors in Parentheses, *** p<0.01, ** p<0.05, * p<0.1

126
Table 2: PANEL E
Dependent variable:
Water
Production Coal Mining
ln sales (SIC46) (SIC60)
lr_input 0.142* 0.568***
(0.082) (0.027)
lemp 1.220*** 0.391***
(0.161) (0.062)
lr_capital 0.216** 0.083*
(0.092) (0.044)
t_trend 0.051*** 0.034***
(0.006) (0.004)
lage -0.221*** -0.079***
(0.046) (0.016)
no_politics 0.174*** 0.061***
(0.040) (0.011)
high_politics 0.239*** -0.015
(0.064) (0.032)
p_capstate -0.474*** -0.212***
(0.157) (0.081)
p_capcoll 0.136 -0.051
(0.146) (0.078)
p_capcorporate -0.191 0.001
(0.140) (0.078)
p_capindividual -0.138 -0.012
(0.149) (0.078)
p_capforeign -0.099 -0.234
(0.145) (0.146)
no_exporter -0.009 -0.103***
(0.360) (0.027)
rd_dum -0.020 0.238***
(0.184) (0.085)
lagglom 0.032 0.103***
(0.033) (0.013)
lherf 0.055** -0.247***
(0.023) (0.023)
ldivers 0.071*** 0.019*
(0.023) (0.011)
lfc -0.049*** -0.000
(0.008) (0.003)
neg_liquid -0.041*** -0.044***
(0.014) (0.007)
lliquid 0.305** 0.376***
(0.134) (0.062)
city200 -0.033 -0.059***
(0.024) (0.009)
Constant -8.343*** -4.078***
(1.278) (0.534)
Province Dummies Yes Yes
Observations 19,451 32,920
Number of Firms 3,183 10,866
AR(1) z-statistic -8.935 -17.74
AR(1) z-statistic p-value 0 0
AR(2) z-statistic -0.642 -3.644
AR(2) z-statistic p-value 0.521 0.000268
Hansen Test 11.26 6.614
Hansen Test p-value 0.258 0.251
Returns to Scale (-1) 0.578*** 0.0417
z-statistic RTS 6.065 1.080
Standard Errors in Parentheses, *** p<0.01, ** p<0.05, * p<0.1

127
3.6. Results of the Semiparametric Estimation
Table 3 presents the results of the estimation of the determinants of TFP levels for 26 industries
according to the Levinsohn and Petrin (2003) semiparametric methodology.
The results suggest that for the majority of industries, the coefficients for employment (lemp) and
capital (lr_capital) are higher in the SYS-GMM estimation results than in the results from the
Levinsohn and Petrin (2003) semiparametric estimation. However, the coefficients for intermediate
inputs (lr_input) are lower in the SYS-GMM results than with the Levinsohn and Petrin (2003)
estimation. Moreover, the results based on the Levinsohn and Petrin (2003) estimation indicate the
existence of increasing returns to scale for 4 out of 26 industries, and decreasing returns to scale for
10 out of 26 industries, with the average sum of output elasticities equalling 0.95. In contrast, the
results based on the SYS-GMM estimation indicate the existence of increasing returns to scale for
18 out of 26 industries, since the average sum of output elasticities equals 1.2. Increasing returns to
scale are more likely for the fast growing Chinese economy than decreasing ones. This suggests that
the results based on the SYS-GMM estimation are more plausible than the ones based on the
semiparametric estimation following Levinsohn and Petrin (2003).
As with the SYS-GMM results, the results of the semiparametric estimation can be summarized by
grouping the variables included in the vector 𝑋𝑖𝑡 into categories: political affiliation/foreign
ownership variables, spatial variables (Marshallian, Jacobian and city spillovers), knowledge
variables (age, R&D and time trend), and all other variables (exporting, competition, liquidity and
marketing capabilities).
Regarding political affiliation/ownership variables, the statistically significant and positive
coefficients of the “high level of political affiliation” variable (high_politics) for 13 out of 26
industries indicate that a high level of political affiliation has a positive effect on firms’ TFP levels.
This effect is strongest for the tobacco, apparel & footwear and water production industries. Only
the timber industry showed a negative effect of a high level of political affiliation on firms’ TFP
levels. The results suggest that Chinese industrial firms benefit in terms of higher TFP from being
affiliated with the central or provincial governments. Moreover, the statistically significant and
positive coefficients for the “no political affiliation” variable (no_politics) for 20 out of 26
industries indicate that a lack of political affiliation also has a positive effect on firms’ TFP levels.
Here, firms appear to benefit in terms of higher TFP from not being politically affiliated with any
level of government. The industries in which this effect is the strongest are the tobacco, electronic
power and water production industries. Based on these results, a high level of political affiliation
with the central or provincial governments and the lack of a political affiliation are both conducive
to higher firm TFP levels. These results are inconsistent, and also partly differ from the initial
expectations and the results of the SYS-GMM estimation, in which the coefficients of the “high

128
level of political affiliation” variable are mostly statistically significant and negative and those on
the “no political affiliation” are mostly statistically significant and positive. These findings also
differ from those of Du and Girma (2010), which indicate that, conditional on survival, politically
unaffiliated firms perform better in terms of TFP growth than politically affiliated ones.
The consideration of political affiliation also takes into account the potential political impact that
State influence might have on a firm’s performance by being a major shareholder. This is because
forms of ownership other than the State ownership are likely to be characterised by a relatively low
impact of political influence from an affiliation. In the semiparametric results, the coefficients for
the variable representing the proportion of paid-in capital owned by the State (p_capstate) are
statistically significant and negative in 21 out of 26 industries (this effect is the highest in the
leather, furniture and water production industries), while the variables representing the proportion
of paid-in capital owned by collective investors (p_capcoll), corporations (p_capcorporate),
individuals (p_capindividual) and foreigners (p_capforeign) are statistically significant and positive
for most industries. These results indicate that a higher proportion of paid-in capital owned by the
State results in lower firm TFP levels, while a higher proportion of paid-in capital owned by
collective investors, corporations, individuals and foreign investors is conducive to higher firm TFP
levels. These findings are consistent with the results from the SYS-GMM estimation and with initial
expectations. They are also similar to the findings of Zhang et al. (2001), Jefferson et al. (2003) and
Zhang et al. (2003), who found that State-owned enterprises were the least efficient and had
achieved the lowest rate of TFP growth, although the studies looked at smaller samples and shorter
time periods.
Regarding spatial variables, the coefficients for the variable representing Marshallian spillovers
(lagglom) are statistically significant and positive for 13 out of 26 industries, but negative in 4
industries. The positive effect is the strongest in the electronic power, tobacco and plastics
industries. The coefficients for the variable representing Jacobian spillovers (ldivers) are
statistically significant and positive in 22 out of 26 industries, with the highest effect seen in the
machinery & equipment, other manufacturing, and apparel & footwear industries. The coefficients
for the variable representing city spillovers (city200) are negative for 18 out of 26 industries, with
the strongest negative effect seen in the leather, transport equipment and measuring instruments
industries. These results indicate that firms are likely to benefit in terms of higher TFP from the
externalities arising by being geographically close to their industrial peers, and by being located in
an area characterised by different industrial activities. The results also indicate that firms do not
benefit in terms of higher TFP levels from being based in a major city. The positive relationship
between Marshallian spillovers and TFP levels is consistent with the results of the SYS-GMM
estimation and similar to those of Lin et al. (2011), who found that industrial agglomeration has a
129
significant positive impact on the productivity of firms, although the relationship takes an inverted
U-shape and only the textile industry was examined. The findings are also similar to those of Yang
et al. (2013), who found that production agglomeration has a positive relationship with firms’
productivity, although their analysis is limited to the electronics industry. The positive relationship
between Jacobian spillovers and TFP is consistent with the SYS-GMM results and similar to the
findings of Liu (2002), who found that Jacobian spillovers positively affect the productivity of 29
manufacturing industries based in Shenzhen. The results are also similar to those of Batisse (2002),
who found Jacobian spillovers to positively affect firms’ added value in 30 industrial sectors across
29 Chinese provinces. The negative relationship between firms’ TFP levels and city spillovers is
consistent with the SYS-GMM estimation, but contrasts with the results of Pan and Zhang (2002),
who found that for firms spread across 28 industries in 224 Chinese cities, firms’ productivity
increases as the city size doubles. In summary, in line with the results of the SYS-GMM estimation
presented in the previous section, firms benefit in terms of higher TFP from being based in areas
characterized by industrial agglomeration and diversity, while not benefiting from being based in
cities.
Among the three knowledge variables examined, the coefficients for the variable representing
firms’ age (lage), are statistically significant and negative in 13 out of 26 industries, indicating that
firms tend to become less productive as they age. These results are consistent with those of the
SYS-GMM estimation but contrast with those of Zheng et al. (2003) who found a significant and
positive effect of age on firms’ technical efficiency for 600 SOEs during 1980-1994, and Hsieh and
Klenow (2009), who found that the productivity of Chinese and Indian firms rises through the
youngest tenth of firms and then remains flat before falling for the oldest tenth of firms. In contrast
to the previous finding, the coefficients for the variable representing firms’ R&D expenditures are
statistically significant and positive for most industries, indicating that firms benefit in terms of
higher TFP levels by undertaking R&D. These results are consistent with those from the SYS-
GMM estimation and those of Wu et al. (2007), who found that R&D positively affected the
technical efficiency of 145 firms belonging to the watch and clock manufacturing industry. The
results also support those of Hu (2001), who found a positive relationship between both firm and
government R&D and the productivity of 813 firms. The coefficients for the variable representing
the time trend (t_trend), or Hicks-neutral technical change, are statistically significant and positive
for 20 out of 26 industries, suggesting that Chinese firms benefit in terms of TFP level increases
over time as they are affected by positive exogenous technological improvements. In summary,
among knowledge variables, R&D expenditure and the time trend positively affect firms’ TFP,
while age negatively affects TFP. These results differ from the SYS-GMM results, in which a
higher level of R&D expenditure resulted in lower TFP levels for most industries.
130
In addition to ownership/political affiliation, spatial and knowledge variables, others variables are
included in the vector 𝑋𝑖𝑡: exporting, competition, liquidity and marketing capabilities.
For 14 out of 26 industries, the statistically significant and negative coefficients for the variable
representing a non-exporting firm (no_exporter) indicate that exporting has a positive effect on
firms’ TFP levels. The results thus suggest that firms benefit from exporting. These findings are not
consistent with those from the SYS-GMM estimation, although they are consistent with those of
Sun and Hong (2011), who found a positive effect of exporting on Chinese firms’ TFP, and Du et
al. (2012b), who found that domestic firms achieve productivity gains by exporting while foreign
firms do not.
The statistically significant coefficients for the variable representing the Herfindahl index of
industrial concentration (lherf) indicate that the higher the industrial concentration, the worse the
firm TFP level. This was the case for 15 out of 26 industries, including non-metal products,
chemical and food production, but was not the case for 10 out of 26 industries, including the water
production, gas production and tobacco industries. In other words, most industries’ firms benefit in
terms of higher TFP levels from an increased level of competition. These results are consistent with
those of the SYS-GMM estimation and similar to those of Zhang et al. (2001), who found a
negative effect of industrial concentration on firms’ productivity, although their analysis was
limited to firms based in Shanghai. The results are also similar to those of Lin et al. (2009), who
found that industrial concentration negatively affects firms’ productivity, although they looked at a
smaller sample over a shorter time period.
In terms of liquidity, the coefficients for the negative working capital to total assets dummy
(neg_liquid) are statistically significant for all industries except tobacco. The coefficients for the
natural logarithm of the working capital to total assets ratio (lliquid) variable are statistically
significant and positive for all industries except for gas production. These results are consistent with
those of the SYS-GMM estimation and those of Chen and Guariglia (2013), who found that a firm’s
productivity is positively and significantly affected by the level of internal liquidity.
For 18 out of 26 industries, the coefficients for the variable representing marketing capabilities (lfc)
are statistically significant and negative, indicating that firms having lower selling and distribution
costs as a percentage of sales tend to be more productive. Such firms are likely to be more able to
transform their resources into valuable output, to better distinguish their products from competitors,
and to build brands that enable them to charge higher prices, thus increasing their TFP level. These
findings are consistent with those of the SYS-GMM estimation but contrast with those of Morgan et
al. (2009), Nath et al. (2010), Lee and Rugman (2012) and Yu et al. (2014).
In summary, the empirical analyses in this study suggest that the SYS-GMM estimation results are
more valid than those from the Levinsohn and Petrin’s (2003) semiparametric estimation. Firstly,

131
coefficients for the political affiliation variables based on the semiparametric estimation indicate
that Chinese firms benefit from having both a high level of political affiliation and no political
affiliation at all. This is somewhat inconsistent and contrasts with the results obtained using the
SYS-GMM estimation, as well as with the empirical results reported in the literature. Secondly,
elasticities with respect to output are much lower for capital and labour but higher for intermediate
inputs when the Levinsohn and Petrin (2003) semiparametric estimation methodology is adopted.
Thirdly, the evidence based on the Levinsohn and Petrin’s (2003) semiparametric approach
suggests the existence of decreasing returns to scale, which are unlikely for the dynamic and fast
growing Chinese economy. In contrast, the results based on the SYS-GMM methodology indicate
the existence of increasing returns to scale. In summary, the empirical results based on the SYS-
GMM estimation seem to be more valid than those based on Levinsohn and Petrin’s (2003)
methodology, strengthening the case for using SYS-GMM as the preferred estimator of TFP in this
study.

132
Table 3: Long-run Levinsohn and Petrin Semi Production Function, Various Industries, China 1998-2007
Food- Apparel &
Dependent variable: Other
Mining Production Tobacco Textile Footwear Leather
ln sales
(SIC10+80) (SIC14) (SIC16) (SIC17) (SIC18) (SIC19)
lr_input 1.000*** 0.810*** 0.328*** 0.675*** 0.861*** 0.881***
(0.008) (0.011) (0.084) (0.012) (0.005) (0.086)
lr_capital 0.007* 0.168*** 0.784*** 0.057*** 0.019*** 0.033***
(0.004) (0.011) (0.124) (0.004) (0.002) (0.009)
lemp 0.040*** 0.102*** 0.220*** 0.079*** 0.118*** 0.086***
(0.002) (0.005) (0.039) (0.002) (0.004) (0.004)
t_trend 0.031*** 0.027*** 0.026*** -0.037*** 0.038*** 0.015***
(0.001) (0.002) (0.006) (0.002) (0.001) (0.001)
lage 0.007*** -0.018*** -0.000 -0.007*** -0.007*** -0.009***
(0.002) (0.004) (0.027) (0.002) (0.003) (0.004)
no_politics 0.007** 0.024*** 0.118* 0.028*** 0.016*** 0.005
(0.003) (0.006) (0.066) (0.003) (0.004) (0.006)
high_politics 0.016** 0.034** 0.099* 0.010 0.074*** -0.062
(0.008) (0.016) (0.056) (0.014) (0.023) -0.062
p_capstate -0.023 -0.190*** -0.056 -0.197*** -0.211*** -0.433***
(0.020) (0.021) (0.310) (0.012) (0.017) (0.044)
p_capcoll -0.000 -0.020 -0.062 0.017*** -0.015** -0.017
(0.018) (0.013) (0.299) (0.006) (0.007) (0.013)
p_capcorporate -0.000 -0.018 -0.150 0.015*** -0.007 0.002
(0.018) (0.013) (0.302) (0.004) (0.005) (0.008)
p_capindividual -0.011 -0.016 0.134 0.010*** -0.012*** 0.008
(0.018) (0.011) (0.312) (0.004) (0.004) (0.007)
p_capforeign -0.010 -0.004 -0.021 0.021*** 0.016*** 0.007
(0.022) (0.014) (0.399) (0.004) (0.005) (0.007)
no_exporter -0.009* -0.017*** -0.067* -0.025*** -0.009*** -0.019***
(0.005) (0.006) (0.036) (0.002) (0.003) (0.005)
rd_dum 0.017* 0.041*** 0.130*** 0.037*** 0.042*** 0.024***
(0.010) (0.007) (0.028) (0.004) (0.005) (0.007)
lagglom 0.023*** 0.023** 0.093 -0.026*** 0.019* 0.025**
(0.003) (0.010) (0.062) (0.009) (0.011) (0.011)
lherf -0.135*** -0.517*** 0.441*** 0.382*** 0.217*** -0.077***
(0.005) (0.023) (0.060) (0.010) (0.017) (0.011)
ldivers -0.010* 0.088*** 0.010 0.055*** 0.154*** 0.087***
(0.006) (0.010) (0.036) (0.005) (0.012) (0.015)
lfc -0.006*** -0.010*** -0.045** -0.009*** 0.008*** -0.015***
(0.001) (0.003) (0.021) (0.002) (0.003) (0.004)
neg_liquid -0.014*** -0.042*** -0.007 -0.030*** -0.032*** -0.032***
(0.004) (0.008) (0.053) (0.003) (0.003) (0.006)
lliquid 0.100*** 0.242*** 0.607*** 0.131*** 0.121*** 0.114***
(0.011) (0.024) (0.178) (0.012) (0.009) (0.015)
city200 -0.002 -0.050*** -0.050 -0.033*** -0.054*** -0.077***
(0.004) (0.009) (0.035) (0.004) (0.006) (0.009)
Province dummies yes yes yes yes yes yes
Observations 37,858 47,250 2,244 165,590 94,106 46,267
Returns to Scale (-1) 0.047*** 0.081*** 0.332*** -0.189*** -0.002 -0.001
z-statistic RTS 8.252 7.485 2.938 -15.41 -0.787 -0.00813
Standard Errors in Parentheses, *** p<0.01, ** p<0.05, * p<0.1

133
Table 3: PANEL B
Paper- Petroleum-
Dependent variable: Timber Furniture Making Printing Cultural Processing
ln sales
(SIC20) (SIC21) (SIC22) (SIC23) (SIC24) (SIC25+70)
lr_input 0.880*** 0.657*** 0.632*** 0.972*** 0.852*** 0.913***
(0.007) (0.049) (0.013) (0.008) (0.109) (0.013)
lr_capital 0.035*** 0.045*** 0.063*** 0.006 0.035*** 0.051***
(0.004) (0.007) (0.006) (0.005) (0.008) (0.009)
lemp 0.083*** 0.107*** 0.094*** 0.052*** 0.102*** 0.024***
(0.004) (0.005) (0.004) (0.002) (0.005) (0.003)
t_trend 0.024*** 0.013*** 0.034*** 0.015*** 0.084*** -0.019***
(0.002) (0.002) (0.001) (0.001) (0.003) (0.001)
lage 0.000 -0.010* -0.004 -0.007*** 0.001 0.006**
(0.003) (0.005) (0.003) (0.002) (0.005) (0.003)
no_politics 0.010* 0.010 0.013*** 0.003 0.014** 0.004
(0.006) (0.011) (0.005) (0.003) (0.007) (0.005)
high_politics -0.060* 0.023 -0.001 0.040*** 0.017 0.007
(0.033) (0.050) (0.017) (0.006) (0.035) (0.011)
p_capstate -0.136*** -0.355*** -0.145*** 0.001 -0.224*** -0.049**
(0.019) (0.035) (0.015) (0.008) (0.036) (0.021)
p_capcoll 0.042*** 0.008 -0.002 0.015* -0.019 -0.014
(0.013) (0.022) (0.009) (0.008) (0.015) (0.018)
p_capcorporate 0.024** 0.047*** 0.003 0.001 -0.020** -0.010
(0.010) (0.010) (0.009) (0.007) (0.009) (0.019)
p_capindividual 0.017* 0.013 0.000 -0.004 -0.011 -0.012
(0.010) (0.009) (0.008) (0.007) (0.007) (0.018)
p_capforeign 0.013 0.011 0.051*** 0.026** 0.005 0.034
(0.011) (0.010) (0.012) (0.011) (0.009) (0.028)
no_exporter -0.019*** -0.014* -0.003 0.010** -0.007 0.005
(0.006) (0.007) (0.006) (0.005) (0.006) (0.011)
rd_dum 0.037*** 0.029*** 0.052*** 0.023*** 0.034*** 0.023***
(0.008) (0.010) (0.008) (0.006) (0.011) (0.007)
lagglom 0.006 0.044*** 0.034*** 0.034*** -0.012 -0.011**
(0.009) (0.017) (0.012) (0.008) (0.015) (0.005)
lherf 0.086*** -0.086*** -0.283*** -0.080*** 0.479*** -0.001
(0.019) (0.021) (0.010) (0.013) (0.045) (0.008)
ldivers 0.065*** 0.135*** 0.110*** 0.063*** 0.102*** -0.061***
(0.011) (0.022) (0.010) (0.007) (0.021) (0.008)
lfc -0.014*** -0.012* -0.010*** -0.005*** -0.001 0.005*
(0.004) (0.006) (0.003) (0.002) (0.004) (0.003)
neg_liquid -0.028*** -0.025*** -0.037*** -0.022*** -0.033*** -0.015***
(0.006) (0.008) (0.005) (0.003) (0.006) (0.005)
lliquid 0.088*** 0.137*** 0.146*** 0.127*** 0.158*** 0.081***
(0.020) (0.027) (0.017) (0.011) (0.023) (0.020)
city200 -0.045*** -0.046*** -0.038*** -0.056*** 0.006 0.017**
(0.007) (0.014) (0.006) (0.004) (0.013) (0.007)
Province dummies yes yes yes yes yes yes
Observations 38,762 22,234 57,792 31,177 24,427 12,378
Returns to Scale (-1) -0.002 -0.191*** -0.210*** 0.030*** -0.012 -0.012*
z-statistic RTS -0.581 -3.664 -15.29 8.746 -0.115 -1.894
Standard Errors in Parentheses, *** p<0.01, ** p<0.05, * p<0.1

134
Table 3: PANEL C
Nonmetal- Metal-
Dependent variable: Chemical Medical Rubber Plastic Products Products
ln sales
(SIC26+28) (SIC27) (SIC29) (SIC30) (SIC31) (SIC32+33+
34)
lr_input 0.984*** 0.884*** 0.874*** 0.868*** 0.542*** 0.922***
(0.018) (0.011) (0.045) (0.004) (0.010) (0.045)
lr_capital 0.000 0.051*** 0.030*** 0.041*** 0.080*** 0.019***
(0.008) (0.006) (0.011) (0.003) (0.002) (0.005)
lemp 0.025*** 0.042*** 0.110*** 0.089*** 0.120*** 0.085***
(0.001) (0.003) (0.006) (0.002) (0.003) (0.003)
t_trend 0.005*** -0.006*** 0.026*** 0.014*** 0.037*** 0.057***
(0.000) (0.002) (0.002) (0.001) (0.001) (0.001)
lage -0.001 -0.004 -0.020*** -0.007** -0.008*** -0.015***
(0.001) (0.003) (0.005) (0.003) (0.001) (0.002)
no_politics 0.011*** 0.009** 0.039*** 0.015*** 0.008*** 0.034***
(0.002) (0.004) (0.008) (0.004) (0.002) (0.003)
high_politics 0.019*** 0.006 0.015 0.011 0.040*** 0.011
(0.004) (0.009) (0.033) (0.015) (0.010) (0.013)
p_capstate -0.043*** -0.057*** -0.213*** -0.205*** -0.115*** -0.132***
(0.004) (0.014) (0.034) (0.012) (0.010) (0.012)
p_capcoll -0.004 -0.027** 0.015 0.015** 0.036*** 0.039***
(0.003) (0.013) (0.016) (0.007) (0.007) (0.008)
p_capcorporate -0.007** -0.012 0.011 0.022*** 0.039*** 0.025***
(0.003) (0.011) (0.013) (0.006) (0.006) (0.006)
p_capindividual -0.009*** -0.011 -0.001 0.014** 0.028*** 0.015***
(0.003) (0.011) (0.013) (0.006) (0.006) (0.005)
p_capforeign 0.019*** 0.017 0.023* 0.046*** 0.063*** 0.043***
(0.004) (0.012) (0.014) (0.007) (0.008) (0.007)
no_exporter -0.004*** -0.016*** -0.001 0.001 -0.019*** -0.021***
(0.001) (0.005) (0.009) (0.003) (0.004) (0.003)
rd_dum 0.012*** 0.023*** 0.053*** 0.041*** 0.021*** 0.030***
(0.002) (0.003) (0.012) (0.004) (0.005) (0.005)
lagglom 0.002 0.045*** -0.052** 0.074*** 0.017*** 0.015*
(0.002) (0.011) (0.022) (0.017) (0.006) (0.009)
lherf -0.019*** -0.526*** -0.304*** -0.164*** -0.514*** 0.352***
(0.001) (0.016) (0.035) (0.011) (0.008) (0.013)
ldivers 0.014*** 0.052*** 0.137*** 0.094*** 0.137*** 0.108***
(0.003) (0.009) (0.017) (0.009) (0.007) (0.007)
lfc -0.001 -0.008*** -0.000 -0.014*** -0.009*** -0.021***
(0.001) (0.002) (0.005) (0.002) (0.002) (0.003)
neg_liquid -0.016*** -0.035*** -0.045*** -0.037*** -0.030*** -0.042***
(0.001) (0.004) (0.008) (0.004) (0.004) (0.003)
lliquid 0.086*** 0.199*** 0.174*** 0.190*** 0.202*** 0.150***
(0.005) (0.016) (0.026) (0.016) (0.013) (0.011)
city200 -0.017*** -0.010 -0.084*** -0.042*** -0.081*** -0.091***
(0.002) (0.006) (0.010) (0.006) (0.004) (0.004)
Province dummies yes yes yes yes yes yes
Observations 129,000 33,367 22,894 80,982 173,374 139,488
Returns to Scale (-1) 0.009 -0.023** 0.013 -0.002 -0.259*** 0.027
z-statistic RTS 0.904 -2.156 0.346 -0.722 -25.46 0.641
Standard Errors in Parentheses, *** p<0.01, ** p<0.05, * p<0.1

135
Table 3: PANEL D
Machinery
& Transport- Measuring- Other- Electronic- Gas
Dependent variable: Equipment Equipment Instrument Manufacturi
ng Power Production
ln sales
(SIC35+36) (SIC37) (SIC41) (SIC42+43) (SIC44) (SIC45)
lr_input 0.861*** 0.907*** 0.886*** 0.858*** 0.357*** 0.825***
(0.104) (0.003) (0.007) (0.121) (0.015) (0.060)
lr_capital 0.036** 0.050*** 0.049*** 0.036*** 0.194*** 0.093*
(0.016) (0.003) (0.004) (0.008) (0.015) (0.052)
lemp 0.106*** 0.041*** 0.054*** 0.101*** 0.242*** 0.032***
(0.002) (0.002) (0.002) (0.003) (0.008) (0.012)
t_trend 0.046*** 0.041*** 0.056*** 0.009*** 0.046*** 0.072***
(0.001) (0.001) (0.001) (0.001) (0.001) (0.009)
lage -0.018*** -0.003*** -0.002 -0.019*** 0.071*** -0.011
(0.001) (0.001) (0.002) (0.003) (0.006) (0.010)
no_politics 0.027*** 0.006*** 0.007* -0.009 0.085*** 0.018
(0.002) (0.002) (0.004) (0.006) (0.011) (0.024)
high_politics 0.059*** 0.024*** 0.017** 0.051** 0.137*** 0.027
(0.008) (0.005) (0.008) (0.020) (0.014) (0.031)
p_capstate -0.239*** -0.040*** -0.007 -0.248*** -0.148*** -0.094***
(0.008) (0.006) (0.008) (0.024) (0.031) (0.031)
p_capcoll 0.029*** 0.003 0.027*** 0.016* -0.066** -0.014
(0.005) (0.005) (0.006) (0.009) (0.032) (0.039)
p_capcorporate 0.005 -0.005 0.033*** 0.034*** -0.091*** -0.009
(0.004) (0.005) (0.005) (0.007) (0.030) (0.032)
p_capindividual 0.001 -0.008* 0.018*** 0.022*** -0.074** -0.008
(0.004) (0.004) (0.005) (0.007) (0.031) (0.037)
p_capforeign 0.065*** 0.025*** 0.030*** 0.047*** -0.050 0.052
(0.005) (0.006) (0.005) (0.009) (0.045) (0.046)
no_exporter -0.020*** 0.003 0.005 0.001 -0.080** -0.032
(0.002) (0.002) (0.003) (0.004) (0.033) (0.055)
rd_dum 0.054*** 0.015*** 0.027*** 0.067*** 0.112*** -0.004
(0.003) (0.002) (0.003) (0.005) (0.020) (0.039)
lagglom -0.001 0.003 -0.007 -0.051*** 0.102*** 0.001
(0.008) (0.007) (0.005) (0.010) (0.013) (0.025)
lherf -0.108*** -0.150*** 0.017*** 0.040*** -0.232*** 0.306***
(0.006) (0.005) (0.005) (0.009) (0.036) (0.089)
ldivers 0.193*** 0.096*** 0.066*** 0.176*** 0.034*** 0.074***
(0.006) (0.005) (0.009) (0.014) (0.011) (0.026)
lfc -0.013*** -0.009*** -0.001 -0.009*** -0.021*** -0.010
(0.002) (0.001) (0.002) (0.003) (0.007) (0.008)
neg_liquid -0.047*** -0.019*** -0.023*** -0.051*** -0.038*** -0.032**
(0.002) (0.002) (0.004) (0.005) (0.010) (0.014)
lliquid 0.188*** 0.134*** 0.177*** 0.174*** 0.781*** 0.053
(0.007) (0.006) (0.011) (0.016) (0.061) (0.064)
city200 -0.105*** -0.077*** -0.063*** -0.057*** 0.025** 0.003
(0.003) (0.003) (0.004) (0.007) (0.011) (0.021)
Province dummies yes yes yes yes yes yes
Observations 276,450 72,401 35,460 60,473 46,033 2,238
Returns to Scale (-1) 0.003 -0.002 -0.012** -0.005 -0.207*** -0.050
z-statistic RTS 0.0312 -0.886 -1.976 -0.0457 -8.118 -0.927
Standard Errors in Parentheses, *** p<0.01, ** p<0.05, * p<0.1

136
Table 3: PANEL E
Water-
Dependent variable: Production Coal Mining
ln sales
(SIC46) (SIC60)
lr_input 0.463*** 0.834***
(0.034) (0.012)
lr_capital 0.258*** 0.041***
(0.010) (0.005)
lemp 0.207*** 0.087***
(0.007) (0.003)
t_trend 0.052*** 0.009***
(0.001) (0.001)
lage 0.019*** 0.000
(0.006) (0.003)
no_politics 0.046** 0.009*
(0.018) (0.005)
high_politics 0.068*** 0.003
(0.022) (0.011)
p_capstate -0.265*** -0.058
(0.049) (0.044)
p_capcoll -0.059 -0.006
(0.053) (0.044)
p_capcorporate -0.168*** 0.013
(0.052) (0.045)
p_capindividual -0.122** 0.005
(0.055) (0.045)
p_capforeign -0.022 -0.156**
(0.078) (0.073)
no_exporter -0.059** -0.033***
(0.025) (0.009)
rd_dum 0.001 0.043***
(0.029) (0.012)
lagglom 0.010 0.072***
(0.013) (0.006)
lherf 0.200*** -0.181***
(0.010) (0.014)
ldivers 0.029*** -0.012*
(0.009) (0.006)
lfc -0.014*** 0.005**
(0.003) (0.002)
neg_liquid -0.039*** -0.030***
(0.008) (0.004)
lliquid 0.188*** 0.112***
(0.043) (0.015)
city200 0.001 -0.019***
(0.010) (0.004)
Province dummies yes yes
Observations 19,451 32,920
Returns to Scale (-1) -0.072** -0.038***
z-statistic RTS -2.404 -3.722
Standard Errors in Parentheses, *** p<0.01, ** p<0.05, * p<0.1

137
3.7. Relative importance of TFP determinants
After having analysed what determines higher TFP levels across Chinese industrial firms, it is
important to underline which determinants are likely to exert the largest impact on TFP. This would
enable policymakers to understand which determinants they should focus on in order to achieve
higher TFP levels.
In order to measure such impacts, the parameter estimates resulting from the SYS-GMM estimation
are taken. The weighted mean of the parameter estimates is calculated for each variable. In this
case, the weight is measured as the number of firms in each industry as a proportion of the total
number of firms in all industries. The weighted mean of the parameter estimates for each variable is
standardized by multiplying it by the respective variable standard deviation. This is then divided by
the dependent variable standard deviation. In all the calculations, only the parameter estimates of
the industries that were statistically significant in the SYS-GMM estimation are included.
In table 4, the figures are ordered in a decreasing order, according to the extent of the impact on
TFP levels. For some variables, in order to measure their positive impact on TFP, the weighted
mean of parameter estimates is multiplied by the negative value of the respective independent
variable standard deviation. These are the variables representing: exporting (no_exporter), age
(lage), competition (lherf), liquidity (neg_liquid) and marketing capabilities (lfc).
Based on these results, it can be seen that the time trend (t_trend), or Hicks-neutral technical
change, has the largest impact on TFP levels. In other words, firms largely increase their
productivity over time as a result of exogenous technological improvements.
The figures in table 4 also indicate that a significant positive impact on TFP levels comes from the
share of Chinese industrial firms’ proportion of paid-in capital owned by either individuals
(p_capindividual) or corporations (p_capcorporate). At the same time, a significant negative impact
on TFP levels comes from the proportion of paid-in capital owned by the State (p_capstate). In
comparison with other owners, such as the State, individuals or corporates are more likely to
influence firms’ decision towards the maximization of TFP, rather than the pursuit of politically
motivated objectives, such as maximum employment. This is also indicated by the variable
representing the political affiliation of a firm with either the central or provincial government
(high_politics), which has a large negative effect on TFP. It can be therefore inferred that policy
measures aimed at decreasing State influence on Chinese firms, in terms of both ownership and
political affiliation, and at increasing private forms of ownership, could have a large positive impact
on firms’ TFP.
Among the negative effects on TFP, the second worst has been recorded by the variable
representing city spillovers (city200). Although firms seem to benefit from being based in areas
characterized by industrial agglomeration and diversity, as indicated by the positive values for the

138
variables representing Marshallian (lagglom) and Jacobian (ldivers) spillovers, they do not seem to
benefit from being based in cities. While cities are likely to provide firms with many positive
advantages, such as access to a wide customer base, these are likely to be dominated by other
disadvantages, such as higher rent and transportation costs, which might hamper their TFP. This
suggests that policy measures incentivizing firms to be based in areas characterized by industrial
agglomeration and diversity other than cities are likely to have a large positive effect on firms’ TFP.
Table 4: Relative importance of different TFP effects based on equation (47)
Variable Impact
t_trend 0.103
p_capindividual 0.086
p_capcorporate 0.068
lliquid 0.053
lage 0.050
ldivers 0.050
lagglom 0.037
lfc 0.029
p_capcoll 0.025
neg_liquid 0.020
no_exporter 0.013
no_politics 0.012
lherf 0.007
p_capforeign 0.006
rd_dum 0.001
high_politics -0.012
city200 -0.023
p_capstate -0.035

139
3.8.Results of the KS Testing
Tables 5 through 7 present the results of the two-sample Kolmogorov and Smirnov (KS) tests of
equality of TFP distribution functions. Figures 1 through 15 complements the tables by plotting the
related empirical cumulative TFP distributions.
Table 5: Two-Sample Kolmogorov-Smirnov Statistics for Equality of Distribution Functions
Industry Year
Group D p-Value Group D p-Value
0 Apparel & Footwear 0 1 0 1998 0.0005 0.945
1 Machinery & Equipment -0.5476 0 1 2007 -0.262 0
Political Affiliation Political Affiliation
Group D p-Value Group D p-Value
0 No Political Affiliation 0.0005 0.945 0
No High Political
Affiliation 0.0071 0
1 High Political Affiliation -0.262 0 1 High Political Affiliation -0.1879 0
Political Affiliation State Ownership
Group D p-Value Group D p-Value
0 Political Affiliation 0.1814 0 0 State Ownership<0.25 0 1
1 No Political Affiliation 0 0.999 1 State Ownership>0.25 -0.3428 0
Province R&D
Group D p-Value Group D p-Value
0 Guizhou 0.4121 0 0 No R&D 0.0158 0
1 Shanghai 0 1 1 R&D -0.0917 0
Exporting
Group D p-Value
0 Non Exporter 0.0069 0
1 Exporter -0.1391 0
The first line represents a hypothesis test that TFP for group 0 has smaller values than for group 1. The related D-
statistic indicates the largest difference between the distribution functions in this direction. The second line represents a
hypothesis test that TFP for group 0 has larger values than for group 1. The related D-statistic indicates the largest
difference between the distribution functions in this direction.
Figure 1 compares the productivity distribution between firms belonging to the “Apparel and
Footwear” and “Machinery and Equipment” industries. Firms belonging to the “Apparel &
140
Footwear” industry have a productivity distribution to the right of those belonging to the
“Machinery & Equipment” industry, indicating that the former stochastically dominate the latter in
terms of its TFP distribution (KS tests in Table 5 indicate that the maximum gap between the
distribution for firms belonging to the Apparel & Footwear industry and firms belonging to the
Machinery and Equipment industry has a value of 0.55, and is significant at the 1% level). Based on
the same rationale, Figures 12 and 13 indicate that the productivity distribution of firms belonging
to the “Leather” industry stochastically dominates the one of the firms belonging to the “Other
Manufacturing” industry, for both 1998 and 2007. Moreover, Figures 14 and 15 indicate that the
productivity distribution of firms belonging to the “Other Manufacturing” industry stochastically
dominates the productivity distribution of firms belonging to the “Apparel & Footwear” industry in
both 1998 and 2007. In Figures 14 and 15, there is some evidence of significant crossover in terms
of TFP distribution between the two sub-groups at high values of the empirical cumulative
distributions. These results point to the existence of heterogeneity in empirical cumulative
distributions of TFP levels for groups of firms according to their industry, suggesting that it is
important to estimate TFP levels separately for each of them.
Figure 2 compares the empirical cumulative distributions of TFP levels between firms operating in
1998 and firms operating in 2007. Consistent with the results presented in Table 2, firms operating
in 2007 have a productivity distribution to the right of those operating in 1998, indicating that the
former stochastically dominate the latter in terms of their TFP distribution (a KS test shows that the
maximum gap between the distribution for firms operating in 1998 and firms operating in 2007 has
a value of 0.26, and is significant at the 1% level). This points to the existence of TFP growth
between 1998 and 2007.
Figure 3 indicates the existence of heterogeneity between the productivity distributions of non-
politically affiliated firms and politically affiliated ones. Firms with no political affiliation have a
productivity distribution to the right of those with high political affiliation and medium political
affiliation, indicating that the former distribution stochastically dominates the other two (a KS test
shows that the maximum gap between the distribution for firms with no affiliation and firms having
high political affiliation is 0.18, and is significant at the 1% level). There is also evidence of some
significant crossover in the figures representing the sub-groups at high values of the empirical
cumulative distributions. These findings suggest that non-politically affiliated firms are more
productive than politically affiliated ones, consistent with the findings in Table 2.
Figure 4 compares the TFP distribution between firms in which the State owns more than 25% of
paid-in capital and those in which the State owns less than 25%. The figure shows that the
productivity distribution for firms in which the State owns less than 25% of paid-in capital is on the
right of the distribution for firms in which the State owns more than 25% of paid-in capital,
141
suggesting that the former stochastically dominates the latter. The KS test indicates that the
maximum gap between the two distributions is 0.34 and is statistically significant at the 1% level.
These findings indicate that firms having a share of State paid-in capital ownership lower than 25%
have higher TFP levels than firms in which the share is higher, and are again in line with the
findings in Table 2.
Figure 5 compares the TFP distribution for firms based in the Shanghai province to those based in
the Guizhou province. The distribution for firms based in Shanghai is on the right of the distribution
for firms based in Guizhou, suggesting that firms based in Shanghai are more productive than firms
based in Guizhou (the value of the KS test statistic is 0.41 and is statistically significant at the 1%
level). Moreover, Figures 8 and 9 indicate that firms based in Guizhou are more productive than
firms based in Guangdong both in 1998 and 2007. Figures 10 and 11 indicate that firms based in
Guangdong are more productive than firms based in Yunnan both in 1998 and 2007. These results,
which are in line with those presented in Section 3.5, point to the existence of heterogeneity in TFP
levels across groups of firms based in different provinces, and suggest that it is important to take
geographical differences into account when estimating TFP.
Figure 6 compares the empirical cumulative productivity distributions between firms undertaking
R&D and those not doing so. The figure indicates that the former dominates the latter (a KS test
shows that the maximum gap between the distribution for firms undertaking R&D and firms not
doing so has a value of 0.09 and is significant at the 1% level). These results indicate that firms
undertaking R&D have higher TFP levels than firms not doing so.
Figure 7 compares the productivity distribution between exporting firms and non-exporting ones.
The first group has a productivity distribution to the right of the second group, indicating that the
empirical cumulative distribution of TFP levels for exporting firms dominates that of the non-
exporting firms. KS tests show that the maximum gap between the two distributions has a value of
0.14, and is statistically significant at the 1% level. These results indicate that firms engaged in
exporting activities have higher TFP levels than non-exporting firms.
In summary, the results of the KS tests and the related empirical cumulative TFP distributions are in
line with the findings represented in Table 2. The results indicate that empirical cumulative
distributions of TFP levels differ across groups of firms having different characteristics in terms of
political affiliation, paid-in capital share ownership, R&D expenditure and exporting. The results
also point to the existence of heterogeneity in TFP levels across groups of firms belonging to
different industries and based in different provinces, thus suggesting that it is important to estimate
TFP separately for each industry, and to take into account the geographical differences across firms
when estimating TFP levels. Moreover, the KS tests and empirical cumulative distributions indicate
the existence of TFP growth between 1998 and 2007.

Table 6: Industry Two-sample Kolmogorov-Smirnov Test for Equality of Distribution Functions
Group SIC Industry D P-value SIC Industry D P-value
0 42 Other Manufacturing 0 1
42 Other Manufacturing 0 1
1 10 Other Mining -0.9534 0
14 Food Production -0.5538 0
0 42 Other Manufacturing 0 1
42 Other Manufacturing 0.5213 0
1 16 Tobacco -0.9347 0
17 Textile -0.0001 1
0 42 Other Manufacturing 0 1
42 Other Manufacturing 0.8617 0
1 18 Apparel & Footwear -0.807 0
19 Leather 0 1
0 42 Other Manufacturing 0 1
42 Other Manufacturing 0 1
1 20 Timber -0.9617 0
21 Furniture -0.9348 0
0 42 Other Manufacturing 0.4861 0
42 Other Manufacturing 0 1
1 22 Papermaking 0 1
23 Printing -0.219 0
0 42 Other Manufacturing 0.0023 0.83
42 Other Manufacturing 0 1
1 24 Cultural -0.3644 0
25 Petroleum
Processing -0.9767 0
0 42 Other Manufacturing 0.1454 0
42 Other Manufacturing 0 1
1 26 Chemical -0.0155 0
27 Medical -0.9853 0
0 42 Other Manufacturing 0 1
42 Other Manufacturing 0.8326 0
1 29 Rubber -0.6539 0
30 Plastic 0 1
0 42 Other Manufacturing 0 1
42 Other Manufacturing 0.3321 0
1 31 Non-metal Products -0.9492 0
32 Metal Products -0.0768 0
0 42 Other Manufacturing 0 1
42 Other Manufacturing 0 1
1 35 Machinery &
Equipment -0.8969 0
37 Transport &
Equipment -0.8393 0
0 42 Other Manufacturing 0 1
42 Other Manufacturing 0 1
1 41 Measuring
Instruments -0.7885 0
44 Electric & Heat
Power -0.9892 0
0 42 Other Manufacturing 0.0179 0.102
42 Other Manufacturing 0 1
1 45 Gas Production -0.6643 0
46 Water Production -0.9988 0
0 42 Other Manufacturing 0 1
1 60 Coal Mining -0.9195 0
The first line represents a hypothesis test that TFP for group 0 has smaller values than for group 1. The related D
indicates the largest difference between the distribution functions in this direction. The second line represents a
hypothesis test that TFP for group 0 has larger values than for group 1. The related D indicates the largest difference
between the distribution functions in this direction.
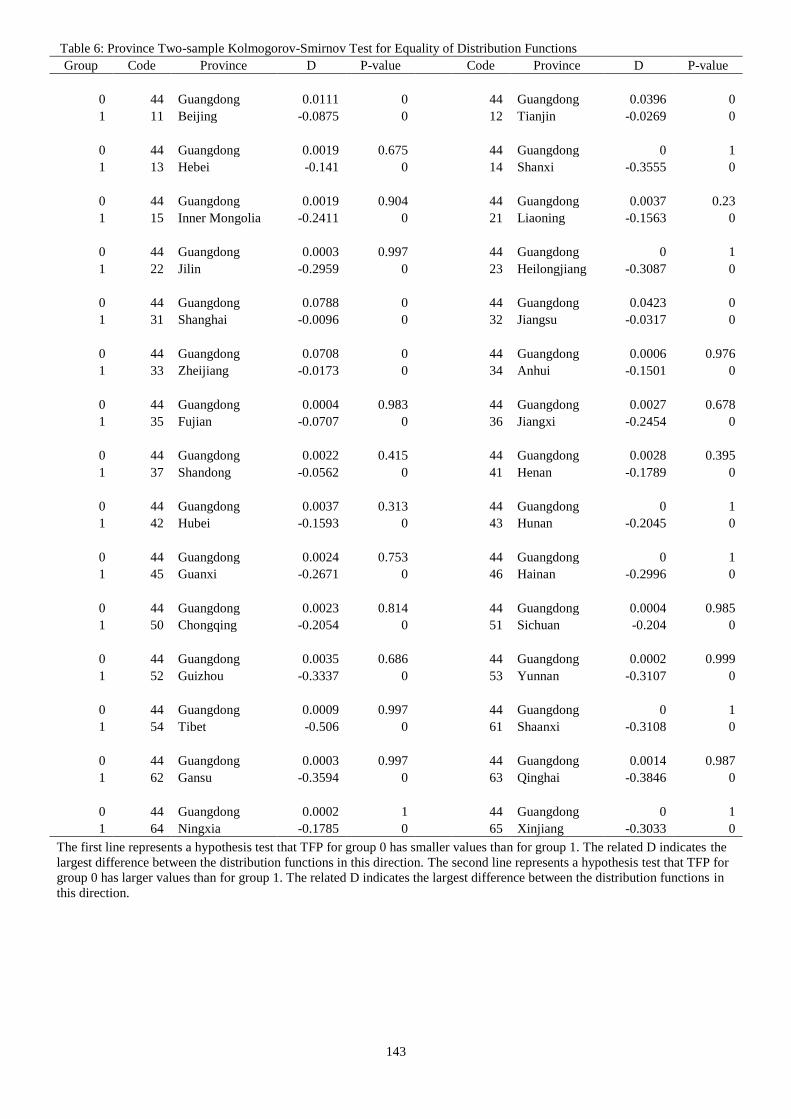
143
Table 6: Province Two-sample Kolmogorov-Smirnov Test for Equality of Distribution Functions
Group Code Province D P-value Code Province D P-value
0 44 Guangdong 0.0111 0
44 Guangdong 0.0396 0
1 11 Beijing -0.0875 0
12 Tianjin -0.0269 0
0 44 Guangdong 0.0019 0.675
44 Guangdong 0 1
1 13 Hebei -0.141 0
14 Shanxi -0.3555 0
0 44 Guangdong 0.0019 0.904
44 Guangdong 0.0037 0.23
1 15 Inner Mongolia -0.2411 0
21 Liaoning -0.1563 0
0 44 Guangdong 0.0003 0.997
44 Guangdong 0 1
1 22 Jilin -0.2959 0
23 Heilongjiang -0.3087 0
0 44 Guangdong 0.0788 0
44 Guangdong 0.0423 0
1 31 Shanghai -0.0096 0
32 Jiangsu -0.0317 0
0 44 Guangdong 0.0708 0
44 Guangdong 0.0006 0.976
1 33 Zheijiang -0.0173 0
34 Anhui -0.1501 0
0 44 Guangdong 0.0004 0.983
44 Guangdong 0.0027 0.678
1 35 Fujian -0.0707 0
36 Jiangxi -0.2454 0
0 44 Guangdong 0.0022 0.415
44 Guangdong 0.0028 0.395
1 37 Shandong -0.0562 0
41 Henan -0.1789 0
0 44 Guangdong 0.0037 0.313
44 Guangdong 0 1
1 42 Hubei -0.1593 0
43 Hunan -0.2045 0
0 44 Guangdong 0.0024 0.753
44 Guangdong 0 1
1 45 Guanxi -0.2671 0
46 Hainan -0.2996 0
0 44 Guangdong 0.0023 0.814
44 Guangdong 0.0004 0.985
1 50 Chongqing -0.2054 0
51 Sichuan -0.204 0
0 44 Guangdong 0.0035 0.686
44 Guangdong 0.0002 0.999
1 52 Guizhou -0.3337 0
53 Yunnan -0.3107 0
0 44 Guangdong 0.0009 0.997
44 Guangdong 0 1
1 54 Tibet -0.506 0
61 Shaanxi -0.3108 0
0 44 Guangdong 0.0003 0.997
44 Guangdong 0.0014 0.987
1 62 Gansu -0.3594 0
63 Qinghai -0.3846 0
0 44 Guangdong 0.0002 1
44 Guangdong 0 1
1 64 Ningxia -0.1785 0
65 Xinjiang -0.3033 0
The first line represents a hypothesis test that TFP for group 0 has smaller values than for group 1. The related D indicates the
largest difference between the distribution functions in this direction. The second line represents a hypothesis test that TFP for
group 0 has larger values than for group 1. The related D indicates the largest difference between the distribution functions in
this direction.

144
Figure 1: Empirical cumulative TFP distributions for firms belonging to the Apparel & Footwear and Machinery
& Equipment Industries
Figure 2: Empirical cumulative TFP distributions for firms operating in 1998 and 2007
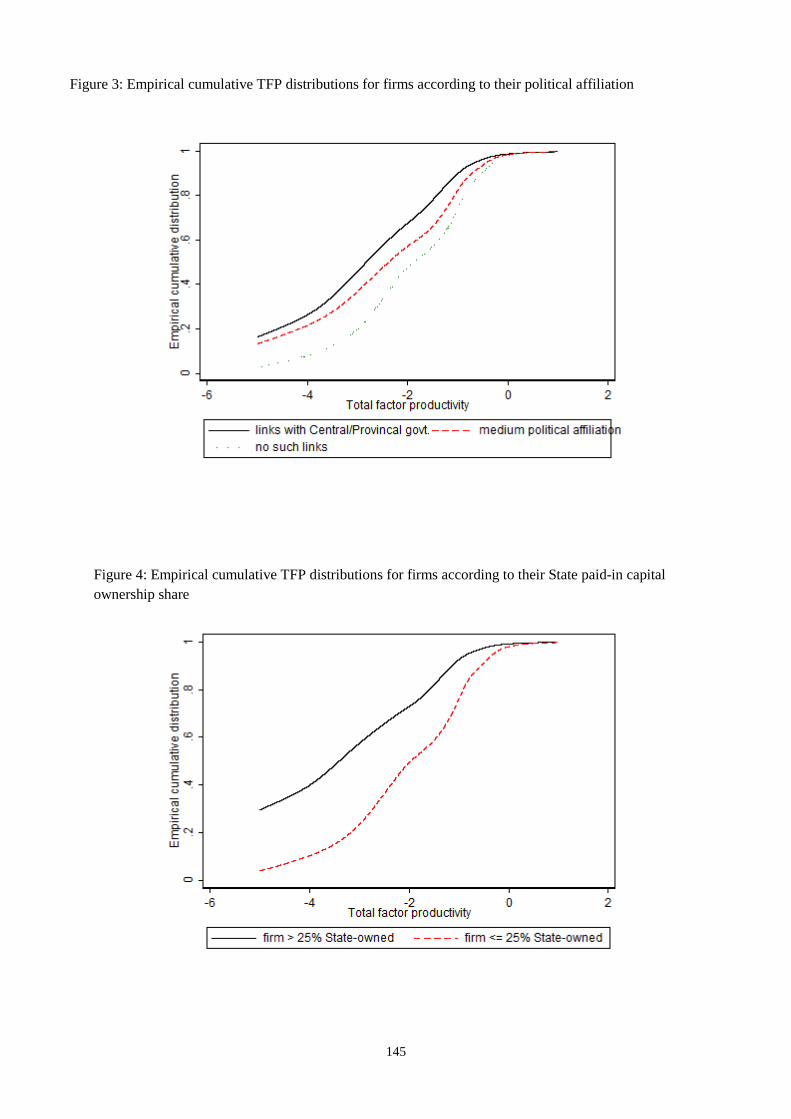
145
Figure 3: Empirical cumulative TFP distributions for firms according to their political affiliation
Figure 4: Empirical cumulative TFP distributions for firms according to their State paid-in capital
ownership share
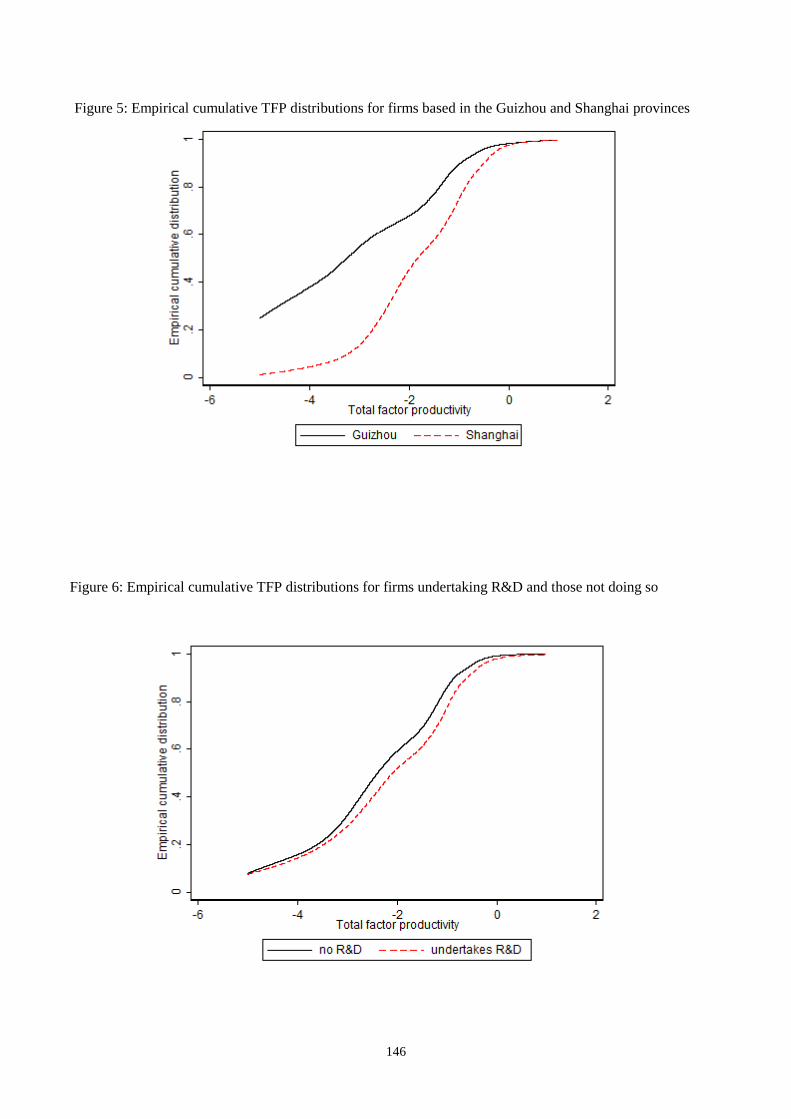
146
Figure 5: Empirical cumulative TFP distributions for firms based in the Guizhou and Shanghai provinces
Figure 6: Empirical cumulative TFP distributions for firms undertaking R&D and those not doing so

147
0.2
.4.6
.81
Em
pir
ica
l cum
ula
tive d
istr
ibutio
n
-6 -4 -2 0 2Total factor productivity
Guangdong Guizhou
Figure 7: Empirical cumulative TFP distributions for exporting firms vs. non-exporting ones
Figure 8: Empirical cumulative TFP distributions for firms based in Guangdong and Guizhou in 1998

148
0.2
.4.6
.81
Em
pir
ica
l cum
ula
tive d
istr
ibutio
n
-6 -4 -2 0 2Total factor productivity
Guangdong Guizhou
0.2
.4.6
.81
Em
pir
ica
l cum
ula
tive d
istr
ibutio
n
-6 -4 -2 0 2Total factor productivity
Guangdong Yunnan
Figure 9: Empirical cumulative TFP distributions for firms based in Guangdong and Guizhou in 2007
Figure 10: Empirical cumulative TFP distributions for firms based in Guangdong and Yunnan in 1998
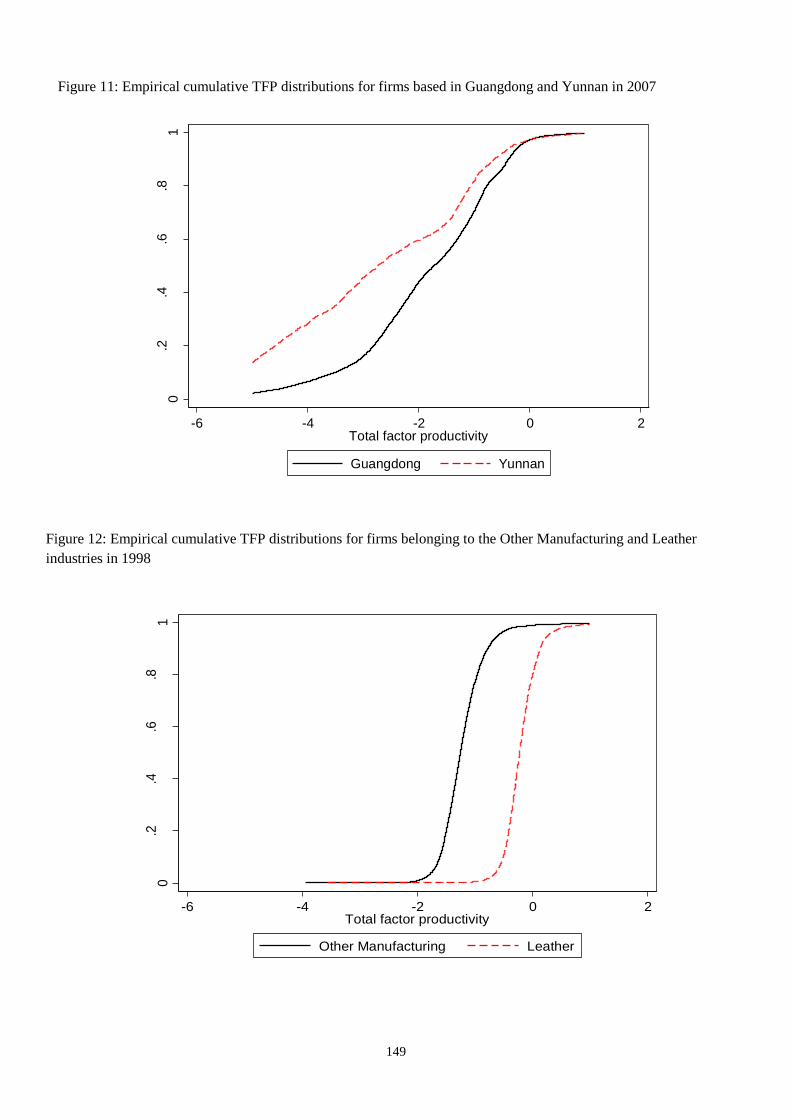
149
0.2
.4.6
.81
Em
pir
ica
l cum
ula
tive d
istr
ibutio
n
-6 -4 -2 0 2Total factor productivity
Other Manufacturing Leather
Figure 12: Empirical cumulative TFP distributions for firms belonging to the Other Manufacturing and Leather
industries in 1998
0.2
.4.6
.81
Em
pir
ica
l cum
ula
tive d
istr
ibutio
n
-6 -4 -2 0 2Total factor productivity
Guangdong Yunnan
Figure 11: Empirical cumulative TFP distributions for firms based in Guangdong and Yunnan in 2007
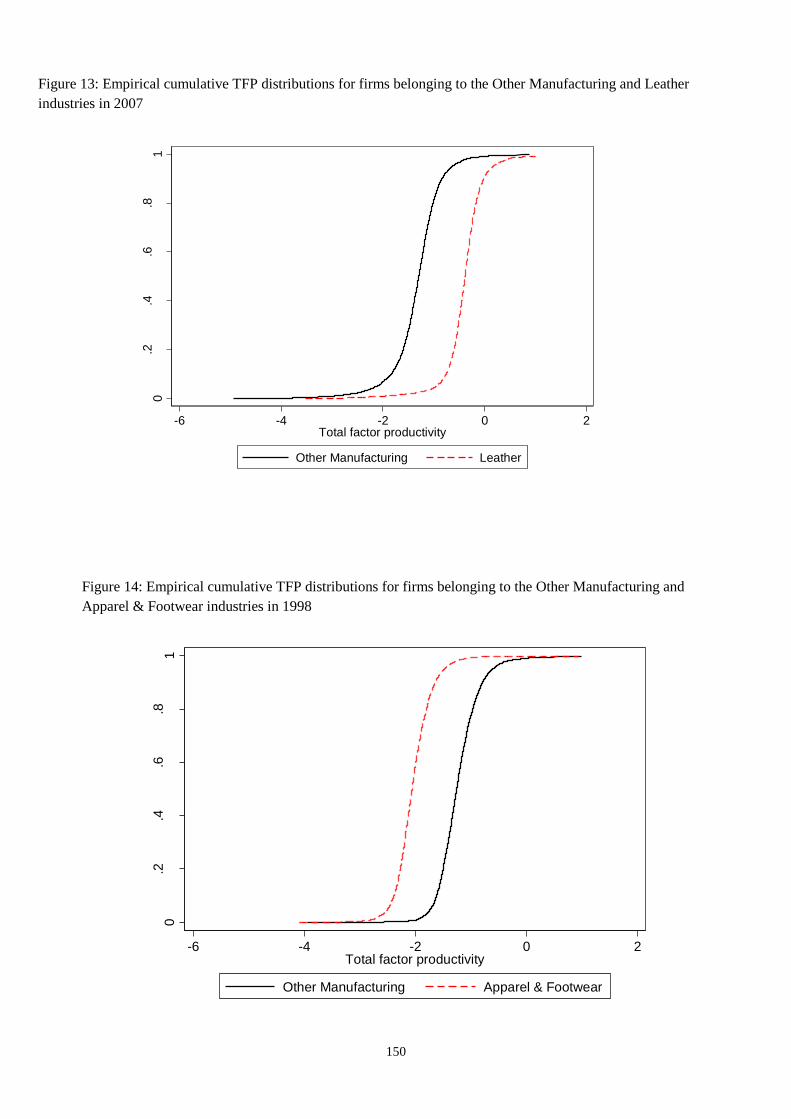
150
0.2
.4.6
.81
Em
pir
ica
l cum
ula
tive d
istr
ibutio
n
-6 -4 -2 0 2Total factor productivity
Other Manufacturing Leather
0.2
.4.6
.81
Em
pir
ica
l cum
ula
tive d
istr
ibutio
n
-6 -4 -2 0 2Total factor productivity
Other Manufacturing Apparel & Footwear
Figure 13: Empirical cumulative TFP distributions for firms belonging to the Other Manufacturing and Leather
industries in 2007
Figure 14: Empirical cumulative TFP distributions for firms belonging to the Other Manufacturing and
Apparel & Footwear industries in 1998

151
0
.2.4
.6.8
1
Em
pir
ica
l cum
ula
tive d
istr
ibutio
n
-6 -4 -2 0 2Total factor productivity
Other Manufacturing Apparel & Footwear
Figure 15: Empirical cumulative TFP distributions for firms belonging to the Other Manufacturing and Apparel &
Footwear industries in 2007

152
4. An Analysis of the Determinants of TFP Growth
Chapter 3 analysed the determinants of TFP levels across Chinese firms during the period of
1998-2007. This chapter analyses the determinants of TFP growth during the same period. A
decomposition of TFP growth can provide policymakers with an understanding of the
underlying determinants. Policy measures targeting them would spur TFP growth and
consequently drive national economic growth.
The decomposition of TFP growth is performed in Section 4.1 using the Haltiwanger (1997)
approach, which breaks down aggregate TFP growth into the contributions provided by the
following: firms becoming more productive over time, the reallocation of resources through
contraction and expansion of output shares between firms characterized by different TFP
levels, the entrance of relatively high productive firms, and the exit of relatively low
productive firms. In order to gain an additional understanding of the determinants of TFP
growth, the decomposition is also performed at the industry, province and political
affiliation/ownership levels.
Melitz and Polanec (2012) have found that the Haltiwanger (1997) decomposition
methodology generates biases in the measurement of the contribution to TFP growth from
entering and exiting firms. Thus, their methodology is also adopted in Section 4.2 in order to
check which set of results is the most appropriate.
4.1. Haltiwanger’s (1997) Decomposition
In this study, a decomposition of aggregate TFP growth is applied using following the
methodology of Haltiwanger (1997), which represents a modified version of Baily et al.’s
(1992) approach. In this section, the description of the methodology follows that of
Haltiwanger (1997). Using the firm-level TFP estimates resulting from the application of
SYS-GMM, an industry index of aggregate productivity in year 𝑡 is determined as a weighted
average of individual firm-level productivity:
ln 𝑃𝑡 = ∑ 𝜃𝑖𝑡 ln 𝑃𝑖𝑡
𝑖
(58)
Its growth rate between year 𝑡 and 𝑡 − 𝑘 is then calculated as follows:
∆ ln 𝑃𝑡 = ln 𝑃𝑡 − ln 𝑃𝑡−𝑘 (59)
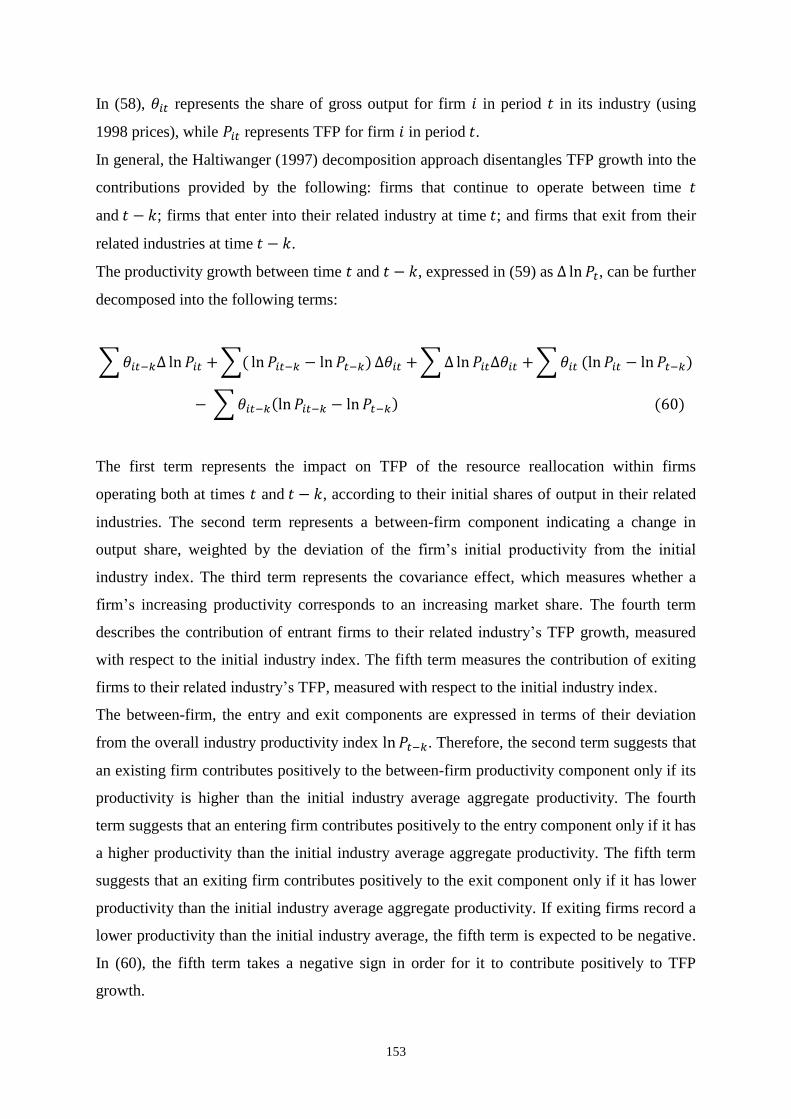
153
In (58), 𝜃𝑖𝑡 represents the share of gross output for firm 𝑖 in period 𝑡 in its industry (using
1998 prices), while 𝑃𝑖𝑡 represents TFP for firm 𝑖 in period 𝑡.
In general, the Haltiwanger (1997) decomposition approach disentangles TFP growth into the
contributions provided by the following: firms that continue to operate between time 𝑡
and 𝑡 − 𝑘; firms that enter into their related industry at time 𝑡; and firms that exit from their
related industries at time 𝑡 − 𝑘.
The productivity growth between time 𝑡 and 𝑡 − 𝑘, expressed in (59) as ∆ ln 𝑃𝑡, can be further
decomposed into the following terms:
∑ 𝜃𝑖𝑡−𝑘∆ ln 𝑃𝑖𝑡 + ∑( ln 𝑃𝑖𝑡−𝑘 − ln 𝑃𝑡−𝑘) ∆𝜃𝑖𝑡 + ∑ ∆ ln 𝑃𝑖𝑡∆𝜃𝑖𝑡 + ∑ 𝜃𝑖𝑡 (ln 𝑃𝑖𝑡 − ln 𝑃𝑡−𝑘)
− ∑ 𝜃𝑖𝑡−𝑘(ln 𝑃𝑖𝑡−𝑘 − ln 𝑃𝑡−𝑘) (60)
The first term represents the impact on TFP of the resource reallocation within firms
operating both at times 𝑡 and 𝑡 − 𝑘, according to their initial shares of output in their related
industries. The second term represents a between-firm component indicating a change in
output share, weighted by the deviation of the firm’s initial productivity from the initial
industry index. The third term represents the covariance effect, which measures whether a
firm’s increasing productivity corresponds to an increasing market share. The fourth term
describes the contribution of entrant firms to their related industry’s TFP growth, measured
with respect to the initial industry index. The fifth term measures the contribution of exiting
firms to their related industry’s TFP, measured with respect to the initial industry index.
The between-firm, the entry and exit components are expressed in terms of their deviation
from the overall industry productivity index ln 𝑃𝑡−𝑘. Therefore, the second term suggests that
an existing firm contributes positively to the between-firm productivity component only if its
productivity is higher than the initial industry average aggregate productivity. The fourth
term suggests that an entering firm contributes positively to the entry component only if it has
a higher productivity than the initial industry average aggregate productivity. The fifth term
suggests that an exiting firm contributes positively to the exit component only if it has lower
productivity than the initial industry average aggregate productivity. If exiting firms record a
lower productivity than the initial industry average, the fifth term is expected to be negative.
In (60), the fifth term takes a negative sign in order for it to contribute positively to TFP
growth.

154
One issue that may arise in the TFP growth decompositions is selection bias. In this study,
“entering” not only refers to a firm joining its respective industry but can also mean
becoming large enough to be part of the NBS sample. At the same time, “exiting” not only
refers to a firm leaving the industry, but can also indicate that a firm becomes too small to be
part of the NBS sample. While one might conclude that the exclusion of small firms could
generate a selection bias, the empirical results in the literature suggest that most firms that
decline and become small in size usually close (Baldwin and Gorecki, 1991; Bernard and
Jensen, 2002; Disney et al., 2003; Dunne et al., 1998). Moreover, by adopting the full census
of firms carried out for China in 2004, Brandt et al. (2012) found that the firms omitted from
the National Bureau of Statistics sample (80% of total) only accounted for about 9.9% of
output and 2.5% of exports in 2004. This indicates that even if firms that become small do
not close, their importance is minimal, suggesting that such exclusion is not likely to have a
significant impact on the results of the TFP growth decompositions, thus not generating a
selection bias.
In summary, the Haltiwanger (1997) approach disentangles TFP growth into within-firm
increases, between-firm increases5 and the contribution provided by entering and exiting
firms. It therefore provides a complete overview of what drives TFP growth within the
Chinese industrial sector. Moreover, in order to gain an additional understanding of the
determinants of TFP growth, the decomposition is also performed at the industry, province
and political affiliation/ownership levels. The Haltiwanger approach is a more informative
measure, as it allows for output reallocation across sub-groups. It must be stressed that when
a large number of sub-groups are considered, or when these have different shares in the total
aggregate output, the results can be difficult to interpret. This is because the results are
determined by the importance of each group (e.g. industry) within the economy, which is
measured in terms of its share of total output, in addition to what is happening to TFP within
each group. Therefore, in order to better interpret the Haltiwanger (1997) approach results,
the figures from the decomposition are weighted to take into account the relative size of each
group.6 A standard TFP index for each sub group is also produced.
5 The between-firm and cross-firm effects obtained through the Haltiwanger (1997) approach are combined into
a unique ‘between firm’ effect. Although the separate information provided by each component is relevant, the
main focus in this study is the change in annual TFP growth within firms, between firms, or through entry and
exit. 6 When results are produced for all industries or all provinces, the weighted and actual figures are the same.
When firms are then sub-divided into single industries or single provinces, the results differ since there are
differences in the relative size of each sub-group within the whole economy.
155
Although the Haltiwanger (1997) approach is a valuable methodology for decomposing TFP
growth, Melitz and Polanec (2012) found that it generates biases in the measurement of the
contribution to TFP growth from entering and exiting firms. By decomposing TFP growth for
a sample of Slovenian firms for the years 1995-2000, they compared the Haltiwanger (1997)
approach with other methodologies, and argue that it suffers from an over-measurement of
the contribution of entering and exiting firms to TFP growth. They also compared their own
TFP decomposition methodology, which represents an extension of that developed by Olley
and Pakes (1996), with those of Griliches and Regev (1995) and Foster et al. (2001), who
adopt the Haltiwanger (1997) approach. Melitz and Polanec’s (2012) results show a large
positive contribution of entering firms when the Griliches and Regev (1995) and Foster et al.
(2001) methodologies are adopted, an effect that increases over the sample period. Their
decomposition, in contrast, indicates that entry provides an almost null contribution to
aggregate productivity growth, as entering firms have, on average, nearly the same TFP level
as existing firms for each time period. These results highlight that the TFP dynamic
decomposition developed by Melitz and Polanec (2012) provides a more suitable measure
than Haltiwanger’s (1997) because it utilises different TFP reference levels to measure the
contribution of surviving, entering and exiting firms to aggregate TFP, thus eliminating the
measurement biases that characterise the Griliches and Regev (1995) and Foster et al. (2001)
methodologies. In order to confirm this finding, and to verify which set of results is the most
appropriate, the Melitz and Polanec (2012) decomposition methodology is also adopted.
4.1.1. Results of the Haltiwanger (1997) Decomposition
Table 8: Firm-level TFP Growth (average % p.a.) in Chinese Industrial Sector (1998-2007)
China
Haltiwanger Approach
SYS-GMM
Actual TFP Growth
9.68
Decomposition of TFP Growth
Within Firm
2.13
Between Firm
2.42
Entering Firms
7.03
Exiting Firms
-1.90
TFP Index
1998
1.00
2007 2.39
The second and third terms of equation (60) have been combined into the “between” component of TFP growth.
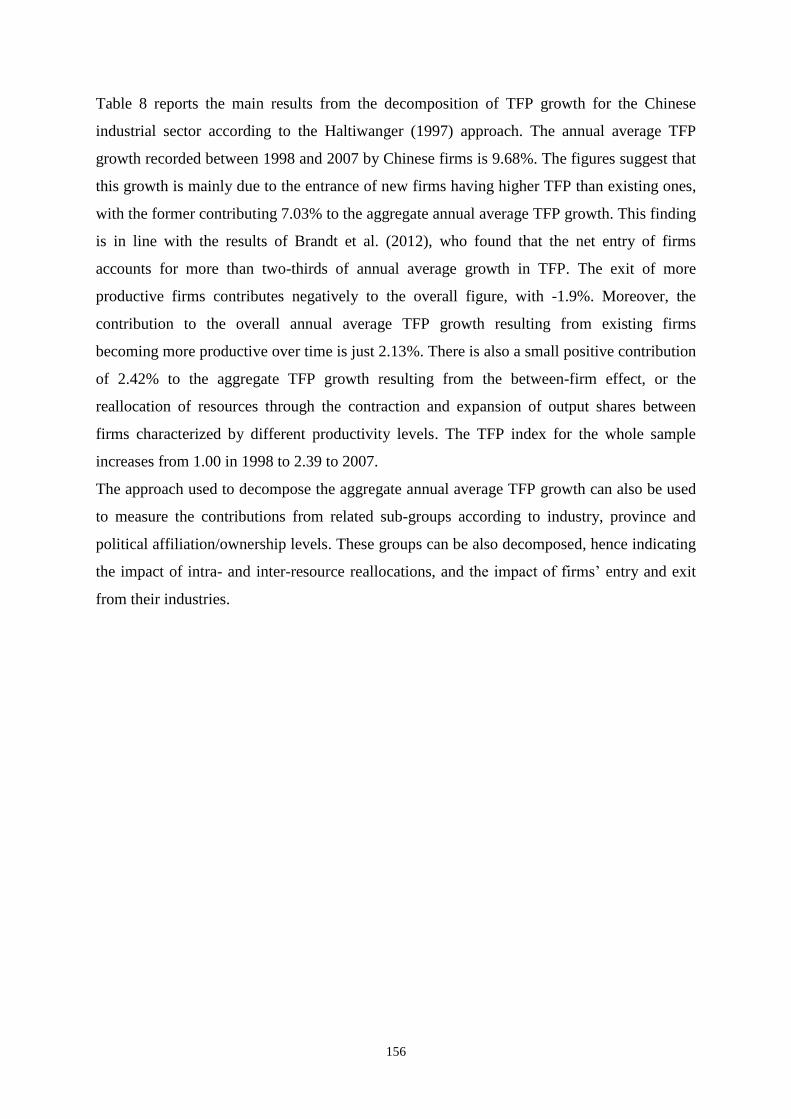
156
Table 8 reports the main results from the decomposition of TFP growth for the Chinese
industrial sector according to the Haltiwanger (1997) approach. The annual average TFP
growth recorded between 1998 and 2007 by Chinese firms is 9.68%. The figures suggest that
this growth is mainly due to the entrance of new firms having higher TFP than existing ones,
with the former contributing 7.03% to the aggregate annual average TFP growth. This finding
is in line with the results of Brandt et al. (2012), who found that the net entry of firms
accounts for more than two-thirds of annual average growth in TFP. The exit of more
productive firms contributes negatively to the overall figure, with -1.9%. Moreover, the
contribution to the overall annual average TFP growth resulting from existing firms
becoming more productive over time is just 2.13%. There is also a small positive contribution
of 2.42% to the aggregate TFP growth resulting from the between-firm effect, or the
reallocation of resources through the contraction and expansion of output shares between
firms characterized by different productivity levels. The TFP index for the whole sample
increases from 1.00 in 1998 to 2.39 to 2007.
The approach used to decompose the aggregate annual average TFP growth can also be used
to measure the contributions from related sub-groups according to industry, province and
political affiliation/ownership levels. These groups can be also decomposed, hence indicating
the impact of intra- and inter-resource reallocations, and the impact of firms’ entry and exit
from their industries.

157
4.1.2. Results for Industry, Province and Political Affiliation/Ownership Decompositions
Table 9: Firm-level TFP Growth (average per annum) in Industry Sub-sectors, 1998-2007, China
TFP Growth (% p.a.) Decomposition of Weighted TFP Growth Output Share (%)
Within Between Entering Exiting
Actual Weighted Firm Firm Firms Firms 1998 2007
Sector 1 2 3 4 5 6 7 8
Water Production 0.24 45.05 2.86 26.89 -7.09 22.39 0.53 0.24
Petroleum Processing 2.56 26.22 3.93 18.70 -4.00 7.59 9.77 3.39
Machinery & Equipment 1.08 15.82 4.23 1.42 9.09 1.08 6.84 11.52
Nonmetal Products 0.81 15.34 4.01 2.66 -2.94 11.61 5.30 5.18
Metal Products 2.03 14.32 1.85 2.37 16.68 -6.57 14.16 18.29
Transport Equipment 0.94 13.92 4.51 0.66 9.65 -0.90 6.75 9.02
Other Mining 0.20 13.41 5.01 1.61 1.28 5.50 1.50 1.78
Gas Production 0.04 13.21 1.99 0.21 13.31 -2.31 0.31 0.31
Electric power and heating 1.02 12.65 6.77 5.00 -9.93 10.80 8.09 6.75
Medical 0.28 12.20 2.64 4.98 -5.92 10.51 2.33 1.83
Measuring instrument 0.50 11.30 1.39 1.54 11.42 -3.06 4.41 7.30
Food Production 0.14 8.06 1.95 -1.60 14.06 -6.34 1.75 1.83
Coal Mining 0.21 7.89 3.34 0.71 2.89 0.95 2.62 2.31
Tobacco 0.18 7.24 3.06 0.35 -0.57 4.41 2.45 1.16
Furniture 0.03 5.98 0.40 -0.07 6.12 -0.47 0.47 0.74
Timber 0.04 5.58 1.21 0.22 1.83 2.32 0.80 1.16
Apparel & Footwear 0.08 2.58 2.32 -1.96 8.05 -5.82 3.10 2.81
Rubber 0.02 1.86 1.39 -0.09 6.70 -6.14 1.30 1.12
Papermaking 0.01 0.29 0.04 -1.43 14.90 -13.21 2.10 1.96
Chemical -0.07 -0.75 -2.03 -1.54 11.84 -9.02 9.61 8.40
Cultural -0.01 -1.01 2.44 -5.80 9.22 -6.87 0.88 0.66
Plastic -0.04 -1.68 -2.74 -3.17 19.96 -15.74 2.44 2.38
Printing -0.02 -2.51 0.72 -5.11 9.76 -7.87 0.88 0.63
Textile -0.25 -3.44 -0.28 -2.72 13.74 -14.18 7.30 6.08
Leather -0.07 -3.45 -0.16 -5.56 19.18 -16.90 1.89 1.61
Other manufacturing -0.27 -11.14 -5.16 -2.54 8.05 -11.49 2.42 1.56
All Sectors 9.68 9.68 2.13 2.42 7.03 -1.90 100.00 100.00
The second and third terms of equation (60) have been combined into the “between” component of TFP growth.
158
Table 9 reports the results for the industry-level decomposition of actual annual average
growth in TFP according to the Haltiwanger (1997) approach. Column (1) reports the average
percentage per annum TFP growth according to equation (60). However, these figures do not
account for the differences in the relative size of each sub-group, measured in terms of the
output shares indicated in columns (7) and (8), which correspond to 1998 and 2007,
respectively. In column (2), the values from column (1) are weighted by the base year output
shares shown in column (7). Columns (3), (4), (5) and (6) represent the decomposition of the
annual weighted average TFP growth, with the rows summing to make the numbers in
column (2).
In terms of absolute annual average TFP growth, as represented by the actual figures in
column (1), the highest growth is recorded by the petroleum processing, metal products and
machinery & equipment industries, while the lowest growth is recorded by the other
manufacturing, textile and chemical industries. The figures in column (2) take into account
the relative size of each sector in the base year. Here, the water production industry records
the strongest annual weighted average TFP growth, followed by the petroleum processing
and machinery & equipment industries. The lowest annual weighted average TFP growth is
recorded by the other manufacturing, leather and textile industries.
In terms of the TFP growth decomposition, the figures in columns (3), (4), (5) and (6) show
that the highest performing industries are characterised by a strong effect from the entry of
new firms, which is the case for the machinery & equipment, metal products and transport
equipment industries. The high performing industries also show a strong effect from the exit
of firms, which is the case for the water production, petroleum processing and non-metal
products industries. The worst performing industries are characterized by a strong effect from
both the entry and exit of more productive firms, as is the case in the other manufacturing,
leather and textile industries.

159
Table 10: Firm-level TFP Growth (average per annum) in Provinces, 1998-2007, China
TFP Growth (% p.a.) Decomposition of Weighted TFP Growth Output Share (%)
Within Between Entering Exiting
Actual Weighted Firm Firm Firms Firms 1998 2007
Province 1 2 3 4 5 6 7 8
Jiangxi 0.32 26.46 5.50 2.30 16.79 1.87 1.22 1.99
Inner Mongolia 0.20 23.13 5.33 -0.37 16.98 1.18 0.84 1.54
Xinjiang 0.27 20.21 3.95 15.40 -0.98 1.84 1.33 -0.06
Heilongjiang 0.65 19.63 -7.32 25.61 0.27 1.07 3.33 0.91
Shandong 1.57 17.76 3.90 2.85 10.60 0.42 8.83 12.59
Qinghai 0.04 17.68 2.03 1.85 -1.37 15.17 0.25 2.37
Gansu 0.15 15.30 3.94 4.78 0.53 6.05 0.99 0.78
Hunan 0.25 14.33 1.99 1.47 10.86 0.01 1.75 1.88
Chongqing 0.16 12.82 2.19 -0.02 6.85 3.80 1.23 1.16
Liaoning 0.66 12.44 4.30 5.00 3.49 -0.35 5.34 4.40
Sichuan 0.31 12.41 3.43 3.69 6.07 -0.78 2.49 2.37
Anhui 0.27 12.38 4.63 4.83 5.14 -2.22 2.22 2.08
Beijing 0.28 10.67 3.89 2.60 5.43 -1.25 2.59 3.14
Henan 0.51 10.63 2.55 4.14 6.18 -2.24 4.76 4.99
Hebei 0.51 10.38 1.73 4.87 6.75 -2.98 4.92 4.70
Zhejiang 0.67 10.14 0.84 0.37 14.93 -6.00 6.60 9.09
Shanxi 0.17 9.65 2.69 2.32 2.32 2.32 1.72 1.93
Yunnan 0.18 9.56 1.69 0.43 3.45 3.98 1.86 1.16
Jilin 0.18 9.48 3.79 -0.35 2.94 3.10 1.90 1.31
Guangxi 0.12 9.45 3.46 0.90 5.48 -0.40 1.26 1.09
Shaanxi 0.10 9.25 3.55 4.26 0.18 1.26 1.11 1.09
Fujian 0.21 8.14 1.66 -0.84 10.57 -3.25 2.64 3.17
Ningxia 0.03 7.82 0.22 0.16 4.16 3.29 0.36 0.31
Hainan 0.02 7.39 3.58 -4.60 7.25 1.16 0.24 0.22
Jiangsu 0.85 7.02 1.76 0.58 10.16 -5.48 12.15 13.25
Tianjin 0.21 6.89 2.85 2.96 6.00 -4.92 3.00 2.50
Guizhou 0.05 6.88 3.53 -0.67 1.96 2.05 0.71 0.56
Hubei 0.17 4.61 1.44 3.02 3.83 -3.68 3.60 2.43
Shanghai 0.24 2.88 2.64 -2.16 6.14 -3.74 8.19 6.72
Guangdong 0.35 2.79 0.85 -1.09 5.27 -2.24 12.68 11.96
All Provinces 9.69 9.68 2.13 2.42 7.03 -1.90 100.00 100.00
The second and third terms of equation (60) have been combined into the “between” component of TFP growth.
Table 10 reports the Haltiwanger (1997) sub-decomposition of annual average TFP growth
for Chinese provinces. As represented in column (1), the highest actual TFP growths are
recorded by Shandong, Jiangsu and Liaoning, while Hainan, Ningxia and Qinghai record the
lowest growth. The figures in column (2) take into account the relative size of each province

160
in the base year. In this case, the provinces of Jiangxi, Inner Mongolia and Xinjiang
provinces record the highest annual weighted average TFP growth, while the provinces of
Guangdong, Shanghai and Hubei record the lowest annual weighted average TFP growth.
The fact that Western provinces such as Inner Mongolia and Xinjiang record high TFP
growth while coastal provinces such as Shanghai and Guangdong record low TFP growth
might reflect a “catch up” effect of less developed provinces with more developed ones,
which are typically located on the coast.
In terms of the TFP growth decomposition, the figures in columns (3), (4), (5) and (6)
indicate that provinces with high TFP growth show a strong effect of firms’ entry, such as in
Jiangxi, Inner Mongolia and Shandong, and a strong between-firm effect, such as in Xinjiang
and Heilongjiang. Provinces characterized by low TFP growth, such as Hubei, Shanghai and
Guangdong, show a strong contribution from the effects of both firms’ entry and exit.
Table 11: Firm-level TFP Growth (average per annum) by Group 1998-2007, China
TFP Growth (% p.a.) Decomposition of Weighted TFP Growth Output Share (%)
Within Between Entering Exiting
Actual Weighted Firm Firm Firms Firms 1998 2007
Group 1 2 3 4 5 6 7 8
State<25%/No Politics 5.86 50.39 2.33 -0.12 52.69 -4.51 11.62 54.33
State<25%/High Politics 1.97 18.46 7.62 10.37 -2.00 2.47 10.67 11.78
State>=50%/High Politics 2.30 8.95 2.31 3.83 -0.69 3.51 25.67 10.70
State>=50%/No Politics 0.07 8.48 0.27 1.63 6.86 -0.28 0.82 0.63
25<State<50%/No Politics 0.02 3.52 1.05 -1.54 5.65 -1.63 0.48 0.40
State>=50%/Medium Politics 0.20 1.26 0.97 0.86 0.19 -0.75 15.80 3.66
25<State<50%/Medium Politics 0.00 0.05 1.21 0.78 0.60 -2.55 2.45 0.72
25<State<50%/High Politics -0.02 -1.21 1.94 2.13 -2.55 -2.74 1.29 0.74
State<25%/Medium Politics -0.71 -2.28 0.78 0.50 3.85 -7.41 31.21 17.04
All Groups 9.68 9.68 2.13 2.42 7.03 -1.90 100.00 100.00
The second and third terms of equation (60) have been combined into the “between” component of TFP growth.
Table 11 reports the Haltiwanger (1997) decomposition of annual average TFP growth for
groups of firms according to their political affiliation and State share ownership of paid-in
capital. In terms of absolute annual average TFP growth, as represented in column (1), the
highest is recorded by non-politically affiliated firms whose paid-in capital State share
ownership is lower than 25%, while firms having medium political affiliation and whose
paid-in capital State share ownership is smaller than 25% record the lowest annual average
TFP growth. The figures in column (2) take into account the relative size of each group
161
during the base year. Of these, non-politically affiliated firms whose paid-in capital State
share ownership is lower than 25% record the highest annual weighted average TFP growth,
while medium politically affiliated firms whose paid-in capital State share ownership is
below 25% record the lowest weighted annual average TFP growth per annum. These figures
indicate that Chinese industrial firms benefit in terms of high TFP growth from a lack of
government influence in terms of both political affiliation and paid-in capital share
ownership.
In terms of TFP growth decomposition, the figures in columns (3), (4), (5) and (6) indicate
that the entry of new firms underlies the strong TFP growth recorded by non-politically
affiliated firms whose paid-in capital State share ownership is less than 25%. At the same
time, there is a strong negative effect on TFP growth of the exit of firms that are more
productive than the existing average for medium and highly politically affiliated firms whose
paid-in capital State share ownership is less than 50%.
In summary, the results from using the Haltiwanger (1997) approach show an annual average
TFP growth of 9.68% during the period of 1998-2007 for the Chinese firms in the sample.
The figures suggest that this growth is mainly due to the entrance of new firms having a
relatively high TFP, with these firms contributing 7.03% to the overall annual average TFP
growth. The contributions of the other components are mild: -1.9% due to the exit of more
productive firms; 2.13% contribution from TFP improvements within existing firms; and
2.42% resulting from the between-firm effect, which represents the reallocation of resources
through the contraction and expansion of output shares between firms characterized by
different productivity levels. The TFP index for the entire sample increases from 1.00 in 1998
to 2.39 to 2007. These results suggest that policy measures favouring the entrance of new,
dynamic and innovative firms would be conducive to TFP growth within the Chinese
industrial sector. Among industries, water production records the strongest annual weighted
average TFP growth, while the other manufacturing industry records the lowest annual
weighted average TFP growth.
Among provinces, Jiangxi, Inner Mongolia and Xinjiang record the highest annual weighted
average TFP growth, while Guangdong, Shanghai and Hubei record the lowest TFP growth.
Such results suggest the existence of a “catch-up” effect of less developed Western provinces
to the highly developed Eastern ones.
Firms that are not politically affiliated and whose State paid-in capital share ownership is
below 25% record the highest annual weighted average TFP growth, while medium
politically affiliated firms whose State paid-in capital ownership is less than 25% record the
162
lowest TFP growth. These results indicate that policy measures aimed at decreasing the role
of the State in the Chinese industrial sector, both in terms of political affiliation and paid-in
capital share ownership, are conducive to higher TFP growth.
This section has introduced the Haltiwanger (1997) approach for decomposing TFP growth
and discussed the results based on its application in the Chinese industrial sector. The next
section introduces the Melitz and Polanec (2012) approach and discusses the related results.
4.2. Melitz and Polanec (2012) Decomposition
This section describes the TFP decomposition methodology of Melitz and Polanec (2012).
Firms’ aggregate productivity is calculated as:
Φ𝑡 = �̅�𝑡 + ∑(𝑠𝑖𝑡 − �̅�𝑡)(𝜑𝑖𝑡 − �̅�𝑡)
𝑖
Here, �̅�𝑡 =1
𝑛𝑡∑ 𝜑𝑖𝑡
𝑛𝑡𝑖=1 is the unweighted firm productivity mean and �̅�𝑡 =
1
𝑛𝑡 is the mean
market share. Melitz and Polanec (2012) use the following Olley and Pakes (1996)
decomposition:
∆Φ = Δ�̅�𝑆 + Δ𝑐𝑜𝑣𝑆 (62)
In this case, the change in aggregate TFP is given by the sum of the change in weighted
average TFP across firms and the covariance between firms’ productivity and market share.
Equation (62) is subsequently decomposed into:
∆Φ = (Φ𝑆2 − Φ𝑆1) + 𝑠𝐸2(Φ𝐸2 − Φ𝑆2) + 𝑠𝑋1(Φ𝑆1 − Φ𝑋1)
= Δ�̅�𝑆 + Δ𝑐𝑜𝑣𝑆 + 𝑠𝐸2(Φ𝐸2 − Φ𝑆2) + 𝑠𝑋1(Φ𝑆1 − Φ𝑋1)
In the first line of equation (63), aggregate productivity growth is decomposed into the
contribution provided by existing firms, entering firms and exiting firms. In the second line,
the contribution of existing firms is further decomposed into the contribution provided by a
shift in productivity, represented by the un-weighted mean growth in the productivity of
existing firms Δ�̅�𝑆, and the contribution provided by market share Δ𝑐𝑜𝑣𝑆 across existing
firms. This represents the covariance between existing firms’ market share and TFP.
The Haltiwanger (1997) approach adopts the same TFP reference level to measure the
contributions to aggregate TFP growth provided by existing firms, entering firms, and exiting
(63)
(61)

163
firms. The TFP reference level is represented by the aggregate TFP for the period 𝑡 = 1, and
is adopted because existing firms are tracked over time. In contrast, Melitz and Polanec
(2012) adopt three different TFP reference levels for existing, entering, and exiting firms. In
the case of existing firms, the TFP reference level is represented by their aggregate
productivity at time 𝑡 = 1. In the case of entering firms, it is the aggregate productivity of
existing firms at time 𝑡 = 2. In the case of exiting firms, it is the aggregate productivity of
existing firms at time 𝑡 = 1. Such TFP reference levels indicate that existing firms make a
positive contribution to the aggregate figure if their productivity at time 𝑡 = 2 is higher than
at time 𝑡 = 1. Entering firms make a positive contribution to the aggregate figure if their
productivity when they enter at time 𝑡 = 2 is higher than the productivity of existing firms.
Exiting firms make a positive contribution to the aggregate figure if their productivity when
they exit at time 𝑡 = 1 is lower than the productivity of existing firms.
Based on a sample of Slovenian manufacturing firms operating during 1995-2000, Melitz and
Polanec’s (2012) results suggest that their decomposition approach, as well as those of
Griliches and Regev (1995) and Foster et al. (2001), are characterised by almost the same
contribution of existing, entering and exiting firms when a one-year sample interval is
considered. However, the components’ contributions seem to differ as the time interval is
widened. The results indicate the existence of an over-measurement of the positive
contribution of both entering and exiting firms to aggregate TFP when the Griliches and
Regev (1995) and Foster et al. (2001) methodologies are adopted. Such contributions also
seem to increase over time. This is because entering firms have almost the same productivity
as existing ones in each year, hence lowering the TFP reference level in the Griliches and
Regev (1995) and Foster et al. (2001) decomposition approaches, and increasing the entering
firms’ contribution over time. The TFP reference level in these decomposition approaches
seems to be below Φ𝑆2. At the same time, the TFP reference level for exiting firms seems to
be above Φ𝑆1, thus increasing the contribution of exiting firms to aggregate TFP growth.
The above discussion suggests the existence of an over-measurement of the contribution of
entering and exiting firms when the Foster et al. (2001) decomposition, which follows the
approach of Haltiwanger (1997), is adopted. Melitz and Polanec (2012) found that this
corresponds to an under-measurement of 7-10% over five years of the contribution provided
by existing firms. Among sub-components, this effect seems to be mainly attributable to the
between-firm effect, or the reallocation of resources. According to the results of Melitz and
Polanec’s (2012) methodology, the contribution from the reallocation of resources is 5% over

164
five years, or double that found using the Griliches and Regev (1995) and Foster et al. (2001)
methodologies. Moreover, the results of Melitz and Polanec’s (2012) TFP decomposition
approach indicate that the contribution of entering firms to aggregate productivity is about
zero and does not increase over time, thus suggesting the existence of an over-measurement
issue in the other two methodologies particularly in the Foster et al. (2001) approach.
These results highlight that the TFP dynamic decomposition of Melitz and Polanec (2012)
represents a more suitable measure than the one used by Haltiwanger (1997), as it utilises
different TFP reference levels to measure the contribution of surviving, entering and exiting
firms to aggregate TFP, thus eliminating measurement biases that characterise Haltiwanger’s
methodology. In order to confirm this, and to verify which set of results are the most
appropriate, Melitz and Polanec’s (2012) methodology is also adopted in this study and its
results discussed in the following subsection.
4.2.1. Results of the Melitz and Polanec (2012) Decomposition.
Table 12: Firm-level TFP Growth (average % p.a.) in the Chinese Industrial Sector (1998-2007)
China
Melitz and Polanec (2012) Approach
SYS-GMM
Actual TFP Growth
9.68
Decomposition of TFP Growth
Within Firm
3.15
Between Firm
6.47
Entering Firms
3.51
Exiting Firms
-3.45
TFP Index
1998
1.00
2007 2.39
The second and third terms of equation (60) have been combined into the “between” component of TFP growth.
Table 12 reports the main results of the decomposition of productivity growth according to
the Melitz and Polanec (2012) approach. The annual average TFP growth of Chinese firms
recorded during the period of 1998-2007 is 9.68%. The figures indicate that such growth
mainly results from the between-firm effect, which contributes 6.47% to the aggregate annual
average TFP growth, a much larger contribution than the 2.42% seen in the results from the
Haltiwanger decomposition. While in the results of the Haltiwanger decomposition approach,
the entrance of new firms contributes 7.03% to the annual average TFP growth, this figure is

165
just 3.15% with the Melitz and Polanec (2012) approach. This finding confirms the results of
Melitz and Polanec (2012) and provides further evidence for the existence of an over-
measurement issue of the “entering firms” component of TFP growth when the Haltiwanger
(1997) decomposition methodology is adopted. Consistent with the -1.9% TFP growth
obtained with the application of the Haltiwanger (1997) decomposition, the results suggest a
productivity decrease due to the exit of more productive firms, although in this case, the
effect is stronger, with a -3.45% contribution to the overall figure. Moreover, the contribution
resulting from existing firms becoming more productive over time is just 3.15%, slightly
larger than the 2.13% found with the Haltiwanger decomposition. As with the results from
the application of the Haltiwanger approach, the TFP index for the entire sample increases
from 1.00 in 1998 to 2.39 to 2007.

166
4.2.2. Results for Industry Sub-sectors, Provinces and Ownership/Political Affiliation
Table 13: Firm-level TFP Growth (average per annum) in Industry Sub-sectors, 1998-2007, China
TFP Growth (% p.a.) Decomposition of Weighted TFP Growth Output Share (%)
Within Between
Actual Weighted Firm Firm Enterers Exitors 1998 2007
Sector 1 2 3 4 5 6 7 8
Water Production 0.38 71.90 23.38 35.25 -7.98 21.25 0.53 0.24
Petroleum Processing 4.36 44.68 0.82 42.46 -5.36 6.76 9.77 3.39
Machinery & Equipment 0.97 14.12 14.54 -2.52 2.59 -0.49 6.84 11.52
Nonmetal Products 0.91 17.21 20.03 -5.34 -7.09 9.61 5.30 5.18
Metal Products 1.67 11.78 -2.71 9.92 12.73 -8.15 14.16 18.29
Transport Equipment 0.84 12.48 5.33 3.90 5.39 -2.13 6.75 9.02
Other Mining 0.22 14.37 15.59 -1.39 -3.47 3.64 1.50 1.78
Gas Production 0.04 12.52 8.22 -0.67 9.09 -4.12 0.31 0.31
Electric power and heat power 0.79 9.81 4.64 7.53 -12.06 9.70 8.09 6.75
Medical 0.29 12.24 6.20 5.28 -8.37 9.14 2.33 1.83
Measuring instruments 0.13 2.95 1.83 1.76 4.33 -4.97 4.41 7.30
Food Production 0.12 6.94 5.83 -0.53 9.75 -8.11 1.75 1.83
Coal Mining 0.19 7.32 4.10 2.21 1.10 -0.09 2.62 2.31
Tobacco 0.14 5.74 0.78 3.66 -1.25 2.54 2.45 1.16
Furniture 0.00 -0.24 4.94 -0.64 -1.99 -2.55 0.47 0.74
Timber 0.00 -0.55 7.18 -2.01 -5.70 -0.01 0.80 1.16
Apparel and Footwear 0.10 3.35 8.51 -2.04 4.52 -7.64 3.10 2.81
Rubber 0.03 2.51 4.60 1.26 4.46 -7.81 1.30 1.12
Papermaking 0.00 0.20 -0.23 4.17 11.42 -15.17 2.10 1.96
Chemical -0.39 -4.07 -0.56 -1.62 8.72 -10.62 9.61 8.40
Cultural 0.00 -0.36 5.97 -4.48 6.44 -8.29 0.88 0.66
Plastic -0.12 -4.84 -12.00 8.68 16.05 -17.57 2.44 2.38
Printing 0.00 -0.29 4.13 -2.25 7.19 -9.36 0.88 0.63
Textile -0.48 -6.52 -0.98 0.23 10.45 -16.22 7.30 6.08
Leather -0.13 -6.64 -1.07 -2.49 15.67 -18.75 1.89 1.61
Other manufacturing -0.38 -15.68 -9.29 0.72 6.08 -13.19 2.42 1.56
All Sectors 9.68 9.68 3.15 6.47 3.51 -3.45 100.00 100.00
The second and third terms of equation (60) have been combined into the “between” component of TFP growth.
The results from the industry sub-decomposition represented in Table 13 suggest that, in
terms of actual annual average TFP growth, as represented by the figures in column (1), the
highest growth is seen for the petroleum processing, metal products, and machinery &
equipment industries, while the lowest growth is seen for the other manufacturing, chemical
and textile industries. These results are similar to those obtained from the Haltiwanger (1997)
decomposition. When the relative size of each industry during the base year is taken into
account, resulting in the figures in column (2), the water production, petroleum processing
and non-metal products industries record the highest annual weighted average TFP growth,
167
while the textile, leather and other manufacturing industries record the lowest performance.
These results are similar to those obtained from the Haltiwanger (1997) decomposition.
Looking at the figures in columns (3), (4), (5), (6), which are decomposed for each industry,
the industries that have experienced rapid TFP growth are characterized by a strong impact of
the within-firm effect, including the water production, non-metal products and other mining
industries. These also show a strong impact of the between-firm effect, such as in the water
production and petroleum processing industries. On the other hand, the industries recording
the lowest growth see a strong impact of the exit of more productive firms and the entrance of
new ones. This is the case for the other manufacturing, leather and textile industries.

168
Table 14: Firm-level TFP Growth (average per annum) in Provinces, 1998-2007, China
TFP Growth (% p.a.) Decomposition of Weighted TFP Growth Output Share (%)
Within Between
Actual Weighted Firm Firm Enterers Exitors 1998 2007
Province 1 2 3 4 5 6 7 8
Jiangxi 0.27 22.16 6.88 4.31 10.71 0.26 1.22 1.99
Inner Mongolia 0.16 18.95 7.35 3.37 8.39 -0.16 0.84 1.54
Xinjiang 0.47 35.85 2.04 36.10 -2.97 0.67 1.33 0.59
Heilongjiang 1.20 36.11 1.45 34.98 -0.55 0.23 3.33 0.91
Shandong 1.47 16.66 4.22 7.76 5.81 -1.13 8.83 12.59
Qinghai 0.03 13.28 1.60 3.17 -4.45 12.96 0.25 0.20
Gansu 0.16 15.80 4.03 8.35 -0.71 4.13 0.99 0.78
Hunan 0.22 12.64 7.62 1.05 6.17 -2.20 1.75 1.88
Chongqing 0.14 11.10 4.09 1.67 3.38 1.96 1.23 1.16
Liaoning 0.90 16.95 3.00 15.22 0.39 -1.66 5.34 4.40
Sichuan 0.33 13.20 8.27 4.27 2.96 -2.31 2.49 2.37
Anhui 0.36 16.42 3.12 14.92 2.07 -3.69 2.22 2.08
Beijing 0.20 7.69 1.58 6.47 2.16 -2.52 2.59 3.14
Henan 0.48 10.12 5.84 4.65 3.31 -3.68 4.76 4.99
Hebei 0.51 10.31 2.90 8.26 3.71 -4.56 4.92 4.70
Zhejiang 0.52 7.86 1.82 4.43 9.41 -7.81 6.60 9.09
Shaanxi 0.10 9.14 4.57 7.33 -2.61 -0.15 1.11 1.09
Yunnan 0.19 10.41 3.85 2.19 1.81 2.56 1.86 1.16
Jilin 0.19 10.02 3.09 4.27 0.87 1.79 1.90 1.31
Guangxi 0.13 9.94 7.04 2.65 2.49 -2.23 1.26 1.09
Shanxi 0.12 6.88 3.13 3.43 -0.59 0.91 1.72 1.93
Fujian 0.16 6.19 1.33 3.23 6.15 -4.53 2.64 3.17
Ningxia -0.003 -0.84 2.04 -5.28 1.15 1.24 0.36 0.31
Hainan 0.01 4.92 4.23 -1.95 2.84 -0.19 0.24 0.22
Jiangsu 0.81 6.76 3.50 3.99 6.36 -7.09 12.05 13.15
Tianjin 0.27 9.14 2.34 10.02 3.14 -6.37 3.00 2.50
Guizhou 0.06 9.03 9.25 -0.06 -0.76 0.61 0.71 0.56
Hubei 0.19 5.17 2.89 5.65 2.03 -5.41 3.60 2.43
Shanghai 0.08 1.03 1.80 1.12 3.25 -5.14 8.19 6.72
Guangdong -0.07 -0.55 0.98 1.29 1.22 -4.03 12.68 11.96
9.68 9.68 3.15 6.47 3.51 -3.45 100.00 100.00
The second and third terms of equation (60) have been combined into the “between” component of TFP growth.
Table 14 reports the Melitz and Polanec (2012) sub-decomposition of annual average TFP
growth for Chinese provinces. In terms of actual annual average TFP growth, as represented
in column (1), the highest is recorded by Shandong, Heilongjiang and Liaoning, while
Hainan, Ningxia and Guangdong provinces record the lowest. These results partly contrast
those obtained from the Haltiwanger (1997) decomposition, in which the best performing
provinces were Shandong, Jiangsu and Liaoning, while Hainan, Ningxia and Qinghai were

169
the worst performing. In terms of annual weighted average TFP growth, Heilongjiang,
Xinjiang and Jiangxi record the best performance, while Shanghai, Guangdong and Ningxia
record the worst. These results differ from those from the Haltiwanger decomposition, in
which the best performing provinces were Jiangxi, Inner Mongolia and Xinjiang, while
Hubei, Shanghai and Guangdong had the worst performance.
The figures in columns (3), (4), (5) and (6), which represent the decomposition of annual
weighted average TFP growth, indicate that the fastest growing provinces are characterized
by a strong positive contribution from the between-firm effect, as is the case for the
Heilongjiang, Xinjiang and Liaoning provinces. Moreover, the slowest growing provinces are
characterised by a strong negative contribution from the exit of more productive firms, such
as in the Guangdong and Shanghai provinces.
Table 15: Firm-level TFP Growth (average per annum) in Groups 1998-2007, China
TFP Growth (% p.a.) Decomposition of Weighted TFP Growth Output Share (%)
Wirhin Between
Actual Weighted Firm Firm Enterers Exitors 1998 2007
Group 1 2 3 4 5 6 7 8
State<25%/No Politics -2.92 -25.15 -52.63 1.61 31.50 -5.64 11.62 54.33
State<25%/High Politics 0.99 9.30 -6.04 18.43 -4.74 1.64 10.67 11.78
State>=50%/High Politics 4.45 17.35 4.59 11.85 -1.29 2.20 25.67 10.70
State>=50%/No Politics 0.22 27.33 24.85 0.30 3.84 -1.66 0.82 0.63
25<State<50%/No Politics -0.03 -6.56 2.34 -9.59 2.94 -2.24 0.48 0.40
State>=50%/Medium Politics 3.26 20.64 26.36 -3.18 -0.10 -2.44 15.80 3.66
25<State<50%/Medium Politics 0.27 11.10 15.87 -0.62 0.09 -4.23 2.45 0.72
25<State<50%/High Politics 0.22 17.06 1.30 24.00 -3.87 -4.36 1.29 0.74
State<25%/Medium Politics 3.22 10.30 12.64 4.90 2.25 -9.49 31.21 17.04
All Groups 9.68 9.68 3.15 6.47 3.51 -3.45 100.00 100.00
The second and third terms of equation (60) have been combined into the “between” component of TFP growth.
Table 15 reports the Melitz and Polanec (2012) decomposition of annual average TFP growth
for groups of firms according to their extent of political affiliation and State ownership of
paid-in capital. Column (1) indicates that non-politically affiliated firms in which the State
has a paid-in capital share larger than 50% record the highest actual TFP growth. On the
other hand, non-politically affiliated firms with a State paid-in capital share ownership
smaller than 25% record the lowest performance. These results contrast with those obtained
from the Haltiwanger (1997) decomposition, in which non-politically affiliated firms with a
State paid-in capital ownership smaller than 25% recorded the highest growth, while medium

170
politically affiliated firms with a State paid-in capital share ownership smaller than 25%
recorded the lowest growth.
The figures in columns (3), (4), (5) and (6) indicate an important role for within-firm TFP
improvements for the best performing group of firms, such as those whose State paid-in
capital ownership is larger than 50% and which are characterized by either a lack of political
affiliation or a medium affiliation (with either the central or provincial governments).
In summary, the results of the Melitz and Polanec (2012) decomposition approach show an
annual average growth in TFP of 9.68% during 1998-2007 for the Chinese firms in the
sample. The figures indicate this is mainly due to the between-firm effect, while the
contribution from the other components is small. The TFP index for the entire sample
increases from 1.00 in 1998 to 2.39 to 2007. Across industries, the water production,
petroleum processing and non-metal industries record the highest annual weighted average
TFP growth, followed by the petroleum processing and non-metal products industries, while
the other manufacturing, leather and textile industries record the lowest growth. Across
provinces, the Heilongjiang, Xinjiang and Jiangxi provinces record the highest annual
weighted average TFP growth, while Ningxia, Guangdong and Shanghai record the lowest
growth. When firms are grouped according to the extent of their political affiliation and the
share of paid-in capital owned by the State, the firms whose State capital share ownership is
larger than 50% and that lack political affiliation record the highest TFP growth, while firms
having a state ownership smaller than 25% and no political affiliation record the lowest TFP
growth.

171
5. Conclusion and Policy Implications
Total factor productivity is important because it generates benefits both within firms, largely
by increasing efficiency and technological change, and beyond, by being the main driver of
national long-run economic growth and higher living standards. Analysing TFP and its
determinants enables an understanding of which factors policymakers can target in order to
achieve higher TFP. While macro-level analyses are important for multi-country studies, they
ignore the fact that firms are heterogeneous in many respects, among them TFP. A micro-
level analysis, on the other hand, enables us to infer what determines TFP levels and growth
rates across firms, providing guidance for policymakers on how to target such determinants to
improve TFP. Because they tend to be more targeted, micro-level analyses are more likely to
be successful than macro-level ones, which tend to adopt a “one size fits all” approach.
Micro-level analyses could therefore contribute to the creation of more competitive firms,
increased living standards for citizens and sustainable long-run economic growth.
The Chinese economy has recorded a very strong economic performance over the last three
decades, significantly outpacing the global growth rate. Moreover, it is the second largest
contributor to global output, after the United States. Surprisingly, the shift from a socially
planned to a market-oriented economic system has been achieved through a slow and gradual
approach to reform. This shift has enabled China to become an upper middle-income country
according to the World Bank (2013) classification. The next step in China’s economic
development would be the move to high-income country status. Such a shift could be
achieved by pursuing policies aimed at increasing total factor productivity.
In light of this, the study conducted in this thesis has aimed to answer the following research
questions:
- What factors determine TFP levels and TFP growth in Chinese industrial firms during
the period of 1998-2007?
- How does TFP growth differ across firms differentiated by industry, province and
ownership/political affiliation?
Four other studies have analysed multiple determinants of TFP in China at the firm level
(Yao et al., 2007; Li et al., 2010; Brandt et al., 2012; Shen and Song, 2013). However, the
current study distinguishes itself in four main respects. Firstly, the set of TFP determinants
analysed is more comprehensive. These include political affiliation, ownership, exporting,
competition, Marshallian (or MAR) spillovers, Jacobian (or Jacob) spillovers, city spillovers,
liquidity, age, R&D, time trend, and marketing capabilities. It is important to include all of
these determinants of TFP, since omitting any would produce biased estimates of the

172
production function, leading to biased estimates of TFP. The choice of determinants is also
motivated by the empirical results in the literature and the information available in the
Chinese National Bureau of Statistics (NBS) database. Secondly, the set of industries
analysed is wider than in most previous studies, with 26 industries belonging to the mining,
manufacturing and public utilities sectors. This allows for differences in technology among
firms, thus avoiding the assumption that all firms operate using a standard technology. The
sample adopted in this study includes both State-owned and non-State-owned firms having
annual sales of at least RMB 5mn. The firms are located in 31 provinces, or province-
equivalent municipal cities. This unbalanced sample comprises 2,183,709 firm-year
observations, which correspond to a large number of firms, ranging from 148,474 in 1998 to
331,453 in 2007. Thirdly, the analysis of the determinants of TFP levels adopts the SYS-
GMM methodology, which contrasts with the semiparametric methodologies of Olley and
Pakes (1996) and Levinsohn and Petrin (2003) used in previous studies. The major advantage
of this methodology, compared to the semiparametric ones, is the allowance for firms’ fixed
effects, since previous studies have indicated that firms have unmeasured productivity
advantages that remain constant over time and that need to be captured. Moreover SYS-
GMM has the advantage of tackling both endogeneity of the right-hand-side variables
(including the lagged dependent variable) and selection bias by using lagged values of the
endogenous variables as instruments in the first differences equation, and first-differences of
the same variables as instruments in the levels equation (Blundell and Bond, 1998). SYS-
GMM is particularly preferable to the semiparametric methodologies of Olley and Pakes
(1996) and Levinsohn and Petrin (2003), as these do not allow for fixed effects and are based
on strong and unintuitive assumptions, which generate collinearity problems in the first stage
of estimation (Ackerberg et al., 2006). Fourth, the analysis of the determinants of TFP growth
is conducted using the Haltiwanger (1997) decomposition approach, which separates TFP
growth into the contributions provided by the following: a within-firm component
representing the impact of the resource reallocation within existing firms, according to their
initial shares of output in their related industries; a between-firm component indicating a
change in the output share of firms, weighted by the deviation of the firm’s initial
productivity from the initial industry index; a covariance component, measuring whether a
firm’s increasing productivity corresponds to an increasing market share; an entering
component indicating the contribution of entrant firms to their related industry’s TFP growth,
measured with respect to the initial industry index; an exiting component indicating the
contribution of exiting firms to their related industry’s TFP, measured with respect to the
173
initial industry index. In order to gain an additional understanding of how the determinants of
TFP growth differ across firms having different characteristics, the decomposition is also
performed at the industry, province and political affiliation/ownership levels. Since Melitz
and Polanec (2012) find the approach developed in Haltiwanger (1997) to be characterized by
biases, their methodology is also adopted in order to understand which set of results is the
most appropriate. The combination of these four features distinguishes this study from
existing studies on firm-level TFP estimation in China.
The results of the SYS-GMM estimation of the determinants of TFP levels indicate the
existence of increasing returns to scale in most industries, suggesting that firms produce a
higher proportion of output from a given proportion of factor inputs. Moreover, the findings
suggest that firms are subject to exogenous technological change.
Various factors are found to be important in determining higher TFP levels across Chinese
industrial firms. Firstly, the lack of State influence on firms in terms of both paid-in capital
share ownership and political affiliation results in higher TFP. This may be due to the greater
ability of non-politically influenced firms to enjoy the freedom to undertake decisions in their
best interest, rather than politically motivated ones. While this is the case in most sectors,
strategic or monopolistic sectors such as the medical, electronic power and water production
industries obtain benefits to TFP from State influence. Despite this special case, the evidence
indicates that policy measures aimed at decreasing the role of the State in the economy while
increasing the role of private actors is conducive to higher total factor productivity.
Secondly, there is evidence of a positive effect on firms’ TFP from being based in areas
characterized by either industrial agglomeration or industrial diversity, although large city
areas tend to generate high costs for firms that hamper their productivity. Policy measures
favouring industrial agglomeration, such as the creation of geographic industrial clusters,
would result in higher TFP, as firms would benefit from knowledge spillovers manifested
through the channels of imitation/demonstration, synergies, commercial relationships, asset
sharing, and labour pooling. Also, measures favouring industrial diversity would be
beneficial to firms, since such a diverse environment would facilitate the transmission of
innovation across industries.
Thirdly, the findings indicate that younger firms tend to be more productive than their older
counterparts. This might be explained by the ability of younger firms to adapt their business
processes and strategies to the dynamic markets in which they operate and keep their
technology up to date with industry best practices. Thus, policy measures aimed at facilitating
the entrance of younger firms into the market, for example, by lowering the regulatory

174
barriers to entry and offsetting initial business costs through tax cuts or subsidies, would be
beneficial for firms’ TFP.
Fourth, increased levels of competition within industries are found to result in higher firm
TFP. This is because in a competitive environment, firms are likely to be motivated to
undertake TFP-enhancing decisions such as increasing their efficiency and undertaking
technological change. Such a positive effect suggests that policy measures aimed at
increasing competition within Chinese industries, such as the disbanding of cartels and the
liberalization of both monopolistic and strategic sectors, would generate higher TFP levels.
Chinese industrial firms are found to benefit in terms of higher TFP levels from the
possession of marketing capabilities. Such capabilities enable firms to transform their
resources into valuable output, to better distinguish their products from competitors, and to
build successful brands so that they can charge a premium to customers. A higher TFP level
can therefore be achieved by pursuing policy measures that support firms’ marketing
capabilities, such as the provision of business consulting so that firms can better target their
consumers.
The positive relationship between firms’ liquidity and TFP indicates the existence of financial
constraints, suggesting that Chinese firms have difficulties in raising external finance and
must therefore rely on their internal liquidity to finance productive investments. A shortage of
internal liquidity pushes firms to either postpone or cancel productive investments. Since the
existence of financial constraints distorts the allocation of capital and thus hampers firms’
TFP, policy steps aimed at addressing this issue, such as the development of the bond market,
would be beneficial.
There are also factors that, contrary to initial expectations, do not determine higher TFP
levels: R&D expenditure and exporting. Although R&D expenditure was expected to have
both direct and indirect positive effects on TFP, this is not the case in most industries. It
might be that such expenditure is focusing on the wrong areas. For example, R&D might be
focused on improving low-priority products and processes. The findings also indicate that
exporting does not seem to lead to higher TFP. Chinese firms were expected to learn by
exporting how to become more productive, since they would face a larger number of
competitors with more innovative technologies, working practices and products. However,
this is not the case in most industries. This finding can potentially be explained by the
“processing trade” argument of Jarreau and Poncet (2012), which suggests that exporting is
beneficial to firms’ performance only when it is in form of ordinary exports rather than

175
“processing trade.” Empirical evidence from Wang and Yu (2011) and Dai et al. (2011)
supports this idea.
Following an analysis of the determinants of TFP levels, it has been assessed which
determinants have the largest impact on TFP levels. The findings indicate that exogenous
technological improvements have the largest positive effect on firms’ TFP levels.
The results also indicate a large positive effect of an increasing proportion of firms’ paid-in
capital owned by either individuals or corporates, and large negative effects from an
increasing proportion of firms’ paid-in capital owned by the State, and firms’ high level of
political affiliation with either the central or local government. From this result, it can be
inferred that policy measures aiming at reducing the State influence on firms, through either
ownership or political affiliation, are likely to have the largest positive effect on Chinese
firms’ TFP.
The large negative effect for the variable representing city spillovers, and the positive effects
for the variables representing Marshallian and Jacobian spillovers, indicate that policy
measures favoring industrial agglomeration and diversity in areas other than cities are also
likely to have a large positive effect on firms’ TFP.
The results of Kolmogorov-Smirnov tests and the related empirical cumulative TFP
distributions are in line with the SYS-GMM findings, since they indicate that TFP differs
across firms having diverse characteristics such as political affiliation, paid-in capital share
ownership, R&D and exporting. The KS test results also stress the importance of estimating
TFP separately for each industry and taking into account the geographical differences
between firms. Moreover, the results indicate the existence of TFP growth between 1998 and
2007.
The application of the methodologies of Haltiwanger (1997) and Melitz and Polanec (2012)
indicate that Chinese industrial firms have recorded an aggregate annual average TFP growth
of 9.68% between 1998-2007. The latter methodology, whose results are more appropriate
since the method addresses the measurement biases characterizing the former, indicates that
such growth largely results from a between-firm effect, which represents the reallocation of
resources through the contraction and expansion of output shares between firms characterized
by different productivity levels. The results indicate a small contribution to aggregate TFP
growth from within-firm TFP improvements and the entrance of new firms, and a negative
contribution from the exit of more productive firms. High growth industries are characterized
by a strong impact from the within-firm effect (e.g. in the water production, non-metal
products and other mining industries) and the between-firm effect (e.g. in the water
176
production and petroleum processing industries). TFP growth across provinces is
characterized by a strong contribution from the between-firm effect (e.g. in Heilongjiang,
Xinjiang and Liaoning). When firms are grouped according to their political affiliation and
State ownership share of paid-in capital, non-politically affiliated firms in which the State has
a paid-in capital share larger than 50% record the highest actual TFP growth, while non-
politically affiliated firms with a State paid-in capital share ownership smaller than 25% have
record the lowest performance. Within-firm TFP improvements drive the strong performance
of the former. The results of the aggregate TFP decomposition indicate that policy measures
favouring the entry of more productive firms, within-firm TFP improvements, and especially
the reallocation of resources across existing firms, are conducive to higher TFP growth.
Since this study has only considered medium and large-sized firms, future research should
also consider small firms, thus offering a more comprehensive understanding of the
determinants of TFP in the Chinese industrial sector. Such research would indicate whether
the determinants of TFP vary across firms of different sizes. It would also indicate whether
small or medium-to-large firms are the main drivers of aggregate TFP growth.
As the industrial sector has been the main focus of this study, an extension to the research
should include the service sector. Such research would indicate whether one sector or the
other largely drives national aggregate TFP and whether TFP is differentially determined in
each. Since China is undergoing a shift from the dominance of the industrial sector towards
the service sector, the inclusion of the latter would help determine whether such a shift is
beneficial to national aggregate TFP growth.
In light of the major role of total factor productivity in raising living standards and in driving
national long-run within- and cross-country economic growth (Easterly and Levine, 2001;
Klenow and Rodriguez-Clare, 1997; Benhabib and Spiegel, 1994), policy measures targeting
the determinants of TFP levels and TFP growth would enable Chinese firms to become more
competitive and allow the achievement of sustainable long-run economic growth and higher
living standards in China, enabling the country to raise its status to a high-income economy.
177
References
Ackerberg, D.A. Benkard, C.L. Berry, S. and Pakes, A. (2007) Econometric Tools for
Analyzing Market Outcomes. In: Heckman, J.J. and Leamer E.E. (1st edition) Handbook of
Econometrics. Amsterdam: North-Holland, pp. 4171-4276
Aitken, B.J. Harrison, A.E. (1999) Do Domestic Firms Benefit from Foreign Direct
Investment? Evidence from Venezuela. The American Economic Review, 89(3): 605-618
Allen, F. Qian, J. and Qian, M. (2005) Law, Finance and Economic Growth in China. Journal
of Financial Economics, 77(1): 57-116
Almeida, P. Dokko, G. Rosenkopf L. (2003) Startup Size and the Mechanisms of External
Learning: Increasing Opportunity and Decreasing Ability? Research Policy, 32(2): 301-315
Arellano, M. and Bond, S. (1991) Some Tests of Specification for Panel Data: Monte Carlo
Evidence and an Application to Employment Equations. Review of Economics Studies, 58(2):
277-298
Arnold, J.M. and Hussinger, K. (2005) Export Behaviour and Firm Productivity in German
Manufacturing: A Firm-Level Analysis. Review of World Economics, 141(2): 219-243
Arrow, K.J. (1962) The Economic Implications of Learning by Doing. The Review of
Economic Studies, 29(3): 155-173
Bacolod, M. Blum, B.S. and Strange, W.G. (2009) Skills in the City. Journal of Urban
Economics, 65(2009): 136-153
Baily, M.N. Hulten, C. Campbell, D. Bresnahan, T. and Caves, R.E. (1992) Productivity
Dynamics in Manufacturing Plants. Brookings Papers on Economic Activity.
Microeconomics, 1992: 187-267
Baldwin, J.R. and Gorecki, P.K. (1991) Firm Entry and Exit in the Canadian Manufacturing
Sector, 1970-1982. The Canadian Journal of Economics, 24(2): 300-323
Baldwin, J.R. Mark Brown, W. and Rigby, D.L. (2010) Agglomeration Economies:
Microdata Panel Estimates from Canadian Manufacturing. Journal of Regional Science,
50(5), pp. 915-934
178
Barney, J. (1991) Firm Resources and Sustained Competitive Advantage. Journal of
Management, 17(1): 99-120
Bartelsman, E.J. and Dhrymes, P.J. (1998) Productivity Dynamics: U.S. Manufacturing
Plants, 1972-1986. Journal of Productivity Analysis, 9(1998): 5-34
Basant, R. and Fikkert, B. (1996) The Effects of R&D, Foreign Technology Purchase, and
Domestic and International Spillovers on Productivity in Indian Firms. The Review of
Economics and Statistics, 78(2): 187-199
Batisse, C. (2002) Dynamic Externalities and Local Growth: A Panel Data Analysis Applied
to Chinese Provinces. China Economic Review, 13(2-3): 231-251
Beckman, T.N. and Buzzell, R.D. (1958) Productivity: Facts and Fiction. Business Horizon, 1
(1): 24-38
Bell, C.R. (1988) Economies of, versus Returns to, Scale: A Clarification. The Journal of
Economic Education, 19(4): 331-335
Benhabib, J. and Spiegel, M.M. (1994) The Role of Human Capital in Economic
Development: Evidence from Aggregate Cross-country Data. Journal of Monetary
Economics, 34(1994): 143-173
Ben Hamida, L. and Gugler, P. (2009) Are There Demonstration-related Spillovers from
FDI? Evidence from Switzerland. International Business Review, 18(2009): 494-508
Berger, A.N. Hasan, I. and Zhou, M. (2009) Bank Ownership and Efficiency in China: What
Will Happen in the World’s Largest Nation? Journal of Banking & Finance, 33(2009): 113-
130
Bernard, A.B. and Jensen J.B. (2002) The Deaths of Manufacturing Plants. NBER Working
Papers Series, No. 9026. Available from: http://www.nber.org/papers/w9026.pdf
[29/06/2015]
Bernard, A.B. and Jensen J.B. (2004) Exporting and Productivity in the USA. Oxford Review
of Economic Policy, Oxford University Press, 20(3): 343-357
Bernard, A.B. and Jensen J.B. (2007) Firm Structure, Multinationals, and Manufacturing
Plant Deaths. The Review of Economics and Statistics, 89(2): 193-204

179
Bernard, A.B., Redding, S.J. and Schott, P.K. (2009) Products and Productivity.
Scandinavian Journal of Economics, 111(4): 681-709
Bilgin, M.H. Lau, C.K.M. and Karabulut, G. (2012) Technology Transfer and Enterprise
Performance: A Firm-Level Analysis in China. Journal of Business Economics and
Management, 13(3): 489-498
Blalock, G. and Gertler, P.J. (2004) Learning from Exporting Revisited in a Less Developed
Setting. Journal of Development Economics, 75(2004): 397-416
Blalock, G. and Veloso, F.M. (2007) Imports, Productivity Growth, and Supply Chain
Learning. World Development, 35(7): 1134-1151
Bloom, D.E. and Canning, D. (2004) Global Demographic Change: Dimensions and
Economic Significance. Proceedings, Federal Reserve Bank of Kansas City, 8 (2004): 9-56
Bloom, D.E. and Finlay, J.E. (2009) Demographic Change and Economic Growth in Asia.
Asian Economic Policy Review, 4(2009): 45-64
Bloom, N. and Van Reenen, J. (2007) Measuring and Explaining Management Practices
Across Firms and Countries, Quarterly Journal of Economics, 122(4): 1351-1408
Bloom, N. and Van Reenen, J. (2010) Why do Management Practices Differ Across Firms
and Countries? Journal of Economic Perspectives, 24(1): 203-224
Bloom, N. Draca, M. and Van Reenen, J. (2011) Trade Induced Technical Change? The
Impact of Chinese Imports on Innovation, IT and Productivity. NBER Working Papers
Series, No. 16717. Available from: http://www.nber.org/papers/w16717 [31/08/2013]
Blundell, R. and Bond, S. (1998) Initial Conditions and Moment Restrictions in Dynamic
Panel Data Models. Journal of Econometrics, 87(1998): 115-143
Blundell, R. and Bond, S. (2000) GMM Estimation with Persistent Panel Data: an
Application to Production Functions. Econometric Reviews, 19(3): 321-340
Borowiecki, K.J. (2013) Geographic Clustering and Productivity: An Instrumental Variable
Approach for Classical Composers. Journal of Urban Economics, 73(1): 94-110
Bowles, P. (2012) Rebalancing China’s Growth: Some Unsettled Questions. Canadian
Journal of Development Studies, 33(1): 1-13

180
Bramall, C. (2009) Chinese Economic Development. New York: Routledge
Brandt, L. and Li, H. (2003) Bank Discrimination in Transition Economies: ideology,
information, or incentives? Journal of Comparative Economics, 31(2003): 387-413
Brandt, L. and Rawski, T. (2008) China’s Great Economic Transformation. 1st Edition.
Cambridge: Cambridge University Press
Brandt, L. Van Biesebroeck, J. and Zhang, Y. (2012) Creative Accounting or Creative
Distruction? Firm-Level Productivity Growth in Chinese Manufacturing. Journal of
Development Economics, 97(2): 339-351
Branstetter, L.G. (2001) Are Knowledge Spillovers International or Intranational in Scope?
Microeconometric Evidence from the US and Japan. Journal of International Economics,
53(2001): 53-79
Breth, R.M. (1977) Mao’s China: A Study of Socialist Economic Development. Melbourne:
Longman Cheshire Pty
Bridgham, P. (1967) Mao’s “Cultural Revolution”: Origin and Development. The China
Quarterly, 29(1967): 1-35
Buck, T. Filatotchev, I. Nolan, P. and Wright, M. (2000) Different Paths to Economic Reform
in Russia and China: Causes and Consequences. Journal of World Business, 35(4): 370-400
Carlino G.A. (1987) Productivity in Cities: Does City Size Matter? Business Review, Federal
Reserve Bank of Philadelphia, 11 (1987): 3-12
Castellani, D. (2002) Export Behavior and Productivity Growth: Evidence from Italian
Manufacturing Firms. Review of World Economics/Weltwirtschaftliches Archiv, 38(4): 605-
628
Cavallo, E.A. and Frankel, J.A. (2008) Does Openness to Trade Make Countries More
Vulnerable to Sudden Stops, or Less? Using Gravity to Establish Causality. Journal of
International Money and Finance, 27(8): 1430-1452
Caves, R. (1974) Multinational Firms, Competition, and Productivity in Host-Country
Markets. Economica, 41(162): 176-193
181
Caves, R. (1996) Multinational Enterprise and Economic Analysis. 2nd
Edition. Cambridge:
Cambridge University Press
Caves, D.W. Christensen, L.R. and Swanson J.A. (1981) Productivity Growth, Scale
Economies, and Capacity Utilization in U.S. Railroads, 1955-4. The American Economic
Review, 71(5): 994-1002
Chai, J.C.H. (1998) China Transition to a Market Economy. Oxford: Clarendon Press
Chan, K.S. Dang, V.Q.T. and Yan, I.K.M. (2012) Financial Reform and Financing
Constraints: Some Evidence from Listed Chinese Firms. China Economic Review, 23(2):
482-497
Che, J. and Qian, Y. (1998) Insecure Property Rights and Government Ownership of Firms.
The Quarterly Journal of Economics, 113(2): 467-496
Chen, C.H. (1992) Modernization in Mainland China: Self-Reliance and Dependence.
American Journal of Economics and Sociology, 51(1): 57-98
Chen, G. Firth, M and Xu, L. (2009) Does the Type of Ownership Control Matter? Evidence
from China’s Listed Companies. Journal of Banking and Finance, 33(1): 171-181
Chen, M. and Guariglia, A. (2013) Internal Financial Constraints and Firm Productivity in
China: Do Liquidity and Export Behavior Make a Difference? Journal of Comparative
Economics, 41(4): 1123-1140
Chen, Z. (2003) Capital Markets and Legal Development: The China Case. China Economic
Review, 14: 451-472
Chen, K. Huang Y.J., and Yang, C.H. (2009) Analysis of Regional Productivity Growth in
China: A Generalized Metafrontier MPI Approach. China Economic Review, 20(4): 777-792
Chen, K. Jefferson, G.H. and Singh I. (1992) Lessons from China’s Economic Reform.
Journal of Comparative Economics, 16(2): 201-225
National Bureau of Statistics (2012): China Statistical Yearbook. Available from:
http://www.stats.gov.cn/tjsj/ndsj/2012/indexeh.htm [22/12/2013]
182
Chong, T.T. Lu, L. Ongena, S. (2013) Does Banking Competition Alleviate or Worsen Credit
Constraints Faced by Small- and Medium-sized Enterprises? Evidence from China. Journal
of Banking & Finance, 37(9): 3412-3424
Chow, G.C. (1987) The Chinese Economy. 2nd
Edition. Singapore: World Scientific
Publishing
Chow, G.C. (1993) How and Why China Succeeded in Her Economic Reform. China
Economic Review, 4(2): 117-128
Chow, G.C. (2007) China’s Economic Transformation. 2nd
Edition. Oxford: Blackwell
Publishing
Cingano, F. and Pinotti, P. (2013) Politicians at Work: The Private Returns and Social Costs
of Political Connections. Journal of the European Economic Association, 11(2): 433-465
Cingano, F. and Schivardi, F. (2010) Identifying the Sources of Local Productivity Growth.
Journal of the European Economic Association, 2(4): 720-742
Clark, P.B. and Wilson, J.Q. (1961) Incentive Systems: a Theory of Organizations.
Administrative Science Quarterly, 6(2): 129-166
Clerides, S.K. Lach, S. and Tybout J.R. (1998) Is Learning by Exporting Important? Micro-
Dynamic Evidence from Colombia, Mexico and Morocco. The Quarterly Journal of
Economics, 113(3): 903-947
Coad, A. Segarra, A. and Teruel, M. (2013) Like Milk or Wine: Does Firm Performance
Improve with Age? Structural Change and Economic Dynamics, 24(2013): 173-189
Coase, R.H. (1937) The Nature of the Firm. Economica, 4(16): 386-405
Coe, D.T. Helpman, E. (1995) International R&D Spillovers. European Economic Review,
39(1995): 859-887
Coelli, T. Prasada Rao, D.S. and Battese G.E. (1998) An Introduction to Efficiency and
Productivity Analysis. 2nd
edition. Boston: Kluwer Academic Press
Cohen, W.M. Levinthal D.A. (1989) Innovation and Learning: The Two Faces of R&D. The
Economic Journal, 99(397): 569-596

183
Cohen, W.M. Levinthal D.A. (1990) Absorptive Capacity: A New Perspective on Learning
and Innovation. Administrative Science Quarterly, 35(1): 128-152
Crespo, N. Fontoura, M.P. (2007) Determinant Factors of FDI Spillovers – What Do We
Really Know? World Development 35(3): 410-425
Dai, M., Maitra, M., & Yu, M. (2011). Unexceptional exporter performance in China? The
role of processing trade. Peking University, Mimeograph.
Daniel III, C. (2001) The Impact on China of its Ascension into the WTO. The Social Science
Journal, 41(3): 363-374
Dekle R. (2002) Concentration and Regional Growth: Evidence from the Prefectures. The
Review of Economics and Statistics, 84(2): 310-315
De Loecker, J. (2007) Do Exports Generate Higher Productivity? Evidence from Slovenia.
Journal of International Economics, 73(2007): 69-98
Del Gatto, M. Di Liberto, A. and Petraglia, C. (2011) Measuring Productivity. Journal of
Economic Surveys, 25(5): 952-1008
Deng, K. (2012) China’s Political Economy in Modern Times. Changes and Economic
Consequences, 1800-2000. New York: Routledge
Didier, T. and Schmukler, S.L. (2013) The Financing and Growth of Firms in China and
India: Evidence From Capital Markets. Journal of International Money and Finance,
39(2013): 111-137
Dinç, I.S. (2005) Politicians and Banks: Political Influences on Government-owned Banks in
Emerging Markets. Journal of Financial Economics, 77(2): 453-479
Ding, S. Guariglia, A. and Knight, J. (2013) Investment and Financing Constraints: Does
Working Capital Management Make a Difference? Journal of Banking & Finance, 37(5):
1490-1507
Disney, R. Haskel, J. and Heden, Y. (2003) Entry, Exit and Establishment Survival in UK
Manufacturing. The Journal of Industrial Economics, 51(1): 91-112
Dollar, D. Wolff, E.N. (1993) Competitiveness, Convergence and International
Specialization, MIT Press, Cambridge, MA

184
Dong, X.Y. and Putterman, L. (1997) Productivity and Organziation in China’s Rural
Industries: A Stochastic Frontier Analysis. Journal of Comparative Economics, 24(2): 181-
201
Dong, X.Y. and Putterman, L. (2003) Soft Budget Constraints, Social Burdens, and Labor
Redundancy in China’s State Industry. Journal of Comparative Economics, 31(2003): 110-
133
Doraszelski, U. and Jaumandreu, J. (2008) R&D and Productivity: Estimating Production
Functions when Productivity is Endogenous. CEPR Discussion Paper Series, No. 6636,
Available from: http://www.cepr.org/pubs/dps/DP6636.asp [22/06/2013]
Dosi, G. Lei, J. and Yu, X. (2013) Institutional Change and Productivity Growth in China’s
Manufacturing: The Microeconomics of Creative Restructuring. LEM Working Paper Series,
No. 7, Available from: http://www.lem.sssup.it/WPLem/2013-07.html [21/12/2013]
Dougherty, S. Herd, R. and He, P. (2007) Has a Private Sector Emerged in China’s Industry?
Evidence from a Quarter of a Million Chinese Firms. China Economic Review, 18(3): 309-
334
Driffield, N. and Love, J.H. (2007) Linking FDI Motivation and Host Economy Productivity
Effects: Conceptual and Empirical Analysis. Journal of International Business Studies,
38(2007): 460-473
Driffield, N. and Du, J. (2007) Privatization, State Ownership and Productivity: Evidence
from China. International Journal of the Economics of Business, 14(2): 215-239
Du, J. and Girma, S. (2010) Red Capitalists: Political Connections and Firm Performance in
China. KYKLOS, 63(4): 530-545
Du, J. and Girma, S. (2012a) Firm Size, Source of Finance, and Growth – Evidence from
China. International Journal of the Economics of Business, 19(13): 397-419
Du, J. Lu, Y. Tao, Z. and Yu, L. (2012b) Do Domestic and Foreign Exporters Differ in
Learning by Exporting? Evidence from China. China Economic Review, 23(2): 296-315
Dunne, T. Roberts, M.J. and Samuelson, L. (1998) Patterns of Firm Entry and Exit in US
Manufacturing Industries. Rand Journal of Economics, 19(4): 495-515

185
Eckstein, A. (1966) Communist China’s Economic Growth and Foreign Trade: Implications
for U.S. Policy. New York: McGraw-Hill Book Company
Eckstein, A. (1976) China’s Economic Development. Michigan: The University of Michigan
Press
Eckstein, A. (1977) China’s Economic Revolution. Cambridge: Cambridge University Press
Elvery, J.A. (2010) City Size and Skill Intensity. Regional Science and Urban Economics,
40(2010): 367-379
Easterly, W. and Levine, R. (2001) It’s Not Factor Accumulation: Stylized Facts and Growth
Models. The World Bank Economic Review, 15(2): 177-219
European Commission 2013: Eurostat. Available at:
http://epp.eurostat.ec.europa.eu/portal/page/portal/statistics/themes [22/12/2013]
Eustace, C. (2000) The Intangible Economy: Impact and Policy Issues. Report of the
European High Level Expert Group on the Intangible Economy, European Commission.
Evans, D.S. (1987) The Relationship Between Firm Growth, Size, and Age: Estimates for
100 Manufacturing Industries. The Journal of Industrial Economics, 35(4): 567-581
Faccio, M. (2006) Politically Connected Firms. The American Economic Review, 96(1): 369-
386
Faccio, M. (2010) Differences between Politically Connected and Nonconnected Firms: A
Cross-Country Analysis. Financial Management, 39(3): 905-928
Farinas, J.C. and Ruano, S. (2005) Firm Productivity, Heterogeneity, Sunk Costs and Market
Selection. International Journal of Industrial Organization, 23(7-8): 505-534
Farrell, M.J. (1947) The Measurement of Productive Efficiency. Journal of the Royal
Statistical Society. Series A (General). 120(3): 253-290
Fazzari, S.M. Hubbard, R.G. and Petersen, B.C. (1998) Financing Constraints and Corporate
Investment. Brookings Papers on Economic Activity, 1998(1): 141-195
Fernandes, A.M. (2008) Firm Productivity in Bangladesh Manufacturing Industries. World
Development. 36(10): 1725-1744

186
Fischer, S. (1993) Socialist Economic Reform: Lessons of the First Three Years. The
American Economic Review, 83(2): 390-395
Forbes, S.J. and Lederman, M. (2010) Does Vertical Integration Affect Firm Performance?
Evidence from the Airline Industry. RAND Journal of Economics, 41(4): 765-790
Foster, L. Haltiwanger, J.C. and Krizan, C.J. (2001) Aggregate Productivity Growth. Lessons
from Microeconomic Evidence. In: Hulten, C.R. Dean, E.R. Harper, M.J. (eds.) New
Developments in Productivity Analysis. Chicago: University of Chicago Press, pp. 303-372
Foster, L. Haltiwanger, J.C. and Syverson, C. (2008) Reallocation, Firm Turnover, and
Efficiency: Selection on Productivity or Profitability? American Economic Review, 98(1):
394-425
Frantzen, D. (2002) Intersectoral and International R&D Knowledge Spillovers and Total
Factor Productivity. Scottish Journal of Political Economy, 49(3): 280-303
Fu, F. Vijverberg, C.C. and Chen, Y.S. (2008) Productivity and Efficiency of State-Owned
Enterprises in China. Journal of Productivity Analysis, 29(3): 249-259
Fu, X. and Gong, Y. (2009) International and Intranational Technological Spillovers and
Productivity Growth in China. Asian Economic Papers, 8(2): 1-23
Fu, X. and Gong, Y. (2011) Indigenous and Foreign Innovation Efforts and Drivers of
Technological Upgrading: Evidence from China. World Development, 39(7): 1213-1225
Fu, X. and Heffernan, S. (2007) Cost X-efficiency in China’s Banking Sector. China
Economic Review, 18(2007): 35-53
Fu, X. and Heffernan, S. (2009) The Effects of Reform on China’s Bank Structure and
Performance. Journal of Banking & Finance, 33(2009): 39-52
Gang, F. (1994) Incremental Changes and Dual-Track Transition: Understanding the Case of
China. Economic Policy, 9(19): 99-122
García, F. Avella, L. and Fernández L. (2012) Learning from Exporting: The Moderating
Effect of Technological Capabilities. International Business Review, 21(6): 1099-1111
Ge, W. (1999) Special Economic Zones and the Opening of the Chinese Economy: Some
Lessons for Economic Liberalization. World Development, 27(7): 1267-1285
187
Geng, X. and Weiss, J. (2007) Development in North East People’s Republic of China: An
Analysis of Enterprise Performance 1995-2002. China Economic Review, 18(2): 170-189
Ghosh, S. (2013) Do Economic Reforms Matter for Manufacturing Productivity? Evidence
from the Indian Experience. Economic Modelling, 31(2013):723-733
Girma, S. and Gong, Y. (2008) FDI, Linkages and the Efficiency of State-Owned Enterprises
in China. The Journal of Development Studies, 44(5): 728-749
Girma, S. and Wakelin, K. (2007) Local Productivity Spillovers from Foreign Direct
Investment in the U.K. Electronics Industry. Regional Science and Urban Economics, 37(3):
399-412
Goldman, E. Rocholl, J. and So, J. (2013) Politically Connected Boards of Directors and The
Allocation of Procurement Contracts. Review of Finance, 17(5): 1-32
Gordon, R.H. and Li, W. (1995) The Change in Productivity of Chinese State Enterprises,
1983-1987. Journal of Productivity Analysis, 6(1): 5-26
Greenhalgh, S. (2003) Science, Modernity, and the Making of China’s One-Child Policy.
Population and Development Review, 29(2): 163-196
Griffith, R. (2001) Product Market Competition, Efficiency, and Agency Costs: An Empirical
Analysis, The Institute for Fiscal Studies, Working Paper W01/12. Available from:
http://eprints.ucl.ac.uk/3840/1/3840.pdf [25/06/2013]
Griffith, R. Harrison, R. and van Reenen, J. (2006) How Special Is the Special Relationship?
Using the Impact of U.S. R&D Spillovers on U.K. Firms as a Test of Technology Sourcing.
The American Economic Review, 96(5): 1859-1875
Griliches, Z. and Regev, H. (1995) Firm Productivity in Israeli Industry: 1978-1988. Journal
of Econometrics, 65(1995): 175-203
Grossman, G.M. and Helpman, E. (1991) Trade, Knowledge Spillovers, and Growth.
European Economic Review, 35(2-3): 517-526
Groves, T. Hong, Y. McMillan, J. and Naughton, B. (1994) Autonomy and Incentives in
Chinese State Enterprises. The Quarterly Journal of Economics, 109(1): 183-209
188
Guariglia, A. Liu, X. and Song, L. (2011) Internal Finance and Growth: Microeconomic
Evidence on Chinese Firms. Journal of Development Economics, 96(1): 79-94
Glaeser, E.L. Kallal, H.D. Scheinkman, J.A. Shleifer A. (1992) Growth in Cities. Journal of
Political Economy, 100(6): 1126-1152
Greenaway, D. and Kneller, R. (2007) Industry Differences in the Effect of Export Market
Entry: Learning by Exporting? Review of World Economics, 143(3): 416-432
Griliches, Z (1986) Productivity, R&D, and Basic Research at the Firm Level in the 1970s.
American Economic Review, 76(1): 141-154
Griliches, Z. and Mairesse, J. (1991) R&D and Productivity Growth: Comparing Japanese
and U.S. Manufacturing Firms. In: Hulten, C.R. Productivity Growth in Japan and the United
States. Chicago: University of Chicago Press, pp. 317-348
Griliches, Z. and Mairesse, J. (1995) Production Functions: The Search for Identification.
NBER Working Papers Series, No. 5067, Available from:
http://www.nber.org/papers/w5067.pdf [15/04/2013]
Guariglia, A. Liu, X. and Song, L. (2011) Internal Finance and Growth: Microeconomic
Evidence on Chinese Firms. Journal of Development Economics, 96(1): 79-94
Gurley, J.G. (1976) China’s Economy and the Maoist Strategy. New York: Monthly Review
Press
Hale, G. and Long, C. (2011) Are there Productivity Spillovers from Foreign Direct
Investment in China? Pacific Economic Review, 16(2): 135-153
Hall, R. and Jones, C.I. (1999) Why do Some Countries Produce so Much More Output per
Worker than Others? The Quarterly Journal of Economics, 114(1): 83-116
Haltiwanger, J. (1997) Measuring and Analyzing Aggregate Fluctuations: The Importance of
Building from Microeconomic Evidence. Review of the Federal Reserve Bank of St. Louis,
79(1997): 55-77
Han, J. Liu, R. and Zhang J. (2012) Globalization and Wage Inequality: Evidence from
Urban China. Journal of International Economics, 87(2012): 288-297

189
Hannan, M.T Freeman J. (1984) Structural Inertia and Organizational Change. American
Sociological Review. 49(2): 149-164
Harris, R. (2002) Foreign Ownership and Productivity in the United Kingdom – Some Issues
When Using the ARD Establishment Level Data. Scottish Journal of Political Economy,
49(3): 318-335
Harris, R. (2005) Economics of the Workplace: Special Issue Editorial. Scottish Journal of
Political Economy, 52(3): 323-343
Harris, R. and Hassaszadeh, P. (2002) The Impact of Ownership Changes and Age Effects on
Plant Exits in UK Manufacturing, 1974-1995. Economics Letters 75(3): 309-317
Harris, R. and Li, Q.C. (2009) Exporting, R&D, and Absorptive Capacity in UK
Establishments. Oxford Economic Papers, 61(1): 74-103
Harris, R. Moffat, J. (2011) Plant-level Determinants of Total Factor Productivity in Great
Britain, 1997-2006. SERC Discussion Paper, No. 64, Available from:
http://www.spatialeconomics.ac.uk/textonly/SERC/publications/download/sercdp0064.pdf
[16/05/2013]
Harris, R. and Moffat, J. (2012a) Is Productivity Higher in British Cities? Journal of Regional
Science, 52(5): 762-786
Harris, R. and Moffat, J. (2012b) R&D, Innovation and Exporting in Britain: An Empirical
Analysis. Available at: http://www.cppr.ac.uk/media/media_232346_en.pdf [17/5/2013]
Harris, R. and Moffat, J. (2013) Intangible Assets, Absorbing Knowledge and Its Impact on
Firm Performance: Theory, Measurement and Policy Implications. Contemporary Social
Science: Journal of the Academy of Social Sciences, 8(3): 1-16
Harris, R. and Robinson, C. (2002) The Effect of Foreign Acquisitions on Total Factor
Productivity: Plant-Level Evidence from U.K. Manufacturing, 1987-1992. The Review of
Economics and Statistics, 84(3): 562-568
Harris, R. and Robinson, C. (2003) Foreign Ownership and Productivity in the United
Kingdom Estimates for U.K. Manufacturing Using the ARD. Review of Industrial
Organization, 22(3): 207-223

190
Harris, R. and Robinson, C. (2004) Productivity Impacts and Spillovers from Foreign
Ownership in the United Kingdom. National Institute Economic Review, 187(1): 58-75
Haskel, J. (2000) What Raises Productivity? The Microeconomics of UK Productivity
Growth, Queen Mary, University of London Research Paper.
He, Z. (2000) Corruption and Anti-corruption in Reform China. Communist and Post-
Communist Studies, 33(2000): 243-270
Hermalin, B.E. (1992) The Effects of Competition on Executive Behavior. The RAND
Journal of Economics, 23(3): 350-365
Higón, D.A. (2007) The impact of R&D Manufacturing Spillovers on UK Manufacturing
TFP:A Dynamic Panel Approach. Research Policy, 36(7): 964-979
Hoch, I. (1962) Estimation of Production Function Parameters Combining Time-Series and
Cross-Section Data, Econometrica, 30(1): 34-53
Holcomb, T.R. Holmes Jr., R.M. and Connelly, B.L. (2009) Making the Most of What You
Have: Managerial Ability as a Source of Value Creation. Strategic Management Journal,
30(5): 457-485
Holmstrom, B. and Milgrom, P. (2004) The Firm as an Incentive System. The American
Economic Review, 84(4): 972-991
Horn, H. Lang, H. and Lundgren, S. (1994) Competition, Long Run Contracts and Internal
Inefficiencies in Firms. European Economic Review, 38(2): 213-233
Hortacsu, A. and Syverson C. (2007) Cementing Relationships: Vertical Integration,
Foreclosure, Productivity and Prices. NBER Working Papers Series, No. 12894, Available
from: http://www.nber.org/papers/w12894 [23/06/2013]
Hou, J.W. (2011) Economic Reform of China: Cause and Effects. The Social Science
Journal, 48(3): 419-434
Hou, C.C. and Hou, J.W. (2001) Evolution of Economic Institutions and China’s Economic
Reform. The Social Science Journal, 39(3): 363-379
Howe, C. Kueh, Y.Y. and Ash, R. (2003). China’s Economic Reform: A Study with
Documents. London: Routledge Curzon

191
Howells, J.R.L. (2002) Tacit Knowledge, Innovation and Economic Geography. Urban
Studies, 39(5-6): 871-884
Howitt, P. (2000), Endogenous Growth and Cross-country Income Differences. American
Economic Review, 90(4): 829-846
Hsieh, C.T. and Klenow, P.J. (2009) Misallocation and Manufacturing TFP in China and
India. Quarterly Journal of Economics, 124(4): 1403-1448
Hu, A.G. (2001) Ownership, Government R&D, Private R&D, and Productivity in Chinese
Industry. Journal of Comparative Economics, 29: 136-157
Huang, J. (2008) Spillovers from Taiwan, Hong Kong, and Macau Investment and from
Other Foreign Investment in Chinese Industries. Contemporary Economic Policy, 22(1): 13-
25
Huang, Y. (2003) Selling China: Foreign Direct Investment during the Reform Era. New
York: Cambridge University Press
Huang, Y. and Duncan, R. (1997) How Successful Were China’s State Sector Reforms?
Journal of Comparative Economics, 24(1): 65-78
Hymer, S. (1976) The International Operations of National Firms: a Study of Direct Foreign
Investment. Cambridge, Massachusetts; London: MIT Press
Ichinowski, C. Shaw, K. and Prennuschi, G. (1997) The Effects of Human Resource
Management Practices on Productivity: A Study of Steel Finishing Lines. The American
Economic Review, 87(3): 291-313
International Monetary Fund (2013): World Economic Outlook Database. Available from:
http://www.imf.org/external/pubs/ft/weo/2013/01/weodata/index.aspx [31/05/2013]
Inui, T. Kawakami, A. and Miyagawa, T. (2008) Do Competitive Markets Stimulate
Innovation? An Empirical Analysis Based on Japanese Manufacturing Industry Data. RIETI
Discussion Paper Series, No. 08-E-012, Available from:
www.rieti.go.jp/jp/publications/dp/08e012.pdf [28/08/2013]
Ishikawa, (1983) China’s Economic System Reform: Underlying Factors and Prospects.
World Development, 11(8): 647-658
192
Jacob, J. (1970) The Economy of Cities. New York: Random Hause
Jarreau, J. and Poncet, S. (2012) Export Sophistication and Economic Growth: Evidence from
China. Journal of Development Economics, 97(2): 281-292
Jefferson, G. and Jian, S. (2006) Privatization and Restructuring in china: Evidence from
Shareholding Ownership, 1995-2001. Journal of Comparative Economics, 34(1): 146-166
Jefferson, G.H. Rawski, T.G. Li, W. and Yuxin, Z. (2000) Ownership, Productivity Change,
and Financial Performance in Chinese Industry. Journal of Comparative Economics, 28(4):
768-813
Jefferson, G. Zhu, A.G.Z., Guan, X. and Xu, X. (2003) Ownership, Performance, and
Innovation in China’s Large- and Medium-size Industrial Enterprise Sector. China Economic
Review, 14(1): 89-113
Jensen, J.B. McGuckin, R.H. and Stiroh, K.J. (2001) The Impact of Vintage and Survival on
Productivity: Evidence from Cohorts of U.S. Manufacturing Plants. The Review of Economics
and Statistics, 83(2): 323-332
Jiang, B.B. Laurenceson, J. and Tang, K.K. (2008) Share Reform and The Performance of
China’s Listed Companies. China Economic Review, 19(3): 489-501
Johnson, S. and Mitton, T. (2003) Cronyism and Capital Controls: Evidence from Malaysia.
Journal of Financial Economics, 67(2): 351-382
Katayama, H. Lu, S. and Tybout, J.R. (2009) Firm-level Productivity Studies: Illusion and a
Solution. International Journal of Industrial Organization, 27(3): 403-413
Keller, W. (1998) Are international R&D Spillovers Trade-related? Analyzing spillovers
Among Randomly Matched Trade Partners, European Economic Review, 42(8): 1469-1481
Kendrick, J.W. (1956) Productivity Trends: Capital and Labour. Cambridge: National
Bureau of Economic Research
Kennett, D. (2001) A New View of Comparative Economic Systems. London: Harcourt
Kerr, D. (2007) Has China Abandoned Self-reliance? Review of International Political
Economy, 14(1): 77-104

193
Kim, S. Gopinath, M. and Kim, H. (2009) High Productivity Before or After Exports? An
Empirical Analysis of Korean Manufacturing Firms. Journal of Asian Economics, 20(4): 410-
418
King, F.H.H. (1968) A Concise Economic History of Modern China. New York: Praeger, Pall
Mall.
Klenow, P. and Rodriguez-Clare, A. (1997) The Neo-classical Revival in Growth Economics:
Has It Gone Too Far? In Bernanke, B., Rotemberg, J. (Eds.), NBER Macroeconomics
Annual. MIT Press, Cambridge, MA: 73-102
Klenow, P. and Rodriguez-Clare, A. (2005) Externalities and Economic Growth. In: Aghion,
P., Durlauf, P. (Eds.) Handbook of Economic Growth, Elsevier Science: 817-861
Klette, T.J. (1999) Market Power, Scale Economies and Productivity: Estimates from a Panel
of Establishment Data. The Journal of Industrial Economics, 47(4): 451-476
Knight, J. and Wang W. (2011) China’s Macroeconomic Imbalances: Causes and
Consequences. The World Economy, (2011): 1476-1506
Kolmogorov, A.N. (1933) Sulla Determinazione Empirica di una Legge di Distribuzione.
Giornale dell’Istituto Italiano degli Attuari, 4(1933): 83-91
Kong, X. Marks, R.E. and Wan, G.H. (1999) Technical Efficiency, Technological Change
and Total Factor Productivity Growth in Chinese State-Owned Enterprises in the Early
1990s. Asia Economic Journal, 13(3): 267-281
Koprowski, E.J. (1981) Exploring the Meaning of “Good” Management. The Academy of
Management Review, 6(3): 459-467
Kornai, J. (1980) The Soft Budget Constraint. Kyklos, 39(1): 3-30
Kotabe, M. Srinivasan, S.S. and Aulakh, P.S. (2002) Multinationality and Firm Performance:
The Moderating Role of R&D and Marketing Capabilities. Journal of International Business
Studies, 33(1): 79-97
Kramer, J.P. Marinelli, E. Iammarino, S. Revilla Diez, J. (2011). Intangible Assets as Drivers
of Innovation: Empirical Evidence on Multinational Enterprises in German and UK Regional
Systems of Innovation. Technovation, 31(9): 447-458

194
Krasnikov, A. and Jayachandran, S. (2008) The Relative Impact of Marketing, Research and
Development, and Operations Capabilities on Firm Performance. Journal of Marketing,
72(4): 1-11
Kroszner, R.S. and Stratmann, T. (1998) Interest-Group Competition and the Organization of
Congress: Theory and Evidence from Financial Services’ Political Action Committees. The
American Economic Review, 88(5): 1163-1187
Krugman, P. (1990) The Age of Diminished Expectations: US Economic Policy in the 1990s.
Cambridge and London: The MIT Press
Krusekopf, C.C. (2002) Diversity in Land-tenure Arrangements Under the Household
Responsibility System in China. China Economic Review, 13(2-3): 297-312
Kung, J.K. (1994) Egalitarianism, Subsistence Provision, and Work Incentives in China’s
Agricultural Collectives. World Development, 22(2): 175-187
Kung, J.K. and Lin, J.Y. (2003) The Causes of China’s Great Leap Famine, 1959-1961.
Economic Development and Cultural Change, 52(1): 51-73
Kwon, J.K. (1986) Capital Utilization, Economies of Scale and Technical Change in the
Growth of Total Factor Productivity: An Explanation of South Korean Manufacturing
Growth. Journal of Development Economics, 24(1): 75-89
Lai, H.H. (2002) China’s Western Development Programme: Its Rationale, Implementation,
and Prospects. Modern China, 28(4): 432-466
Lazear, E.P. (2000) Performance Pay and Productivity. The American Economic Review,
90(5): 1346-1361
Lee, H. and Rugman, A.M. (2012) Firm-specific Advantages, Inward FDI Origins, and
Performance of Multinational Enterprises. Journal of International Management, 18(2012):
132-146
Leibenstein, H. (1966) Allocative Efficiency vs. “X-Efficiency”. The American Economic
Review, 56(3): 392-415
Levinsohn, J. and Petrin, A. (2003) Estimating Production Functions Using Inputs to Control

195
Li, D.D. (1996) A Theory of Ambiguous Property Rights in Transition Economies: The Case
of the Chinese Non-State Sector. Journal of Comparative Economics, 23(40): 1-19
Li, H. (2012) The Impact of China’s Stock Market Reforms on its International Stock Market
Linkages. The Quarterly Review of Economics and Finance, 52(4): 358-368
Li, H. Meng, L. Wang, Q. and Zhou, L.A. (2008) Political Connections, Financing and Firm
Performance: Evidence from Chinese Private Firms. Journal of Development Economics,
87(2): 283-299
Li, H. and Zhang, J. (2007) Do High Birth Rates Hamper Economic Growth? The Review of
Economics and Statistics, 89(1): 110-117
Li, J. (1995) China’s One Child Policy: How and How Well Has It Worked? A Case Study of
Hebei Province, 1979-88. Population and Development Review, 21(3): 563-585
Li, J. Lam, K. and Qiam, G. (2001) Does Culture Affect Behaviour and Performance of
Firms? The Case of Joint Ventures in China. Journal of International Business Studies, 32(1):
115-131
Li, K. Liu, Z. Yu, Y. and Zhang, J. (2010) Does Market-oriented Economic Transition
Enhance Enterprise Productivity? Evidence From China’s Enterprises. Pacific Economic
Review, 15(5): 719-742
Li, S. (2004) Location and Performance of Foreign Firms in China. Management
International Review, 44(2): 151-169
Li, S. (2004) The Puzzle of Firm Performance in China: an Institutional Explanation.
Economics of Planning, 37(1): 47-68
Li, S. and Xia, J. (2008) The Roles and Performance of State Firms and Non-State Firms in
China’s Economic Transition. World Development, 36(1): 39-54
Li, X. Liu, X. and Parker, D. (2001) Foreign Direct Investment and Productivity Spillovers in
the Chinese Manufacturing Sector. Economics Systems, 25(4): 305-321
Li, W. and Tang, D.T. (2005) The Great Leap Forward: Anatomy of a Central Planning
Disaster. Journal of Political Economy, 113(4): 840-877

196
Lichtenberg, F.R. (1992) Industrial De-diversification and Its Consequences for Productivity.
Journal of Economic Behavior and Organization, 18(1992): 427-438
Lichtenberg, F.R. and Siegel, D. (1991) The Impact of R&D Investment on Productivity –
New Evidence Using Linked R&D Data. Economic Enquiry, 29(2): 203-229
Lieberman, M.B. (1990) Exit from Declining Industries: “Shakeout” or “Stakeout”? The
RAND Journal of Economics, 21(4): 538-554
Lin, H. Li, H. and Yang, C. (2011) Agglomeration and Productivity: Firm-Level Evidence
from China’s Textile Industry. China Economic Review, 22(3): 313-329
Lin, J.Y. (1988) The Household Responsibility System in China’s Agricultural Reform: A
theoretical and Empirical Study. Economic Development and Cultural Change, 36(3): 199-
224
Lin, J.Y. (1990) Collectivization and China’ Agricultural Crisis in 1959-1961. Journal of
Political Economy, 98(6): 1128-1252
Lin, J.Y. (1992) Rural Reforms and Agricultural Growth in China. The American Economic
Review, 82(1): 34-51
Lin, J.Y. and Liu, Z. (2000) Fiscal Decentralization and Economic Growth in China.
Economic Development and Cultural Change, 49(1): 1-21
Lin, J.Y. and Yang, D.T. (1998) On the Causes of China’s Agricultural Crisis and the Great
Leap Famine. China Economic Review, 9(2): 125-140
Lin, J.L. (1988) The Household Responsibility System in China’s Agricultural Reform: A
Theoretical and Empirical Study. Economic Development and Cultural Change, 36(3): 199-
224
Lin, J.L. (1990) Collectivization and China’s Agricultural Crisis in 1959-1961. Journal of
Political Economy, 98(6): 1228-1252
Lin, P. Liu, Z. and Zhang, Y. (2009) Do Chinese Domestic Firms Benefit from FDI Inflow?
Evidence of Horizontal and Vertical Spillovers? China Economic Review, 20(4): 677-691

197
Liou, K.T. (2012) Incentive Policies and China’s Economic Development: Change and
Challenge. Journal of Public Budgeting, Accounting & Financial Management, 24(1): 114-
135
Liu, Z. (2002) Foreign Direct Investment and Technology Spillover: Evidence from China.
Journal of Comparative Economics, 30(2002): 579-602
Liu, Z. (2008) Foreign Direct Investment and Technology Spillovers: Theory and Evidence.
Journal of Development Economics, 85(2008): 176-193
Liu, X. and Buck, T. (2007) Innovation Performance and Channels for International
Technology Spillovers: Evidence from Chinese High-tech Industries. Research Policy,
36(2007): 355-366
Lokshin, B. Belderbos, R. and Carree M. (2008) The Productivity Effects of Internal and
External R&D: Evidence from a Dynamic Panel Data Model. Oxford Bulletin of Economics
and Statistics, 70(3): 399-413
Lööf, H. and Andersson, M. (2010) Imports, Productivity and Origin Markets: The Role of
Knowledge Intensive Economies. The World Economy,
López, R.A. and Südekum, J. (2009) Vertical Industry Relations, Spillovers, and
Productivity: Evidence from Chilean Plants. Journal of Regional Science, 49(4): 721-747
Luo, X. (2004) The Role of Infrastructure Investment Location in China’s Western
Development. World Bank Working Paper, No. 3345, Available from:
http://elibrary.worldbank.org/doi/book/10.1596/1813-9450-3345 [10/12/2013]
Ma, G. and Yi, W. (2010) China’s High Saving Rate: Myth and Reality. BIS Working
Papers, No. 312, Available from: Available from: http://www.bis.org/publ/work312.htm
[18/08/2013]
Ma, J. Evans, D.G. Fuller, R.J. and Stewart, D.F. (2002) Technical Efficiency and
Productivity Change of China’s Iron and Steel Industry. International Journal of Production
Economics, 76(3): 293-312
Mairesse, J. and Hall, B.H. (1996) Explorating the Productivity of Research and
Development: an Exploration of the GMM Methods Using Data on French and United States
198
Manufacturing Firms. NBER Working Papers Series, No. 5501, Available from:
http://www.nber.org/papers/w5501.pdf [15/04/2013]
Majumdar, S.K. (1997) The Impact of Size and Age on Firm-Level Performance: Some
Evidence from India. Review of Industrial Organization, 12(2): 231-241
Marrocu, E. Paci, R. and Usai S. (2012) Productivity Growth in the Old and New Europe:
The Role of Agglomeration Externalities. Journal of Regional Science, 53(3): 418-442
Marschak, J. and Andrews W.H. Jr. (1954) Random Simultaneous Equations and the Theory
of Production. Econometrica, 12 (3/4): 143-205
Marshall, A. (1922) Principles of Economics: An Introductory Volume. 8th
edition. London:
Macmillan & Co., Limited.
Martin, R. (2008) Productivity Dispersion, Competition and Productivity Measurement. CEP
Discussion Paper, No. 692, Available from: http://eprints.lse.ac.uk/19573/ [03/09/2013]
Martin, P. Mayer, T. and Mayneris F. (2011) Spatial Concentration and Plant-level
Productivity in France. Journal of Urban Economics, 69(2011): 182-195
Melitz, M.J. and Polanec, S. (2012) Dynamic Olley-Pakes Productivity Decomposition With
Entry and Exit. NBER Working Papers Series, No. 18182, Available from:
http://www.nber.org/papers/w18182 [29/06/2014]
Mertha, A.C. (2009) From ‘Rustless Screws’ to ‘Nail Houses’: The Evolution of Property
Rights in China. Orbis, 53(2): 233-249
Meyer, M.A. and Vickers, J. (1997) Performance Comparisons and Dynamic Incentives.
Journal of Political Economy, 105(3): 547-581
Mitra, A. (1999) Agglomeration Economies as Manifested in Technical Efficiency at the
Firm Level. Journal of Urban Economics, 45 490-500
Morgan, N.A. Slotegraaf, R.J. and Vorhies, D.W. (2009) Linking Marketing Capabilities with
Profit Growth. International Journal of Research in Marketing, 26(4): 284-293
Motohashi, K. and Yuan, Y. (2010) Productivity Impact of Technology Spillover from
Multinationals to Local Firms: Comparing China’s Automobile and Electronics Industries.
Research Policy: 39(6): 790-798.
199
Movshuk, O. (2004) Restructuring, productivity and technical efficiency in China’s Iron and
Steel Industry, 1988-2000. Journal of Asian Economics, 15(1): 135-151
Mundlak, Y. (1961) Empirical Production Function Free of Management Bias. Journal of
Farm Economics, 43(1): 44-56
Nakajima, T. Nakamura, M. and Yoshioka K. (1998) An Index Number Method for
Estimating Scale Economies and Technical Progress Using Time-Series of Cross-Section
Data: Sources of Total Factor Productivity. The Japanese Economic Review, 49(3): 310-334
Nath, P. Nachiappan, S. and Ramanathan R. (2010) The Impact of Marketing Capability,
Operations Capability and Diversification Strategy on Performance: A Resource-Based View.
Industrial Marketing Management, 39(2010): 317-329
Naughton, B.J. (2004) The Western Development Program. In: Naughton, B.J. and Yang,
D.L. (ed) Holding China Together. Cambridge: Cambridge University Press, pp. 253-295
Nelson, R.A. and Wohar, M.E. (1983) Regulation, Scale Economies, and Productivity in
Steam-Electric Generation. International Economic Review, 24(1): 57-79
Nickell, S.J. (1996) Competition and Corporate Performance. Journal of Political Economy,
104(4): 724-746
Nickell, S.J. and Nicolitsas, D. (1999) How Does Financial Pressure Affect Firms? European
Economic Review, 43(8): 1435-1456
Nickell, S.J. Wadhwani, S. and Wall M. (1992) Productivity Growth in UK Companies,
1975-1986. European Economic Review, 36(5): 1055-1085
Nishimizu, M. and Page J.M. Jr. (1982) Total Factor Productivity Growth, Technological
Progress and Technical Efficiency Change: Dimensions of Productivity Change in
Yugoslavia, 1965-78. The Economic Journal, 92(368): 920-936
Nishitateno, S. (1983) China’s Special Economic Zones: Experimental Units for Economic
Reform. International and Comparative Law Quarterly, 32(1): 175-185
North, D.C. (2000) Big-Bang Transformations of Economic Systems: An Introductory Note.
Journal of Institutional and Theoretical Economics, 156(1): 3-8

200
Olley, G.S. and Pakes, A. (1996) The Dynamics of Productivity in the Telecommunications
Equipment Industry. Econometrica, 64(6): 1263-1297
Ornaghi, C. (2006) Spillovers in Product and Process Innovation: Evidence from
Manufacturing Firms. International Journal of Industrial Organization, 24(2): 349-380
Overman, H. Gibbons, S. and Tucci, A. (2009) The Case for Agglomeration Economies.
Manchester Independent Economics Review. Manchester. Available at:
http://www.manchester-review.org.uk/projects/view/?id=718
Pan, Z. and Zhang F. (2002) Urban Productivity in China. Urban Studies, 39(12): 2267-2281
Park, B.S. (2009) China’s Corporate Reform and its Economic Effect. SERI Quarterly,
7(2009): 11-21
Park, S.H. Li, S. and Tse, D.K. (2006) Market Liberalization and Firm Performance during
China’s Economic Transition. Journal of International Business Studies, 37(1): 127-147
Polanyi, M. (2005) Tacit Knowing: Its Bearing on Some Problems of Philosophy. Review of
Modern Physics, 34(4): 601-616
Peng, X. (2011) China’s Demographic History and Future Challenges. Science, 333(581):
581-587
Perkins, F.C. (1996) Productivity Performance and Priorities for the Reform of China’s State-
Owned Enterprises. Journal of Development Studies, 32(3): 414-444
Petrin, A. Poi, B.P. and Levinsohn, J. (2004) Production Function Estimation in Stata Using
Inputs to Control for Unobservables. The Stata Journal, 4(2): 113-123
Putterman, L. (1987) The Incentive Problem in the Demise of Team Farming in China.
Journal of Development Economics, 26(1): 103-127
Putterman, L. (1990) Effort, Productivity, and Incentives in a 1970s Chinese People’s
Commune. Journal of Comparative Economics, 14(1): 88-104
Pyle, D.J. (1997) China’s Economy. Basingstoke: MacMillan Press Ltd
201
Qian, Y. (2000) The Process of China’s Market Transition (1978-1998): The Evolutionary,
Historical, and Comparative Perspectives. Journal of Institutional and Theoretical
Economics, 156(1): 151-171
Rajan, S.I. (1994) China’s One-Child Policy: Implication for Population Aging. Economic
and Political Weekly, 29(38): 2502-2506
Rasiah, R. Miao, Z. and Xin, K.X. (2013) Can China’s Miraculous Economic Growth
Continue? Journal of Contemporary Asia, 43(2): 295-313
Rawski, T.G. (1975) The Growth of Producer Industries, 1900-1971 In: D.H. Perkins (ed).
China’s Modern Economy in Historical Perspective. Stanford: Stanford University Press, pp.
203-234
Rawski, T.G. (1980) China’s Transition to Industrialism: Producer Goods and Economic
Development in the Twentieth Century. Ann Arbor: University of Michigan Press
Rawski, T.G. (1995) Implications of China’s Reform Experience. The China Quarterly,
144(12): 1150-1173
Reinhart, C.M. and Rogoff, K.S. (2009) This Time is Different: Eight Centuries of Financial
Folly. Princeton: Princeton University Press
Riskin, C. (1998) Seven Questions About the Chinese Famine of 1951-61. China Economic
Review, 9(2): 111-124
Roberts, M.J. and Tybout, J.R. (1997) The Decision to Export in Colombia. An Empirical
Model of Entry with Sunk Costs. The American Economic Review, 87(4): 545-564
Roland, G. (2000) Transition and Economics: Politics, Markets and Firms. Cambridge,
Massachusetts: The MIT Press
Romer, P.M. (1986) Increasing Returns and Long-run Growth. Journal of Political Economy,
94(5): 1002-1037
Romijn, H. and Albaladejo, M. (2002) Determinants of Innovative Capacity in Small
Electronics and Software Firms in Southeast England. Research Policy, 31(7): 1053-1067
Roodman, D. (2006) How to do xtabond2: An Introduction to Difference and System GMM
in Stata. The Stata Journal, 9(1): 86-136

202
Rosenkopf, L. and Nerkar, A. (2001) Beyond Local Search: Boundary-Spanning,
Exploration, and Impact in the Optical Disk Industry. Strategic Management Journal, 22(4):
387-306
Rugman, A.M. (2005) The Regional Multinationals: MNEs and ‘Global’ Strategic
Management. Cambridge University Press, Cambridge, UK
Schmidt, T. (2005) What Determines Absorptive Capacity? Working Paper
Schoar, A. (2002) Effects of Corporate Diversification on Productivity. Journal of Finance,
57(6): 2379-2403
Shangquan, G. (1993) Taking a Market Oriented Direction and Pushing Forward in a Gradual
Way – The Basic Experience of China’s Economic Reform. China Economic Review, 4(2):
129-136
Shen, C. Jin, J. and Zou, H. (2012) Fiscal Decentralization in China: History, Impact,
Challenges and Next Steps. Annals of Economics and Finance, 13(1): 1-51
Shen, Y. and Song, (2013) Re-estimation of firms’ total factor productivity in China’s iron
and steel industry. China Economic Review, 24(1): 177-188
Shirley, M.M. and Xu, L.C. (2001) Empirical Effects of Performance Contracts: Evidence
from China. The Journal of Law, Economics & Organization, 17(1): 168-200
Sjöholm, F. (1999a) Productivity Growth in Indonesia: The Role of Regional Characteristics
and Direct Foreign Investment. Economic Development and Cultural Change, 47(3): 559-584
Sjöholm, F. (1999b) Exports, Imports and Productivity: Results from Indonesian
Establishment Data. World Development, 27(4): 705-715
Smirnov, N.V. (1939) Estimate of Deviation between Empirical Distribution Functions in
Two Independent Samples. Bulletin Moscow University, 2(1): 3-16
Solow, R.M. (1957) Technical Change and the Aggregate Production Function. The Review
of Economics and Statistics. 39(3): 312-320
Stigler, G.J. (1947) Trends in Output and Employment. Cambridge: National Bureau of
Economic Research
203
Sun, J. Harimaya, K. and Yamori, N. (2013) Regional Economic Development, Strategic
Investors, and Efficiency of Chinese City Commercial Banks. Journal of Banking & Finance,
37(5): 1602-1611
Sun, X. and Hong, J. (2011) Exports, Ownership and Firm Productivity: Evidence from
China. The World Economy, 34(7): 1199-1215
Suyanto, Salim, R.A. and Bloch H. (2012) Does Foreign Direct Investment Lead to
Productivity Spillovers? Firm Level Evidence from Indonesia. World Development, (37)12:
1861-1876
Sveikauskas, L. (1975) The Productivity of Cities. Quarterly Journal of Economics, 89(3),
393-413
Syverson, C. (2011) What Determines Productivity? Journal of Economic Literature, 49(2):
326-365
Tan, J. Li, S. and Xia, J. (2007) When Iron Fist, Visible Hand, and Invisible Hand Meet: Fir-
Level Effects of Varying Institutional Environments in China. Journal of Business Research,
60(7): 786-794
Tang, J. and Wang, W. (2005) Product Market Competition, Skill Shortages and
Productivity: Evidence from Canadian Manufacturing Firms. Journal of Productivity
Analysis, 23(3): 317-339
Teece, D.J. Pisano, G. Shuen, A. (1997) Dynamic Capabilitites and Strategic Management.
Strategic Management Journal, 18(7): 509-533
Todo, Y. Zhang, W. Zhou L. (2009) Knowledge Spillovers from FDI in China: The Role of
Educated Labor in Multinational Enterprises. Journal of Asian Economics, (20) 2009: 626-
639
Tondkar, R.H. Peng, S. and Hodgdon, C. (2003) The Chinese Securities Regulatory
Commission and The Regulation of Capital Markets in China. Advances in International
Accounting, 16(1): 153-174
Transparency International (2011): Corruption Perceptions Index. Available from:
http://www.transparency.org/cpi2011/results [14/02/2014]

204
Trefler, D. (1993) International Factor Price Differences: Leontief Was Right! Journal of
Political Economy, 101(6): 961-987
Trefler, D. (1995) The Case of Missing Trade and Other Mysteries. American Economic
Review, 85(5): 1029-1046
Tsai, C.F. Lu, Y.H. Chen, D.C. (2012) Determinants of Intangible Assets Value: The Data
Mining Approach. Knowledge Based Systems, 31(1): 67-77
U.S. Congress, Joint Economic Committee (1967). An Economic Profile of Mainland China.
Washington: GPO
Van Bart, A. (1993) Comparative Levels of Manufacturing Productivity in Postwar Europe:
Measurement and Comparisons. Oxford Bulletin of Economics and Statistics, 52(4): 343-374
Van Bart, A. and Pilat, D. (1993) Productivity Levels in Germany, Japan and the United
States: Differences and Causes. Brookings Paper on Economic Activity, 2(1): 1-69
Van Beveren, I. (2012) Total Factor Productivity Estimation: A Practical Review. Journal of
Economic Surveys, 12(1): 98-128
Van Biesebroeck, J. (2007) Robustness of Productivity Estimates. The Journal of Industrial
Economics, 55(3): 529-569
van der Panne, G. (2004) Agglomeration Externalities: Marshall versus Jacobs. Journal of
Evolutionary Economics, 14(5): 593-604
Vinding, A.L. (2006) Absorptive Capacity and Innovative Performance: A Human Capital
Approach. Economics of Innovation and New Technology, 15(4-5): 507-517
Vogel, A. and Wagner J. (2010) Higher Productivity in Importing German Manufacturing
Firms: Self-Selection, Learning From Importing, or both? Review of World Economics,
145(4): 641-665
Vorhies, D.W. and Morgan, N.A. (2005) Benchmarking Marketing Capabilities for
Sustainable Competitive Advantage. Journal of Marketing, 69(1): 80-94
Wang, J. (2013) The Economic Impact of Special Economic Zones: Evidence from Chinese
Municipalities. Journal of Development Economics, 101(1): 133-147

205
Wang, Z. and Yu, Z. (2011) Trade Partners, Trade Products, and Firm Performance:
Evidence from China’s Exporter-Importers, GEP Working Paper Series, the University of
Nottingham
Wedervang, F. (1965) Development of a Population of Industrial Firms. Oslo: Scandinavian
University Books
Wei, Y. and Liu, X. (2006) Productivity Spillovers from R&D, Exports and FDI in China’s
Manufacturing Sector. Journal of International Business Studies, 37(4): 544-577
Wei, Y. Liu, X. and Wang, C. (2008) Mutual Productivity Spillovers between Foreign and
Local Firms in China. Cambridge Journal of Economics, 32(4): 609-631
Wei, Z. Varela, O. and Hassan, M.K. (2002) Ownership and Performance in Chinese
Manufacturing Industry. Journal of Financial Management, 12(1): 61-78
Williamson, O.E. (1981) The Economics of Organization: The Transaction Cost Approach.
American Journal of Sociology, 87(3): 548-577
Wills, I. and Yang, X. (2006) The Importance of Property Rights for Economic Growth: The
Case of Rural China, 1979-1987. Economic Papers, 25(2): 117-124
Windmeijer, F. (2005) A Finite Sample Correction for the Variance of Linear Efficient Two-
step GMM Estimators. Journal of Econometrics, 126(1): 25-51
Wolff, E.N. (2014) Productivity Convergence: Theory and Evidence. Cambridge: Cambridge
University Press
Wooldridge, J.M. (2009) On Estimating Firm-level Production Functions Using Proxy
Variables to Control for Unobservables. Economic Letters, 104(3): 112-114
World Bank (2013) World Development Indicators. [online] Available at:
http://data.worldbank.org/ [22/12/2013]
World Trade Organization (2001) 2001 Press releases. [online] Available at:
http://www.wto.org/english/news_e/pres01_e/pr243_e.htm [26/12/2013].
World Trade Organization (2013): Trade Profiles: China. [online] Available at:
http://stat.wto.org/CountryProfile/WSDBCountryPFView.aspx?Country=CN& [28/12/2013].
206
Wu, F.W.Y. (1981) From Self-reliance to Interdependence? Developmental Strategy and
Foreign Economic Policy in Post-Mao China. Modern China, 7(4): 445-482
Wu, H.L. and Chen, C.H. (2010) Operational Performance of Commercial Banks in the
Chinese Transitional Economy. Journal of Developing Areas, 44(1): 1-15
Wu, J. (2013) Marketing Capabilities, Institutional Development, and the Performance of
Emerging Market Firms: A Multinational Study. International Journal of Research in
Marketing, 30(1): 36-45
Wu, W. Wu, C. Zhou, C. and Wu, J. (2012) Political Connections, Tax Benefits and Firm
Performance: Evidence from China. Journal of Accounting and Public Policy, 31(3): 277-300
Wu, Y. (2003) Has Productivity Contributed to China’s Growth? Pacific Economic Review,
8(1): 15-30
Wu, Z.B. Yeung, G. Mok, V. and Han, Z. (2007) Firm-Specific Knowledge and Technical
Efficiency of Watch and Clock Manufacturing Firms in China. International Journal of
Production Economics, 107(2): 317-332
Yang, C.H., Lin, H.L. and Li, H.Y. (2013) Influences of Production and R&D Agglomeration
on Productivity: Evidence from Chinese Electronics Firms. China Economic Review, 27(1):
162-178
Yang, D.T. Zhang, J. and Zhou, S. (2011) Why Are Saving Rates so High in China? NBER
Working Papers Series, No. 16771, Available from: http://www.nber.org/papers/w16771
[18/08/2013]
Yanikkaya, H. (2003) Trade Openness and Economic Growth: A Cross-Country Empirical
Investigation. Journal of Development Economics, 72(2003): 57-89
Yao, S. Han, Z. and Feng, G. (2007) On technical Efficiency of China’s Insurance Industry
after WTO Accession. China Economic Review, 18(1): 66-86
Yu, M. (2010) Processing Trade, Firm’s Productivity, and Tariff Reductions: Evidence from
Chinese Products. CCER Working Paper Series, No. E2010007, Available from:
http://www.eaber.org/sites/default/files/documents/CCER_Yu_2010.pdf [12/01/2014]

207
Yu, W. Ramanathan, R. and Nath, P. (2014) The Impacts of M and Operations Capabilities
on Financial Performance in the UK Retail Sector: A Resource-based Perspective. Industrial
Marketing Management, 43(2014): 25-31
Yu, X. and Sheng, Y. (2012) Productivity Spillovers from Foreign Direct Investment: Firm-
level Evidence from China. World Development, 40(1): 62-74
Xia, J. Li, S. and Long, C. (2009) The Transformation of Collectively Owned Enterprises and
its Outcomes in China, 2001-2005. World Development, 37(10): 1651-1662
Xiwei, Z. and Xiangdong, Y. (2007) Science and Technology Policy Reform and Its Impact
on China’s National Innovation System. Technology in Society, 29: 317-325
Xu, L.C. (2000) Control, Incentives and Competition. The Impact of Reform on Chinese
State-owned Enterprises. Economics of Transition, 8(1): 151-173
Zhang, L. (2012) Do Imports of Technology Facilitate Technological Progress? Evidence
from China. Procedia Engineering, 29(3): 2826-2831
Zhang, J. and Liu, X. (2013) The Evolving Pattern of the Wage-labor Productivity Nexus in
China: Evidence from Manufacturing Firm-Level Data. Economic Systems, 37(3): 354-368
Zhang, A. Zhang Y. and Zhao, R. (2001) Impact of Ownership and Competition on the
Productivity of Chinese Enterprises. Journal of Comparative Economics, 29(2): 327-346
Zhang, A. Zhang Y. and Zhao, R. (2002) Profitability and Productivity of Chinese Industrial
Firms: Measurement and Ownership Implications. China Economic Review, 13(1): 65-68
Zhang, A. Zhang Y. and Zhao, R. (2003) A Study of the R&D Efficiency and Productivity of
Chinese Firms. Journal of Comparative Economics, 31(2003): 444-464
Zhang, J. Wang, L. and Wang, S. (2012) Financial Development and Economic Growth:
Recent Evidence from China. Journal of Comparative Economics, 40(3): 393-412
Zhao, S. (1993) Deng Xiaoping’s Southern Tour: Elite Politics in Post-Tianmen China. Asian
Survey, 33(8): 739-756
Zheng, J. Liu, X. and Bigsten (1998) Ownership Structure and Determinants of Technical
Efficiency: An Application of Data Envelopment Analysis to Chinese Enterprises (1986-
1990) Journal of Comparative Economics, 26(3): 465-484

208
Zheng, J. Liu, X. and Bigsten, A. (2003) Efficiency, technical progress, and best practice in
Chinese state enterprises (1980-1994). Journal of Comparative Economics, 31(1): 134-152
Zhou, D. Li, S. and Tse, D.K. (2002) The Impact of FDI on the Productivity of Domestic
Firms: The Case of China. International Business Review, 11(4): 465-484
Zhou, Q. (2010) The Institutional Foundation of China’s Economic Growth. China Economic
Journal, 3(1): 25-32
Zhu, X. Li, L. and Xue, Y. (2012) Banking System Reform, Earnings Quality and Credit
Allocation. China Journal of Accounting Research, 5(3): 217-22

209
Appendix
Table A1. Structure of the unbalanced panel
Panel I.
Year Number of
observations
Percent Cumulative
1998 148,474 6.8 6.8
1999 148,474 6.8 13.6
2000 162,004 7.4 21.0
2001 168,275 7.7 28.7
2002 180,751 8.3 37.0
2003 195,389 9.0 46.0
2004 277,827 12.7 58.7
2005 270,564 12.4 71.1
2006 300,498 13.8 84.8
2007 331,453 15.2 100
Total 2,183,709 100
Panel II.
Number of
observations per
firm
Number of
firms
Percen
t
Cumulati
ve
Number of
firm-year
observations
Percen
t
Cumulati
ve
1 109,513 19.6 19.6 109,513 5.0 5.0
2 103,878 18.6 38.1 207,756 9.5 14.5
3 74,800 13.4 51.5 224,400 10.3 24.8
4 98,547 17.6 69.1 394,188 18.1 42.9
5 41,828 7.5 76.6 209,140 9.6 52.4
6 36,373 6.5 83.1 218,238 10.0 62.4
7 26,356 4.7 87.8 184,492 8.4 70.9
8 19,746 3.5 91.3 157,968 7.2 78.1
9 8,616 1.5 92.8 77,544 3.6 81.7
10 40,047 7.2 100 400,470 18.3 100.0
Total 559,704 100 2,183,709 100