dublin waste water treatment - choisir une...
TRANSCRIPT

EX POST EVALUATION OF INVESTMENT PROJECTS CO-FINANCED BY THE
EUROPEAN REGIONAL DEVELOPMENT FUND (ERDF) OR COHESION FUND
(CF) IN THE PERIOD 1994-1999
DUBLIN WASTE WATER TREATMENT
PREPARED BY: DKM ECONOMIC CONSULTANTS, DUBLIN
IN PARTNERSHIP WITH CSIL, CENTRE FOR INDUSTRIAL STUDIES, MILAN
Prepared for: European Commission DIRECTORATE-GENERAL
REGIONAL POLICY POLICY DEVELOPMENT
EVALUATION
MILAN, SEPTEMBER 5, 2012

This report is part of a study carried out by a Team selected by the Evaluation Unit, DG Regional Policy,
European Commission, through a call for tenders by open procedure no 2010.CE.16.B.AT.036.
The consortium selected comprises CSIL – Centre for Industrial Studies (lead partner – Milan) and DKM
Economic Consultants (Dublin).
The Core Team comprises:
- Scientific Director: Massimo Florio, CSIL and University of Milan;
- Project Coordinators: Silvia Vignetti and Julie Pellegrin, CSIL;
- External experts: Ginés de Rus (University of Las Palmas, Spain), Per-Olov Johansson (Stockholm School
of Economics, Sweden) and Eduardo Ley (World Bank, Washington, D.C.);
- Senior experts: Ugo Finzi, Mario Genco, Annette Hughes and Marcello Martinez;
- Task managers: John Lawlor, Julie Pellegrin and Davide Sartori;
- Project analysts: Emanuela Sirtori, Gelsomina Catalano and Rory Mc Monagle.
A network of country experts provides the geographical coverage for the field analysis: Roland Blomeyer,
Fernando Santos (Blomeyer and Sanz – Guadalajara), Andrea Moroni (CSIL – Milano), Antonis Moussios,
Panos Liveris (Eurotec - Thessaloniki), Marta Sánchez-Borràs, Mateu Turró (CENIT – Barcelona), Ernestine
Woelger (DKM – Dublin).
The authors of this report are John Lawlor and Rory Mc Monagle of DKM.
The authors are grateful for the very helpful comments from the EC staff and particularly to Veronica
Gaffey, José-Luís Calvo de Celis and Kai Stryczynski. They also express their gratitude to all stakeholders
who agreed to respond to the team’s questions and contributed to the realisation of the case study. The
authors are responsible for any remaining errors or omissions.
Quotation is authorised as long as the source is acknowledged.
Cover: Dublin Bay. Source: Dublin City.
TABLE OF CONTENTS
EXECUTIVE SUMMARY ....................................................................................................................... 1
1 PROJECT DESCRIPTION ............................................................................................................... 7
1.1 KEY FEATURES OF THE INFRASTRUCTURE AND SERVICE DELIVERED............................................................... 7 1.2 CONTEXT ...................................................................................................................................... 11 1.3 TARGET POPULATION ...................................................................................................................... 12 1.4 CURRENT PERFORMANCE ................................................................................................................. 16
2 ORIGIN AND HISTORY ............................................................................................................... 23
2.1 CONTEXT FOR THE PROJECT .............................................................................................................. 23 2.2 KEY STAKEHOLDERS AND MANAGEMENT STRUCTURES ............................................................................ 33 2.3 MAIN DEVELOPMENTS SINCE COMPLETION .......................................................................................... 41 2.4 HAS THE PROJECT STABILISED? .......................................................................................................... 46
3 LONG-TERM DEVELOPMENT EFFECTS ........................................................................................ 49
3.1 KEY FINDINGS ............................................................................................................................... 49 3.2 DIRECT ECONOMIC GROWTH ............................................................................................................ 53 3.3 ENDOGENOUS DYNAMICS ................................................................................................................ 55 3.4 SOCIAL COHESION .......................................................................................................................... 56 3.5 ENVIRONMENTAL EFFECTS ............................................................................................................... 58 3.6 TERRITORIAL COHESION ................................................................................................................... 58 3.7 INSTITUTIONAL QUALITY .................................................................................................................. 58 3.8 SOCIAL HAPPINESS .......................................................................................................................... 60
4 DETERMINANTS OF PROJECT OUTCOMES .................................................................................. 61
4.1 KEY FINDINGS ............................................................................................................................... 61 4.2 APPROPRIATENESS TO THE CONTEXT .................................................................................................. 62 4.3 PROJECT DESIGN ............................................................................................................................ 64 4.4 FORECASTING CAPACITY .................................................................................................................. 64 4.5 PROJECT GOVERNANCE .................................................................................................................... 65 4.6 MANAGERIAL RESPONSE .................................................................................................................. 66 4.7 INFLUENCE OF AND INTERPLAY BETWEEN DRIVERS ................................................................................. 67 4.8 THE ROLE OF THE EU ...................................................................................................................... 68
5 CONCLUSIONS ........................................................................................................................... 69
ANNEX I. METHODOLOGY OF EVALUATION .................................................................................. 73
ANNEX II. COST-BENEFIT ANALYSIS ............................................................................................... 79
ANNEX III. GLOSSARY OF TERMS .................................................................................................... 99
ANNEX IV. LIST OF INTERVIEWEES ................................................................................................ 101
ANNEX V. REFERENCES ............................................................................................................... 103

LIST OF ABBREVIATIONS
ABP An Bord Pleanála/Planning Appeals Board
AD Anaerobic Digestion
BOD5 Biochemical Oxygen Demand
CAW Celtic Anglian Water, the DWWT concessionaire
CBA Cost-Benefit Analysis
CF Cohesion Fund
CFU Colony Forming Unit
COD Chemical Oxygen Demand
CSO Central Statistics Office
DBO Design Build Operate
DBWQMP Dublin Bay Water Quality Management Plan
DCC Dublin City Council
DDDA Dublin Docklands Development Authority
DOE Department of the Environment (now the Department of Environment, Community and Local Government, DECLG)
DG Regio Directorate General for Regional Policies
DWWT Dublin Wastewater Treatment
EAP Environmental Action Programme
EIA Environmental Impact Assessment
EIS Environmental Impact Statement
EC European Commission
EPA Environmental Protection Agency
ERDF European Regional Development Fund
ERU Environmental Research Unit
EU European Union
EUR Euro
FF Fíanna Fáil, Irish Political Party

GDA Greater Dublin Area
GDP Gross Domestic Product
GVA Gross Value Added
IFSC International Financial Services Centre
IPPC Integrated Pollution Prevention Control
Km Kilometre(s)
m Metre(s)
MACL
mm
McCarthy Acer Consultants Limited
Millimetre(s)
M&E Mechanical & Electrical
MSW Municipal Solid Waste
MW
NUTS
Megawatts
Nomenclature of Territorial Statistical Units
NPV Net Present Value
PE Population Equivalent
PDs Progressive Democrats, Irish Political Party
R&D Research and Development
SBR Sequencing Batch Reactors
ToR Terms of Reference
TSS Total Suspended Solids
WtE Waste to Energy (i.e. incineration)
WTP Willingness to pay

1
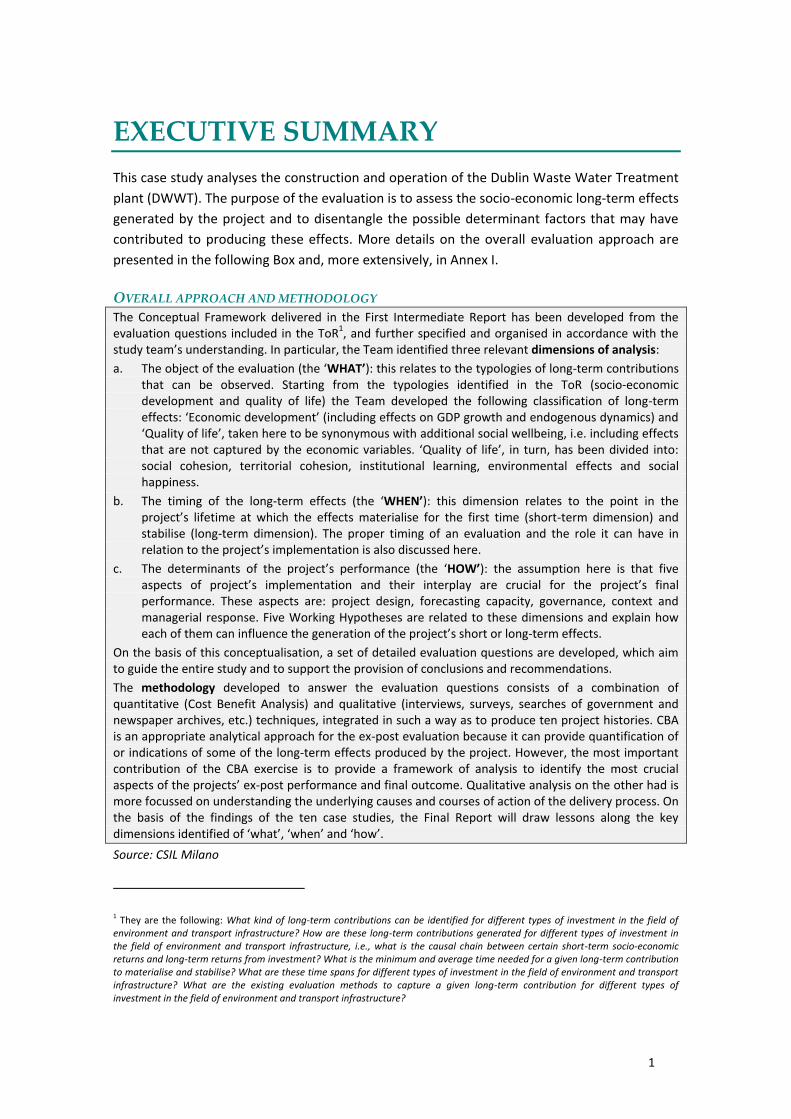
EXECUTIVE SUMMARY
This case study analyses the construction and operation of the Dublin Waste Water Treatment
plant (DWWT). The purpose of the evaluation is to assess the socio-economic long-term effects
generated by the project and to disentangle the possible determinant factors that may have
contributed to producing these effects. More details on the overall evaluation approach are
presented in the following Box and, more extensively, in Annex I.
OVERALL APPROACH AND METHODOLOGY
The Conceptual Framework delivered in the First Intermediate Report has been developed from the evaluation questions included in the ToR1, and further specified and organised in accordance with the study team’s understanding. In particular, the Team identified three relevant dimensions of analysis:
a. The object of the evaluation (the ‘WHAT’): this relates to the typologies of long-term contributions that can be observed. Starting from the typologies identified in the ToR (socio-economic development and quality of life) the Team developed the following classification of long-term effects: ‘Economic development’ (including effects on GDP growth and endogenous dynamics) and ‘Quality of life’, taken here to be synonymous with additional social wellbeing, i.e. including effects that are not captured by the economic variables. ‘Quality of life’, in turn, has been divided into: social cohesion, territorial cohesion, institutional learning, environmental effects and social happiness.
b. The timing of the long-term effects (the ‘WHEN’): this dimension relates to the point in the project’s lifetime at which the effects materialise for the first time (short-term dimension) and stabilise (long-term dimension). The proper timing of an evaluation and the role it can have in relation to the project’s implementation is also discussed here.
c. The determinants of the project’s performance (the ‘HOW’): the assumption here is that five aspects of project’s implementation and their interplay are crucial for the project’s final performance. These aspects are: project design, forecasting capacity, governance, context and managerial response. Five Working Hypotheses are related to these dimensions and explain how each of them can influence the generation of the project’s short or long-term effects.
On the basis of this conceptualisation, a set of detailed evaluation questions are developed, which aim to guide the entire study and to support the provision of conclusions and recommendations.
The methodology developed to answer the evaluation questions consists of a combination of quantitative (Cost Benefit Analysis) and qualitative (interviews, surveys, searches of government and newspaper archives, etc.) techniques, integrated in such a way as to produce ten project histories. CBA is an appropriate analytical approach for the ex-post evaluation because it can provide quantification of or indications of some of the long-term effects produced by the project. However, the most important contribution of the CBA exercise is to provide a framework of analysis to identify the most crucial aspects of the projects’ ex-post performance and final outcome. Qualitative analysis on the other had is more focussed on understanding the underlying causes and courses of action of the delivery process. On the basis of the findings of the ten case studies, the Final Report will draw lessons along the key dimensions identified of ‘what’, ‘when’ and ‘how’.
Source: CSIL Milano
1 They are the following: What kind of long-term contributions can be identified for different types of investment in the field of
environment and transport infrastructure? How are these long-term contributions generated for different types of investment in the field of environment and transport infrastructure, i.e., what is the causal chain between certain short-term socio-economic returns and long-term returns from investment? What is the minimum and average time needed for a given long-term contribution to materialise and stabilise? What are these time spans for different types of investment in the field of environment and transport infrastructure? What are the existing evaluation methods to capture a given long-term contribution for different types of investment in the field of environment and transport infrastructure?

2
The context and objective of the project can be considered as:
The requirement to comply with the Urban Waste Water Directive 91/271/EEC, along
with other Directives such as the Bathing Water Directive;
The availability of very high funding rates from the EU Cohesion Fund for investments
to address the requirements of the Directive; and
The increasingly well-established need to improve water quality in Dublin Bay,
independent of the requirements of the Directive, driven by increased population and
prosperity.
In more detail, the project, completed in 2003, consisted primarily of a comprehensive
expansion and up-grading of the Ringsend treatment plant, as well as a pumping station and
underwater pipeline to carry wastewater from the north of the city to the Ringsend plant. The
objective was to accommodate most of the waste water arising in the Dublin region (a human
population of approximately 1.1 million) and comply with the Urban Waste Water Directive.
There is also planned substantial future investment to increase capacity and cater for the
sensitive status of the Liffey estuary, to be completed by 2015.
This was an exceptionally large and complex project, and at the time was the largest
wastewater project grant-aided by the Cohesion Fund. The project was delivered using a Public
Private Partnership (Design-Build-Operate - DBO2) procurement process, and used a number of
innovative technologies to cater for the large pollution load on a constrained site (15
hectares). The public authority in charge of the project was Dublin City Council (DCC), and the
concessionaire awarded the DBO contract was the ABA consortium, which included Celtic
Anglian Water (CAW) as the plant operator.
The construction phase took place between 1995 and 2003. Elements of the upgraded plant
commenced operations in 1999 but the plant became fully operational in 2003.
The project involved a total initial investment of EUR 297 million (2011 prices, VAT exclusive),
53% of which co-financed through the Cohesion Fund. The remaining investment cost was
covered through national public contribution (37%) and contributions by large industrial users
(10%). The EC contribution was primarily justified by reference to the requirement to meet the
standards of the already mentioned Urban Waste Water Directive.
After the project was finalised, the designation of the Liffey estuary as a sensitive water body
requiring full tertiary treatment forced to implement additional investments. A further EUR
147.3 million (2011 prices, VAT exclusive) is to be spent between now and 2015 to increase
2 Design-Build-Operate or DBO is a type of Public Private Partnership (PPP), whereby the public authority appoints a
concessionaire to Design, Build and Operate a piece of infrastructure. The concessionaire is free to design the plant as they see fit, to deliver an agreed outcome. The concessionaire then builds the plant according to this design and operates the plant for a set period of time (typically 20-25 years), at the end of which the plant is transferred back to the public authority. Ownership remains with the local authority throughout. Under traditional procurement the public authority (the “employer”) designs the plant and employs a contractor to build it according to the employer’s specification. Upon completion the public authority takes over the operation of the plant.

3
capacity and make the plant fully compliant with the Urban Waste Water Directive. Thus the
total cost of the project will be EUR 443.3 million.
OVERVIEW OF INVESTMENT COSTS AND SOURCES OF FINANCING
Financing period 1995-2003
First year of operation 2003
Total investment costs (2011 prices) EUR 296 million 100%
Sources of financing and co-funding rates over the total investment costs
Cohesion Fund EUR 157 million 53.1%
European Regional Development Fund EUR 0 0%
European Investment Bank EUR 0 0%
National-regional-local public contribution EUR 109 million 36.8%
Private capital EUR 29.9 million 10.1%
There were no major time overruns on delivery of the project, but the whole project was
subject to a cost overrun of approximately EUR 23 million, as a result of the overrun on one
aspect of the project – the underwater pipeline from Sutton in north Dublin to the treatment
plant.
Design capacity of the plant (originally not expected to be reached until 2020) was 1.64 million
population equivalent, split roughly 70:30 between domestic and non-domestic customers.
However, the plant was operating at above design capacity - 1.8 to 1.9 million population
equivalent - from the day it opened. This created significant operational problems, and
contributed to serious odour problems during the early years of the plant’s operations. The
latter were eventually resolved, albeit at significant additional cost to Dublin City Council,
which has also had to compensate the concessionaire for the above design capacity pollution
load.
Current performance is satisfactory, indeed the plant is seen as a flagship for the technology
used. Operation of the plant represents a significant financial burden on Dublin City Council. In
particular, there are no water charges on households, although it is planned to introduce
metered household water charges in the coming years. This will contribute significantly to
financial sustainability of the overall public water services, as well as potentially having a
moderating impact on demand. Commercial customers, whose discharges are similar in nature
to domestic wastewater, currently pay a combined water/wastewater charge (EUR1.90/m3 in
2012). Industrial customers pay based on a formula in accordance with the constituents of
their wastewater discharges and their licences. The formula is designed to capture the
marginal cost of treating their waste water. As such, the European “polluter pays” principle3 is
only partly implemented at the moment, although it is expected to be fully implemented in the
coming years with the introduction of metered household charges.
3 Stated in Directive 2004/35/EEC.

4
Project impacts are analysed using two broad methodological approaches – quantitative (i.e.
Cost Benefit Analysis) and qualitative. From an economic viewpoint (taking into account
household willingness to pay for improved water quality in Dublin Bay and conversion from
market to shadow prices), the project generates highly positive returns: an economic net
present value of EUR 355 million and an internal rate of return of 11.7%.
There were some positive endogenous dynamics effects, particularly in terms of technological
progress: many of these benefits may be mainly felt outside Ireland. The project may also have
uncovered technological inadequacies, which had negative impacts on the subsequent
operations of the plant, initially at least.
Social cohesion may have on balance been somewhat negatively impacted, through the
impacts of the odour problems on the Ringsend district of the city, which is less well-off than
the average, and sees itself as being poorly treated by Dublin City Council (a municipal
incinerator is also proposed for the area, which has exacerbated this perception). On the other
hand, the extension of waste water capacity facilitated increased housing and commercial
development, particularly in the north of the city where development had been constrained
due to lack of water services.
It can be argued that the absence of domestic water supply and wastewater treatment charges
contributes to social cohesion, by avoiding financial burdens on less-well-off households, but
of course this has negative consequences for both financial and environmental sustainability.
Avoidance of undue burdens on households can be more efficiently achieved through general
social welfare transfers.
Environmental quality was strongly enhanced by the project, with a significant improvement in
water quality in the bay, and further improvement possible with the installation of increased
capacity and a long sea outfall in the coming years. This has resulted in a number of beaches
along the bay achieving Blue Flag status in the years since the new treatment plant opened.
The absence of metered domestic water supply and wastewater treatment charges has
negative consequences for environment, as economic theory indicates that this contributes to
the excessive load on the plant.
The plant as designed (and as operated) is in compliance with the basic requirements of the
Urban Waste Water Directive, but on designation of the Liffey Estuary as a sensitive water
body in 2001, further investment (to be completed by 2015) is required to deliver full
compliance.
There is limited impact on territorial cohesion, except in so far as development in Fingal
County in the north of the city has been facilitated.
It is open to question whether the project had an impact on institutional quality. The project
does appear to have uncovered a lack of institutional quality at local authority level, in terms
of capacity to plan and design the physical plant and the Design-Build-Operate (DBO) contract.

5
Social happiness impacts, in terms of perception of the project, are mixed. Those using the
amenity of Dublin Bay have largely positive perceptions, while the residents immediately
neighbouring the plant have a negative perception due to the serious odour problems in the
early years of the plant’s operations, reinforced by the current plans for a municipal waste
incinerator on an adjacent site.
The assessment of the key determinants of project outcomes highlights that the context for
the project was in large part highly positive, specifically inadequate or no treatment of
wastewater discharges from the largest city in Ireland into an enclosed bay with a high amenity
value; growing population, housing and prosperity; the Urban Waste Water Directive, which
brought the requirement for improved treatment into sharp legal focus; and finally the
availability of very high levels of EU grant aid for projects aimed at meeting the requirements
of the Directive.
Some weaknesses were highlighted under the heading of project design, under which we
would include contract design. Although the DBO procurement approach apparently enabled
the accommodation of the plant on a constrained site, shortfalls in the contract design made it
difficult and time-consuming to resolve operational problems and allocate responsibility.
Forecasting capacity likewise was a significant source of weakness in the project, most notably
in terms of projecting the design load, which was exceeded from day one of operations. That
said, the acceleration of growth during the “Celtic Tiger” period exceeded all expectations.
Failure to anticipate important environmental constraints was also an issue. Between them,
these have had significant consequences for the technical solution, the cost and the operations
of the plant.
In general, governance for EU co-funded projects is stronger than for unfunded projects,
because of the discipline imposed by EU procedures. However, it can be said that governance
of this project exhibited weaknesses in many respects, most notably in respect of the
forecasting issues discussed above, but also in terms of contract design.
Managerial response exhibited positive and negatives. The project had to adapt to a number of
unforeseen events, albeit that many of these should have been foreseen. It appears to have
been able to cater for the above design capacity demand quite well, but took a number of
years – and high cost - to deal with the odour problem. A number of environmental
designations that constrained the project also had to be dealt with. Positive managerial
response can be seen in the construction of the Sutton to Ringsend pipeline, and in the
decision by DCC to change its consulting engineers.
Looking forward, the project will involve significant further investment to increase capacity
and deliver full compliance with the Urban Waste Water Directive (to be completed in 2015).
The planned introduction of metered domestic water service charges in the coming years will
enhance financial sustainability and should moderate demand.
A lesson from the project is to be aware of vulnerabilities with complex and innovative
infrastructure projects, subject to significant constraints, in a dynamic environment. This may

6
be particularly problematic in contexts where technical expertise is weak, and demand data or
forecasting capacity is limited.

7
1 PROJECT DESCRIPTION
1.1 KEY FEATURES OF THE INFRASTRUCTURE AND SERVICE DELIVERED
Wastewater from most of the Dublin NUTS III Region4 is treated at the treatment plant at
Poolbeg in the docks area of Dublin city. The current plant was completed in 2003, but there
has been a treatment plant on the site since the early 1900s.
Poolbeg is a narrow spit of land jutting into Dublin Bay, which has been extended on either
side over the years via land reclamation. It is a long-established port/industrial area; as well as
the wastewater treatment plant, it is home to a gas-fired power station5, several used and
unused industrial and port sites, and it is also the site for a proposed new MSW incinerator6 to
serve the Dublin region. The plant site is quite constrained (covering 15 hectares), a factor that
has shaped much of the evolution of the project (see further discussion in later Sections).
Figure 1.1 LOCATION OF WASTEWATER TREATMENT PLANT IN DUBLIN
Legend: Proposed Incinerator ; Wastewater Treatment Plant ; Poolbeg Power Station Source: Authors
Although situated in Poolbeg, the plant is most often referred to as the Ringsend plant or the
Ringsend works (Ringsend being the most immediately adjacent district of the city - see Figure
4 Which comprises Dublin City and the administrative counties of Fingal, Dún Laoghaire-Rathdown and South Dublin. Small parts of
the neighbouring counties of Kildare and Meath are also served by the plant. 5 Capacity 463MW.
6 http://www.dublincity.ie/WATERWASTEENVIRONMENT/WASTE/Pages/WastetoEnergy.aspx

8
1.1). “Poolbeg” and “Ringsend” are often used interchangeably in the literature when referring
to the plant.
Figure 1.2 DUBLIN WASTEWATER TREATMENT PLANT
Source: Wordpress, 20107
The treatment works are the centre of a broader infrastructure project which was constructed
in the 1990s to service the four main catchment areas of Dublin – north, south (Dún Laoghaire)
central (Inner City/Grand Canal) and south-west (Dodder Valley) – as set out in Figure 1.3
below8. Wastewater is channelled to pumping stations in the north, central and south
catchment areas from where it is pumped to the treatment plant (via underwater pipelines
across Dublin Bay in the case of the north and south catchments). The Dodder Valley sewer
which serves the south-west of the city drains by gravity.
7 http://conorcreighton.wordpress.com/2010/05/.
8 Some wastewater from the neighbouring counties of Kildare and Meath also accesses the treatment plant via the Grand Canal
sewer.

9
Figure 1.3 CATCHMENT AREA FOR DUBLIN WASTEWATER TREATMENT PLANT
Source: Author’s elaboration of Dublin Corporation & MACL, DWWT Environmental Impact Statement
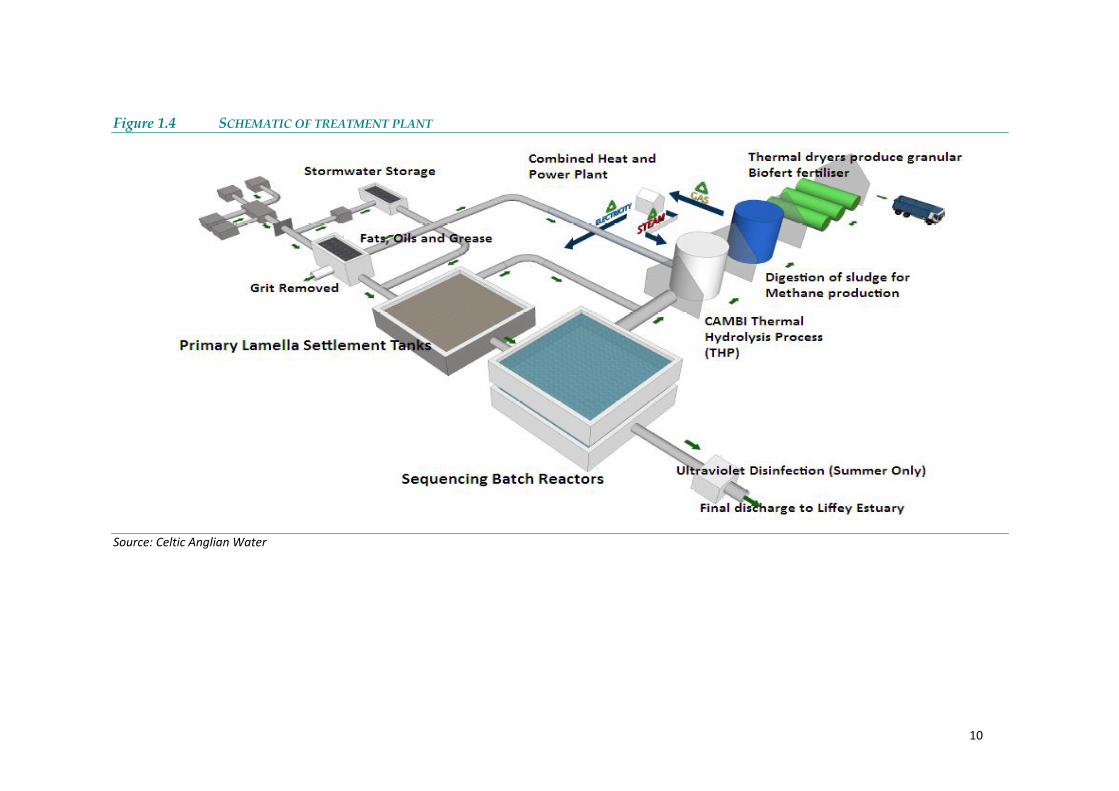
At the plant wastewater is treated in three main stages (see Figure 1.4)9:
Primary: Heavy material (paper, plastics, etc.) is removed as the waste water passes
through 6mm mesh screens. It passes to tanks where fats, oils and grease are allowed
to float to the top, and are “skimmed” off. It then moves to the main primary lamella
settlement tanks. Suspended solids are allowed to settle to the bottom and are
removed. This process removes 40-50% of the pollutants10. In both processes the
removed material is sent to the sludge treatment facility.
Secondary: The waste water then passes to the Sequencing Batch Reactors (SBRs).
Biological agents remove organic matter as well as reducing ammonia and nitrogen
content. There are 24 SBRs at the facility and uniquely they were constructed in two
storeys due to the space limitations of the site (see Figure 2.3). They are the largest of
their kind in the world. Sludge is generated during this process and it is sent to the
sludge treatment facility.
9 For a useful video tour of the plant, see http://www.youtube.com/watch?v=TTEz8NguqfM.
10Source: Project brochure for Ringsend Plant.
10
Figure 1.4 SCHEMATIC OF TREATMENT PLANT
Source: Celtic Anglian Water

11
Tertiary: Finally, during the months of May to September, ultraviolet radiation is
passed through the water to kill any remaining pathogens11. It is discharged into Dublin
Bay, where it is further diluted by mixing with the cooling water outfall from the
neighbouring power station.
The sludge undergoes thermal hydrolysis, whereby it is heated to 265°C and subjected to 10
bar of pressure. This increases the digestibility and viscosity of the material, and pasteurises
it12. It then undergoes anaerobic digestion. The main outputs of this process are:
Biogas (methane), which is used to generate electricity, which serves 40% of the
plant’s power needs, and
After subsequent drying, Biofert (a stabilised compost-like material, dried to 92% solid
matter), which is supplied to farmers in the south-east of Ireland as agricultural
fertiliser13.
Figure 1.5 FINAL BIOFERT PRODUCT BEING LOADED ONTO TRUCK
Source: DKM tour of the plant
Due to capacity limitations in the Anaerobic Digestion (AD) plant, a proportion of sludge does
not undergo anaerobic digestion, but is dried to 24% solid matter, as “sludge cake”, which can
also be spread on land as a fertiliser. Plant operators are actively working to minimise the
proportion of this product produced over time, and to subject all sludge to anaerobic
digestion.
1.2 CONTEXT
The context for the investment can be seen as threefold:
11
UV ttreatment outside these months is considered unnecessary, as the water temperature is too low for bacteria to survive. Note the plant would not be considered a full tertiary treatment plant, as it lacks chemical nutrient (phosphorus and nitrogen) removal capability. 12
The so-called CAMBI process, which was adopted as being highly suited to a constrained site. 13
Locational usage of the biofert reflects the locational base of the contractor who removes the material as well as the land conditions which are suitable for taking the material.
12
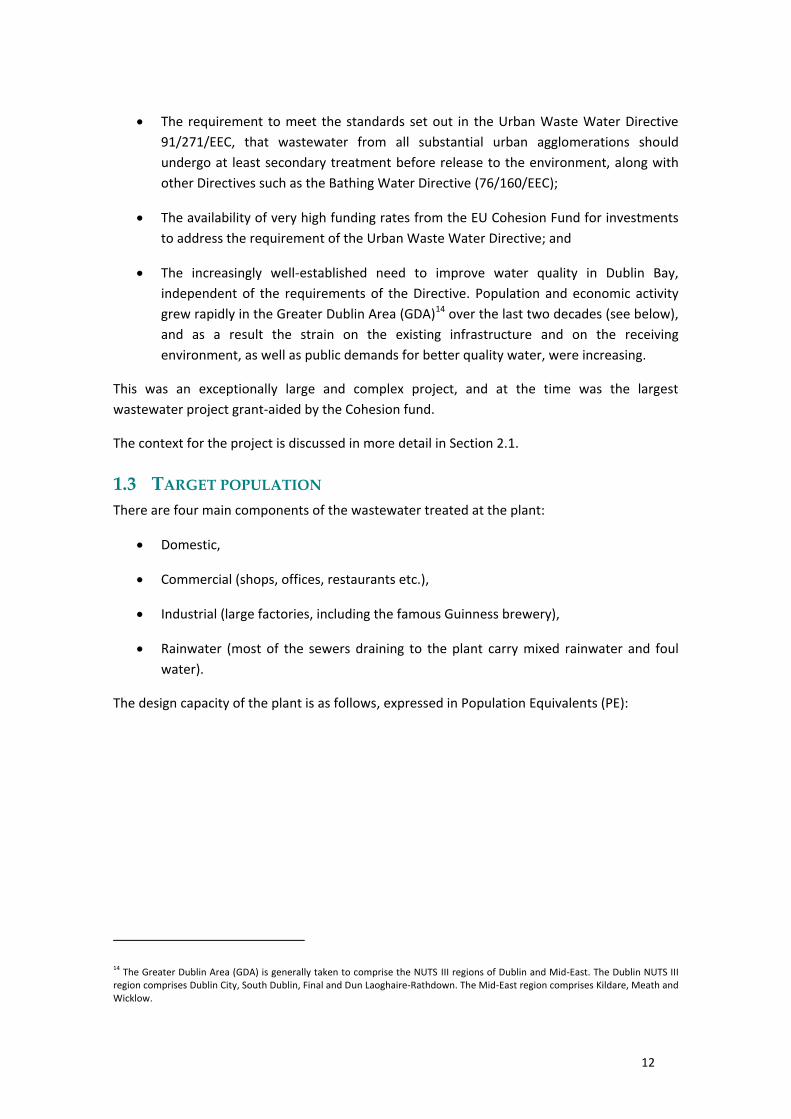
The requirement to meet the standards set out in the Urban Waste Water Directive
91/271/EEC, that wastewater from all substantial urban agglomerations should
undergo at least secondary treatment before release to the environment, along with
other Directives such as the Bathing Water Directive (76/160/EEC);
The availability of very high funding rates from the EU Cohesion Fund for investments
to address the requirement of the Urban Waste Water Directive; and
The increasingly well-established need to improve water quality in Dublin Bay,
independent of the requirements of the Directive. Population and economic activity
grew rapidly in the Greater Dublin Area (GDA)14 over the last two decades (see below),
and as a result the strain on the existing infrastructure and on the receiving
environment, as well as public demands for better quality water, were increasing.
This was an exceptionally large and complex project, and at the time was the largest
wastewater project grant-aided by the Cohesion fund.
The context for the project is discussed in more detail in Section 2.1.
1.3 TARGET POPULATION
There are four main components of the wastewater treated at the plant:
Domestic,
Commercial (shops, offices, restaurants etc.),
Industrial (large factories, including the famous Guinness brewery),
Rainwater (most of the sewers draining to the plant carry mixed rainwater and foul
water).
The design capacity of the plant is as follows, expressed in Population Equivalents (PE):
14
The Greater Dublin Area (GDA) is generally taken to comprise the NUTS III regions of Dublin and Mid-East. The Dublin NUTS III region comprises Dublin City, South Dublin, Final and Dun Laoghaire-Rathdown. The Mid-East region comprises Kildare, Meath and Wicklow.

13
Table 1.1 DESIGN CAPACITY OF THE POOLBEG WASTEWATER TREATMENT PLANT
('000S PE)
Ringsend* North Dublin Total %age Split
Human Population 831 314 1,145 69.8%
Hospitals & Commuters 10 1 11 0.7%
Design Margin 31 31 1.9%
Industry 366 87 453 27.6%
Total 1,207 433 1,640 100.0%
*”Ringsend” includes all the wastewater treated at the plant with the exception of that originating from North Dublin. Source: Fehily (2008)
In rough terms the split of capacity was domestic:non-domestic in the ratio 70:30. This design
capacity was expected to be reached in 2020; however, as discussed in Section 2, the plant
found itself operating at in excess of design capacity from the day it opened in 2003.
As indicated, the plant serves the population of the Dublin NUTS III region, along with small
parts of the neighbouring counties of Kildare and Meath (see Figure 1.6).
Figure 1.6 COUNTIES AND REGIONS IN IRELAND SERVED BY PLANT
Source: Authors’ elaboration of Andi Knight (2004)15 and volunteer.ie16
Table 1.2 and Figure 1.7 summarise the evolution of the relevant population over the last
decade and a half.
15
http://www.gogolfing.ie/Maps/Ireland.htm 16
http://www.volunteer.ie/Find-Your-Local-Volunteer-Centre.html

14
Table 1.2 POPULATION COUNTIES IN THE PLANT’S CATCHMENT AREA, 1996 -2011
Area 1996 2011 %age Growth
Dublin City 481,854 525,383 9.0%
Fingal 167,683 273,051 62.8%
Dún Laoghaire-Rathdown 189,999 206,995 8.9%
South Dublin 218,728 265,174 21.2%
Dublin (NUTS III) 1,058,264 1,270,603 20.1%
Meath 109,732 184,034 67.7%
Kildare 134,992 209,955 55.5%
State 3,626,087 4,581,269 26.3%
Source: CSO Census of Population, 1996 and 2011
The strength of population growth is clear over the period, as is the variability in that growth.
Fingal, the most peripheral and least developed part of the Dublin region, to the north of the
city, has experienced the strongest growth, matching that in the surrounding counties. Dublin
City and Dún Laoghaire-Rathdown, the most developed parts, experienced the least growth.
Notably, the Dublin region as a whole experienced less than average population growth
compared to the State. This reflects a classic urban sprawl or “donut” pattern of urban
development, partly caused by constraints on development in Fingal due to a lack of
wastewater treatment (and water supply) capacity until the Ringsend plant upgrade was in
place.
Figure 1.7 COUNTY LEVEL POPULATION GROWTH, INDEX 1991 = 100
Source: CSO Census of Population, various years
15
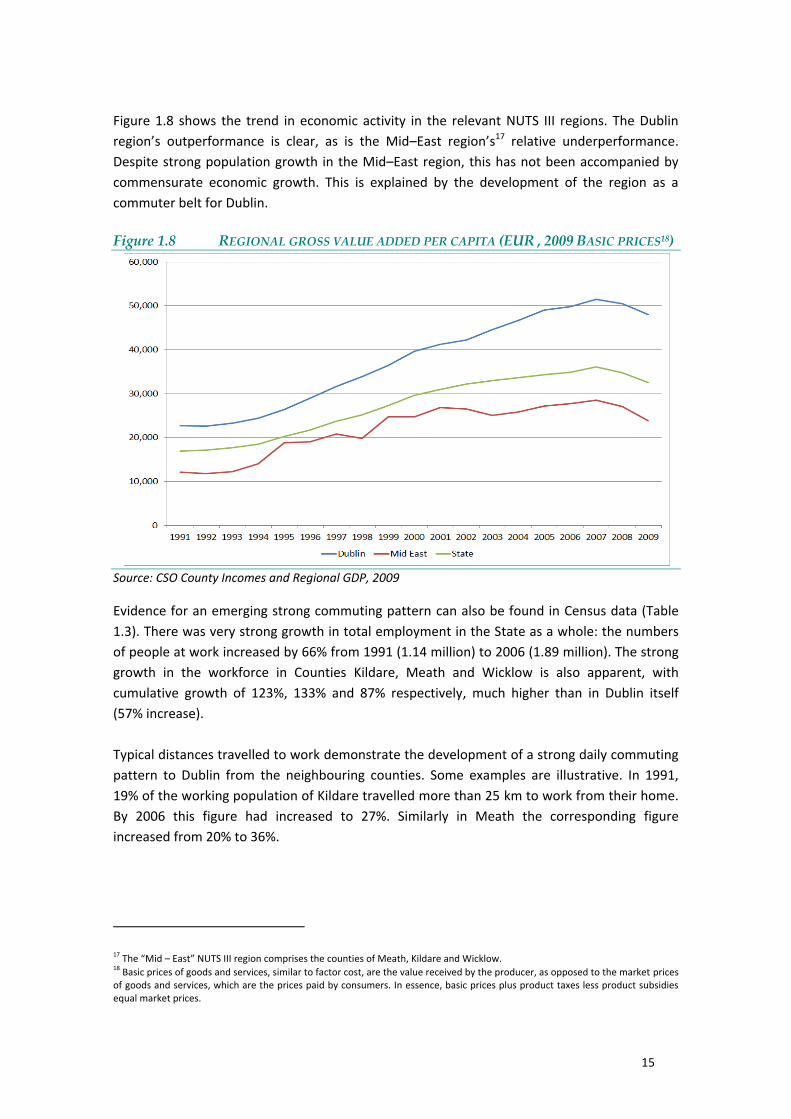
Figure 1.8 shows the trend in economic activity in the relevant NUTS III regions. The Dublin
region’s outperformance is clear, as is the Mid–East region’s17 relative underperformance.
Despite strong population growth in the Mid–East region, this has not been accompanied by
commensurate economic growth. This is explained by the development of the region as a
commuter belt for Dublin.
Figure 1.8 REGIONAL GROSS VALUE ADDED PER CAPITA (EUR , 2009 BASIC PRICES18)
Source: CSO County Incomes and Regional GDP, 2009
Evidence for an emerging strong commuting pattern can also be found in Census data (Table
1.3). There was very strong growth in total employment in the State as a whole: the numbers
of people at work increased by 66% from 1991 (1.14 million) to 2006 (1.89 million). The strong
growth in the workforce in Counties Kildare, Meath and Wicklow is also apparent, with
cumulative growth of 123%, 133% and 87% respectively, much higher than in Dublin itself
(57% increase).
Typical distances travelled to work demonstrate the development of a strong daily commuting
pattern to Dublin from the neighbouring counties. Some examples are illustrative. In 1991,
19% of the working population of Kildare travelled more than 25 km to work from their home.
By 2006 this figure had increased to 27%. Similarly in Meath the corresponding figure
increased from 20% to 36%.
17
The “Mid – East” NUTS III region comprises the counties of Meath, Kildare and Wicklow. 18
Basic prices of goods and services, similar to factor cost, are the value received by the producer, as opposed to the market prices of goods and services, which are the prices paid by consumers. In essence, basic prices plus product taxes less product subsidies equal market prices.

16
1.4 CURRENT PERFORMANCE
The construction of the plant has resulted in significant environmental benefits. The quality of
water in Dublin Bay has notably improved and this has resulted in a number of beaches along
the bay achieving Blue Flag19 status in the years since the new treatment plant opened,
namely:
Dollymount strand20, the nearest beach north of the treatment plant (Figure 1.9);
Portmarnock, (north-side)21;
Seapoint22 (south-side); and
Killiney (south-side).
It should be noted however that these beaches have from year to year lost and regained their
blue flag status23.
Figure 1.9 DOLLYMOUNT STRAND, WITH POOLBEG POWER STATION IN
BACKGROUND
Source: Sarah777 (2007)24
Table 1.4 shows the reduction of faecal coliforms at key points in the bay over last 25 years. A
number of samples were taken for each period and summary statistics are presented.
19
http://www.blueflag.org/ 20
http://www.dublincity.ie/Press/PressReleases/PR2009/PressReleasesJune2009/Pages/Dublin'sDollymountStrandretainsBlueFlagAwardandGreenCoastAward.aspx. 21
http://www.independent.ie/national-news/top-beaches-fail-to-retain-blue-flag-despite-300m-investment-2220666.html 22
http://www.labour.ie/niamhbhreathnach/news/12018137651010311.html. 23
Dollymount strand lost its Blue Flag in 2011, based on water quality standards achieved in 2010, but we understand it is on course to regain the status in 2012, based on 2011 standards achieved. 24
Picture originally uploaded and released into the public domain by its author at en-wikipedia (http://en.wikipedia.org/wiki/File:IMGDollymountStrand_3649w.JPG).

17
Table 1.3 FAECAL COLIFORM READINGS DUBLIN BAY, 1986 - 2005
1986 1987-1988
2000 2003 2005
Sandymount/Merrion Strand Minimum 2 0 10 18 36
Median 92 141 60 364 119
Maximum 9,200 4,860 46,600 800 430
Bull Wall Minimum 220 40 10 18 18
Median 3300 1560 480 91 27
Maximum 18,000 24,080 100,000 1,800 270
Dollymount Strand Minimum 10 0 65 27 9
Median 127 230 234 96 23
Maximum 51,000 11,360 2,300 636 191
Source: Dublin City Council; Environmental Research Unity (1991)
It is clear that the maximum readings, and in most cases in the minimum and median readings,
have fallen dramatically since the plant opened in 2003.
However, since the plant opened it has operated above its original design capacity. It was
designed for a PE of 1.64 million (Table 1.1)25, but typically has been receiving and processing
volumes of approximately 1.9 million PE26.
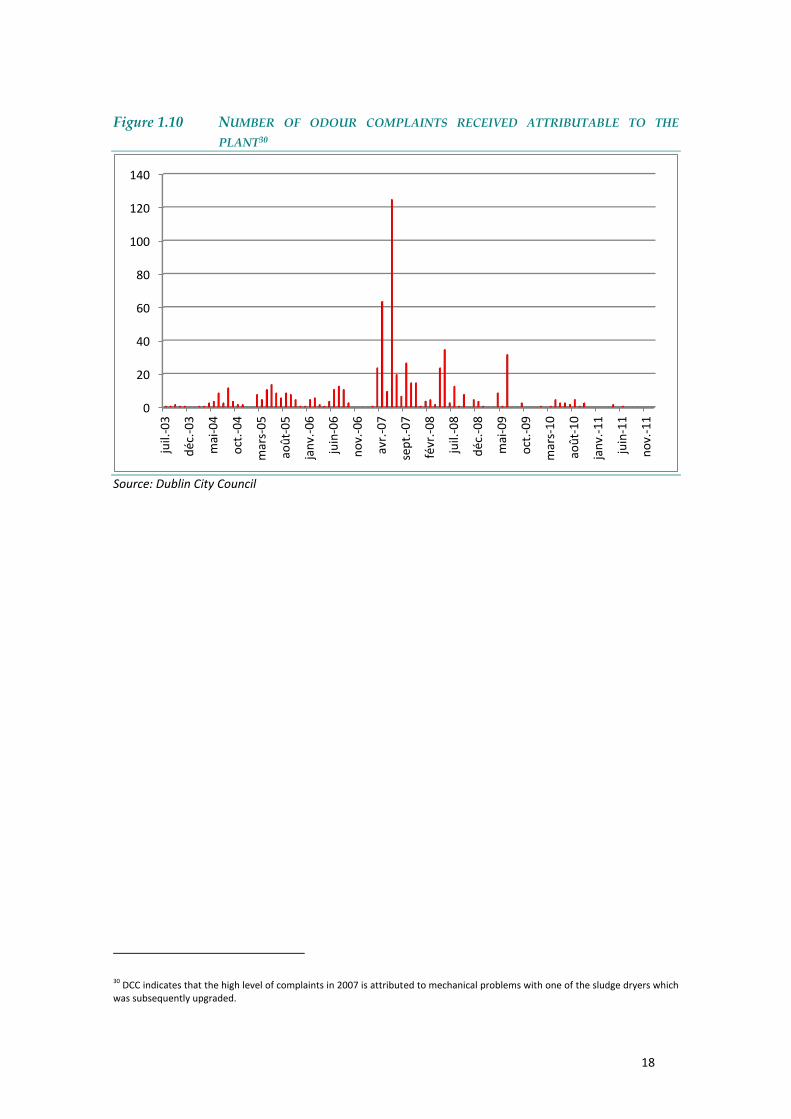
The operations of the plant have not been without problems. Apart from the over-loading of
the plant, there was a serious odour problem in the early years of operation27, which
particularly affected residents in the nearby Ringsend and Sandymount districts (Figure 1.1).
This required additional investments to confine the odour emissions within the plant. These
works were completed in November 200828 and resulted in a dramatic drop in complaints from
nearby residents (Figure 1.10). Plans are now underway to upgrade the capacity of the plant to
2.4 million PE to address the overloading29; this is expected to be operational by 2015.
25
The original design incorporated the ability to increase capacity to 2.4 million PE in the future. 26
“Ringsend sewage plant overall to cost EUR220m” http://www.irishtimes.com/newspaper/ireland/2011/1003/1224305144991.html. 27
See more detailed discussion later. 28
http://www.dublincity.ie/WATERWASTEENVIRONMENT/WASTEWATER/RINGSEND%20WASTE%20WATER%20TREATMENT/Pages/RingsendWasteWaterTreatment.aspx. 29
The up-graded capacity of the plant is sometimes quoted as 2.1 million PE. This refers to “firm capacity”, i.e. capacity when the single largest piece of plant in the works is not working. When all plant is working properly the facility will be capable of catering for 2.4 million PE when upgraded.
18
Figure 1.10 NUMBER OF ODOUR COMPLAINTS RECEIVED ATTRIBUTABLE TO THE
PLANT30
Source: Dublin City Council
30
DCC indicates that the high level of complaints in 2007 is attributed to mechanical problems with one of the sludge dryers which was subsequently upgraded.
0
20
40
60
80
100
120
140ju
il.-0
3
déc
.-0
3
mai
-04
oct
.-0
4
mar
s-0
5
aoû
t-0
5
jan
v.-0
6
juin
-06
no
v.-0
6
avr.
-07
sep
t.-0
7
févr
.-0
8
juil.
-08
déc
.-0
8
mai
-09
oct
.-0
9
mar
s-1
0
aoû
t-1
0
jan
v.-1
1
juin
-11
no
v.-1
1

19
Box 1.1 KEY METRICS AND CONCEPTS IN WASTEWATER TREATMENT31
BOD (Biochemical Oxygen Demand) and COD (Chemical Oxygen Demand) – Polluted water contains
both biodegradable and non-biodegradable polluting matter which will deplete oxygen levels in the
water thus making it uninhabitable for marine life. BOD measures the amount of dissolved oxygen
needed by aerobic biological organisms to break down the organic polluting matter in the water. COD
measures the oxygen depletion by both biodegradable and non-biodegradable polluting matter, and so
will typically be a higher number than BOD.
Testing for BOD is carried out by the BOD5 test by measuring the dissolved oxygen concentration before
and after the incubation of a sample at 20C for five days in the dark. Testing for COD is much quicker
(three hours) so is more useful as a quick indicator of the level of water pollution. The Environmental
Protection Agency (EPA) stipulates that after secondary treatment the water should have a BOD of no
higher than 25mg/l, and a COD of less than 125mg/l. The EPA indicates that typically before treatment
wastewater has a BOD of 100–300 mg/l, and a COD of 250–800 mg/l.
TSS (Total Suspended Solids) – This is the sum of organic and inorganic particulate matter in the water,
including sand, gravel, silt, human and other solid waste. The EPA indicates that polluted water has TSS
level of 100–350 mg/l and requires clean water to have a concentration of less than 35 mg/l.
Population equivalent (PE) – Wastewater comes from a number of sources, including domestic,
commercial and industrial. PE is the metric that allows comparison between the various sources,
converting them to a single equivalent number. Regulations (and Directive 91/271/EEC) define one
population equivalent as the load resulting in a BOD of 60g.
Daily organic load – A compound measure of the total volume of wastewater passing through a
treatment plant which takes into account both the volume and pollution concentration of the waste
water. It is defined as
Organic load (kg/day) = Daily flow (m3/day) x BOD (mg/l)
1,000
Faecal Coliforms – (for example E. Coli) Indicative of water contamination by sewage, and thus the
possibility of the presence of pathogenic bacteria and viruses. It is a key variable to gauge the threat
bathing waters are to human health. Typically unpolluted waters should show very low counts, but small
numbers may be present due to waste from birds and wild mammals. Densities in excess of 2000
organisms per 100ml would indicate an appreciable level of contamination32.
Eutrophication – enrichment of water by nutrients, typically nitrogen and phosphorous compounds,
causing accelerated algal growth which leads to oxygen depletion in the water to the detriment of other
water plant and animal life.
Source: Authors
The plant as designed (and as operated) is in compliance with the basic water quality
requirements of Directive 91/271/EEC. However, on foot of the regular reviews required under
the Directive, the Liffey Estuary was designated as a sensitive area in 2001, which means that
31
Unless otherwise indicated the source for the data in this table is http://www.epa.ie/downloads/advice/water/wastewater/EPA_water_%20treatment_manual_primary_secondary_tertiary1.pdf 32
Dublin Bay Water Quality Management Plan – Technical Report 5 – Water Quality Surveys (1991).

20
current discharges into Dublin Bay from the plant do not meet the required standards (full
tertiary treatment with nutrient removal). Because of the constraints on the site, it has been
concluded by DCC and their consultants CDM that the most feasible means of meeting the
terms of the Directive is to build a 9 km underwater tunnel from the plant to discharge the
treated wastewater beyond the sensitive waters area. A similar solution has been applied in a
number of cities around the world, including Barcelona, Boston, Lisbon, Miami and Sydney33.
The construction of this tunnel will be undertaken in conjunction with the works to expand the
plant’s capacity. The plant’s licence from the Environmental Protection Agency requires it to
meet the standards of Directive 91/271/EEC by 2015. It should be noted that these plans are
subject to the approval by the EPA of the Environmental Impact Statement, which is currently
in draft form.
DCC’s site engineer indicates that while the capital cost of the tunnel is higher than installing
nutrient removal on site, when operating costs are taken into account it is less expensive in the
long run. Full tertiary treatment would also increase the sludge output of the plant,
greenhouse gas emissions, chemical usage and energy usage34.
The decision to build a tunnel rather than a seabed pipeline is based on the need to avoid
delays and cost escalations in construction, as happened with the underwater pipeline from
the Sutton pumping station to the Ringsend plant, due to inter alia the discovery of a
shipwreck on the route. The need to minimise environmental damage to sea life was also a
consideration. According to the engineer, “there are hundreds of shipwrecks in Dublin Bay”.
The overloading of the plant has also had financial consequences for Dublin City Council, which
has had to pay additional fees to the operators of the plant, Celtic Anglian Water as
compensation for dealing with the extra load35. DCC also ended up having to pay for the bulk
of the works to deal with the odour problem.
33
http://www.dublincity.ie/WaterWasteEnvironment/WasteWater/RingsendWastewaterTreatmentWorksExtension/Documents/Dublin_Bay_Project_Brochure(Final_Phase).pdf 34
http://dublincity.ie/WaterWasteEnvironment/WasteWater/RingsendWastewaterTreatmentWorksExtension/Documents/Ringsend_FAQs%5b1%5d.pdf 35
http://www.rte.ie/news/2008/0630/waste.html

21
Figure 1.11 AREAS (IN YELLOW) TO BE USED ON THE CURRENT SITE FOR THE PLANT’S
PROPOSED CAPACITY EXPANSION
Source: Dublin City Council

22

23
2 ORIGIN AND HISTORY
2.1 CONTEXT FOR THE PROJECT
Until the early 1990s the treatment plant at Ringsend only offered primary treatment for
wastewater generated in its catchment area, which at that point comprised only the central
city area. The waste sludge generated at the plant was loaded onto ships and dumped in the
Irish Sea untreated. The original plant was constructed in 1906 and designed for a population
of 325,00036; it replaced the previous practice of directly discharging wastewater into the River
Liffey. However, outside of the catchment of the plant, wastewater was still discharged
untreated, into either the various rivers running through Dublin or into the sea at Dublin Bay.
As the city population rapidly expanded in the 1940s and 1950s, the central sewers of the city
became overloaded37. These pressures were relieved with the completion in 1958 of the North
Dublin Drainage Scheme38.
In 1975 the Dodder Valley sewer was built, collecting wastewater from the city’s southern
suburbs (including Dundrum, Templeogue and the rapidly expanding suburb of Tallaght) and
sending it to Ringsend for primary treatment. Previous to this, raw sewage from these districts
had been discharged to the Dodder River.
Sewage generated in the Northern and Dún Laoghaire areas was collected at outfall points on
the coast and discharged largely untreated into the Irish Sea (apart from some rudimentary
screening).
Pollution in Dublin Bay became an increasingly important issue of public debate in the 1980s39.
The quality of the water was the subject of much criticism40, including concerns that swimming
in the area could cause serious health problems such as gastroenteritis41. The polluted nature
of the bay was referred to in environmental debates in the Irish parliament, with specific
references to waste material washing up on beaches along the coast42.
36
http://www.greaterdublindrainage.com/history-of-dublin-drainage/. 37
Irish Times 20th
Many 1950 “Growth of Dublin causes alarm” http://www.irishtimes.com/newspaper/archive/1950/0520/Pg003.html.
Irish Times 15th
November 1952 “Housing sites difficulty met” http://www.irishtimes.com/newspaper/archive/1952/1115/Pg004.html.
Irish Times 9th
March 1955 “Minister outlines new draining scheme for Dublin” http://www.irishtimes.com/newspaper/archive/1955/0309/Pg007.html. 38
Dublin Corporation and McCarthy Acer Consultants Ltd (1993). 39
Irish Times 23rd
June 1988 “Flynn approves sewage pipeline for Dublin Bay” http://www.irishtimes.com/newspaper/archive/1988/0623/Pg009.html. 40
Irish Times 19th
January 1988 “Dublin Bay ‘safer than swimming pool’ http://www.irishtimes.com/newspaper/archive/1988/0119/Pg004.html . 41 Irish Times 20
th July 1984 “Dublin bay dump for a city’s rubbish”
http://www.irishtimes.com/newspaper/archive/1984/0720/Pg013.html. 42
http://historical-debates.oireachtas.ie/D/0395/D.0395.199002140093.html
http://debates.oireachtas.ie/dail/1986/05/06/00032.asp.

24
In general it was felt that Ireland as a whole complied reasonably well with the 1976 Bathing
Water Directive, but the Dublin was an exception43.
Review of the media of the time conveys a sense that the public authorities and Government
were failing to keep up with public opinion with regard to the environment. That said, it should
also be noted that a European survey at the time found “the Irish, once again least concerned
about environmental matters”44 (see also Figure 2.1).
Figure 2.1 AVERAGE WILLINGNESS TO TAKE ACTION TO PROTECT THE ENVIRONMENT
AS A FUNCTION OF PER CAPITA GDP, BY COUNTRY (1986)
Source: Europeans and their Environment (1986)
The general perception was that local authorities, who had primary responsibility to protect
Ireland’s environmental assets, lacked the capacity for the task45. Calls were made by senior
civil servants to establish a statutory authority to regulate environmental matters46.
43
Irish Times 26th
August 1988 “Clean bill of health this week for all beaches”
http://www.irishtimes.com/newspaper/archive/1988/0826/Pg006.html. 44
Irish Times 5th
May 1987 “Europe’s grubby relations”
http://www.irishtimes.com/newspaper/archive/1987/0505/Pg019.html. 45
See Callanan and Keogan (2003) page 266. Also see
Irish Times 18th
August 1986 “Councils unlikely to take over water pollution control”
http://www.irishtimes.com/newspaper/archive/1986/0818/Pg008.html. 46
Irish Times 23rd
January 1986 “New agency proposed to protect the environment”
http://www.irishtimes.com/newspaper/archive/1986/0123/Pg005.html.

25
In a bid to maintain pressure on the Department of the Environment (DOE)47 to deal with
discharges from the Ringsend plant, environmental groups attempted to show that sewage
from Ringsend was being deposited on Dollymount strand48.
Around this time, the bodies representing spatial planners in Ireland took the unusual step of
criticising the “inadequate” approach of the Minister of the Environment in implementing EU
Directives on Environmental Impact Assessments49.
The economic context at the time was also relevant. During the 1980s Ireland experienced a
severe recession and fiscal crisis. The State body at the time that conducted environmental
research and provided environmental information was An Foras Forbartha (AFF). But in the
late 1980s it was proposed to abolish this agency in the context of “a radical reduction in
(public) expenditure”50 51. AFF was absorbed into the Department of Environment, to form the
Environmental Research Unit (ERU), but crucially was not thereafter allowed to make its
research public without the consent of the DOE, thus effectively losing its independence52. This
move was understandably criticised by environmental groups.
In 1989 there was a general election in Ireland, and the dominant political party, Fíanna Fáil
(FF), was forced to form a coalition with a new smaller party the Progressive Democrats (PDs).
Here, it appears was the impetus to give environmental matters more consideration53. The
Joint Programme for Government promised the formation of an Environmental Protection
Agency (EPA) to enforce and monitor environmental standards and also to inform the public.
Ms Mary Harney, the new junior minister for the environment, was described thus in the
media:
“One thing that marks out Mary Harney from most of her predecessors in the Custom House is
her refusal to treat environmentalists as cranks or weirdos. When she talks about the “scandal”
of sewage in Dublin Bay, she sounds like one of them rather than a Minister charged with
responsibility to do something about it”.
47
Over the years this government department has undergone numerous name changes. Pre-1977 it was the “Department of Local Government”. In 1977 it was renamed the “Department of the Environment”, in 1997 it was renamed the “Department of the Environment and Local Government, in 2003 it was renamed the “Department of the Environment, Heritage and Local Government, and finally in 2011 it was renamed the “Department of the Environment, Community and Local Government”. 48
Irish Times 14th
November 1988 “Group to trace flow to sewage from Ringsend”
http://www.irishtimes.com/newspaper/archive/1988/1114/Pg011.html. 49
Irish Times 29th
July 1988 “Flynn action on EC order criticised by planners”
http://www.irishtimes.com/newspaper/archive/1988/0729/Pg008.html. 50
Irish Times 26th
October 1987 “’Liquidation’ of Foras Forbartha”
http://www.irishtimes.com/newspaper/archive/1987/1026/Pg010.html. 51
This period was characterised by harsh fiscal budgets to control the national debt, and the finance minister of the time, Mr Ray MacSharry, later to become EU Agriculture and Rural Development Commissioner, was popularly known as “Mac the Knife” for his severe fiscal cutbacks. 52
Irish Times 10th
September 1988 “Foras staff made to sign pledges on secrets Act”
http://www.irishtimes.com/newspaper/archive/1988/0910/Pg001.html. 53
Irish Times 13th
November 1989 “Watchdogs with real teeth – or white elephants?”
http://www.irishtimes.com/newspaper/archive/1989/1113/Pg015.html

26
Irish Times 13th November 198954
A major evolution in Irish Government thinking came with the publication of the
Environmental Action Programme in 1990, albeit largely in anticipation of policy changes at EU
level. Inter alia, this programme:
Acknowledged the significant increase in environmental awareness among the public;
Proposed to establish Enfo55, a public environmental information service;
Committed to ending the dumping of sewage sludge at sea by 1998, and to develop
alternative sludge treatments;
Committed to eliminating untreated sewage discharges at sea by 2000;
Committed to the construction of a new sewer in Dublin to eliminate sewage
discharges to the River Poddle;
Directed DCC to prepare plans for secondary treatment of sewage at Ringsend;
These developments were given extra momentum by the commitment of funding by the EU
for scientific studies into water quality in Dublin Bay56. Issues regarding the public availability
of information on drinking water quality were also emerging in media during this time57.
In 1991 a pumping station at Dún Laoghaire was completed which transferred untreated
sewage from the south eastern suburbs of the city to the Poolbeg plant via an underwater
pipeline across Dublin Bay58 59. At the same time interim works at Ringsend were carried out to
provide capacity to deal with this increased demand.
Notwithstanding growing public dissatisfaction with water quality, the key catalyst for change
was the Urban Wastewater Directive 91/271/EEC60, which made secondary treatment
mandatory for Dublin, and meant that the dumping of untreated sewage and primary sludge
into water bodies would be prohibited from 1998.
54
By contrast, the senior Minister for the Environment at the time, Mr Pádraig Flynn, in a TV interview, infamously described the environmental movement as “political queers”. A radio programme of the time satirised Mr Flynn’s conservatism in a sketch entitled “The Flynnstones”. 55
www.enfo.ie 56
Irish Times 6th
February 1990 “EC to help fund pollution protection in Dublin Bay”
http://www.irishtimes.com/newspaper/archive/1990/0206/Pg008.html 57
Irish Times 8th
February 1990 “Minister urged to act on aluminium in drinking water”
http://www.irishtimes.com/newspaper/archive/1990/0208/Pg009.html
Irish Times 9th
February 1990 “Department denies secrecy over water quality data”
http://www.irishtimes.com/newspaper/archive/1990/0209/Pg008.html 58
Irish Times 23rd
June 1988 “Flynn approves sewage pipeline for Dublin Bay” http://www.irishtimes.com/newspaper/archive/1988/0623/Pg009.html. 59
Subsequently an untreated outfall at Bullock Harbour slightly further south was also diverted to the Dún Laoghaire pumping station for eventual treatment at Ringsend. In 2008 the sewage outfall at Coliemore Harbour (PE 1,000) was similarly discontinued. http://www.erbd.ie/Reports/CR/Section7.pdf 60
http://eur-lex.europa.eu/LexUriServ/LexUriServ.do?uri=OJ:L:1991:135:0040:0052:EN:PDF.

27
Box 2.1 KEY ELEMENTS OF THE URBAN WASTEWATER DIRECTIVE 91/271/EEC The Directive61 sets out a number of scientific criteria and definitions for the treatment of Urban Wastewater and assigns responsibility in rather general terms to suit local procedures in each Member State.
One Population Equivalent (PE) is defined as the organic biodegradable load having a five-day Biochemical Oxygen Demand (BOD5) of 60g of oxygen per day.
Primary and secondary treatment is the minimum standard of treatment for all population agglomerations with a population greater than 10,000. Water quality discharges from plants must satisfy the following standards:
Parameter Concentration % Reduction from incoming load
BOD5 25 mg/l 70%-90%
Chemical Oxygen demand (COD) 125mg/l 75%
Total Suspended Solids (TSS) 35mg/l (optional) 90%
In addition to these requirements, Member States have the option to identify water bodies as “sensitive” to eutrophication from treatment plant discharges. Areas deemed sensitive must comply with the following standards62 (for PEs greater than 100,000).
Parameter Concentration % Reduction from incoming load
Total Phosphorus 1mg/l 80%
Total Nitrogen 10mg/l 70%-80%
Member States were given until 31st December 1993 to identify water bodies sensitive to eutrophication. These classifications were to be reviewed every four years thereafter. Once a sensitive classification is made by the national authorities they must ensure compliance with the additional standards within seven years.
Member States could also designate water bodies as “less sensitive”, thus requiring only primary treatment, but these had to be subject to regular review.
Source: Authors
Several environmental studies were underway during this time, most notably the Dublin Bay
Water Quality Management Plan (DBWQMP). Local opinion was generally favourable to the
plant upgrading to deal with pollution in the bay.
One issue, prominent in the media at this time63, was whether the proposed upgrade of the
plant should incorporate full tertiary treatment (i.e. nutrient removal). Environmental groups
were in favour of tertiary treatment, while the authorities favoured secondary treatment only.
A number of studies were conducted at the time to assess the “sensitivity” of the bay in terms
of Directive 91/271/EEC, including:
Technical Report 7 of the DBWQMP; and
61
http://eur-lex.europa.eu/LexUriServ/LexUriServ.do?uri=OJ:L:1991:135:0040:0052:EN:PDF 62
The technical interpretation of these standards was amended by directive 98/271/EEC. 63
Irish Times 11th
August 1992 “Sewage shortfall holds up north Dublin progress”
http://www.irishtimes.com/newspaper/archive/1992/0811/Pg007.html.

28
Wilson et al., (1993) “Particulate Nutrient Inputs and their role in Macro-algae
Development in Dublin Bay”.
They concluded that secondary treatment would be adequate for the bay, and would remove
sufficient nutrients to eliminate eutrophication, but acknowledged that this was subject to
review in the future.
The issue of what level of treatment was to be provided at the plant took on a further political
dimension as elected councillors in Dublin Corporation passed a motion in 1994 calling on the
Minister of the Environment to designate the Liffey estuary sensitive64. However, the
Corporation did not have the resources to upgrade the plant, and was dependent on the
Department (and the EU) to fund investments, so the DOE effectively had the power to decide
the level of treatment to be adopted65.
At the same time it emerged that the Corporation intended to discontinue plans for a separate
treatment plant at Baldoyle, and instead to transfer wastewater from the north of the city to
Ringsend for treatment (see further discussion below). This increased local resentments in
Ringsend and Sandymount. According to the councillors, this strengthened need for tertiary
treatment, as increased levels of discharge by the addition of the north Dublin catchment
would “destroy” the local amenity of Sandymount Strand, as well as damaging Bull Island and
the inner bay66.
When Directive 91/271/EEC was incorporated into Irish law in December 199467, ten water
bodies were deemed “sensitive”, comprising a mix of lakes and rivers (including a portion of
the river Liffey), but no estuaries. The omission of the Liffey estuary was again criticised in the
media68.
Our search of the archives at the DECLG indicates that uncertainty surrounding the scientific
evidence regarding the causes of eutrophication in the bay, combined with a desire to spend
EU funds wisely and in a timely fashion, was the key logic behind the decision not to designate
the Liffey estuary as sensitive in 1994. Extracts from an internal communication69 at the
department are indicative:
“All available evidence and studies point to the association between particulate nitrogen and
macroalgal growth. As a consequence, the most effective strategy would be to achieve a
reduction in the average particulate nitrogen load entering the Bay through the provision of
secondary treatment.”
64
Irish Times 27th
June 1994 “Councillors cite EU in demand for sewage plan”
http://www.irishtimes.com/newspaper/archive/1994/0627/Pg002.html. 65
The matter was raised in parliament when the original plant up-grade was being debated, in the mid-1990s http://debates.oireachtas.ie/dail/1995/02/02/00012.asp. 66
Irish Times 27th
June 1994 Op. Cit.. 67
http://www.irishstatutebook.ie/1994/en/si/0419.html. 68
Irish Times 28th
December 1994 “Sewage treatment designations criticised”
http://www.irishtimes.com/newspaper/archive/1994/1228/Pg003.html. 69
“Sewage Treatment Requirements for Dublin” note addressed to Dr. T. Collins, special advisor to the Minister for the Environment from F. Gallagher, Water Quality Section 18
th January 1995. Reproduced with permission.

29
“Apart from the water quality considerations outlined above, the financial implications in
providing treatment facilities in Ringsend should also be borne in mind.”
“The estimated cost of the Dublin facilities at a minimum of £250 million70 must be seen in the
context of the total cost of meeting the requirements of the Directives and limitations on the
future availability of funds. The current estimated cost to end 2005 of implementing the
Directive is £1.15 billion.”
“Apart from the need to develop an alternative to dumping sewage sludge in Dublin Bay by end
1998 (estimated cost £30 million) and the need to provide for more stringent than secondary
treatment in respect of the recently designated 10 sensitive areas (estimated cost £52 million),
the most critical deadline for us from the point of view of implementing the requirements of the
Directive is end 2000.”
“The above requirements must be viewed in the context of future provision for expenditure of
sewerage services. Under the National Development Plan expenditure on these services
between 1994 and 1999 is projected at £335 million. This is clearly a long way short of
requirements and provides a focus for consideration of demands for costlier solutions to
treatment requirements where serious evidence of need has not been established.”
In the early 1990s, planning commenced for upgrading to secondary treatment at Ringsend. In
1993 Dublin Corporation71 with consultant engineers McCarthy Acer Consultants Ltd (MACL)
published the Ringsend Sewage Treatment Works Expansion – Preliminary report. Population
and wastewater projections were generated to the year 2040, based on Census data from
1991. The report outlined the next steps needed in the project’s lifecycle, as follows:
Completion of the Environmental Impact Statement;
Arrangement of funding;
Procurement of site and land reclamation works72; and
Commencement of detailed designs.
At the same time plans were drawn up to deal with north Dublin’s wastewater (then being
discharged largely untreated from the nose of Howth), in the context of Directive 91/271/EEC.
In September 1994 Dublin Corporation with MC O’ Sullivan & Co. Ltd Consulting Engineers
(MCOS) published the North Dublin Drainage Scheme Catchment Area Study – Preliminary
Report.
A range of options was considered, from a separate secondary treatment plant to be built at
Baldoyle, a greenbelt area in the north of the city, to an underwater pipeline to the Ringsend
70
Fixed exchange rate is IR£1 = EUR 1.27. 71
Changed to Dublin City Council (DCC) in 2001 http://www.dublincity.ie/YOURCOUNCIL/ABOUTTHECOUNCIL/Pages/DublinCityCouncilHistory.aspx. 72
At that time part of the proposed site was actually in the sea.

30
plant via a pumping station at Sutton that would take all of the wastewater from the north of
the city. A number of intermediate options foresaw a treatment plant at Baldoyle combined
with some piping of wastewater to the Ringsend plant, but were dismissed on financial
grounds. The report did not make a recommendation as between the two main options – a
separate plant at Baldoyle or expansion of Ringsend to accommodate the wastewater from the
entire Dublin catchment.
Newspaper articles at the time73 74 75 reported that local residents and councillors at Baldoyle
were not willing to accept the plant because a flooding problem in the area over the previous
thirty years had never been addressed, and also because of a desire for the area to remain
undeveloped (it was zoned greenbelt).
Considering the capital costs of the options outlined in the 1994 Preliminary Report, the
Baldoyle option had the lowest capital cost. However, when Dublin Corporation and MACL
published the Ringsend Wastewater Treatment Plant Works Expansion – Supplementary
Report (1995), a single plant at Ringsend was the only treatment option considered.
The EIS of the project lists a number of reasons for the rejection of the option of a separate
plant at Baldoyle, namely76:
Additional pipework necessary for the Baldoyle option.
Stormwater overflows would discharge into Sutton Creek.
Negative landscape impacts due to the elevation of the proposed site.
The sludge generated at Baldoyle would have to either be treated separately or
piped to Ringsend for additional treatment, thus incurring additional operational
costs.
A second large-scale high technology plant in Dublin would result in higher overall
operating costs.
Perhaps most tellingly, the EIS indicates:
“A single works can be planned at Ringsend and procured in the site of the existing works,
within the timetable set down in the EU Wastewater Directive and S.I. 419. A second works at
Baldoyle would involve a major planning process. Including site acquisition planning approval
on lands zoned agricultural. This process would have a higher risk of failure to satisfy the
deadline.”
73
Irish Times 31st
July 1993 “Baldoyle seen as likely site for new £32 m sewage treatment works” http://www.irishtimes.com/newspaper/archive/1993/0731/Pg004.html. 74
Sunday Business Post 2nd
May 1993 “Sewage farm may be for Baldoyle”. 75
Irish Independent 3rd
May 1993 “Council may want green belt site for sewage plan”. 76
Drawn from an internal DECLG report on the Environmental Impact Assessment of the Ringsend Treatment Works.

31
It is also worth noting that, when in 1997 the Environmental Impact Statement (EIS) was
approved for the plant by the Minister for the Environment, it was stipulated that the design
and layout of the plant should allow for denitrification facilities to be installed if it was later
proved necessary (i.e. that further research would show that the Liffey Estuary was sensitive to
eutrophication).
DCC personal indicate that allowances were made in the SBRs to have de-nitrification facilities
installed as a contingency for the Liffey being deemed sensitive. However, this would reduce
the capacity of the works.
A further relevant development was that in 1994 the Irish Government designated a
substantial section of Sandymount Strand, close to the site to be reclaimed, as a Special
Protection Area (SPA) in accordance with the EU Birds Directive 79/409/EEC77. The 1995
Supplementary Report states that:
“Because of anticipated consequent difficulties in obtaining permission to use this site, DC
(Dublin Corporation) decided to assess the feasibility of using only the existing Ringsend STW
(sewage treatment works) site for a compact secondary treatment works. This solution was
found to be feasible and DC then commissioned the SR (supplementary report) on the basis
that this existing site would accommodate the complete proposed works”. (p.5/6).
Interviews with DECLG technical staff indicate that a “market testing” exercise was
undertaken, whereby leading international firms in the sector were asked to confirm that the
required treatment plant could be built on the site, and all those consulted agreed that it was
feasible. Interestingly, the DECLG interviewee added that:
“It (building a single plant on the Ringsend site) was only feasible using Design-Build-Operate.
Traditional design is inherently conservative. A traditional design would never have been put
on that site.” 78
The decision to proceed with the single plant option had a number of design consequences,
including:
The Sequence Batch Reactors (SBRs), where waste water is subjected to secondary
(bacteriological) treatment, were built in two storeys to save space (see Figure 2.2).
An important consequence of up-grading from primary to secondary wastewater
treatment is that it leads to a significant increase in the volume of sludge generated. In
77
http://www.irishstatutebook.ie/1994/en/si/0059.html
The “Birds Directive” has subsequently been replaced by 2009/147/EC 78
Design-Build-Operate or DBO is a type of Public Private Partnership (PPP), whereby the public authority appoints a concessionaire to Design, Build and Operate a piece of infrastructure. The concessionaire is free to design the plant as they see fit, to deliver an agreed outcome. The concessionaire then builds the plant according to this design and operates the plant for a set period of time (typically 20-25 years), at the end of which the plant is transferred back to the public authority. Ownership remains with the local authority throughout. Under traditional procurement the public authority (the “employer”) designs the plant and employs a contractor to build it according to the employer’s specification. Upon completion the public authority takes over the operation of the plant.

32
addition, the dumping of untreated sludge was to be discontinued. A key issue in the
plant’s design therefore was how sludge was to be processed and disposed of. As a
result, it was decided to adopt the CAMBI thermal hydrolysis process79, which subjects
the sludge to temperatures of 265°C and 10 bar of pressure, and facilitates subsequent
anaerobic digestion. This was novel technology however, and had never before been
used on such as scale. To quote the Fehily (2008) in his review of the plant:
“This process is relatively new, and the Dublin plant was the biggest plant of its kind to be built
anywhere in the world. The first Cambi plant was built in Norway in 1996 and had only one-
tenth the capacity of the Dublin plant.” (p.54)
Figure 2.2 FIRST AND SECOND STOREY SEQUENCE BATCH REACTORS, RINGSEND
WASTE WATER TREATMENT PLANT
Source: DKM tour of plant
Other consequences flowed from this decision, which had impacts subsequent to the
commissioning of the plant, as are discussed later.
As indicated, it was decided to procure the plant using the Design-Build-Operate (DBO) format
in view of the complexities and site characteristics, and a 25-year concession was offered. The
contact was awarded to ABA consortium, comprising:
Ascon (construction firm)80,
Black & Veatch (plant designers and suppliers)81 and
Anglian Water International82,
79
For background on the CAMBI process, see http://www.cambi.no/wip4/ ,
http://www.seai.ie/Archive1/Files_Misc/JaneBickerstaffeCelticAnglianWater.pdf, and
http://www.cambi.no/photoalbum/view2/P3NpemU9b3JnJmlkPTIxOTg3NiZ0eXBlPTE. 80
Now BAM Contractors (http://www.asconrohcon.com/live/index.html). 81
http://www.bv.com/. 82
http://www.anglianwater.co.uk/.

33
Anglian now operates the plant via Celtic Anglian Water (CAW)83, a 50:50 joint venture with
National Toll Roads84.
Construction commenced in 1998 and the upgraded plant opened in 2003.
Box 2.2 KEY EVENTS IN DEVELOPMENT OF THE DUBLIN REGION’S
WASTEWATER TREATMENT INFRASTRUCTURE 1881 – Rathmines and Pembroke Scheme – Drainage for wastewater from south east Dublin completed.
1906 – Opening of Ringsend Primary Treatment Plant.
1958 – North Dublin Drainage Scheme – interceptor sewers built to discharge raw sewage off the Nose of Howth.
1975 – Dodder Valley Drainage Scheme – diverting sewage from Dundrum, Templeogue and Tallaght to Ringsend plant, previously discharged untreated to the River Dodder.
1982 – Grand Canal Scheme. Connected the Blanchardstown sub-catchment area to Dublin’s Central catchment area.
1986 – Completion of drainage works for Tallaght, Lucan, Clondalkin and Blanchardstown areas to Ringsend for primary treatment. Rathmines and Pembroke areas also connected to treatment works at Ringsend; previously raw sewage from these areas was discharged into Dublin Bay.
1990 – Irish government publishes Environmental Action Programme, a comprehensive programme to deal with management of the environment, contains the provision to ban the dumping of raw sewage in Irish coastal waters in major urban areas by the year 2000, in line with Directive 91/271/EEC.
1993 – Dun Laoghaire Main Drainage Scheme – pumping station and underwater pipeline to Ringsend treatment plant.
1992 – Dublin Bay Water Quality Management Plan published by Dublin local authorities.
1997 – Environmental Impact Statement choosing the single option of treating all of Dublin’s wastewater is approved by the Minister of the Environment
2001 – Completion of underwater pipeline from Sutton (North Dublin) to Ringsend.
2001 – EPA publishes “An Assessment of the Trophic Status of Estuaries and Bays in Ireland”, recommending that the Liffey Estuary is “sensitive” to eutrophication
2003 – Opening of new Ringsend wastewater treatment plant.
Source: Authors
2.2 KEY STAKEHOLDERS AND MANAGEMENT STRUCTURES
A schematic of the key stakeholders involved in the delivery of the new infrastructure is set out
in Figure 2.3. Institutional and management structures evolved over the timeframe of the
project, and this is reflected in the diagram. The main stakeholders and their roles are
discussed below.
The EU Commission with the Irish Government are the providers and controllers of funding, via
the Department of Finance. The next level is the Department of the Environment, Community
and Local Government (DECLG), which was jointly in charge of delivery of the Operational
Programmes with other Government Departments.
At the next level are the Local Authorities, who are the water drainage authorities in Ireland
(as well as the planning authorities), and are responsible for providing and maintaining all 83
http://www.caw.ie/. 84
http://www.nationaltollroads.ie/.

34
drainage infrastructure within their territories. The relevant Local Authorities were Dublin
Corporation (later Dublin City Council) and Dublin County Council (which in 1994 was split into
Fingal, Dún Laoghaire-Rathdown and South Dublin County Councils), and Meath and Kildare
County Councils.
Figure 2.3 CHART OF STAKEHOLDERS
Key: Contractual Relationships Provides licenses for the discharge of waste material, enforces and monitors those licenses Provides judicial recourse in planning process Provides judicial oversight in planning process Disperses funds, provides policy guidance Principal stakeholders in planning approval process Informs public on environmental issues, allows input in license approvals Writes EU wide national directives to be transposed into Irish Law Transposes EU directives into Irish Law Elects councilors, accepts lobbying
Source: Authors
Statutory responsibility for water management and protection rests primarily with local
authorities. The Water Pollution Acts, 1977 and 1990 and regulations made thereunder,
including regulations giving effect to EU Directives, constitute the main national legislation in
this regard. However, as local authorities have limited tax-raising powers, they must invariably
secure funding from central government for capital investment in waste water (and other)
infrastructure.
Environmental NGOs
Supreme Court
High Court
Planning Appeals Board
EU Commission
Environmental Protection
Agency
(Founded 1992)
Irish Government
Department of Finance
Department of the Environment, Community and
Local Government
Other Local Authorities
Dublin City Council
ABA Consortium
Celtic Anglican
WaterLocal
ResidentsRecreational Users of Bay
35
Since the majority of funding for the local authorities is sourced from central government via
the DECLG, the department has major leverage over the actions of the local authorities. It is
divided into a number of policy sections:
It forms and implements national policy on wastewater treatment for Ireland.
It prioritises schemes for investment, allocates central government funding for those
schemes to the local authorities and secures the funding from Irish government and
EU sources.
Civil servants (including engineering inspectors) form steering committees with the
local authorities during the project’s implementation.
Department personnel thus have had significant knowledge and influence over the project’s
evolution, even though they were not ultimately responsible for its implementation. The
Minister for the Environment also has large significant influence over how EU Directives are
applied.
During the implementation of the Cohesion Fund programme, these government, local
authority and EU stakeholders met every six months to review and assess the progress made
on the various infrastructure projects approved for EU funding.
The Environmental Protection Agency (EPA) is the regulator charged with maintaining water
quality standards (and other environmental standards) as set out in Irish Law. It was
established in 1993 by the Environmental Protection Agency Act, 199285. Under section 61 of
the Act, the EPA is required to report biennially on the quality of effluents being discharged
from treatment plants controlled by local authorities. The report is based on data collected
and submitted by local authorities and audited by the EPA. Since 200786, local authorities must
apply for an emitting license to the EPA in order to establish wastewater treatment facilities.
Standards to be met are set out in the license, and the agency has responsibility to monitor
and enforce these standards.
During the application for the license, the public is free to view the license application
documentation and make their submissions regarding license approval87.
Local residents are a key stakeholder group. Ringsend/Irishtown has historically been a
working class district of the inner city. During Ireland’s Celtic Tiger period (Box 2.3) the area
and the nearby Docklands experienced major urban renewal. The Dublin docklands until the
late 1980s was a rundown and under-utilised area of the city.
The Irish Government’s decision to locate the International Financial Services Centre (IFSC)88 at
the western end of the Docklands, and the establishment of the Dublin Docklands
85
http://www.irishstatutebook.ie/1992/en/act/pub/0007/print.html 86
http://www.attorneygeneral.ie/esi/2007/B25648.pdf 87
http://www.epa.ie/whatwedo/licensing/wwda/ 88
Dublin’s financial district where many international banks have offices

36
Development Authority (DDDA) subsequently led to its rapid development in the 1990s,
including significant new work and living space. More recently a number of technology
multinationals, such as Google and Facebook, have located their European headquarters in the
Ringsend district. Consequently there has been some gentrification of the area, but
Ringsend/Irishtown has still maintained its traditional close-knit community. To the south is
the historically more affluent Sandymount neighbourhood.
Box 2.3 RELEVANT EU DIRECTIVES FOR DUBLIN WASTEWATER TREATMENT
1975 –Directive 76/160/EEC – Bathing Water Directive – Sets water quality standards for bathing areas in member states designated by national authorities.
1976 – Directive 76/464/EEC – Water Pollution by Discharges of Certain Dangerous Substances – gives directions regarding pollution caused by certain dangerous substances discharged into the aquatic environment.
1979 – Directive 79/923/EEC – The Shellfish Directive – sets water quality standards for areas designated by the national authorities for the purpose of farming shellfish.
1979 –Directive 79/409/EEC – The Birds Directive. Designed to protect the habitat and populations of wild birds. The Directive lists wild bird species whose habitats must be protected under the Directive. Member states are required to designate Special Protection Areas (SPAs) where these species populations can be maintained. This directive has been updated several times. The latest version is 2009/147/EEC.
1985 –Directive 85/337/EEC – Sets procedure for completion of EIA1991 - Directive 91/271/EEC – Urban Waste Water Directive, prohibited the dumping of raw sewage in coastal waters by 1998.
2000 –Directive 2000/60/EC89 – Water Framework Directive- requires national governments to take a new holistic approach to managing their waters. It applies to rivers, lakes, groundwater, estuaries and coastal waters. It directs that all waters by 2015 must be of good quality (as defined in the Directive) and that there is no deterioration in standards.
2006 – Directive 2006/113/EEC90 - Repealing original Shellfish Directive 79/923/EEC so as to codify changes motivated by Directive 91/692/EEC, concerning standardizing reporting methods across the EU
2006 – Directive 2006/7/EC – New Bathing Directive repealing 76/160/EEC. Defines new categories of bathing water quality which are much stricter than those standards set out in the old directive
Source: Authors
The courts influence developments in infrastructure through the procedure of judicial review.
Both in the planning stage of infrastructure, where the local authorities, the Planning Appeals
Board (ABP) and local residents are the main stakeholders, and when the EPA issues licenses
for pollution control, stakeholders have recourse to challenge the decisions of the EPA or ABP
in the courts. The domain of this challenge is only in regards to the legality of the decision, i.e.
whether the correct statutory procedures were followed by the authorities. If the courts
decide that the correct statutory procedures were not followed they can overturn decisions
made by ABP or the EPA.
Other stakeholders include:
89
http://eur-lex.europa.eu/LexUriServ/LexUriServ.do?uri=OJ:L:2000:327:0001:0072:EN:PDF 90
http://eur-lex.europa.eu/LexUriServ/LexUriServ.do?uri=OJ:L:2006:376:0014:0020:EN:PDF

37
Domestic, commercial and industrial customers of the plant (industrial customers
contributed EUR 44 million [current prices VAT inclusive] to the initial capital cost of
the plant);
Plant operators CAW; and
Amenity users of Dublin Bay, and other citizens who gain benefit from the improved
environmental status of the bay without being users.
Box 2.4 IRISH LEGISLATION RELEVANT TO DUBLIN WASTEWATER
TREATMENT
1977 - 1990- Local Government (Water Pollution) Acts - empowers local authorities to issue permits to companies for the discharge of industrial effluent into sewers or waters91. The decision of the local authority may be appealed to the local authority and then to The Planning Appeals Board (ABP). These regulations do not apply to sewage treatment plants operated by local authorities.
1988 –Statutory Instrument (S.I.) No. 84/1988, giving effect to the Directive 76/160/EEC, and designating Burrow Beach, Killiney, Portmarnock and Dollymount strand as bathing areas92.
1989 – Statutory Instrument No. 349/1989 –Giving effect to EC Directive 85/337/EEC.
1992 - Quality of Bathing Waters Regulations, 1992 (S.I. 155 of 1992) – updating SI 84/1988 and adding Seapoint to the list of designated bathing areas.
1992 – Environmental Protection Agency Act93 – empowers the Minister of the Environment to make regulations, and establishes the Environmental Protection Agency (EPA)94 to enforce standards for the management of sewage treatment plants. A major innovation of these acts was the establishment of Integrated Pollution Control Licenses (IPCs), covering facilities involved a range of “scheduled” activities95. Thus the EPA took over responsibility from the local authorities for large facilities such as Guinness Brewery. These licenses were enhanced in later Irish legislation (Protection of the Environment Act 200396) in response to EU Directive 96/61/EC97 to become Integrated Pollution Prevention Control (IPPC) licenses. It should be noted that the local authorities still issue the majority of licenses for discharges into sewers, covering activities other than the “scheduled” list.
1994 – Statutory Instrument No. 200/1994 – Irish Legislation implementing the Shellfish Directive, designated shellfish areas are mostly in the west of Ireland.
1998 – Irish Government implements Water Quality Standards for Phosphorous Regulations98 - Implements elements of EC Directive 76/464/EEC regarding pollution by phosphorus.
1998 – SI No 177/1998 – Further amendments to list of designated bathing areas, adding Merrion Strand and Sandymount Strand to the designated list of bathing areas.
2001 – Urban Wastewater Treatment Regulations (SI No. 254/2001) – Designated the Liffey Estuary as a body “sensitive” to eutrophication as defined in the UWWTD.
2003 – European Communities (Water Policy) Regulations (SI 722/200399) – Incorporating the Water Framework Directive into Irish Law. Where river basins encompass multiple local authorities, particular
91
http://www.envirocentre.ie/includes/documents/BPGEffluentlicence.pdf. 92
http://www.irishstatutebook.ie/1988/en/si/0084.html. 93
http://www.irishstatutebook.ie/1992/en/act/pub/0007/index.html. 94
http://www.irishstatutebook.ie/1992/en/act/pub/0007/index.html. 95
http://www.epa.ie/whatwedo/licensing/ippc/whoneedsalicence/ 96
http://www.irishstatutebook.ie/pdf/2003/EN.ACT.2003.0027.pdf 97
The Integrated Pollution Prevention and Control Directive
http://eur-lex.europa.eu/LexUriServ/LexUriServ.do?uri=OJ:L:1996:257:0026:0040:EN:PDF, the updated form is
2008/1/EC
http://eur-lex.europa.eu/LexUriServ/LexUriServ.do?uri=OJ:L:2008:024:0008:0029:EN:PDF 98
http://www.irishstatutebook.ie/1998/en/si/0258.html. 99
http://www.irishstatutebook.ie/2003/en/si/0722.html.

38
local authorities are designated to co-ordinate management the basins. Seven river basins were defined on the island of Ireland by the EPA. For each river basin, local authorities whose borders partially or wholly encompass the basin boundaries had to submit a management plan to the Minister for the Environment for that particular basin. The EPA is required to co-ordinate and collate information at a national and international level (for submission to the EU Commission), and monitor the efforts of the local authorities. The Minister for the Environment and the EPA must co-ordinate efforts between Irish and the relevant UK authorities for those river basins which cross the Irish border.
2006 – Statutory Instrument No. 268/2006 – Update of Irish legislation on the Shellfish Directive. National bodies are specified to assist the Minister of the Environment in enforcing the Shellfish Directive. Four additions (none in the Dublin area) are made to the list of designated shellfish areas.
2007 – Waste Water Discharge (Authorisation) Regulations100 (SI 684/2007) – Requiring local authorities to obtain a license for wastewater treatment plants operated by them or their contractors.
2008 – New Bathing Water Regulations (SI 79/2008101) – incorporating Directive 2006/7/EC into Irish Law.
2009 – Statutory Instruments No.s 55 and 464 of 2009 – Implementing the new EU Shellfish Directive
2006/113/EEC. Significant additions are made to the list of designated shellfish areas, including some in north county Dublin (Malahide, Balbriggan/Skerries), but no designations are made for Dublin Bay.
Source: Authors
Figure 2.4 BEACHES IN THE DUBLIN BAY AREA
Source: Authors’ elaboration based on a NASA radar image102
100
http://www.environ.ie/en/Legislation/Environment/Water/FileDownLoad,16869,en.pdf 101
http://www.environ.ie/en/Legislation/Environment/Water/FileDownLoad,16953,en.pdf. 102
http://visibleearth.nasa.gov/useterms.php and http://www.archive.org/details/nasa.
BurrowBeach, sutton
Postmarnok
DollymountStrand
Wastewater treatment plant
Sandymount Strand
Merrion Strand
Seapoint
Killney

39
Figure 2.5 QUALITY OF BEACHES ACCORDING TO EU BATHING WATER DIRECTIVE
Source: European Environment Agency
Box 2.5 THE “CELTIC TIGER”
From 1994 to 2000 Ireland went through a period of exceptional growth, rarely seen in the developed world. During this period it was the fastest growing economy in the OECD, with average GNP growth per annum of over 8% (McAleese, 2000) and GDP growing at over 9% per annum (Figure 1.5). In terms of GNP per capita, Ireland went from less than 60% of the EU average in the late Eighties to converge with the average by the early 2000s. At the peak (2007) GDP per capita in Ireland was 148% of the EU27 average (Eurostat, 2011).
The economy was transformed during this period, with unemployment falling from 15.7% in 1993 to trough at 3.7% as of Mid-2001, while the national debt fell from 118% of GDP in 1987 to 39% by the end of 2000 (Figure 2.6). This remarkable performance is in stark contrast to the previous experience of the Irish economy, when it had been a notable laggard (Lee, 1989).
The reasons for this turnaround have been widely debated, but there is consensus around a number of factors, which can be summarised as follows:
a) By the late 1980s, Ireland was slowly emerging from a major fiscal crisis, which had seen public debt rise above 100% of GDP, despite increasing tax rates and falling public investment (McCarthy, 2009) and the return of large-scale emigration which had not been experienced since the 1950s (Figure 2.7). The crisis had only been halted by painful fiscal retrenchment, introduced by a minority Government but made possible by broad political and social consensus on the remedies required. This consensus included a process that became known as “social partnership”, involving the State, trade unions and employers’ representatives, which traded tax reductions for pay restraint. It was a watershed moment in the history of the Irish State, and triggered a significant turnaround in the fortunes of the economy (often held forth as an example of an “expansionary fiscal contraction”, Considine and Duffy, 2007).
b) A large amount of underutilised labour resources, as evidenced by the unemployment rate. The unemployment statistics actually understate the position, as the large number of Irish workers who emigrated during the 1980s started to return during the 1990s when the economy improved (Figure 2.7). For a long time this gave the economy the capacity to expand rapidly without increasing general inflation (Figure 2.8), although asset price inflation did begin in the 1990s.
c) The improving quality of that labour force, following the introduction of free secondary education in 1967 and the increasing numbers attending third level education.
d) The EU Structural and Cohesion Funds from the late 1980s onwards, which facilitated the implementation of infrastructure investment plans that had been on hold since the 1960s, thus freeing up constraints on the physical capital side. The funds themselves also had a direct economic impact, particularly during the 1990s. Between these two effects it is estimated the EU funding added approximately 2% to the level of GDP during the 1990s (Honohan, 1997, Walsh, 2000).
e) Globalisation, and the rapid expansion of US multi-nationals internationally during the 1990s. Labour availability, English language and Ireland’s low corporate tax rate proved attractive to
Year 91 92 93 94 95 96 97 98 99 00 01 02 03 04 05 06 07 08 09 10
Portmarnock Burrow Beach,
Sutton
Dollymount Strand
Sandymount Strand
Merrion Strand
Seapoint
Killiney
KEY: BLUE = meets mandatory and guide values GREEN = meets mandatory values
RED = does not meet mandatory values BLANK = no data

40
these firms. During the 1990s Ireland captured a disproportionately high share of US foreign direct investment (Murphy, 2000).
f) The Northern Ireland peace process improved the international image of the entire island, and freed up resources that had previously been devoted to security.
g) Small size was a factor also, in the context of an increasingly globalised economic system. “An increase in a small share of a large number can make a huge difference to a small country” (McAleese, 2000).
Source: Authors
Figure 2.6 IRELAND GOVERNMENT DEBT TO GDP RATIO, 1980 TO 2011
Source: CSO
Figure 2.7 NET MIGRATION IRELAND 1987-2010 (‘000S)
Source: CSO

41
Figure 2.8 CPI INFLATION 1990-2011 (%)
Source: CSO
2.3 MAIN DEVELOPMENTS SINCE COMPLETION
The plant officially opened in September 2003 (although it had been in operation since June of
that year), initially to a positive reception in the media. In a newspaper article of the time it
was claimed that103:
Nearby beaches had already achieved standards close to Blue Flag.
The smaller Tolka and Santry rivers in the north of the city had seen their water quality
improve as a result of the plant.
The opening of the north interconnector sewer would also make available more
serviced land to accommodate development (planning permission had recently been
granted for approximately 14,000 houses in the northern and central parts of the city).
Environmental impacts have generally been positive since the opening of the plant. In the
years subsequent to the plant’s opening there has been an improvement in the quality of
water at the principle beaches in Dublin bay, notably Dollymount strand, Merrion strand and
Sandymount strand (Figures 2.4 and 2.5).
The plant also produces 40% of its own energy needs through the production of biogas, and
the remaining by-product is spread on agricultural land as fertiliser.
It should be noted that Dublin Corporation and MACL (1993) indicated that the treatment
works would only have the potential to improve bathing water quality at Dollymount strand. In
this context, a number of other initiatives may have had positive impacts on the environmental
103
Irish Times 9th
September 2003 “Dublin beaches ‘now meet Blue Flag standards’”
http://www.irishtimes.com/newspaper/archive/2003/0909/Pg005.html
Irish Independent 8th
September 2003 “Massive sewerage projects flushes into action”
http://www.independent.ie/national-news/massive-sewerage-project-flushes-into-action-203933.html
42
quality of the rivers following through Dublin and of Dublin Bay, not least the Upper104 and
Lower105 Liffey Valley Regional Sewerage Schemes, which serve a number of towns and major
industries upriver of Dublin city. These investments were also instigated on foot of the Urban
Waste Water Directive, and benefited from significant EU assistance106.
However the operating of the plant since then has been beset by a number of significant
problems, most notably related to (1) capacity and (2) odour. These are discussed in detail
below.
2.3.1 Capacity Problems From day one of operations, it was clear that the plant had inadequate capacity. Design
capacity, forecast to be reached in 2020, was 1.64 million PE. However, in 2003 the plant
received a load of 1.85 million PE, and the annual load since has ranged between 1.8 million
and 1.95 million PE. This is a remarkable situation, and numerous reasons have been put
forward by various commentators, including the Celtic Tiger boom, rigidities in the DBO
contract may have constrained the scope for change to reflect increasing demand107, and a
failure by industry to reduce pollution load in response to the introduction of charging108.
Fehily (2008) undertook a comprehensive review of the operations of the plant on behalf of
the Minister for the Environment, concentrating on the capacity and odour problems. With
respect to the former, he concluded:
In fact, industry did reduce its pollution load in line with expectations.
Likewise, population growth in Dublin per the Census was in line with expectations,
although he does highlight that some commentators claimed that there was a
significant problem of “unaccounted for persons” in the Censuses of the time.
However, the impact of commuters (reflective of urban sprawl), and day tourism were
under-estimated.
Commercial demand (restaurants, etc.) had been ignored, and this was a major
oversight (see further discussion below).
104
http://kildare.ie/CountyCouncil/WaterServices/WasteWaterDischargeLicenceApplications/UpperLiffeyValleyRegionalSewerageScheme/ 105
http://kildare.ie/CountyCouncil/WaterServices/WasteWaterDischargeLicenceApplications/LowerLiffeyValleyRegionalSewerageSchemeLeixlipWWTP/ 106
While these schemes certainly improved the water quality in the River Liffey, and possibly in the estuary and Dublin Bay, it has not proved possible to isolate their impacts from that of DWWT. However given the DWWT’s location and pollution load, it is reasonable to assume that it is responsible for the bulk of impacts on the estuary and the bay. 107
John Walsh former desk Officer for Ireland in DG Regio, quoted in COWI (2009). 108
The design capacity included a 50% reduction in industrial load in response to the introduction of charging, reflecting international experience and in particular the experience of the Lynetten municipal waste water plant in Copenhagen.

43
The design measure for population equivalents, of 60g BOD/litre, although the
standard set in Directive 91/271/EEC, may understate that true population load for
advanced countries109.
With regard to the commercial demand issue, the 2004 DECLG report National Urban
Wastewater Study contains guidelines for local authorities for best practise regarding
treatment plant design. According to this document, once domestic population projections are
made they should be inflated by a factor of 16% to take account of the additional wastewater
generated by commercial premises. It further notes that:
“This relationship has been used extensively in the estimation of flow and load for design
purposes and is widely accepted at a local and national level in Ireland”. (p.14 Volume 2, Part A
Methodology, No. 4 Flow and Load Assessment)
Fehily (2008) confirms that this approach was not used by DCC and MACL in their demand
forecasts. In effect, they assumed that all waste generated in commercial premises related to
the human resident population, and added no additional load demand in respect of them (see
Table 1.1). He further notes that at the time, most commercial establishments were not
metered, and many used food macerators which effectively converted solid waste to waste
water, thus adding to the pollution load at the plant (these have since been prohibited).
Since opening, the plant has continued to operate at above design capacity, and DCC has had
to compensate the concessionaire for the operational consequences of treating the excess
volumes. The original design did allow for expansion to 2.4 million PE, and it is intended to put
this additional capacity in place between now and 2015.
2.3.2 Odour Problems Almost immediately after opening, it was apparent to the residents of Dublin City that the
treatment plant was emitting malodorous fumes, which had a significant impact on their
quality of life, particularly in the immediate neighbourhoods of the plant110. The main chemical
which causes odour pollution is hydrogen sulphide (H2S), which has a smell of rotten eggs.
A number of reasons have been put forward for this problem, including the fact that the plant
was operating at above capacity. Fehily (2008) in his investigation identified a range of issues
that contributed to the problem, notably:
H2S levels at the inlet to the plant were higher than expected, perhaps because waste
material was turning septic in the pipeline from Sutton pumping station;
“Leaking valves and fugitive emissions” in the CAMBI thermal hydrolysis process;
Lack of odour control at the extractor fans;
109
Fehily (2008) indicates that 80g/litre is the norm used in the USA. DECLG engineering personnel indicate that a BOD of 75g/litre is often used for large cities. 110
Irish Times 12th
August 2003 “Sewerage plant cause of odour problem”
http://www.irishtimes.com/newspaper/archive/2003/0812/Pg006.html

44
The fact that this was novel technology;
“Odour emissions from the primary lamellae tanks (settling tanks) were untreated;
There was no individual odour extraction from the sludge presses which are highly
odoriferous;
High levels of ammonia were being released from the treated sludge;”
Perhaps most remarkably, that the contract for the construction of the plant grossly
mis-specified the threshold value for odour emissions.
With regard to this last point, Fehily (2008) reports that the World Health Organisation reports
a nuisance threshold value of 3.5 parts per billion (ppb) of H2S as an hourly average
concentration. In the Environmental Impact Statement in 1997, a threshold of 5ppb was
stipulated. Fehily then notes that the contract documents stipulated that the odour emission
threshold for hydrogen sulphide was set at 100ppb, well in excess of levels stipulated in the EIS
and WHO guidance levels. By way of explanation Fehily notes that the odour modelling
undertaken as part of the EIS may have created a false sense of security for the designers;
failing that it was a “serious error of judgement” (p.48).
Furthermore, the terms of the contract did not oblige the plant operator to deal effectively
with the odour problem when it did occur. Fehily reports that protracted negotiations
between DCC and the operator to address the odour problem eventually led them agreeing to
share costs of EUR 1.2 million in August 2004.
However, reference to Figure 1.4 shows that this did not solve the problem. Media reports
indicate that DCC eventually had to make a much more substantial investment in the plant to
solve the problem111, and this is confirmed by a recent statement by Mr Bob Gaudes112, senior
vice president of CDM, who indicated a cost of up to EUR 30 million to resolve the issue113.
Discussions with one of the operator’s site engineers identified what in his opinion had been
the main causes of the odour problems, as hot summers in the mid-2000s, and the fact that
the primary lamellae tanks were uncovered. He did not believe that problems with the CAMBI
process were primarily responsible.
He indicated that covering the lamellae tanks played a major part of solving the problem.
Another factor that contributed was the heating of gases released from the thermal dryers
(post digestion) to 850°C for two minutes in a closed environment, which oxidised most of the
volatile compounds in the emissions.
111
http://www.rte.ie/news/2008/0630/waste.html. 112
http://www.dublincity.public-i.tv/core/portal/webcast_interactive/67901and
http://cdmsmith.com/en-EU/Insights/Features/A-Tunnel-to-Clean-Waters.aspx. 113
An interview with one of DCC’s site engineers confirms Fehily’s interpretation of the contracts, and indicates that these contract issues influenced DCC in changing their consulting engineers from MACL to CDM, and that the matter is currently the subject of arbitration between DCC and MACL.

45
DCC’s site engineer has indicated that the problem with leaking valves was reflective of a
number of problems with quality of the physical plant, which caused difficulties in the early
years of the plant’s operations. He indicated that Design-Build-Operate was adopted in an
effort to avoid these problems. However, it was not entirely successful in doing so.
Other difficulties have included:
There have been some controversies regarding the use of Biofert114 and sludge cake115
from the plant, with disputes between the users of the material and Dublin City
Council116 ;
The newly constructed Sutton pumping station flooded raw sewage on two occasions
in 2003, resulting in damage to nearby housing117.;
A fire/explosion in one of the sludge dryers occurred in November 2004118..
One other major development has been the designation of the Liffey Estuary as a sensitive
water body in 2001. This means that treated water currently discharged into Dublin Bay from
the Ringsend plant does not meet the required standards (full tertiary treatment with nutrient
removal).
Because of the constraints on the site and the capacity problems that the plant is currently
experiencing, it has been concluded that the most feasible option is to build a 9 km
underwater tunnel from the plant to discharge the treated wastewater beyond the sensitive
waters area, rather than build the necessary works on site119. In the words of Bob Gaudes120,
senior vice president of CDM, the site constraints and the projected plant size were “very
limiting” in the final choice to deal with the new regulations (Figure 2.9).
114
By-product of the sludge treatment, used as agricultural fertilizer. 115
Irish Independent 13th
May 2007 “Outrage as raw human waste ‘mistakenly’ spread on land” http://www.independent.ie/national-news/outrage-as-raw-human-waste-mistakenly-spread-on-land-655660.html 116
http://www.rte.ie/news/2005/0421/ringsend.html. 117
Irish Independent 2nd
April 2004 “Sewage still dumped into Dublin bay bypassing 300m sieve” http://www.independent.ie/national-news/massive-sewerage-project-flushes-into-action-203933.html. Irish Times 12
th September 2003 “Sewage traps Sutton students in school”
http://www.irishtimes.com/newspaper/archive/2003/0912/Pg006.html. 118
Irish Independent 3rd
November 2004 “Dryer fire in 300m waste plant probed”. Dried biofert can be unstable if stored for long periods, the solution being to remove the material from the plant as quickly as possible and to minimise volumes in storage. http://www.independent.ie/national-news/dryer-fire-in-300m-waste-plant-probed-141469.html. 119
Stated advantages include lower energy usage, lower sludge volumes, and a longer useful life. http://dublincity.ie/WaterWasteEnvironment/WasteWater/RingsendWastewaterTreatmentWorksExtension/Documents/Ringsend_FAQs%5b1%5d.pdf 120
http://www.dublincity.public-i.tv/core/portal/webcast_interactive/67901and http://cdmsmith.com/en-EU/Insights/Features/A-Tunnel-to-Clean-Waters.aspx.

46
Figure 2.9 PROPOSED SEA OUTFALL AT RINGSEND TO COMPLY WITH URBAN
WASTEWATER DIRECTIVE (DESIGNATION OF LIFFEY ESTUARY AS
SENSITIVE)
Source: CDM
As stated, the option of retro-fitting the SBRs with denitrification was built into the design at
the time of approval of the EIS. However, DCC personnel have indicated that a difficulty with
choosing this option would reduce the capacity of the SBRs, thus further exacerbating the
current capacity problems that the plant is experiencing.
2.4 HAS THE PROJECT STABILISED?
The volume of waste water arriving at the Ringsend plant for treatment has in large part
stabilised in recent years at approximately 1.9 million PE. Despite this, it is arguable in fact that
this project has not yet stabilised, on two counts:
Most obviously, the plant is operating in excess of capacity. Within two years of the
plant’s opening, DCC announced plans for an expansion of the plant, which originally it
was not expected would be necessary until after 2020. This led to much opposition
from local political representatives, who threatened to block any proposed extension
until the odour problem was resolved121. It is now planned to proceed with the
extension, to be completed in 2015.
Designation of the Liffey Estuary as a sensitive body of water, and the subsequent
decision, because of the constraints of the site, to build a 9 km underwater tunnel
from the plant to discharge the treated wastewater beyond the sensitive waters area
121
http://www.rte.ie/news/2005/0420/ringsend.html.

47
to deal with the problem. The construction of this tunnel will be undertaken in
conjunction with the works to expand the plant’s capacity. The plant’s licence from the
EPA requires it to meet the standards of the Directive by 2015.
These developments will have impacts on investment and operating costs, as well as on
environmental quality (via the removal of nutrient-rich effluent from the estuary.
Environmental and as well as some ongoing financial benefits may accrue from the fact that
the plant will be operating within capacity, although the actual load in terms of PE has
stabilised in recent years.
One further potential development is the plan to build a new wastewater treatment plant in
Fingal in north Dublin122, to cater for growing demand and consolidate treatment
infrastructure along the north Dublin coast. It is noted that the Ringsend plant currently treats
70% of the waste water from Fingal County, and options to redirect some of this load to the
new plant are being explored. However, there is concerted public opposition to this new
plant123, which argues inter alia, that since the economic downturn the population projections
on which the plant is based are out of date (Skerries Community Association, 2011), and it is
unlikely to proceed in the short term.
122
http://www.greaterdublindrainage.com/2011/12/15/preliminary-screening-report-presentation/. 123
See for instance http://www.skerriesca.com/node/503.

48

49
3 LONG-TERM DEVELOPMENT
EFFECTS
3.1 KEY FINDINGS
This Section describes the main long-term development effects provided by the project. In
accordance with the guidance set out in the First Interim Report, seven categories of effects
(listed below) are considered and for each of them an assessment of the contribution of the
project to that specific effect is given. On the most relevant effects, either positive or negative,
descriptions of the timing of their materialisation and evolution are presented. The seven
categories of effects are:
Direct economic growth
Endogenous dynamics
Social cohesion
Environmental effects
Territorial cohesion
Institutional quality
Social happiness.
As discussed earlier, these categories are analysed using two broad methodological
approaches – quantitative (i.e. Cost Benefit Analysis) and qualitative. As a starting point, we
can summarise the nature and strength of the long term impacts of the investment across the
above categories, as well as the degree to which these impacts have been identified and
analysed quantitatively or qualitatively (Table 3.1 overleaf). We also consider the degree to
which short term as well as long term impacts arise (Table 3.2 overleaf). The criteria
considered to assign the scores shown in these Tables are presented in Annex I.
In broad terms, the direct economic impact is identified quantitatively in the CBA, while the
other categories are largely identified qualitatively. However, elements of these other
categories are captured to some extent in the quantitative analysis also.
The project clearly has both short term and long term impacts. While the key driver for the
project was compliance with Directive 91/271/EEC, there were increasing societal concerns
regarding the water quality in Dublin Bay. There was an immediate and noticeable
improvement in water quality and in the amenity quality of beaches and the coastline
following the plant’s opening, and this has been maintained.

50
The plans to disperse the plant’s outfall via a 9 km tunnel has the potential to deliver further
benefits in the inner bay in the medium term, and the increase in the plant’s capacity should
safeguard the improvements already achieved.
Table 3.1 NATURE AND STRENGTH IMPACTS
Strength*
(-5 to +5)
Level Identified and Analysed
Quantitatively (CBA)
Qualitatively
1. Direct economic growth +3 Local, regional √
2. Endogenous dynamics +2 Regional, national √ √
3. Social cohesion -1 Local, regional √
4. Environmental effects +4 Regional, national √ √
5. Territorial cohesion +1 Local, regional √
6. Institutional quality +1 Regional, national √
7. Social happiness -1 Local, regional √
*-5 = net highly negative effect; 0 = net neutral effect; +5 = net highly positive effect.
Table 3.2 TEMPORAL DYNAMICS OF THE EFFECTS
Short run (years 1-5)
Long run (years 6- 10)
Future years
Comments
1. Direct economic growth
+ ++ +++ Immediate positive effect, improved in long-run as initial odour problems resolved; future investment will generate further benefits.
2. Endogenous dynamics + ++ ++ Positive effect stabilised in the long-run.
3. Social cohesion - - - Slightly negative effect stabilised in the long-run.
4. Environmental effects + ++ +++ Immediate positive effect, improved in long-run as initial odour problems resolved; future investment will generate further benefits.
5. Territorial cohesion + + + Slightly positive effect stabilised since the short-term.
6. Institutional quality + + + Slightly positive effect stabilised since the short-term.
7. Social happiness - - - Slightly negative effect stabilised in the long-run.
Note: + or - Positive or negative effect; ++ or -- Positive of negatively effects reinforced (in positive or negative direction) with respect to the previous stage; +++ or --- Positive of negatively effects further reinforced (in positive or negative direction) with respect to the previous stage; +/- Mixed effect, it is not possible to assess whether the net impact was positive or negative (see Annex I).
There was one notable short term environmental negative, i.e. the serious odour problem,
which had a significant impact on the quality of life of the plant’s neighbours. However, this
appears now to have been resolved, albeit at substantial cost.
Economically, our CBA indicates that the project generated a positive socio-economic return
compared to the counterfactual (Economic NPV EUR 335 million), with the largest benefit
51
related to household Willingness To Pay (WTP) for improvements in water quality in Dublin
Bay.
Short term impacts were felt directly from the planning, construction and operations of the
plant. We estimate that construction to date has generated 3,300 man years of employment,
while future investments have the potential to generate a further 1,300 man years of work.
The plant current employs approximately 50 people, including 30 working in five shifts of six
over 24 hours, with the balance as day staff.
The plant has enabled water-using industry in the city (notably Guinness Brewery) to have its
waste water treated to the required standard (industry made a contribution of EUR 44
million124 to the initial capital investment cost). It has also facilitated an expansion of housing
and population, by providing proper waste water treatment in accordance with Directive
91/271/EEC.
Table 3.3 overleaf summarises our assessment of the dispersal of impacts across the various
stakeholders.
Notable is the negative impacts on the residents of neighbouring districts, who had to suffer
serious odour problems in the early years of operation of the plant. They also have a
continuing negative perception of the plant, which has been exacerbated by further plans by
DCC to build an MSW incinerator on an adjacent site at Poolbeg.
The positive impacts of economic growth are concentrated among the plant designers,
builders and operators, customers of the plant and the local authorities who have benefited
from increased commercial rates (property tax) and development levies.
The plant does represent a significant financial burden for Dublin City Council, as it recovers no
revenues from domestic customers, and it only charges non-domestic customers on a marginal
cost basis, whereas it must pay the concessionaire the full cost of operating the plant.
124
Current prices VAT inclusive.

52
Table 3.3 DISTRIBUTION OF IMPACTS ACROSS STAKEHOLDERS
Stakeholders
Customers of the plant Plant Operators Designers,
Builders, etc.
Government & Citizens
EPA Department of
Environment
Neighbouring residents Users (& non-users) of Dublin Bay Amenities
Local/
Regional Authorities
EU
1. Direct economic growth +3 +5 +5 +1 +/-
2. Endogenous dynamics +2 +2 +2 +2 +3
3. Social cohesion +2 -4
4. Environmental effects +5 +3 +3 -1 +5 +5
5. Territorial cohesion +1
6. Institutional quality +2 +1 +1 +1
7. Social happiness -4 +2
*-5 = net highly negative effect; 0 = net neutral effect; +5 = net highly positive effect; +/- = mixed positive and negative effects Note: the numbers in this table do not necessarily match those in Table 3.1, as the latter relates to the aggregate impacts, while the above relates to impacts on individual stakeholder groups, at which level the impact may be more significant. The aggregate impact can be interpreted as the weighted average of the individual stakeholder values (see Annex I).
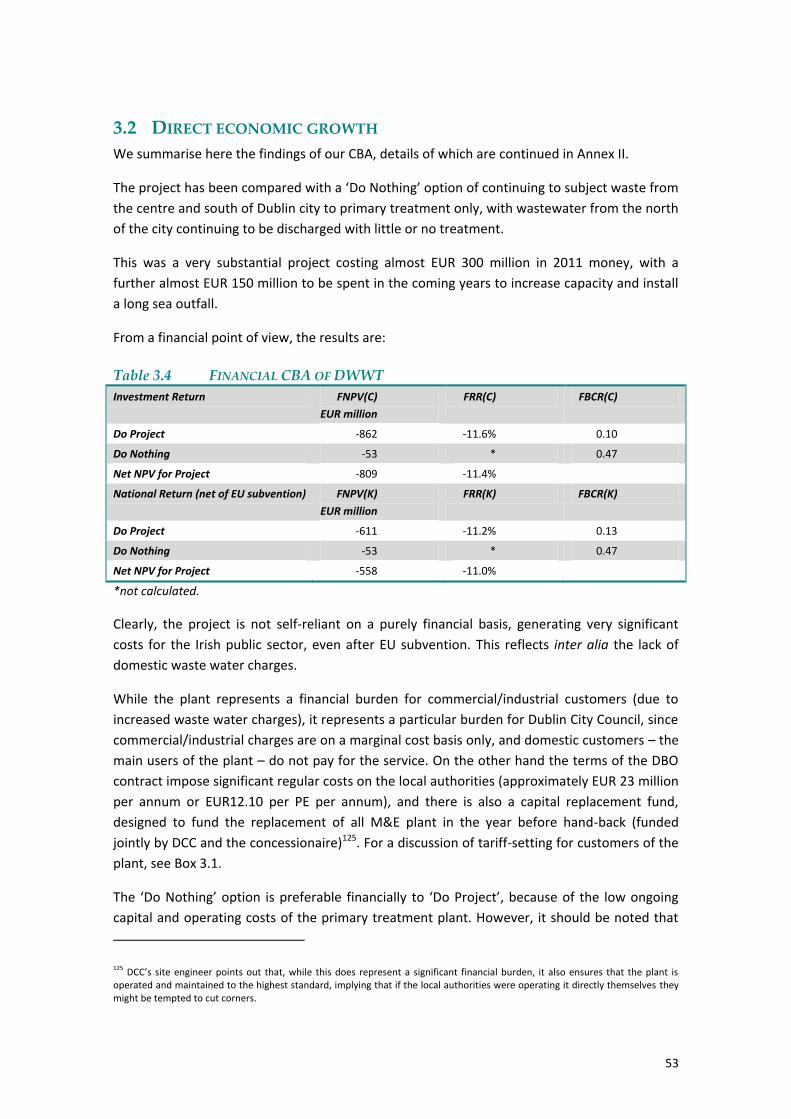
53
3.2 DIRECT ECONOMIC GROWTH
We summarise here the findings of our CBA, details of which are continued in Annex II.
The project has been compared with a ‘Do Nothing’ option of continuing to subject waste from
the centre and south of Dublin city to primary treatment only, with wastewater from the north
of the city continuing to be discharged with little or no treatment.
This was a very substantial project costing almost EUR 300 million in 2011 money, with a
further almost EUR 150 million to be spent in the coming years to increase capacity and install
a long sea outfall.
From a financial point of view, the results are:
Table 3.4 FINANCIAL CBA OF DWWT
Investment Return FNPV(C)
EUR million
FRR(C) FBCR(C)
Do Project -862 -11.6% 0.10
Do Nothing -53 * 0.47
Net NPV for Project -809 -11.4%
National Return (net of EU subvention) FNPV(K)
EUR million
FRR(K) FBCR(K)
Do Project -611 -11.2% 0.13
Do Nothing -53 * 0.47
Net NPV for Project -558 -11.0%
*not calculated.
Clearly, the project is not self-reliant on a purely financial basis, generating very significant
costs for the Irish public sector, even after EU subvention. This reflects inter alia the lack of
domestic waste water charges.
While the plant represents a financial burden for commercial/industrial customers (due to
increased waste water charges), it represents a particular burden for Dublin City Council, since
commercial/industrial charges are on a marginal cost basis only, and domestic customers – the
main users of the plant – do not pay for the service. On the other hand the terms of the DBO
contract impose significant regular costs on the local authorities (approximately EUR 23 million
per annum or EUR12.10 per PE per annum), and there is also a capital replacement fund,
designed to fund the replacement of all M&E plant in the year before hand-back (funded
jointly by DCC and the concessionaire)125. For a discussion of tariff-setting for customers of the
plant, see Box 3.1.
The ‘Do Nothing’ option is preferable financially to ‘Do Project’, because of the low ongoing
capital and operating costs of the primary treatment plant. However, it should be noted that
125
DCC’s site engineer points out that, while this does represent a significant financial burden, it also ensures that the plant is operated and maintained to the highest standard, implying that if the local authorities were operating it directly themselves they might be tempted to cut corners.

54
this calculation ignores the possibility of substantial EU fines being levied on Ireland for non-
compliance with Directive 91/271/EEC.
However, when assessed from a socio-economic viewpoint (mainly taking into account
household WTP for improved water quality in Dublin Bay but also conversion from market to
shadow prices), the results are as follows:
Table 3.5 SOCIO-ECONOMIC CBA OF DWWT PROJECT
ENPV
EUR million
ERR EBCR
Do Project 246 10.3% 1.20
Do Nothing -89 * 0.37
Net NPV for Project 335 11.7%
*not calculated.
On this basis, the project clearly generates a positive return.
Direct economic benefits are felt by:
The designers, builders and operators of the plant and related infrastructure, as well as
their employees;
Industrial firms whose waste water is treated at the plant to the required standard,
and their employees;
The house building sector in north Dublin, whose expansion was facilitated by the
provision of proper wastewater treatment in the region, as well as the households
buying these properties (not included in the above calculations, but partly captured in
the WTP);
Improved quality of life and general amenity value among Dublin residents,
particularly those using the waters and beaches of the bay for amenity and recreation
purposes;
Property owners in the Dublin region, whose property values have been increased by
the project (captured in the WTP calculations);
Similar benefits for tourists, and thus the tourism-related sectors of the Dublin
economy (not valued – the main users of Dublin Bay are residents rather than
tourists).

55
Box 3.1 TARIFFS FOR THE DUBLIN WASTE WATER TREATMENT PLANT
Almost all discharges of wastewater to public sewers in the Dublin region are brought to the Ringsend plant for treatment. Customers of the plant fall into the following broad categories: domestic, commercial and industrial.
Domestic customers pay no charges for waste water (or for water supply).
Commercial customers, who discharge waters which are similar in nature to domestic discharges (including schools and similar institutions), are charged on a water-in, water-out basis, and in 2012 pay a combined water/waste water charge of EUR 1.90/cubic metre126. It is not clear how much of this relates to water supply, as compared to waste water services.
Most industrial customers operate under a Local Authority license, which sets the limits on what they are allowed to discharge. Their tariffs are calculated on the basis of the marginal cost of treating their effluent at the plant. The tariff is worked out by means of a formula which includes volumetric load, BOD, COD and suspended solids.
Industrial customers in certain industries (for example brewing) are licensed by the EPA under the Integrated Pollution Prevention Control (IPPC) system, which covers all types of pollution in a single licence. Their tariffs are calculated on the same basis as other industrial customers
Total revenue from industrial customers is currently approximately EUR 3.3 million per annum. This compares with annual payments from Dublin City Council to the operating concessionaire CAW of approximately EUR 23 million.
The largest industrial customers also made a capital contribution to the cost of the plant, based on the marginal capital cost of adding the required capacity to cater for them, amounting to EUR 44 million (current prices, VAT inclusive). This represented approximately 10% of the capital cost of the project.
Source: Authors
3.3 ENDOGENOUS DYNAMICS
The three main headings under which endogenous dynamics are considered to positively
impact on long term economic growth in the context of infrastructural investment are:
Human capital;
Technological progress (including R&D investments); and
Organisational development.
The DWWT project was a major infrastructure investment, which will cost almost EUR 450
million when future investments are considered (2011 money, VAT exclusive). It is the largest
wastewater treatment plant in Ireland, and includes a number of innovative engineering
elements in response to the constrained site (first international use of the CAMBI process at
this scale, the two-storey SBRs) as discussed in Section 2.
There would have been an increase of knowledge and expertise in the institutions and firms
involved in the design, delivery and operations of the plant, given the scale and innovative
characteristics of the plant, thus improving Irish human capital (see later discussion of
institutional quality). This increased knowledge and expertise could be expected to overflow
into the building of subsequent plants, and possibly into other areas of civil engineering. While
126
http://www.dublincity.ie/WaterWasteEnvironment/DrinkingWater/WaterChargingandMetering/Pages/Findoutaboutwatercharges.aspx

56
the plant suffered significant “teething problems”, partly due to the use of the CAMBI process
on a scale never before attempted, CAW’s site engineer describes it now as “a flagship
project”. Apparently it receives regular international site visits by students, engineering firms
and other interested bodies, including a recent visit by a delegation from Hong Kong,
specifically interested in how the constrained site issue was dealt with127.
On the other hand, the technical complexity of the plant and the constrained site did create
significant problems and added costs, and we note that DCC has in recent years changed its
consultant engineers, apparently as a result of dissatisfaction with the quality of their work on
the Ringsend project (see fuller discussion in Section 2).
Technological progress would also have resulted from the project, specifically in terms of the
use of innovative technology at scale (the CAMBI process) on the constrained site at Ringsend.
That said, it may be that this will have more relevance outside Ireland than in the State. We
are not aware of any other treatment plant in Ireland that has used or intends to use a similar
technical solution.
In terms of organisational development it is not clear that there have been specific
developments, apart from technical capability, in the stakeholders as a result of this project.
One can perhaps point to the lesson apparently learned by Anglian Water International in
terms of the need to have a hands-on approach to the design and construction of plants that
they would subsequently be operating.
3.4 SOCIAL COHESION
3.4.1 Inequality and social cohesion in Ireland Ireland went through a period of exceptional economic growth over the last two decades, and
as is the case in many countries in similar circumstances, there was an increase in income
inequality over that period. As recently as 2006, a Government-sponsored report indicated
that Ireland was one of the most unequal societies in the developed world128.
That said, unemployment fell very rapidly between 1994 and 2008 (from approximately 17% to
4.6%) and this had a very significant impact on incomes across the population. It facilitated a
very significant expansion of public and social services, which helped to improve social
inclusion129, including increases in health expenditure, which is partly credited with
significantly increasing life expectancy130. At a general level, EU funding of this and other
infrastructure projects may have allowed the Government to redirect expenditure to areas of
social spending.
127
The Hong Kong delegation was considering the feasibility of constructing SBRs on three storeys, as opposed to two at Ringsend. 128
Based on relative measures such as comparing incomes of the top 20% with the bottom 20%; National Social & Economic Forum (2006), Creating a More Inclusive Labour Market, report No. 33. http://www.drugsandalcohol.ie/6053/1/NESF_No-33-Creating-a-More-Inclusive-Labour-Market%5B1%5D.pdf f. 129
Whether all of the progress made under this heading will survive the current requirement for fiscal rebalancing is a moot point. 130
Walsh (2008).

57
3.4.2 The Ringsend Plant The plant has had mixed social cohesion impacts:
By removing constraints on development, notably on the north-side of the city (many
parts of which are generally less well-off than the average for Dublin), it enabled the
provision of new housing and economic opportunities where they were not previously
available.
At a more localised level, the residents of Ringsend/Irishtown, a less affluent part of
the city, would have borne the brunt of the serious odour problem in the early years of
the plant’s operation. There remains a significant degree of resentment in the area on
account of this, intensified by the perception that all the city’s waste was being
“dumped on their doorstep”, particularly the waste from the north of the city.
With regard to the latter, there is a perception that better off and more politically connected
residents neighbouring the proposed plant at Baldoyle managed to have that plant cancelled,
to the detriment of the Ringsend residents. Our analysis of this issue in Section 2 indicates that
this in fact does not appear to have been the case, although the prospect of a drawn-out
planning process for a new waste water treatment plant to be built on land zoned agricultural
was a factor in the decision. A new treatment plant anywhere in Dublin would likely have
experienced a similar planning timeframe, however.
DCC’s plan to build an MSW WtE plant (incinerator) on a site adjacent to the wastewater plant
has exacerbated negative local feelings131 132, particularly since the EIS for the WtE plant
describes the option of incinerating 80,000 tonnes of sludge per annum, if the option of land-
spreading is removed133. It is likely also that the odour problems have made it less likely that
the incinerator will be acceptable to local residents, although it must be said that incinerators
have a low level of acceptance in general in Ireland, and the first MSW WtE plant to be
successfully developed in Ireland only commenced operations in September 2011.
This WtE plant, to be built as a Public Private Partnership (PPP) has been particularly dogged by
controversy, and has been subject to considerable delays, apparently due to difficulties with
financing134.
It can be argued that the absence of domestic water supply and wastewater treatment charges
contributes to social cohesion, by avoiding financial burdens on less-well-off households, but
of course this has negative consequences for both financial and environmental sustainability.
131
For example http://www.rte.ie/news/2010/0130/incinerator.html, and http://www.indymedia.ie/article/78759?save_prefs=true&userlanguage=ga 132
That said, another neighbouring district, Sandymount, is a notably affluent district of Dublin. 133
Land spreading might become politically or socially unacceptable, or it might prove impossible to find farmers willing to accept it in the future. Health concerns might potentially become an issue (see for instance http://www.ncbi.nlm.nih.gov/pmc/articles/PMC2094820/). Currently, DCC pays approximately EUR60 per tonne to have the biofert removed. 134
See for instance http://www.irishtimes.com/newspaper/ireland/2012/0202/1224311113163.html and http://www.rte.ie/news/av/2012/0131/media-3184978.html.

58
Avoidance of undue burden can be more efficiently achieved through general social welfare
transfers.
3.5 ENVIRONMENTAL EFFECTS
The Ringsend wastewater treatment plant has had a broadly positive impact on the
environment. As demonstrated in Section 1, water quality has improved significantly, and can
be expected to improve further when the long sea outfall and the increased capacity are in
place. This will also enable full compliance with Directive 91/271/EEC, in the context of the
Liffey Estuary being designated a sensitive water body.
The plant also incorporates state-of-the art sludge treatment, which contributes 40% of the
plant’s energy needs and stabilises the sludge into a useful product.
On the other hand, energy usage would have increased significantly in order to operate the
more sophisticated plant (notwithstanding energy generated internally), and there has been a
serious odour problem in the early years of the plant’s life, albeit it is now resolved.
In addition, the absence of domestic water supply and wastewater treatment charges has
negative consequences for environmental sustainability.
3.6 TERRITORIAL COHESION
By its nature, this project would have had limited if any impact on territorial cohesion at a
national level. There would be positive territorial cohesion effects within the catchment of the
Ringsend plant (effectively the Dublin NUTS III region) in terms of providing a uniform level of
wastewater treatment throughout the region (free at the point of use to all domestic
customers). Some parts of the region (particularly Fingal), had been development constrained
due to lack of water and waste water services prior to the commissioning of this plant and the
extension of water supply services.
3.7 INSTITUTIONAL QUALITY
The impact of this project on institutional quality is an interesting question. It is not clear that
there has been a specific impact from the plant as such. Irish Local Authorities, the DECLG and
the EPA would have had to upgrade their respective technical capacities in order to design,
operate and oversee the operations of this and other WWT plants around the country, a large
number of which have been built over the last two decades on foot of Directive 91/271/EEC
and other Directives, and part-funded by the EU.
The main institutional development over that period has been the establishment of the EPA in
1992, which took over a number of environmental regulatory and supervisory roles from the
DECLG in the intervening years, notably in the water supply, wastewater treatment and solid
waste management sectors. Many of the technical staff from the Department would have
transferred to the Agency on foot of these role transfers.

59
Unlike the roads sector in Ireland, the Local Authorities remain the operational and
management authorities in respect of water and wastewater. It is intended, however, to
establish a “semi-state” company135 in the near future to take over and operate the water
sector in Ireland on a commercial basis, including the introduction of metered water charges
for all users136. The exact details and timeframe for this development remain uncertain,
although recent statements from Government are that it is to be fully in place by 2017137.
The Ringsend project uncovered some institutional/technical limitations, in terms of the
various problems that arose with the plant, notably:
Under-estimation of the load on the plant (over-capacity from day one), in the context
of clearly apparent economic growth, increased commuting and partly due to
miscalculation of the commercial load;
The odour problem, which has been traced to, inter alia, design problems, build quality
problems and a gross misspecification of the threshold value for H2S emissions138;
Failure to anticipate the designation of Sandymount strand as an SPA, which
constrained expansion of the site;
Failure to anticipate the designation of the Liffey Estuary as a sensitive water body (the
design allowed for installation of nutrient removal, but the capacity problems meant
that this solution would not be feasible);
Weaknesses in the contract design, which inter alia, made it difficult to force the
concessionaire to pay for resolving the odour problem.
At a more general level, some local residents have argued to the effect that the decision to
direct all of Dublin’s wastewater for treatment to a single constrained site, at the centre of
Dublin Bay and the Liffey Estuary, and particularly to abandon the option for a separate plant
at Baldoyle, was a sign of institutional/political weakness in the face of public opposition to the
Baldoyle plant. Our analysis indicates that this decision was more pragmatic than reflective of
a waivering to public opposition. We do note the observation by one interviewee that the
prospect of a long planning process in the face of a rapidly approaching deadline for meeting
the terms of Directive 91/271/EEC was a factor in choosing to concentrate all investment at
the existing Ringsend site. However, this would have been the case regardless of the location
of any new waste water treatment plant.
At a more general level, abolition of domestic water charges in Ireland in 1997139 undermined
the application of the “polluter pays” principle140 as well as placing a significant financial
135
A commercial company whose shares are owned by the State. 136
http://www.irishtimes.com/newspaper/ireland/2011/0930/1224305001574.html. 137
http://www.environ.ie/en/Publications/Environment/Water/FileDownLoad,29193,en.pdf 138
Having said that, the odour issue represented a major lesson for local engineers, and retro-fitting measures taken to alleviate the problems at Ringsend have become “standard practice” in Ireland (see http://www.youtube.com/watch?v=TTEz8NguqfM).

60
burden on local authorities who are responsible for providing water and wastewater services.
The inclusion in the Water Framework Directive of a clause that allowed the Irish Government
to avoid having to reintroduce domestic water charges consolidated the position.
3.8 SOCIAL HAPPINESS
Social happiness impacts are to do with perceptions, over and above the impacts already
considered. The main perception issues have been dealt with under the Social Cohesion and
Environmental Effects headings. Worth reiterating are:
The negative experiences of residents of neighbouring districts in terms of the odour
problems in the first few years of the plant’s operations, and
The generally positive experiences of those who use Dublin Bay as an amenity. This has
effectively been captured in the household WTP calculations included in the economic
CBA.
As indicated, the Poolbeg peninsula incorporates another public infrastructure project that
suffers from significantly negative public perceptions, i.e. the proposed WtE plant. Interviews
with local representatives as well as reviews of the media indicate that the two projects are
generating mutually reinforcing negative perceptions. Overall, because of these issues, the net
“social happiness” impact is likely to be slightly negative.
139
Domestic water charges were abolished for blatantly political reasons – to help the Government to win a by-election in a constituency in West Dublin where opposition to domestic water charges was strong. The Government lost the by-election and later that year lost the general election. 140
According to the ”polluter pays” principle, stated in Directive 2004/35/CE, the operator whose activity has caused the environmental damage or the imminent threat of such damage is to be held financially liable. The objective of this principle is to induce operators to adopt measures and develop practices to minimise the risks of environmental damage so that their exposure to financial liabilities is reduced.

61
4 DETERMINANTS OF PROJECT
OUTCOMES
4.1 KEY FINDINGS
Overall this project was worthwhile from a socio-economic point of view, delivering a positive
ENPV, has delivered significant environmental improvements, and has/will meet the terms of
Directive 91/271/EEC. The determinants of performance that we consider are:
Appropriateness to the context
Project design
Forecasting capacity
Project governance
Managerial response
Table 4.1 summarises the relative strength of each of these determinants:
Table 4.1 IMPACT OF KEY DETERMINANTS ON PROJECT’S PERFORMANCE
Strength*
1. Appropriateness to the context +4
2. Project design -2
3. Forecasting capacity -3
4. Project governance -2
5. Managerial response +1
*-5 = very strong negative effect; 0 = no effect; 5 = very strong positive effect (see in Annex I the criteria considered to assign these scores)
The project is highly appropriate to the context, in terms of the requirement to meet the terms
of Directive 91/271/EEC, increasing population and economic activity, and the clearly
inadequate pre-existing level of treatment for waste water in Dublin Bay.
Project design was innovative in terms of responding to the constrained site, but problematic
in a number of ways, albeit these issues have in large part been resolved.
Forecasting capacity was clearly problematic, as the plant had inadequate capacity from the
start of operations.
Governance appears to have caused some difficulties, in terms of the capacity to deal with the
early operational problems with the plant, and contract design.

62
Managerial response had some positive impacts, in terms of overcoming the problems caused
by inadequate capacity at the plant, and some of the governance issues. However, resolution
of the odour problem did take some time and ultimately cost DCC a lot of money to resolve.
These determinants are discussed in more detail in the rest of this section, after which the
interplay between the determinants is also considered. We also include a brief discussion of
the role of the EU as a determinant of outcome.
4.2 APPROPRIATENESS TO THE CONTEXT
The context for the project was highly positive, and the project addressed that context well:
Inadequate or no treatment of wastewater discharges from the largest city in Ireland
into an enclosed bay with high amenity value;
Growing population, housing (Figure 4.1) and prosperity, leading to increased human
environmental impact on the one hand and increased demand for improved
environmental quality on the other;
A system of sewers in place, already taking most of the waste water in Dublin to the
Ringsend site141;
Directive 91/271/EEC and other Directives, which brought the requirement for
improved treatment into sharp legal focus; and finally
The availability of very high levels of EU grant aid for projects aimed at meeting the
requirements of Directive 91/271/EEC.
As demonstrated in the earlier discussions on the context, Ireland and Dublin have had a
history of playing catch-up in terms of wastewater treatment. The Operational Programme for
Water, Sanitary and Other Local Services 1989-1993 report (1990) noted that during the 1980s
government priorities were to deal with “the historically low level of infrastructure provision
and the impact of rapid population growth and urbanisation in the 1970s”. (p.24)
The Operational Programme report further notes that, as a consequence, priority was given to
the more immediate problem of supplying water to newer development areas and a greater
proportion of capital expenditure (60%) was devoted to water supply infrastructure than to
wastewater treatment.
From Figure 4.1 we can see that the housing stock in the Dublin NUTS III region showed a
stronger than average growth until the 1970s. This created a number of legacy issues with
regard to the city’s drainage infrastruture. Growth accelerated in the 1970s but was also
matched in the Mid–East region. Growth in the latter sharply accerated in the 1990s with the
141
With the exception of a small number of recently completed sewers, the Dublin sewerage network is mixed (foul water and storm water). This generates some uncertainty in the volumetric flow to the plant, and in extreme circumstances can lead to an overflow of poorly treated sewage into the Bay.
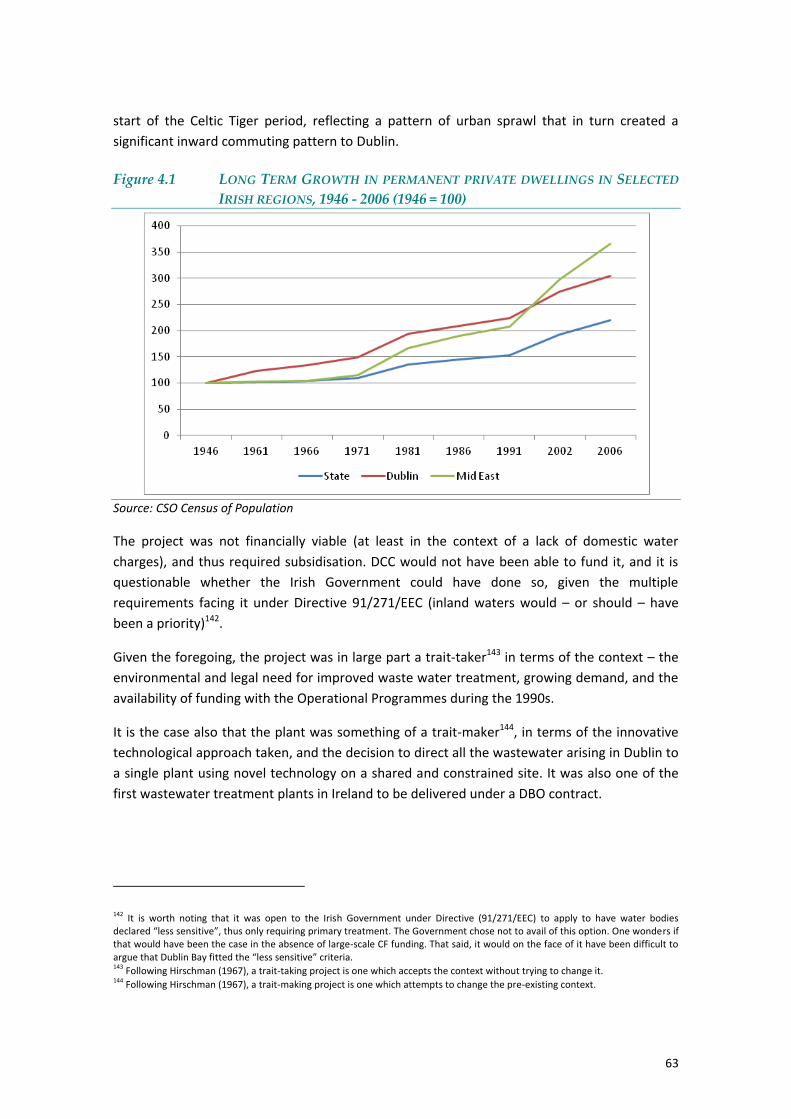
63
start of the Celtic Tiger period, reflecting a pattern of urban sprawl that in turn created a
significant inward commuting pattern to Dublin.
Figure 4.1 LONG TERM GROWTH IN PERMANENT PRIVATE DWELLINGS IN SELECTED
IRISH REGIONS, 1946 - 2006 (1946 = 100)
Source: CSO Census of Population
The project was not financially viable (at least in the context of a lack of domestic water
charges), and thus required subsidisation. DCC would not have been able to fund it, and it is
questionable whether the Irish Government could have done so, given the multiple
requirements facing it under Directive 91/271/EEC (inland waters would – or should – have
been a priority)142.
Given the foregoing, the project was in large part a trait-taker143 in terms of the context – the
environmental and legal need for improved waste water treatment, growing demand, and the
availability of funding with the Operational Programmes during the 1990s.
It is the case also that the plant was something of a trait-maker144, in terms of the innovative
technological approach taken, and the decision to direct all the wastewater arising in Dublin to
a single plant using novel technology on a shared and constrained site. It was also one of the
first wastewater treatment plants in Ireland to be delivered under a DBO contract.
142
It is worth noting that it was open to the Irish Government under Directive (91/271/EEC) to apply to have water bodies declared “less sensitive”, thus only requiring primary treatment. The Government chose not to avail of this option. One wonders if that would have been the case in the absence of large-scale CF funding. That said, it would on the face of it have been difficult to argue that Dublin Bay fitted the “less sensitive” criteria. 143
Following Hirschman (1967), a trait-taking project is one which accepts the context without trying to change it. 144
Following Hirschman (1967), a trait-making project is one which attempts to change the pre-existing context.
64
4.3 PROJECT DESIGN
As discussed in Sections 2 and 3, project design was innovative, but in some ways problematic.
Certainly it had consequences for the satisfactory operating of the plant in the initial years at
least.
It is informative to refer to Dublin Corporation & MACL (1993), which states the rationale for
choosing from the various technologies available for treating the capital’s wastewater. The
1993 report did not foresee wastewater from North Dublin coming to the Ringsend plant. The
criteria considered most important at that time were:
“Process suitability to meet objectives,
Satisfactory demonstration of the process on a comparable scale to the Ringsend
Works,
Ease of up-rating the plant to meet stricter effluent consent standards,
Land requirements,
Capital costs,
Operating costs and energy efficiency.” (p.96)
One can argue that the chosen solution failed a number of these criteria (notably 2, 3 and 4),
so it appears that the criteria applied to the project evolved (or perhaps were forced to evolve
by the circumstances) over time.
Furthermore, there were significant teething problems with the plant, notably with regard to
odour, which along with inadequate capacity forecasting must be laid at the door of project
design. Notable is the apparent misspecification of the emission threshold for hydrogen
Sulphide in the contract documents, which also caused difficulties with solving the problem
and allocating responsibility.
That said, it must be acknowledged that the plant is now working satisfactorily (after the initial
teething problems), and the objectives of improving water quality and amenity value in the
bay have been achieved. Further investments in the coming years are expected to further
enhance its working and the environmental benefits delivered. However, the teething
problems (particularly with regard to odour) have compromised the perceptions of benefits in
the minds of the public.
4.4 FORECASTING CAPACITY
Forecasting capacity is key to minimising risk factors and uncertainty in the delivery of major
infrastructure projects. Such risk factors can include over- or under-design in terms of capacity
delivered, failure to anticipate difficult geology or the presence of archaeology, poor
estimation of costs, under-anticipated inflation, etc.

65
It is clear that poor forecasting capacity was a major problem with this project, most
specifically under-estimation of the load on the plant (a plant that was supposed to have
sufficient capacity until 2020 was over-capacity in 2002), in the context of clearly apparent
economic growth, and partly due to miscalculation of the commercial load.
Scope to deal with increased demand was included in the design, as was scope to increase the
treatment level to full tertiary treatment, if required. Designation of Liffey Estuary as a
sensitive water body meant that this treatment was in fact required. However, the plant as
designed could not deliver both increased capacity and tertiary treatment. That is, it was
vulnerable to unexpected developments in more than one dimension.
These have had significant consequences for the technical solution, in terms of the cost and
the operations of the plant. In particular, the fact that the plant had inadequate capacity:
put extra strain and cost on the operations,
possibly contributed to the odour problem,
meant that not all sludge could be fully treated as per the technical design solution,
and
meant that the foreseen technical solution, should full tertiary treatment be required
(retro-fitting denitrification to the SBRs) could not be acted upon because it would
further reduce the capacity of the plant.
Hence it can be said that forecasting capacity was a significant negative determinant of the
project’s performance.
4.5 PROJECT GOVERNANCE
Governance structures for the delivery of the Ringsend Treatment Plant are as follows: the
over-arching Community Support Frameworks (CSF) 1989-1993 and 1994-1999 had a
Monitoring Committee, as did the Operational Programmes for Peripherality and
Environmental Services. These committees included representatives from:
the Departments of Environment, Transport and Finance,
Local Authorities,
State bodies such as the EPA,
external evaluators (usually economic consultants who undertook appraisals of
proposed investments), and
the EU Commission.
These committees as well as the Commission itself had regular reporting requirements with
regard to physical and financial delivery of the various investment programmes. The discipline
of complying with these reporting and other requirements in general added to the quality of

66
the governance and decision-making process in the course of the delivery of the programme.
Our examination of the Irish files confirms for instance that more detailed reports were kept
for infrastructure which was eligible for EU funding.
However, it can be said that governance of this project exhibited weaknesses in many respects,
most notably regarding the forecasting issues discussed above, and in terms of contract design
(threshold values for H2S, channels for dealing with operational problems). Certainly, the
criteria DCC and MACL set down for themselves in 1993 (see section 4.3 above) with respect to
technical choices were not followed in a number of important areas.
The DBO approach to project delivery, which apparently enabled the location of the plant on
the constrained site (“traditional procurement would not have put the plant on this site”145),
also created a more complex governance structure. Also, it seems, along with the related
contract design, it has made the resolution of operational problems more difficult and time
consuming, and ultimately it appears that the cost of resolving unexpected problems
(inadequate capacity, odour) has fallen on DCC, which somewhat defeats the purpose of DBO,
which is supposed to transfer significant risk to the concessionaire.
Another aspect of DBO which has been pointed out to us is that the operational standards to
be met as per the concession contract mean it is more expensive for DCC than if the Council
was operating the plant itself. In effect, the Council would “cut corners” in the operations if it
were free to do so. It has been confirmed to us by the DECLG that DBO-operated plants in
general are operated to a better standard than those directly operated by Local Authorities146.
DCC’s site engineer indicates that this is a short term burden but is likely to be a positive for
the Council in the long run, in terms of the operation of the plant and its longevity.
4.6 MANAGERIAL RESPONSE
We are concerned here with the adaptability /flexibility of project management to unforeseen
events. In many ways the project reacted well to unforeseen events, leaving aside for the
moment that many of these events should not have been unforeseen.
The designation of Sandymount strand as an SPA meant that part of the original site could not
be reclaimed from the sea, and a smaller site was needed. DCC and the DOE reacted by
confirming the feasibility of a “compact secondary treatment plant”, via a market testing
exercise, and adopting a DBO approach (the decision not to proceed with a separate treatment
plant for the north of the city was also a driver). The compact secondary treatment plant
approach was found to be feasible, but it seems it drove some of the technological solutions
that subsequently caused problems.
At the project operational level, there is evidence of adaptation to unforeseen events. The
main such events were the unexpectedly high load on the plant from day one, and the odour
145
Source: interviewee, engineering section, DECLG. 146
A parallel can be found with the maintenance standards of motorways in Ireland (such as the M1) that is operated under a PPP tolling concession.

67
problem. It has proved possible to operate the plant satisfactorily at higher than design
capacity, although there have been cost implications.
Reaction to the odour issues was less successful, and it took a number of years to adequately
deal with the problem. Resolution of both the capacity and the odour problems eventually had
to be paid for by DCC. Correspondence we have seen between DCC and DECLG indicates that
contractual problems and capacity problems contributed to this. DCC were constrained in their
dealings with the concessionaire CAW because the plant was operating at above design
capacity, and CAW could argue that the odour problem was largely due to this. DCC could have
taken the matter to arbitration but this would have been a lengthy and potentially expensive
process, and a speedy resolution of the odour problem was required.
The designation of the Liffey Estuary as a sensitive water body brought into sharp focus the
fact that there the capacity problems had invalidated the contingency plan to cater for
nutrient removal (retrofitting denitrification on the SBRs). As a result, a long sea outfall will be
used to bring the outfall beyond the limits of the sensitive area. Further, this will be a tunnel
rather than a pipeline, to avoid similar problems147, as well as generating less environmental
impact148.
Finally, it appears that DCC’s decision to change their consulting engineers from MACL to CDM
have been as a result of many of the shortcomings highlighted above.
4.7 INFLUENCE OF AND INTERPLAY BETWEEN DRIVERS
There are clear interplays between the drivers of performance.
The requirements of Directive 91/271/EEC would have put pressure on DCC and the Irish
Government to treat Dublin’s wastewater to a higher standard, as would the rising population
and living standards. Meanwhile the CF co-funding made it financially possible (without the
politically unpalatable option of re-introducing water charges).
Project design and forecasting capacity are clearly linked, as forecast demand is a key input to
design. Likewise governance and managerial response – the governance structures set the
means by which managerial response can happen. In particular, the choice of a DBO approach
facilitated the technical solution to the constrained site, but the related contract arrangements
had impacts on the capacity to respond to unforeseen events, and who eventually had to pay
for the resulting actions. By the same token, governance structures had an influence on
forecasting capacity, which set the degree to which events were unforeseen.
Governance also influenced the technological solutions chosen which had implications for the
operations of the plant, especially in the early years. The operator’s site engineer maintains
that the plant is now “a flagship”, and attracts attention internationally because of its
147
According to DCC’s site engineer, there are “hundreds of shipwrecks” in Dublin Bay. 148
The basic limitation of the site remains however, which may become binding if at some future point all sea outfalls of nutrient enriched material is prohibited (subject to advances in technology).

68
technology. While benefits will accrue to other countries, but the knowledge and experience
gained on the project has also been used elsewhere in Ireland, for instance in terms of dealing
with odours.
4.8 THE ROLE OF THE EU
The EU clearly had a significant role in this project, firstly as a catalyst for the requirement for
the plant (via various Directives, especially Directive 91/271/EEC), and secondly as a provider
of a high proportion of the total initial investment cost.
As described, it also had a strong governance role, via its participation in CSF and Operational
Programme steering committees, and the imposition of the discipline of regular reporting of
physical and financial progress.
It has been indicated by interviewees, furthermore, that the time constraints imposed by the
need to comply with Directive 91/271/EEC in particular, was a factor in deciding to concentrate
all waste water treatment at the single existing site in Ringsend, as a second new plant (such as
that originally planned for Baldoyle) would have entailed a long planning process.
However, a key problem with the water sector in Ireland has been the lack of full cost recovery
and in particular the complete lack of domestic water charges, in contravention of the
“polluter pays” principle. The abolition of domestic water charges in the late 1990s was a very
poor political decision (to put it at its mildest), and was accommodated in the Water
Framework Directive149. This placed a significant ongoing financial burden on the Irish local
authorities; however, it should be resolved by the planned reintroduction of domestic water
charges in the coming years.
149
Water Framework Directive, Article 9(4). See also
http://www.philiplee.ie/Libraries/Publications/Water_Framework_Directive_Council_Review_-_Issue_30.sflb.ashx

69
5 CONCLUSIONS
Here we present the results and lessons learnt from our quantitative and qualitative analysis of
the project. Impacts have been considered under seven headings, as summarised in Table 5.1:
Table 5.1 NATURE AND STRENGTH OF IMPACTS
Strength*
(-5 to +5)
Level Identified and Analysed
Quantitatively (CBA)
Qualitatively
1. Direct economic growth +3 Local, regional √
2. Endogenous dynamics +2 Regional, national √ √
3. Social cohesion -1 Local, regional √
4. Environmental effects +4 Regional, national √ √
5. Territorial cohesion +1 Local, regional √
6. Institutional quality +1 Regional, national √
7. Social happiness -1 Local, regional √
*-5 = net highly negative effect; 0 = net neutral effect; +5 = net highly positive effect.
The strongest impacts were felt in terms of direct economic growth and environmental quality.
While the project was not self-sustaining financially and thus required subvention (partly due
to the lack of domestic water charges), it generated a positive socio-economic return
compared to the counterfactual (NPV of EUR 335 million), with the largest benefit related to
household Willingness To Pay (WTP) for improvements in water quality in Dublin Bay.
Short term economic impacts were felt directly from the planning, construction and operations
of the plant. We estimate that construction to date and in the future will generate some 4,600
work years of employment. The plant itself current employs approximately 50 people.
Environmental quality was strongly enhanced by the project, with a significant improvement in
water quality in Dublin Bay, and further improvement possible with the installation of
increased capacity and a long sea outfall in the coming years. The proper treatment of sludge
has been a further positive. Some negatives arise in terms of the odour problem in the initial
years (now resolved), and the fact that not all sludge can be fully treated because of the
greater than expected pollution load on the plant.
The plant has enabled water-using industry in the city (notably Guinness Brewery) to have its
waste water treated to the required standard (industry made a contribution of EUR 44 million
[current prices, VAT inclusive] to the initial capital investment cost). It has also facilitated an
expansion of housing and population, by providing proper waste water treatment in
accordance with Directive 91/271/EEC.
Endogenous dynamics effects were also positive, in terms of technological progress, and many
of these benefits may be felt outside Ireland. Worthy of note also are the social happiness
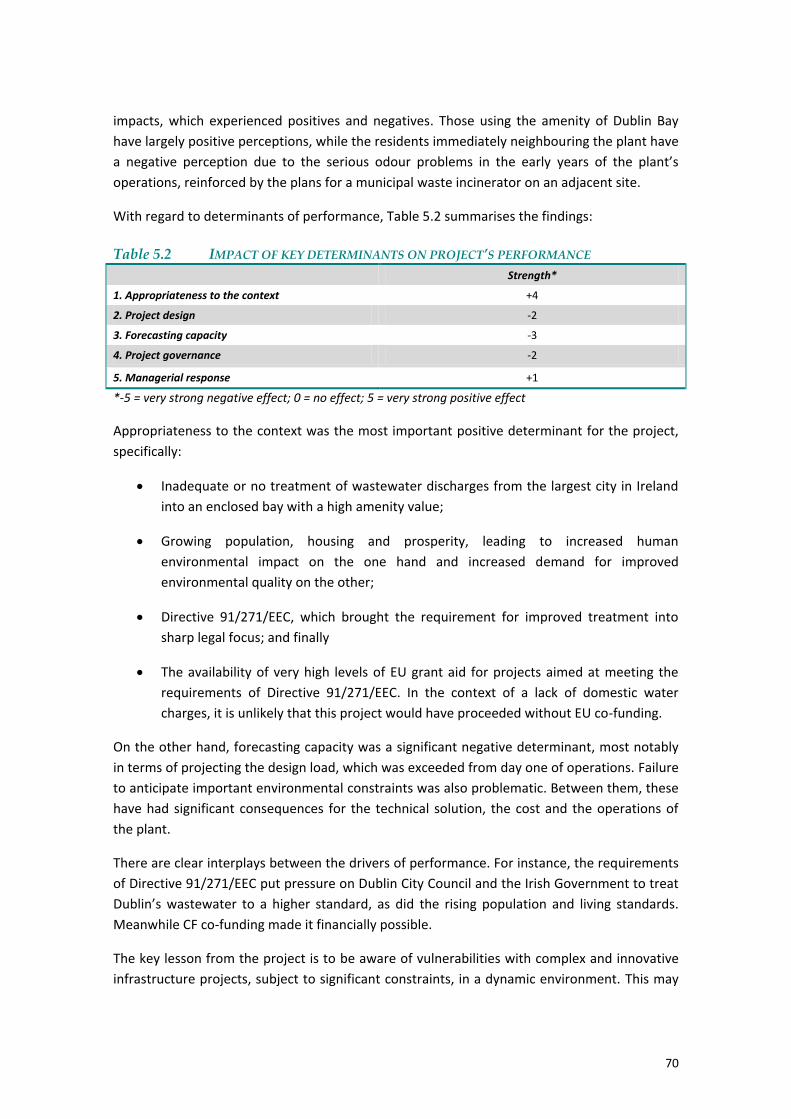
70
impacts, which experienced positives and negatives. Those using the amenity of Dublin Bay
have largely positive perceptions, while the residents immediately neighbouring the plant have
a negative perception due to the serious odour problems in the early years of the plant’s
operations, reinforced by the plans for a municipal waste incinerator on an adjacent site.
With regard to determinants of performance, Table 5.2 summarises the findings:
Table 5.2 IMPACT OF KEY DETERMINANTS ON PROJECT’S PERFORMANCE
Strength*
1. Appropriateness to the context +4
2. Project design -2
3. Forecasting capacity -3
4. Project governance -2
5. Managerial response +1
*-5 = very strong negative effect; 0 = no effect; 5 = very strong positive effect
Appropriateness to the context was the most important positive determinant for the project,
specifically:
Inadequate or no treatment of wastewater discharges from the largest city in Ireland
into an enclosed bay with a high amenity value;
Growing population, housing and prosperity, leading to increased human
environmental impact on the one hand and increased demand for improved
environmental quality on the other;
Directive 91/271/EEC, which brought the requirement for improved treatment into
sharp legal focus; and finally
The availability of very high levels of EU grant aid for projects aimed at meeting the
requirements of Directive 91/271/EEC. In the context of a lack of domestic water
charges, it is unlikely that this project would have proceeded without EU co-funding.
On the other hand, forecasting capacity was a significant negative determinant, most notably
in terms of projecting the design load, which was exceeded from day one of operations. Failure
to anticipate important environmental constraints was also problematic. Between them, these
have had significant consequences for the technical solution, the cost and the operations of
the plant.
There are clear interplays between the drivers of performance. For instance, the requirements
of Directive 91/271/EEC put pressure on Dublin City Council and the Irish Government to treat
Dublin’s wastewater to a higher standard, as did the rising population and living standards.
Meanwhile CF co-funding made it financially possible.
The key lesson from the project is to be aware of vulnerabilities with complex and innovative
infrastructure projects, subject to significant constraints, in a dynamic environment. This may

71
be particularly problematic in contexts where technical expertise is weak, and demand data or
forecasting capacity is limited.

72

73
ANNEX I. METHODOLOGY OF
EVALUATION
The present Annex summarises the methodological approach undertaken for carrying out the
project case studies and presented in the First Intermediate Report of this evaluation study.
Moreover, the Annex further elaborates on and specifies the definition of long-term effects
considered throughout the case study and the typology of determinant mechanisms analysed
in interpreting the project outcomes. The main objective is to provide the reader with a set of
information describing how the project evaluation was conducted and to enable him/her to
replicate this methodology.150
The Annex is divided into three parts: in the first one, the overall conceptual framework of the
evaluation study is recalled and the definition of long-terms effects and project determinants
are laid out; in the second one, the methodology of analysis followed to implement the ex-post
evaluation is discussed; finally, the structure of the case study reports and the tools used to
standardise them is described in the third part.
CONCEPTUAL BASIS
The Conceptual Framework of this evaluation study is based on three dimensions of analysis:
the object of the evaluation (the ‘What’), the timing of the long-term effects (the ‘When) and
the determinants of the project’s outcomes (the ‘How’).
The ‘What’ dimension
The Team developed a classification of long-term effects, with the aim of identifying all the
possible impacts of public investments on social welfare. A broad distinction of project effects
is among effects on ‘Economic development’ or ‘Quality of life’. Investment projects can foster
economic development, which is generally quantifiable by aggregate indicators, such as the
Gross Domestic Product; although economic development is not disconnected from the
wellbeing of society, it is acknowledged that there are a number of other factors that may
affect public welfare, that are not captured by the traditional economic indicators151. For the
purpose of this study, the notion of quality of life152 refer to the factors that affect social
development, the level of social satisfaction, the perception of social reality and other
dimensions which are outside the conventional economic dimension. Under these two broad
categories, a taxonomy of more specific long-term development effects of investment projects
has been developed. The definition of each type of effect is provided in Table I.1.
150
Specific recommendations which may enable application of the same evaluation methodology to future projects are discussed in the Final Report of this evaluation study. 151
Dasgupta, 2011 and Stiglitz et al., 2009. 152
Used also as synonymous with wellbeing, as mentioned in the ToR.
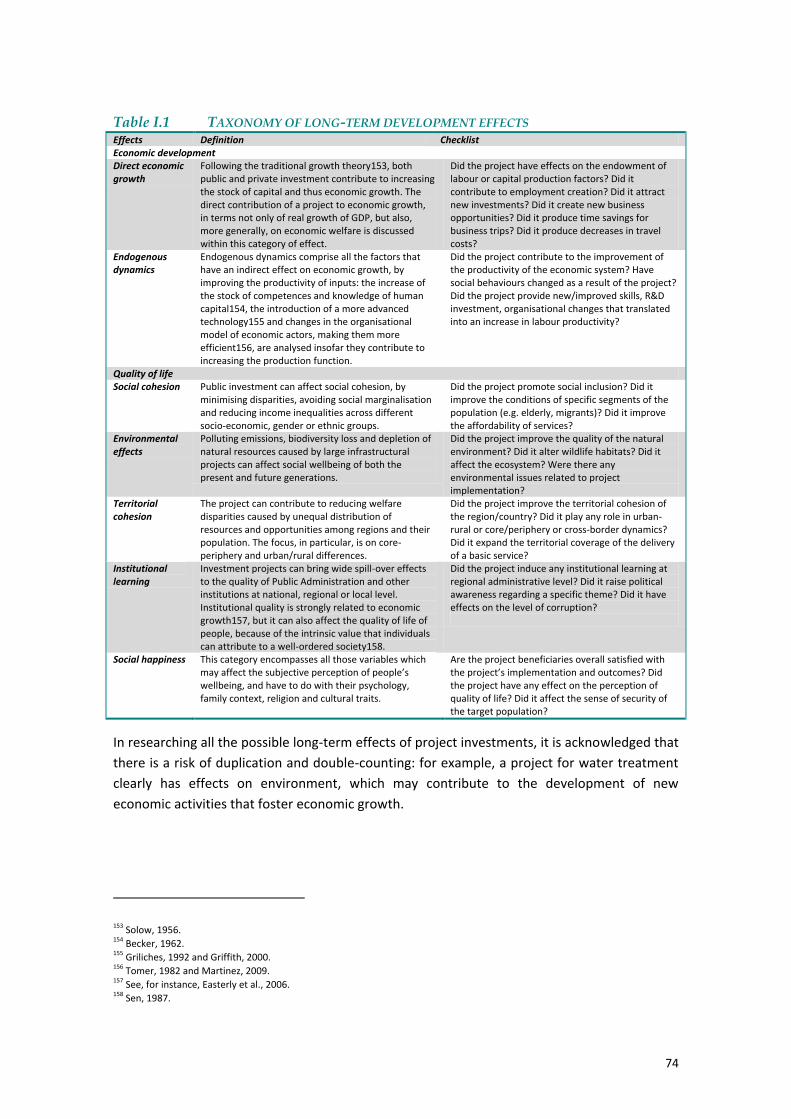
74
Table I.1 TAXONOMY OF LONG-TERM DEVELOPMENT EFFECTS Effects Definition Checklist Economic development Direct economic growth
Following the traditional growth theory153, both public and private investment contribute to increasing the stock of capital and thus economic growth. The direct contribution of a project to economic growth, in terms not only of real growth of GDP, but also, more generally, on economic welfare is discussed within this category of effect.
Did the project have effects on the endowment of labour or capital production factors? Did it contribute to employment creation? Did it attract new investments? Did it create new business opportunities? Did it produce time savings for business trips? Did it produce decreases in travel costs?
Endogenous dynamics
Endogenous dynamics comprise all the factors that have an indirect effect on economic growth, by improving the productivity of inputs: the increase of the stock of competences and knowledge of human capital154, the introduction of a more advanced technology155 and changes in the organisational model of economic actors, making them more efficient156, are analysed insofar they contribute to increasing the production function.
Did the project contribute to the improvement of the productivity of the economic system? Have social behaviours changed as a result of the project? Did the project provide new/improved skills, R&D investment, organisational changes that translated into an increase in labour productivity?
Quality of life Social cohesion Public investment can affect social cohesion, by
minimising disparities, avoiding social marginalisation and reducing income inequalities across different socio-economic, gender or ethnic groups.
Did the project promote social inclusion? Did it improve the conditions of specific segments of the population (e.g. elderly, migrants)? Did it improve the affordability of services?
Environmental effects
Polluting emissions, biodiversity loss and depletion of natural resources caused by large infrastructural projects can affect social wellbeing of both the present and future generations.
Did the project improve the quality of the natural environment? Did it alter wildlife habitats? Did it affect the ecosystem? Were there any environmental issues related to project implementation?
Territorial cohesion
The project can contribute to reducing welfare disparities caused by unequal distribution of resources and opportunities among regions and their population. The focus, in particular, is on core-periphery and urban/rural differences.
Did the project improve the territorial cohesion of the region/country? Did it play any role in urban-rural or core/periphery or cross-border dynamics? Did it expand the territorial coverage of the delivery of a basic service?
Institutional learning
Investment projects can bring wide spill-over effects to the quality of Public Administration and other institutions at national, regional or local level. Institutional quality is strongly related to economic growth157, but it can also affect the quality of life of people, because of the intrinsic value that individuals can attribute to a well-ordered society158.
Did the project induce any institutional learning at regional administrative level? Did it raise political awareness regarding a specific theme? Did it have effects on the level of corruption?
Social happiness This category encompasses all those variables which may affect the subjective perception of people’s wellbeing, and have to do with their psychology, family context, religion and cultural traits.
Are the project beneficiaries overall satisfied with the project’s implementation and outcomes? Did the project have any effect on the perception of quality of life? Did it affect the sense of security of the target population?
In researching all the possible long-term effects of project investments, it is acknowledged that
there is a risk of duplication and double-counting: for example, a project for water treatment
clearly has effects on environment, which may contribute to the development of new
economic activities that foster economic growth.
153
Solow, 1956. 154
Becker, 1962. 155
Griliches, 1992 and Griffith, 2000. 156
Tomer, 1982 and Martinez, 2009. 157
See, for instance, Easterly et al., 2006. 158
Sen, 1987.

75
The ‘When’ dimension
The temporal dimension of analysis relates to the point in the project’s lifetime at which the
effects materialise for the first time, how they develop over time and whether they have
already stabilised or are still evolving. A clear distinction emerges between short-term and
long-term effects, with the former being the first contributions made by the project and
enjoyed by society after a relatively short time following project completion (about 1-5 years);
the latter, on the other hand, become visible after a longer period of time and tend to stabilise
over many years. It is acknowledged that, given the varying timeframe for different effects to
appear and stabilise, the choice of the time horizon and the timeframe at which the ex-post
evaluation is carried out can significantly affect the results of the evaluation.
The ‘How’ dimension
Project outcomes, i.e. the way projects affect the generation of certain effects and the varying
timeframe for effects to appear and stabilise, are not certain, but result from a non-
deterministic combination of different and interrelated factors. Five stylised determinants of
project outcomes have been identified: appropriateness to the context, project design,
forecasting capacity, project governance and managerial response. Five Working Hypotheses
are related to these dimensions and explain how each of them can influence the generation of
the project’s short or long-term effects (see Table I.2).
The three dimension of analysis are logically interconnected and by combining the ‘What’,
‘When’ and ‘How’ dimensions the evaluator can disentangle the causal chain between the
project’s inputs and the outputs.
METHODOLOGY OF ANALYSIS
The methodology developed to answer the evaluation questions consists of a combination of
quantitative (Cost Benefit Analysis) and qualitative (personal interviews, surveys, searches of
government and newspaper archives, etc.) techniques. Qualitative techniques are probably
better at determining why certain effects are generated, along what dimensions, and
underlying causes and courses of action of the delivery process. The media (including websites
or blogs), in particular, have proved to be an excellent source of evidence identifying or
revealing both objective information and perceptions about the project, thus concurring to
assess the project’s impact on social happiness. At the same time, quantitative data can
provide an important support to test and validate certain findings derived from interviews and
other sources. The most important contribution of the CBA exercise is to provide a framework
of analysis to identify the most crucial aspects of the projects’ ex-post performance and final
outcome159.
159
More details on the approach adopted to carry out the ex-post CBA exercise and, in particular, indications on project identification, time horizon, conversion factors and other features are extensively described in the First Intermediate Report of this evaluation study.

76
Table I.2 KEY DETERMINANTS OF PROJECT OUTCOMES CONSIDERED Determinant Definition Working Hypothesis Questions to be answered Appropriateness to the context
Includes the consideration of institutional, cultural, social and economic environment into which the project is inserted.
Context traits can be more or less favourable for project performance and deserve early and careful consideration about which to take or to make. The terminology of context traits that can be either ‘taken’ (that is, accepted, as they are considered unchangeable) or ‘made’ (by changing existing or creating new traits) is drawn from Hirschman (1967).
Has the (political, cultural, socio-economic, institutional, regulatory) context played a role in influencing the attainment of long-term effects? Were there any political, social, cultural, economic, regulatory, or institutional constraints to project implementation and performance? Was the project ‘trait taking’ or ‘trait making’ in its nature? If it was intended to be trait making, did it succeed?
Project design Refers to the technical capacity to design the infrastructure project and to select the best project option.
The technical and engineering capacity to design an infrastructure and to provide the appropriate mechanism for its financial sustainability should be sufficiently disciplined to reduce future risks; at the same time it should leave some degrees of ‘latitude’ to enable adjustments for unforeseen circumstances. Following Hirschman, latitude is the characteristic of a project that permits the project planner and operator to mould it, or to let it ‘slip’, in one direction or another. Some projects are so structured that latitude is severely restricted or completely absent: in these cases, the project is considered highly ‘disciplined’.
To what extent and in what way did the technical, structural and financial features of the project influence its performance? Did the option selection process lead to the implementation of the most promising project idea? Was project design capacity a relevant factor in determining the observed ex-post performance of the project? Was the project design flexible enough to be adjusted, if needed, to external and unexpected constraints?
Forecasting capacity
Relates to the feasibility and capacity to predict future variables, such as the demand level.
A good initial investment in building the forecasting capacity does not eliminate risks, but it increases the knowledge of the context, improves the project design and optimises the distribution of responsibilities without lowering the commitment to performance.
Were the ex-ante forecasts based on a sound methodology and a comprehensive set of information? Were some important factors not sufficiently considered ex-ante? Was the forecasting capacity a relevant factor in determining the observed ex-post performance of the project?
Project governance
Concerns the number and type of stakeholders involved throughout the project cycle and how responsibilities are attributed and shared.
High stakeholder involvement, well-defined roles and responsibilities and incentive mechanisms require commitment of resources and increase the complexity of the decision-making process, which may be subject to particular pressures, but they can favour the project performance and its sustainability over time.
What are the interests and motives of different actors and incentives for decision-making? How did they change over the time-span considered? Was the ownership of the project clearly identified? Did contractual arrangements improve the co-ordination of different stakeholders towards achievement-oriented results? Was project visibility a relevant political incentive to foster proper project implementation? Was the project subject to political or other forms of pressure?
Managerial response
Defined as the managerial and professional ability to react to unforeseen events.
Unpredicted events that occur and undermine the sustainability of the project and its capacity to lead to expected benefits can be overcome by prompt and adequate response from the decision-makers and project managers, driven either by professionalism and experience or by creativity and imagination.
How did the project react to exogenous, unpredictable, events? What remedial actions were put in place? What mechanisms were used to incentivise proactive responses? Why were these events unexpected? Was it due to their purely exogenous and ex-ante unpredictable nature? Or, was it due to poor planning capacity?

77
STRUCTURE OF CASE STUDIES AND STANDARD TABLES OF RESULTS
Qualitative and quantitative findings are integrated in a narrative way, in order to develop ten
project ‘histories’ and to isolate and depict the main aspects behind their long-term
performance. All case study reports share the same outline, presented in the following Table:
Table I.3 OUTLINE OF THE CASE STUDY REPORT
SECTION CONTENT
Projects description
The first section provides a brief sketch of the unit of analysis. It describes the key structural features of the infrastructure and the service delivered, the context in which it takes place, the target population and the current performance of the project.
Origin and history This section describes the background in which the decision to initiate the project was taken, the need and objectives expected be met and the key stakeholders involved and their role. The section should present a brief chronicle of the main developments after the construction phase and the most recent facts.
Description of long-term development effects
This section should describe the main long-term development effects provided by the project. The seven categories of effects should be considered and for each of them an assessment of the contribution of the project to that specific effect, and the timing of their materialisation and evolution, should be given.
Determinants of project outcomes
The main drivers influencing the performance observed are described and elaborated here. The evaluators should provide their own assessment for each of the five key determinants of project outcomes identified in the conceptual framework.
Conclusions The key messages in terms of lessons learnt are developed here.
Annexes Ex-post cost-benefit analysis report, list of interviewees, other ad hoc analysis if relevant (such as stakeholder mapping).
In order to maintain the structure of all the case study reports as similar as possible, and
facilitate the cross-project analysis of findings, a set of standard tables is used to summarise
the main evaluation results related to three dimensions of analysis (‘What’, ‘When’ and ‘How’).
Section 3 and 4 of each case study include standardised tables in which scores are assigned to
each type of long-term effect and each determinant. Scores ranging from -5 to +5 are given in
order to intuitively highlight which are the most important effects generated for each case
study and which are the most relevant determinants explaining the project outcomes. In other
words, scores are used to rank the effects and determinants, showing which ones are the most
relevant. Moreover, the plus or minus signs indicate the nature of the effects produced by the
project (was the impact positive or negative?) and of the determinant of project performance
(did the determinant positively or negatively contribute to the project outcome?).
The same scores are used to disentangle the project’s impacts on different stakeholders. This
table allows one to better interpret the aggregated score given to each effect, by
understanding on which actor the project impacted the most: for example, a +3 score to
“Direct economic growth” may be reflected by a very high positive effect on the infrastructure
operator (valued, for instance, +5) and a slightly negative effect on other actors (valued -2). As
shown by this example, the aggregate score of each effect and the scores related to different
stakeholders should be consistent with each other and should results from a sort of weighted
average of the impacts on individual stakeholders: an aggregate positive score is inconsistent
with negative impact scores on all the different stakeholders involved.
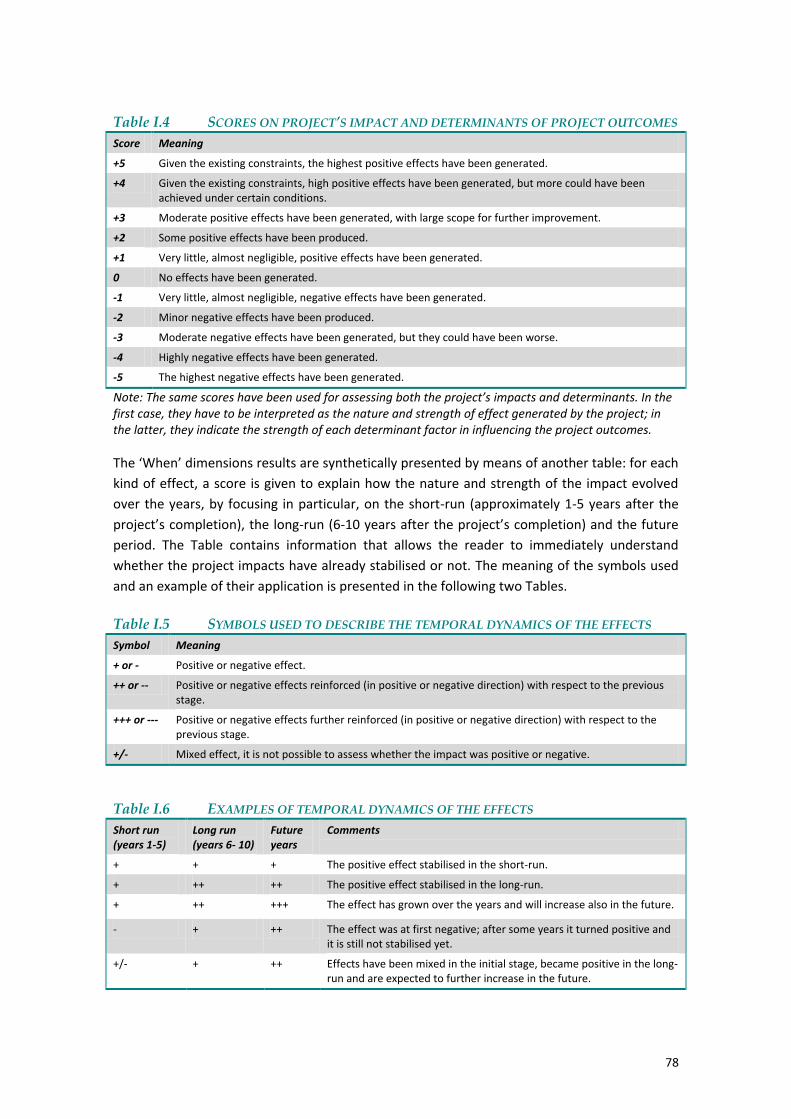
78
Table I.4 SCORES ON PROJECT’S IMPACT AND DETERMINANTS OF PROJECT OUTCOMES
Score Meaning
+5 Given the existing constraints, the highest positive effects have been generated.
+4 Given the existing constraints, high positive effects have been generated, but more could have been achieved under certain conditions.
+3 Moderate positive effects have been generated, with large scope for further improvement.
+2 Some positive effects have been produced.
+1 Very little, almost negligible, positive effects have been generated.
0 No effects have been generated.
-1 Very little, almost negligible, negative effects have been generated.
-2 Minor negative effects have been produced.
-3 Moderate negative effects have been generated, but they could have been worse.
-4 Highly negative effects have been generated.
-5 The highest negative effects have been generated.
Note: The same scores have been used for assessing both the project’s impacts and determinants. In the first case, they have to be interpreted as the nature and strength of effect generated by the project; in the latter, they indicate the strength of each determinant factor in influencing the project outcomes.
The ‘When’ dimensions results are synthetically presented by means of another table: for each
kind of effect, a score is given to explain how the nature and strength of the impact evolved
over the years, by focusing in particular, on the short-run (approximately 1-5 years after the
project’s completion), the long-run (6-10 years after the project’s completion) and the future
period. The Table contains information that allows the reader to immediately understand
whether the project impacts have already stabilised or not. The meaning of the symbols used
and an example of their application is presented in the following two Tables.
Table I.5 SYMBOLS USED TO DESCRIBE THE TEMPORAL DYNAMICS OF THE EFFECTS
Symbol Meaning
+ or - Positive or negative effect.
++ or -- Positive or negative effects reinforced (in positive or negative direction) with respect to the previous stage.
+++ or --- Positive or negative effects further reinforced (in positive or negative direction) with respect to the previous stage.
+/- Mixed effect, it is not possible to assess whether the impact was positive or negative.
Table I.6 EXAMPLES OF TEMPORAL DYNAMICS OF THE EFFECTS
Short run (years 1-5)
Long run (years 6- 10)
Future years
Comments
+ + + The positive effect stabilised in the short-run.
+ ++ ++ The positive effect stabilised in the long-run.
+ ++ +++ The effect has grown over the years and will increase also in the future.
- + ++ The effect was at first negative; after some years it turned positive and it is still not stabilised yet.
+/- + ++ Effects have been mixed in the initial stage, became positive in the long-run and are expected to further increase in the future.

79
ANNEX II. COST-BENEFIT ANALYSIS
This annex presents the ex-post CBA of the Dublin Wastewater Treatment project (DWWT).
The purpose is to quantitatively assess the performance of the project. The methodology
applied is in line with the technical note provided in the First Interim Report and, more
generally, with the EC Guide (European Commission, 2008). This annex presents in more detail
the assumptions, inputs and results of the CBA, along with scenario and risk analysis.
METHODOLOGY, ASSUMPTIONS AND DATA GATHERING
The CBA incorporates the following assumptions:
Project identification
The unit of analysis comprises the following elements of infrastructure:
i. the major improvements to the Ringsend wastewater treatment plant, in the
centre of Dublin, incorporating –
“interim sludge treatment” improvements at the start of the project,
upgrade to secondary and partial tertiary (UV) treatment,
a major increase in capacity to cater for almost all the wastewater arising in
the Dublin NUTS III region,
full sanitary sludge treatment to generate biogas and fertilizer (“biofert”),
Electricity generation from the biogas, for internal consumption.
ii. The northern interceptor sewer, to collect wastewater from the northern
fringe of the city;
iii. The pumping station at Sutton and the submarine pipeline, to convey the
wastewater from the northern interceptor sewer to the Ringsend plant;
iv. A pumping station at Bullock Harbour to facilitate connection to the pre-
existing Dun Laoghaire pumping station;
v. Other minor upgrade works;
vi. Subsequent investments in the plant, primarily to deal with the problem of
odour;
vii. The planned future increase in capacity and installation of a long sea outfall to
discharge final effluent outside the Liffey estuary area, thus avoiding the
requirement to upgrade the plant to full tertiary treatment level (i.e. nutrient
removal).

80
In addition, as part of the Design-Build-Operate contract, both Dublin City Council and the
concessionaire Celtic Anglian Water (CAW) are required to contribute to a plant
replacement fund, which will fund the entire replacement of plant and machinery in the
final year of the concession (2020). This will clearly represent a major cost; however, it
will also contribute substantially to the residual value of the plant at the end of the
evaluation period (2025). The cost of this replacement programme is difficult to estimate,
and the respective share of the cost between DCC and the concessionaire CAW is not
disclosed. We have ignored this investment cost item, as it will make little net difference
to the net return on the project.
On this basis, the total capital cost of the project, as well as funding sources, is
summarised in Table II.1 (current Euros).
Table II.1 CAPITAL EXPENDITURE AND FUNDING DWWT (EUR’000S, CURRENT
PRICES, VAT EXCL.)
Total Cost
Funding Funding %age
Stage I & II EU CF Industrial users*
Irish
Public
Sector
EU CF
Industrial users
Irish
Public Sector
Interim sludge Treatment 16,214
Bullock Harbour & Related Works 27,794
Sub-total 44,008 35,936
8,072 81.7%
0.0% 18.3%
Stage IV - Submarine Pipeline Sutton to Ringsend**
57,497 23,000
34,497
40.0%
0.0% 60.0%
Stage V
Pumping Station Sutton 20,708
Northern Interceptor Sewer 47,415
Ringsend Plant 187,997
Sub-total 256,120 130,716
36,099 89,305
51.0%
14.1% 34.9%
Total Investment Cost to Date 357,625 189,652
36,099 131,874
53.0%
10.1% 36.9%
Estimated Future Expenditure (2012-2015)
Capacity Increase 25,997 25,997
100.0%
Long Sea Outfall 121,317 121,317
100.0%
Grand Total 504,938 189,652
36,099 279,188
37.6%
7.1% 55.3%
*Industrial users were required to pay the marginal capital cost of the additional capacity required to treat their wastewater, in accordance with Lawlor & Scott (1995). **Very significant cost overruns were experienced on this stage of the project. This led to a dispute between the contractor and the client (DCC), which went to arbitration and was eventually settled for EUR 23 million (included above). Source: Department of Finance, DCC, DECLG
81
In current money, total capital cost amounts to EUR 505 million; in constant 2011 money
it amounts to EUR 443 million (both VAT exclusive). It is notable that in constant 2011
prices, the project costs less than in current prices. This reflects the relative market
conditions in the construction and civil engineering sectors in Ireland in the relevant
years. The sectors have experienced severe deflation in recent years, and prices are now
back at the levels of the late 1990s160.
Time horizon
The time horizon has been set at 30 years for all the project case studies. This means that
the timeframe for the CBA of the DWWT project spans from 1995 (year zero), the year in
which construction of the first element of the project – the interim sludge works –
commenced, to 2025 (year 30). Since the point of view is today (2011), the analysis
presents a mix of historical and forecast data.
Constant prices
The analysis is carried out in constant 2011 Euros. Data from 2012 et seq. are estimated in
real terms (2011 prices, no inflation), while available data up to 2011 are historical and
therefore have been inflated to convert them into 2011 Euro.
Discount rates
Discount rates are as per the guidance in the First Interim Report. The financial discount
rate is 5.0% real for both backward and forward analysis. In the economic analysis,
specific social discount rates for Ireland for past and the future periods have been
calculated. A real backward social discount rate of 9.1% and a real forward social discount
rate of 4.0% have been used.
Counterfactual scenario
All cash flows are incremental against a ‘Do Nothing’ scenario, i.e. a continuation of the
position prior to the project, whereby the Ringsend plant only treated waste water from
the centre and south of Dublin, and then only to primary treatment level. Waste water
from the north of Dublin would continue to be discharged untreated from the Nose of
Howth. This scenario would of course be in contravention of the Urban Waste Water
Directive, among others, and would in time have attracted significant financial fines from
the EU. However, we do not include the possibility of such financial sanctions in the
analysis161. The purpose of the counterfactual is to have a physically feasible basis for
comparison of the costs and benefits of ‘Do Project’, rather than present a fully realisable
alternative project per se.
160
Based on a Water & Sanitary Services deflator provided to DKM by the Water Services section of the DECLG. 161
On the same basis that cost is not stated net of EU grant aid, except in the “national return” as part of the financial analysis.

82
An alternative ‘Do Something’ scenario does present itself, in terms of proceeding with a
separate secondary waste water treatment plant for the north of Dublin at Baldoyle, and
upgrading the Ringsend plant to deal purely with its pre-existing load. However, it did not
prove possible to estimate an accurate set of investment and operational costs for this
alternative, and we are forced to deal only with ‘Do Project’ and ‘Do Nothing’.
The capital investment required for ‘Do Nothing’ is based on estimates from COWI (2011),
and involves expenditure of approximately EUR 25 million (2002 Euros) over a number of
years starting in 1998, and again in 2018. Operating costs are based on a continuation of
the Ringsend operating costs prior to the implementation of ‘Do Project’, adjusted for
inflation.
We also assume that EU grant aid would not be available for this counterfactual, as there
would be no basis for the EU to co-fund such a project (indeed, as indicated, it would be
potentially subject to substantial EU fines).
Data sources
The main project-specific data sources have been DCC, CAW, Department of Finance,
DECLG, and the EU Commission DG Regio, as well as interviews, review of the media and
previous CBAs.
At a more general level, the usual economic and demographic data are available,
including population census data for 1991, 1996, 2002, 2006 and 2011. In particular,
population and GDP data were available for the at NUTS III regional level. Future long
term economic forecasts are based on Central Bank and IMF sources, while demographic
forecasts are derived from DKM’s regional demographic model.
Residual Value
The civil engineering elements of built assets are taken to have a useful life of fifty years,
and this useful life is assumed to depreciate on a straight-line basis. As of project year 30,
the undepreciated residual value of these assets is credited back to the project. Land is
taken to have an infinite life, but since there has been a waste water treatment plant on
the site since 1906, it has been ignored. All machinery and equipment is taken to have a
NIL value at year 30162.
FUTURE SCENARIO
This CBA is a combination of an ex-ante and an ex-post analysis, since the time horizon covers
17 years in the past (1995-2011), for which historical data are available and 14 years in the
future (2012-2025).
162
This is notwithstanding the requirement to replace all the M&E plant in the final year of the DBO concession, as explained in an earlier footnote.

83
A number of capital investments – to expand capacity and install a long sea outfall tunnel - are
expected to occur in the future, as discussed above and summarised in Table II.1.
Future operating costs, in terms of the payments DCC make to the concessionaire CAW, will
increase in line with these capital investments. The concession ends in 2022, at which point
DCC may put out a new concession to tender or decide to operate the plant itself (which would
eliminate the concessionaire’s profit from the apparent operating costs). For convenience, we
assume a new concession period is put in place, and that operating costs remain unchanged in
real terms thereafter.
One issue not specifically taken into account is the fact that the Government plans to
introduce metered water charges for all domestic users over the coming years. This is likely to
have some dampening effect on the pollution load reaching the plant, in volumetric terms at
least, and hence the requirement for increased capacity. However, we were not in a position
to model this.
FINANCIAL ANALYSIS
Sources of financing
The financing of the project is summarised in Table II.1 above. In terms of expenditure to date,
The EU has contributed 53% of costs, the Irish public sector contributed 37% and local industry
made capital contributions totalling 10%. Future capital expenditure is expected to be fully
funded by the Irish public sector.
Operating cost and revenues
Operating costs with respect to the project as it stands now are expected to remain at their
2011 level (approximately EUR 23 million paid by DCC to the concessionaire)163. Additional
operating costs will apply when the plant capacity is upgraded and the long sea outfall is put in
place, adding an estimated net EUR 1.8 million and EUR 4 million per annum respectively to
operating costs (2011 prices)164.
DCC does earn revenues with respect to the treatment plant, from the major industrial
customers of the plant. These make a contribution towards the DCC’s payments to the
concessionaire. In Ireland, commercial and industrial customers pay water charges to their
respective local authorities, mostly based on metered water usage. Total revenues in 2010
were approximately EUR 3.3 million (current Euros).
However, the water industry is not commercialised and there is little transparency in the
charging system. Most importantly, domestic customers pay no water charges, although it is
163
Ideally, we would use the actual operating costs incurred by the concessionaire CAW, but this information is not available. While CAW’s financial statements are lodged with the Irish Companies Registration Office (www.cro.ie), because the company operates a number of water supply and wastewater treatment plants around Ireland, it is not possible to isolate operational financial data for the Ringsend plant. 164
Operating costs are as per COWI (2011), confirmed by DCC.

84
planned that charges will be introduced in the coming years, in the context of a
commercialisation of the entire water industry. Because of this, we only consider the industrial
revenues to DCC in the financial analysis below, and ignore them for the purposes of the socio-
economic analysis.
Results of Financial analysis
Using the cost-benefit methodology described above, we calculated:
the Financial Net Present Value and the Financial Rate of Return on investment –
FNPV(C) and FRR(C), and
the Financial Net Present Value and Financial Rate of Return on national capital –
FNPV(K) and FRR(K), i.e. net of EU grant aid.
The results are presented in Table II.2, comparing ‘Do Project’ and ‘Do Nothing’ (detailed
tables at back of Annex).
Table II.2 FINANCIAL CBA OF DWWT
Investment Return FNPV(C)
EUR million
FRR(C) FBCR(C)
Do Project -862 -11.6% 0.10
Do Nothing -53 * 0.47
Net NPV for Project -809 -11.4%
National Return FNPV(K)
EUR million
FRR(K) FBCR(K)
Do Project -611 -11.2% 0.13
Do Nothing -53 * 0.47
Net NPV for Project -558 -11.0%
*not calculated.
The table confirms that, on a purely financial basis, the project as an investment would not
have been viable, and required subvention. Financial NPV of the project is approximately –EUR
0.86 billion. With EU grant aid, it generates a financial return on national capital of
approximately –EUR 0.61 billion. The highly negative result is due in large part to the annual
payments to the concessionaire, which is not recovered via user charges.
On the basis of our assumptions, the Do Nothing option is also non-viable, generating a
Financial NPV of –EUR 53 million. This is reflective of very limited capital investment and low
operating costs for the pre-existing primary treatment plant. It is worth keeping in mind that in
the financial analysis we ignore the likelihood that Ireland would be subject to a substantial
fine for failure to comply with Directive 91/271/EEC under this option. These fines could
exceed EUR 40 million per annum165.
165
See http://www.greenstar.ie/docs/2010/DKM%20-%20Greenstar%20paper%20on%20EU%20fines.pdf.

85
ECONOMIC ANALYSIS
Having assessed the purely financial performance of the project and compared it with the ‘do
nothing’ counterfactual, the next step is to consider the project from a socio-economic
viewpoint. This involves:
conversion of market prices to accounting (true economic or shadow) prices, and
Inclusion of external costs and benefits.
FROM MARKET TO ACCOUNTING PRICES
Financial Costs and Benefits
In the economic analysis all input data are converted from financial to shadow prices, in order
to reflect their opportunity costs. The conversion factors defined in the First Interim Report
have been applied, namely:
Table II.3 SHADOW PRICE CONVERSION FACTORS DWWT
Resource Conversion Factor Source
Land n/a 1st Interim Report, Volume 1, Table AII.8
Labour 1.00 1st Interim Report, Volume 1, Table AII.13
traded goods & Services* 0.989/1.00 1st Interim Report, Volume 1, Table AII.8
non-traded goods & Services* 0.989/1.00 1st Interim Report, Volume 1, Table AII.8
Other* 0.989/1.00 1st Interim Report, Volume 1, Table AII.8
Public funds 1.25/1.5 See discussion below.
*backward/forward.
The shadow price of public funds is relevant to actual public sector expenditure (net of EU
funding and industrial wastewater revenue earned by DCC), to reflect the distortionary impact
of non-optimal taxes raised to fund public expenditure on the project as well as crowding out
of private expenditure. The EU Commission 2008 Guide to CBA indicates that “If there are no
national guidelines on this issue, MCPF (marginal cost of public funds) = 1 is the default rule
suggested in this Guide” (p.54).
National guidelines do exist for Ireland. CSF evaluation Unit (1999) states: “we recommend
that a shadow price of 150% be applied to Exchequer cash flows (taxes, subsidies and grants)
to take account of the distortionary effect of taxation” (p.15). This is in line with the
recommendations in Honohan (1998), who noted that the appropriate figure in the mid-1980s
would have been in excess of 200%, the reduction over time reflecting lower marginal income
tax rates.
More recently, Murphy et al. (2003) in a report to the State enterprise promotion authority,
have recommended using 1.25, reflecting further reductions in marginal income tax rates.

86
On this basis, we apply a rate of 1.5 for expenditure in the 1980s and 1990s, and 1.25 for
expenditure in the 2000s and the current decade166.
Externalities and their Valuation
The key benefit of this project from a socio-economic viewpoint is the improvement in the
water quality of Dublin Bay. This is largely an external benefit, which is not captured in the
market (given the lack of household wastewater charges in Ireland), although some of the
benefit may be reflected in increased property valuations.
The methodology adopted to estimate this benefit is the same as used in the Ría de Vigo
project, and is based on Pearce et al’s (2004) approach for the evaluation of environmental
projects, and on WATECO (2003)167. This approach identifies user benefits (related to actual,
planned or possible use) and non-user benefits, which in turn are divided into:
existence (unrelated to usage by anyone),
altruistic (related to usage by others now) and
bequest (related to usage by future generations) benefits.
Two notable key differences between Ría de Vigo and DWWT are that:
i. there is no commercial fishing in Dublin Bay, and as far as we are aware, no
concrete plans to develop such a fishery in the future. That said, in Ría de Vigo no
economic benefits were identifiable from the project in respect of these
fisheries168.
ii. Dublin Bay, while a valuable amenity for the population of Dublin, and a valuable
addition to the attractions of Dublin, is not a major tourism focus per se.
However, fisheries and tourism benefits would not be expected to be reflected in households’
WTP for the environmental benefits delivered. In the Ría de Vigo case study, a valuation of
EUR86.24 per household was derived, based on a sample of 30 Contingent Valuation Method
(CVM) studies in advanced countries, and weighted by reference to national GDP per capita169.
Eurostat indicates that in 2010 GDP per capita in Ireland was 28% higher than in Spain (PPP)170;
on this basis WTP per household in Ireland would be EUR 110.39171. This would vary by year in
166
Irish marginal income tax rates have risen again in the current decade, with the prospect of further increases. On this basis one might argue that a shadow price in excess of 1.25 should be used for the current decade. However for simplicity we leave the rate unchanged. 167
See European Commission (2008) Annex F for a more detailed discussion. 168
It is noteworthy that Spain incurred a significant fine from the EU related to the failure to comply with the Shellfish Waters Directive, because of the importance of Ría de Vigo as a commercial fishery. 169
These 30 cases were drawn from the following meta-analyses of CVM/WTP studies:
Barton (1999); US Environmental Protection Agency, Office of Water (2000); US Environmental Protection Agency, Office of Policy, Economics and Innovation (2000); US Environmental Protection Agency, Office of Policy, Economics and Innovation (2000a); Källstrøm et al. (2010). 170
http://epp.eurostat.ec.europa.eu/tgm/table.do?tab=table&init=1&language=en&pcode=tec00114&plugin=1

87
line with economic growth. It is generally accepted in the literature when applying Benefits
Transfer to adjust valuations by reference to relative income levels (see Pearce [2003] and
European Commission [2008], Annex F)172; this is subjected to further testing under the
Scenario & Sensitivity Analysis sub-section below.
The population of the Dublin NUTS III region in 2011 was 1.27 million, and we use this as
representative of the affected households173. Average household size in Dublin is estimated by
DKM at 2.63 in 2011, implying 470,000 households.
Economic performance
The economic performance of the project – Economic Net Present Value (ENPV), Economic
Rate of Return (ERR) and Benefit-Cost Ratio (EBCR) – is summarised in Table II.4 (detailed
tables at back of Annex).
Table II.4 SOCIO-ECONOMIC CBA OF DWWT PROJECT
ENPV
EUR million
ERR EBCR
Do Project 246 10.3% 1.20
Do Nothing -89 * 0.37
Net NPV for Project 335 11.7%
*not calculated.
As can be seen, at a socio-economic level, the project generates significant benefits for society,
generating an ENPV of EUR 246 million. The valid measure is compared to the counterfactual
of no up-grade or increase in capacity at the plant, which generates an ENPV of - EUR89
million. Therefore the net benefit to society of the project is an ENPV of EUR 335 million.
‘Do Project’ is significantly more positive on a socio-economic basis than on a pure financial
basis, compared to ‘Do Nothing’. This is due to the inclusion of the WTP by households for the
improvement in the waters of Dublin Bay (see further discussion below).
PREVIOUS CBAS
A number of CBAs has been undertaken on this project in the past, namely:
a) Ex ante CBA of the project by the Project Directorate, Water, waste and Agriculture
Department, EIB (1999).
171
It is widely recognised that GDP overstates the true level of income in Irish households, because of the high level of foreign direct investment (FDI) in Ireland. In 2011, GDP exceeded GNP in Ireland by 24.1% (ESRI, 2012). However, income levels in Dublin are significantly higher than in the rest of Ireland, and in view of this we have decided to use GDP in the current analysis. 172
Although there is debate as to whether the income elasticity of WTP is equal to one; e.g. Schlepfer (2007) and Hokby & Soderqvist (2001) 173
CAW estimates at the moment that the plant serves 1.1 million people. A proportion of people living in the region are relatively remote from Dublin Bay, or their nearest seaside area is outside the Bay. However, large numbers of people commute to and visit Dublin from outside the region, and our valuation incorporates non-use values which could potentially extend well beyond the region.
88
This estimated investment cost at EUR 188 million, and additional net operating costs of EUR
79 million, compared to benefits of only EUR 48 million (all present values at 1999 prices,
evaluated over 20 years at 5% discount rate).
On this basis, it concluded that
“the principal justification of the scheme does not rest in direct benefits to the local population,
but rather in the presumed externalities accruing to persons and countries further afield.”
(p.16)
However it does not elaborate on what these externalities might be.
It must be noted that actual capital and operating costs are well in excess of those used in the
EIB project appraisal. Benefits were user only, and made up of sludge as fertilizer EUR 12
million; revival of commercial fisheries EUR 3.2 million; recreation EUR 32.8 million. In reality,
disposal of sludge as fertilizer represents a cost, while there appears no prospect at the
moment of the development of commercial fisheries in the bay. The last of the categories of
benefits is estimated on the basis of 100,000 households using Dollymount strand per annum,
and a mean WTP of EUR 25 per household per annum with respect to compliance with EU
Bathing Water Directive (aggregate EUR 2.5 million per annum). Our assessment of WTP is
considerably wider, covering the entire population of Dublin and the total range of user and
non-user benefits.
b) Ex Ante CBA by Dublin Corporation (now DCC) in 1999.
This ex ante CBA was an update of a CBA undertaken at preliminary report stage (in 1993). It
estimated a capital cost of EUR 182 million and annual operating costs of EUR 7.3 million (1999
prices). It derived a highly positive return of 13.6% for the project, but included a number of
arbitrary benefits notably:
2.5% of the estimated tourism value added in the catchment;
2% of industrial and commercial value added;
An additional 5% for “other benefits”.
The methodology was thus not comparable with the current analysis.
c) Ex Post CBA by MCAL in 2004.
This ex post CBA derived an ENPV of EUR 119 million, and an ERR of 6.71%. It differs from the
current methodology in a number of respects, notably:
Annual operating costs appears to be significantly underestimated, at EUR 10.7 million
per annum;
It includes a benefit in respect of an estimated 45,000 housing units that it would not
have been possible to build in the Dublin region in the absence of the plant, due to

89
lack of wastewater treatment capacity174. We have not included this element
separately in the current study.
It adds:
“It should also be noted that it was too early in the life of the project to determine ecological
benefits due to water quality improvements in the Bay. The future inclusion of these benefits
would further increase the rate of return on the project.”
d) Most recently, the ex post CBA by COWI (2011). It generated the following results:
Table II.5 RESULTS OF COWI (2011) CBA OF DWWT (2010 PRICES)
Financial FNPV
EUR million
FRR
Do Project -674.6 -11.4%
Socio-economic ENPV
EUR million
ERR
Do Project -324.6 -4.3%
Source: COWI (2011)
The financial results are reasonably similar to our own, as one would expect, given the relative
timing of the studies. The socio-economic results differ greatly, however, and reflect a
significantly different methodology, notably:
COWI includes the benefit in respect of an estimated 45,000 housing units that it
would not have been possible to build in the Dublin region in the absence of the plant,
as per the 2004 ex post CBA.
COWI only include a very modest external benefit in terms of improved bathing water
quality, of EUR 1.2 million per annum, in accordance with the 2005 ex post CBA by
MACL.
SCENARIO AND SENSITIVITY ANALYSIS
A number of scenarios can be tested, based on alternative forecasts, namely:
Higher and Lower economic growth, which will translate into higher and lower future
WTP for environmental improvements;
As an alternative to the base case social discount rates, we also test a rate equivalent
to the social opportunity cost of capital, i.e. the return that can be generated on the
marginal project in the private sector175. The Guide to Cost Benefit analysis of
174
In accordance with a methodology developed by DKM et al. (2004). 175
In a closed economy with perfect information, no distortions and no externalities the social discount rate and the social opportunity cost of capital are equivalent.

90
Investment Projects recommends 5% real as a benchmark figure, and this is what we
use.
It is also worth testing the project’s sensitivity to the level of household WTP for improvements
to the waters of Dublin Bay (as opposed to future growth), given the relative importance of
this variable in the CBA calculations. We test scenarios whereby WTP is varied by +/-10%.
The results are presented in the tables below (socio-economic analysis only).
Table II.6 SOCIO-ECONOMIC CBA OF DWWT PROJECT - HIGH ECONOMIC GROWTH
ENPV
EUR million
ERR EBCR
Do Project 300 10.7% 1.25
Do Nothing -89 * 0.37
Net NPV for Project 390 12.1%
*not calculated
Table II.7 SOCIO-ECONOMIC CBA OF DWWT PROJECT – LOW ECONOMIC GROWTH
ENPV
EUR million
ERR EBCR
Do Project 185 9.7% 1.15
Do Nothing -89 * 0.37
Net NPV for Project 275 11.2%
*not calculated
Table II.8 SOCIO-ECONOMIC CBA OF DWWT PROJECT – SOCIAL OPPORTUNITY
COST OF CAPITAL (5% THROUGHOUT)
ENPV
EUR million
ERR EBCR
Do Project 345 10.3% 1.35
Do Nothing -69 * 0.40
Net NPV for Project 414 11.7%
*not calculated
Table II.9 SOCIO-ECONOMIC CBA OF DWWT PROJECT – WTP +10%
ENPV
EUR million
ERR EBCR
Do Project 381 11.9% 1.32
Do Nothing -89 * 0.37
Net NPV for Project 470 13.4%
*not calculated

91
Table II.10 SOCIO-ECONOMIC CBA OF DWWT PROJECT – WTP -10%
ENPV
EUR million
ERR EBCR
Do Project 111 8.5% 1.09
Do Nothing -89 * 0.37
Net NPV for Project 200 9.9%
*not calculated
While the various scenarios have the expected impact on the results, none overturns the
ranking of the alternative projects, and the project ENPV remains positive throughout. Thus we
can conclude that our results are robust to these scenarios.
With regard to the sensitivity to WTP, so long as the average household WTP in the Dublin
region is EUR83 or more per annum, then the Project is worthwhile on a socio-economic basis
(Figure I.1). Since our estimated household WTP is approximately EUR110, this gives a
reasonable degree of reassurance that the project is worthwhile. So long as actual WTP is at
least 75% of our estimate, the project will generate a positive socio-economic return.
Figure II.1 SENSITIVITY OF NET ENPV TO HOUSEHOLD WTP FOR WATER
IMPROVEMENTS
Source: Authors
RISK ANALYSIS
Monte Carlo Analysis was also performed on our CBA model, assigning a triangular distribution
to five input variables, to simulate the future uncertainty associated with these variables. The

92
peak of the distributions and their upper and lower bounds (at which points their probabilities
fall to zero) are outlined in Table II.11176.
Table II.11 PARAMETERS FOR PROBABILITY DISTRIBUTIONS FOR MODEL INPUTS
Input Variable
(Annual Growth Rates)
Peak (Baseline Scenario) Value
Lower Bound
(Probability=0)
Upper Bound
(Probability=0)
Future GDP Growth 2.8% 5.0% 0.8%
Value of CO2 emissions growth
4.0% 8.0% 0.0%
Population Growth Dublin NUT III region
0.0% 2.0% -1.0%
Avg Household size growth in Dublin NUTS III region
-0.76% 0.50% 1.50%
Future Investment cost variance
0.0% 100% -20%
The last of these variables, relating to the cost of future investments, captures the risk that
these costs will be significantly higher than expected, as often happens with major
infrastructure investments.
The results (Table II.12) confirm a strong economic NPV and internal rate of return for the
project. The simulations were run two thousand times. The computed expected value of ENPV
EUR 236 million and ERR 10.1% compare to the base case values of EUR 246 million and 10.3%
respectively.
Table II.12 OUTPUT STATISTICS OF MONTE CARLO SIMULATIONS
Economic Net
Present Value
(EUR million)
Economic Internal
Rate of Return
Computed Expected Value 236 10.1%
Standard deviation 49 0.5%
Minimum value 97 8.3%
Maximum value 400 11.5%
Probability of being not higher than the reference value 51.4% 49.2%
Probability of being higher than the reference value 48.6% 50.8%
Probability of being lower than EUR NIL (ENPV) and 4% (EIRR)
NIL NIL
Source: Authors
The results are further elaborated in the charts overleaf.
176
The software used to generate the Monte Carlo results is Risk Analyzer Release 11.02 (http://www.add-ins.com/analyzer/index.htm).

93
Figure II.2 PROBABILISTIC DISTRIBUTION OF ECONOMIC NET PRESENT VALUE (EUR
MILLION)
Source: Authors
Figure II.3 CUMULATIVE PROBABILISTIC DISTRIBUTION OF THE ECONOMIC NET
PRESENT VALUE (EUR MILLION)
Source: Authors

94
Figure II.4 PROBABILISTIC DISTRIBUTION OF ECONOMIC INTERNAL RATE OF RETURN
Source: Authors
Figure II.5 CUMULATIVE PROBABILISTIC DISTRIBUTION OF ECONOMIC INTERNAL RATE
OF RETURN
Source: Authors
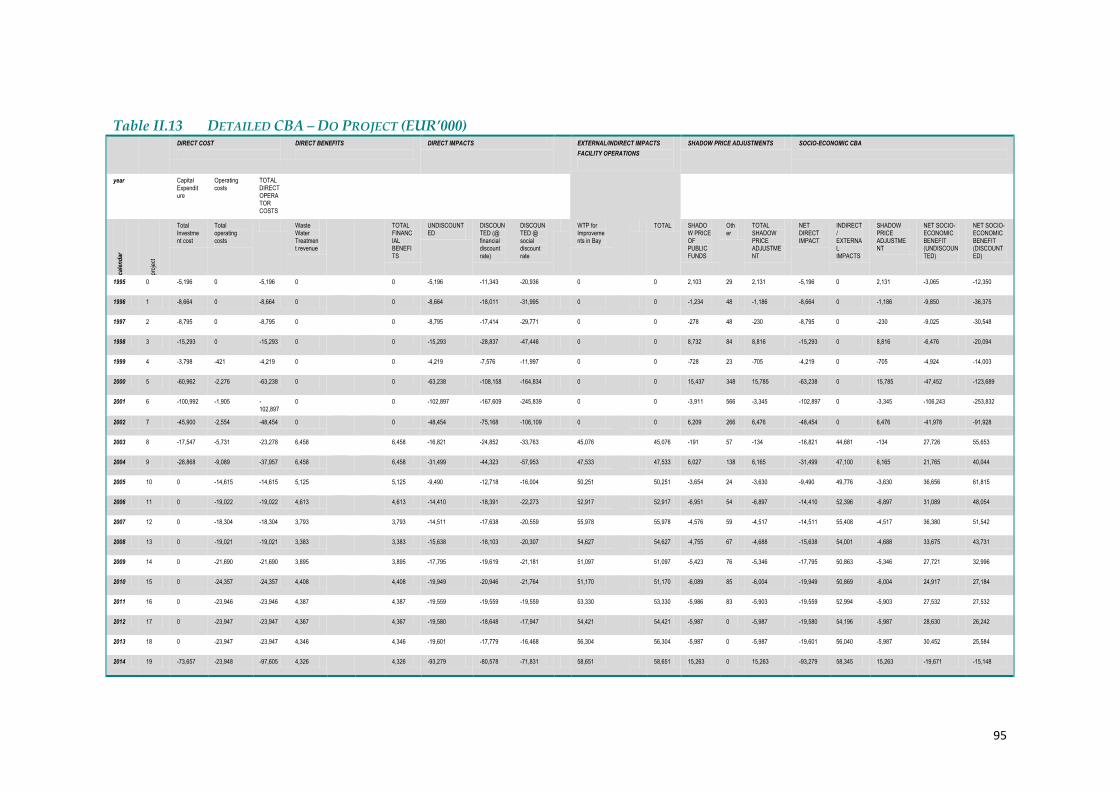
95
Table II.13 DETAILED CBA – DO PROJECT (EUR’000) DIRECT COST
DIRECT BENEFITS
DIRECT IMPACTS EXTERNAL/INDIRECT IMPACTS
FACILITY OPERATIONS
SHADOW PRICE ADJUSTMENTS SOCIO-ECONOMIC CBA
year Capital Expenditure
Operating costs
TOTAL DIRECT OPERATOR COSTS
cale
nd
ar
proj
ect
Total Investment cost
Total operating costs
Waste Water Treatment revenue
TOTAL FINANCIAL BENEFITS
UNDISCOUNTED
DISCOUNTED (@ financial discount rate)
DISCOUNTED @ social discount rate
WTP for Improvements in Bay
TOTAL SHADOW PRICE OF PUBLIC FUNDS
Other
TOTAL SHADOW PRICE ADJUSTMENT
NET DIRECT IMPACT
INDIRECT/ EXTERNAL IMPACTS
SHADOW PRICE ADJUSTMENT
NET SOCIO-ECONOMIC BENEFIT (UNDISCOUNTED)
NET SOCIO-ECONOMIC BENEFIT (DISCOUNTED)
1995 0 -5,196 0 -5,196 0 0 -5,196 -11,343 -20,936 0 0 2,103 29 2,131 -5,196 0 2,131 -3,065 -12,350
1996 1 -8,664 0 -8,664 0 0 -8,664 -18,011 -31,995 0 0 -1,234 48 -1,186 -8,664 0 -1,186 -9,850 -36,375
1997 2 -8,795 0 -8,795 0 0 -8,795 -17,414 -29,771 0 0 -278 48 -230 -8,795 0 -230 -9,025 -30,548
1998 3 -15,293 0 -15,293 0 0 -15,293 -28,837 -47,446 0 0 8,732 84 8,816 -15,293 0 8,816 -6,476 -20,094
1999 4 -3,798 -421 -4,219 0 0 -4,219 -7,576 -11,997 0 0 -728 23 -705 -4,219 0 -705 -4,924 -14,003
2000 5 -60,962 -2,276 -63,238 0 0 -63,238 -108,158 -164,834 0 0 15,437 348 15,785 -63,238 0 15,785 -47,452 -123,689
2001 6 -100,992 -1,905 -102,897
0 0 -102,897 -167,609 -245,839 0 0 -3,911 566 -3,345 -102,897 0 -3,345 -106,243 -253,832
2002 7 -45,900 -2,554 -48,454 0 0 -48,454 -75,168 -106,109 0 0 6,209 266 6,476 -48,454 0 6,476 -41,978 -91,928
2003 8 -17,547 -5,731 -23,278 6,458 6,458 -16,821 -24,852 -33,763 45,076 45,076 -191 57 -134 -16,821 44,681 -134 27,726 55,653
2004 9 -28,868 -9,089 -37,957 6,458 6,458 -31,499 -44,323 -57,953 47,533 47,533 6,027 138 6,165 -31,499 47,100 6,165 21,765 40,044
2005 10 0 -14,615 -14,615 5,125 5,125 -9,490 -12,718 -16,004 50,251 50,251 -3,654 24 -3,630 -9,490 49,776 -3,630 36,656 61,815
2006 11 0 -19,022 -19,022 4,613 4,613 -14,410 -18,391 -22,273 52,917 52,917 -6,951 54 -6,897 -14,410 52,396 -6,897 31,089 48,054
2007 12 0 -18,304 -18,304 3,793 3,793 -14,511 -17,638 -20,559 55,978 55,978 -4,576 59 -4,517 -14,511 55,408 -4,517 36,380 51,542
2008 13 0 -19,021 -19,021 3,383 3,383 -15,638 -18,103 -20,307 54,627 54,627 -4,755 67 -4,688 -15,638 54,001 -4,688 33,675 43,731
2009 14 0 -21,690 -21,690 3,895 3,895 -17,795 -19,619 -21,181 51,097 51,097 -5,423 76 -5,346 -17,795 50,863 -5,346 27,721 32,996
2010 15 0 -24,357 -24,357 4,408 4,408 -19,949 -20,946 -21,764 51,170 51,170 -6,089 85 -6,004 -19,949 50,869 -6,004 24,917 27,184
2011 16 0 -23,946 -23,946 4,387 4,387 -19,559 -19,559 -19,559 53,330 53,330 -5,986 83 -5,903 -19,559 52,994 -5,903 27,532 27,532
2012 17 0 -23,947 -23,947 4,367 4,367 -19,580 -18,648 -17,947 54,421 54,421 -5,987 0 -5,987 -19,580 54,196 -5,987 28,630 26,242
2013 18 0 -23,947 -23,947 4,346 4,346 -19,601 -17,779 -16,468 56,304 56,304 -5,987 0 -5,987 -19,601 56,040 -5,987 30,452 25,584
2014 19 -73,657 -23,948 -97,605 4,326 4,326 -93,279 -80,578 -71,831 58,651 58,651 15,263 0 15,263 -93,279 58,345 15,263 -19,671 -15,148
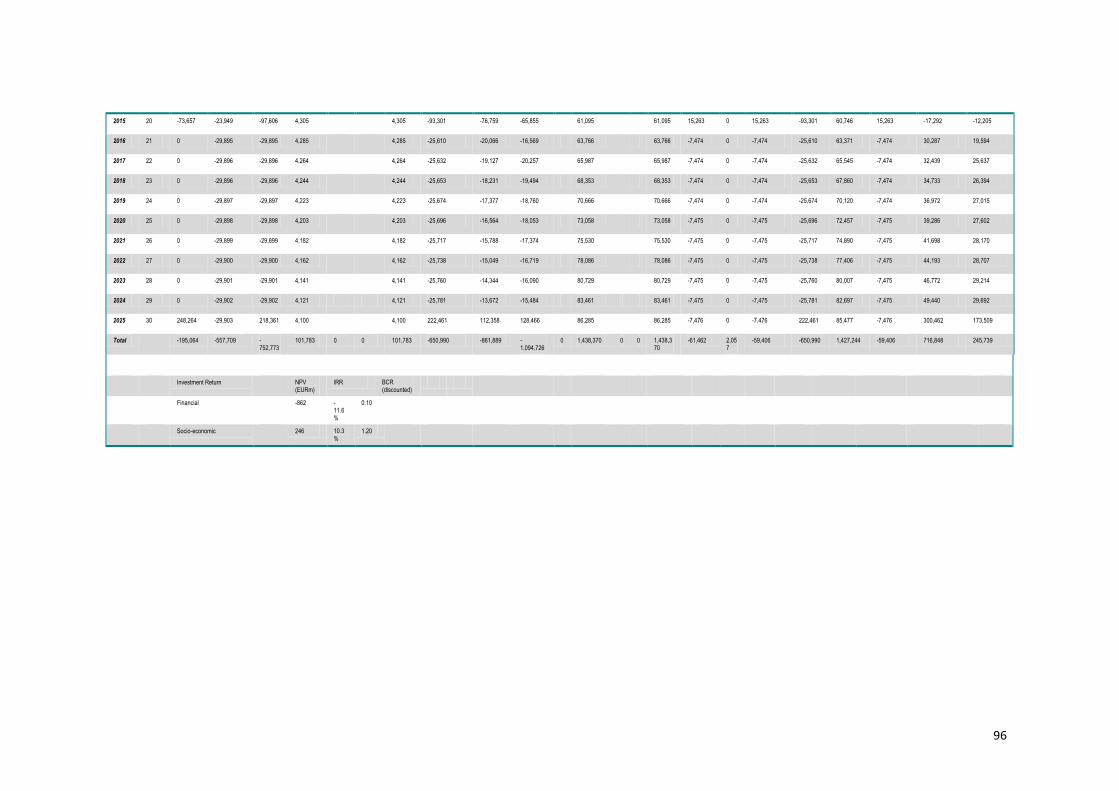
96
2015 20 -73,657 -23,949 -97,606 4,305 4,305 -93,301 -76,759 -65,855 61,095 61,095 15,263 0 15,263 -93,301 60,746 15,263 -17,292 -12,205
2016 21 0 -29,895 -29,895 4,285 4,285 -25,610 -20,066 -16,569 63,766 63,766 -7,474 0 -7,474 -25,610 63,371 -7,474 30,287 19,594
2017 22 0 -29,896 -29,896 4,264 4,264 -25,632 -19,127 -20,257 65,987 65,987 -7,474 0 -7,474 -25,632 65,545 -7,474 32,439 25,637
2018 23 0 -29,896 -29,896 4,244 4,244 -25,653 -18,231 -19,494 68,353 68,353 -7,474 0 -7,474 -25,653 67,860 -7,474 34,733 26,394
2019 24 0 -29,897 -29,897 4,223 4,223 -25,674 -17,377 -18,760 70,666 70,666 -7,474 0 -7,474 -25,674 70,120 -7,474 36,972 27,015
2020 25 0 -29,898 -29,898 4,203 4,203 -25,696 -16,564 -18,053 73,058 73,058 -7,475 0 -7,475 -25,696 72,457 -7,475 39,286 27,602
2021 26 0 -29,899 -29,899 4,182 4,182 -25,717 -15,788 -17,374 75,530 75,530 -7,475 0 -7,475 -25,717 74,890 -7,475 41,698 28,170
2022 27 0 -29,900 -29,900 4,162 4,162 -25,738 -15,049 -16,719 78,086 78,086 -7,475 0 -7,475 -25,738 77,406 -7,475 44,193 28,707
2023 28 0 -29,901 -29,901 4,141 4,141 -25,760 -14,344 -16,090 80,729 80,729 -7,475 0 -7,475 -25,760 80,007 -7,475 46,772 29,214
2024 29 0 -29,902 -29,902 4,121 4,121 -25,781 -13,672 -15,484 83,461 83,461 -7,475 0 -7,475 -25,781 82,697 -7,475 49,440 29,692
2025 30 248,264 -29,903 218,361 4,100 4,100 222,461 112,358 128,466 86,285 86,285 -7,476 0 -7,476 222,461 85,477 -7,476 300,462 173,509
Total -195,064 -557,709 -752,773
101,783 0 0 101,783 -650,990 -861,889 -1,094,726
0 1,438,370 0 0 1,438,370
-61,462 2,057
-59,406 -650,990 1,427,244 -59,406 716,848 245,739
Investment Return NPV (EURm)
IRR BCR (discounted)
Financial -862 -11.6%
0.10
Socio-economic 246 10.3%
1.20

97
Table II.14 DETAILED CBA – DO NOTHING (EUR’000) DIRECT COSTS (OPERATOR)
DIRECT BENEFITS (OPERATOR)
DIRECT IMPACTS (OPERATOR) EXTERNAL/INDIRECT IMPACTS
FACILITY OPERATIONS
SHADOW PRICE ADJUSTMENTS SOCIO-ECONOMIC CBA
year Capital Expenditure
Operating costs
TOTAL DIRECT OPERATOR COSTS
cale
ndar
proj
ect
Total Investment cost
Total operating costs
Waste Water Treatment revenue
TOTAL FINANCIAL BENEFITS
UNDISCOUNTED
DISCOUNTED (@ financial discount rate)
DISCOUNTED @ social discount rate
WTP for Improvements in Bay
TOTAL
SHADOW PRICE OF PUBLIC FUNDS
Other
TOTAL SHADOW PRICE ADJUSTMENT
NET DIRECT IMPACT
INDIRECT/ EXTERNAL IMPACTS
SHADOW PRICE ADJUSTMENT
NET SOCIO-ECONOMIC BENEFIT (UNDISCOUNTED)
NET SOCIO-ECONOMIC BENEFIT (DISCOUNTED)
1995
0 0 0 0 0 0 0 0 0 0 0 0 0 0 0 0 0 0 0
1996
1 0 0 0 0 0 0 0 0 0 0 0 0 0 0 0 0 0 0
1997
2 0 0 0 0 0 0 0 0 0 0 0 0 0 0 0 0 0 0
1998
3 -832 0 -832 0 0 -832 -1,569 -2,581 0 0 -416 5 -411 -832 0 -411 -1,243 -3,857
1999
4 -832 0 -832 0 0 -832 -1,494 -2,366 0 0 -416 5 -411 -832 0 -411 -1,243 -3,535
2000
5 -3,327 0 -3,327 0 0 -3,327 -5,691 -8,673 0 0 -832 18 -814 -3,327 0 -814 -4,141 -10,794
2001
6 -3,327 0 -3,327 0 0 -3,327 -5,420 -7,950 0 0 -832 18 -814 -3,327 0 -814 -4,141 -9,894
2002
7 -5,823 0 -5,823 0 0 -5,823 -9,034 -12,752 0 0 -1,456 32 -1,424 -5,823 0 -1,424 -7,247 -15,870
2003
8 -6,552 -3,075 -9,627 3,178 3,178 -6,552 -9,681 -13,152 0 0 -1,638 19 -1,620 -6,552 0 -1,620 -8,172 -16,403
2004
9 103 -3,075 -2,973 3,178 3,178 103 144 189 0 0 26 -18 8 103 0 8 110 203
2005
10 -553 -3,075 -3,628 2,522 2,522 -553 -741 -933 0 0 -138 -11 -149 -553 0 -149 -702 -1,184
2006
11 -805 -3,075 -3,880 2,270 2,270 -805 -1,028 -1,245 0 0 -201 -8 -209 -805 0 -209 -1,015 -1,568
2007
12 -1,209 -3,075 -4,284 1,866 1,866 -1,209 -1,469 -1,713 0 0 -302 -4 -306 -1,209 0 -306 -1,515 -2,146
2008
13 -1,411 -3,075 -4,486 1,664 1,664 -1,411 -1,633 -1,832 0 0 -353 -1 -354 -1,411 0 -354 -1,765 -2,292
2009
14 -1,158 -3,075 -4,233 1,917 1,917 -1,158 -1,277 -1,379 0 0 -290 -4 -294 -1,158 0 -294 -1,452 -1,729
2010
15 -906 -3,075 -3,981 2,169 2,169 -906 -952 -989 0 0 -227 -7 -234 -906 0 -234 -1,140 -1,243
2011
16 -916 -3,075 -3,991 2,159 2,159 -916 -916 -916 0 0 -229 -7 -236 -916 0 -236 -1,152 -1,152
2012
17 -926 -3,075 -4,001 2,149 2,149 -926 -882 -849 0 0 -232 0 -232 -926 0 -232 -1,158 -1,061
2013
18 -936 -3,075 -4,011 2,139 2,139 -936 -849 -787 0 0 -234 0 -234 -936 0 -234 -1,171 -983
2014
19 -947 -3,075 -4,022 2,128 2,128 -947 -818 -729 0 0 -237 0 -237 -947 0 -237 -1,183 -911

98
2015
20 -957 -3,075 -4,032 2,118 2,118 -957 -787 -675 0 0 -239 0 -239 -957 0 -239 -1,196 -844
2016
21 -967 -3,075 -4,042 2,108 2,108 -967 -757 -625 0 0 -242 0 -242 -967 0 -242 -1,208 -782
2017
22 -977 -3,075 -4,052 2,098 2,098 -977 -729 -772 0 0 -244 0 -244 -977 0 -244 -1,221 -965
2018
23 -1,810 -3,075 -4,885 2,088 2,088 -1,810 -1,286 -1,376 0 0 -453 0 -453 -1,810 0 -453 -2,263 -1,719
2019
24 -1,820 -3,075 -4,895 2,078 2,078 -1,820 -1,232 -1,330 0 0 -455 0 -455 -1,820 0 -455 -2,275 -1,663
2020
25 -4,300 -3,075 -7,375 2,068 2,068 -4,300 -2,772 -3,021 0 0 -1,075 0 -1,075 -4,300 0 -1,075 -5,375 -3,776
2021
26 -4,310 -3,075 -7,385 2,058 2,058 -4,310 -2,646 -2,912 0 0 -1,078 0 -1,078 -4,310 0 -1,078 -5,388 -3,640
2022
27 -6,790 -3,075 -9,865 2,048 2,048 -6,790 -3,970 -4,411 0 0 -1,697 0 -1,697 -6,790 0 -1,697 -8,487 -5,513
2023
28 -7,623 -3,075 -10,698 2,038 2,038 -7,623 -4,245 -4,761 0 0 -1,906 0 -1,906 -7,623 0 -1,906 -9,529 -5,952
2024
29 -1,047 -3,075 -4,122 2,028 2,028 -1,047 -555 -629 0 0 -262 0 -262 -1,047 0 -262 -1,309 -786
2025
30 18,700 -3,075 15,625 2,017 2,017 18,700 9,445 10,799 0 0 -264 0 -264 18,700 0 -264 18,435 10,646
Total
-42,262 -70,725 -112,987 50,083 0 0 50,083 -42,262 -52,845 -68,370 0 0 0 0 0 -15,921 36 -15,884 -42,262 0 -15,884 -58,146 -89,416
Investment Return NPV (EURm)
IRR BCR (discounted)
Financial -53 #NUM!
0.47
Socio-economic -89 #NUM!
0.37

99
ANNEX III. GLOSSARY OF TERMS
Biofert Dry stabilised compost-like material output of anaerobic digestion of sewage sludge, suitable for use as agricultural fertiliser.
Biogas Gaseous output of anaerobic digestion process, containing approximately 55% methane and suitable for combustion to generate electricity.
Biochemical Oxygen Demand The amount of dissolved oxygen needed by aerobic biological organisms to break down the organic polluting matter in the water. One of the main indicators used to measure water pollution. The EPA stipulates that after secondary treatment the water should have a BOD of no higher than 25mg/l, typically before treatment wastewater has a BOD in the range of 100 – 300 mg/l.
Daily organic load A compound measure of the total volume of wastewater passing through a treatment plant which takes into account both the volume and pollution concentration of the waste water. It is defined as
Organic load (kg/day) = Daily flow (m3/day) x BOD (mg/l)
1000
Design Build Operate (DBO) Design-Build-Operate or DBO is a type of Public Private Partnership (PPP), whereby the public authority appoints a concessionaire to Design, Build and Operate a piece of infrastructure. The concessionaire is free to design the plant as they see fit, to deliver an agreed outcome. The concessionaire then builds the plant according to this design and operates the plant for a set period of time (typically 20 -25 years), at the end of which the plant is transferred back to the public authority. Ownership remains with the local authority throughout. Under traditional procurement the public authority (the “employer”) designs the plant and employs a contractor to build it according to the employer’s specification. Upon completion the public authority takes over the operation of the plant.
Eutrophication Enrichment of water by nutrients, typically nitrogen and phosphorous compounds, causing accelerated algal growth which leads to oxygen depletion in water to the detriment of other aquatic life.
Faecal Coliforms Bacterial count Indicative of water contamination by sewage, and thus the possibility of the presence of pathogenic bacteria and viruses. It is a key variable to gauge the threat bathing waters are to human health. Typically unpolluted waters should show very low counts, but small numbers may be present due to waste from birds and wild mammals. Densities in excess of 2000 organisms per 100ml would indicate an appreciable level of contamination177. For example E. Coli.
E. Coli. Escherichia coli; a type of bacteria found in and indicative of the presence of faecal matter, particularly in water.
Lamella Settlement tanks A water treatment process that features a rack of inclined metal plates, which cause material to precipitate from water that flows across the plates. Inclined plate settlers or lamella® clarifiers are primarily used in the water and wastewater treatment industries to separate solids from liquids in effluent streams. (http://en.wikipedia.org/wiki/Lamella_clarifier).
177
Dublin Bay Water Quality Management Plan – Technical Report 5 – Water Quality Surveys (1991)

100
Less Sensitive Areas Marine water bodies or areas where the discharge of waste water does not adversely affect the environment as a result of morphology, hydrology or specific hydraulic conditions which exist in the area. When identifying less sensitive areas, Member States shall take into account the risk that the discharged load may be transferred to adjacent areas where it can cause detrimental environmental effects.
Sensitive Areas Sensitive areas, within the meaning of the directive 91/271/EEC, include:
• freshwater bodies, estuaries and coastal waters which are eutrophic or which may become eutrophic if protective action is not taken;
• surface freshwaters intended for the abstraction of drinking water which contain or are likely to contain more than 50 mg/l of nitrates;
• areas where further treatment is necessary to comply with other Directives, such as the Directives on fish waters, on bathing waters, on shellfish waters, on the conservation of wild birds and natural habitats, etc.
Population Equivalent Wastewater comes from a number of sources, including industry. PE is the metric that allows comparison between the various sources that generate wastewater converting them to a single equivalent number. UWWT regulations define one population equivalent as the load resulting in a BOD of 60g/litre.
Primary Treatment Treatment of urban waste water by a physical and/or chemical process involving settlement of suspended solids, or other processes by which the BOD5 of the incoming waste water is reduced by at least 20% before discharge and the total suspended solids of the incoming waste water are reduced by at least 50%.
Secondary Treatment Treatment of urban waste water by a process generally involving biological treatment with a secondary settlement or other process in which the requirements established in Table 1 of Annex I of Directive 91/271/EEC are met.
Sequencing Batch Reactors Sequencing batch reactors (SBR) or sequential batch reactors are industrial processing tanks for the treatment of wastewater. SBR reactors treat waste water in batches. Oxygen is bubbled through the waste water to reduce biochemical oxygen demand (BOD) and chemical oxygen demand (COD) to make it suitable for discharge into sewers or for use on land.
(http://en.wikipedia.org/wiki/Sequencing_batch_reactor)
Sewerage Pipes or networks of pipes carrying waste water and/or Stormwater, whether to a treatment plant or for discharge untreated into water bodies.
Tertiary Treatment Advanced treatment of urban waste water employed when specific wastewater constituents which cannot be removed by secondary treatment must be removed. Usually relates to UV treatment to kill pathogens remaining after secondary treatment, and/or nutrient (nitrogen, phosphorus) removal.

101
ANNEX IV. LIST OF INTERVIEWEES
The following is a list of interviews undertaken as part of this evaluation. We are grateful to all
participants, as we are to the Department of Finance, DECLG and DG Regio Ireland desk for
access to their files on the project.
Interviewee Affiliation Position Date Eoin Gaffney Swim Ireland Secretary of Masters
Committee Telephone conversations – various dates
Kenneth Rumball
Irish National Sailing School
Sailing Coach Telephone conversation – 15th February 2012
Donal O’Sullivan
Dublin Bay Sailing Club
Honorary Secretary Email correspondence
Ger Looney Dun Laoghaire – Rathdown County Council
Senior Engineer – Water Services
Telephone conversation – 8th February 2012
Aideen Carney
Dublin City Council Senior Executive Scientific Officer, Central Laboratory
Telephone conversations – various dates
Imelda Avril Dublin City Council Telephone conversation – 13th March 2012 James Wilson
Trinity College Dublin Professor, Zoology Department
Telephone conversation – 10th February 2012
May Kane Ringsend/Irishtown Residents’ Association
Former Committee Member
17th February 2012 – Telephone conversation
Frances Corr Ringsend/Irishtown Residents’ Association
Committee Member 17th February 2012 – Telephone conversation
Joan MacArthur
Sandymount and Merrion Residents Association
Chairperson 1st March 2012 – Telephone conversation
Lorna Kelly Sandymount and Merrion Residents Association
Committee Member 1st March 2012 – Telephone conversation
Pat Cronin Dublin City Council Executive Manager – Drainage and Wastewater Services
Telephone conversations – various dates
Michael Kenny
Dublin City Council DCC site engineer, Ringsend WWTP
27th February 2012 (after site tour)
Ciarán McCausland
Celtic Anglian Water Operations Engineer, Ringsend WWTP
27th February 2012 (with site tour)
Declan Maguire
Celtic Anglian Water Operations Director Telephone conversation – 13th March 2012
Gerry O’Donoghue
Department of Environment, Community and Local Government
Senior Advisor, Water Services
20th March 2012 – Telephone conversation
Tom Walsh Department of Environment, Community and Local Government
Assistant Principal Officer
Various meetings and telephone conversations
Declan MacGabhann
Sea Fisheries Protection Authority
Telephone conversations – various dates
Cathal Gallagher
Inland Fisheries Ireland
Head of Research and Development
Telephone conversations – various dates

102

103
ANNEX V. REFERENCES
Barton D., 2003, Rapid valuation of environmental impacts – a review of benefit transfer
approaches, Agricultural University of Norway.
Becker G.S., 1962, Investment in Human Capital: A Theoretical Analysis, The Journal of Political
Economy, Vol. 70, No. 5, Part 2: Investment in Human Beings (Oct., 1962), pp. 9-49.
Carney, A., 2003, Dublin Bay Water Quality Monitoring Programme – Third Annual Report.
Considine, J., and Duffy, D., 2007, Tales of Expansionary Fiscal Contractions in Two European
Countries: Hindsight and Foresight. Working Paper 0120, July 2007, Department of Economics
National University of Ireland, Galway.
http://aran.library.nuigalway.ie/xmlui/bitstream/handle/10379/1012/paper_0120.pdf?sequen
ce=1.
Corcoran M., 2007, Water, Drainage, People and Heritage, Dublin City Council Drainage
Division, presented to Engineers Ireland
http://www.engineersireland.ie/media/engineersireland/community/whitepapers/Water,%20
Drainage,%20People%20and%20Heritage.pdf.
Costanza, R. D'Arge, R. De Groot, R. Farber, S. Grasso, M. Hannon, B. Limburg, K. Naeem, S.
O'Neill, R. V. Paruelo, J., 1997, “The value of the world's ecosystem services and natural
capital” in Nature (London), Issue 6630, pages 253-260.
COWI, 2011, Ex post evaluation of cohesion policy interventions 2000-2006 financed by the
Cohesion Fund (including former ISPA) Work Package C - Cost benefit analysis of environment
projects Pilot case study - Project no. 22: Dublin Region Waste Water Treatment Scheme (Stage
5), Ireland (2000IE16CPE001), for EUROPEAN COMMISSION Directorate-General Regional
Policy.
http://ec.europa.eu/regional_policy/sources/docgener/evaluation/pdf/expost2006/wpc_d5_d
ublin.pdf
CSF Evaluation Unit, 1999, Proposed Working Rules for cost-Benefit Analysis. Dublin. June
1999.
Dasgupta P., 2001, Human Well-Being and the Natural Environment, Oxford University Press.
Department of the Environment, 2004, National Urban Wastewater Study, (NUWS).
http://www.environ.ie/en/Environment/Water/WaterServices/NationalUrbanWasteWaterStu
dy/.
Department of the Environment, Government of Ireland, 1990, An Environmental Action
Programme.

104
Department of the Environment, Government of Ireland, 1990, Operational Programme:
Water, Sanitary and Other Local Services 1989 – 1993, EC Structural Funds, European Regional
Development Fund.
Department of the Environment, Government of Ireland, 1994, Operational Programme for
Environmental Services 1994 – 1999.
DG Environment, 1986, Europeans and their Environment in 1986.
http://aei.pitt.edu/8691/1/8691.pdf.
DKM Economic Consultants Ltd., Aquavarra Research Ltd. & ESRI, 2004, Economic Evaluation of
Water Supply & Waste Water Projects – Cost-Benefit Analysis Methodology Paper, Final
Report. http://www.dkm.ie/uploads/pdf/reports/Water_cba_paper.pdf.
Dublin City Council, Ringsend Wastewater Treatment Works.
http://www.dublincity.ie/WaterWasteEnvironment/WasteProjects/Documents/Dublin_Bay_Pr
oject_Brochure.pdf.
Dublin Corporation and M.C. O’Sullivan and Co. Ltd., 1994, North Dublin Drainage Scheme
Catchment Area Study – Preliminary Report.
Dublin Corporation and McCarthy Acer Consultants Ltd, 1993, Ringsend Sewage Treatment
Plant Expansion – Preliminary Report.
Dublin Corporation and McCarthy Acer Consultants Ltd, 1995, Ringsend Wastewater
Treatment Plant Works Expansion – Supplementary Report.
Easterly W., Ritzen J. and Woolcock M., 2006, Social Cohesion, Institutions, and Growth,
Economics and Politics Vol. 18 (2), pp. 103-120.
Environmental Protection Agency, 2001, An Assessment of the Trophic Status of Estuaries and
Bays in Ireland.
Environmental Research Unit 1992, Dublin Bay Water Quality Management Plan Technical
Reports Numbers 1 – 8.
Environmental Research Unity 1991, Dublin Bay Management Plan Report No.5 Water Quality
Surveys, report for Dublin Local Authorities.
ESRI, 2012, Quarterly Economic Commentary, Winter 2011-Spring 2012.
http://esri.ie/publications/latest_publications/view/index.xml?id=3462.
European Commission, 2008, Guide to Cost Benefit Analysis of Investment Projects.
http://ec.europa.eu/regional_policy/sources/docgener/guides/cost/guide2008_en.pdf.
European Investment bank, 1999, APPRAISAL REPORT - Dublin Bay Wastewater Treatment
Scheme Stage 4, Project Directorate, Water, waste and Agriculture Department.

105
Fehily B., 2008, A Review of and Report on Certain Matters Relating to Dublin City Council’s
Ringsend Wastewater Treatment Plant, prepared for The Minister for Environment, Heritage
and Local Government, Mr John Gormley TD.
Griffith R., 2000, How important is Business R&D for Economic Growth and should the
Government subsidise it?, The Institute for Fiscal Studies, Briefing Note No. 12.
Griliches Z., 1992, The search for R&D spillovers, Scandinavian Journal of Economics, vol.94,
pp. 29-47.
Hirschman A.O., 1967, Development Projects Observed, The Brookings Institution,
Washington, D.C.
Hökby, S., & Söderqvist, B., 2001, “Elasticities of demand and willingness to pay for
environmental services in Sweden”, Paper presented at the 11th Annual Conference of the
European Association of Environmental and Resource Economists, Southampton, UK, June
2001.
Honohan P, and Walsh B, 2002, Catching up with the leaders: The Irish Hare Brookings Papers
on Economic Activity, Part 1, pages 1-57.
http://www.brookings.edu/~/media/Files/Programs/ES/BPEA/2002_1_bpea_papers/2002a_b
pea_honohan.pdf
Honohan P., (ed.), 1997, EU Structural Funds in Ireland: A Midterm Evaluation of the CSF 1994-
99, Policy Research Series no. 31, Dublin: ESRI.
Honohan, P., 1998, Key Issues of Cost-Benefit Methodology for Irish Industrial Policy. Dublin:
ESRI, General Research series, September 1998.
http://homepage.eircom.net/~phonohan/costbenefit.pdf
http://www.uvm.edu/giee/publications/Nature_Paper.pdf.
Källstrøm M.N., 2010, Testing different approaches to benefit transfers between two sites in
the same country, valuing the improvement of water quality, Aarhus University Denmark.
Keogan J.F. and Callanan, J.F., 2003, Local Government in Ireland: Inside Out. Institute of Public
Administration, Dublin.
http://www.environ.ie/en/Publications/Environment/Water/FileDownLoad,18910,en.pdf.
Martinez M., 2009, “Il management delle aziende di Public Utilities tra cambiamento
istituzionale e compliance”, in Modelli di governance e processi di cambiamento nelle Public
Utilities, edited by Mercurio R. and Martinez M., Franco Angeli, 2009.
McAleese, D., 2000, “The Celtic Tiger: Origins and Prospects”, in Political Options, July-August
2000. http://www.irpp.org/po/archive/jul00/mcaleese.pdf.

106
McCarthy, C., 2009, “Fiscal Consolidation II: Lessons from the Last Time”. Paper presented at
Dublin Economics Workshop, Kenmare, 18th October 2009.
http://www.irisheconomy.ie/Notes/IrishEconomyNote8.pdf
McCumiskey, L.M. 1991, Water in Ireland: A Review of Water Resources, Water Supplies and
Sewerage Services. Environmental Research Unit.
Murphy, A., 2000, The ’Celtic Tiger’ – An Analysis of Ireland’s Economic Growth Performance.
Murphy, A., Walsh, B.M. and Barry, F., 2003, The economic appraisal system for projects
seeking support from the industrial development agencies. Dublin: Forfás.
http://irserver.ucd.ie/dspace/bitstream/10197/1600/3/walshb_report_pub_016.pdf.
Pearce D.W., Mourato S. and Atkinson G., 2006, Recent developments in environmental cost
benefit analysis, OECD publishing.
Pearce, DW, 2003, “Conceptual Framework for Analysing the Distributive Impacts of
Environmental Policies”. Paper presented at Workshop on The Distribution of Benefits and
Costs of Environmental Policies: Analysis, Evidence and Policy Issues. National Policies Division,
OECD Environment Directorate, March 4th-5th, 2003.
Schläpfer, F., 2007, “Contingent valuation: a new perspective”, in Ecological Economics,
Section: Methods, September 2007.
Sen A.K., 1987, On Ethics and Economics, Basil Backwell eds., Oxford.
Skerries Community Association, 2011, Submission on the Regional Sewage Treatment Plant,
Marine Outfall and Orbital Sewer proposed by Fingal County Council for the Greater Dublin
Drainage Project - Public Consultation Process.
http://www.skerriesca.com/files/Final%20Submission.pdf.
Solow R.M., 1956, A Contribution to the Theory of Economic Growth, The Quarterly Journal of
Economics, Vol.70, No. 1 (Feb. 1956), pp. 65-94.
Stiglitz J.E., Sen A., Fitoussi J.P, 2009, Report by the Commission on the Measurement of
Economic Performance and Social Progress. Available at: http://www.stiglitz-sen-
fitoussi.fr/documents/rapport_anglais.pdf
Swords P., 2009, Ireland’s choice: EU Environmental Policy or Green Economy?
http://www.oireachtas.ie/documents/committees30thdail/j-
climate_change/submissions/ps20091001-2.pdf.
Tomer J., 1981, Organizational Change, Organization Capital and Economic Growth, Eastern
Economic Journal Vol. VII, No. 1.
US Environmental Protection Agency, 2000a, A benefit assessment of water pollution control
programme since 1972,
107
http://water.epa.gov/lawsregs/lawsguidance/cwa/316b/upload/2000_04_17_economics_asse
ssment.pdf.
US Environmental Protection Agency, 2000b, Improving the practice of benefit transfer: a
preference calibration approach,
http://water.epa.gov/lawsregs/lawsguidance/cwa/316b/upload/2000_04_17_economics_ben
efits.pdf.
US Environmental Protection Agency, 2000c, A retrospective assessment of cost of the Clean
Water Act: 1972‐1997,
http://water.epa.gov/lawsregs/lawsguidance/cwa/economics/upload/2000_10_23_economics
_costs.pdf.
Walsh B.M., 2008, “Wealthier and healthier: Ireland’s demographic catch-up”, in Journal of the
Statistical and Social Inquiry Society of Ireland, Vol. 37, pp. 95-112.
Walsh, J., 2000, Ireland and the Structural Funds and Cohesion Fund. Presentation to IPA -
Louvain/Leuven. 16 August 2000.
WATECO, 2003, Common Implementation Strategy for the Water Framework Directive
(2000/60/EC) Guidance document n.o 1 Economics and the environment - The implementation
challenge of the Water Framework Directive.
http://circa.europa.eu/Public/irc/env/wfd/library?l=/framework_directive/guidance_documen
ts/guidancesnos1seconomicss/_EN_1.0_&a=d.
Wilson, Jeffrey, Dowley et al., 1993, Particulate Nutrient Inputs and their Role in Macro-algae
Development in Dublin Bay. Carried out under the STRIDE Operational Programme.