dubai international financial centre wealth and asset ... · pdf filedubai international...
TRANSCRIPT
Dubai International Financial Centre Wealth and Asset Management Report 2017
MAPPING OPPORTUNITIES IN THE MEASA REGION

Copyright © 2017 The Dubai International Financial Centre (DIFC). All rights reserved. No part of this report or its content may be used, reproduced, stored in a retrieval system, or transmitted in any form or by any means, electronic, mechanical photocopying, recording, or otherwise without the prior written consent of Dubai International Financial Centre Authority.
Thomson Reuters and its logo are registered trademarks or trademarks of the Thomson Reuters group of companies around the world.
Dubai International Financial Centre Wealth and Asset Management Report 2017
MAPPING OPPORTUNITIES IN THE MEASA REGION
ContentsExecutive Summary 4
CHAPTER 1
REGIONAL MACROECONOMIC OVERVIEW 8Fed rate hikes boost investor interest in GCC fixed income 10
Rebound in commodity prices paves way for growth recovery in GCC and Sub-Saharan Africa 10
Egypt on the tightrope 10
Growth momentum remains fragile for sub-Saharan Africa 10
India temporarily set back by demonetisation 11
Macroeconomic Outlook for 2018-2022 12
Market Experts Insight: The Prominence of Political Risk 14BY MICHAEL BENNETT AND AKINCHAN JAIN
CHAPTER 2
ASSET MANAGEMENT INDUSTRY OVERVIEW AND LANDSCAPE 16
Despite Challenging Economic Conditions Global AuM Grows 6.27% in 2016 18
India Leads MEASA Countries in AuM 18
Change in Tax Treaties in UK and India Expected To Shift Asset Managers to GCC 19
Emerging Markets Equity Funds Outperform Developed Markets 21
Market Experts Insight: A Copernican revolution is taking investment management by storm 22BY PAOLO SIRONI
CHAPTER 3
ASSET AND WEALTH MANAGEMENT LEADING FINANCIAL HUBS 24
Dubai leads the list of financial centres in MEASA region 26
Changing capital flows are changing what is required from a financial centre 26
Dubai: DIFC combines ease of registration and low tax approach 27
Bahrain: Historically the original jurisdiction of choice for GCC fund managers 27
Japan: a good example of a mature market 28
Singapore: regulatory regime has been tightened in recent years 29
South Africa: home to a large domestic fund management industry 29
Growing emerging market wealth continues to expand opportunities for financial centres 30
Emerging Markets Outlook 31
Market Experts Insight: OFC’s Perception is Projection 32BY NICK SAVASTANO
CHAPTER 4
ALTERNATIVE ASSET MANAGEMENT 34Overview of the Middle East Investment Market 36
Overview of Role of Alternative Investments for Middle Eastern Investors 37
Alternative assets’ contribution to portfolio diversification 37
Quantitative easing and the reach for yield 37
Alternatives as a new source of alpha-generation 38
Pension funds and wealth managers account for bulk of assets 38
Alternative assets in the Middle East Africa and Asia 39
MENA private equity investors are different than traditional markets 39
Evolving investor preferences for alternative investments 40
Outlook: alternative investment represents a safe harbor 40
CHAPTER 5
ISLAMIC ASSET MANAGEMENT 42Islamic AuM maintains growth despite economic challenges 44
Shariah-compliant investments have strong demographic demand but remain under-utilised 44
Islamic assets can feed into Islamic Wealth Management and Funds 45
Islamic funds concentrated in Saudi Arabia and Malaysia 47
Sukuk leader Malaysia provides Asia’s first robo-adviser service for Islamic investors 47
Luxembourg is home to 168 Islamic funds 48
Asset Types: Diversification and liquidity among the main reasons for mutual funds growth 48
Substantial growth in Islamic pension funds in Malaysia and Pakistan 48
Market Experts Insight: The Role and Emergence of Islamic Asset Management in Global Markets 50BY SANDEEP SINGH

The biggest global events to rock the MEASA asset
management markets last year were the election of
Donald Trump to the US presidency and the British
electorate’s decision to exit the European Union. However,
markets soon took these shock outcomes in their stride.
For the Middle East, while the chronic instability that has
plagued some of the countries in the region since the
onset of the Arab Spring has held back their economic
growth, it has had little effect on its main financial
markets. The biggest influence on markets in the region,
particularly in the countries of the Gulf Cooperation
Council, however, has been continued low oil prices.
After reaching a high of US$115 per barrel in June
2014, oil prices turned as low as US$27 in January
2016, reflecting sustained oversupply of crude oil in
the market. Prices have since partially recovered, and
have stabilised this year either side of US$50 per barrel.
As long as oil prices remain relatively stable, growth
in the GCC is expected to pick up this year and next.
EXECUTIVE SUMMARY
4 WEALTH AND ASSET MANAGEMENT REPORT
Dubai aims to provide bridge for regional capital flowsStill, economies that had for decades enjoyed fiscal surpluses suddenly found themselves in deficit, and the governments of the GCC are now making efforts to diversify their economies away from sole reliance on natural resources.
Dubai, leading the Global Financial Center Index (GFCI) in the MEASA regions has the aspiration to provide a bridge for capital flowing to South Asia, Africa and the Middle East due to their central locations and convenient time zones relative to Europe.
While Bahrain has long been the jurisdiction of choice for many fund managers operating within the GCC, growth slowed there in the wake of the financial crisis. Political instability during the Arab Spring also hit confidence and many fund managers who moved to Dubai at that time have stayed despite a return to stability in Bahrain.
The United Arab Emirates has several different regimes for fund managers but most managers use one of the free zones, particularly the Dubai International Financial Centre (DIFC).
New legislation in Dubai designed to attract inward investmentDubai’s government has introduced legislation and regulatory frameworks specifically designed to attract inward invest-ment from those who might not have invested in the country prior to the creation of the DIFC.
For Indian managers, in particular, the DIFC has become the prime destination for accessing the region because of its vibrant ecosystem, coupled with its continuous efforts to enhance ease of business and an enabling Qualified Investor Funds regime. India is one country — the UK is another — that is beginning to tighten tax laws for asset managers’ offshore investments. India has amended its tax treaties with Mauri-tius, Singapore and Cyprus and asset managers there are looking at moves to other financial centres such as Dubai that provide similar incentives.
A uniform regulatory regime for the creation, manage-ment and marketing of collective investment vehicles in the countries of the GCC seems to be essential for governments to achieve their aim of attracting locally domiciled funds.
The major change affecting fund managers will be the UAE’s introduction in January 2018 of a 5% value-added tax to combat declining prices for oil, the resource which accounts for most of the federal government’s revenue. The country still has no company or income taxes, however, and the low value-added tax is unlikely to affect free zones.
Expansion of middle class presents opportunitiesThe massive expansion of the middle class in emerging mar-kets has created significant opportunities, with financial sectors that were previously focused on exporting capital now reinvesting that capital in those requiring finance at home.
Financial centres in the GCC have a particular opportu-nity because there are opportunities for investment both regionally (despite low oil prices being a drain, there are massive infrastructure investment needs) and across the wider African and Asian regions. This and the greater financial sophistication of the region’s financial markets are driving the rapid growth in fund assets in the GCC.
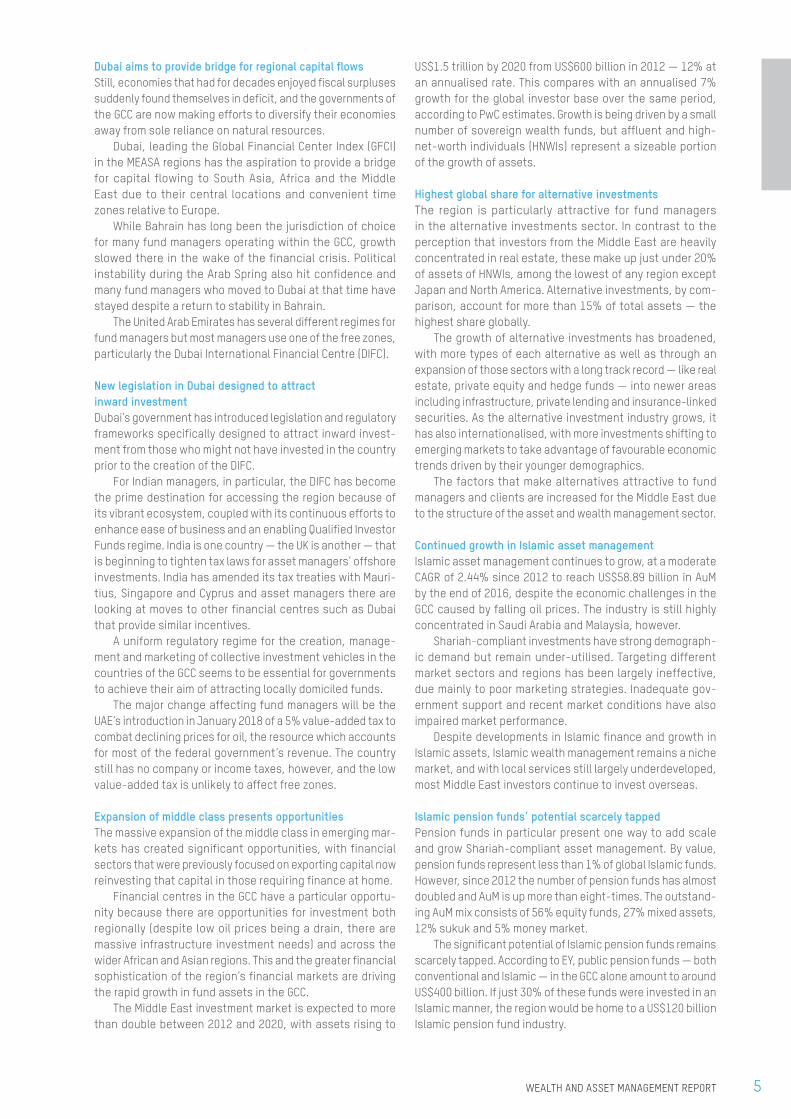
The Middle East investment market is expected to more than double between 2012 and 2020, with assets rising to
US$1.5 trillion by 2020 from US$600 billion in 2012 — 12% at an annualised rate. This compares with an annualised 7% growth for the global investor base over the same period, according to PwC estimates. Growth is being driven by a small number of sovereign wealth funds, but affluent and high-net-worth individuals (HNWIs) represent a sizeable portion of the growth of assets.
Highest global share for alternative investmentsThe region is particularly attractive for fund managers in the alternative investments sector. In contrast to the perception that investors from the Middle East are heavily concentrated in real estate, these make up just under 20% of assets of HNWIs, among the lowest of any region except Japan and North America. Alternative investments, by com-parison, account for more than 15% of total assets — the highest share globally.
The growth of alternative investments has broadened, with more types of each alternative as well as through an expansion of those sectors with a long track record — like real estate, private equity and hedge funds — into newer areas including infrastructure, private lending and insurance-linked securities. As the alternative investment industry grows, it has also internationalised, with more investments shifting to emerging markets to take advantage of favourable economic trends driven by their younger demographics.
The factors that make alternatives attractive to fund managers and clients are increased for the Middle East due to the structure of the asset and wealth management sector.
Continued growth in Islamic asset managementIslamic asset management continues to grow, at a moderate CAGR of 2.44% since 2012 to reach US$58.89 billion in AuM by the end of 2016, despite the economic challenges in the GCC caused by falling oil prices. The industry is still highly concentrated in Saudi Arabia and Malaysia, however.
Shariah-compliant investments have strong demograph-ic demand but remain under-utilised. Targeting different market sectors and regions has been largely ineffective, due mainly to poor marketing strategies. Inadequate gov-ernment support and recent market conditions have also impaired market performance.
Despite developments in Islamic finance and growth in Islamic assets, Islamic wealth management remains a niche market, and with local services still largely underdeveloped, most Middle East investors continue to invest overseas.
Islamic pension funds’ potential scarcely tapped Pension funds in particular present one way to add scale and grow Shariah-compliant asset management. By value, pension funds represent less than 1% of global Islamic funds. However, since 2012 the number of pension funds has almost doubled and AuM is up more than eight-times. The outstand-ing AuM mix consists of 56% equity funds, 27% mixed assets, 12% sukuk and 5% money market.
The significant potential of Islamic pension funds remains scarcely tapped. According to EY, public pension funds — both conventional and Islamic — in the GCC alone amount to around US$400 billion. If just 30% of these funds were invested in an Islamic manner, the region would be home to a US$120 billion Islamic pension fund industry.
5WEALTH AND ASSET MANAGEMENT REPORT

ISLAMIC ASSET MANAGEMENT INDUSTRY
TOTAL AUM:
US$ 58.9 BNLARGEST MARKETS:
US$ 20.6 BNAUM of Saudi Arabia
US$ 19.6 BNAUM of Malaysia
Outstanding Balance Launched Liquidated / MergedEnd Balance No. of Funds
2012 52,915.52 906.80 (338.78)53,483.54663
2013 56,366.69 920.03 (203.06)57,083.66717
2014 60,535.03 1,864.03 (524.41)61,874.65791
2015 54,664.73 2,039.73 (167.81)56,536.65885
2016 57,466.42 1,511.43 (91.75)58,886.10937
2012
US$ 37.7 MN
2016
US$ 305.3 MN
End Balance No. of Funds
2012 37.6632
2013 90.8346
2014 152.550
2015 221.5655
2016 305.2560
Islamic pension funds witnessed
substantial growth in the past five
years to stand atUS$ 305.3 million
by end of 2016 from US$ 37.7
million in 2012
ISLAMIC PENSION FUNDS
WHAT DIFC HAS TO OFFER:
Funds to be treated as onshore for tax and regulatory purposes within the GCC
Linking global innovation across 4 other FinTech hubs, in New York, London, Singapore and Hong Kong
Smooth company establishment and fast-tracking licensing process for managers launching new funds
Access to top firms looking to access the high-growth MEASA markets Location at the crossroads of major international trade and travel
routes as well as global markets
100%FOREIGN OWNERSHIP
0%TAX RATE
LOW COSTFEE STRUCTURES
+22,000INDIVIDUALS
HOME TO 1750FINANCIAL AND NON-FINANCIAL COMPANIES
Source: Thomson Reuters projections
MEASA ASSET MANAGEMENT MARKET AT A GLANCE
TOTAL AUM IN MEASA’S KEY FINANCIAL CENTRES AS OF 2016
US$ 436.5 BNPROJECTED TO REACH BY 2020
US$ 678.9 BN
INDIA248,653365,787
NIGERIA708
3,787
GCCCOUNTRIES
45,758110,853
SOUTH AFRICA139,776188,457
QATAR2577,828
UAE1,64518,862
KUWAIT2,9249,287
BAHRAIN18,29822,046
OMAN2442,349
SAUDI ARABIA22,38950,482
EGYPT1,6529,974
2016
2020
6 WEALTH AND ASSET MANAGEMENT REPORT

ISLAMIC ASSET MANAGEMENT INDUSTRY
TOTAL AUM:
US$ 58.9 BNLARGEST MARKETS:
US$ 20.6 BNAUM of Saudi Arabia
US$ 19.6 BNAUM of Malaysia
Outstanding Balance Launched Liquidated / MergedEnd Balance No. of Funds
2012 52,915.52 906.80 (338.78)53,483.54663
2013 56,366.69 920.03 (203.06)57,083.66717
2014 60,535.03 1,864.03 (524.41)61,874.65791
2015 54,664.73 2,039.73 (167.81)56,536.65885
2016 57,466.42 1,511.43 (91.75)58,886.10937
2012
US$ 37.7 MN
2016
US$ 305.3 MN
End Balance No. of Funds
2012 37.6632
2013 90.8346
2014 152.550
2015 221.5655
2016 305.2560
Islamic pension funds witnessed
substantial growth in the past five
years to stand atUS$ 305.3 million
by end of 2016 from US$ 37.7
million in 2012
ISLAMIC PENSION FUNDS
WHAT DIFC HAS TO OFFER:
Funds to be treated as onshore for tax and regulatory purposes within the GCC
Linking global innovation across 4 other FinTech hubs, in New York, London, Singapore and Hong Kong
Smooth company establishment and fast-tracking licensing process for managers launching new funds
Access to top firms looking to access the high-growth MEASA markets Location at the crossroads of major international trade and travel
routes as well as global markets
100%FOREIGN OWNERSHIP
0%TAX RATE
LOW COSTFEE STRUCTURES
+22,000INDIVIDUALS
HOME TO 1750FINANCIAL AND NON-FINANCIAL COMPANIES
Source: Thomson Reuters projections
MEASA ASSET MANAGEMENT MARKET AT A GLANCE
TOTAL AUM IN MEASA’S KEY FINANCIAL CENTRES AS OF 2016
US$ 436.5 BNPROJECTED TO REACH BY 2020
US$ 678.9 BN
INDIA248,653365,787
NIGERIA708
3,787
GCCCOUNTRIES
45,758110,853
SOUTH AFRICA139,776188,457
QATAR2577,828
UAE1,64518,862
KUWAIT2,9249,287
BAHRAIN18,29822,046
OMAN2442,349
SAUDI ARABIA22,38950,482
EGYPT1,6529,974
2016
2020
7WEALTH AND ASSET MANAGEMENT REPORT
CHAPTER 1
Regional Macroeconomic Overview

FED RATE HIKES BOOST INVESTOR INTEREST IN GCC FIXED INCOMEBenchmark interest rates have remained stable in developed economies since 2016, with two notable exceptions. The UK cut its rate by 25 basis points in August 2016 to stimulate the economy given widespread uncertainty about the country’s future post-Brexit. In the US, the Federal Reserve (Fed) hiked its benchmark rate three times by the same amount — in December 2016, March 2017 and June 2017 — driven by an anticipated shift to an expansionary fiscal policy and improved economic figures, signaling the beginning of a tightening in US monetary policy.
In response to the Fed’s decision to raise its benchmark rate, the central banks of all GCC countries except for Oman raised their key policy rates by 25 bps in a commitment to main-tain their peg to the U.S. dollar. Oman has not raised its lending interest rate; however, as its policy rate — the overnight repo rate — has increased in line with the Fed rate since December 2016. This resulted in increased borrowing costs and higher yields compared for these countries in a time of economic slowdown. Higher yields on GCC fixed income compared to other regions have attracted increased interest from investors, which in turn has led GCC governments to increase their bond and sukuk issuances in 2017 seeking cheap deficit funding.
REBOUND IN COMMODITY PRICES PAVES WAY FOR GROWTH RECOVERY IN GCC AND SUB-SAHARAN AFRICAElsewhere, signs were mixed for emerging market and devel-oping economies. Countries that are heavily dependent on commodity exports suffered declining — in some cases plum-meting — revenues as energy prices continued their descent during 2016, marking the end of a commodity supercycle.
Although commodity prices, for oil in particular, experi-enced a sharp decline after seeing elevated levels in 2014, they began to rebound in 2016 and are expected to stabilise during the next few years. On the other hand, industrial and precious metals and agricultural commodity prices recov-ered earlier, in Q4 2015. This recovery is primarily down to the supply-demand balance shifting in favour of commodity exporters, in addition to increased interest from investors.
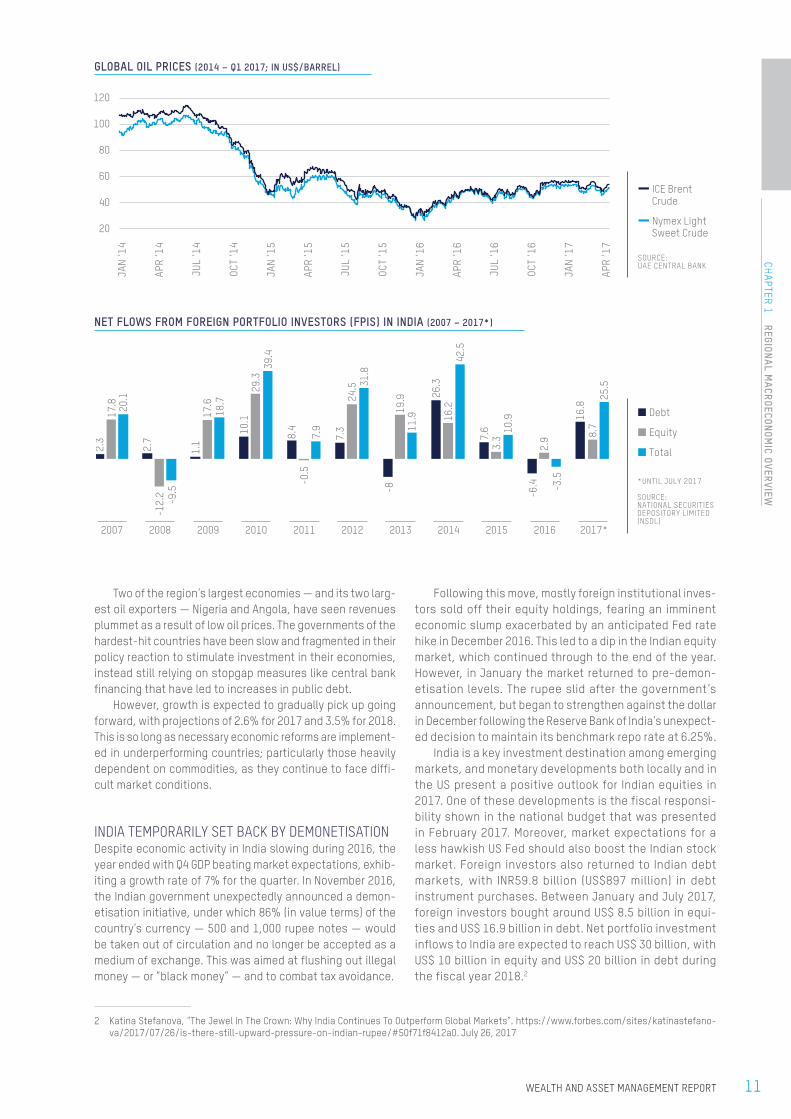
After reaching a high of US$115 per barrel in June 2014, oil prices turned as far south as US$27 in January 2016; reflecting sustained oversupply of crude oil in the market. Prices have since partially recovered, ending 2016 on a bullish note above
1 Franklin Templeton Investments, “Behind the Record-Breaking GCC Debt Issuances”. http://global.beyondbullsandbears.com/2017/05/18/record-breaking-gcc-debt-issuances . May 18, 2017
US$55 following November’s agreement between OPEC and non-OPEC oil producers to cut production for six months. In light of this agreement and a consensus to extend its implementation until March 2018, prices have stabilised around US$50 per barrel.
The GCC debt market has a record US$ 71 billion in debt issuance in 2016 by 160 issuers.1 Most notably, Saudi Arabia issued its US$ 17.5 billion debut international bond in October 2017. This was also the largest ever emerging market issuance, beating the record of Qatar’s US$ 9 billion Eurobond issue earlier in the year. GCC debt issuances are significantly ahead in the first half of 2017, with around US$ 40 billion in sovereign issuances compared to US$ 43 billion for the full year 2016.
EGYPT ON THE TIGHTROPEIn order to secure a US$12 billion International Monetary Fund (IMF) bailout package in November 2016, Egypt agreed to implement a series of reforms to tackle structural issues within its economy. The program included introducing val-ue-added tax, slashing energy subsidies, and floating the Egyptian pound. The currency soon lost over 50% of its value against the dollar, although this was an intended effect to improve Egypt’s external competitiveness, support exports, attract foreign investment, and rebuild foreign reserves.
In late 2016 and early 2017, following the implemen-tation of these reforms, Egypt saw the return of foreign investors, which helped the Egyptian pound recover some of its strength against the dollar. In May 2017, the Egyptian parliament passed the revised version of its 2015 investment law, which aims to cut red tape, streamline doing business in Egypt and offer incentives to lure back foreign investment to the country. Foreign direct investment in Egypt is estimated to have reached US$8.7 billion in the fiscal year ending June 2017, compared US$6.9 billion a year prior.
GROWTH MOMENTUM REMAINS FRAGILE FOR SUB-SAHARAN AFRICAAnother region hit hard by the slump in commodity prices is sub-Saharan Africa, where economic growth dropped to its lowest level in two decades in 2016. The IMF reported growth of 1.4% in 2016; down from 3.4% in 2015 and a high of 7.0% in 2010. The decline was primarily the result of low commodity prices and tightening financial markets.
Countries in the Middle East, Africa and South Asia (MEASA) have exhibited mixed signs of economic growth and prospects in recent years, impacted by a series of global and local economic developments. This is reflected in mixed prospects in the asset management landscape for each of these regions. As with economic growth, South Asia and China are expected to lead the way attracting significant interest from investors worldwide across a spectrum of assets classes. Elsewhere, weaker growth in the Middle East and Africa is shifting increasing foreign investments towards debt markets.
10 WEALTH AND ASSET MANAGEMENT REPORT
CHA
PTER
1
REG
ION
AL
MA
CROE
CON
OMIC
OVE
RVI
EW
¢ Debt
¢ Equity
¢ Total
*UNTIL JULY 2017
SOURCE: NATIONAL SECURITIES DEPOSITORY LIMITED (NSDL)
2.3
2.7
1.1
10.1
8.4
7.3
-8
26.3
7.6
-6.4
16.8
17.8
-12.
2
17.6
29.3
-0.5
24.5
19.9
16.2
3.3
2.9 8.
7
20.1
-9.5
18.7
39.4
7.9
31.8
11.9
42.5
10.9
-3.5
25.5
2007
2008
2009
2010
2011
2012
2013
2014
2015
2016
2017*
GLOBAL OIL PRICES (2014 – Q1 2017; IN US$/BARREL)
NET FLOWS FROM FOREIGN PORTFOLIO INVESTORS (FPIS) IN INDIA (2007 – 2017*)
Two of the region’s largest economies — and its two larg-est oil exporters — Nigeria and Angola, have seen revenues plummet as a result of low oil prices. The governments of the hardest-hit countries have been slow and fragmented in their policy reaction to stimulate investment in their economies, instead still relying on stopgap measures like central bank financing that have led to increases in public debt.
However, growth is expected to gradually pick up going forward, with projections of 2.6% for 2017 and 3.5% for 2018. This is so long as necessary economic reforms are implement-ed in underperforming countries; particularly those heavily dependent on commodities, as they continue to face diffi-cult market conditions.
INDIA TEMPORARILY SET BACK BY DEMONETISATIONDespite economic activity in India slowing during 2016, the year ended with Q4 GDP beating market expectations, exhib-iting a growth rate of 7% for the quarter. In November 2016, the Indian government unexpectedly announced a demon-etisation initiative, under which 86% (in value terms) of the country’s currency — 500 and 1,000 rupee notes — would be taken out of circulation and no longer be accepted as a medium of exchange. This was aimed at flushing out illegal money — or “black money” — and to combat tax avoidance.
2 Katina Stefanova, “The Jewel In The Crown: Why India Continues To Outperform Global Markets”. https://www.forbes.com/sites/katinastefano-va/2017/07/26/is-there-still-upward-pressure-on-indian-rupee/#50f71f8412a0. July 26, 2017
Following this move, mostly foreign institutional inves-tors sold off their equity holdings, fearing an imminent economic slump exacerbated by an anticipated Fed rate hike in December 2016. This led to a dip in the Indian equity market, which continued through to the end of the year. However, in January the market returned to pre-demon-etisation levels. The rupee slid after the government’s announcement, but began to strengthen against the dollar in December following the Reserve Bank of India’s unexpect-ed decision to maintain its benchmark repo rate at 6.25%.
India is a key investment destination among emerging markets, and monetary developments both locally and in the US present a positive outlook for Indian equities in 2017. One of these developments is the fiscal responsi-bility shown in the national budget that was presented in February 2017. Moreover, market expectations for a less hawkish US Fed should also boost the Indian stock market. Foreign investors also returned to Indian debt markets, with INR59.8 billion (US$897 million) in debt instrument purchases. Between January and July 2017, foreign investors bought around US$ 8.5 billion in equi-ties and US$ 16.9 billion in debt. Net portfolio investment inflows to India are expected to reach US$ 30 billion, with US$ 10 billion in equity and US$ 20 billion in debt during the fiscal year 2018.2
JAN
‘14
APR
‘14
JUL
‘14
OCT
‘14
JAN
‘15
APR
‘15
JUL
‘15
OCT
‘15
JAN
‘16
APR
‘16
JUL
‘16
OCT
‘16
JAN
‘17
APR
‘17
20
40
60
80
100
120
— ICE Brent Crude
— Nymex Light Sweet Crude
SOURCE: UAE CENTRAL BANK
11WEALTH AND ASSET MANAGEMENT REPORT
CHA
PTER 1
REGION
AL M
ACR
OECONOM
IC OVERVIEW
MACROECONOMIC OUTLOOK FOR 2018-2022
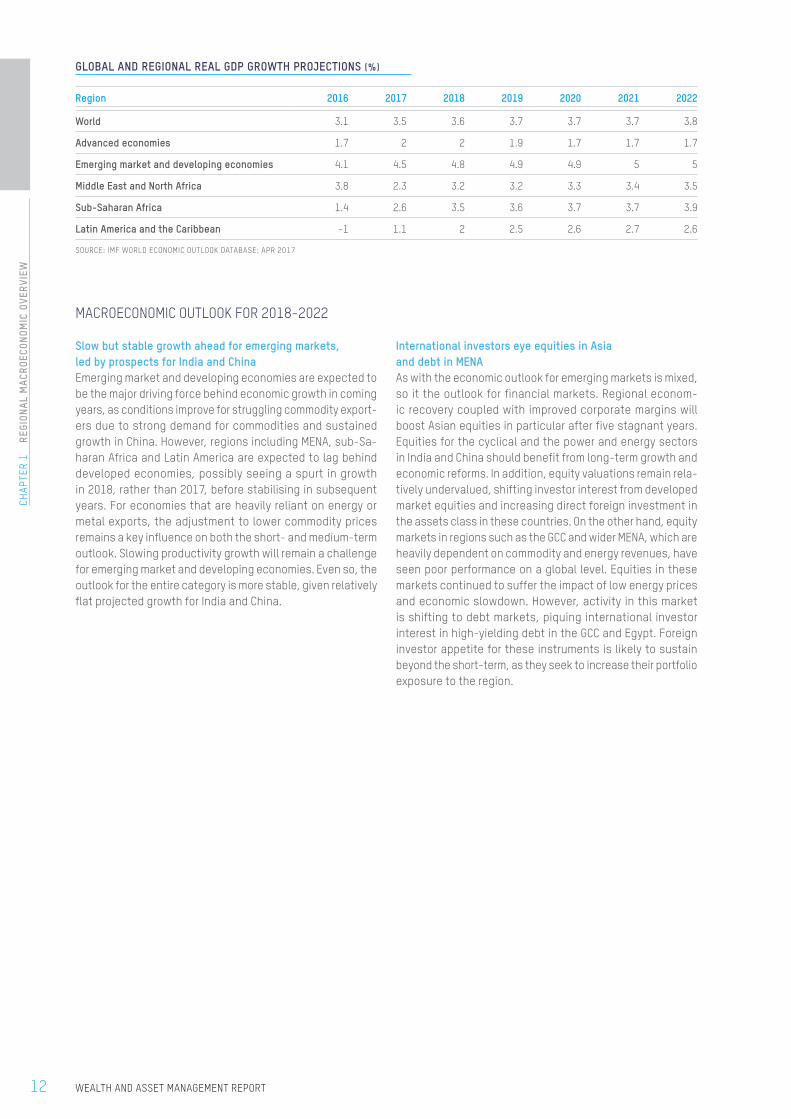
Slow but stable growth ahead for emerging markets, led by prospects for India and ChinaEmerging market and developing economies are expected to be the major driving force behind economic growth in coming years, as conditions improve for struggling commodity export-ers due to strong demand for commodities and sustained growth in China. However, regions including MENA, sub-Sa-haran Africa and Latin America are expected to lag behind developed economies, possibly seeing a spurt in growth in 2018, rather than 2017, before stabilising in subsequent years. For economies that are heavily reliant on energy or metal exports, the adjustment to lower commodity prices remains a key influence on both the short- and medium-term outlook. Slowing productivity growth will remain a challenge for emerging market and developing economies. Even so, the outlook for the entire category is more stable, given relatively flat projected growth for India and China.
International investors eye equities in Asia and debt in MENAAs with the economic outlook for emerging markets is mixed, so it the outlook for financial markets. Regional econom-ic recovery coupled with improved corporate margins will boost Asian equities in particular after five stagnant years. Equities for the cyclical and the power and energy sectors in India and China should benefit from long-term growth and economic reforms. In addition, equity valuations remain rela-tively undervalued, shifting investor interest from developed market equities and increasing direct foreign investment in the assets class in these countries. On the other hand, equity markets in regions such as the GCC and wider MENA, which are heavily dependent on commodity and energy revenues, have seen poor performance on a global level. Equities in these markets continued to suffer the impact of low energy prices and economic slowdown. However, activity in this market is shifting to debt markets, piquing international investor interest in high-yielding debt in the GCC and Egypt. Foreign investor appetite for these instruments is likely to sustain beyond the short-term, as they seek to increase their portfolio exposure to the region.
GLOBAL AND REGIONAL REAL GDP GROWTH PROJECTIONS (%)
Region 2016 2017 2018 2019 2020 2021 2022
World 3.1 3.5 3.6 3.7 3.7 3.7 3.8
Advanced economies 1.7 2 2 1.9 1.7 1.7 1.7
Emerging market and developing economies 4.1 4.5 4.8 4.9 4.9 5 5
Middle East and North Africa 3.8 2.3 3.2 3.2 3.3 3.4 3.5
Sub-Saharan Africa 1.4 2.6 3.5 3.6 3.7 3.7 3.9
Latin America and the Caribbean -1 1.1 2 2.5 2.6 2.7 2.6
SOURCE: IMF WORLD ECONOMIC OUTLOOK DATABASE: APR 2017
12 WEALTH AND ASSET MANAGEMENT REPORT
CHA
PTER
1
REG
ION
AL
MA
CROE
CON
OMIC
OVE
RVI
EW
13WEALTH AND ASSET MANAGEMENT REPORT
CHA
PTER 1
REGION
AL M
ACR
OECONOM
IC OVERVIEW
MARKET EXPERTS INSIGHT
The Prominence of Political Risk
A few years ago, when the CEOs of large asset management companies considered where existential threats to their business could come from, most would have singled out technological change as the largest source of risk. From the advent of robo-advisors and other online and mobile-based competitors to the increasing appeal of index-based and other technology-driven passive investment strategies, keeping up with new technologies was undoubtedly the single biggest cause of sleepless nights for asset managers.
These days, however, while staying abreast of technological change remains a high priority, asset management CEOs are also losing sleep over election results. The rise of populism in many major economies, fuelled by skepticism about the global economic order that has generally benefited asset managers for the past three decades, is leading to dramatic and previously unimaginable political developments that in 2017 are a source of significant risk to the asset management business.
The Brexit vote in the United Kingdom, the election of Donald Trump in the United States, and the defeat of both main political parties in the recent French presidential election are just some of the dramatic events at the ballot box that surprised many pollsters and propelled major economies in new directions. Events such as these create a level of uncertainty about the future course of economic and financial policy that asset managers need to be able to manage.
Political Uncertainty and its Impact on Economic PerformanceThe most obvious implication of the changing political landscape on the asset management business is through its impact on the underlying economic and financial fundamentals. On the whole, and over the long term, most asset managers (and certainly
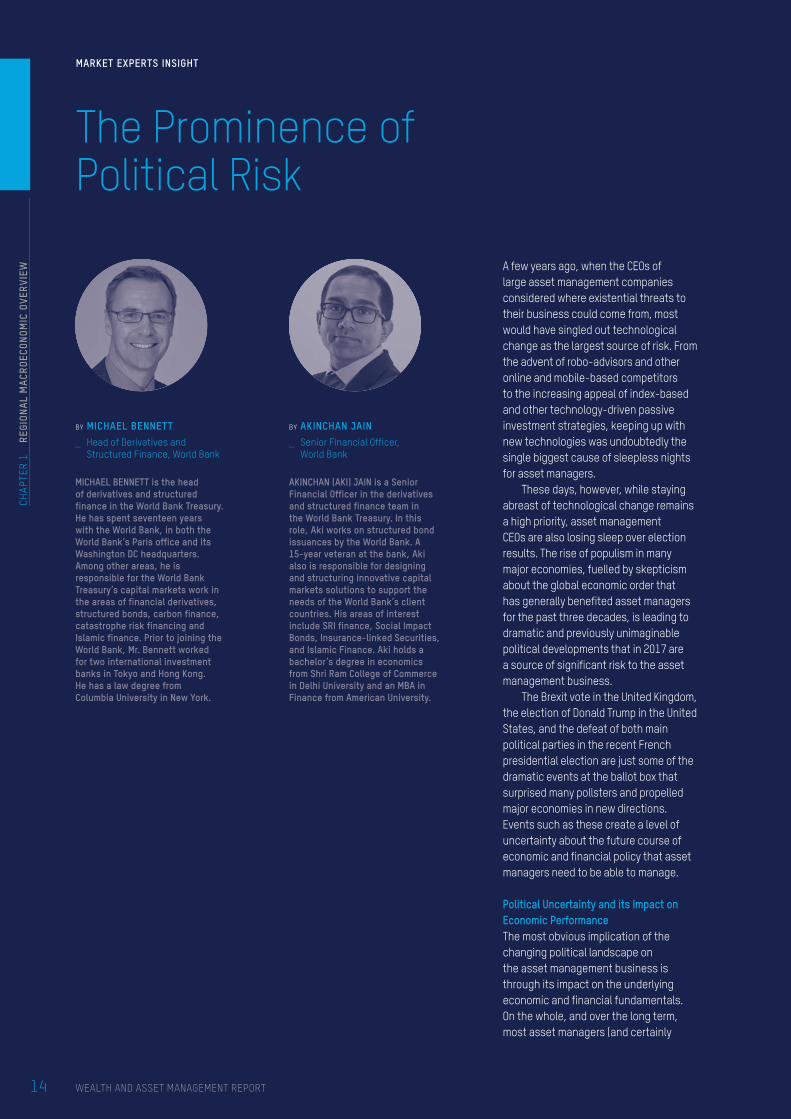
BY MICHAEL BENNETT
_ Head of Derivatives and Structured Finance, World Bank
MICHAEL BENNETT is the head of derivatives and structured finance in the World Bank Treasury. He has spent seventeen years with the World Bank, in both the World Bank’s Paris office and its Washington DC headquarters. Among other areas, he is responsible for the World Bank Treasury’s capital markets work in the areas of financial derivatives, structured bonds, carbon finance, catastrophe risk financing and Islamic finance. Prior to joining the World Bank, Mr. Bennett worked for two international investment banks in Tokyo and Hong Kong. He has a law degree from Columbia University in New York.
BY AKINCHAN JAIN
_ Senior Financial Officer, World Bank
AKINCHAN (AKI) JAIN is a Senior Financial Officer in the derivatives and structured finance team in the World Bank Treasury. In this role, Aki works on structured bond issuances by the World Bank. A 15-year veteran at the bank, Aki also is responsible for designing and structuring innovative capital markets solutions to support the needs of the World Bank’s client countries. His areas of interest include SRI finance, Social Impact Bonds, Insurance-linked Securities, and Islamic Finance. Aki holds a bachelor’s degree in economics from Shri Ram College of Commerce in Delhi University and an MBA in Finance from American University.
14
CHA
PTER
1
REG
ION
AL
MA
CROE
CON
OMIC
OVE
RVI
EW
WEALTH AND ASSET MANAGEMENT REPORT
those that are long only) will only do as well as the overall economy. Political uncertainty is generally bad for business, which in turn usually results in lower returns for asset managers. Moreover, increased uncertainty in the face of a shifting political landscape impedes business activity in the short term by hindering planning, decision-making, and investing. A sudden change in import duties on raw materials, or taxation rates, or government spending, for instance, can quickly render a business unviable.
The experience over the last few years has borne this out. Take the case of Britain’s decision to exit the European Union. Even before a formal exit, which in itself may take a few years, businesses have already felt a negative impact. According to the British Chambers of Commerce, a majority of firms expect an increase in their costs, which they plan to pass on to consumers. The pound has fallen more than 10%, even after accounting for a recent recovery, which has had a significant impact on prices of imported goods and raw materials. Consulting firm Mercer has warned that Britain is already experiencing a serious shortage of labour because of shifting demographics, a trend that could worsen as Brexit is expected to reduce the number of foreign workers coming to the country.
The power of political events to move markets and have repercussions for the real economy was also recently demonstrated in South Africa. President Jacob Zuma’s decision to sack well-regarded Finance Minister Pravin Gordhan resulted in a sharp depreciation of the rand, an almost 10% fall in the local stock market, and S&P downgrading the country’s international credit rating to junk status. The impeachment of President Dilma Rousseff in Brazil similarly led to a deepening of the recession in that country.
The Asset Management Industry as Political TargetPolitical change can also have a direct impact on the asset management business due to shifts in the regulatory landscape. In most countries, asset management is a very profitable business. This can make the industry a target for politicians, particularly in countries where populism is on the upswing. According to a recent report by Institutional Investor magazine, the universe of total investable assets has grown steadily over recent years, and now stands at more than $270 trillion, resulting in record profits for the industry. Consulting firm BCG estimates that global industry profits totalled $102 billion in 2014, with remarkably high operating margins of 39%. These margins are about twice as high as profits earned by the pharmaceutical industry, which itself has incurred the wrath of regulators in the United States and elsewhere for the high prices of specialty drugs.
The Financial Conduct Authority, the UK’s financial regulator, published a damning report last November, raising questions about the value the industry provides for investors. While a majority of money managers underperform their benchmark indices net of fees, the report also highlighted that bigger, institutional investors tend to get better pricing and performance than individuals. These were the same concerns that had prompted the Department of Labour under the Obama administration to introduce a “Fiduciary Rule” that would have required asset managers offering retirement investment advice to act in the best interests of their customers. Although temporarily on hold for review by the Trump administration, the writing is already on the wall — just over half of assets in both mutual funds and exchange-traded funds are now passively invested in a low-cost index,
according to research firm Morningstar. During, more than $400 billion has flowed into passively managed funds, primarily at the expense of actively managed ones. To stem the tide, large asset managers such as Blackrock, Fidelity, Charles Schwab, and others have already announced that they will slash fees on various actively managed funds.
The same is true in emerging markets. A recent report by Reuters points out China is attempting to rein in financial risk by tightening regulation of its asset management products, which have grown to over 80 trillion yuan ($11.7 trillion) by the first half of 2016. Draft rules formulated by the central bank together with the securities, banking, and insurance regulators would standardise leverage ratio limits and require sellers of asset management products to put aside risk reserve funds equal to 10% of product management fees, among other requirements.
ConclusionOver the past few years, disenchantment with the status quo and a perception that the economic benefits of globalisation have not been evenly distributed have led to unexpected results at the ballot box and other political volatility in many countries. While such events are not always bad for the economy (witness the strong stock market performance in the United States following the election of Donald Trump or in South Korea following the impeachment of President Park Geun-hye), uncertainty almost always causes asset managers to lose sleep. In such times, successful asset management requires the ability to navigate smoothly political changes while at the same time delivering value to the growing base of institutional and retail investors looking for cost-effective strategies for investment management.
15
CHA
PTER 1
REGION
AL M
ACR
OECONOM
IC OVERVIEW
WEALTH AND ASSET MANAGEMENT REPORT

CHAPTER 2
Asset Management Industry Overview and Landscape

DESPITE CHALLENGING ECONOMIC CONDITIONS, GLOBAL AUM GROWS 6.27% IN 2016The past two years have been the most economically chal-lenging since the financial crisis of 2008. Developed and emerging markets have been prone to turbulence in one way or another, whether economic or political. However, despite the uncertainty caused by the UK’s decision to leave the Euro-pean Union, the unexpected election of Donald Trump to the US presidency, and political turmoil in other parts of the world, the asset management industry has performed relatively well.
In the MENA region, a steep drop in oil prices has sig-nificantly impacted government revenues, particularly in the GCC, where oil accounts for as much as 70% of income for some countries. This has been a concern for investors whose investments are tied to the performance of those economies. However, not all MENA economies rely on oil. Countries such as Egypt, Morocco, Tunisia, Jordan and Leb-anon have all benefited from tumbling oil prices as they are net oil importers. And the affected GCC countries may even eventually benefit as they are now making efforts to diversify their economies away from oil, and have agreed to introduce value-added taxes in 2018.
Global assets under management, or AuM, rose 6.27% last year to US$39.0 trillion, partly encouraged by a rise in equity market valuations. This contrasts with previous years when fund flows were determined more by long-term competitive advantage.
Speaking of fund flows, the industry has shown inter-esting trends in the past few years. Net flows in 2016 were down significantly on previous years, signalling slowing demand for global markets. However, net flows for bonds continued to be large, standing at US$481.7 billion as of December 2016, representing 79.1% of total net flows across different asset classes.
North America dominates the asset management industry, with a 56.0% market share in 2016, and 94.3% of that share is managed in the United States. This market has weathered some changes, both politically and financially, but overall the US economy has pushed ahead in 2017, after a weak start in early 2016, as it approaches a condition of full employment.
1 UBS/PwC. Billionaire Report 2016: Are billionaires feeling the pressure?
INDIA LEADS MEASA COUNTRIES IN AUMThe MEASA assets under management totalled about US$436.5 billion at the end of 2016, of which India accounted for US$248.7 billion, followed by South Africa with US$139.8 billion. India has the potential to grow further and become a regional hub, however; tax treaty in the country remains a challenge for the local asset managers which have forced them to look for offshore financial centres to enjoy tax incentives.
While the MENA region may not be home to asset manag-ers on a scale with some in the US and Europe, its regulatory regimes have attracted a number of foreign asset managers, as witnessed recently in the Dubai International Financial Centre (DIFC) and Morocco through foreign direct investments. Investment attitudes in the region have also been chang-ing, with a massive expansion of the middle class and rising numbers of young high-net-worth individuals (HNWI). Apart from favourable regulations and a shift in investing attitudes, regional emerging market financial sectors are reinvesting capital locally that previously have gone offshore.
The growing number of wealthy millennials is expected to take the market by storm, and to become the prime investor base for asset and wealth managers as baby boomers start to cash out. The latest UBS/PwC Billionaires Report1 predicts that over the next two decades as much as US$2.1 trillion will be handed over to billionaires’ heirs, representing 85% of the first generation’s wealth. While this may create new opportunities in Asian and Middle East markets, it also poses serious chal-lenges for wealth managers. The rising number of tech-savvy younger investors when contrasted with older wealth man-agers and advisors will create big gaps in areas such as knowledge, technology and risk appetite. Asset and wealth managers will need to attract younger and more leading-edge relationship managers to work with the new generation.
AUM OF GLOBAL FUNDS OUTSTANDING (2012 – 2016, IN US$ BILLION)
30.7
2012
34.9
2013
36.7
2014
36.7
2015
39.0
2016
SOURCE: THOMSON REUTERS LIPPER
18 WEALTH AND ASSET MANAGEMENT REPORT
CHA
PTER
2
ASS
ET M
AN
AGE
MEN
T IN
DUST
RY
OVER
VIEW
AN
D LA
NDS
CAPE
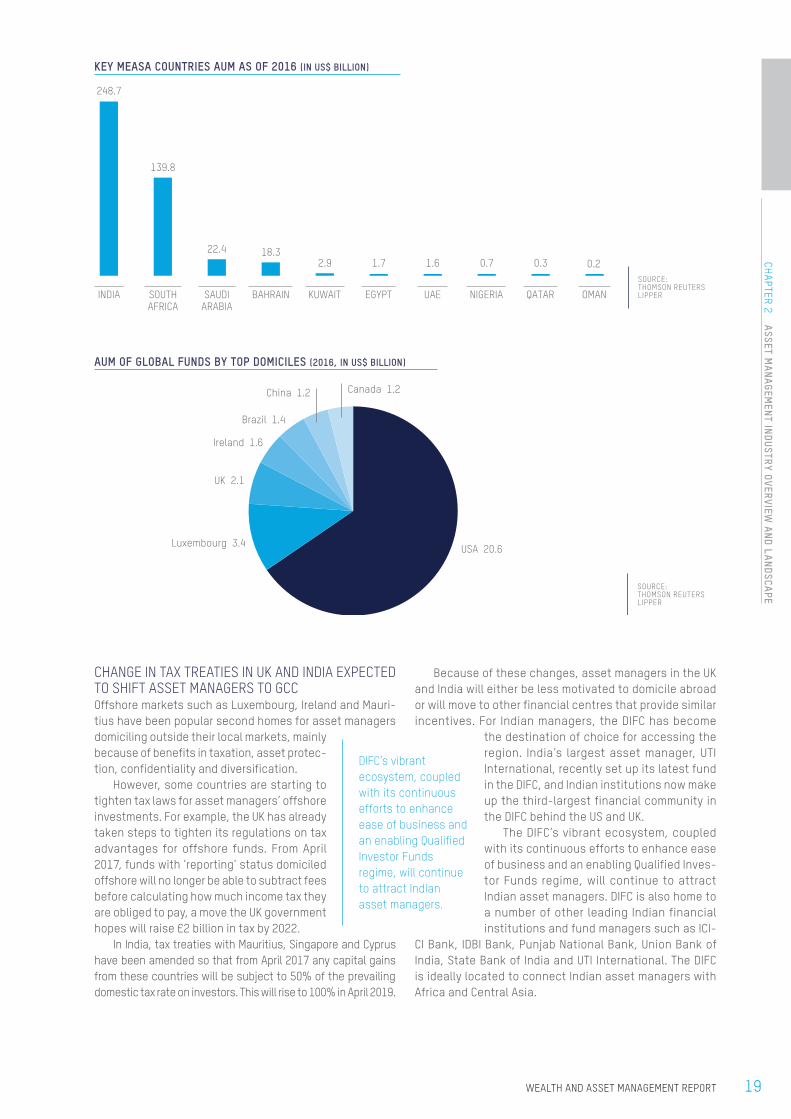
CHANGE IN TAX TREATIES IN UK AND INDIA EXPECTED TO SHIFT ASSET MANAGERS TO GCCOffshore markets such as Luxembourg, Ireland and Mauri-tius have been popular second homes for asset managers domiciling outside their local markets, mainly because of benefits in taxation, asset protec-tion, confidentiality and diversification.
However, some countries are starting to tighten tax laws for asset managers’ offshore investments. For example, the UK has already taken steps to tighten its regulations on tax advantages for offshore funds. From April 2017, funds with ‘reporting’ status domiciled offshore will no longer be able to subtract fees before calculating how much income tax they are obliged to pay, a move the UK government hopes will raise £2 billion in tax by 2022.
In India, tax treaties with Mauritius, Singapore and Cyprus have been amended so that from April 2017 any capital gains from these countries will be subject to 50% of the prevailing domestic tax rate on investors. This will rise to 100% in April 2019.
Because of these changes, asset managers in the UK and India will either be less motivated to domicile abroad or will move to other financial centres that provide similar incentives. For Indian managers, the DIFC has become
the destination of choice for accessing the region. India’s largest asset manager, UTI International, recently set up its latest fund in the DIFC, and Indian institutions now make up the third-largest financial community in the DIFC behind the US and UK.
The DIFC’s vibrant ecosystem, coupled with its continuous efforts to enhance ease of business and an enabling Qualified Inves-tor Funds regime, will continue to attract Indian asset managers. DIFC is also home to a number of other leading Indian financial institutions and fund managers such as ICI-
CI Bank, IDBI Bank, Punjab National Bank, Union Bank of India, State Bank of India and UTI International. The DIFC is ideally located to connect Indian asset managers with Africa and Central Asia.
KEY MEASA COUNTRIES AUM AS OF 2016 (IN US$ BILLION)
AUM OF GLOBAL FUNDS BY TOP DOMICILES (2016, IN US$ BILLION)
DIFC’s vibrant ecosystem, coupled with its continuous efforts to enhance ease of business and an enabling Qualified Investor Funds regime, will continue to attract Indian asset managers.
248.7
139.8
22.4 18.32.9 1.7 1.6 0.7 0.3 0.2
INDIA
SOUTHAFRICA
SAUDI
ARABIA
BAHRAIN
KUWAIT
EGYPT
UAE
NIGERIA
QATAR
OMAN
SOURCE: THOMSON REUTERS LIPPER
SOURCE: THOMSON REUTERS LIPPER
USA 20.6Luxembourg 3.4
UK 2.1
Ireland 1.6
Brazil 1.4
China 1.2 Canada 1.2
19WEALTH AND ASSET MANAGEMENT REPORT
CHA
PTER 2
ASSET M
AN
AGEM
ENT IN
DUSTRY OVER
VIEW A
ND LA
NDSCA
PE

20 WEALTH AND ASSET MANAGEMENT REPORT
CHA
PTER
2
ASS
ET M
AN
AGE
MEN
T IN
DUST
RY
OVER
VIEW
AN
D LA
NDS
CAPE
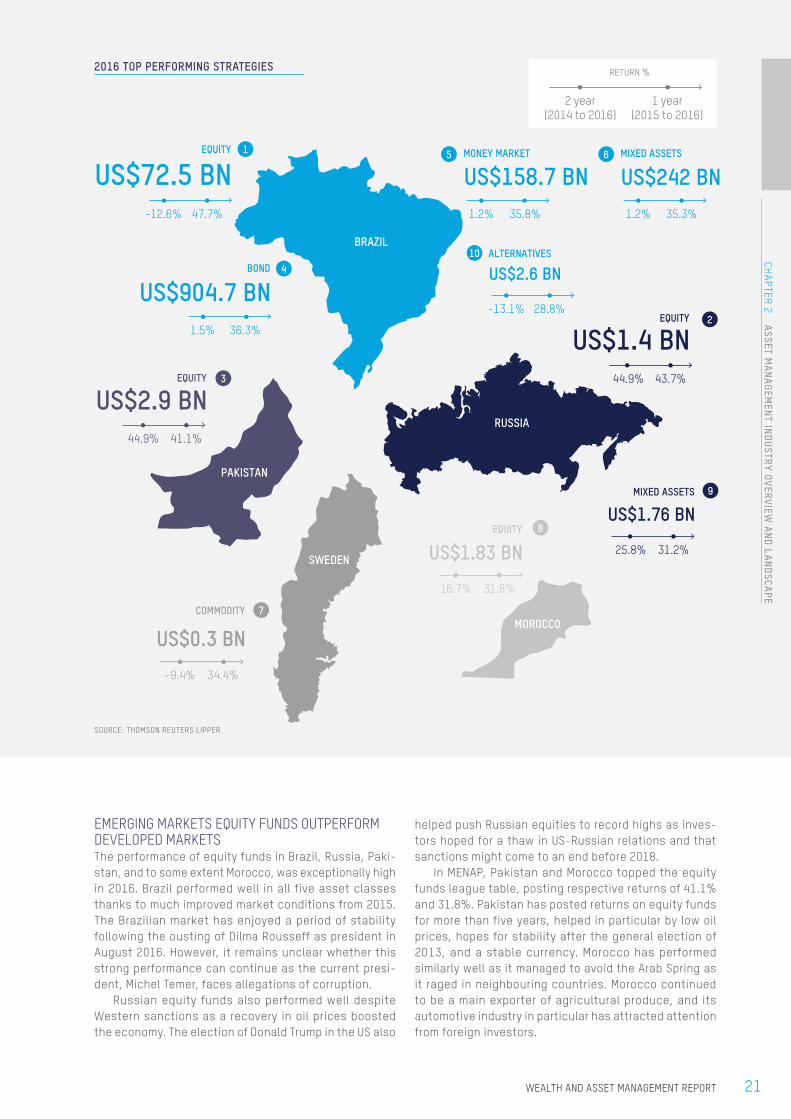
EMERGING MARKETS EQUITY FUNDS OUTPERFORM DEVELOPED MARKETSThe performance of equity funds in Brazil, Russia, Paki-stan, and to some extent Morocco, was exceptionally high in 2016. Brazil performed well in all five asset classes thanks to much improved market conditions from 2015. The Brazilian market has enjoyed a period of stability following the ousting of Dilma Rousseff as president in August 2016. However, it remains unclear whether this strong performance can continue as the current presi-dent, Michel Temer, faces allegations of corruption.
Russian equity funds also performed well despite Western sanctions as a recovery in oil prices boosted the economy. The election of Donald Trump in the US also
helped push Russian equities to record highs as inves-tors hoped for a thaw in US-Russian relations and that sanctions might come to an end before 2018.
In MENAP, Pakistan and Morocco topped the equity funds league table, posting respective returns of 41.1% and 31.8%. Pakistan has posted returns on equity funds for more than five years, helped in particular by low oil prices, hopes for stability after the general election of 2013, and a stable currency. Morocco has performed similarly well as it managed to avoid the Arab Spring as it raged in neighbouring countries. Morocco continued to be a main exporter of agricultural produce, and its automotive industry in particular has attracted attention from foreign investors.
BRAZIL
RUSSIA
PAKISTAN
SWEDEN
MOROCCO
EQUITY
US$72.5 BN47.7%-12.6%
MIXED ASSETS
US$1.76 BN
25.8% 31.2%
EQUITY
US$1.4 BN44.9% 43.7%EQUITY
US$2.9 BN44.9% 41.1%
COMMODITY
US$0.3 BN
-9.4% 34.4%
MONEY MARKET
US$158.7 BN35.8%1.2%
BOND
US$904.7 BN36.3%1.5%
ALTERNATIVES
US$2.6 BN
28.8%-13.1%
EQUITY
US$1.83 BN
31.8%16.7%
MIXED ASSETS
US$242 BN35.3%1.2%
3
7
8
1
4
5
10
6
2
9
1 year(2015 to 2016)
RETURN %
2 year(2014 to 2016)
SOURCE: THOMSON REUTERS LIPPER
2016 TOP PERFORMING STRATEGIES
21WEALTH AND ASSET MANAGEMENT REPORT
CHA
PTER 2
ASSET M
AN
AGEM
ENT IN
DUSTRY OVER
VIEW A
ND LA
NDSCA
PE

MARKET EXPERTS INSIGHT
A Copernican revolution is taking investment management by storm
BY PAOLO SIRONI
_ FinTech Thought Leader, IBM Watson Financial Services, IBM Industry Academy
PAOLO SIRONI is elective member of IBM Industry Academy and recognised bestselling author of FinTech, Investment Management, Risk Management and Banking Regulation. He advises IBM clients on digital transformation by linking finance (FIN), regulation (REG) and technology (TECH) into ROI oriented business models. He was formerly head of market risk management for investment banks and startup entrepreneur.
How would you describe today’s digital transformation?We live in a digital era which is revolutionising our lives at an accelerated pace. We are dedicating more time to staying connected, as we are exposed to a global deluge of complex economic and financial information which we are expected to interpret and then make clear, intelligent financial decisions. All the while, volatility reigns and stock markets bounce between boom and bust. There is no doubt many of us need better financial advice. The equations should be simple in a digital world:
EARNINGS – PAYMENTS = SAVINGS
SMART SAVINGS =
INFORMED INVESTING
BORROWING
RETIRING
INSURING
Yet the banking relationship has been dominated for decades by an asymmetry of information which has allowed professional players to bury our personal needs under a layer of complexities, fees, and conflicts of interest. Today, in the aftermath of the global financial crisis, the industry’s reputation is largely broken, and while regulators attempt to mend the system, financial firms are also having to deal with the advent of FINancial TECHnology innovation.
How would you define FinTech?FinTech attempts to leverage digital technology and advanced analytics to revolutionise financial services, harnessing economies of scale by targeting long-tail consumers and inefficient businesses with cheaper services. These typically feature a high level of specialisation — making
them a very narrow and simple business proposition — to profit from the unbundling of financial services into leaner digital offers.
The FinTech space changes fast and is populated by new firms and ideas almost every quarter. By and large, these can be classified into digital lending; digital payments; big data analytics; blockchain architectures; robo-advisors; and residual models.
Social media and digital technology are providing the opportunity to leverage virtual networks among individuals, without the need for traditional intermediaries. Potential creditors can reach out almost directly to potential debtors, by pooling small-ticket investments into lending facilities specialised in personal lending or small business. Mobile and wearable technologies are giving IT firms unprecedented power to disintermediate the centuries-old banking centrality of cash repository and payment services, and helping to foster financial inclusion in poor countries. As telecommunications and the worldwide web become ubiquitous, we can today visit smart cities and travel around them using our mobile phones instead of holding physical travel cards, carrying a credit card, or looking for spare change in our pockets.
Social media has become global, providing innovators with a fertile terrain on which to develop advanced analytics that identify, analyse, and target investors’ preferences, and track their digital interaction and peer-to-peer relationships. Big data analytics, behavioral analytics, and cognitive computing operate within this space. FinTech companies have the opportunity either to adopt these techniques as part of their operations or to create new business models that provide analytics-driven services and
22
CHA
PTER
2
ASS
ET M
AN
AGE
MEN
T IN
DUST
RY
OVER
VIEW
AN
D LA
NDS
CAPE
WEALTH AND ASSET MANAGEMENT REPORT
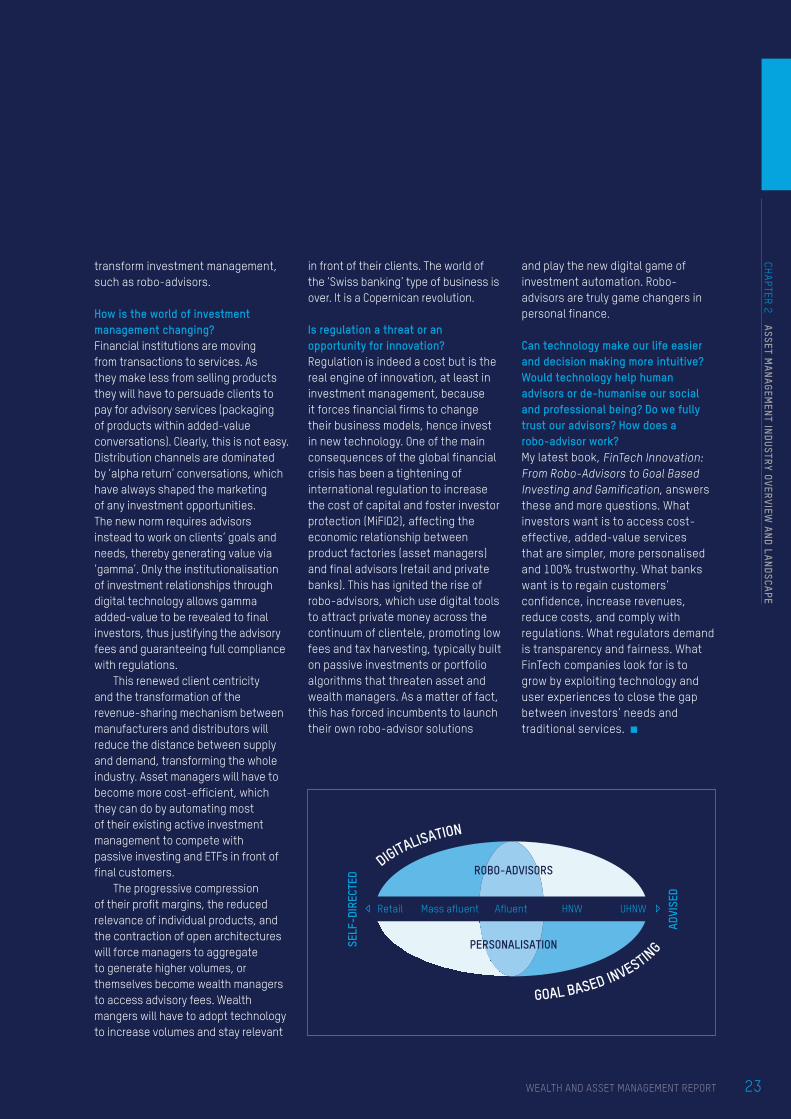
transform investment management, such as robo-advisors.
How is the world of investment management changing?Financial institutions are moving from transactions to services. As they make less from selling products they will have to persuade clients to pay for advisory services (packaging of products within added-value conversations). Clearly, this is not easy. Distribution channels are dominated by ‘alpha return’ conversations, which have always shaped the marketing of any investment opportunities. The new norm requires advisors instead to work on clients’ goals and needs, thereby generating value via ‘gamma’. Only the institutionalisation of investment relationships through digital technology allows gamma added-value to be revealed to final investors, thus justifying the advisory fees and guaranteeing full compliance with regulations.
This renewed client centricity and the transformation of the revenue-sharing mechanism between manufacturers and distributors will reduce the distance between supply and demand, transforming the whole industry. Asset managers will have to become more cost-efficient, which they can do by automating most of their existing active investment management to compete with passive investing and ETFs in front of final customers.
The progressive compression of their profit margins, the reduced relevance of individual products, and the contraction of open architectures will force managers to aggregate to generate higher volumes, or themselves become wealth managers to access advisory fees. Wealth mangers will have to adopt technology to increase volumes and stay relevant
in front of their clients. The world of the ‘Swiss banking’ type of business is over. It is a Copernican revolution.
Is regulation a threat or an opportunity for innovation?Regulation is indeed a cost but is the real engine of innovation, at least in investment management, because it forces financial firms to change their business models, hence invest in new technology. One of the main consequences of the global financial crisis has been a tightening of international regulation to increase the cost of capital and foster investor protection (MiFID2), affecting the economic relationship between product factories (asset managers) and final advisors (retail and private banks). This has ignited the rise of robo-advisors, which use digital tools to attract private money across the continuum of clientele, promoting low fees and tax harvesting, typically built on passive investments or portfolio algorithms that threaten asset and wealth managers. As a matter of fact, this has forced incumbents to launch their own robo-advisor solutions
and play the new digital game of investment automation. Robo-advisors are truly game changers in personal finance.
Can technology make our life easier and decision making more intuitive? Would technology help human advisors or de-humanise our social and professional being? Do we fully trust our advisors? How does a robo-advisor work?My latest book, FinTech Innovation: From Robo-Advisors to Goal Based Investing and Gamification, answers these and more questions. What investors want is to access cost-effective, added-value services that are simpler, more personalised and 100% trustworthy. What banks want is to regain customers’ confidence, increase revenues, reduce costs, and comply with regulations. What regulators demand is transparency and fairness. What FinTech companies look for is to grow by exploiting technology and user experiences to close the gap between investors’ needs and traditional services.
Retail
SELF
-DIR
ECTE
D
ADVI
SED
Mass afluent Afluent HNW UHNW
GOAL BASED INVESTING
DIGITALISATION
ROBO-ADVISORS
PERSONALISATION
23
CHA
PTER 2
ASSET M
AN
AGEM
ENT IN
DUSTRY OVER
VIEW A
ND LA
NDSCA
PE
WEALTH AND ASSET MANAGEMENT REPORT

Asset and Wealth Management Leading Financial Hubs
CHAPTER 3


DUBAI LEADS THE LIST OF FINANCIAL CENTRES IN MEASA REGIONThe Global Financial Centres Index 21 released in March ranked 88 different financial centres based on a wide vari-ety of factors including country risk, business environment, financial secrecy, logistics, tele-communications, and innovation.
The traditional powerhouses of New York, London and Tokyo continue to lead GFCI rank-ings, along with their competitors in Singapore and Hong Kong targeting growth in China and other Asian emerging markets. Dubai, ranks 25th in the index and leads all other MEASA countries, and has aspirations to provide a bridge for capital flowing to South Asia, Africa and the Mid-dle East due to their central locations and convenient time zones relative to Europe.
GFCI RANKING
City
1 London
2 New York
3 Singapore
4 Hong Kong
5 Tokyo
13 Shanghai
25 Dubai
28 Abu Dhabi
City
30 Casablanca
39 Doha
57 Bahrain
59 Johannesburg
63 Mumbai
71 Mauritius
76 Riyadh
SOURCE: CHINA DEVELOPMENT INSTITUTE & Z/YEN GLOBAL FINANCIAL CENTRES INDEX 21
CHANGING CAPITAL FLOWS ARE CHANGING WHAT IS REQUIRED FROM A FINANCIAL CENTREIn today’s environment, regional financial centres are import-ant for capital investments in developed markets as well as
other parts of their regions and in emerging markets. This requires more than offering a low-tax jurisdiction that is able to guarantee full repatriation of funds, although that is still important. It has become more important to offer a one-stop shop connecting with many different markets where tax treaties are in place and mutual recognition allows fund managers in one jurisdiction to operate freely in another without undue cost.
In addition to the regulatory infrastructure relating to incorporation, operations and internationalisation, it is important to have the telecommunications and broader financial services network in place to be able to compete in today’s interconnected world.
Regulations and taxes still matter, of course, and this chapter will provide a brief overview of the highs and lows of the regulatory and tax regimes in Dubai, Bahrain, Singa-pore, Hong Kong, Japan, and South Africa.. This overview will highlight the opportunities and challenges facing asset managers in different regions across Africa, the Middle East, South Asia and East Asia.
Financial centres have long competed by vying to offer the lowest taxes and lightest regulation. Although these remain important factors when asset managers decide where to base their businesses, changes in where investments are coming from and headed to have changed the equation. Whereas in the past the primary direction of fund managers was to move offshore while still largely managing assets based in developed markets, there has been a shift this century to setting up closer to emerging markets to serve both the growing wealth in these regions as well as interest from developed market asset owners in global investment allocations.
“Capital goes where it’s welcome and stays where it’s well treated.”WALTER WRISTON,
FORMER CHAIRMAN & CEO,
CITICORP
26 WEALTH AND ASSET MANAGEMENT REPORT
CHA
PTER
3
ASS
ET A
ND
WEA
LTH
MA
NA
GEM
ENT
LEA
DIN
G FI
NA
NCI
AL
HUB
S
DUBAI: DIFC COMBINES EASE OF REGISTRATION AND LOW TAX APPROACHThe United Arab Emirates has several different regimes for fund managers but most managers use the Dubai Interna-tional Financial Centre.
The major change affecting fund managers will be the UAE’s introduction in January 2018 of a 5% value-added tax to combat declining prices for oil, the resource which accounts for most of the federal government’s revenue. The country still has no company or income taxes, however, and the low value-added tax is unlikely to affect free zones.
The DIFC allows fund management companies to incor-porate with 100% foreign ownership and a zero percent tax rate. Investment managers are required to hold licenses and authorisation for their activities within the DIFC. For foreign fund managers with funds registered elsewhere, they are able to manage DIFC funds without a separate DFSA license provided they meet conditions including being registered in one of the countries on the DFSA’s recognised jurisdiction list.
For fund managers with large institutional customers who don’t want lengthy disclosures, the DIFC allows Qualified Investor Funds to be sold with only a very limited information memorandum and 14 days’ notice. The flexibility for fund man-agers to take advantage of a low-cost fund offering process has made the DIFC attractive not just for its low personal taxes and the UAE’s network of tax treaties.
This fund regime has been particularly attractive as funds targeting the GCC region increase in sophistication to include alternative assets like hedge and private equity funds, complementing traditional equity and real estate funds. The increased sophistication has created a need for a regional fund domicile and for the speed the DIFC offers in terms of company establishment and fast-tracking the licensing pro-cess for managers launching new funds.
Also, unlike with offshore financial centres, a DIFC fund can be treated as onshore for tax and regulatory purposes within the GCC. As the GCC countries increase cooperation, there are benefits for investors within the region that aren’t available to foreign investors, opening a wider market for a DIFC-registered fund than if it were domiciled offshore.
1 CBB.
2 Al-Maraj. Rasheed. Keynote Address at The 3rd Annual Euromoney Bahrain Conference, March 4, 2014.
BAHRAIN: HISTORICALLY THE ORIGINAL JURISDICTION OF CHOICE FOR GCC FUND MANAGERSBahrain has long been the jurisdiction of choice for many fund managers operating within the GCC on the back of its position as an offshore banking hub for the region. The regulation of collective investment schemes is overseen by the Central Bank of Bahrain under a separate module within the CBB rulebook. Investment managers, including those for collective investment schemes, are permitted to undertake different levels of activities depending on whether the firm is responsible for safeguarding assets, or whether it is trading on a principal basis. As in oth-er jurisdictions, base capital requirements for fund managers incorporated in Bahrain rise with the scope of activities per-mitted and are comparable with some Asian financial centres.
For the funds themselves, the investor profile determines the fund licensing type (either open- or closed-ended). Retail collective investment undertakings (CIUs) must be authorised by the CBB and carry significant restrictions on the types of assets that can be invested in and maximum concentration in a single position or issuer’s securities. Expert CIUs allow greater flexibility on concentration and asset classes but require investors to have investable assets of $100,000 and minimum fund investments of at least $10,000.
Unlike retail or expert CIUs, exempt CIUs are not authorised by the CBB and are only available for accredited investors. Although authorisation is not required before these investment funds can be sold, they still require registration with the CBB, although the disclosure documents are much more limited. There are no restrictions on asset classes or investment concentrations.1
However, growth in Bahrain slowed following the financial crisis, with a downturn in the property market, and a central bank-led effort to encourage consolidation within the domes-tic banking sector.2 Political instability during the Arab Spring also hit confidence and many fund managers who moved to Dubai then have stayed despite a return to stability in Bahrain. Dubai is also often favoured over Bahrain because of its wider network of business linkages (Dubai is a regional transpor-tation and logistics hub as well as financial services centre) and because its more cosmopolitan character attract financial services professionals from similarly cosmopolitan cities.
Despite these challenges, Bahrain offers similar regula-tory, incorporation and tax benefits as Dubai. It has a single regulator, allows 100% foreign ownership and free repatriation of funds, and there are no corporation, personal income, wealth, or capital gains taxes.
27WEALTH AND ASSET MANAGEMENT REPORT
CHA
PTER 3
ASSET A
ND W
EALTH
MA
NA
GEMEN
T LEADIN
G FINA
NCIA
L HUBS
JAPAN: A GOOD EXAMPLE OF A MATURE MARKETAs a starting point, Japan provides a good example of a mature market where the regulatory and tax system is primarily focused on a large domestic pool of assets.
The regulatory regime for a new fund manager operating in Japan is partly an outcome of domestic scandals in the funds sector. There are stringent asset valuation regulations and base capital requirements for investment managers as well as restrictions on the types of activities that can be undertaken by registered investment advisory firms.
Investment advisory firms and investment management firms are subject to separate regulatory frameworks, with investment advisors allowed only limited activities rela-tive to investment managers. An investment management company is allowed wide discretion (there are four different levels of licensing) but has rigid registration requirements in terms of corporate structure, having to be a Japanese incorporated joint stock company with 50 million yen in paid-in capital ($450,000).3
The investment management registration, for example, allows a firm to manage collective investment schemes as well as investment trusts and investment corporations, provided the firm can demonstrate that its compliance systems meet the required level, that it protects the best interests of cus-tomers (including in many cases through required third-party assessors for asset valuation), and it files the required annual reports with Japan’s Financial Services Agency (FSA).
For foreign funds, there is some greater leeway provided they are qualified institutional investors (QII), although the number of investors and their total contribution to the fund value must remain limited to avoid more stringent regulatory oversight. The law has recently been amended to loosen some of the requirements for offshore funds with limited numbers of Japanese QII clients, but there are still challenges facing single-investor funds and feeder funds for Japan-specific clients (even QII only).
From a tax perspective, Japan also has relatively high tax-es compared to other jurisdictions, with capital gains taxes, corporation taxes for Japan-sourced income, and income taxes for Japan-based fund managers. Depending on whether fund limited partners (LPs) have a permanent establishment in Japan, they may also have their fund distributions taxed, although most funds are set up to avoid this.
3 Kabata, Naoyuki and Takahiko Yamada. 2013. “Japan” in Dickson, Paul (ed.) The Asset Management Review, 2nd ed. London: Law Business Research Ltd., pp. 226-245.
4 Webber, Jason, Peter Lake and Ben Heron. “Hong Kong” in Dickson, Paul (ed.) The Asset Management Review, 5nd ed. London: Law Business Research Ltd., pp. 186-203.
5 Hayden, Rolfe, Gaven Cheong and Eva Chan. “Investment funds in Hong Kong: regulatory overview,” Thomson Reuters Practical Law, https://uk.practicallaw.thomsonreuters.com/Document/I2ef129e71ed511e38578f7ccc38dcbee/View/FullText.html?transitionType=CategoryPageItem&-contextData=(sc.Default)&firstPage=true&bhcp=1 (accessed May 30, 2017)
6 Webber et al, op cit.
HONG KONG: PROVIDES UNIQUE ACCESS TO CHINAHong Kong doesn’t have the numbers of domestic asset owners that attract asset managers to Japan but it does provide unique access to China, including through the Shang-hai-Hong Kong Stock Connect program, which provides a pathway for foreign investors to the Shanghai stock market. Hong Kong’s financial sector is thus regulated on a two-tier basis to differentiate between asset managers targeting the domestic market and those focused on mainland China and elsewhere in Asia.
Investment products marketed to the public (defined as more than 50 investors) in Hong Kong must be registered with the Securities & Futures Commission (SFC), as must fund managers, even those that do not make public offerings of their funds. There are a number of exemptions that allow for fund managers to have investors from within Hong Kong without registration, such as the ‘professional investors’ exemption, which includes individuals with more than HK$8 million (US$1 million) in investable assets.
Most alternative assets, like hedge and private equi-ty funds, are set up using offshore structures to avoid the requirement to register locally, although, as mentioned above, the fund manager must often still be registered with the SFC. Other types of funds, such as those set up for real estate investment or exchange-traded funds (ETFs), have more reg-istration requirements, including a requirement for real estate investment trusts to be listed on the local exchange.4 The direction of regulation in Hong Kong follows Japan and other markets to ensure accurate appraisal of illiquid asset values and safekeeping of custodied assets through their oversight of the manager’s activities.5 Many of these rules are covered by compliance with the SFC’s Code of Conduct, which has been expanded starting in June 2017 to cover more professional investors, even those dealing with institutional investors.6
For taxation, Hong Kong doesn’t have a separate capital gains or dividends tax but it does tax properties, salaries and profits. The profits tax operates on a territorial taxa-tion system, so the 16.5% tax rate would apply only to Hong Kong-based businesses. However, authorised and regulated funds, as well as non-resident and offshore funds, are exempt provided they don’t breach the anti-avoidance provisions designed to prevent Hong Kong residents round-tripping their investments through another country to hide their residency.
Unlike many other countries, Hong Kong subjects stock investment to stamp duty, although ETFs and funds are either exempt (ETFs) or often structured to avoid incurring the duty on transactions in their units (although not in the Hong Kong-listed shares they trade in).
Looking forward, Hong Kong is expanding the ability of fund managers to undertake yuan-denominated transactions offshore as China liberalises its currency.
28 WEALTH AND ASSET MANAGEMENT REPORT
CHA
PTER
3
ASS
ET A
ND
WEA
LTH
MA
NA
GEM
ENT
LEA
DIN
G FI
NA
NCI
AL
HUB
S

SINGAPORE: REGULATORY REGIME HAS BEEN TIGHTENED IN RECENT YEARSLike in Hong Kong, Singapore has separate regulations for domestic funds and for asset managers based in Singapore but with a focus on other countries in Asia. The regulatory regime has been tightened in recent years even as some changes have been introduced to make it easier for tra-ditional hedge and private equity funds to be domiciled in Singapore and some tax incentives introduced to attract these types of investors.
Most funds operating in Singapore must register, although there are lighter requirements for funds that have less than S$250 million and fewer than thirty qualified clients (half of which can be other funds or limited partnerships). For-eign funds, including hedge and private equity funds, are subject to notice requirements that have become more burdensome recently, with requirements for the filing of information memoranda with the Monetary Authority of Sin-gapore (MAS). Funds with unit prices over $200,000 (such as those targeted at institutional investors) are exempt from the filing requirements.
For asset managers who are subject to MAS oversight, capital requirements vary depending on their risk levels but generally range from S$250,000 to S$1 million (US$180,000 to US$723,000), which is lower than Japan but at or above the required level for Hong Kong asset managers. Until 2013, the capital requirements were mostly internal matters not receiving significant review and oversight by the MAS. Since then, however, there has been a more proscriptive rule set that outlines the methodology for calculation of base capital and includes an immediate reporting obligation if base capital falls below 120% of the minimum level. Capital shortfalls can trigger MAS license revocation or limits being placed on the fund managers’ business activities. One exception to the general trend of increased minimum base capital levels is for venture capital fund managers where the MAS has proposed the elimination of the minimum base capital requirements.7
On the tax side, there are no capital gains taxes in Sin-gapore and low personal and corporate taxes. The city-state maintains a wide network of tax treaties and offers conces-sionary tax rates of between 5% and 12% for fund managers if they employ more than three people working in the fund man-agement operations in Singapore. For the fund’s profits, there is generally an exclusion on taxes except for assets owned by Singapore tax-resident investors or where local investors own a significant or majority share of the fund’s assets.
The Singapore Resident Fund Scheme provides incentives aimed at increasing the number of locally domiciled funds on the premise that they will enjoy the same benefits as an offshore fund domicile but with access to Singapore’s wide network of tax treaties.
7 Monetary Authority of Singapore. “Faster approvals and lower requirements for venture capital managers,” Press Release, February 15, 2017.
8 Werksmans. “2017/2018 Budget Proposals – Tax Overview,” February 2017.
SOUTH AFRICA: HOME TO A LARGE DOMESTIC FUND MANAGEMENT INDUSTRYUnlike many financial centres in the Middle East and Asia (ex-Japan), South Africa has a large domestic fund manage-ment industry. This industry is currently undergoing significant regulatory changes. The Financial Services Board, which regu-lates conduct in the financial industry, is increasing its focus on the qualification and competence rules. It is also raising the requirements for pension funds investing in private equity.
In common with other jurisdictions, South Africa places its tightest regulations on collective investment schemes targeting the retail market but has a lighter touch for trusts and partnerships used as private investment vehicles. How-ever, one big difference with other jurisdictions is that there is no two-tiered regulatory system. All funds approved for sale in South Africa (local or foreign) must be suitable for the general public, including those investing in securities, property or participation bonds.
On the tax front, both dividend and interest withholding taxes are applicable, although foreign investors can make use of double tax treaties to avoid some of these obligations. Corporate income tax in South Africa is a flat 28%, although there is relief available for non-residents making them exempt from paying tax on income created by disposal of assets (although not from derivatives-related income). A change in the tax laws in the 2017 budget proposed by the former Finance Minister would allow some foreign fund managers (with a special dispensation from the government) to use local fund managers without being subject to interest withholding.8
29WEALTH AND ASSET MANAGEMENT REPORT
CHA
PTER 3
ASSET A
ND W
EALTH
MA
NA
GEMEN
T LEADIN
G FINA
NCIA
L HUBS
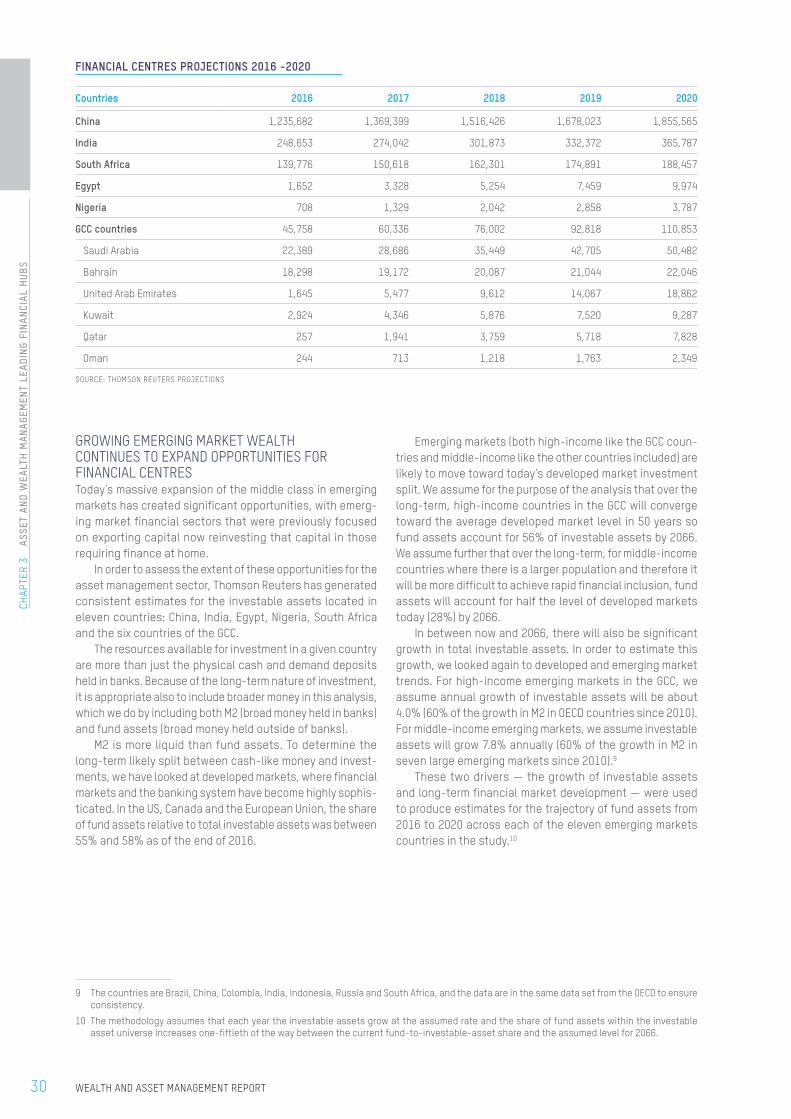
GROWING EMERGING MARKET WEALTH CONTINUES TO EXPAND OPPORTUNITIES FOR FINANCIAL CENTRESToday’s massive expansion of the middle class in emerging markets has created significant opportunities, with emerg-ing market financial sectors that were previously focused on exporting capital now reinvesting that capital in those requiring finance at home.
In order to assess the extent of these opportunities for the asset management sector, Thomson Reuters has generated consistent estimates for the investable assets located in eleven countries: China, India, Egypt, Nigeria, South Africa and the six countries of the GCC.
The resources available for investment in a given country are more than just the physical cash and demand deposits held in banks. Because of the long-term nature of investment, it is appropriate also to include broader money in this analysis, which we do by including both M2 (broad money held in banks) and fund assets (broad money held outside of banks).
M2 is more liquid than fund assets. To determine the long-term likely split between cash-like money and invest-ments, we have looked at developed markets, where financial markets and the banking system have become highly sophis-ticated. In the US, Canada and the European Union, the share of fund assets relative to total investable assets was between 55% and 58% as of the end of 2016.
9 The countries are Brazil, China, Colombia, India, Indonesia, Russia and South Africa, and the data are in the same data set from the OECD to ensure consistency.
10 The methodology assumes that each year the investable assets grow at the assumed rate and the share of fund assets within the investable asset universe increases one-fiftieth of the way between the current fund-to-investable-asset share and the assumed level for 2066.
Emerging markets (both high-income like the GCC coun-tries and middle-income like the other countries included) are likely to move toward today’s developed market investment split. We assume for the purpose of the analysis that over the long-term, high-income countries in the GCC will converge toward the average developed market level in 50 years so fund assets account for 56% of investable assets by 2066. We assume further that over the long-term, for middle-income countries where there is a larger population and therefore it will be more difficult to achieve rapid financial inclusion, fund assets will account for half the level of developed markets today (28%) by 2066.
In between now and 2066, there will also be significant growth in total investable assets. In order to estimate this growth, we looked again to developed and emerging market trends. For high-income emerging markets in the GCC, we assume annual growth of investable assets will be about 4.0% (60% of the growth in M2 in OECD countries since 2010). For middle-income emerging markets, we assume investable assets will grow 7.8% annually (60% of the growth in M2 in seven large emerging markets since 2010).9
These two drivers — the growth of investable assets and long-term financial market development — were used to produce estimates for the trajectory of fund assets from 2016 to 2020 across each of the eleven emerging markets countries in the study.10
FINANCIAL CENTRES PROJECTIONS 2016 -2020
Countries 2016 2017 2018 2019 2020
China 1,235,682 1,369,399 1,516,426 1,678,023 1,855,565
India 248,653 274,042 301,873 332,372 365,787
South Africa 139,776 150,618 162,301 174,891 188,457
Egypt 1,652 3,328 5,254 7,459 9,974
Nigeria 708 1,329 2,042 2,858 3,787
GCC countries 45,758 60,336 76,002 92,818 110,853
Saudi Arabia 22,389 28,686 35,449 42,705 50,482
Bahrain 18,298 19,172 20,087 21,044 22,046
United Arab Emirates 1,645 5,477 9,612 14,067 18,862
Kuwait 2,924 4,346 5,876 7,520 9,287
Qatar 257 1,941 3,759 5,718 7,828
Oman 244 713 1,218 1,763 2,349
SOURCE: THOMSON REUTERS PROJECTIONS
30 WEALTH AND ASSET MANAGEMENT REPORT
CHA
PTER
3
ASS
ET A
ND
WEA
LTH
MA
NA
GEM
ENT
LEA
DIN
G FI
NA
NCI
AL
HUB
S

EMERGING MARKETS OUTLOOKThe outlook for the financial sectors serving Asia, Africa and the Middle East depends both on the regulatory and tax sys-tems that put them where they are today and on how they evolve to deal with the changing distribution of wealth and future sources of wealth creation.
In absolute value, China dwarfs other sources of new fund assets, and China will likely continue to lead the emerging market growth story. It has done so with relatively closed capital accounts, making investment domestical-ly challenging and investment from elsewhere even more difficult. As this changes, the intensity of the competition to intermediate will accelerate, reflected already in the competition among offshore financial centres to be cen-tres for yuan clearing (London and Singapore are the two largest behind Hong Kong).
India and South Africa are both growing regions for fund management, although like China they are difficult places for foreign investors to do business because of currency volatil-ity, taxes and regulations. Both are large targets for investors but their onshore cities are not very competitive as financial centres. This opens a big opportunity for other financial cen-tres, particularly those with business-friendly regulations and taxes located in geographic proximity to Africa and Asia.
Financial centres in the GCC have a particular opportunity because there are opportunities for investment both region-ally (despite low oil prices being a drain on the budgetary resources of many MENA countries, there are massive infra-structure investment needs) and across the wider African and Asian regions. This and the greater financial sophistication of the region’s financial markets are driving the rapid growth in fund assets in the GCC, led by Saudi Arabia, and the UAE.
31WEALTH AND ASSET MANAGEMENT REPORT
CHA
PTER 3
ASSET A
ND W
EALTH
MA
NA
GEMEN
T LEADIN
G FINA
NCIA
L HUBS
MARKET EXPERTS INSIGHT
Offshore financial centres have been around since 1936, when the first was opened in the Bahamas. Dubai — ranked 25 among the world’s top 100 financial centres — exemplifies both the opportunities and challenges faced by the multiplicity of OFCs today.
Located at the crossroads of major international trade and travel routes as well as global markets, it made sense for Dubai to create its own financial centre. In the process, Dubai’s government has introduced legislation and regulatory frameworks specifically designed to attract inward investment from those who might not have invested in the country prior to the creation of the Dubai International Financial Centre (DIFC).
These frameworks include preferential tax structures for both corporations and individuals as well as plans for tax evasion schemes and money laundering operations to counter persistent concerns over the use of OFCs by terrorists and other criminals as well as their bad press as a safe haven for wealthy tax dodgers.
Offshore financial centres as fund domicilesIndeed, more practical legislation and regulation is needed to support political ambitions in frontier and emerging markets to establish themselves as international financial centres. For an international asset manager like Invesco, a key aspect is the creation and distribution of funds from within the financial centre, as opposed to segregated mandates with large institutional clients. International asset managers need to be able to distribute their financial products to high-net-worth individuals, ultra-high-net-worth individuals, family offices, private and retail banks, as well as the various
other financial providers operating within the ecosystem.
Local governments obviously have a strong interest in locally domiciled funds. A glance at the creation of funds in two other jurisdictions — Luxembourg and Dublin — can help them in their efforts to install the right regulatory framework. Both jurisdictions benefit from the UCITS regulatory regime for the creation, management and marketing of collective investment vehicles in EU countries. Asset managers can ‘passport’ through the UCITS fund framework, which enables them to expand their overall ecosystems within a sustainable product and services platform. Indeed, it is doubtful whether Luxembourg and Dublin could survive as financial centres without the UCITS framework.
Given the number of regional financial centres and regulators, a uniform regulatory regime for the creation, management and marketing of collective investment vehicles in the countries of the GCC therefore seems to be essential for governments to achieve their aim of attracting locally domiciled funds. Like London after Brexit, DIFC without a regionally agreed framework will see locally based businesses faced with multiple regulators and very limited access to fund distribution. Given the limited scope for economies of scale and the limited size of the population within the DIFC and the United Arab Emirates, this would call into question the direct fund distribution business for most international asset managers based in the DIFC and could then see them withdraw these services.
Tapping new services — success recipe for OFCs?Traditionally focused on banking and wealth management services, OFCs
BY NICK SAVASTANO
_ Head of Offshore global Life Groups and M.E Financial Institutions, Invesco Asset Management Limited
NICK SAVASTANO has lived and worked in the Middle East and has covered the MENA region for 21 years. Nick has worked in the Dubai International Financial centre (DIFC) since 2006 and is the Senior Executive officer of Invesco within the region. Nick Holds an MBA and has extensive experience of building Sales and distribution businesses in the region both onshore and offshore.
OFC’s Perception is Projection
32
CHA
PTER
3
ASS
ET A
ND
WEA
LTH
MA
NA
GEM
ENT
LEA
DIN
G FI
NA
NCI
AL
HUB
S
WEALTH AND ASSET MANAGEMENT REPORT
have increasingly entered new service segments and niches to compete with the larger, more established financial centres. This move has included a focus on such market segments as gaming, internet and technology companies as well as, more recently, on financial technology (FinTech) and insurance technology (InsurTech)-style businesses, with governments providing incentives and preferential treatment for certain businesses to establish themselves within the centres.
Fuelled by the trend toward FinTech and InsurTech as well as the wider use of technology and artificial intelligence, we are currently witnessing an exciting transformation from ‘old model’ to ‘new model’ OFCs characterised by a wider agglomeration of services within these centres. However, FinTech and InsurTech businesses and other general technology disruptors looking to respond to these new global trends will require legislation that allows them to operate regionally and internationally.
At present, the focus is on payment systems and the operational streamlining of manual processes. Banks are still working on their own challenges around big data and improving customer intelligence. Regulations such as Dodd-Frank and the Volker rule have resulted in banks having to capture all relevant data in a central repository and create analytics that allow them to stress test to avoid huge fines. Right now, 50% of bank projects relate to regulatory and legal requirements, with a focus on fraud as well as risk and compliance systems. The key question, therefore, is whether financial centres can set up the necessary systems to keep up with this development.
At the same time, the proliferation of financial services through digital and mobile networks is transforming the way people work with finance. In 2015, the International Data Corporation estimated the world’s mobile worker population at 1.3 billion people, or more than 37% of the global workforce. In this environment, the growth of regional financial centres will depend on the development of the necessary telecommunication systems as well as other infrastructure both inside and outside the centres.
As developed markets increasingly adopt data security laws and regulations such as the Gramm-Leach-Bliley Act and the Payment Card Industry Data Security Standard (PCI-DSS), financial centres in frontier and emerging markets will have to either develop their own legislation or follow the rules that have been set by others.
Building a local talent poolHuman capital is another issue for financial centres in frontier and emerging markets. Generally speaking, most of the financial working population in the Gulf region is expatriates — and expats are known to be prone to ‘home bias’. They know they will probably return home at some stage. This leads to huge levels of remittances out of the United Arab Emirates and generally from the regional financial centres.
While the fees and income generated through these remittances within the centres may be considered a positive, the centres may find themselves facing a shortage of skilled labor over time. Accordingly, these countries will have to set up systems to ensure they can develop and attract the right local talent.
Systems that favour national communities over expatriates, applying ‘positive discrimination’, may be understandable. However, as the financial ecosystem expands, this strategy could impair the growth of regional financial centres, especially without the right knowledge transfer to the new economies.
Communicating the benefitsThe legitimacy and existence of offshore financial centres will continue to be challenged by onshore governments seeking to minimise their effects on their economies. However, the centres are critical in the structuring of inward investments into economies and are important for diversification in others. Some of the smaller financial centres have sophisticated business legislation that gives investors access to markets they could not or would not consider onshore due to underdeveloped business laws.
In the end, OFCs’ continued success will depend on their ability to remain tax neutral. They will need to create legislation that allows for transparency but protects the individual’s right to confidentiality. Ultimately, OFCs are like any business. They are bound to face strong headwinds, but if they can set themselves apart through competitive niches they are likely to confound perceptions and flourish. As the poet and artist Carl Jung said, “Perception is projection.” OFCs’ reputation will depend on their ability to project their benefits to the global ecosystem.
33
CHA
PTER 3
ASSET A
ND W
EALTH
MA
NA
GEMEN
T LEADIN
G FINA
NCIA
L HUBS
WEALTH AND ASSET MANAGEMENT REPORT
Alternative Asset Management
CHAPTER 4

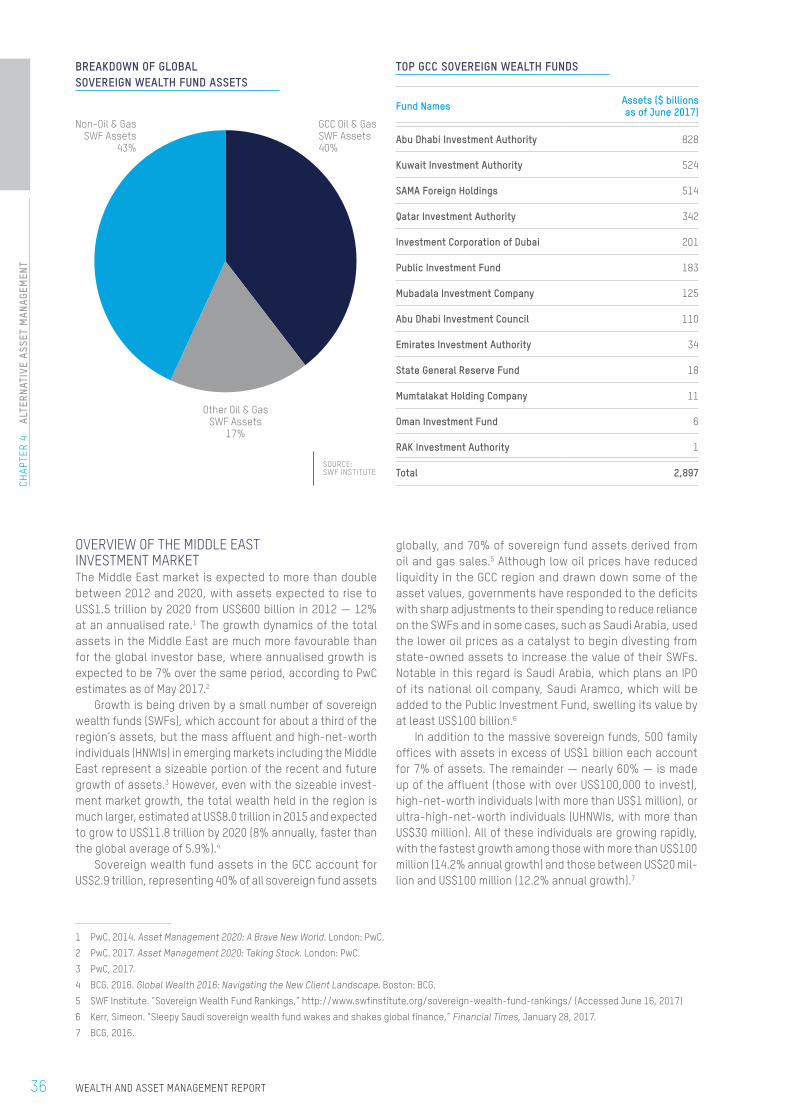
OVERVIEW OF THE MIDDLE EAST INVESTMENT MARKETThe Middle East market is expected to more than double between 2012 and 2020, with assets expected to rise to US$1.5 trillion by 2020 from US$600 billion in 2012 — 12% at an annualised rate.1 The growth dynamics of the total assets in the Middle East are much more favourable than for the global investor base, where annualised growth is expected to be 7% over the same period, according to PwC estimates as of May 2017.2
Growth is being driven by a small number of sovereign wealth funds (SWFs), which account for about a third of the region’s assets, but the mass affluent and high-net-worth individuals (HNWIs) in emerging markets including the Middle East represent a sizeable portion of the recent and future growth of assets.3 However, even with the sizeable invest-ment market growth, the total wealth held in the region is much larger, estimated at US$8.0 trillion in 2015 and expected to grow to US$11.8 trillion by 2020 (8% annually, faster than the global average of 5.9%).4
Sovereign wealth fund assets in the GCC account for US$2.9 trillion, representing 40% of all sovereign fund assets
1 PwC. 2014. Asset Management 2020: A Brave New World. London: PwC.
2 PwC. 2017. Asset Management 2020: Taking Stock. London: PwC.
3 PwC, 2017.
4 BCG. 2016. Global Wealth 2016: Navigating the New Client Landscape. Boston: BCG.
5 SWF Institute. “Sovereign Wealth Fund Rankings,” http://www.swfinstitute.org/sovereign-wealth-fund-rankings/ (Accessed June 16, 2017)
6 Kerr, Simeon. “Sleepy Saudi sovereign wealth fund wakes and shakes global finance,” Financial Times, January 28, 2017.
7 BCG, 2016.
globally, and 70% of sovereign fund assets derived from oil and gas sales.5 Although low oil prices have reduced liquidity in the GCC region and drawn down some of the asset values, governments have responded to the deficits with sharp adjustments to their spending to reduce reliance on the SWFs and in some cases, such as Saudi Arabia, used the lower oil prices as a catalyst to begin divesting from state-owned assets to increase the value of their SWFs. Notable in this regard is Saudi Arabia, which plans an IPO of its national oil company, Saudi Aramco, which will be added to the Public Investment Fund, swelling its value by at least US$100 billion.6
In addition to the massive sovereign funds, 500 family offices with assets in excess of US$1 billion each account for 7% of assets. The remainder — nearly 60% — is made up of the affluent (those with over US$100,000 to invest), high-net-worth individuals (with more than US$1 million), or ultra-high-net-worth individuals (UHNWIs, with more than US$30 million). All of these individuals are growing rapidly, with the fastest growth among those with more than US$100 million (14.2% annual growth) and those between US$20 mil-lion and US$100 million (12.2% annual growth).7
TOP GCC SOVEREIGN WEALTH FUNDS
Fund Names Assets ($ billions as of June 2017)
Abu Dhabi Investment Authority 828
Kuwait Investment Authority 524
SAMA Foreign Holdings 514
Qatar Investment Authority 342
Investment Corporation of Dubai 201
Public Investment Fund 183
Mubadala Investment Company 125
Abu Dhabi Investment Council 110
Emirates Investment Authority 34
State General Reserve Fund 18
Mumtalakat Holding Company 11
Oman Investment Fund 6
RAK Investment Authority 1
Total 2,897
BREAKDOWN OF GLOBAL SOVEREIGN WEALTH FUND ASSETS
GCC Oil & GasSWF Assets40%
Other Oil & GasSWF Assets
17%
Non-Oil & GasSWF Assets
43%
SOURCE: SWF INSTITUTE
36 WEALTH AND ASSET MANAGEMENT REPORT
CHA
PTER
4
ALT
ERN
ATIV
E A
SSET
MA
NA
GEM
ENT

OVERVIEW OF ROLE OF ALTERNATIVE INVESTMENTS FOR MIDDLE EASTERN INVESTORSIn contrast to the perception that investors from the Middle East are heavily concentrated in real estate, these make up just under 20% of assets of HNWIs, among the lowest of any region except Japan and North America. Alternative investments, by comparison, account for more than 15% of total assets — the highest share globally.8 These char-acteristics make the region attractive for fund managers in the alternative investments sector.
The growth of alternative investments has broadened, with more types of each alternative as well as through an expansion of those sectors with a long track record — like real estate, private equity and hedge funds — into newer areas including infrastructure, private lending and insurance-linked securities. As the alternative invest-ment industry grows, it has also internationalised, with more investments shifting to emerging markets to take advantage of favourable economic trends driven by their younger demographics.
As the market has grown in scope, its purpose has also expanded to not only deliver uncorrelated returns, but also generate yield in a yield-starved market. It can also provide alternative sources of alpha for investors facing shortfalls between the long-term returns they need and what they are able to get from traditional investment allocations. As a result, the alternative investment market is likely to contin-ue growing, mostly in areas that are also attractive to fund managers as they are less vulnerable to commodification. The effect of commodification has sent fees tumbling as investors shift equity and fixed-income investments from actively to passively managed funds.
The factors that make alternatives attractive to fund managers and clients are increased for the Middle East due to the structure of the asset and wealth management sector. First, there has been a historical preference to invest via offshore fund managers or those based in other regions (predominately Europe). As of 2015, assets held outside the region accounted for US$1.9 trillion, although a proportion of these assets have since returned as financial centres in the region have developed.9
One factor which has remained the same even as the regional industry has developed is that the share of assets held in separately managed accounts is dramat-ically different from the share held in mutual funds. In the US, for example, four times the volume of assets is held in mutual funds as in separately managed accounts, whereas in the GCC region the figure is flipped, with five times as many assets in separately managed accounts as in mutual funds.10
Given the relatively short track record for alterna-tives that are available in the form of funds (including exchange-traded funds, or ETFs); it is more likely that alter-natives are invested through funds rather than directly. This will provide a tailwind to the growth of alternative asset
8 Capgemini & RBC. 2016. World Wealth Report 2016. Paris: Capgemini.
9 Capgemini & RBC. 2016.
10 EYGM. 2015. Fast Growth, Divergent Paths: The EY GCC Wealth and Asset Management Report 2015. Dubai: EYGM.
11 Wigglesworth, Robin and Eric Platt, “Value of negative-yielding bonds hits US$13.4tn,” Financial Times, August 12, 2016.
12 Wigglesworth, Robin and Eric Platt, “Global negative yielding debt climbs back above US$10tn level,” Financial Times, March 8, 2017
managers set up to capture the return of assets invested in alternatives from overseas investors returning to the financial centres established across the GCC region.
Looking forward, the growth concentrated today among HNWIs, UHNWIs and family offices will yield new oppor-tunities. The transition occurring globally in wealth and asset management is an increased shift toward lower-cost vehicles including ETFs, and the alternatives sector is no different. Asset managers that develop a market presence around the HNWIs and UHNWIs will be ideally positioned to capitalise on this future shift, often in a way that expands their prospective investor base (through retail products like ETFs) that will have a relatively modest impact on their traditional funds.
ALTERNATIVE ASSETS’ CONTRIBUTION TO PORTFOLIO DIVERSIFICATIONAs correlations between traditional asset classes have risen amidst central bank actions to support the economy, asset managers are turning to alternative investments for new sources of diversification. As a result, institutional investors in particular have followed pioneers like the Yale University Endowment Fund by increasing their investments in less liquid but higher returning or uncorrelated assets like hedge funds, private equity, real estate, real assets, and newer asset classes such as infrastructure, illiquid credit, and insurance-linked instruments.
The approach used by David Swensen, chief investment officer at Yale, views the illiquidity of alternative investments as a benefit because of a favourable gain in returns from sacrificing liquidity. Other investors are not so enthusiastic for illiquid assets as Swensen, particularly as the financial crisis dealt a savage blow to illiquid assets, but most insti-tutional investors still view alternative assets as beneficial for diversification, yield, and, in some cases, to provide an alternative source of alpha generation.
QUANTITATIVE EASING AND THE REACH FOR YIELDBond yields across the world have fallen dramatically since the Global Financial Crisis. In August 2016, the vol-ume of negative-yielding bonds reached US$13.4 trillion, mostly in Europe and Japan.11 Since this peak, the value has dropped but still hovers around US$10 trillion.12 This collapse in yields was the direct outcome of a deliberate central bank policy (quantitative easing) to push economic stimulus by buying fixed-income assets. The policy has achieved one of its objectives — incentivising a shift of investments out the risk curve — and these investments include alternative assets that are able to generate higher yields. Investments that have benefited from the reach for yield include real estate, infrastructure, real assets, and illiquid credit (including credit being provided through peer-to-peer financing platforms).
37WEALTH AND ASSET MANAGEMENT REPORT
CHA
PTER 4
ALTER
NATIVE A
SSET MA
NA
GEMEN
T
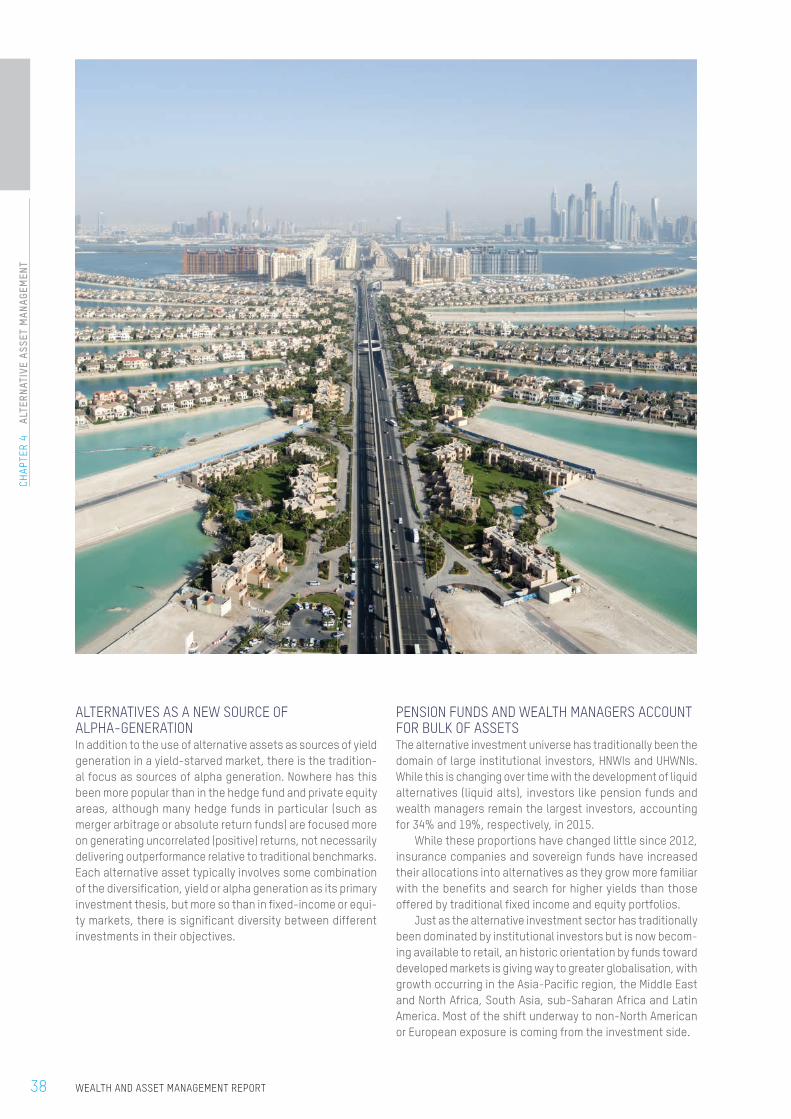
ALTERNATIVES AS A NEW SOURCE OF ALPHA-GENERATIONIn addition to the use of alternative assets as sources of yield generation in a yield-starved market, there is the tradition-al focus as sources of alpha generation. Nowhere has this been more popular than in the hedge fund and private equity areas, although many hedge funds in particular (such as merger arbitrage or absolute return funds) are focused more on generating uncorrelated (positive) returns, not necessarily delivering outperformance relative to traditional benchmarks. Each alternative asset typically involves some combination of the diversification, yield or alpha generation as its primary investment thesis, but more so than in fixed-income or equi-ty markets, there is significant diversity between different investments in their objectives.
PENSION FUNDS AND WEALTH MANAGERS ACCOUNT FOR BULK OF ASSETSThe alternative investment universe has traditionally been the domain of large institutional investors, HNWIs and UHWNIs. While this is changing over time with the development of liquid alternatives (liquid alts), investors like pension funds and wealth managers remain the largest investors, accounting for 34% and 19%, respectively, in 2015.
While these proportions have changed little since 2012, insurance companies and sovereign funds have increased their allocations into alternatives as they grow more familiar with the benefits and search for higher yields than those offered by traditional fixed income and equity portfolios.
Just as the alternative investment sector has traditionally been dominated by institutional investors but is now becom-ing available to retail, an historic orientation by funds toward developed markets is giving way to greater globalisation, with growth occurring in the Asia-Pacific region, the Middle East and North Africa, South Asia, sub-Saharan Africa and Latin America. Most of the shift underway to non-North American or European exposure is coming from the investment side.
38 WEALTH AND ASSET MANAGEMENT REPORT
CHA
PTER
4
ALT
ERN
ATIV
E A
SSET
MA
NA
GEM
ENT
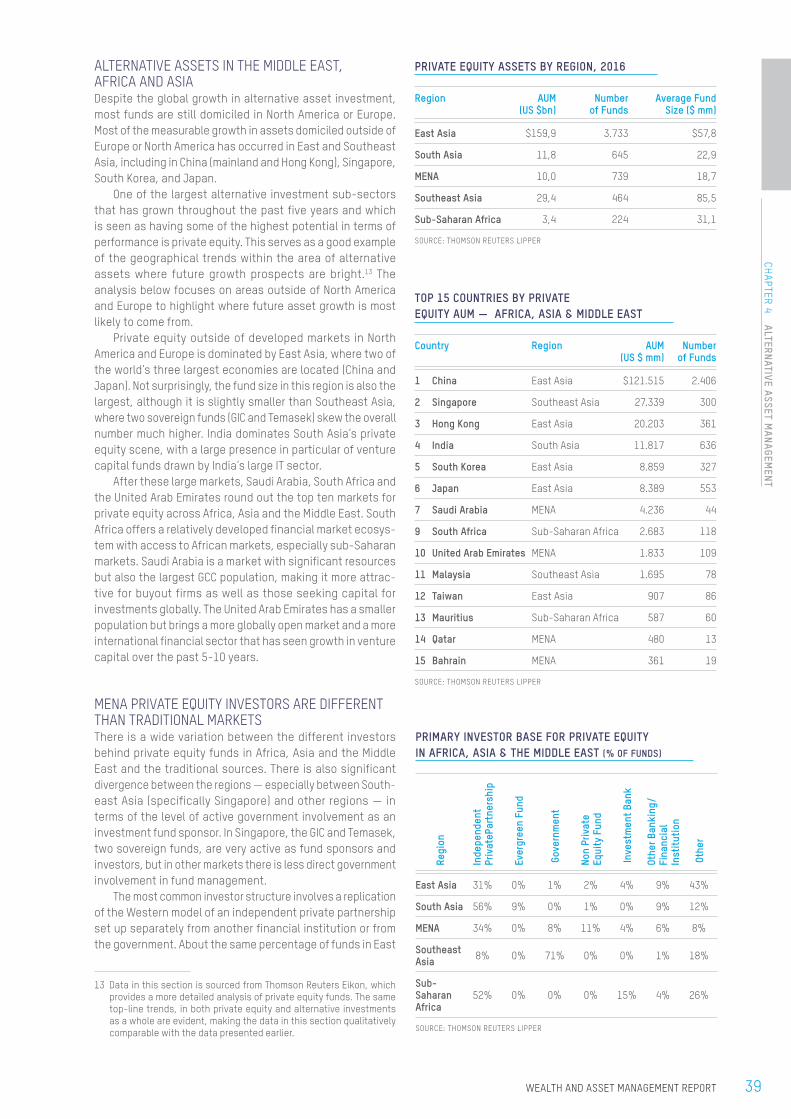
ALTERNATIVE ASSETS IN THE MIDDLE EAST, AFRICA AND ASIADespite the global growth in alternative asset investment, most funds are still domiciled in North America or Europe. Most of the measurable growth in assets domiciled outside of Europe or North America has occurred in East and Southeast Asia, including in China (mainland and Hong Kong), Singapore, South Korea, and Japan.
One of the largest alternative investment sub-sectors that has grown throughout the past five years and which is seen as having some of the highest potential in terms of performance is private equity. This serves as a good example of the geographical trends within the area of alternative assets where future growth prospects are bright.13 The analysis below focuses on areas outside of North America and Europe to highlight where future asset growth is most likely to come from.
Private equity outside of developed markets in North America and Europe is dominated by East Asia, where two of the world’s three largest economies are located (China and Japan). Not surprisingly, the fund size in this region is also the largest, although it is slightly smaller than Southeast Asia, where two sovereign funds (GIC and Temasek) skew the overall number much higher. India dominates South Asia’s private equity scene, with a large presence in particular of venture capital funds drawn by India’s large IT sector.
After these large markets, Saudi Arabia, South Africa and the United Arab Emirates round out the top ten markets for private equity across Africa, Asia and the Middle East. South Africa offers a relatively developed financial market ecosys-tem with access to African markets, especially sub-Saharan markets. Saudi Arabia is a market with significant resources but also the largest GCC population, making it more attrac-tive for buyout firms as well as those seeking capital for investments globally. The United Arab Emirates has a smaller population but brings a more globally open market and a more international financial sector that has seen growth in venture capital over the past 5-10 years.
MENA PRIVATE EQUITY INVESTORS ARE DIFFERENT THAN TRADITIONAL MARKETSThere is a wide variation between the different investors behind private equity funds in Africa, Asia and the Middle East and the traditional sources. There is also significant divergence between the regions — especially between South-east Asia (specifically Singapore) and other regions — in terms of the level of active government involvement as an investment fund sponsor. In Singapore, the GIC and Temasek, two sovereign funds, are very active as fund sponsors and investors, but in other markets there is less direct government involvement in fund management.
The most common investor structure involves a replication of the Western model of an independent private partnership set up separately from another financial institution or from the government. About the same percentage of funds in East
13 Data in this section is sourced from Thomson Reuters Eikon, which provides a more detailed analysis of private equity funds. The same top-line trends, in both private equity and alternative investments as a whole are evident, making the data in this section qualitatively comparable with the data presented earlier.
PRIVATE EQUITY ASSETS BY REGION, 2016
Region AUM (US $bn)
Number of Funds
Average Fund Size ($ mm)
East Asia $159,9 3.733 $57,8
South Asia 11,8 645 22,9
MENA 10,0 739 18,7
Southeast Asia 29,4 464 85,5
Sub-Saharan Africa 3,4 224 31,1
SOURCE: THOMSON REUTERS LIPPER
TOP 15 COUNTRIES BY PRIVATE EQUITY AUM — AFRICA, ASIA & MIDDLE EAST
Country Region AUM (US $ mm)
Number of Funds
1 China East Asia $121.515 2.406
2 Singapore Southeast Asia 27.339 300
3 Hong Kong East Asia 20.203 361
4 India South Asia 11.817 636
5 South Korea East Asia 8.859 327
6 Japan East Asia 8.389 553
7 Saudi Arabia MENA 4.236 44
9 South Africa Sub-Saharan Africa 2.683 118
10 United Arab Emirates MENA 1.833 109
11 Malaysia Southeast Asia 1.695 78
12 Taiwan East Asia 907 86
13 Mauritius Sub-Saharan Africa 587 60
14 Qatar MENA 480 13
15 Bahrain MENA 361 19
SOURCE: THOMSON REUTERS LIPPER
PRIMARY INVESTOR BASE FOR PRIVATE EQUITY IN AFRICA, ASIA & THE MIDDLE EAST (% OF FUNDS)
Regi
on
Inde
pend
ent
Priv
ateP
artn
ersh
ip
Ever
gree
n Fu
nd
Gov
ernm
ent
Non
Priv
ate
Equi
ty F
und
Inve
stm
ent
Bank
Othe
r Ban
king
/ Fi
nanc
ial
Inst
itut
ion
Oth
er
East Asia 31% 0% 1% 2% 4% 9% 43%
South Asia 56% 9% 0% 1% 0% 9% 12%
MENA 34% 0% 8% 11% 4% 6% 8%
Southeast Asia 8% 0% 71% 0% 0% 1% 18%
Sub-Saharan Africa
52% 0% 0% 0% 15% 4% 26%
SOURCE: THOMSON REUTERS LIPPER
39WEALTH AND ASSET MANAGEMENT REPORT
CHA
PTER 4
ALTER
NATIVE A
SSET MA
NA
GEMEN
T
and South Asia have links with banks and similar institutions as in Western markets. In the MENA region and in Africa, few-er institutions are connected to banking institutions other than investment banks.
The biggest investor gap in these regions is from pension funds, individuals and corporate funds. For pension funds, there may be limited development of the entire sector, as is the case in the MENA region, or those in existence may prefer more conservative investment allocations that avoid private equity entirely.
For individuals, there may be factors including difficult regulation (or the absence of a well-developed regulatory environment) that inhibit individuals from setting up private equity funds. There is also a dearth of entrepreneurs who have become wealthy through exit from a venture-backed business, which is a key source of new investment funds.
Finally, while there have been a few corporates that have set up private equity or venture capital funds (for exam-ple Saudi Telecom and Dubai Silicon Oasis), they remain the exception and are concentrated in only a few sectors, often those where relatively few firms operate such as telecoms.
EVOLVING INVESTOR PREFERENCES FOR ALTERNATIVE INVESTMENTSAlternative investments have grown into a major asset class (or combination of asset classes, since private equity is very different from real estate, which is equally different from private lending, and so on). As it has grown, some areas have thrived and are likely to continue to benefit both institutional investors and asset managers by delivering uncorrelated returns for investors and higher management fees for the fund managers in exchange. However, pressure on fees is intensifying depending on how readily a particular strategy can be replicated by exchange-traded funds (ETFs), which are gaining ground in alternatives as they have in equi-ty and fixed income.
As has been seen in equity and fixed-income mutual funds, investors have been drawn by lower fees to consider replacing exposure gained through funds (and more so in the alternatives sector, replacing funds of funds). However, the areas where this exposure is both cost-effective to replace and efficient at delivering the uncorrelated returns is still relatively limited, even within the hedge fund sector, and has not extended into private equity, infrastructure investment, or newer asset classes such as private lending and insur-ance-linked securities.
For institutional investors (see box for an overview of the opportunity for sub-HNWI retail investors from liquid alts), the primary challenge involves selecting both the appropriate alternative strategy and the appropriate fund to execute the strategy. This is a challenge because of the complexity, lack of transparency, and broadly diverging objectives of different alternative investments. Adding on to this challenge is the need to evaluate and gain access to a top-tier manager in order to derive all the benefits of adding alternative invest-ments to an investment allocation.
OUTLOOK: ALTERNATIVE INVESTMENT REPRESENTS A SAFE HARBORAt a time when the asset management industry faces sig-nificant upheaval and traditional investment management strategies are shifting from actively to passively managed funds, the alternative investment space represents a safe harbor particularly in the Middle East. In a region where inves-tors allocate a relatively high share of portfolio into alternative assets, the asset class offers them a way to overcome the low yields prevailing in traditional fixed income without dramatic increases in risk through direct lending investments and infra-structure debt funds. It can also provide uncorrelated assets as new sources of alpha that will not be as correlated with equity or fixed income markets, thus reducing overall volatility.
For fund managers and ETF sponsors, the large alloca-tion to alternatives attracts those with specialist experience where their added value brings higher management fees, and offers protection from fee erosion because the expo-sure delivered by alternative investments is more resistant to commoditisation.
As demonstrated above, the growth in alternative assets has been largely focused on developed markets, although funds targeting buyouts in Asia, global real estate, venture capital in India, or infrastructure across the world have become more common in recent years, including among investors in the Middle East. The location of domiciles, which has historically been even more tilted toward developed mar-kets than alternative investment assets, will shift toward emerging markets, bringing with it new areas for growth in the financial sector.
There is a unique opportunity within the GCC to capitalise on the general trend of assets and asset managers shifting away from developed markets and toward markets with sig-nificant investor asset bases. These assets are often invested abroad today, but as investments become more global the impetus grows to return the assets closer to home markets where significant investments are located. Within the GCC, there are two factors that are attractive to asset managers in this respect. First, there is a substantial investor base concentrated in a relatively limited number of individuals and institutions including large sovereign funds and family offices with assets in excess of US$1 billion. This is complemented by an increasing share of the HNWIs and UHNWIs having a substantial portion of their investments in alternatives and the future potential to expand to the broader affluent investor base, both in the region and by using the region as a base for other countries where there is a substantial and growing base of affluent investors.
40 WEALTH AND ASSET MANAGEMENT REPORT
CHA
PTER
4
ALT
ERN
ATIV
E A
SSET
MA
NA
GEM
ENT

41WEALTH AND ASSET MANAGEMENT REPORT
CHA
PTER 4
ALTER
NATIVE A
SSET MA
NA
GEMEN
T

CHAPTER 5
Islamic Asset Management

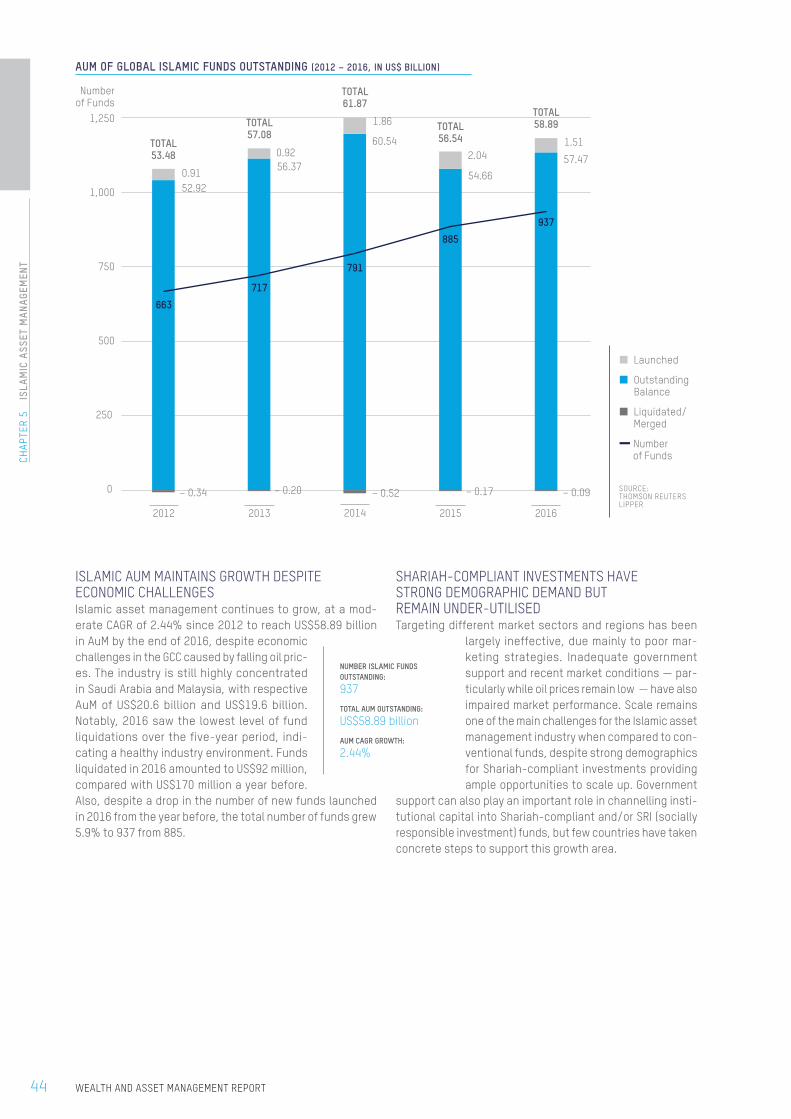
ISLAMIC AUM MAINTAINS GROWTH DESPITE ECONOMIC CHALLENGESIslamic asset management continues to grow, at a mod-erate CAGR of 2.44% since 2012 to reach US$58.89 billion in AuM by the end of 2016, despite economic challenges in the GCC caused by falling oil pric-es. The industry is still highly concentrated in Saudi Arabia and Malaysia, with respective AuM of US$20.6 billion and US$19.6 billion. Notably, 2016 saw the lowest level of fund liquidations over the five-year period, indi-cating a healthy industry environment. Funds liquidated in 2016 amounted to US$92 million, compared with US$170 million a year before. Also, despite a drop in the number of new funds launched in 2016 from the year before, the total number of funds grew 5.9% to 937 from 885.
SHARIAH-COMPLIANT INVESTMENTS HAVE STRONG DEMOGRAPHIC DEMAND BUT REMAIN UNDER-UTILISEDTargeting different market sectors and regions has been
largely ineffective, due mainly to poor mar-keting strategies. Inadequate government support and recent market conditions — par-ticularly while oil prices remain low — have also impaired market performance. Scale remains one of the main challenges for the Islamic asset management industry when compared to con-ventional funds, despite strong demographics for Shariah-compliant investments providing ample opportunities to scale up. Government
support can also play an important role in channelling insti-tutional capital into Shariah-compliant and/or SRI (socially responsible investment) funds, but few countries have taken concrete steps to support this growth area.
NUMBER ISLAMIC FUNDS OUTSTANDING:
937
TOTAL AUM OUTSTANDING:
US$58.89 billion
AUM CAGR GROWTH:
2.44%
AUM OF GLOBAL ISLAMIC FUNDS OUTSTANDING (2012 – 2016, IN US$ BILLION)
0
250
500
750
1,000
1,250
Numberof Funds
¢ Launched
¢ Outstanding Balance
¢ Liquidated/ Merged
— Number of Funds
SOURCE: THOMSON REUTERS LIPPER
2012
52.920.91
TOTAL53.48
– 0.34 2013
56.370.92
TOTAL57.08
– 0.20 2014
60.54
1.86
TOTAL61.87
– 0.52 2015
54.66
2.04
TOTAL56.54
– 0.17 2016
57.47
1.51
TOTAL58.89
– 0.09
937
663
717
791
885
44 WEALTH AND ASSET MANAGEMENT REPORT
CHA
PTER
5
ISLA
MIC
ASS
ET M
AN
AGE
MEN
T
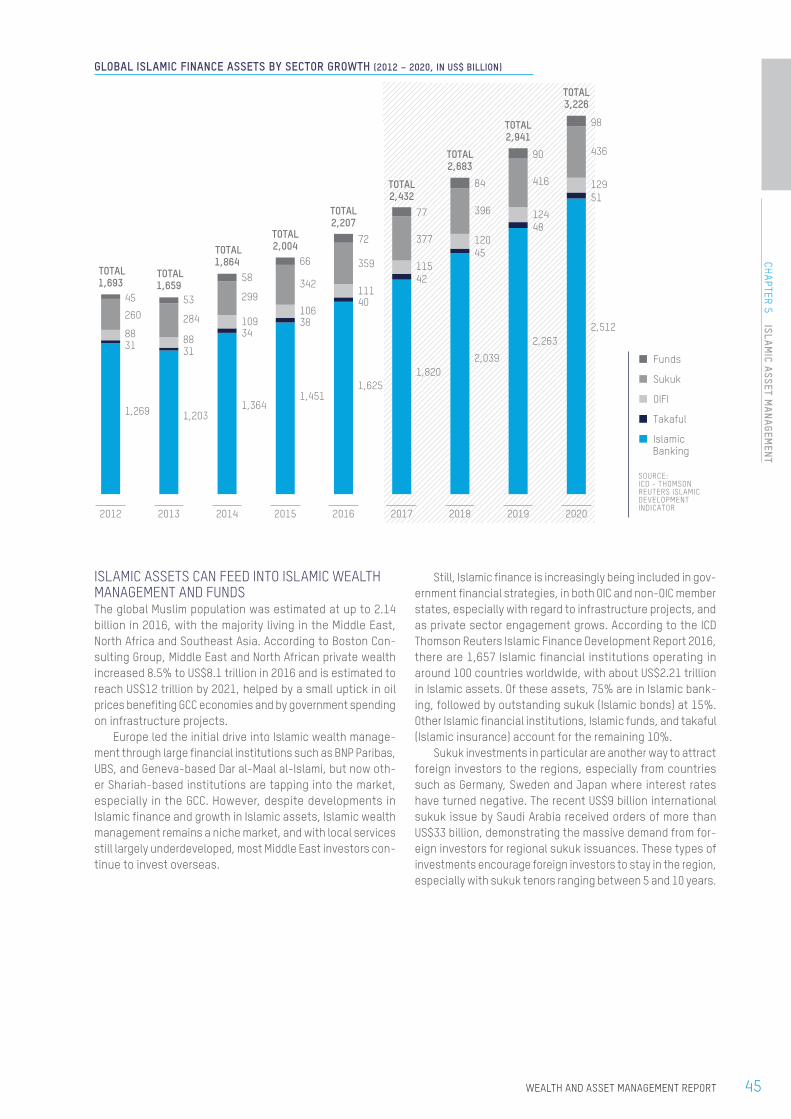
GLOBAL ISLAMIC FINANCE ASSETS BY SECTOR GROWTH (2012 – 2020, IN US$ BILLION)
ISLAMIC ASSETS CAN FEED INTO ISLAMIC WEALTH MANAGEMENT AND FUNDSThe global Muslim population was estimated at up to 2.14 billion in 2016, with the majority living in the Middle East, North Africa and Southeast Asia. According to Boston Con-sulting Group, Middle East and North African private wealth increased 8.5% to US$8.1 trillion in 2016 and is estimated to reach US$12 trillion by 2021, helped by a small uptick in oil prices benefiting GCC economies and by government spending on infrastructure projects.
Europe led the initial drive into Islamic wealth manage-ment through large financial institutions such as BNP Paribas, UBS, and Geneva-based Dar al-Maal al-Islami, but now oth-er Shariah-based institutions are tapping into the market, especially in the GCC. However, despite developments in Islamic finance and growth in Islamic assets, Islamic wealth management remains a niche market, and with local services still largely underdeveloped, most Middle East investors con-tinue to invest overseas.
Still, Islamic finance is increasingly being included in gov-ernment financial strategies, in both OIC and non-OIC member states, especially with regard to infrastructure projects, and as private sector engagement grows. According to the ICD Thomson Reuters Islamic Finance Development Report 2016, there are 1,657 Islamic financial institutions operating in around 100 countries worldwide, with about US$2.21 trillion in Islamic assets. Of these assets, 75% are in Islamic bank-ing, followed by outstanding sukuk (Islamic bonds) at 15%. Other Islamic financial institutions, Islamic funds, and takaful (Islamic insurance) account for the remaining 10%.
Sukuk investments in particular are another way to attract foreign investors to the regions, especially from countries such as Germany, Sweden and Japan where interest rates have turned negative. The recent US$9 billion international sukuk issue by Saudi Arabia received orders of more than US$33 billion, demonstrating the massive demand from for-eign investors for regional sukuk issuances. These types of investments encourage foreign investors to stay in the region, especially with sukuk tenors ranging between 5 and 10 years.
¢ Funds
¢ Sukuk
¢ OIFI
¢ Takaful
¢ Islamic Banking
SOURCE: ICD - THOMSON REUTERS ISLAMIC DEVELOPMENT INDICATOR
2012
2013
2014
2015
2016
2017
2018
2019
2020
TOTAL1,693
TOTAL1,659
TOTAL1,864
TOTAL2,004
TOTAL2,207
TOTAL2,432
TOTAL2,683
TOTAL2,941
TOTAL3,226
1,269 1,2031,364
1,4511,625
1,8202,039
2,2632,512
31 31
3438
40
42
45
48
51
88 88
109106
111
115
120
124
129
260 284
299342
359
377
396
416
436
45 53
58
66
72
77
84
90
98
45WEALTH AND ASSET MANAGEMENT REPORT
CHA
PTER 5
ISLAM
IC ASSET M
AN
AGEM
ENT

46 WEALTH AND ASSET MANAGEMENT REPORT
CHA
PTER
5
ISLA
MIC
ASS
ET M
AN
AGE
MEN
T
ISLAMIC FUNDS CONCENTRATED IN SAUDI ARABIA AND MALAYSIASaudi Arabia and Malaysia accounted for 67% of Islamic assets under management and 49% of the total number of Islamic funds outstanding by the end of 2016.
Saudi Arabia passed a major milestone in 2015 when it opened its stock market to foreign investors to boost capital inflows. Qatar and the UAE similarly opened their stock mar-kets in 2014 to gain MSCI Emerging Market status. Saudi Arabia is not yet part of the MSCI Emerging Markets Index, but is being considered for inclusion in 2019. Some asset managers expect inclusion in the index will allow Saudi Arabia to attract as much as US$50 billion in passive and active investments.
The Tadawul, or Saudi Stock Exchange, is the Gulf’s largest equity market, with a market capitalisation exceeding SAR1.6 trillion at the end of February 2017. Foreigners owned about 4.07% of the market, a share that is expected to increase after the market regulator raised the limit for individual foreigners owning shares in a single company from 5% to 10%, while qualified financial investors can now own up to 49% of a listed company’s share capital.
GCC asset managers are getting ready to capture the expected investment inflows into the Arab world’s biggest mar-ket. More allocations are therefore expected for equity-based, Saudi-focused investments; especially with the upcoming initial public offering of shares in Saudi oil titan Aramco.
Aramco has been centre stage for investors and the Saudi government alike since the world’s biggest oil com-pany announced plans last year to sell a stake of up to 5%. The shares will be listed both in Riyadh and on foreign stock exchanges. An expected total stake price of US$100 billion would value Aramco at US$2 trillion, making this the world’s biggest-ever IPO.
SUKUK LEADER MALAYSIA PROVIDES ASIA’S FIRST ROBO-ADVISER SERVICE FOR ISLAMIC INVESTORSMalaysia, the second biggest market for Islamic asset man-agement, is also home to the biggest Islamic finance industry and was ranked first in the ICD Thomson Reuters Islamic Finance Development Indicator as of 2016. Malaysia is the backbone of the global sukuk market, with an approximate 60% market share. This is a result of decades of effort by the Malaysian government and regulators Bank Negara Malaysia and the Securities Commission.
Malaysia provides a number of tax incentives for invest-ments in the country and to promote Islamic finance. Islamic asset management is expected to continue growing in Malay-sia as there are numerous Shariah-compliant investments available, especially in sukuk. The Malaysian sukuk market is considered the most liquid in the world, and has attracted a number cross-border issuances from GCC bodies such as Abu Dhabi National Energy Co., Bahrain-based Gulf Investment Corp., and National Bank of Abu Dhabi. In 2013, Al Bayan Hold-ing Group became the first Saudi corporate to venture into the Malaysian debt capital market when it issued a MYR200 million (then US$65.4 million) sukuk.
On top of this, Malaysia will this July become the first country in Asia to launch a robo-adviser that follows Shariah guidelines. The service is being launched by Kuala Lum-pur-based wealth manager Farringdon Group and is aimed at lower-income investors who would previously have invested in fixed deposits and saving accounts.
47WEALTH AND ASSET MANAGEMENT REPORT
CHA
PTER 5
ISLAM
IC ASSET M
AN
AGEM
ENT
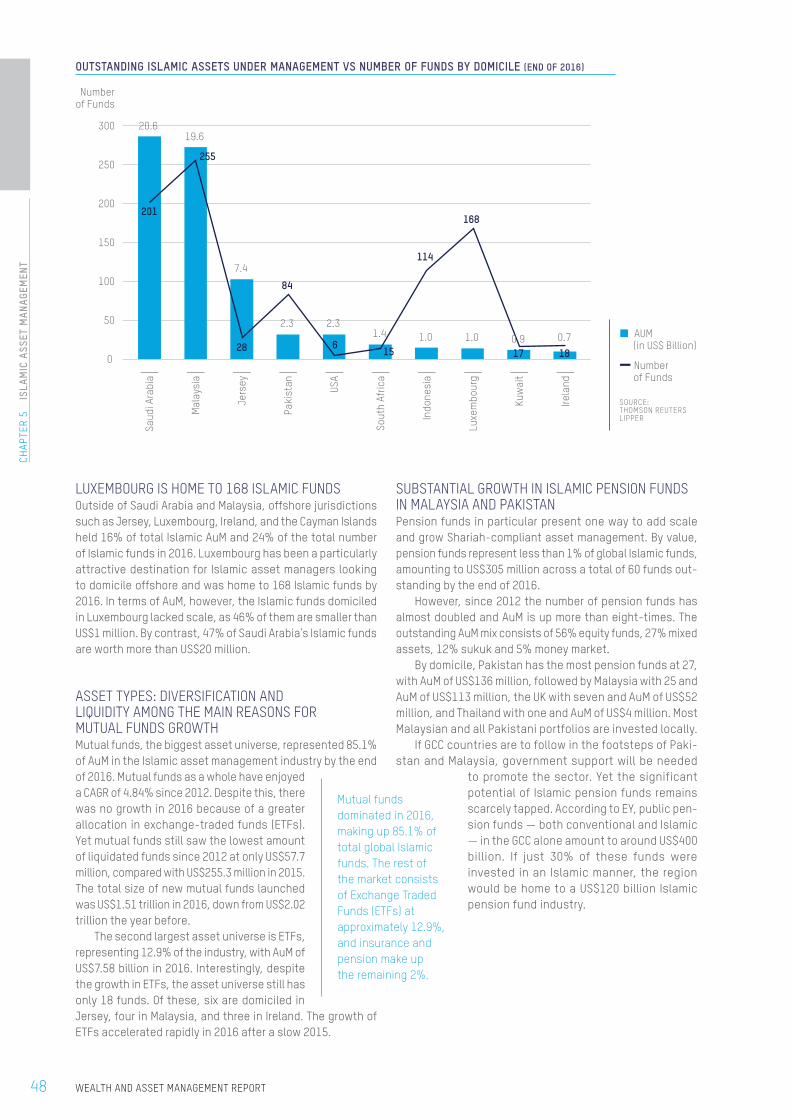
LUXEMBOURG IS HOME TO 168 ISLAMIC FUNDSOutside of Saudi Arabia and Malaysia, offshore jurisdictions such as Jersey, Luxembourg, Ireland, and the Cayman Islands held 16% of total Islamic AuM and 24% of the total number of Islamic funds in 2016. Luxembourg has been a particularly attractive destination for Islamic asset managers looking to domicile offshore and was home to 168 Islamic funds by 2016. In terms of AuM, however, the Islamic funds domiciled in Luxembourg lacked scale, as 46% of them are smaller than US$1 million. By contrast, 47% of Saudi Arabia’s Islamic funds are worth more than US$20 million.
ASSET TYPES: DIVERSIFICATION AND LIQUIDITY AMONG THE MAIN REASONS FOR MUTUAL FUNDS GROWTHMutual funds, the biggest asset universe, represented 85.1% of AuM in the Islamic asset management industry by the end of 2016. Mutual funds as a whole have enjoyed a CAGR of 4.84% since 2012. Despite this, there was no growth in 2016 because of a greater allocation in exchange-traded funds (ETFs). Yet mutual funds still saw the lowest amount of liquidated funds since 2012 at only US$57.7 million, compared with US$255.3 million in 2015. The total size of new mutual funds launched was US$1.51 trillion in 2016, down from US$2.02 trillion the year before.
The second largest asset universe is ETFs, representing 12.9% of the industry, with AuM of US$7.58 billion in 2016. Interestingly, despite the growth in ETFs, the asset universe still has only 18 funds. Of these, six are domiciled in Jersey, four in Malaysia, and three in Ireland. The growth of ETFs accelerated rapidly in 2016 after a slow 2015.
SUBSTANTIAL GROWTH IN ISLAMIC PENSION FUNDS IN MALAYSIA AND PAKISTANPension funds in particular present one way to add scale and grow Shariah-compliant asset management. By value, pension funds represent less than 1% of global Islamic funds, amounting to US$305 million across a total of 60 funds out-standing by the end of 2016.
However, since 2012 the number of pension funds has almost doubled and AuM is up more than eight-times. The outstanding AuM mix consists of 56% equity funds, 27% mixed assets, 12% sukuk and 5% money market.
By domicile, Pakistan has the most pension funds at 27, with AuM of US$136 million, followed by Malaysia with 25 and AuM of US$113 million, the UK with seven and AuM of US$52 million, and Thailand with one and AuM of US$4 million. Most Malaysian and all Pakistani portfolios are invested locally.
If GCC countries are to follow in the footsteps of Paki-stan and Malaysia, government support will be needed
to promote the sector. Yet the significant potential of Islamic pension funds remains scarcely tapped. According to EY, public pen-sion funds — both conventional and Islamic — in the GCC alone amount to around US$400 billion. If just 30% of these funds were invested in an Islamic manner, the region would be home to a US$120 billion Islamic pension fund industry.
Mutual funds dominated in 2016, making up 85.1% of total global Islamic funds. The rest of the market consists of Exchange Traded Funds (ETFs) at approximately 12.9%, and insurance and pension make up the remaining 2%.
OUTSTANDING ISLAMIC ASSETS UNDER MANAGEMENT VS NUMBER OF FUNDS BY DOMICILE (END OF 2016)
0
100
50
150
200
250
300
Numberof Funds
¢ AUM (in US$ Billion)
— Number of Funds
SOURCE: THOMSON REUTERS LIPPER
Saud
i Ara
bia
|
Mal
aysi
a |
Jers
ey |
Paki
stan
|
USA
|
Sout
h Af
rica
|
Indo
nesi
a |
Luxe
mbo
urg
|
Kuw
ait |
Irela
nd |
20.6 19.6
7.4
2.3 2.3 1.4 1.0 1.0 0.9 0.7
201
255
28
84
6 15
114
168
17 18
48 WEALTH AND ASSET MANAGEMENT REPORT
CHA
PTER
5
ISLA
MIC
ASS
ET M
AN
AGE
MEN
T

AUM OF GLOBAL ISLAMIC FUNDS OUTSTANDING - BREAKDOWN BY UNIVERSE (2012 – 2016, IN US$ BILLION)
AUM OF GLOBAL ISLAMIC PENSION FUNDS OUTSTANDING - BREAKDOWN BY UNIVERSE (2012 – 2016)
11.256.13 6.71 5.16
7.58
0.72
0.89 0.960.88
0.88
41.48 49.97
54.05
50.2850.11
0.04
0.09
0.15
0.220.31
¢ Pension Funds
¢ Mutual Funds
¢ Insurance Funds
¢ Exchange Traded Funds
SOURCE: THOMSON REUTERS LIPPER
2012 2013
2014
2015
2016
TOTAL53.48
TOTAL57.08
TOTAL61.87
TOTAL56.54
TOTAL58.89
0
20
10
30
40
50
60
70
¢ AUM (in US$ Million)
— Number of Funds
SOURCE: THOMSON REUTERS LIPPER
2012 2013
2014
2015
2016
Numberof Funds
37.66
90.83
152.50
221.56
305.25
32
46
50
55
60
49WEALTH AND ASSET MANAGEMENT REPORT
CHA
PTER 5
ISLAM
IC ASSET M
AN
AGEM
ENT
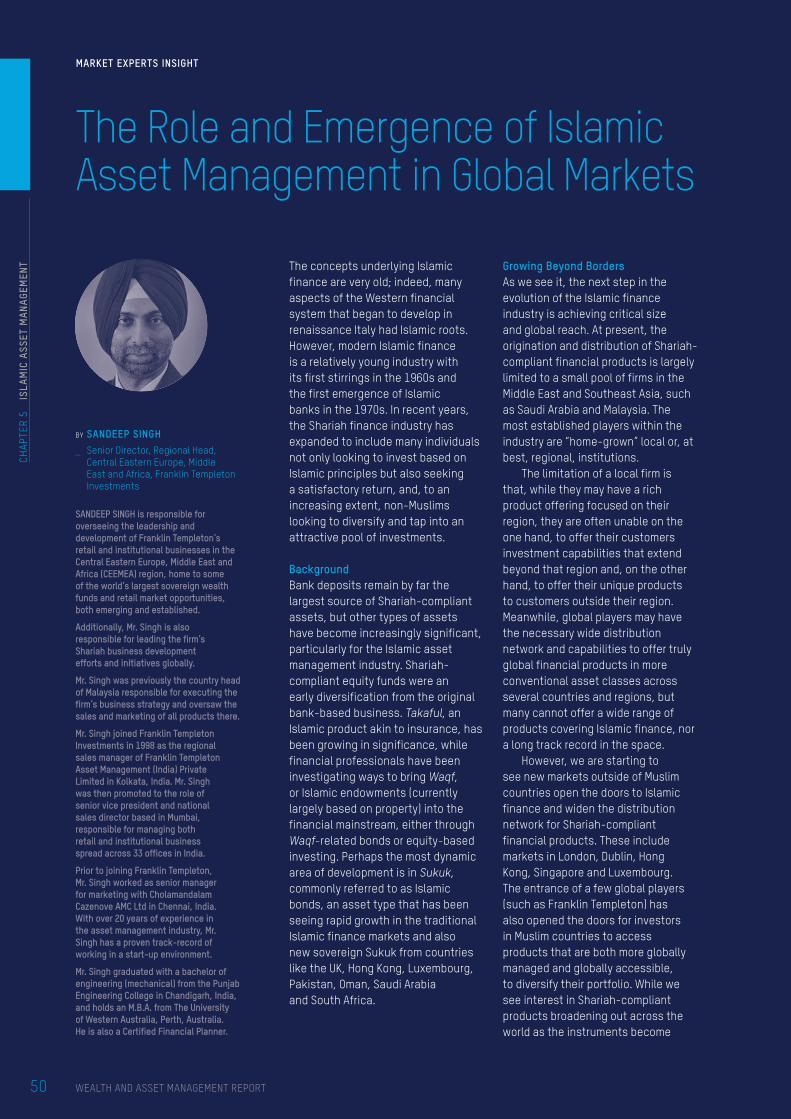
MARKET EXPERTS INSIGHT
The concepts underlying Islamic finance are very old; indeed, many aspects of the Western financial system that began to develop in renaissance Italy had Islamic roots. However, modern Islamic finance is a relatively young industry with its first stirrings in the 1960s and the first emergence of Islamic banks in the 1970s. In recent years, the Shariah finance industry has expanded to include many individuals not only looking to invest based on Islamic principles but also seeking a satisfactory return, and, to an increasing extent, non-Muslims looking to diversify and tap into an attractive pool of investments.
BackgroundBank deposits remain by far the largest source of Shariah-compliant assets, but other types of assets have become increasingly significant, particularly for the Islamic asset management industry. Shariah-compliant equity funds were an early diversification from the original bank-based business. Takaful, an Islamic product akin to insurance, has been growing in significance, while financial professionals have been investigating ways to bring Waqf, or Islamic endowments (currently largely based on property) into the financial mainstream, either through Waqf-related bonds or equity-based investing. Perhaps the most dynamic area of development is in Sukuk, commonly referred to as Islamic bonds, an asset type that has been seeing rapid growth in the traditional Islamic finance markets and also new sovereign Sukuk from countries like the UK, Hong Kong, Luxembourg, Pakistan, Oman, Saudi Arabia and South Africa.
Growing Beyond BordersAs we see it, the next step in the evolution of the Islamic finance industry is achieving critical size and global reach. At present, the origination and distribution of Shariah-compliant financial products is largely limited to a small pool of firms in the Middle East and Southeast Asia, such as Saudi Arabia and Malaysia. The most established players within the industry are “home-grown” local or, at best, regional, institutions.
The limitation of a local firm is that, while they may have a rich product offering focused on their region, they are often unable on the one hand, to offer their customers investment capabilities that extend beyond that region and, on the other hand, to offer their unique products to customers outside their region. Meanwhile, global players may have the necessary wide distribution network and capabilities to offer truly global financial products in more conventional asset classes across several countries and regions, but many cannot offer a wide range of products covering Islamic finance, nor a long track record in the space.
However, we are starting to see new markets outside of Muslim countries open the doors to Islamic finance and widen the distribution network for Shariah-compliant financial products. These include markets in London, Dublin, Hong Kong, Singapore and Luxembourg. The entrance of a few global players (such as Franklin Templeton) has also opened the doors for investors in Muslim countries to access products that are both more globally managed and globally accessible, to diversify their portfolio. While we see interest in Shariah-compliant products broadening out across the world as the instruments become
BY SANDEEP SINGH
_ Senior Director, Regional Head, Central Eastern Europe, Middle East and Africa, Franklin Templeton Investments
SANDEEP SINGH is responsible for overseeing the leadership and development of Franklin Templeton’s retail and institutional businesses in the Central Eastern Europe, Middle East and Africa (CEEMEA) region, home to some of the world’s largest sovereign wealth funds and retail market opportunities, both emerging and established.
Additionally, Mr. Singh is also responsible for leading the firm’s Shariah business development efforts and initiatives globally.
Mr. Singh was previously the country head of Malaysia responsible for executing the firm’s business strategy and oversaw the sales and marketing of all products there.
Mr. Singh joined Franklin Templeton Investments in 1998 as the regional sales manager of Franklin Templeton Asset Management (India) Private Limited in Kolkata, India. Mr. Singh was then promoted to the role of senior vice president and national sales director based in Mumbai, responsible for managing both retail and institutional business spread across 33 offices in India.
Prior to joining Franklin Templeton, Mr. Singh worked as senior manager for marketing with Cholamandalam Cazenove AMC Ltd in Chennai, India. With over 20 years of experience in the asset management industry, Mr. Singh has a proven track-record of working in a start-up environment.
Mr. Singh graduated with a bachelor of engineering (mechanical) from the Punjab Engineering College in Chandigarh, India, and holds an M.B.A. from The University of Western Australia, Perth, Australia. He is also a Certified Financial Planner.
The Role and Emergence of Islamic Asset Management in Global Markets
50
CHA
PTER
5
ISLA
MIC
ASS
ET M
AN
AGE
MEN
T
WEALTH AND ASSET MANAGEMENT REPORT
The Islamic banking system is itself seeing some interesting newdevelopments that could extend the reach of more sophisticatedShariah-compliant products.
more mainstream, the fact remains that Islamic financial institutions and wealthy Muslims are still the biggest investors. We believe much more needs to be done to grow and deepen the Islamic finance industry, not just by attracting more faith-based investors but also by appealing to and creating awareness among non-faith-based investors.
Not Just For Faith-Based InvestorsThe principles of Shariah investing mean that these products lend themselves well to diversify any investor’s portfolio, regardless of faith. Not only are the returns attractive relative to traditional fixed income assets, volatility has historically been more subdued—something that could prove important in a rising interest-rate environment.
The limit on debt ownership due to Islamic principles also means that a Shariah-compliant equity portfolio may appear higher-quality than more conventional portfolios due to the screening out of highly leveraged companies, and the absence of sectors like alcohol, tobacco, gaming, etc. also makes them more ethical. Indeed, many attributes of a Shariah-compliant product may also appeal to those interested in ethical, environmental or socially responsible investing.
Islamic bonds or Sukuk provide exposure to some of the fast-growing and most financially sound economies in the Gulf Cooperation Council (GCC) and Southeast Asia, countries where credit ratings are relatively strong but that are often underrepresented in many traditional bond indices and funds. Due to their unique structure and market dynamics, Sukuk tend to be more insulated from market events and have lower correlations to other asset classes, including global bonds,
global equity and commodities. We believe all of these factors could make Sukuk an appropriate complement to investors’ existing portfolios. Indeed, several so-called “conventional” investors around the world have been pouring funds into the asset class, attracted purely by valuations and fundamentals.
The inclusion of Sukuk to emerging-market indices will add to the pool of investors that are benchmark-sensitive in the emerging-market bond space, which is particularly important for the government and corporate Sukuk that meet these criteria. Even though some Sukuk issued out of the GCC may not meet the criteria for EM index inclusion (due to size, rating or per capita income), even partial inclusions bring light to the Sukuk regions that are still underrepresented in global fixed income allocations in spite of a compelling risk/reward investment rationale.
The Road AheadWith expansion, the challenge for Islamic finance is to achieve a degree of uniformity in the treatment of assets, providing comfort to international investors, when the underlying principles governing such treatments necessarily have local roots. The Islamic banking system is itself seeing some interesting new developments that could extend the reach of more sophisticated Shariah-compliant products. Evolving banking solvency requirements are driving demand for subordinate, perpetual and lower-tier Sukuk as banks that previously held reserves largely in cash deposits at central banks look for more efficient balance sheet structures, which has the effect of widening investment choices for non-faith-based investors.
51
CHA
PTER 5
ISLAM
IC ASSET M
AN
AGEM
ENT
WEALTH AND ASSET MANAGEMENT REPORT

Notes


Dubai International Financial Centre Wealth and Asset Management Report 2017
MAPPING OPPORTUNITIES IN THE MEASA REGION