dual mode vehicle and infrastructure alternative analysis
TRANSCRIPT
Technical Report Documentation Page 1. Report No. FHWA/TX-08/0-5827-1
2. Government Accession No.
3. Recipient's Catalog No.
4. Title and Subtitle DUAL MODE VEHICLE AND INFRASTRUCTURE
LTERNATIVES ANALYSIS A
5. Report Date October 2007 Published: April 2008 6. Performing Organization Code
7. Author(s) Christine Ehlig-Economides and Jim Longbottom
8. Performing Organization Report No. Report 0-5827-1
9. Performing Organization Name and Address Harold Vance Department of Petroleum Engineering Dwight Look College of Engineering Texas A&M University College Station, Texas 77843-3116 and Texas Transportation Institute The Texas A&M University System College Station, Texas 77843-3135
10. Work Unit No. (TRAIS) 11. Contract or Grant No. Project 0-5827
12. Sponsoring Agency Name and Address Texas Department of Transportation Research and Technology Implementation Office P.O. Box 5080 A ustin, Texas 78763-5080
13. Type of Report and Period Covered Technical Report: September 2006-August 2007 14. Sponsoring Agency Code
15. Supplementary Notes Project performed in cooperation with the Texas Department of Transportation and the Federal Highway Administration. Project Title: Alternatives Analysis for Initial and Future TxDOT Deployment of a Dual Mode, Automated Transportation System URL: http://tti.tamu.edu/documents/0-5827-1.pdf 16. Abstract The United States has a transportation challenge that requires addressing four issues simultaneously: traffic congestion, environmental pollution, safety, and energy security. A potential solution to these transportation challenges is the concept of an electrified guideway infrastructure providing energy in real time to automated vehicles. This project surveyed existing electrified advanced transportation concepts and selected five systems for evaluation of their technology readiness. None of the systems evaluated were judged ready for commercialization, but potential benefits of the technology warrant further development. Stakeholder interviews and a survey of collaboration mechanisms identified organizational and research paths that would enable accelerated development of a system capable of handling personal vehicles, public transit, and driverless freight movement on a common 21st century infrastructure. 17. Key Words Energy, Congestion, Safety, Emissions, Dual Mode, Electric Vehicle, Personal Rapid Transit
18. Distribution Statement No restrictions. This document is available to the public through NTIS: National Technical Information Service Springfield, Virginia 22161 http://www.ntis.gov
19. Security Classif.(of this report) Unclassified
20. Security Classif.(of this page) Unclassified
21. No. of Pages 136
22. Price
Form DOT F 1700.7 (8-72) Reproduction of completed page authorized


DUAL MODE VEHICLE AND INFRASTRUCTURE ALTERNATIVES ANALYSIS
by
Christine Ehlig-Economides, Ph.D. Professor
Harold Vance Department of Petroleum Engineering Dwight Look College of Engineering
Texas A&M University
and
Jim Longbottom TEES Associate Research Scientist
Harold Vance Department of Petroleum Engineering Dwight Look College of Engineering
Texas A&M University
Report 0-5827-1 Project 0-5827
Project Title: Alternatives Analysis for Initial and Future TxDOT Deployment of a Dual Mode, Automated Transportation System
Performed in cooperation with the Texas Department of Transportation
and the Federal Highway Administration
October 2007 Published: April 2008
HAROLD VANCE DEPARTMENT OF PETROLEUM ENGINEERING Dwight Look College of Engineering
Texas A&M University College Station, Texas 77843-3116
and TEXAS TRANSPORTATION INSTITUTE
The Texas A&M University System College Station, Texas 77843-3135


DISCLAIMER
The contents of this report reflect the views of the authors, who are responsible for the facts and the accuracy of the data presented herein. The contents do not necessarily reflect the official views or policies of the Federal Highway Administration (FHWA) or the Texas Department of Transportation (TxDOT). This report does not constitute a standard, specification, or regulation.
v

vi
ACKNOWLEDGMENTS
This project was conducted in cooperation with the Texas Department of Transportation (TxDOT) and the Federal Highway Administration (FHWA). Project members extend thanks to the TxDOT project director Duncan Stewart and program coordinator Tonia Norman, and to members of the Project Management Committee (PMC) including Loretta Brown, Teresa Lemons, Don Lewis, Jackie Ploch, M. Kim Soucek, and Orlando Jamandre, Jr.
TABLE OF CONTENTS
Page
LIST OF FIGURES ..................................................................................................................... ix
LIST OF TABLES ........................................................................................................................ x
EXECUTIVE SUMMARY—A CHALLENGE AND BOLD SOLUTION ............................. 1
1. RESEARCH METHOD OVERVIEW .................................................................................. 5
2. LITERATURE REVIEW AND BACKGROUND ............................................................... 7 Transportation Demand .............................................................................................................. 7 Congestion and Demographics ................................................................................................... 8 Energy Security ......................................................................................................................... 11 Emissions .................................................................................................................................. 13 Safety ........................................................................................................................................ 13 Roadway Costs.......................................................................................................................... 15 A View into the Future ............................................................................................................. 16 Why Focus on Automation ....................................................................................................... 19 Personal Rapid Transit and Dual Mode System History .......................................................... 20 Recent PRT Studies .................................................................................................................. 23 Current Department of Energy and Department of Transportation Technology Pathways ...... 25
ITS/VII .................................................................................................................................. 25 PNGV .................................................................................................................................... 25 FreedomCAR ........................................................................................................................ 26
Efficiency Myth ........................................................................................................................ 28
3. DUAL MODE TECHNOLOGY EVALUATION .............................................................. 31 System Requirements................................................................................................................ 31 Technology Options .................................................................................................................. 32 Technology Readiness Levels Summary .................................................................................. 35
4. A PATH FORWARD—EFFECTING NETWORKED SYSTEM CHANGE ................. 39 An Equilibrium Shift................................................................................................................. 39 Collaboration............................................................................................................................. 42 Who Are the Stakeholders and How Is Consensus Built? ........................................................ 45 Stakeholder Comments/Insight ................................................................................................. 46 A Dual Mode Benefits Coalition .............................................................................................. 48 A Policy of Flexibility and Competition ................................................................................... 50
Value of Competition ............................................................................................................ 51 Electric Grid and Homeland Security Impact ....................................................................... 52 Transit System and Funding Impact ..................................................................................... 52 Use of Corridor Authority for Demonstration Pilots ............................................................ 53
A Method of Monitoring Progress ............................................................................................ 53
5. CONCLUSIONS AND RECOMMENDATIONS ............................................................... 55
vii

REFERENCES ............................................................................................................................ 59
APPENDIX A: DUAL MODE STAKEHOLDER/CUSTOMER ASSESSMENT ............... 63 A-1.0. Introduction.................................................................................................................... 65 A-2.0. Summary of Findings .................................................................................................... 65 A-3.0. Interview and Survey Process ........................................................................................ 67
A-3.1. Stakeholder Interviews .............................................................................................. 67 A-3.2. Customer Survey ....................................................................................................... 68
A-4.0. Detailed Results ............................................................................................................. 68 A-4.1. Stakeholder Responses .............................................................................................. 69 A-4.2. Survey Responses ...................................................................................................... 76
APPENDIX B: TABLE OF DUAL MODE AND PRT SYSTEMS ........................................ 81
APPENDIX C: CRITICAL TECHNOLOGY ELEMENTS AND READINESS LEVELS ........................................................................................................................... 91
APPENDIX D: LITERATURE LIST ..................................................................................... 113
APPENDIX E: GLOSSARY .................................................................................................... 123
viii

LIST OF FIGURES
Page Figure 1. Transportation Demand since 1990. ................................................................................ 7 Figure 2. Congestion Levels in 1982 and 2003 (Schrank and Lomax 2005). ................................ 8 Figure 3. Increase in Population, Workers, Vehicles, Vehicle Miles Traveled, and Lane
Miles, 1990 to 2000. ........................................................................................................... 9 Figure 4. Texas Population History and Forecast (Murdock et al. 2002). ...................................... 9 Figure 5. U.S. Transportation Fuels since 1950 (Data from the Energy Information
Administration [EIA] of the U.S. Department of Energy [DOE]). ................................... 11 Figure 6. U.S. Energy Consumption since 1950 (Data from the EIA of U.S. DOE). .................. 12 Figure 7. Employment and Major Petroleum Supply Disruptions in OPEC Era.......................... 12 Figure 8. Road Vehicle Emissions since 1990 (U.S. Department of Transportation 2007). ........ 13 Figure 9. Fatal Crashes since 1990 (U.S. Department of Transportation 2007). .......................... 14 Figure 10. Fatalities per 100 Million VMT since 1990 (U.S. Department of
Transportation 2007). ........................................................................................................ 14 Figure 11. Total Disbursements for Highways by Function (NCHRP 2006). .............................. 15 Figure 12. Indexed Cost of Highway Construction (NCHRP 2006). ........................................... 15 Figure 13. Travel Time Budget versus Per Capita GDP (Schafer and Victor 2000). ................... 17 Figure 14. U.S. Per Capita VMT versus Per Capita GDP. ........................................................... 18 Figure 15. Conventional Vehicle Velocity versus Vehicle Spacing (Garrison and Ward
2000). ................................................................................................................................ 20 Figure 16. AHS Automation Evolution (Ioannou 1997). ............................................................. 23 Figure 17. Ton-mpg by Model Year Using a Three-Year Moving Average (Heavenrich
2006). ................................................................................................................................ 26 Figure 18. Total Fleet CAFE Performance (National Highway Traffic Safety
Administration 2003). ....................................................................................................... 27 Figure 19. Vehicle Weight and Performance since 1975 (Heavenrich 2006). ............................. 27 Figure 20. Comparison of Total Energy Consumption, Energy Intensity, and VMT. ................. 29 Figure 21. Innovation Patterns (Miller and Morris 1999). ............................................................ 39 Figure 22. The Challenge of a Networked Market Equilibrium Shift. ......................................... 40 Figure 23. Car Technology Penetration Years after First Significant Use (Heavenrich
2006). ................................................................................................................................ 41 Figure 24. SEMATECH Collaboration Maturity Model. ............................................................. 44 Figure 25. Dual Mode Concept Readiness Timeline. ................................................................... 47
ix

x
LIST OF TABLES
Page Table 1. Technology Review Team. ............................................................................................... 5 Table 2. Highway, Demographic, and Geographic Characteristics of Urbanized Areas in
Texas: 2000 (US DOT 2000). ........................................................................................... 10 Table 3. Texas in Context. ............................................................................................................ 16 Table 4. Characteristics of the 14 Systems Selected for Ranking. ............................................... 33 Table 5. Characteristics Common to Many of the Systems. ......................................................... 33 Table 6. System Cost Comparison to Conventional Highway Construction Cost. ...................... 34 Table 7. Critical Technology Elements and Readiness for Selected Systems. ............................. 35 Table 8. Transportation System Stakeholders. ............................................................................. 45
EXECUTIVE SUMMARY— A CHALLENGE AND BOLD SOLUTION
The United States wastes over $1.5 billion per day due to inefficiencies in the current highway transportation architecture. This waste includes:
• $189 billion per year premium in energy costs due to the 98.5 percent transportation dependence on a single primary fuel (oil);
• $230 billion per year due to deaths, injuries, and property damage caused by safety issues;
• $64 billion per year due to congestion causing excess fuel consumption and lost productivity;
• $17 billion per year due to air emissions; • $33 billion per year in international energy security expenditures; and • $75 billion per year in lost productivity and foregone supply chain improvements that
could be enabled by faster, more reliable mobility of people and goods. A bold solution to these challenges may exist in the form of a dual mode electrified transportation network. This concept merits a critical mass research effort to evaluate the cost/benefit balance, identify and address the technology challenges, analyze the transition pathways to the alternative architecture, and ascertain the policies and coalition support mechanisms that would enable the vision to become reality. A proposed new national network uses single and dual mode vehicles to provide mobility for freight, private cars, and mass transit vehicles. In single mode, the vehicles will be captive to an electric guideway from which they draw propulsion energy in real time as the vehicle moves at high speed under automated computer control. Single mode applications could include fully automated (driverless) terminal-to-terminal freight transport and personal rapid transit. In dual mode operation, driver-controlled vehicles will be able to travel the first and last miles off-guideway using onboard energy storage as one mode and then enter the guideway in a second mode for high speed automated travel. The mixed-use nature of the guideways provides multiple revenue streams to pay for the infrastructure, as is currently the case with highways. Shorter headway distances and higher steady speeds combine with costs per mile similar to highways to provide more throughput capacity per infrastructure dollar invested. A generally elevated and lightweight infrastructure is envisioned, enhancing safety and minimizing footprint so that current highway or railroad rights-of-way could be sufficient for much of the national network. Any primary fuel capable of generating electricity will be able to compete for the transportation energy market. The resulting competition between primary fuels to satisfy the transportation energy demand may accelerate innovation in this arena while also enabling better solutions for control of air emissions.
1

In addition, the research team offers the following four options that can be employed by TxDOT, with each option exhibiting higher degrees of engagement, leadership, and influence in defining future transportation alternatives:
1. Passively monitor dual mode technology developments and advise TxDOT decision makers when the technology maturity is approaching commercialization. This option will leave TxDOT with little influence or leadership in steering the technology to meet Texas’ needs.
2. Directly sponsor in-depth studies of the impact on Texas from development of dual mode with matching industry funds required for the studies. This option will provide TxDOT with some influence and leadership and will send clear signals to the private market of receptivity to new solutions.
3. In addition to the impact studies of option two, provide testbed sponsorship from state funds to match private investment to ensure Texas shares in the lead of new energy and transportation solution development.
4. In addition to Texas-supported impact studies and testbed facilities, engage the Texas governor and the U.S. congressional delegation to make this a federal initiative with multi-state support.
It is in Texas’ interest to lead the nation in this transition to maintain our position as the “energy capital” of the nation. To take the leadership role, a first phase of development should provide a baseline system concept/design and robust modeling of the expected impact in the following areas: economic development, electric demand, emissions, congestion, safety, energy flows, emergency preparedness, and transportation planning and policy. The researchers recommend adopting option two of the alternative pathways. Based on a positive outcome from the initial analyses, the following recommendations may be advanced:
• Engage the private sector in implementing the new mode with the goal of a 20-year full implementation of a national system, which should be explored to achieve a new level of energy security by 2035. A relatively quick transition to the new architecture will have network benefits that will encourage rapid end user adoption of the new technology.
• Should initial impact and cost/benefit studies prove feasible and attractive, TxDOT should encourage design and operations standards that ensure interconnection between intercity systems justified by freight and intracity systems justified by transit, thereby providing a navigable critical mass network for dual mode private vehicle technology adoption.
• Leverage political support from the state to develop availability of federal matching funds for dual mode electrified transportation technology acceleration.
A policy of enabling more robust transportation energy competition should be adopted. There is no current corporate monopoly in oil, but oil as a resource has a monopoly in transportation energy markets. A policy of encouraging the move to electrification for transportation energy will increase competition and spur productivity improvements and innovation.
2

3
Development of a dual mode electric transportation infrastructure should be explored as an opportunity to harden and increase the electric transmission and distribution capacity while also delivering new solutions for emergency response and homeland security. Approach the challenge in step-wise fashion, with further efforts focused on four thrusts:
• a technology roadmap, • systems-level technology adoption and impact modeling, • a financial and policy framework, and • organization of a research and development consortium.
The technology roadmap efforts would address system performance and integration issues, power delivery, vehicle systems, surface superstructure, command and control systems, and networked sensors and system health monitoring. Modeling efforts would include energy, emissions, transportation demand, economic impact, emergency response, and system dynamic modeling. Financial and policy analysis would clarify pathways to critical mass support for a transition to a 21st century transportation network. Finally, organizational development is needed to define a pre-competitive space in which collaboration among competitors can be achieved for the benefit of all collaboration partners while guarding the assurance of robust competition for actual delivery of products to the market. A consortium dedicated to the launch of this initiative is recommended and may follow the business model of the SEMATECH collaboration, which operates in the semiconductor fabrication space, or the FutureGen Alliance, which is organized to demonstrate clean coal technologies to a commercial scale.


1. RESEARCH METHOD OVERVIEW
The research project was organized into tasks as outlined in the following list:
• literature and background review, • technology developer screening, • workshop review of currently available technologies, • gathering of stakeholder input, • development of a method of monitoring the future progress of dual mode technology, • recommendation of a process to accelerate maturing of a dual mode system, and • final report preparation.
The literature and background review included a very broad review of technical papers, patents, books, and research reports on issues including energy and emissions, transportation planning, vehicle technologies, infrastructure design, collaborative innovation methods, critical infrastructure protection, and policy issues. Appendix D includes a listing of the most relevant literature, and many of the documents are available online. The purpose of the literature review was to identify the critical issues and metrics that might be used in the technology screening, workshop review, and stakeholder discussions. A list of operational requirements was developed for a national dual mode transportation system. Based on this list of requirements, knowledge of the reference literature reviewed, and a review of available information from the technology vendors, researchers identified 14 systems to be reviewed in greater detail in the workshop. Representatives across a number of technical disciplines including mechanical engineering, electrical engineering, civil engineering, transportation engineering, freight logistics, power systems engineering, transportation policy, and energy were engaged for a review process. The personnel included members of Texas A&M University Dwight Look College of Engineering, Texas Transportation Institute, and Oak Ridge National Laboratory as shown in Table 1.
Table 1. Technology Review Team. Review Team Member Discipline Area of Specialization & Research Interests Alexander Parlos Mechanical Engineering Networked Intelligent Sensors & Machines David Ford Civil Engineering System Dynamics Mark Burris Civil Engineering Transportation Economy Prasad Enjeti Electrical Engineering Power Electronics Paolo Gardoni Civil Engineering Structures
Ginger Goodin Texas Transportation Institute
Transportation Policy, Systems, and Managed Lanes
David Ungemah Texas Transportation Institute Stakeholder Engagement
Jim Longbottom Petroleum Engineering Energy Systems & Innovation Methods Christine Ehlig- Economides Petroleum Engineering Energy Systems & Sustainability
Curtis Morgan Texas Transportation Institute Freight Systems
Guests Oak Ridge National Laboratory Power Electronics & Motors, Materials, Policy
5

6
Each member of the review team was provided with a manual including detailed literature on the 14 systems under review. Based on a set of system elements, each member of the workshop ranked the 14 systems under consideration to identify the five most promising systems. Members of the review team ranked the technologies in advance, and then the team met in a one-day workshop December 5, 2006, to arrive at a consensus on the high-graded systems and to identify the critical technology elements and assign a technology readiness rank to each critical element. The technology readiness levels and critical technology element identification process are further described in Chapter 3 and Appendix C of this report. The research initially contemplated identifying initial deployment opportunities for a dual mode demonstration, soliciting solutions for these applications from selected dual mode vendors, conducting a workshop review of the vendor proposals, and performing an alternatives analysis of two options. This plan was modified after completion of task three because no systems were judged to be ready for demonstration at that time. The process was instead redirected to focus on a means for accelerating the maturing of the technology. Stakeholders in the transportation network are many. These include carriers, users of transportation services, goods suppliers, service suppliers, construction companies, vehicle manufacturers, electric utilities, primary fuel suppliers, entrepreneurs, investors, labor, environmental interests, professional associations, research/education/policy interests, and federal/state/local governments. Original plans for the stakeholder engagement process included web meetings. Although a couple of web meetings were held, with limited funds and time to engage such a large group of stakeholders, the process was modified to use the following three formats. An Internet-based discussion group focusing on transportation innovation was used to engage the entrepreneurial community to collect their input. A separate telephone interview process engaged the broad industry and government stakeholders, and an Internet survey polled the supply chain/logistics users of transportation services. The stakeholder engagement processes are discussed in more detail in Chapter 4 and Appendix A of this report. Based on the literature review, technology readiness, and stakeholder input, a set of recommendations was then developed. These recommendations include methods of monitoring future developments in this technology space and options for accelerating the maturing process for these technologies.

2. LITERATURE REVIEW AND BACKGROUND
The first task in any project is to understand the very nature of the challenges to be addressed and the context or perspective of the existing environment in which the challenges are embedded. To this end it is useful to capture some statistics and background understanding of transportation demand, congestion and demographics, energy security, emissions, safety performance, and roadway cost issues.
TRANSPORTATION DEMAND Figure 1 shows that transportation demand on the highway and road systems in the United States has been steadily increasing for vehicles, passengers, and freight for the last 15 years, and indeed the trend continues back to 1960. In the period from 1990 to 2005, vehicle miles traveled (VMT) on the highway system increased 39 percent, while passenger miles traveled (PMT) increased 37.2 percent and intercity truck ton-miles (TTM) of freight increased 48 percent (data for intercity truck ton-miles is from 1990 to 2003). During the same period from 1990 to 2005, the principal arterial public roads including interstates, freeways, and other arterials have increased by only 13.6 percent (FHWA 2005). As a result, vehicle densities have increased and led to traffic congestion. The freight load is forecast to increase 70 percent between 1998 and 2020 with 71 percent of all freight tonnage and 80 percent of freight values being carried by trucks (Sedor and Caldwell 2002).
Figure 1. Transportation Demand since 1990.
0
1,000
2,000
3,000
4,000
5,000
6,000
1990
1991
1992
1993
1994
1995
1996
1997
1998
1999
2000
2001
2002
2003
2004
2005
Bill
ions
Mile
s or
Ton
-Mile
s
Highway VMT Highway PMT
Freight Intercity Truck Ton-Miles
As of 2005, Texas had 304,000 miles of public roads and 47,768 road bridges, of which TxDOT manages 79,648 miles including 3233 miles of interstate highways. Texas is the second highest of the 50 states in traffic demand, logging 235 billion vehicle miles traveled and representing 7.9 percent of the total U.S. 2989 billion vehicle miles traveled. In the process Texas used 15.03 billion gallons of fuel on the highway, representing 8.59 percent of the U.S. consumption (FHWA 2005).
7
In 2005, 91 percent of workers commuted to work using personal vehicles, although commuting only represents 15 percent of daily trips taken. Of all daily trips, 87 percent took place in personal vehicles, with the average person driving 29 miles per day and spending 55 minutes behind the wheel (BTS 2007).
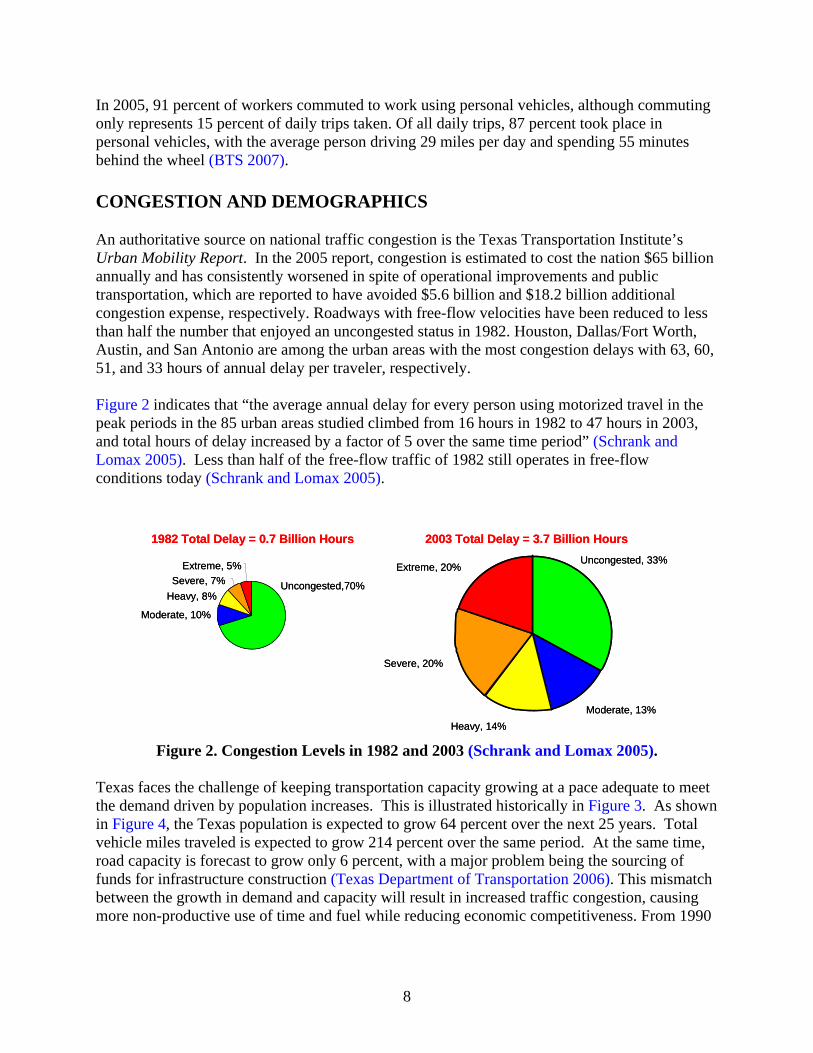
CONGESTION AND DEMOGRAPHICS An authoritative source on national traffic congestion is the Texas Transportation Institute’s Urban Mobility Report. In the 2005 report, congestion is estimated to cost the nation $65 billion annually and has consistently worsened in spite of operational improvements and public transportation, which are reported to have avoided $5.6 billion and $18.2 billion additional congestion expense, respectively. Roadways with free-flow velocities have been reduced to less than half the number that enjoyed an uncongested status in 1982. Houston, Dallas/Fort Worth, Austin, and San Antonio are among the urban areas with the most congestion delays with 63, 60, 51, and 33 hours of annual delay per traveler, respectively. Figure 2 indicates that “the average annual delay for every person using motorized travel in the peak periods in the 85 urban areas studied climbed from 16 hours in 1982 to 47 hours in 2003, and total hours of delay increased by a factor of 5 over the same time period” (Schrank and Lomax 2005). Less than half of the free-flow traffic of 1982 still operates in free-flow conditions today (Schrank and Lomax 2005).
Figure 2. Congestion Levels in 1982 and 2003 (Schrank and Lomax 2005).
Uncongested, 33%
Moderate, 13%Heavy, 14%
Severe, 20%
Extreme, 20%
Uncongested,70%
Moderate, 10%
Heavy, 8%Severe, 7%
Extreme, 5%
1982 Total Delay = 0.7 Billion Hours 2003 Total Delay = 3.7 Billion Hours1982 Total Delay = 0.7 Billion Hours 2003 Total Delay = 3.7 Billion HoursUncongested, 33%
Moderate, 13%Heavy, 14%
Severe, 20%
Extreme, 20%
Uncongested,70%
Moderate, 10%
Heavy, 8%Severe, 7%
Extreme, 5%
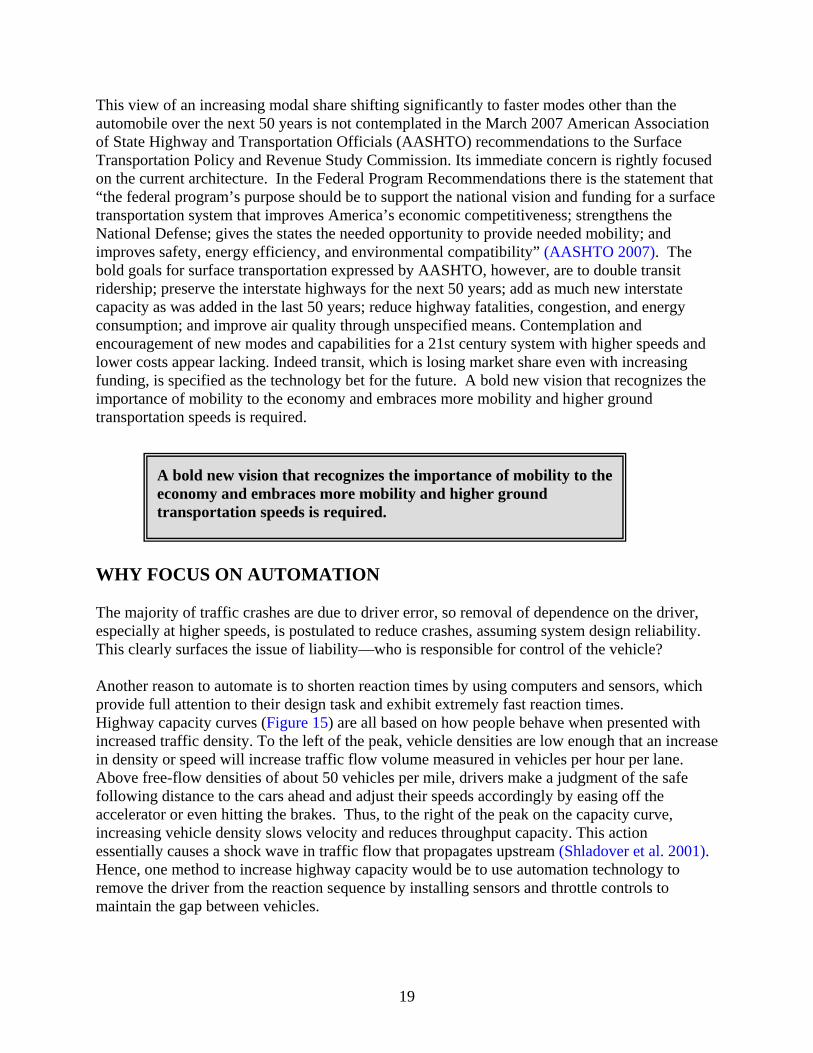
Texas faces the challenge of keeping transportation capacity growing at a pace adequate to meet the demand driven by population increases. This is illustrated historically in Figure 3. As shown in Figure 4, the Texas population is expected to grow 64 percent over the next 25 years. Total vehicle miles traveled is expected to grow 214 percent over the same period. At the same time, road capacity is forecast to grow only 6 percent, with a major problem being the sourcing of funds for infrastructure construction (Texas Department of Transportation 2006). This mismatch between the growth in demand and capacity will result in increased traffic congestion, causing more non-productive use of time and fuel while reducing economic competitiveness. From 1990
8
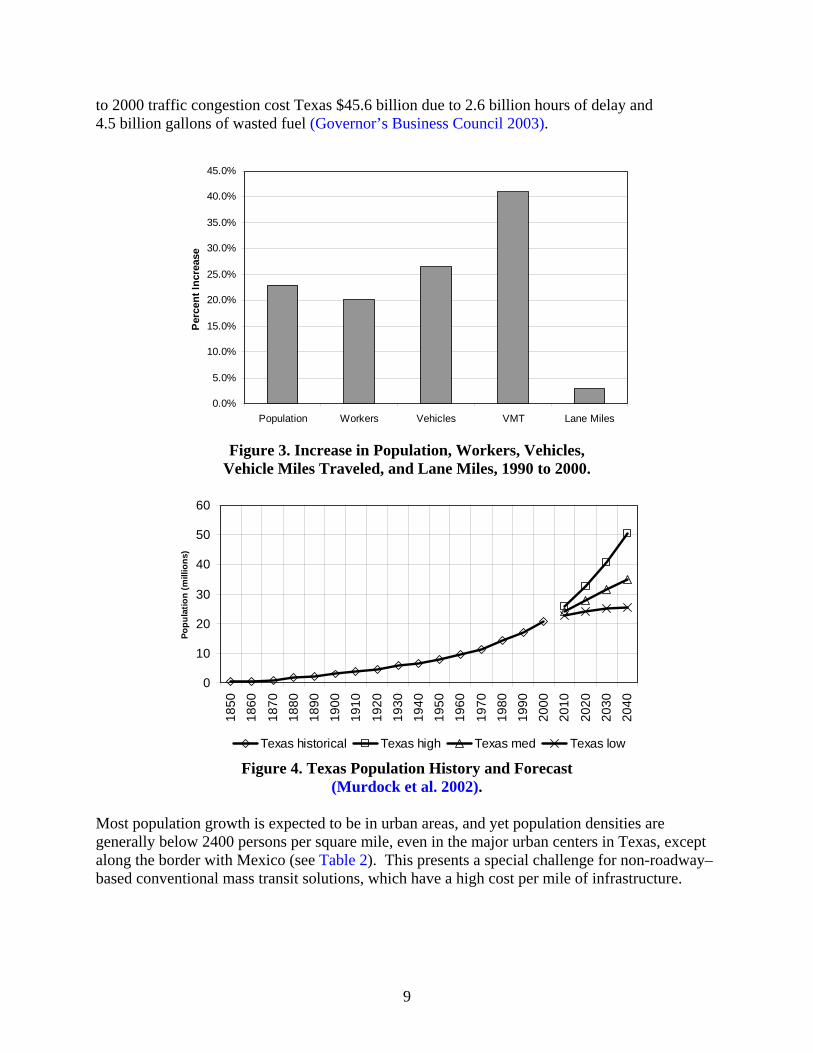
to 2000 traffic congestion cost Texas $45.6 billion due to 2.6 billion hours of delay and 4.5 billion gallons of wasted fuel (Governor’s Business Council 2003).
0.0%
5.0%
10.0%
15.0%
20.0%
25.0%
30.0%
35.0%
40.0%
45.0%
Population Workers Vehicles VMT Lane Miles
Per
cent
Incr
ease
Figure 3. Increase in Population, Workers, Vehicles,
Vehicle Miles Traveled, and Lane Miles, 1990 to 2000.
0
10
20
30
40
50
60
1850
1860
1870
1880
1890
1900
1910
1920
1930
1940
1950
1960
1970
1980
1990
2000
2010
2020
2030
2040
Popu
latio
n (m
illio
ns)
Texas historical Texas high Texas med Texas low
Figure 4. Texas Population History and Forecast (Murdock et al. 2002).
Most population growth is expected to be in urban areas, and yet population densities are generally below 2400 persons per square mile, even in the major urban centers in Texas, except along the border with Mexico (see Table 2). This presents a special challenge for non-roadway–based conventional mass transit solutions, which have a high cost per mile of infrastructure.
9

Table 2. Highway, Demographic, and Geographic Characteristics of Urbanized Areas in Texas: 2000 (U.S. Department of Transportation 2000).
10

Ridership on a mass transit system is typically determined by the population and job density origin to destination pairs that are within one-half to one-quarter mile of the mass transit stops. Required mode changes and the nature of systems that stop at every pick-up/drop-off point along a route tend to make the transportation service provided more time consuming than the use of an automobile. Consequently when automobile travel can be afforded, it is usually the preferred mode in a low density setting. The miles of roadway per person in the chart should read miles of roadway per 1000 persons. If this ratio was to be held relatively constant for urban areas while population increases 64 percent in the next 25 years, many more miles of roadway would be required.
ENERGY SECURITY As seen in Figure 5, essentially the only fuel used for transportation is oil, and the amount of oil imported from foreign sources is currently more than 80 percent of the amount of oil consumed in transportation in the United States. Triggered by price controls on domestic oil production, just before the Arab oil embargo of 1973, U.S. oil imports began a climb to the highest historic fraction of U.S. oil consumption. The reduction in oil imports occurred when Alaska’s Prudhoe Bay oilfield initiated production, and in about that timeframe as well, the United States curtailed use of oil in electric power generation. The figure shows that oil imports have increased steadily since about 1982, when the Saudi Aramco production increase caused a global drop in oil price that led to ever-increasing transportation consumption in less and less efficient vehicles.
Figure 5. U.S. Transportation Fuels since 1950
(Data from the Energy Information Administration [EIA] of the U.S. Department of Energy [DOE]).
0
5
10
15
20
25
30
1950 1955 1960 1965 1970 1975 1980 1985 1990 1995 2000
Qua
drill
ion
BTU
Imported OilDomestic OilNatural GasCoal
0
5
10
15
20
25
30
1950 1955 1960 1965 1970 1975 1980 1985 1990 1995 2000
Qua
drill
ion
BTU
Imported OilDomestic OilNatural GasCoal
0
5
10
15
20
25
30
1950 1955 1960 1965 1970 1975 1980 1985 1990 1995 2000
Qua
drill
ion
BTU
Imported OilDomestic OilNatural GasCoal
As a percentage of total oil consumed in the United States, transportation represents 67 percent with the remaining 33 percent consumed as petrochemical feedstock. Figure 6 shows that the other primary fuels—namely coal, natural gas, nuclear, hydroelectric, wind, and solar—are supplying the electric and process heat requirements of the nation and are not available to the transportation sector in any significant way.
11

Figure 6. U.S. Energy Consumption since 1950
(Data from the EIA of U.S. DOE).
0.00
20.00
40.00
60.00
80.00
100.00
120.00
140.00
1950 1960 1970 1980 1990 2000 2010 2020
Quad
rillio
n BT
U
OtherHydroelectricNuclearCoalNatural GasOil TransportationOil Products
13
27
23
23
8.1
3.42.8
Heating and Electric Power
0.00
20.00
40.00
60.00
80.00
100.00
120.00
140.00
1950 1960 1970 1980 1990 2000 2010 2020
Quad
rillio
n BT
U
OtherHydroelectricNuclearCoalNatural GasOil TransportationOil Products
13
27
23
23
8.1
3.42.8
Heating and Electric Power
Does it matter that the transportation sector is so dependent on only one fuel? Consider Figure 7 (employment data from the U.S. Bureau of Labor Statistics and significant oil disruptions from the U.S. Department of Energy). While the established trend of growth in jobs in the United States is about three million jobs per year, over the last three decades significant economic stalls or job losses have interrupted this trend and account for perhaps as many as 30 million jobs that were not created. These discontinuities in the employment curve correlate completely with significant disruptions in oil supply (those over two million barrels per day) and are primarily related to turmoil in the Middle East and other Organization of Petroleum Exporting Countries (OPEC) countries.
01970 1974 1978 1982 1986 1990
U.S. Employment (Millions)
20
40
60
80
100
120
140
160
2
4
6
Supply Disruptions (Mbopd)
Arab Oil Embargo
8 mo.
6 mo.
9 mo.
14 mo.
1994 1998 20020
2006
15 million jobs
2 mo.
30 million jobsIran
Revolution
Iran/Iraq War Iraq
Invades Kuwait
OPEC Cuts
Production
Natural Gas Disruption
of 2000
Venezuela Strike
3 mo.
01970 1974 1978 1982 1986 1990
U.S
. Em
ploy
men
t (M
illion
s)
20
40
60
80
100
120
140
160
20
40
60
80
100
120
140
160
2
4
6
Oil
Supp
ly D
isru
ptio
nsM
illion
s of
bar
rels
of o
il pe
r day
(Mbo
pd)
Arab Oil Embargo
8 mo.
6 mo.
9 mo.
14 mo.
1994 1998 20020
2006
15 million jobs
2 mo.
30 million jobsIran
Revolution
Iran/Iraq War Iraq
Invades Kuwait
OPEC Cuts
Production
Natural Gas Disruption
of 2000
Venezuela Strike
3 mo.
01970 1974 1978 1982 1986 1990
U.S. Employment (Millions)
20
40
60
80
100
120
140
160
20
40
60
80
100
120
140
160
2
4
6
Supply Disruptions (Mbopd)
Arab Oil Embargo
8 mo.
6 mo.
9 mo.
14 mo.
1994 1998 20020
2006
15 million jobs
2 mo.
30 million jobsIran
Revolution
Iran/Iraq War Iraq
Invades Kuwait
OPEC Cuts
Production
Natural Gas Disruption
of 2000
Venezuela Strike
3 mo.
01970 1974 1978 1982 1986 1990
U.S
. Em
ploy
men
t (M
illion
s)
20
40
60
80
100
120
140
160
20
40
60
80
100
120
140
160
2
4
6
Oil
Supp
ly D
isru
ptio
nsM
illion
s of
bar
rels
of o
il pe
r day
(Mbo
pd)
Arab Oil Embargo
8 mo.
6 mo.
9 mo.
14 mo.
1994 1998 20020
2006
15 million jobs
2 mo.
30 million jobsIran
Revolution
Iran/Iraq War Iraq
Invades Kuwait
OPEC Cuts
Production
Natural Gas Disruption
of 2000
Venezuela Strike
3 mo.
Figure 7. Employment and Major Petroleum Supply Disruptions in OPEC Era.
12

EMISSIONS Considerable progress has been made on emissions with volatile organic compounds (VOCs), carbon monoxide (CO), and particulate matter smaller than 2.5 microns (PM 2.5) decreasing, even with increasing VMT. Carbon dioxide (CO2) emissions have closely paralleled the growth in VMT. The values in Figure 8 are indexed with the year 2000=1. So as to provide some sense of scale, it should be noted that in 2000 emissions were CO2/1635 million short tons (MST), CO/68 MST, nitrogen oxides (NOX)/8.15 MST, VOCs/5.04 MST, sulfur oxides (SOX)/0.31 MST, and PM 2.5/0.21 MST. On-road transportation accounted for 25.4 percent of all CO2 emissions in 2000 in the United States, and with increased travel, the actual emission volume is expected to continue to climb (U.S. Department of Transportation 2007).
Figure 8. Road Vehicle Emissions since 1990 (U.S. Department of Transportation 2007).
0
0.2
0.4
0.6
0.8
1
1.2
1.4
1.6
1.8
1990 1991 1992 1993 1994 1995 1996 1997 1998 1999 2000Roa
d Tr
ansp
orta
tion
Emis
sion
s In
dex
2000
=1
NOX SOX PM 2.5 VOC CO2 CO VMT
SAFETY Finally, from a safety perspective, Figure 9 shows that slightly over 50 percent of fatal crashes involve speeds above 55 miles per hour, and significantly more fatal crashes occur on rural roads than urban roads. Total roadway fatalities in 2005 were 43,443—an order of magnitude more than were killed in the 9/11/2001 terrorist attack—and these fatalities occur annually. Although the absolute number of fatalities has been fairly constant, the number per 100 million vehicle-miles has declined from 2.1 in 1990 to 1.45 in 2005 (Figure 10). Injuries due to vehicle crashes in 2005 were 2.7 million, and total crashes numbered 6.3 million. Safety issues cost the nation over $231 billion annually in lost productivity, medical costs, and
13

property damage (U.S. Department of Transportation 2003). In Texas, there were 3769 traffic fatalities.
15
17
19
21
23
25
1990
1991
1992
1993
1994
1995
1996
1997
1998
1999
2000
2001
2002
2003
2004
2005
Fata
l Cra
shes
(100
0s)
Over 55 mph Under 55 mph Rural Urban
Figure 9. Fatal Crashes since 1990 (U.S. Department of Transportation 2007).
0.80
1.00
1.20
1.40
1.60
1.80
2.00
2.20
1990
1991
1992
1993
1994
1995
1996
1997
1998
1999
2000
2001
2002
2003
2004
2005
Inde
x 19
90 =
1
Fatalities InjuriesCrashes VMTFatalities/100 Million VMT
Figure 10. Fatalities per 100 Million VMT since 1990
(U.S. Department of Transportation 2007).
14

ROADWAY COSTS As the inventory of roads in the state increases, there is an increase in the funds required just to maintain current infrastructure. In Figure 11, it is plain that maintenance, administration, and debt retirement for current roadways are consuming 50 percent of transportation spending, with the remaining 50 percent available for roadway expansion or new infrastructure. Even though TxDOT scores well in the Reason Foundation ranking of state departments of transportation (DOTs) for their efficiency, adequate funding for transportation infrastructure falls short. Compounding the challenge is a steadily increasing cost of construction, as shown in Figure 12 (NCHRP 2006).
0
20
40
60
80
100
120
140
160
1945 1947 1949 1951 1953 1955 1957 1959 1961 1963 1965 1967 1969 1971 1973 1975 1977 1979 1981 1983 1985 1987 1989 1991 1993 1995 1997 1999 2001 2003
YEAR
BIL
LIO
NS
OF
DO
LLA
RS
DEBT RETIREMENT
ADMINISTRATION, HIGHWAY LAW ENFORCEMENT, & BOND INTEREST
MAINTENANCE
CAPITAL OUTLAY
Figure 11. Total Disbursements for Highways by Function (NCHRP 2006).
Figure 12. Indexed Cost of Highway Construction (NCHRP 2006).
15

Finally, to put the Texas challenge into national perspective, Table 3 provides a comparison between Texas and the nation as a whole.
Table 3. Texas in Context.
Measure United States Texas Comparison Miles of Public Roads 4,010,000 304,171 7.6 percent Miles of State DOT–Owned Roads 781,812 79,648 10.2 percent Interstates—Miles 46,873 3,233 6.90 percent Road Bridges 591,078 47,768 8.08 percent Registered Automobiles and Light Trucks (Millions) 231.9 13.4 5.78 percent Registered Heavy Trucks 8,500,000 155,000 1.82 percent Geographic Area—Square Miles 3,500,000 261,797 7.48 percent Population 296,410,404 22,859,968 7.71 percent Labor Force 134,254,928 9,969,293 7.43 percent Population Density—People/Square Mile 79.6 79.6 Percentage of Population in Urban Areas 79 percent 80 percent Median Household Income $46,242 $39,842 86.2 percent Gross State or National Product (Billions) $12,500 $989 7.91 percent Vehicle Miles Traveled (Billions) 2,990 235 7.86 percent Gross State Product (GSP) or Gross National Product (GNP) per Capita $42,171 $43,278 103 percent GSP or GNP per Worker $93,106 $99,238 107 percent VMT per Capita 10,087 10,280 102 percent VMT per Worker 22,271 23,572 106 percent Percent Workers Commuting Alone 77.0 percent 79.4 percent Percent Workers Carpooling 10.7 percent 12.5 percent Percent Commuters Using Public Transport 4.6 percent 1.7 percent Traffic Fatalities 43,443 3,504 8.07 percent Traffic Fatalities per 100 Million VMT 1.45 1.49 1.03 Freight Shipment by Origin—Value (Billions) $8,397 $589 7.01 percent Freight Shipment by Origin—Tons (Billions) 11.67 1.08 9.25 percent Freight Shipment by Origin—Ton-Miles (Billions) 3,137 229.8 7.33 percent Mean Travel Time to Work—Minutes 25.10 24.60 98.01 percent Transportation Energy Consumption per Capita 93.10 121.90 130.93 percent
A VIEW INTO THE FUTURE In their paper titled “The Future Mobility of the World Population,” Andreas Schafer and David Victor (2000) were interested in building tools to aid in long term policy planning and recognized that the modeling tools typically used for transportation planning are focused on specific traffic flows, numbers of cars on the road at various times of the day, trip rates, relative prices of transport modes, and incomes. These models are built on relationships that are only poorly known. In addition, energy or emissions modeling is typically built by extrapolating past trends and may offer glimpses into some potential future scenarios but offer little guidance on which future scenarios are most likely 30, 40, or 50 years into the future. Schafer and Victor developed their model to project total mobility and the modal split at a regional or global aggregate level to provide some long term planning guidance. Two core elements on which their model is built are the traveler’s budget constraints of time and money.
16

People around the world are willing to spend on average only about 0.8 to 1.5 hours per day per capita traveling, with the world average being 1.1 hours per day. This is an empirically observed phenomenon that is likely based on the family or home as a basic human organizational unit and the demands of time for sleep, work, leisure, and eating, leaving a finite time allowable for travel in a typical day. This is known as the travel time budget, and as illustrated in Figure 13, it is relatively constant around the world in various gross domestic product (GDP) per capita environments.
People around the world on average are willing to spend only about 0.8 to 1.5 hours per day per capita traveling. This is known as the travel time budget.
Figure 13. Travel Time Budget versus Per Capita GDP (Schafer and Victor 2000).
The travel money budget is also shown to be predictable with growth as motorization of travel increases and then stabilization in the 10 to 15 percent range of the GDP. Fuel price shocks, economic recessions, and fluctuations in new car prices have not been able to destabilize the travel money budget as a percentage of GDP. As incomes rise, however, actual spending on travel increases, and a relationship between income and mobility is observed, with higher incomes allowing greater mobility. The rise of the travel money budget from 3 to 5 percent of GDP to 10 to 15 percent is largely due to the transition from public modes to private automobiles, but even within modes, the relationship of increasing mobility with increasing income holds.
17

The travel money budget is stabilized at about 15 percent of GDP. As incomes rise, however, actual spending on travel increases, and vehicle miles traveled (mobility) increases. This relationship suggests a growing economy will demand more mobility.
Vehicle miles traveled per capita in the United States has paralleled increases in GDP per capita as illustrated in Figure 14 using data from 1960 to 2005. Using this historical trend we might expect 25,000 VMT/capita in 2050—a 250 percent increase from today’s traffic demand. Coupling this GDP–VMT relationship with continued expectations of GDP growth and the observation of a relatively constant travel time budget, it becomes obvious that higher speed modes of travel will be in demand. Schafer and Victor (2000) modeled four modes including cars, buses, rail, and air travel with mean travel speeds for each mode being 55 kilometers per hour (kmph), 20 kmph, 30 kmph, and 600 kmph, respectively. For North America, they forecast a peaking of automotive transport as a percentage of total mobility in 2010 at approximately 22,000 passenger kilometers per capita (pkm/cap) with higher speed modes growing four-fold to 71 percent of pkm but only representing on average 17 percent of the travel time budget due to the high speeds. The absolute mobility satisfied by a given mode will increase (such as a 260 percent increase in pkm traveled in cars globally by 2050) even for modes that are in relative decline. Technologies that alter the modal choices will shift the forecast, but technologies such as intelligent transportation systems (ITS) enabling a 15 percent speed increase will only reportedly shift the auto share peak in the United States by approximately four years (Schafer and Victor 2000). Due to the four-decade time span of this forecast, it is realistic that new modes operating at significantly higher speeds will extend the auto mobility, but a significant increase in speed would be required.
2003
1960
U.S. GDP/Capita ($1000s)
$40.00$35.00$30.00$25.00$20.00$15.00
11.00
4.00 5.00 6.00 7.00 8.00 9.00
10.00
U.S
. VM
T/C
apita
(100
0 m
iles)
3.00 $10.00
Figure 14. U.S. Per Capita VMT versus
Per Capita GDP.
18
This view of an increasing modal share shifting significantly to faster modes other than the automobile over the next 50 years is not contemplated in the March 2007 American Association of State Highway and Transportation Officials (AASHTO) recommendations to the Surface Transportation Policy and Revenue Study Commission. Its immediate concern is rightly focused on the current architecture. In the Federal Program Recommendations there is the statement that “the federal program’s purpose should be to support the national vision and funding for a surface transportation system that improves America’s economic competitiveness; strengthens the National Defense; gives the states the needed opportunity to provide needed mobility; and improves safety, energy efficiency, and environmental compatibility” (AASHTO 2007). The bold goals for surface transportation expressed by AASHTO, however, are to double transit ridership; preserve the interstate highways for the next 50 years; add as much new interstate capacity as was added in the last 50 years; reduce highway fatalities, congestion, and energy consumption; and improve air quality through unspecified means. Contemplation and encouragement of new modes and capabilities for a 21st century system with higher speeds and lower costs appear lacking. Indeed transit, which is losing market share even with increasing funding, is specified as the technology bet for the future. A bold new vision that recognizes the importance of mobility to the economy and embraces more mobility and higher ground transportation speeds is required.
A bold new vision that recognizes the importance of mobility to the economy and embraces more mobility and higher ground transportation speeds is required.
WHY FOCUS ON AUTOMATION The majority of traffic crashes are due to driver error, so removal of dependence on the driver, especially at higher speeds, is postulated to reduce crashes, assuming system design reliability. This clearly surfaces the issue of liability—who is responsible for control of the vehicle? Another reason to automate is to shorten reaction times by using computers and sensors, which provide full attention to their design task and exhibit extremely fast reaction times. Highway capacity curves (Figure 15) are all based on how people behave when presented with increased traffic density. To the left of the peak, vehicle densities are low enough that an increase in density or speed will increase traffic flow volume measured in vehicles per hour per lane. Above free-flow densities of about 50 vehicles per mile, drivers make a judgment of the safe following distance to the cars ahead and adjust their speeds accordingly by easing off the accelerator or even hitting the brakes. Thus, to the right of the peak on the capacity curve, increasing vehicle density slows velocity and reduces throughput capacity. This action essentially causes a shock wave in traffic flow that propagates upstream (Shladover et al. 2001). Hence, one method to increase highway capacity would be to use automation technology to remove the driver from the reaction sequence by installing sensors and throttle controls to maintain the gap between vehicles.
19
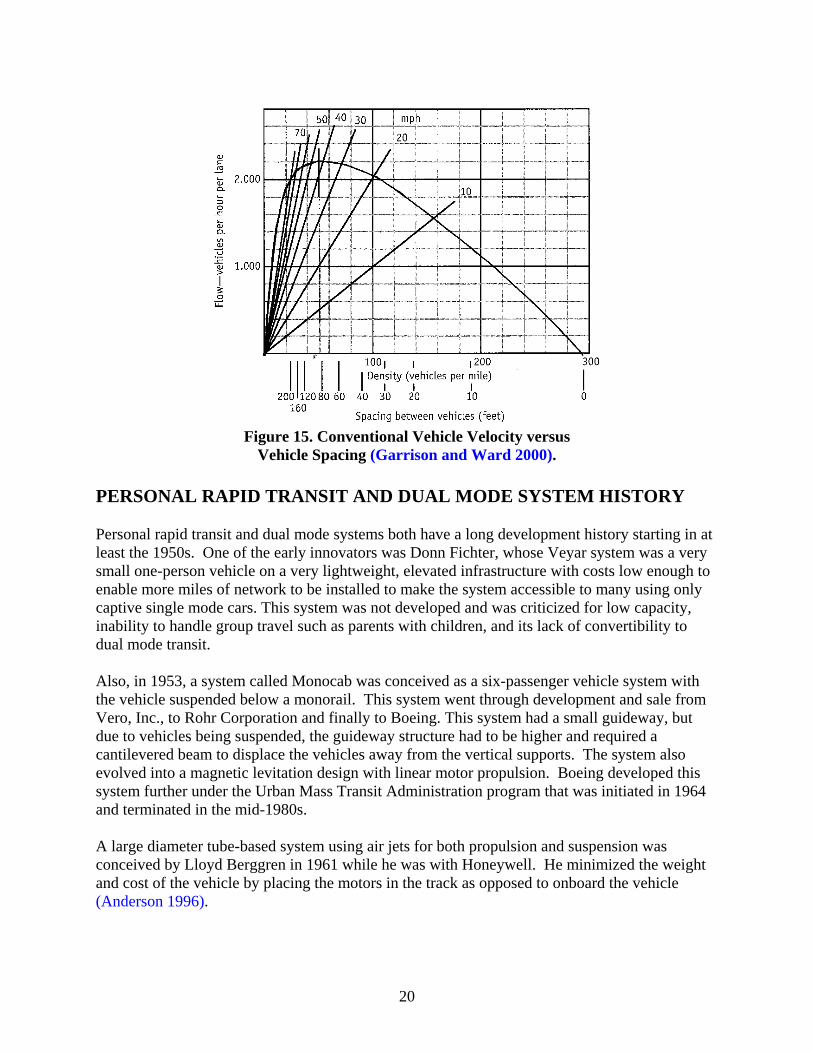
Figure 15. Conventional Vehicle Velocity versus
Vehicle Spacing (Garrison and Ward 2000).
PERSONAL RAPID TRANSIT AND DUAL MODE SYSTEM HISTORY Personal rapid transit and dual mode systems both have a long development history starting in at least the 1950s. One of the early innovators was Donn Fichter, whose Veyar system was a very small one-person vehicle on a very lightweight, elevated infrastructure with costs low enough to enable more miles of network to be installed to make the system accessible to many using only captive single mode cars. This system was not developed and was criticized for low capacity, inability to handle group travel such as parents with children, and its lack of convertibility to dual mode transit. Also, in 1953, a system called Monocab was conceived as a six-passenger vehicle system with the vehicle suspended below a monorail. This system went through development and sale from Vero, Inc., to Rohr Corporation and finally to Boeing. This system had a small guideway, but due to vehicles being suspended, the guideway structure had to be higher and required a cantilevered beam to displace the vehicles away from the vertical supports. The system also evolved into a magnetic levitation design with linear motor propulsion. Boeing developed this system further under the Urban Mass Transit Administration program that was initiated in 1964 and terminated in the mid-1980s. A large diameter tube-based system using air jets for both propulsion and suspension was conceived by Lloyd Berggren in 1961 while he was with Honeywell. He minimized the weight and cost of the vehicle by placing the motors in the track as opposed to onboard the vehicle (Anderson 1996).
20

In the early 1960s, a dual mode concept called Urbmobile was developed at Cornell Aeronautic Laboratories. This system showed how short headway distances of one-half second could be safely achieved to increase system throughput capacity. The vehicle seated four passengers and used an all electric propulsion system with a 40-mile range. In a preliminary study of this system by the New York State DOT, the system was judged capable of converting 11 percent of automobile users to the new mode using a simple 17.4-mile trunk line route providing access to 136,000 households in the city of Rochester, New York. The system also contemplated the options of privately owned, long term lease access rights, public transit pay-per-use single mode, and minibus public transit vehicles using a common infrastructure (Fichter 1970, Anderson 1996). Between 1968 and 1976, the Aerospace Corporation, a non-profit Federally Funded Research and Development Center, applied its systems engineering and technical talent to transportation challenges, viewing the congestion in central business districts, air emissions, and oil shortages (a need for alternative energy) as serious problems of the day. This program studied the network layout, propulsion and control systems, safety, and traffic management issues; and then progressed to experimental work in propulsion and control, and ultimately to one-tenth scale modeling. The entire effort is well documented in a book titled Fundamentals of Personal Rapid Transit by Jack Irving, who was at the time a vice president of Aerospace Corporation. The Aerospace system was later used as the basis for the Taxi 2000 system, which is active today but offers only a personal rapid transit (PRT) version and not a dual mode capability (Irving 1978, Anderson 1996). Efforts in Japan contributed a computer-controlled vehicle system (CVS), which was a one-second headway, 2000 pound, four-passenger PRT concept. A German system developed by Messerschmitt-Bolkow-Blohm (MBB) and DEMAG called Cabinentaxi supported one vehicle above and one vehicle below the guideway. The three-person vehicles ran on rubber tires and were propelled by linear induction motors. This system was licensed by Ratheon, and studies for its application in Indianapolis were conducted. Additional international development efforts were conducted in Canada, Australia, Sweden, and Great Britain (Anderson 1996). Numerous other early innovators, including General Motors, Raytheon, General Research Corporation, IBM, Mitre Corporation, Parsons Company, LTV Aerospace Corporation, Honeywell, Renault Engineering, Bendix, Ford Motor Company, and Otis Elevator Company, contributed to the development of PRT and dual mode concepts. Many universities and research institutes were also engaged, including MIT, John Hopkins, Ohio State, University of Minnesota, San Diego State, Battelle Columbus Laboratories, Aerospace Corporation, Jet Propulsion Lab, and Booz-Allen Applied Research. Much of this early work is collected in proceedings of PRT conferences in 1972, 1974, and 1976, published by the University of Minnesota and edited by Edward Anderson and Sherry Romig (Anderson and Romig 1973). An additional collective source is the Transportation Research Board (TRB) Special Report 170 titled Dualmode Transportation, which recorded the proceedings of a TRB conference conducted May 29–31, 1974. This conference focused on dual mode and included sessions on concepts, user considerations, command and control, lateral control, station planning, reliability and maintenance, longitudinal control, propulsion and energy, capacity and safety, and guideway
21

design. The general conclusions of this 1974 conference were that dual mode was technically feasible, with the remaining technical challenges being the choice among candidate system and subsystem configurations and the experimental component, subsystem, and full system testing including analysis of failure modes and effects, reliability, and safety and performance testing. The larger challenges were viewed to be the typical institutional barriers of implementing any new public system including technological uncertainty, financial risk, institutional inertia, restrictive laws and union work rules, establishment of national and international standards, liability questions in the event of an accident, and evolutionary implementation strategies (Transportation Research Board 1976). Because dual mode systems are a hybrid between single mode transit systems and roadway-based operation, it is relevant to also review roadway automation research. More recent work on automated transportation systems was performed in the U.S. Department of Transportation (U.S. DOT) Automated Highway Systems (AHS) program, which was initiated in late 1993 with an aggressive congressional mandate to demonstrate an automated highway and vehicle system by 1997. This work included precursor studies by TRW, MIT, CalSpan, Battelle, Honeywell, SAIC, Lockheed, Ratheon, Mitre Corporation, and Rockwell. The actual AHS program was then managed by the National Automated Highway Systems Consortium (NAHSC), which included as core participants General Motors, Bechtel, Delco Electronics, Hughes, Lockheed Martin, Parsons Brinkerhoff, Caltrans, UC PATH, Carnegie Mellon, and FHWA. Associate partners in the demonstration that took place in 1997 were Eaton, Houston Metro, Honda, Ohio State, Toyota, and ultimately many others (Bishop and Lay 1997). The precursor studies included (FHWA 1994):
• automated check-in, • automated check-out, • lateral and longitudinal control, • malfunction management, • freight and mass transit impact, • deployment and network integration, • urban versus rural comparison, • comparable systems analysis, • vehicle operational analysis, • safety analysis, • propulsion system analysis, • institutional and societal aspects, • cost/benefit analysis, and • infrastructure design optimization and constructability.
Part of the early AHS thinking is reported by Jerry Ward in Automated Highway Systems, edited by Petros Ioannou (1997). Ward proposed an evolutionary sequence toward an automated highway, which progressed from current cruise control, to an intelligent cruise control, to an automated cruise control enabling platooning, and ultimately to fully automated operations including off-guideway travel and advanced traffic management systems/ITS (Figure 16) (Ioannou 1997). In that sequence no modification to infrastructure is required to progress through
22

step three, and only a small investment in special paint or magnetic road markers is required to outfit roads for step four. ITS systems for traffic management, lane departure warning systems, and adaptive cruise control are all features now becoming available on higher end cars (Bishop 2005).
Figure 16. AHS Automation Evolution (Ioannou 1997).
Fully autonomous or driver-commanded autonomous system
Throttle control only in free-flow conditionWith auto-gap to vehicle ahead with throttle control only With auto-gap and auto-brake controlWith auto-gap, auto-brake, and auto-lane control With auto-gap, auto-brake, auto-lane, and auto-platoonACC-2 plus interface with advanced traffic management systems as envisioned with ITS
Cruise Control (CC)Intelligent Cruise Control 1 (ICC-1)Intelligent Cruise Control 2 (ICC-2)Automated Cruise Control (ACC-1)Automated Cruise Control (ACC-2)Automated Cruise Control (ACC-3)
Step 1Step 2Step 3Step 4Step 5Step 6
The AHS program did demonstrate automated vehicle operation in a dedicated lane in San Diego in August 1997, but U.S. DOT reduced their funding support and then unfunded the program in late 1997, deciding instead to support an intelligent vehicle initiative that focused on advanced vehicle control and driver assistance technologies that could be deployed within the decade. This change of direction is discussed further in Chapter 4 of this report.
RECENT PRT STUDIES The most complete recent study of PRT systems was completed in February 2007 by the Voorees Transportation Center at Rutgers in partnership with Booz Allen Hamilton at the direction of the New Jersey state legislature (Carnegie et al. 2007). This study concluded that PRT systems are approaching but are not yet ready for commercial deployment. In addition, the researchers recommended a fully operational PRT system testing facility to verify the theoretical benefits and establish technology readiness. A comprehensive research and development program costing $50 to $100 million over a period of three years was envisioned to mature the technology. The New Jersey study also identified challenges involving the availability of relevant engineering and planning expertise and a complementary institutional framework for support of a new transportation mode, the need for open standards and intellectual property licensing access to encourage competition, and a long term commitment of consistent political, economic, and technical support to avoid the historical pitfalls of changing agendas and political winds that have plagued previous efforts. The study makes travel speed, system capacity, capital cost, operating and maintenance cost, ridership, congestion relief, and energy/emissions comparisons with other public transportation modes as the benchmark. The potential for elevated infrastructure to activate citizen concern as part of a public project development process is noted.
23

PRT systems are evaluated to have an average travel speed of 23 mph compared to the national transit average of 14 mph or heavy rail average of 20 mph. Passenger movement capacities are judged to be equal to or higher than comparable light rail or bus systems with theoretical capacities of 30,000 passengers per hour per direction (pphpd) and expected usage around 10,000 pphpd. Capital costs are estimated to average $30 to $50 million per mile compared to light rail’s average cost of $50 to $70 million per mile and bus rapid transit busways’ average cost of $14 to $25 million per mile. Operating and maintenance costs of 40 cents/passenger-mile are slightly higher than heavy rail (33 cents/passenger-mile) and lower than light rail (55 cents/passenger-mile) and the U.S. average bus (72 cents/passenger-mile). PRT systems are expected to generate less noise pollution with 43 to 65 decibels (dB) compared to subways (90 dB) or highways (70 dB), but the visual impact is much greater due to the expected elevated infrastructure. Finally, energy use at 0.6 kilowatt hours per passenger mile (kWh/passenger-mile) compares favorably with the auto (1.65 kWh/passenger-mile), motor bus (0.95 kWh/passenger-mile), and light rail (2.9 kWh/passenger-mile). Four options are presented for consideration with progressively more state involvement and support. These range from simple monitoring to full research and pilot demonstration. The more expensive options provide the opportunity for more leadership and steering of the development to New Jersey applications but also carry the increased financial risk of longer term state-supported development. A separate study supported by the European Union (EU) and four European cities used the acronym EDICT (Evaluation and Demonstration of Innovative City Transport). This was a 36-month project completed in November 2004 and funded by an EU energy, environment, and sustainable development program looking for alternatives to the car that could also complement existing forms of public transport (CIRT et al. 2001). This study applied a PRT system to four specific city environments and evaluated the impact based on factors including:
• transport efficiency and quality, • safety and security, • accessibility, • environment, • economy, • integration with other policies, • distribution and equity, • user acceptance and stakeholder support, • funding and procurement, • risks, and • political context and decision making process.
In the application environments, the system generally was cheaper than conventional public transport and was able to cover operation and maintenance costs plus most but not all of the capital cost amortization. In social cost-benefit terms, the rate of return was judged to be positive.
24

CURRENT DEPARTMENT OF ENERGY AND DEPARTMENT OF TRANSPORTATION TECHNOLOGY PATHWAYS ITS/VII Intelligent transportation systems are intended to improve transportation safety and mobility and enhance productivity through the use of 16 communications-based and electronics technologies (ITS/VII 2007). These technologies are grouped into intelligent infrastructure systems and intelligent vehicle systems. The infrastructure products include: arterial management, freeway management, transit management, incident management, emergency management, electronic payment, traveler information, information management, crash prevention and safety, roadway operations and maintenance, road weather management, commercial vehicle operations, and intermodal freight. The intelligent vehicle system includes collision avoidance systems, driver assistance systems, and collision notification systems. The Vehicle Infrastructure Integration (VII) program is a part of this ITS effort. The VII initiative is using dedicated short range wireless bandwidth to support vehicle-to-vehicle and vehicle-to-infrastructure communication. This communication infrastructure is intended to prevent intersection collisions and road departure collisions, which account for 50 percent of the crashes and fatalities on U.S. roads. Intersection crashes alone account for 17 percent of highway fatalities and cost the United States $124 billion per year. The infrastructure is also intended to reduce congestion and improve travel time reliability by enabling better operational management of roads and enabling more informed drivers. Mobility applications include cooperative adaptive cruise control, in-vehicle signage, weather alert notices, icy bridge warnings, incident observation, and roadway incident assistance. Consumer and commercial services include parking location assistance, food drive-through payment, roadway toll payment appointment confirmation changes, data download capability, remote diagnostics, etc. In general, however, data processing, decision making, and liability still rest with the driver. The VII program is managed by a coalition including U.S. DOT (Federal Highway Administration [FHWA], National Highway Traffic Safety Administration [NHTSA], and Federal Motor Carrier Safety Administration [FMCSA]), AASHTO (12 state departments of transportation—Indiana, Minnesota, Michigan, Idaho, Connecticut, Florida, California, Utah, New Jersey, New York, Washington, and Virginia), and the automobile manufacturers (BMW, Chrysler, Ford, GM, Nissan, Toyota, and Volkswagon). A proof-of-concept system is currently operating over 20 square miles in the Detroit area to test the operational benefits and institutional assumptions involved in delivering services using the new capability. Provided that testing is successful, a decision to deploy nationwide is planned for December 2007. PNGV Parallel with the AHS program there was a Partnership for New Generation Vehicles (PNGV), which was a partnership between the U.S. auto manufacturers and eight federal agencies including the Departments of Energy, Commerce, Defense, Interior, and Transportation, the Environmental Protection Agency, the National Aeronautics and Space Administration (NASA),
25

and the National Science Foundation to develop a vehicle prototype that could achieve 80 miles per gallon (mpg) at the level of performance, utility, and cost of ownership that today’s consumers demand. That program focused on reducing vehicle weight, increasing engine efficiency, combining internal combustion engines with electric motors to provide hybrid systems, implementing regenerative braking systems, and exploring fuel cell power plants. The program had some successes, with GM creating an 80 mpg concept vehicle called Precept, Ford unveiling the 72 mpg Prodigy, and Chrysler introducing the 72 mpg ESX-3. All concept vehicles developed were diesel hybrids (Transportation Research Board 2001). The program was cancelled in 2001 at the request of the automakers with some aspects shifted to the FreedomCAR program. Fuel efficiency gains have been made as shown in the following three figures (Figure 17 to Figure 19), where the metric is ton-mpg, or the miles per gallon to move a ton of vehicle weight. In parallel, however, the weight and acceleration power of vehicles have been increased such that actual fuel economy has been flat since 1986 (Heavenrich 2006). FreedomCAR The FreedomCAR and Fuel Partnership is a collaboration between the U.S. government, led by the Department of Energy; and the U.S. Council for Automotive Research (USCAR), whose members are Ford, GM, and DaimlerChrysler along with five major energy companies, BP America, Chevron, ConocoPhillips, ExxonMobil, and Shell Hydrogen USA. This program is managed through the DOE Office of Energy Efficiency and Renewable Energy (EERE). The FreedomCAR program was framed around the goals of achieving freedom from dependence on imported oil, freedom from pollutant emissions, freedom of mobility and vehicle choice, and freedom to obtain fuel affordably and conveniently (National Academy of Engineering 2005). The program’s goals align with many of the benefits anticipated by the use of dual mode vehicles, but the major research thrust of this program is geared toward the high volume production of hydrogen fuel cell vehicles and a national hydrogen infrastructure necessary to support them.
Figure 17. Ton-mpg by Model Year Using a
Three-Year Moving Average (Heavenrich 2006).
26

Figure 18. Total Fleet CAFE Performance
(National Highway Traffic Safety Administration 2003).
Figure 19. Vehicle Weight and Performance
since 1975 (Heavenrich 2006). As is obvious from this brief review, the tangled network of technologies, institutional jurisdictions, regional differences, and research directions is complex. The institutional environment alone involves 52 state-level entities, 3066 counties, 153 municipalities with populations over 200,000, 463 cities with populations over 50,000, and thousands of small towns (ITS/VII 2007). PRT systems are single mode, whereas dual mode systems have the added complication of ingress and egress from a high performance guideway with check-in and check-out procedures. The challenge reaches beyond just safety or congestion. Transformational impact on the energy and emissions front is required while also delivering new value propositions to travel service users by enabling automated ground travel/routing in a private or
27
freight vehicle at higher speeds than today’s highways. This is a challenge broader than any of the previously discussed programs, and the effort required for proper evaluation and development should not be underestimated. This is an Apollo mission challenge to catapult the United States into a new 21st century transportation network reality.
The dual mode challenge reaches beyond safety and congestion to attempt transformational change in energy and emissions performance while delivering higher speed automated ground travel and routing for both people and goods movement. This is an Apollo mission challenge to catapult the United States into a new 21st century transportation network reality.
EFFICIENCY MYTH Huber and Mills point out a common misunderstanding that efficiency gains in internal combustion engines will reduce actual fuel consumption while accommodating economic growth (Huber and Mills 2005). A review of transportation energy consumption for the United States in fact shows that efficiency gains beget higher consumption (Figure 20). Even when normalized for population increases, energy consumption increases. This is not to suggest that efficiency gains are bad, just misunderstood. They increase productivity, and the increased productivity is then used to deliver more value, whether in the form of safety, comfort, speed, time savings, or more widely available mobility choices.
Fuel efficiency gains beget higher consumption because increased productivity is used to deliver more value in the form of safety, comfort, speed, time savings, or more widely available mobility choices.
This is no different than the manufacture of more transistors on a given semiconductor chip, providing more computational capability for a lower cost. It does not result in fewer chips being manufactured but rather leads to more purposes being discovered for the use of semiconductor chip sets and hence increased consumption. This is the basis on which pre-competitive collaboration can be agreed upon among fiercely competitive semiconductor manufacturers, as evidenced by the ongoing health of the SEMATECH consortium. The end result is increased growth of the total market and hence an increase in potential for all competitors.
28

U.S. Energy Consumption (quadrillion btu/yr)Energy Cost of Economy (1000 btu/$GDP)VMT/Non-farm Employee (1000s miles)
Ener
gy C
ost o
f Eco
nom
y or
VM
T pe
r Non
-farm
Em
ploy
ee
23.00
21.00
19.00
17.00
15.00
13.00
11.00
9.00
7.00
2005
2001
1997
1993
1985
1989
1981
1977
1973
1969
1965
1961
1957
1953
1949
110.00
40.00
50.00
60.00
70.00
80.00
90.00
100.00U
.S. E
nerg
y C
onsu
mpt
ion
30.00
Figure 20. Comparison of Total Energy Consumption, Energy Intensity, and VMT.
29


3. DUAL MODE TECHNOLOGY EVALUATION
SYSTEM REQUIREMENTS As mentioned previously, numerous previous studies of PRT and dual mode systems have been conducted, with many of these studies from the 1960s and 1970s. Particularly detailed work has been performed and made public by the Aerospace Corporation and Dr. Edward Anderson. An active collection of developments is also maintained on Dr. Jerry Schneider’s website, http://faculty.washington.edu/jbs/itrans/, from which a list of systems has been extracted and incorporated herein as Appendix B. From the literature a list of system requirements for a dual mode transportation architecture was developed and is summarized as follows. The system:
• must provide mixed-use characteristics—accommodate freight, mass transit, and personal vehicles;
• should use zero or ultra-low emissions vehicles; • should be user scheduled—efficient and accessible 24/7/365 on demand; • must have guideway speeds that have a constant velocity—guaranteeing reliability of
travel times with traffic flow control and excess exit capacity designed to prevent impairment of the constant velocity feature (intercity speeds of approximately 130 mph, urban highway equivalents at 65 mph, urban arterials at 32.5 mph, and neighborhood local guideways at 16.25 mph; urban bypass routes could maintain 130 mph; vehicles may move in platoons [groups of 5 to 10] with 100 to 150 ft between platoons);
• should have throughput capacity at least four times that of conventional highway lanes in the urban environment and eight times that of conventional highway lanes in the intercity environment—this requires short headway between vehicles and may dictate a requirement for more than tire/pavement frictional braking capabilities for emergency use;
• should have direct origin-to-destination service with no intervening stops while in guideway mode;
• should have an elevated or underground guideway to avoid at-grade conflicts and minimize right-of-way requirement and noise/visual footprint of the system;
• should be compatible with remote automated parking systems; • should be capable of single mode PRT operation for people movement and be cost-
effective for low/medium density population areas (2000 to 2500 person/square mile); • should have operation on the guideway in automated mode—driverless while on the
guideway; • should preferably have public-private financial backing for the new system—users repay
capital, operating and maintenance, energy costs, and financial return to investors; • must be capable of modular, incremental acquisition and be scalable to a national
network; • should maximize the use of existing rights-of-way and interface to capillary roads in a
seamless manner;
31

• should provide security and privacy for individual or small groups traveling together by choice—door-to-door service in the same cabin;
• should have an evolutionary path to the final network vision that is plausible—perhaps PRT/mass transit in urban areas and a terminal-to-terminal captive system for freight with later ability to join mass transit systems and freight links to create a full network accessible to private dual mode vehicles;
• should have a guideway design that is modular for factory construction and on-site easy assembly/replacement and accelerated build time;
• should consider a triple lane guideway—one in each direction and the middle one for diverted traffic in event of maintenance/repair/contra-flow needs;
• should be able to accommodate cars of the rough size/shape of today’s conventional cars and about 3000 lb load per vehicle including vehicle and occupants (freight vehicle to handle two pallets with about 2000 lb per pallet and allowing about 2000 lb vehicle weight; two pallet sizes/shapes to fit within 5 ft × 5 ft × 10 ft envelope; actual size and weight limits are to be optimized and negotiated through competitions and impact analyses);
• should be designed for all-weather operation without impact to performance or safety; • must be able to accommodate those with disabilities; • should use vehicles that use stationary electric grid power while mobile on the guideway; • should enable terminal-to-terminal automated/driverless freight movement; • must have safety that is better than automobile statistics—reduce high speed crashes to
less than 5 percent of current highway performance for traffic converted to guideway; • must be designed so that the reliability of vehicles on the guideway system renders the
probability of breakdowns on the guideway to the range of 10 to 100 disabilities per 100 million vehicle miles with clear strategies for removal of disabled vehicles;
• must be economically competitive with a moving baseline design of internal combustion engine/electric hybrid automobiles; and
• should have a guideway that optionally provides hardened infrastructure for electrical conduits and communications cables.
TECHNOLOGY OPTIONS The system concepts outlined in Appendix B were reviewed with this list of system requirements in mind to identify 14 systems for further review by a cross-disciplinary team. The 14 selected systems are summarized in Table 4 and Table 5, but the identities of the systems are omitted to avoid commercialization of the project results. A workbook with literature, patent information, and a summary of each system was prepared and provided to attendees of a workshop. Claims by the vendors regarding speed, capacity, efficiency, and cost were not verified at this stage of review. The systems were reviewed briefly in the workshop, and attendees down-selected 5 of the 14 systems based on a list of system ranking elements. There was a clear break between the top tier concepts and the others in the view of the cross-disciplinary workshop attendees.
32

Table 4. Characteristics of the 14 Systems Selected for Ranking.
5263748927,692554341141097133318,685600
31251000320026,4006188
26321872692313861029366333
467125
2250250800
66001547
3.8619
3.51530
2.67201.61051016
20,00044,93627,69249,88814,40016,46140,00049,88812,000500010,00016,000264,00099,000
90-15068-100
180 120
94-12540
80-250120 100 100
38-12580-15060-200
300
A B C D EF GH I JK L M N
Capacity/$ Invested (pph/$)
Capacity/$ Invested (vph/$)
Speed (mph)
Capacity (veh/hr)10,000 11,234 692312,472 3600548710,000 12,472 500
36002500400066,000 24,750
Capacity (passengers/hr)
Cost ($/lane-mile)
System
Table 5. Characteristics Common to Many of the Systems.
FOffers True Dual Mode Capability
NoYesA, B, C, D, E, G, H
J, K, L, M, N
E, H, J, K C, D, F, IE, G, NA, B, L, MAdaptable to Current Vehicle Designs
PartiallyNoYes with Pallet
Feasible Retrofit from Current Car
Designs
Route Switching Mechanical
B Magnetic
M, NOff-Guideway
C, D, GUndefined
A
H, JVehicle Placement Relative to Guideway
BelowAboveA, B, C, D, E, F, G
I, K, L, M, N
Power Transfer to Vehicle Battery
C
Inductive Pick-Up
A, H, L, I, M, N
Rolling Contact
D
Sliding Contact
E, F, G
Uncommitted/NoneB, K, J
Guideway PropulsionRamp Propulsion
WheelMotor
EE
Conventional Electric
A, C, D, F, G, J D, F
Linear Synchronous
H, I, M, NI
Linear Induction
LA, C, G, H
UncommittedB, KB, K
33

The elements used in consideration of the overall system ranking were:
• ability to add utilized capacity per dollar invested; • adaptability to existing networks—urban, intercity, people, and freight movement; • environmental impact—emissions, noise, water resources, land use—footprint/skyprint; • construction speed and ability to avoid current traffic disruption; • relative operational reliability and design robustness; • operational speed and convenience; • potential for public adoption; • handicap accessibility; • safety feature; • robustness of vehicle control/traffic management potential; • logistical robustness; • energy efficiency and primary fuel flexibility; • ability to handle palletized freight—size/shape/load; • vehicle aerodynamics; and • technology readiness/risk/dollars to mature technology.
As shown in Table 6, the average claimed vehicle-per-hour capacity per $1000 of infrastructure investment for the dual mode systems evaluated was 2360 vph/$1000. The comparable number for conventional free-flow interstate traffic would be about 435 vph/$1000, and with conventional highways and all vehicles equipped with advanced cooperative adaptive cruise control (CACC), the metric would be 758 vph/$1000.
Table 6. System Cost Comparison to Conventional Highway Construction Cost.
Speed (mph)
Capacity (vph)
Cost ($1,000,000/lane-mile)
Capacity/$ Invested (vph/$1000)
758435
2360
65
10.3
45502174
13,349
70 70
158
Conv. Hwy. w/ 100% CACC
Conv. Hwy.Avg. Dual Mode
Once the five high graded systems had been identified, the research team initiated the process of identifying the critical technology elements within each system and then evaluating the technology readiness level of that element based on the knowledge of the participants in the workshop. A brief excerpt from the Department of Defense Technology Readiness Assessment (TRA) Deskbook is included in Appendix C and explains the process of identifying critical technology elements and ranking their readiness levels. Basically, a “technology element is ‘critical’ if the system being acquired depends on this technology element to meet operational requirements with acceptable development cost and schedule acceptable production and operation costs, and if the technology element or its application is either new or novel. Said another way, an element that is new or novel or being
34
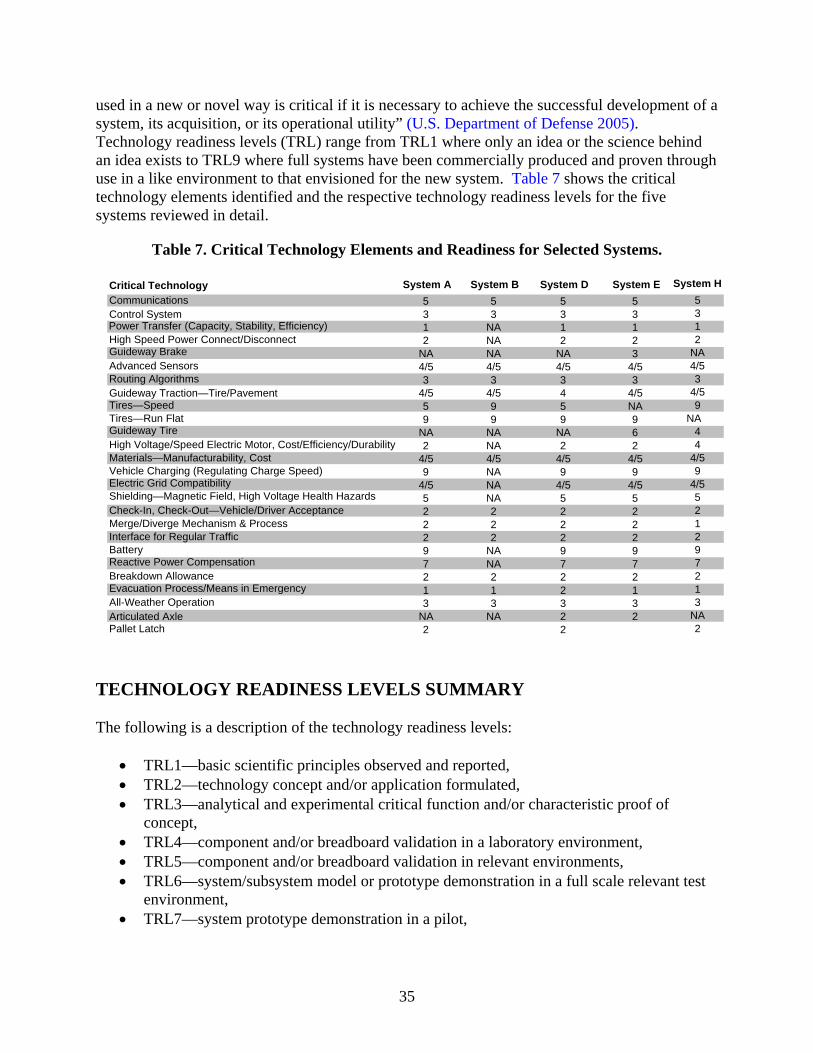
used in a new or novel way is critical if it is necessary to achieve the successful development of a system, its acquisition, or its operational utility” (U.S. Department of Defense 2005). Technology readiness levels (TRL) range from TRL1 where only an idea or the science behind an idea exists to TRL9 where full systems have been commercially produced and proven through use in a like environment to that envisioned for the new system. Table 7 shows the critical technology elements identified and the respective technology readiness levels for the five systems reviewed in detail.
Table 7. Critical Technology Elements and Readiness for Selected Systems.
System HSystem D System A System B System ECritical Technology
TECHNOLOGY READINESS LEVELS SUMMARY The following is a description of the technology readiness levels:
• TRL1—basic scientific principles observed and reported, • TRL2—technology concept and/or application formulated, • TRL3—analytical and experimental critical function and/or characteristic proof of
concept, • TRL4—component and/or breadboard validation in a laboratory environment, • TRL5—component and/or breadboard validation in relevant environments, • TRL6—system/subsystem model or prototype demonstration in a full scale relevant test
environment, • TRL7—system prototype demonstration in a pilot,
Pallet Latch NA NA
Communications 5 5 5 5 5Control System 3 3 3 3 3Power Transfer (Capacity, Stability, Efficiency) 1 NA 1 1 1High Speed Power Connect/Disconnect 2 NA 2 2 2Guideway Brake NANA NA NA 3Advanced Sensors 4/54/5 4/5 4/5 4/5 Routing Algorithms 3 3 3 3 3
4/5 Guideway Traction—Tire/Pavement 4/5 4/5 4/5 4Tires—Speed 9NA 5 9 5Tires—Run Flat 9 9 9 9 NA Guideway Tire 4NA NA NA 6High Voltage/Speed Electric Motor, Cost/Efficiency/Durability 2 NA 2 2 4Materials—Manufacturability, Cost 4/54/5 4/5 4/5 4/5 Vehicle Charging (Regulating Charge Speed) 9 NA 9 9 9Electric Grid Compatibility 4/5 4/5 NA 4/5 4/5 Shielding—Magnetic Field, High Voltage Health Hazards 5 NA 5 5 5Check-In, Check-Out—Vehicle/Driver Acceptance 2 2 2 2 2Merge/Diverge Mechanism & Process 2 2 2 2 1Interface for Regular Traffic 2 2 2 2 2Battery 9 NA 9 9 9Reactive Power Compensation 7 NA 7 7 7Breakdown Allowance 2 2 2 2 2Evacuation Process/Means in Emergency 1 1 2 1 1All-Weather Operation 3 3 3 3 3Articulated Axle Pallet Latch
NA NA 2 2 NA 2 2 2
35

• TRL8—production version system completed and qualified through test and demonstration, and
• TRL9—production version system proven through successful commercial operation. The critical elements in the different systems were largely similar with some variation due to the specifics of a given concept. The critical elements with particularly low readiness levels included:
• power transfer device—the capacity, stability, and efficiency of the power transfer from the stationary element to the moving element particularly at high speed and including the ability to quickly connect and disconnect;
• routing algorithms to be used to manage tens of thousands of fast-moving vehicles in real time with acceptable optimization of traffic flow;
• check-in vehicle inspection and check-out driver control confirmation process—this must be done in motion to avoid interrupted traffic flow conditions or at least very quickly to avoid an excessive choke on throughput capacity;
• merge/diverge switching mechanisms to be used for vehicle routing; and • latching mechanisms to be used to connect vehicles to pallets or boggies that are captive
to a guideway.
To move forward, a hybrid “best system” needs to be developed. This will require focused engineering and system integration together with critical mass funding.
Although all systems evaluated in detail included several elements with low technology readiness levels, there was general consensus that there are no new scientific discoveries required for dual mode technology development. The challenges appear to be more engineering, funding, and policy related than technology limited. To move forward, a hybrid “best system” needs to be developed. This will require focused engineering and system integration together with critical mass funding. A more rigorous simulation of the impacts of a dual mode system is required to speed the rate of experimentation and verify the costs/benefits so that a dominant design emerges through market competition. In the final analysis, no acceptable systems were judged to be ready for demonstration, but in the opinion of the research team a system could be progressed to TRL9 within 7 to 10 years with proper support.
A more rigorous simulation of the impacts of a dual mode system is required to speed the rate of experimentation and verify the costs/benefits so that a dominant design emerges through market competition.
Based on the conclusions from the workshop, the original plan to have vendors engage in a proposal process for demonstrations was determined to be premature, and the remaining research tasks were modified to explore the pathways to accelerate dual mode technology development.
36

No acceptable systems were judged to be ready for demonstration, but in the opinion of the research team a system could be progressed to TRL 9 within 7 to 10 years with proper support.
37


4. A PATH FORWARD—EFFECTING NETWORKED SYSTEM CHANGE
The fifth task in this project was to identify methods of accelerating the maturation process for dual mode technologies. The technology review workshop identified several components with low technology readiness levels, but it was the sense of the workshop attendees that while new materials and basic research would potentially improve dual mode systems, no new discoveries were required to move forward. The technical challenges are more engineering than science related. The larger challenge is still institutional, as it was in the 1970s. With this in mind, an attempt to understand major technology system introductions and research and development collaborative efforts was initiated. Innovation follows known patterns, as illustrated in Figure 21. One might argue that current efforts to introduce more efficient engine designs or flex fuel or hybrid vehicles are a product innovation within the current architecture for auto-based mobility. The hydrogen fuel cell vehicles as envisioned by the FreedomCAR program or the dual mode vehicles that are the subject of this project would be architectural-level changes, which would open new potential research directions and market innovation opportunities (Miller and Morris 1999). Architectural-level change, however, is typically slow.
Figure 21. Innovation Patterns (Miller and Morris 1999).
AN EQUILIBRIUM SHIFT In his book The Slow Pace of Fast Change: Bringing Innovations to Market in a Connected World, Bhaskar Chakravorti (2003) references John Nash’s Nobel Prize–winning discovery of “equilibrium.” In a connected or networked market, each self-interested person or firm’s choice is dependent on the choices of others. In a private enterprise system, market outcomes are a collective result of many choices made at the individual level based on private rationale and not based on the consideration of the collective good. Complementary and competitive interdependencies, reliance on a shared resource, connected belief systems about what is expected in a future environment, and fragmentation in a supply chain are all indications of a networked market. In this networked market, all the players are bound in a self-reinforcing
39

gravitational pull to the existing status quo system equilibrium, which Chakravorti dubbed “the beautiful bind” (Chakravorti 2003).
In a private-enterprise system, market outcomes are a collective result of many choices made at the individual level based on private rationale and not based on the consideration of the collective good.
The transportation system, with its shared resource of networked highways and roads built and expanded by the heavy construction industry, complementary interdependence of fuel stations and auto manufacturing, the local clout of automobile dealers, and the low retail prices of auto-accessible big box retail generates an equilibrium around the current dominant form of mobility in the United States—the automobile. In this scenario, with each player of the network making their best individual choice, they are locked into a self-reinforcing configuration, and no single firm has a motivation to unilaterally switch to something new even if the new architecture were to offer a more efficient or technically superior result. This is similar to a marble in the shallow cone of Figure 22. Getting into the deeper cone requires overcoming gravity to shift to the more efficient network.
M
ore
Eff
icie
nt
Hig
her
Cap
aci
tyN
etw
ork
Current Network
Equilibrium
More
Eff
icie
nt
Hig
her
Cap
aci
tyN
etw
ork
More
Eff
icie
nt
Hig
her
Cap
aci
tyN
etw
ork
Current Network
Equilibrium
M
ore
Eff
icie
nt
Hig
her
Cap
aci
tyN
etw
ork
Current Network
Equilibrium
More
Eff
icie
nt
Hig
her
Cap
aci
tyN
etw
ork
More
Eff
icie
nt
Hig
her
Cap
aci
tyN
etw
ork
Current Network
Equilibrium
Figure 22. The Challenge of a Networked Market Equilibrium Shift.
Causing a shift to a new equilibrium requires:
• establishing a new network alternative by coordinating the incentives for innovators, distributors, and users to synchronize a shift;
• co-opting the current network through various strategies such as targeting a niche underserved segment or introducing a “new,” “faster,” “improved” complement to the status quo; or
• having one or more hub players in the network leverage their clout to enable the shift.
40

Recognizing that the introduction of a dual mode transportation network is an equilibrium shift is central to the politics and reality of how success will be achieved.
Not only must a coalition come together to effect an equilibrium shift, but they must also have the staying power to ride out the long technology adoption cycle that is prevalent in the automotive industry—new individual technologies have taken 10 to 15 years to achieve a 50 to 75 percent market penetration (Figure 23). If the architectural-level change requires a new national infrastructure, then projects such as the Interstate Highway System (IHS) are analogous. The IHS took 20 years to complete 80 percent of the planned miles (Moon 1994). This suggests that smaller scale demonstrations need to deliver the necessary benefits and economic health to sustain the shift. The vehicle fleet also turns over every 14 to 15 years. This suggests that a dual mode capability need not be backward compatible with current vehicle designs as is sometimes suggested, although a rationale or business model for demonstrations would need to demand and cause the adoption of sufficient vehicles to encourage the cooperation of the vehicle manufacturers. The fleet turnover and rate of adding new infrastructure can conceivably parallel one another closely.
The successful introduction of a dual mode transportation network will require an equilibrium shift. Complementary and interdependent players will need to form a coalition and have the staying power to ride out a long technology adoption cycle.
Figure 23. Car Technology Penetration Years after First Significant Use (Heavenrich 2006).
41
Several attempts to cause major change in the transportation sector have only had limited, if any, success due to changing political winds, an inferior product or their inability to achieve the critical mass to cause an equilibrium shift. The Urban Mass Transit Administration (UMTA) effort in the 1960s and 1970s supported much of the research that was carried out at that time on dual mode and PRT technologies. The effort was capped, however, with several institutional failures. A high capacity PRT research effort was tied up in 1972 Executive Administration politics, according to Edward Anderson (1973), and lobbying by parties with vested interests in conventional transit was able to kill the project funding. Separately, UMTA sponsored an exhibition for transportation solutions, which included a major focus on PRT. Due to a rushed schedule, the technology developers did not pay adequate attention to integrating systems into the urban community. The many options presented confused the city planners and decision makers who attended, with the result being that no one wanted to fund the first demonstration with their own funds but instead were looking for 100 percent federal funding. UMTA viewed their role as one of stimulating private sector development. A demonstration of PRT technology was organized by UMTA officials in Morgantown, West Virginia, on the University of West Virginia campus. The company whose system was selected for demonstration was judged too small for a federal demonstration program, and the program was awarded to the Jet Propulsion Lab for system engineering, to Boeing for the vehicle, to F.R. Harris for engineering guideways and stations, and to Bendix Corporation for the control system. In a hurry to demonstrate the system before the elections of 1972, mistakes were made that caused the system cost to balloon by a factor of four. Although the system was built and is still operating to this day, the cost overruns dampened any further congressional support (Anderson 1973). In TRB Special Report 253 (1998), a National Research Council committee reviewed the AHS efforts to automate transportation. The AHS effort had been initiated through the Intermodal Surface Transportation Efficiency Act of 1991 with an expanded role for U.S. DOT in research and development of intelligent transportation systems. The program was a public-private partnership effort to develop an automated highway and vehicle prototype, and it did result in a successful technical demonstration of cars automatically following one another in a dedicated lane. Review of the program, however, faulted the effort for under-emphasizing the human factors issues and the institutional, liability, and societal barriers to implementation. The actual vision of the program—which aimed within seven years to specify and build support for a preferred design after an accelerated three-year pre-planned assessment, with the managing consortium playing the role of both promoter and evaluator—was viewed as flawed. Finally, the consensus-based management structure that was specified by U.S. DOT for the consortium proved to be difficult in a changing and uncertain environment where responsiveness was required (Transportation Research Board 1998).
COLLABORATION To look outside the transportation industry at other collaborative efforts, an excellent overview is provided by E. Raymond Corey in his book Technology Fountainheads: The Management
42

Challenge of R&D Consortia (1997). This book reviews the history of six different major research consortia—the Electric Power Research Institute (EPRI), the Semiconductor Research Corporation (SRC), the Gas Research Institute (GRI), SEMATECH, the Microelectronics and Computer Technology Corporation (MCC), and Bell Communications Research. Some of these consortia such as GRI served a vertically integrated membership including natural gas producers, consumers, distributors, and marketers, while others such as EPRI served a horizontal cross section with all of its members being electric power producers. The challenges in managing each are unique. One immediate distinction to recognize is the difference between research and development (R&D) consortia and R&D joint ventures or alliances. Alliances are typically closed memberships organized to lead to the members’ competitive advantage, whereas consortia tend to be organized around non-competitive or pre-competitive research. Two particularly relevant functions for research consortia are industry standard setting and infrastructure development. The rates of technological change and the scope of networked systems change make it difficult for an individual company to unilaterally set standards. By pooling efforts, a large percentage of an industry can assure themselves of standards that will facilitate interoperability of subsystems and components in a larger networked system. In addition, pooled funds can rationalize academic research, avoid duplicative work, and support the development of a skill base to serve new technological needs.
The rates of technological change and the scope of networked systems change make it difficult for an individual company to unilaterally set standards. By pooling efforts, a large percentage of an industry can assure themselves of standards that will facilitate interoperability of subsystems and components in a larger networked system.
Corey (1997) found in his research that R&D consortia “had particular success as creatures of the private enterprise system. They have been less successful when they have been formed to carry out some overarching national policy.” This is partially credited to a tendency of governments to impose “a multiplicity of goals, some economic, some political, and some not completely congruent with member interests” (Corey 1997). Two of the consortia mentioned above were based in Austin, Texas—MCC and SEMATECH. MCC was a for-profit R&D consortium initially led by Admiral Bobby Inman, who is now at the University of Texas. After reading Gibson and Rogers’ book R&D Collaboration on Trial (1994) about the formation of MCC, researchers met with Inman to discuss the potential for a dual mode consortium. His key comments relevant to this effort were:
• do not discount the ability of science to add to the effort even if new discoveries are not required for the baseline design effort—there is a tremendous appetite to fund scientific research, and this can be leveraged to access some of the brightest minds;
• design the system for an awareness of what is on the infrastructure; and
43
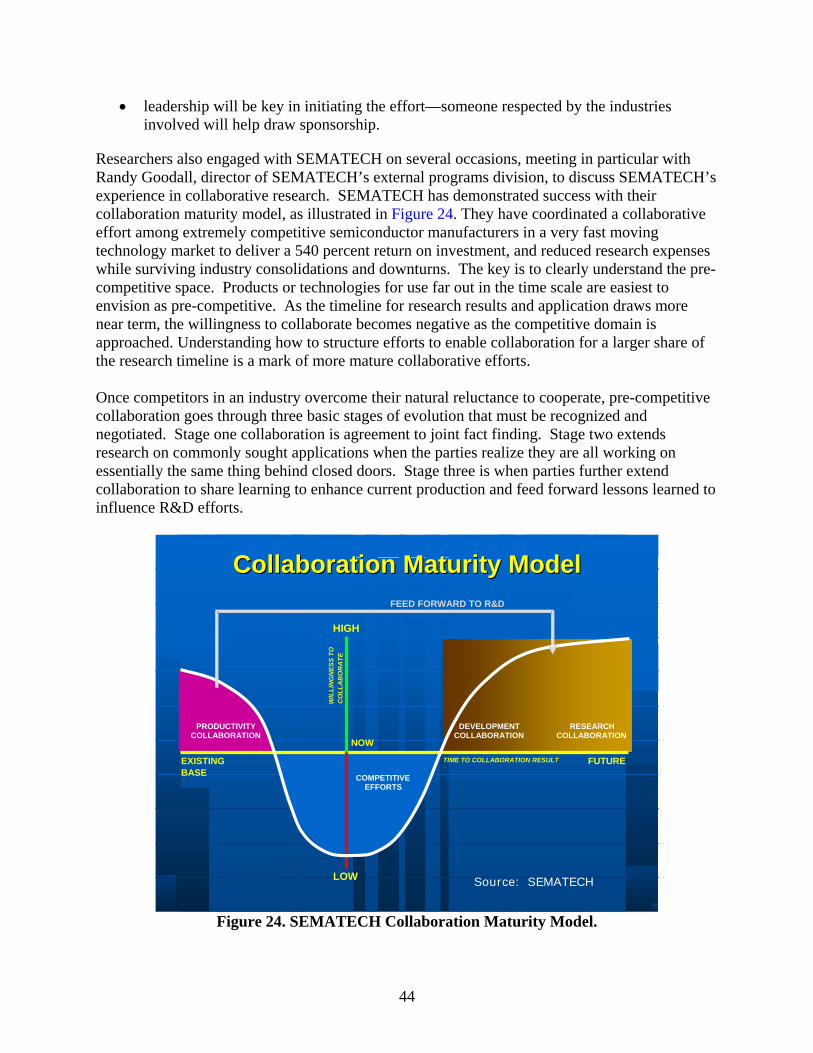
• leadership will be key in initiating the effort—someone respected by the industries involved will help draw sponsorship.
Researchers also engaged with SEMATECH on several occasions, meeting in particular with Randy Goodall, director of SEMATECH’s external programs division, to discuss SEMATECH’s experience in collaborative research. SEMATECH has demonstrated success with their collaboration maturity model, as illustrated in Figure 24. They have coordinated a collaborative effort among extremely competitive semiconductor manufacturers in a very fast moving technology market to deliver a 540 percent return on investment, and reduced research expenses while surviving industry consolidations and downturns. The key is to clearly understand the pre-competitive space. Products or technologies for use far out in the time scale are easiest to envision as pre-competitive. As the timeline for research results and application draws more near term, the willingness to collaborate becomes negative as the competitive domain is approached. Understanding how to structure efforts to enable collaboration for a larger share of the research timeline is a mark of more mature collaborative efforts. Once competitors in an industry overcome their natural reluctance to cooperate, pre-competitive collaboration goes through three basic stages of evolution that must be recognized and negotiated. Stage one collaboration is agreement to joint fact finding. Stage two extends research on commonly sought applications when the parties realize they are all working on essentially the same thing behind closed doors. Stage three is when parties further extend collaboration to share learning to enhance current production and feed forward lessons learned to influence R&D efforts.
Figure 24. SEMATECH Collaboration Maturity Model.
Collaboration Maturity ModelCollaboration Maturity Model
EXISTINGBASE
WIL
LIN
GN
ESS
TO
CO
LLA
BO
RA
TE
HIGH
LOW
DEVELOPMENTCOLLABORATION
PRODUCTIVITY COLLABORATION
TIME TO COLLABORATION RESULT
COMPETITIVEEFFORTS
NOW
FUTURE
RESEARCHCOLLABORATION
FEED FORWARD TO R&D
SEMATECH Source:
44

There are other parallels to the efforts in the semiconductor industry, which has relentlessly driven the size of transistors (functionality) and the cost of semiconductors down according to Moore’s law—doubling the number of transistors on a chip every 18 months and delivering ever more capable functionality and enabling new applications (Goodall et al. 2002). Just as society has embraced the ownership of ever more powerful personal computers that can be turned on any time to gain “thinking productivity” advantages, they have also embraced the private automobile, held in standby to be used on demand (mobility productivity). Lane size might be related to wafer size and bit rate related to highway capacity. The bottom line is whether the transportation industry can lower the unit functional cost of mobility to deliver new mobility solutions by taking lessons from the semiconductor industry. A transportation industry collaborative similar to SEMATECH, operating on industry funds for expediency and R&D continuity, needs to be explored. A collaboration rationale and business model will be fundamental to success in overcoming the pitfalls suffered in other architectural-level change attempts.
Can the transportation industry lower the unit functional cost of mobility to deliver new mobility solutions by taking lessons from the semiconductor industry? A collaboration rationale and business model will be fundamental to success in overcoming the pitfalls suffered in other architectural-level change attempts.
WHO ARE THE STAKEHOLDERS AND HOW IS CONSENSUS BUILT? In National Transportation Organizations: Their Roles in the Policy Development and Implementation Process published by the ENO Transportation Foundation (2002), the stakeholders in the national transportation process are listed as shown in Table 8.
Table 8. Transportation System Stakeholders. Carriers Freight movement—air, intermodal, motor carrier, pipeline, railroad, water Passenger movement—air, transit, water Environment Goods Suppliers Equipment and materials Fuel Infrastructure and terminals—airports, pavement and bridges, seaports, truck stops Vehicles and accessories—aircraft, autos, trucks, railroad, transit, recreational vehicles, boats Investors Labor—air, rail, transit, trucking, manufacturing, water Professional Organizations Research, Education and Policy—independent, industry affiliated, university Service Suppliers—freight brokers, consultants, travel agents State and Local Government Users of Transportation Services
45

While this broad list certainly identifies the stakeholders, it is perhaps misleading in identifying where the focus should be placed for the development of policy. The only justification for public funding of infrastructure is the service it provides to the users and taxpayers (Cox et al. 2005). Industry, labor, investors, and research institutions should not be involved in these discussions to serve themselves but rather to ensure a better service is delivered to the ultimate consumer of their services or product. The metrics should involve cost/benefit ratios, quality of life, efficiency measures, etc. As clearly outlined by Zielinski in “New Mobility: The Next Generation of Sustainable Urban Transportation” (2006), there are many tools that can be used for modeling and analysis of complex transportation systems. She refers to top-down system dynamics models, bottom-up agent-based models, and simulation or scenario-building software. She notes that “single-fix” solutions (e.g., only fuel, only policy, or only pricing) cannot address the challenge. The complex system analysis approach that “integrates innovations in products, services, technologies, financing, social conditions, marketing, policies, and regulations” is a better way to build a systems-based solution (Zielinski 2006). In the discussion of institutional issues involved in the development of the automated highway system, similar challenges of introducing a new infrastructure were encountered. At that time the key ingredients of education, communication, and participation were noted as key to breaking down barriers and correcting misinformation among the major participants. Complex system dynamic models can help to define the impacts in areas of travel volume changes, mobility, land use, emissions, energy use, economic development, and quality of life issues and would be useful in helping those with opposing views to develop strategies to bridge the gaps so that a common vision of a future transportation system can be forged (Ioannou 1997).
STAKEHOLDER COMMENTS/INSIGHT Stakeholders, transportation service consumers, and entrepreneurs were engaged in dialog regarding the merits and potential for dual mode technology. Understandably, there is skepticism among most stakeholders for a new technology that is not definitively communicated. The full report of stakeholder comments is included in Appendix A. Stakeholder questions captured in the stakeholder interview process will need to be addressed in the incubator phase (Figure 25). These questions include the following and predominantly indicate a need for better communication and definition:
• Where will funds for dual mode come from, and will they be additive to existing sources of revenue?
• Can simulation tools be developed to show the transportation benefits and detriments of dual mode systems?
• Will dual mode strategies encourage urban sprawl, thereby negatively affecting traffic and congestion off the guideway?
• Why wouldn’t Texas be better off addressing current and short-term needs through transit system expansion rather than making a long-term commitment to a new infrastructure now?
46
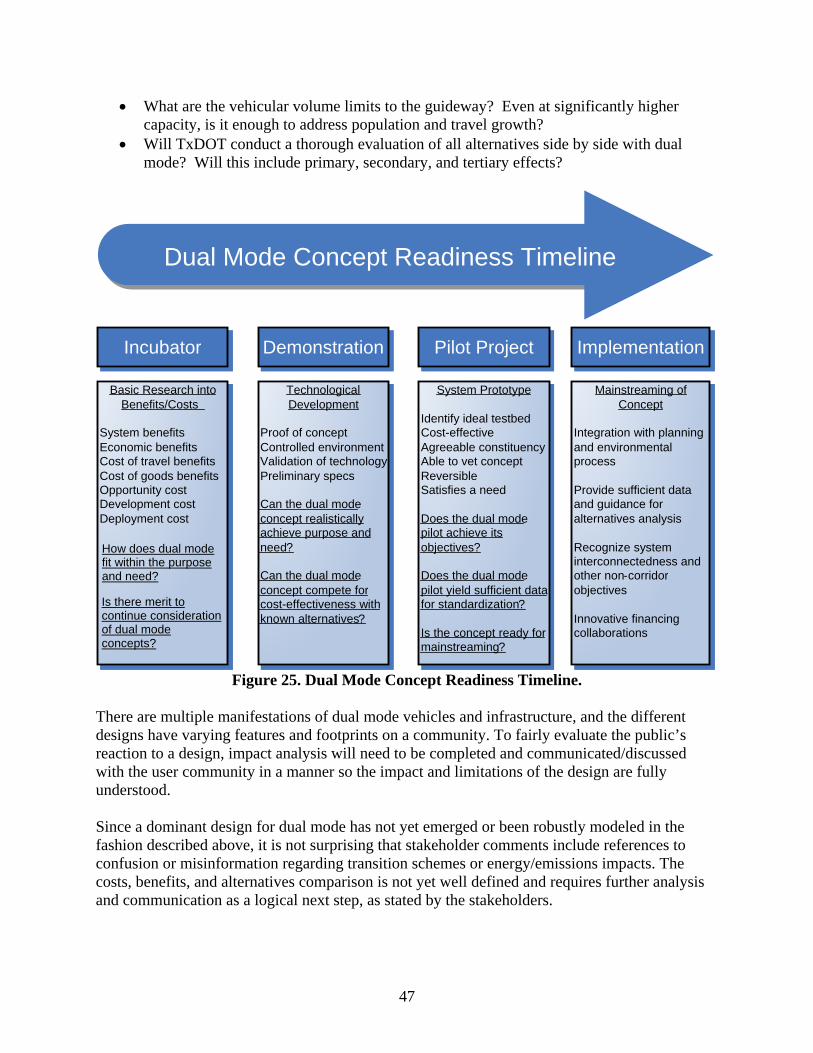
• What are the vehicular volume limits to the guideway? Even at significantly higher capacity, is it enough to address population and travel growth?
• Will TxDOT conduct a thorough evaluation of all alternatives side by side with dual mode? Will this include primary, secondary, and tertiary effects?
Figure 25. Dual Mode Concept Readiness Timeline.
Basic Research into Benefits/Costs
System benefits Economic benefits Cost of travel benefitsCost of goods benefits Opportunity cost Development cost Deployment cost
How does dual mode fit within the purpose and need?
Is there merit to continue consideration of dual mode concepts?
Technological Development
Proof of conceptControlled environmentValidation of technologyPreliminary specs
Can the dual mode concept realistically achieve purpose and need?
Can the dual mode concept compete forcost-effectiveness with known alternatives?
System Prototype
Identify ideal testbedCost-effectiveAgreeable constituencyAble to vet conceptReversibleSatisfies a need
Does the dual mode pilot achieve its objectives?
Does the dual mode pilot yield sufficient data for standardization?
Is the concept ready for mainstreaming?
Innovative financing collaborations
Recognize system interconnectedness and
corridor other non-objectives
Provide sufficient data and guidance for alternatives analysis
Integration with planning and environmental process
Mainstreaming of Concept
Dual Mode Concept Readiness Timeline
ImplementationPilot ProjectDemonstrationIncubator
There are multiple manifestations of dual mode vehicles and infrastructure, and the different designs have varying features and footprints on a community. To fairly evaluate the public’s reaction to a design, impact analysis will need to be completed and communicated/discussed with the user community in a manner so the impact and limitations of the design are fully understood. Since a dominant design for dual mode has not yet emerged or been robustly modeled in the fashion described above, it is not surprising that stakeholder comments include references to confusion or misinformation regarding transition schemes or energy/emissions impacts. The costs, benefits, and alternatives comparison is not yet well defined and requires further analysis and communication as a logical next step, as stated by the stakeholders.
47

The oil industry has a good record of ensuring transportation fuels are available, and transitions to other liquid fuels are currently promoted on television as economic options. Consequently, there is no sensed urgency for fuel-switching capability that would require as drastic a change as real time electrification. Lead times, however, for new infrastructure are long, and current popularly known alternatives such as fuel cells or biofuels have been promoted heavily even though they also require new infrastructure and include currently uneconomic technologies. A side-by-side robust study of the technologies including their anticipated side effects should be completed and communicated broadly. The “chicken and egg” problem was expressed by several interviewees and is a valid concern since new infrastructure is envisioned as part of the implementation of dual mode. Transition steps that incrementally match niche markets for infrastructure and vehicles will be a critical consideration in winning and maintaining public support for any system. An intercity freight justification can lead the development to prove safety, clean energy, and reliability. Mass transit applications can lead in the intracity environment to relieve congestion and provide better service. The solution for both environments will need to be architected to allow infrastructure for both systems to be joined together at a later date to deliver a seamless network accessible by freight, mass transit, and private cars.
To deal with the “chicken and egg” transition issues, an intercity freight justification can lead the development to prove safety, clean energy, and reliability. Mass transit applications can lead in the urban environment to relieve congestion and provide better service. The solution for both environments will need to be architected to allow infrastructure for both system to be joined together at a later date to deliver a seamless network accessible by freight, mass transit, and private cars.
In the dialog with the entrepreneurial community, the main concern regarded the dearth of funds available for transportation innovations while congestion, emissions, safety, and energy costs are considered to be underperforming in comparison to what is perceived as achievable. Sponsorship of prize competitions and signals to industry of serious interest in dual mode capabilities will accelerate experimental work. A clear pathway for evaluation and approval of new technologies that allows their consideration in the Texas statewide plan would also be helpful. The National Environmental Policy Act (NEPA) process used for new infrastructure permitting eliminates new technologies early if they have not been adopted in the statewide plans. A rigorous but transparent process for evaluation should be clarified for technology developers.
A DUAL MODE BENEFITS COALITION The dual mode system offers an opportunity for major growth in a number of industries:
• automotive manufacturers, • heavy construction, • electric utilities,
48

• primary fuel suppliers, • computing equipment manufacturers, • information/communications technology, • electrical equipment manufacturers, • trucking industry, • mass transit industry, • railroads, • logistics and supply chain, • aerospace and defense, • financial services and banking, and • insurance.
For the auto industry, dual mode offers a brand new product with revolutionary features and maintains an auto-centric transportation future. For heavy industry, there is the potential to construct a new national infrastructure. For electric utilities and primary fuel suppliers (natural gas, coal, and nuclear), there is an opportunity to supply energy to virtually the entire transportation sector and a hardened infrastructure for a new highly reliable electric grid. For computing and communications, there is a new market for mobile computing and entertainment with a captive audience, new technologies for vehicles, a control system, and new fiber optic bandwidth. For electrical equipment manufacturers, there will be the need for motors, transformers, sensors, and many other technologies. For trucking, there is the possibility of driverless long-haul high-speed freight delivery. For the mass transit industry, dual mode offers a cost-effective mechanism to share the guideway infrastructure. Railroads may see opportunities to leverage their right-of-way holdings to participate in increased high value freight shipments. For business in general, the capability to speed the pace of commerce will reduce working capital, inventories, and work-in-process expenses. The aerospace and defense industry can contribute high speed aerodynamic designs, large scale integration capability, and sensor technologies. Banking and financial institutions will facilitate private funding. Insurance companies will benefit from reduced liabilities. James Dunn observed in Driving Forces: The Automobile, Its Enemies, and the Politics of Mobility (1998) that in the promotional stage of a new transport technology there is the opportunity to generate a “modal growth coalition.” This might include:
(1) localized business interests, particularly land developers hoping to capitalize on the improved access offered by a new mode, (2) investors attracted by the public incentives offered and the potential profits from financing, building, owning, and operating specific transportation facilities, (3) politicians eager to boost the local economy, help their political careers, and (4) workers seeking jobs building and operating the new mode (Dunn 1998).
Highway promotion was successful because it had the advantages of:
• legitimacy as a public endeavor, • incrementalism which allows relatively small investments to yield large improvements in
capacity and comfort,
49

• good fit with federal intergovernmental structure, • appearance as more complementary than competitive to other modes, • broad impact on land use and land values, • being a key element in economic growth and social change, • separation of infrastructure from rolling stock investments, and • self-financing through user fees (Dunn 1998).
Transportation service is a key element of economic competitiveness, but its procurement by a state requires the product to be packaged for institutional purchasing. Beyond the technology, engineering, and cost/benefit hurdles, dual mode proponents will need to develop a modal growth coalition to successfully navigate the politics of transportation.
Beyond the technology, engineering and cost/benefit hurdles, dual mode proponents will need to develop a modal growth coalition to successfully navigate the politics of transportation.
A POLICY OF FLEXIBILITY AND COMPETITION Transportation policy took a turn in 1991 after completion of the Interstate Highway System. There was no longer a shared goal to build a national infrastructure. The problems of congestion, poor road conditions, and automobile pollution provided an intellectual basis for considering major change in policies, and global competition was making American businesses sensitive to capital efficiency and transportation issues with emphasis on just-in-time deliveries. The relatively predictable politics of the interstate construction era had given way to more partisan and less predictable interest group politics (Dilger 2003). In this context, the neighborhood support group is pitted against the global integration group in a policy battle. The neighborhood support group stands for shorter trips, walking/biking, land use solutions, design/plan, little consideration of freight, accessibility, public, mass, change behavior, and “make it happen.” The global integration group stands for longer trips, broad community of interests, choices, market forces, a major role for freight, mobility, private, personalized, technological fixes, and “let it happen” (Cox et al. 2005). A choice between these two visions of the world is not required, and in fact the dual mode system may offer a viable vision that satisfies both. A dual mode transportation vision could deliver more efficient mass transit to fit U.S. population densities while consuming less land and providing improved mobility for both goods and people movement.
A dual mode transportation vision could deliver more efficient mass transit to fit U.S. population densities while consuming less land and providing improved mobility for both goods and people movement.
50

Value of Competition Presidential administrations from both political parties in the United States have favored a national policy to replace “a highly protected, regulated environment of the transportation sector with a predominantly market-based competitive system with minimal government economic regulation” (ENO 2002). This approach has come from the realization that the “protected industries are—almost without exception—laggard, costly, and a burden on the countries that maintain them” and that “open-trade policies are a precondition for healthy economic growth.” The challenge for politicians is to “support policies that prevent established interests from shutting out challengers” (London 2005). Whether it is rail, trucking, or air travel and air freight, deregulation has improved performance and made each of these sectors more competitive. In the process of industries becoming more efficient, there are always losers, and painful adjustments will lead to complaints of “unfairness.” But many more working people are hurt in the long run if inefficient facilities are artificially kept afloat. “Government’s role is to encourage competition, not to supervise monopolistic industries” (London 2005). Bi-partisan support that embraces competition and remains open to innovation will be fundamental to the realization of dual mode potential. A policy of enabling more robust transportation energy competition should also be adopted. There is no current corporate monopoly in oil, but oil as a resource has a monopoly in transportation energy markets. A policy of encouraging the move to electrification for transportation energy will increase competition and spur productivity improvements and innovation. The electrification of manufacturing, the home, and the office are all examples where productivity improvements have been dramatic with the introduction of microwave ovens, dishwashers, refrigerators, personal computers, digital communications, numerically controlled machines, etc. Transportation is the one industry that has yet to tap the productivity improvements enabled by electrification.
A policy of encouraging the move to electrification for transportation energy will increase competition and spur productivity improvements and innovation. The dual mode technologies under study are immature, but they could be fully developed in a 7 to 10 year timeframe with dedicated effort. Policies that close the door to innovations such as dual mode should be avoided.
The current public-private partnership (PPP) arrangements often incorporate non-compete provisions for parallel infrastructure. Since transportation investments, and especially the PPP agreements, are long term in nature, the potential of new technology to make current modes obsolete should be included in scenario analysis of possible future outcomes. On the question of investment, promotion, and regulatory policy, the guiding principle should be to encourage competition and transparency. The dual mode technologies under study are immature, but they could be fully developed in a 7 to 10 year timeframe with dedicated effort. Policies that close the door to innovations such as dual mode should be avoided.
51

Electric Grid and Homeland Security Impact In a separate review of dual mode impact on the electric grid, it was concluded that long distance freight movements shifted to the night off-peak hours could be accommodated without significant new generation capacity required (Akinnikawe et al. 2008). In fact the new off-peak demand would improve power plant utilization and economic efficiency. A similar conclusion was drawn by EPRI in their study of the plug-in hybrid vehicle version of transportation electrification (Duvall and Knipping 2007). With a fully implemented dual mode guideway network installed, the emergency response capability for evacuations and insertion of first responders could be accelerated due to increased throughput capacity and system management capability. This capability, combined with a hardened electric utility infrastructure, should be considered as a part of the new infrastructure cost/benefit analysis to evaluate any impact on homeland security policy and planning. Transit System and Funding Impact One of the challenges with transit is that it is really designed to serve high density populations. European nations have high population densities along transportation corridors whereas U.S. populations have different settlement patterns. Population density is really not the key, however, but rather high concentrations of destinations. To make conventional transit competitive in most of the United States would require downtown-like high concentrations of destinations throughout (Cox et al. 2005). This is both politically and practically unachievable. Dual mode offers a solution that hybridizes the convenience and reach of a car and the efficiency of electrified transit. Transit funds should be leveraged to enable a broader application of transit benefits in the future by assisting in the development of dual mode technologies. The state should view dual mode technology as a potential advanced manufacturing and advanced energy solution. Finally, it is well known that as cars achieve higher fuel efficiency, there are fewer transportation fuel tax dollars collected per vehicle mile traveled. In the case of Texas, this effect of efficiency is combined with the fact that Texas is a donor state for the federal highway trust fund, receiving less than a dollar in funding for every dollar contributed in comparison to other wealthy states that receive much more than a dollar return per dollar contributed. Dual mode systems will inherently include the ability to charge a fee per mile traveled and powered by electricity. There would not be the perception of double taxation with fuel taxes and tolls collected. This represents an opportunity to relieve congestion, improve emissions, improve energy security, and reduce crashes with a clean but complementary separation from the funding mechanisms for traditional modes.
Dual mode systems will inherently include the ability to charge a fee per mile traveled and powered by electricity. There would not be the perception of double taxation with both fuel taxes and tolls collected.
52

Use of Corridor Authority for Demonstration Pilots In 2003, Texas HB3588 created a true department of transportation by giving TxDOT authority over railroads, ports, highways, and airports. The state legislature authorized TxDOT to use public-private partnerships for the planning, design, financing, building, operation, and maintenance of infrastructure. This effort, supported by the Governor’s Business Council, refused to accept the “business as usual” notion of a continued slow decline in mobility and instead authorized the Trans-Texas Corridor. This partnership with the private sector in addition to the corridor authority can be leveraged in the demonstration of dual mode technology in both greenfield and brownfield applications once dual mode concepts have matured and are ready for demonstration. The provision of transportation and utility corridors, the separation of large trucks from personal cars, and the use of private capital for construction are features of the corridor authority that TxDOT can leverage to facilitate dual mode demonstrations. The small footprint of elevated dual mode infrastructure makes the designation of existing brownfield highway segments as corridors potentially realistic without further land use impact.
A METHOD OF MONITORING PROGRESS There are four levels of engagement that can be employed by TxDOT to monitor progress, with the later levels (options) exhibiting higher degrees of leadership in definition of future transportation alternatives:
1. passively monitor and advise—little influence or leadership, 2. sponsor matching fund in-depth studies of the impact on Texas from development of dual
mode—some influence and leadership with clear signals to the private market of receptivity to new solutions,
3. option two plus testbed sponsorship from the state to match private investment to ensure Texas leads development of the 21st century transportation architecture, and
4. option three plus support from the Texas governor and U.S. congressional delegation to make this a federal initiative with multi-state support.
Option one could be accomplished by TxDOT staff or contracted university researchers monitoring various websites, discussion groups, professional association technical papers, industry news sources, and the activities of government agencies and programs. Many of the sources to be monitored are listed in Appendices B and D. Periodic progress reports would provide early notice of any significant industry movement that could impact Texas transportation planning, and attendance of relevant conferences would give voice to Texas concerns. This option keeps TxDOT aware of developments but is passive and provides little opportunity to lead or shape development of the technology. Option two will require multi-year state, federal, or industry research funds to progress the evaluation through more robust definition of a system and its impacts and costs/benefits in comparison to all viable alternatives. As noted in the stakeholder comments in Appendix A, a strong statement of interest by TxDOT would get the industry’s attention to support this effort. To monitor progress in this or later options, TxDOT should be a member of the advisory board of the collaborative consortium leading the effort. This option would provide TxDOT some opportunity for shaping and leading the development through the incubation phase outlined in
53

54
Figure 25. Commitment beyond option two should be reserved until the robust design alternatives comparison and impact studies are completed. Option three aligns with the demonstration phase in Figure 25 and should involve a competition format as a part of the process of defining alternatives. In addition, some prototype testing facilities will be required. The competition and facilities provide an opportunity to engage state funds for research superiority and economic development to place Texas in a leading position for advanced manufacturing and transportation energy research. Technology would be developed through TRL4 and TRL5 as part of this phase. Finally, option four involves development of a full-scale system test lab capability with the ability to test vehicle and infrastructure designs, manufacturing and constructability, and operational performance of a new system in an environment representative of the actual expected conditions with regard to weather, speeds, traffic volume, power demand, and reliability. Both the pilot project and implementation phases of Figure 25 would be covered in this option. Although each successive phase of this project should be initiated after passing a go/no-go review, planning for this last phase would need to be considered early on to allow the necessary time for incubation of a new large scale program without delaying the commercial expediency of the technology development. The multi-mile system test facility would be a national resource as a testbed for the 21st century transportation industry. Even after the initial testing and standards are complete, the facility would continue to draw research and testing of improvements. A model similar to the current FutureGen program, which is designed to prove clean coal electric generation technologies on a commercial scale, should be considered if private industry views dual mode technology to be sufficiently high risk to preclude 100 percent industry funding of the development. In the FutureGen model the industry coalition is providing roughly one-fourth of the funds, and the government is providing three-fourths of the billion dollar test effort. Just as the FutureGen effort is led by the FutureGen Alliance of industry players, this project should be led by a private consortium with hub players from some of the key industry stakeholder groups. Leading this option has the potential to create and draw federal matching research funds to Texas. Interest in partnering on this effort has already been expressed to the research group by national laboratories and federally funded research and development groups. Texas should adopt option two of the alternative pathways and prepare to extend the effort to option four. The potential of dual mode technology merits further research funding, impact analysis, and investment in supportive policy development.

5. CONCLUSIONS AND RECOMMENDATIONS
Based on the research conducted, the research team draws the following conclusions:
• A continuing policy of improved mobility is fundamental to economic growth and improvement in the standard of living enjoyed by the citizens of this state and country.
• No dual mode or PRT systems meeting Texas’ requirements, at the time of this project,
are developed to a technology readiness level 7, which would qualify them for pilot demonstrations. There are many ideas and concepts developed to various degrees, but in the opinion of the research team no single system incorporates all the best ideas. A critical mass system engineering effort is required to develop a single dominant design, but funds for an architectural-level change to transportation are difficult to acquire for current pre-seed or seed-stage efforts.
• Dual mode technology potentially offers the travel time and privacy benefits of the
automobile, the energy diversity/emissions benefits of transportation electrification, and the systems management/throughput capacity of automated systems hybridized together to deliver a new transportation solution. The hybrid “Auto-Plus” dual mode solution appears to have the potential to deliver both people and freight movement and includes both private and public transit solutions. Further research is needed to robustly model the impact, advance the designs, and develop supportive policy.
• A benefits coalition is critical to moving this technology forward successfully and should
engage all key stakeholders. A TxDOT stated commitment of interest in the maturing of this technology and a commitment to incorporate a technology review process that seriously considers transformational innovations in transportation planning for Texas would be regarded by the industry as a key signal to engage their investment and support.
• Defining standards for a dual mode system would require a collaborative development
process engaging both large corporate stakeholders and the entrepreneurial community.
• While the stakeholders in a new transportation mode are many, the primary metric of feasibility should be the benefits delivered to the consumers of transportation services and the users of the as-built environment.
In addition, the research team offers the following recommendations:
• Following are four options that can be employed by TxDOT, with each option exhibiting higher degrees of engagement, leadership, and influence in defining future transportation alternatives:
1. Passively monitor dual mode technology developments and advise TxDOT decision
makers when the technology maturity is approaching commercialization. 2. Directly sponsor in-depth studies of the impact on Texas from development of dual
mode with matching industry funds required for the studies. This option will provide
55

TxDOT some influence and leadership and will send clear signals to the private market of receptivity to new solutions.
3. In addition to the impact studies of option two, provide testbed sponsorship from state funds to match private investment to ensure Texas shares in the lead of new energy and transportation solution development.
4. In addition to Texas-supported impact studies and testbed facilities, engage the Texas governor and U.S. congressional delegation to make this a federal initiative with multi-state support.
• It is in Texas’ interest to lead the nation in this transition to maintain our position as the
“energy capital” of the nation. To take the leadership role, a first phase of development should provide a baseline system concept/design and robust modeling of expected impact in the following areas: economic development, electric demand, emissions, congestion, safety, energy flows, emergency preparedness, and transportation planning and policy. The researchers recommend adopting option two of the alternative pathways. Based on a positive outcome from the initial analyses, the following recommendations may be advanced:
o Engage the private sector in implementing the new mode with the goal of a 20-year
full implementation of a national system, which should be explored to achieve a new level of energy security by 2035. A relatively quick transition to the new architecture will have network benefits that will encourage rapid end user adoption of the new technology.
o Ensure new technology is properly studied and considered in any non-compete provisions of PPP-built infrastructure.
o Should initial impact and cost/benefit studies prove feasible and attractive, TxDOT should encourage design and operations standards that ensure interconnection between intercity systems justified by freight and intracity systems justified by transit, thereby providing a navigable critical mass network for dual mode private vehicle technology adoption.
o Leverage political support from the state to develop availability of federal matching funds for dual mode electrified transportation technology acceleration.
• A policy of enabling more robust transportation energy competition should be adopted. There is no current corporate monopoly in oil, but oil as a resource has a monopoly in transportation energy markets. A policy of encouraging the move to electrification for transportation energy will increase competition and spur productivity improvements and innovation.
• Development of a dual mode electric transportation infrastructure should be explored as
an opportunity to harden and increase the electric transmission and distribution capacity while also delivering new solutions for emergency response and homeland security.
56

57
• Approach the challenge in step-wise fashion, with further efforts focused on four thrusts:
o a technology roadmap, o systems-level technology adoption and impact modeling, o a financial and policy framework, and o organization of a research and development consortium.
The technology roadmap efforts would address system performance and integration issues, power delivery, vehicle systems, surface superstructure, command and control systems, and networked sensors and system health monitoring. Modeling efforts would include energy, emissions, transportation demand, economic impact, emergency response, and system dynamic modeling. Financial and policy analysis would clarify pathways to critical mass support for a transition to a 21st century transportation network. Finally, organizational development is needed to define a pre-competitive space in which collaboration among competitors can be achieved for the benefit of all collaboration partners while guarding the assurance of robust competition for actual delivery of products to the market. A consortium dedicated to the launch of this initiative is recommended and may follow the business model of the SEMATECH collaboration, which operates in the semiconductor fabrication space, or the FutureGen Alliance, which is organized to demonstrate clean coal technologies to a commercial scale.


REFERENCES
AASHTO. “Surface Transportation and Policy Recommendations for the National Surface Transportation Policy and Revenue Study Commission,” March 2007. Akinnikawe, A., F. Azcarate, C. Ehlig-Economides, J. Longbottom, and A. Tokan-Lowal. “Dualmode Transportation: Impact on the Electric Grid,” presented at 87th Transportation Research Board Annual Meeting, Washington, D.C., January 2008. Anderson, J. Edward, and Sherry Romig. Personal Rapid Transit II Progress-Problems-Potential, 1973 International Conference on Personal Rapid Transit, Minneapolis, Minnesota, University of Minnesota, December 1973. Anderson, J. Edward. “Some Lessons from the History of Personal Rapid Transit (PRT),” presented at the Conference on PRT and Other Emerging Transit Systems in Minneapolis, Minnesota, November 1996. Bishop, Richard J., and Rodney K. Lay. Where the Rubber Consorts with the Road: Observations on the Consortium Approach to Automated Highway System Transportation Research, Society of Automotive Engineers, SAE 970450, 1997. Bishop, Richard. Intelligent Vehicle Technology and Trends, Artech House ITS Library, 2005. BTS. National Household Travel Survey Quick Facts, Bureau of Transportation Statistics, U.S. Department of Transportation, http://www.bts.gov/programs/national_household_travel_survey/ daily_travel.html, accessed August 2007. Carnegie, Jon A., Alan M. Voorhees, and Paul S. Hoffman. Viability of Personal Rapid Transit in New Jersey, final report presented to Governor Jon S. Corzine and the New Jersey State Legislature, NJ Transit, February 2007. Chakravorti, Bhaskar. The Slow Pace of Fast Change: Bringing Innovations to Market in a Connected World, Harvard Business School Press, 2003. CIRT et al. Evaluation and Demonstration of Innovative City Transport, EDICT program final report to the European Commission DG Research, 2001. Corey, E. Raymond. Technology Fountainheads: The Management Challenge of R&D Consortia, Harvard Business School Press, 1997. Cox, Wendell, Alan Pisarski, and Ronald D. Utt. 21st Century Highways Innovative Solutions to America’s Transportation Needs, Heritage Foundation, 2005. Dilger, Robert J. American Transportation Policy, Praeger Publishers, Connecticut, 2003.
59

Dunn, James A., Jr. Driving Forces: The Automobile, Its Energies, and the Politics of Mobility, Brookings Institution Press, 1998. Duvall, M., and E. Knipping. Environmental Assessment of Plug-In Hybrid Electric Vehicles, Electric Power Research Institute Report No. 1015325, July 2007. ENO. National Transportation Organizations: Their Roles in the Policy Development and Implementation Process, 2002 edition, ENO Transportation Foundation, 2002. FHWA. Precursor Systems of Automated Highway Systems, resource materials, U.S. Federal Highway Administration, 1994. FHWA. Highway Statistics 2005, U.S. Department of Transportation, http://www.fhwa.dot.gov/ policy/ohim/hs05/index.htm, accessed August 2007. Fichter, Donn. “Urbmobile Synthesis,” New York State Department of Transportation Planning and Research Bureau, July 1970. Garrison, William L., and Jerry D. Ward. Tomorrow’s Transportation: Changing Cities, Economies, and Lives, Artech House, Inc., 2000. Gibson, David V., and Everett M. Rogers. R&D Collaboration on Trial, Harvard Business School Press, 1994. Goodall, Randal, Denis Fandel, Alan Allan, Paul Landler, and Howard R. Huff. Long-Term Productivity Mechanisms of the Semiconductor Industry, SEMATECH International, 2002. Governor’s Business Council. Texas’ Roadways—Texas’ Future: A Look at the Next 25 Years of Roadway Supply, Demand, Cost, and Benefits, Governor’s Business Council Transportation Task Force, April 2003, http://www.texasgbc.org/pdfs/TX-Future.pdf, accessed August 2007. Heavenrich, Robert M. Light Duty Automotive Technology and Fuel Economy Trends: 1975 through 2006, Advanced Technology Division, Office of Transportation and Air Quality, U.S. Environmental Protection Agency, EPA420-R-06-011, July 2006, http://www.epa.gov/otaq/cert/mpg/fetrends/420s06003.htm, accessed August 2007. Huber, Peter W., and Mark P. Mills. The Bottomless Well, Basic Books, 2005. Ioannou, Petros A. Automated Highway Systems, Plenum Press, 1997. Irving, Jack H., Harry Bernstein, C.L. Olson, and Jon Buyan. Fundamentals of Personal Rapid Transit, D.C. Heath and Company, 1978. ITS/VII. Intelligent Transportation Systems, Vehicle Infrastructure Integration, U.S. Department of Transportation, http://www.its.dot.gov/vii/index.htm, accessed August 2007.
60

London, Paul A. The Competition Solution: The Bipartisan Secret behind American Prosperity, AEI Press, 2005. Miller, William L., and Langdon Morris. Fourth Generation R&D Managing Knowledge, Technology, and Innovation, John Wiley & Sons, Inc., 1999. Moon, Henry. The Interstate Highway System, University of Toledo Ohio, Department of Geography and Planning, Association of American Geographers, 1994. Murdock, Steve H., Steve White, Nazrul Hoque, Beverly Pecotte, Xiuhong You, and Jennifer Balkan. The Texas Challenge in the Twenty-First Century: Implications of Population Change for the Future of Texas, Texas A&M University, Department of Rural Sociology, Center for Demographic and Socioeconomic Research and Education, December 2002. National Academy of Engineering. Review of the Research Program of the FreedomCAR and Fuel Partnership: First Report, National Academy Press, November 2005. National Highway Traffic Safety Administration. Annual Update Calendar Year 2002, Automotive Fuel Economy Program, U.S. Department of Transportation, DOT HS 809 512, September 2003. NCHRP. Future Financing Options to Meet Highway and Transit Needs, Transportation Research Board, National Research Council, National Academy Press, Washington D.C., Project 20-24(49), December 2006. Schafer, Andreas, and David G. Victor. “The Future Mobility of the World Population,” Transportation Research Part A, 34, 171-205, 2000. Schrank, David, and Tim Lomax. The 2005 Urban Mobility Report, Texas Transportation Institute, The Texas A&M University System, http://mobility.tamu.edu, accessed August 2007. Sedor, Joanne, and Harry Caldwell. “The Freight Story: A National Perspective on Enhancing Freight Transportation,” FHWA, U.S. Department of Transportation, November 2002, http://www.ops.fhwa.dot.gov/freight/freight percent5Fanalysis/freight percent5Fstory/ freight.pdf, accessed August 2007. Shladover, Steven, Joel VanderWerf, Mark A. Miller, Natalia Kourjanskaia, and Hariharan Krishnan. Development and Performance Evaluation of AVCSS Deployment Sequences to Advance from Today’s Driving Environment to Full Automation, California PATH Research Report UCB-ITS-PRR-2001-18, University of California Berkeley, August 2001. Texas Department of Transportation. The Texas Transportation Challenge, May 2006, http://www.dot.state.tx.us/publications/government_and_public_affairs/challenge.pdf, accessed August 2007.
61

62
Transportation Research Board. Dualmode Transportation, proceedings of a conference conducted by the Transportation Research Board, TRB Special Report 170, National Research Council, National Academy Press, Washington, D.C., 1976. Transportation Research Board. Review of the National Automated Highway System Research Program, TRB Special Report 253, National Research Council, National Academy Press, Washington, D.C., 1998. Transportation Research Board. Review of the Research Program of the Partnership for a New Generation of Vehicles (PNGV): Seventh Report, National Research Council, National Academy Press, Washington, D.C., 2001. U.S. Department of Commerce. Bureau of Economic Analysis, Gross Domestic Product by State, http://www.bea.gov/regional/gsp/, accessed August 2007. U.S. Department of Defense. Technology Readiness Assessment (TRA) Deskbook, May 2005, http://www.dod.mil/ddre/doc/tra_deskbook_2005.pdf, accessed August 2007. U.S. Department of Transportation. Table 5.5, Highway, Demographic, and Geographic Characteristics of Urbanized Areas in Texas: 2000, Bureau of Transportation Statistics, 2000, http://www.bts.gov/publications/state_transportation_statistics/texas/html/table_05_05.html, accessed August 2007. U.S. Department of Transportation. Transportation Statistics Annual Report, Bureau of Transportation Statistics, October 2003, http://www.bts.gov/publications/ transportation_statistics_annual_report/2003/pdf/entire.pdf, accessed August 2007. U.S. Department of Transportation. National Transportation Statistics 2007, Research and Innovative Technology Administration, Bureau of Transportation Statistics, http://www.bts.gov/publications/national_transportation_statistics/pdf/entire.pdf, accessed August 2007. Zielinski, Susan. “New Mobility: The Next Generation of Sustainable Urban Transportation,” The Bridge, National Academy of Engineering, winter 2006.

APPENDIX A: DUAL MODE STAKEHOLDER/CUSTOMER ASSESSMENT
63


A-1.0. INTRODUCTION The Texas Department of Transportation sponsored research conducted by Texas A&M University to evaluate the feasibility and desirability of dual mode infrastructure options for Texas highways. As a component of this research, industry stakeholders were contacted, and their opinions of these strategies were assessed. Two primary assessment activities occurred: one-on-one interviews with industry professionals and a survey of potential “customers” of a dual mode system—primarily freight-oriented shippers and distributors. This section documents findings from the assessment activities.
A-2.0. SUMMARY OF FINDINGS The following is a summary of stakeholder interview findings. These findings are explored more fully in section A-4.0.
• Dual mode infrastructure systems are viewed with “optimistic skepticism.” Although most interviewees expressed optimistic hope that a new form of transportation infrastructure could demonstrate the benefits as outlined for dual mode systems, all but one of the interviewees stated they viewed the obstacles for implementing such a new infrastructure as insurmountable. These obstacles included: the need for a very long term commitment by both the private and public sectors to dual mode, public opposition to guideway designs and futuristic technologies, and the gap between when facilities are built and when there is sufficient demand to use the facilities.
• If at all possible, backwards compatibility for existing vehicles should be preserved. If
entirely new vehicular systems are necessary to use the dual mode system, then a “chicken and egg” situation emerges. According to interviewees, dual mode infrastructure will remain unused or underutilized until a sufficient number of dual mode–capable vehicles are commercially available, drawing the ire of the public. Conversely, automakers will be unlikely to commit to developing dual mode–capable vehicles until such a time as the U.S. Department of Transportation makes a national commitment to the infrastructure and develops a detailed series of specifications that will not be subject to change. Finally, consumers are unlikely to purchase dual mode–capable vehicles until they are widely available, cost-economical, and offer ready opportunities to use the dual mode system. As one interviewee put it, it took automakers 30 years for hybrids to be commercially viable. If it even took 20 years for dual mode–capable vehicles to reach market viability, it is a long time for the infrastructure to sit unused. The only way to avoid this situation is to develop a dual mode system that permits the existing vehicular fleet to use the infrastructure, permitting a gradual development schedule.
• Demonstrable political commitment must be shown before industry will take dual mode
infrastructure seriously. Interviewees from the utilities, auto manufacturers, and communications industries indicated that dual mode technologies tend to be viewed as a
65

fringe concept, not to be taken too seriously to warrant substantial financial commitment for research and development. However, all interviewees stated that if high level political commitment to dual mode systems was demonstrated by Texas leaders (such as occurred with the Trans-Texas Corridor concept), their respective industry leadership would follow suit.
• As viewed currently, there are substantially more attractive options for energy
alternatives and mobility programs than for dual mode. Although certain components of dual mode infrastructure were viewed quite favorably by interviewees, including the use of the electric grid for transportation operations and performance benefits while on the guideway, other alternatives were seen as not only viable but also more cost-effective than dual mode. Opinions on alternatives varied but included:
o greater integration of land use and transportation planning to reduce the need for new
infrastructure; o incorporation of automated vehicle systems technologies developed in the 1990s on
existing highway corridors and/or managed lanes; o expansion of “proven” guideway transit technologies (light rail transit, bus rapid
transit, etc.); and o alternative fuel vehicles, including plug-in vehicles.
• There are hidden costs and benefits. Some interviewees expressed concern that unit costs are lower than realized, especially considering the need for inline electric energy storage, command-and-control systems, transition infrastructure (between surface streets and guideway), and right-of-way (ROW) acquisition for legacy corridors (where ROW is already likely maximized). Conversely, some “costs” may actually be borne outside of the dual mode projects—expanded electric capacity, for example, would be paid for by long term electric rates. Furthermore, the potential use of existing off-peak capacity through inline storage regeneration could help bring the rate-based cost of electricity down for all. In all, interviewees stated a more expansive and quantified examination of all costs and benefits needs to occur as a logical next step.
• Interviewees wanted more information. The primary questions concerning the
consideration of dual mode technologies included:
o Where will funds for dual mode come from, and will they be additive to existing sources of revenue?
o Can simulation tools be developed to show the transportation benefits and detriments
of dual mode systems?
o Will dual mode strategies encourage urban sprawl, thereby negatively affecting traffic and congestion off the guideway?
66

o Why wouldn’t Texas be better off addressing current and short term needs through transit system expansion than making a long term commitment to a new infrastructure now?
o What are the vehicular volume limits to the guideway? Even at significantly higher
capacity, is it enough to address population and travel growth?
o Will TxDOT conduct a thorough evaluation of all alternatives side by side with dual mode? Will this include primary, secondary, and tertiary effects?
The following is a summary of customer survey findings. These findings are explored more fully in section A-4.0.
• Transportation Infrastructure customer respondents are supportive of dual mode components. Over half of all respondents were favorably or very favorably inclined toward the use of dual mode technologies for passenger and freight transportation, with greater preference for freight uses. Furthermore, one-quarter of respondents viewed real-time electric power from the stationary grid as the most dominant transportation energy source in 20 years.
• Given a choice, transportation infrastructure customers prefer reinvesting in legacy
systems. Expanding and rebuilding the existing highway and bridge infrastructure was preferable to new innovative uses of infrastructure. Customers were divided on how best to pay for new infrastructure, with preference given to taxation on economic productivity or tolls on publicly financed infrastructure over tolls on privately financed infrastructure and fuel taxation.
• Mobile-based energy sources are not a paramount concern. One of the principal benefits
of dual mode strategies—namely, real time provision of transportation energy from the stationary electric grid—is offset by the customers’ perspective on the perceived immediate and long-term availability of petroleum energy and medium-term availability of alternative fuel sources, including hydrogen fuel cells, biodiesel, and battery-based electricity.
A-3.0. INTERVIEW AND SURVEY PROCESS A-3.1. Stakeholder Interviews The stakeholder interview process began with identification of candidate industry representatives, reflecting a cross section of industries involved in the development, power, and use of transportation infrastructure. To this list, Texas A&M University researchers sent an email explaining that Texas A&M, sponsored by TxDOT, was soliciting input from industry stakeholders to gauge their thoughts and opinions regarding dual mode systems. It went on to inform the recipients that they would be contacted to schedule an interview and requested their participation.
67

The purpose of the interviews was to explore stakeholders’ perceptions and opinions of the possible consideration, study, and implementation of dual mode systems in Texas. Issues addressed in each interview included:
• information on the dual mode concept, • an opportunity for the interviewee to ask questions regarding the concept, • an opportunity to make comments and offer opinions regarding the concept, and • an opportunity to offer suggestions regarding next steps for the consideration of these
strategies. One-on-one interviews were conducted by phone with seven industry stakeholders. Participants for the stakeholder interviews were selected based on their professional interest in and impact on the consideration of dual mode technologies. The interviews were conducted by David Ungemah, Texas Transportation Institute (TTI), and Ginger Goodin, TTI. The interviews began with an explanation of the purpose of the discussion and an introduction to the dual mode research project. The interviewers then gave a brief overview and description of the dual mode concept. Once the dual mode concept had been explained, interviewees were given an opportunity to ask questions regarding the presentation of the concept for clarification. After the interviewees’ questions had been answered, they were given an opportunity to share comments and opinions on the concept and the project. The interview concluded with the interviewers asking for suggestions regarding the next steps for research and continued study of the concepts. A-3.2. Customer Survey The customer survey process began with identification of candidate industry representatives, reflecting shippers and distributors with primary use of transportation infrastructure. The eventual list numbered 97 customer representatives. To this list, Texas A&M researchers sent an email explaining that Texas A&M, sponsored by TxDOT, was soliciting input from commercial operators, shippers, and distributors to gauge their thoughts and opinions regarding dual mode systems. This input was collected by an online survey available via www.dualmodesurvey.org. A link to the online customer survey was individually sent to each representative. A follow-up reminder email was sent two weeks following the initial mail-out to the representatives who had not yet taken the survey. The purpose of the survey was to explore stakeholders’ perceptions and opinions of the possible consideration, study, and implementation of dual mode systems in Texas. In addition to the survey questions, a short three-minute video was prepared to illustrate the dual mode concept.
A-4.0. DETAILED RESULTS The following is a summary of the interviews and survey responses. Individual interview summaries are available but are not included in this report for privacy purposes.
68

A-4.1. Stakeholder Responses Stakeholders were asked a variety of questions during the interview (although not every question was asked of each stakeholder). These questions and answers were:
• What role does your industry have in the planning, development, and/or use of transportation facilities in Texas?
a. When vehicle and infrastructure are connected, the automotive industry can have a
role. Technology will play a role—the kinds of vehicles you build relate to the kinds of industry that are set up.
b. Only to the extent that electrified transportation comes into play. Currently, electricity providers need to provide for capacity and infrastructure in light rail systems. They’ll also pay for a portion of the infrastructure to provide the electricity to rail, due to profit margin from rents in the long term. Electric loads from rail wouldn’t require new generation capacity if storage were included in the system.
c. Transportation planning and development in a major metropolitan region in Texas. d. We are an administrative agency ensuring that federal funds are spent appropriately,
so we have involvement in all those decisions (planning, development, and use of facilities).
e. Review and advocate environmental stewardship in transportation development. f. (A) Support the highway system through needed communications structure for the
control of the system and the vehicles using the system. (B) With over 652 locations and 1100 vehicles in Texas, we are a major user of the system.
• What is your industry’s perspective on transportation in Texas? How do you distinguish
short term and long term transportation problems?
a. Energy—increasing role in transportation in the future. Example: “Plug-In Partners” campaign with major municipalities. Persuade the automotive industry to pursue cars that run on electricity.
b. Same concerns as everyone—not enough money, increasing demand, congestion is projected to grow faster than we can keep up. Short term, up to five years: focus on bottleneck removal, system efficiency. Long term: adding capacity and changing travel behavior (long range supply and demand).
c. Transportation is necessary, vital, and there’s not enough available in Texas to deal with the demand. Our agency addresses both forecasted demand and dealing with issues associated with existing demand.
d. Planning tools for alternatives and externalities is extremely lacking in Texas. TxDOT could look into an urban simulation model for the state that integrates land use and transportation into a simulation model. It’s the most practical analytic tool available in the United States for urban simulation. Oregon/Washington are currently deploying this. Texas could develop statewide and metro sketch-planning models that integrate land use, transportation, and prices for transport.
e. The current system is good and well maintained (short term), but with the growing numbers of new users, the system will be overrun in the next 10 years (long term) without major expense in repair and new construction.
69

• What is your perspective on the availability and utilization of different types of transportation energy (including petroleum, ethanol, biodiesel, hydrogen, etc.)?
a. Battery limitations are making it difficult for vehicle alternatives. Industry really
doesn’t know what the viability of alternative fuels is. Efficiency improvements can be made, but whether it’s enough is unknown. Grid electrification can still play a role but through plug-in for battery storage. So, from this perspective, dual mode is a perfect system to consider at this time—before we get too far down the road.
b. Pacific Northwest Labs: plug-in vehicles at off-peak hours (with controls as to when they are charged); 75 percent of today’s vehicles could be replaced by plug-in vehicles that would require no increase in generating capacity (if charged in the off-peak). One byproduct would be higher utilization of assets—decreasing everyone’s rates in return. One energy provider set aside $1 million in rebates to purchasers of electric vehicles (electric bikes, scooters, and neighborhood electric cars).
c. Do not have a position on type of fuel but rather the consequence of alternative fuels from an air quality standpoint. We are concerned about the health of our region’s citizens as a consequence of transportation. As it relates to dual mode: why wouldn’t we put our available funding into alternative fuels for the current vehicle fleet to achieve better air quality rather than develop a new infrastructure?
d. In my opinion, it’s hard to beat the traditional gas engine; a change to a new paradigm will be evolutionary rather than revolutionary. The change will be a matter of economics and affordability for the average citizen purchasing the automobile.
e. Fuel issues: environmentalists are concerned that the current approach to ethanol does not make sufficient reference to carbon content. Carbon intensity needs to be addressed. Conventional ethanol has marginal benefits to emissions; use of coal could increase greenhouse gases. Switchgrass pilots suggest some benefit to greenhouse gas reductions, but the technology for the large scale commercial level currently is lacking. Need a low carbon fuel standard for any liquid fuel substitute.
f. Two main issues with different types of system are (A) a good distribution system statewide is needed; (B) what percentage of the vehicles on the road today can use the new energy source? And are we looking at new vehicles only (under four years of age) for these new systems?
• Have you heard of dual mode concepts, and if so, what do you know about them?
a. Very little information; had some conversations with Jerry Roane. b. I have heard of “smart highway concepts”; I understand their goals are to increase
safety and corridor efficiency. c. Yes, but I have not paid much attention because of enormous infrastructure
requirements. This reminds me of the automated highway demonstration in San Diego in 1997. It was proven, and then nothing happened. It requires both new autos and new infrastructure, and the auto manufacturers are not likely to develop vehicles if the infrastructure is not forthcoming. There has been no political will to do automated highways within HOV lanes, although the technology was been proven, so why would this be any different?
d. Only guided bus systems.
70

e. People have been talking about this type of system for years (ITS), and I have full knowledge of most systems on the drawing board today.
• What is your initial reaction to these (dual mode) concepts?
a. Power through fixed infrastructure is very appealing. Separating the power from the battery is very good—helps the electrification of transportation.
b. Personal reaction (R&D guy) is “this is neat stuff.” However, colleagues’ reactions do not embrace it—“pie in the sky,” not feasible, impractical. If TxDOT presented this material (as opposed to Texas A&M/University of Texas academics) and asked for industry participation, it would get a very different response—it would show “it’s practical,” instead of academic whimsy.
c. The concept sounds great. However, it seems to have a low potential for implementation because of all the moving pieces that have to come together—infrastructure and vehicles both. You are changing both the supply and demand side, in that it requires new vehicles or retrofit of existing vehicles on the demand side and retrofitting or building new infrastructure on the supply side. And we already have huge problems building enough facilities to meet current demand. I also see this as being very rough to implement from a public acceptance standpoint. The diagrams in the materials show cool-looking monorail structures that in reality would be very difficult to put into place from a public acceptance perspective. We face extraordinary public pushback on elevated structures or additional ROW.
d. Neat idea, nice goal. But the reality is that it will be a very long time before it would be implemented, other than in a demonstration.
e. General skepticism for automated highway systems. Dual mode systems may require high capital costs and may facilitate sprawl with ever-affluent far-flung communities (where the time cost of long commutes goes down). Will we fully internalize the external costs of mobility through dual mode? So far, the transportation industry does a poor job of capturing and internalizing the hidden costs of mobility upon air and water, noise, public health, climate, and social-economic costs. We’ve only just begun accounting for these. Until we do a better job of capturing and internalizing these costs, it is imprudent for us to invest large sums of money in new systems that also hide these costs.
f. Question the compatibility of the new systems with a large percentage of the vehicles on the road today.
• Do the described benefits seem reasonable? Are there others?
a. Energy-related benefits track with industry perspective. Other advantages are guideway and control, which help transportation performance. Authoritative resource on environmental impact of plug-in hybrid: July 19, 2007 (National Resources Defense Council & Electric Power Research Institute). Addressed emissions benefits of the use of electricity. Even with coal plants, plug-in hybrids reduce emissions. In the future, de-carbonization only improves. Cleaner than existing vehicle fleet and only gets cleaner.
71

b. Generally yes, but I didn’t see anything quantitative. Due to availability of current vehicles, I wonder how realistic this is in the short term in terms of changing the vehicle fleet in order to get to the lane equivalence expressed. I also doubt the public will react favorably to high speeds with confidence in a control system being responsible for low headways; that will be a tough sell.
c. Yes, no others come to mind. d. The United Kingdom’s Eddington Report provides a great framework for evaluating
both the benefits and costs. It’s in economic competitiveness context. e. Benefits of the system are good with safety being in the lead.
• Do the identified costs seem reasonable? Do you have other concerns?
a. What compromises do you make on the vehicle that may limit adoption and/or
desirability? Some vehicle concepts are not very appealing. Giving up control for the consumer can be a problem.
b. New capacity-generation requirements could be offset with storage possibilities but likely would require new capacity with a large system. If storage is built into the system, then this can be reduced. Capacity costs would likely be paid by the energy industry with a view to the future of electricity rate payments as paying back costs.
c. First reaction: costs seem high. But rethinking: $40 million per mile is what light rail (LRT) costs in the urban environment, so it’s hard for me to believe we can put in a more complicated infrastructure for that price. So the unit costs seem low. What about improvements to the electrical grid? Addition of control centers? Transition infrastructure from surface street to guideway? What about highways with extremely limited ROW? It doesn’t seem possible that those costs have been included.
d. I have no idea if the costs are reasonable. e. The costs appear to be inline with current pricing, but with this being a long run
project I see that cost may and will be overrun going forward.
• How would your industry likely react to this concept? Are there any particular benefits or concerns that they may tend to concentrate on?
a. There needs to be some level of backward compatibility in order to sell the system to
consumers. The more vehicles can look like “normal” vehicles, the more acceptable the system will be for industry and for consumers.
b. Off-peak capacity utilization and emissions benefits. c. I expect most public transportation agencies will see this as a nice concept to try to
develop, but it has a long way to go before being implementable in a broad way. Concerns to concentrate on: public education and cost. Right now we are having trouble communicating the concept of congestion pricing. The most logical approach would be to demonstrate in limited corridors under a long trip scenario (I-35 corridor from Lewisville to LBJ, for example). However, how do you deal with the vehicle availability issue? What vehicles would use it—new or retrofitted—and how large a fleet would that be? This is similar to the industry dealing with alternative fuels for their own vehicle fleets, with natural gas, for example. Refueling locations were
72

d. Generally favorable to research and test some of it, and prove feasibility, but implementation would be a local decision. FHWA may fund test locations through research or ITS funding. Our interest would be in such benefits as air quality, zero emissions, higher capacity, reliability, and safety. On the concerns side: cost first and foremost, political will, public acceptance (resistance to change).
e. Systems-based electrical energy—the perspective that electricity can solve emission problems is naïve. It all depends upon how you produce energy: can have up to 70 percent loss of energy from fuel to electrical power generation. Need to look at the lifecycle of impact in electricity, as well as equipment that create and convert power (e.g., how does the electricity convert to transportation movement). To have environmental sector support, dual mode would need to demonstrate that it obtains its electricity in a way that doesn’t just shift carbon emissions from the tailpipe to the smokestack.
f. The reaction would be good because it would reduce our time on the road, increase our safety, and reduce our fuel cost.
• To be most effective, dual mode systems require significant investment in new
infrastructure. What reaction within your industry do you expect for this new investment?
a. Industry would opt for research to be spent in conventional areas (e.g., batteries,
automated highway systems). But dual mode research could pay higher dividends in the long term. Vehicle systems can be a challenge, propulsion could be conventional (and even less expensive than hybrids)…the vehicle isn’t the issue.
b. Safer bet = electricity for vehicles (plug-in hybrids, for example). Existing and future focus will be on convincing automobile manufacturers to build electric models. Focus: “soft order” by a stakeholder/community influencer to convey to car companies, “We want to buy XXXX number of electric vehicles.”
c. Expensive, and wouldn’t we be better off dealing with the congestion and safety issues by expanding current light and commuter rail systems? With dual mode, you still have to deal with parking issues on the end-trip side. In other words, you are not necessarily changing the behavior of the commuter, not supporting sustainable development, and would still have to park and circulate at the destination.
d. We don’t have enough funding to even maintain what we have, so implementing a brand new infrastructure would be difficult at best.
e. The reaction would be good due to the long run benefits.
• Does the cost of alternative actions (such as large-scale rehabilitation of highway systems and airport expansions) change your opinion about dual mode? Why or why not?
a. Insights to be gained from looking at E-85 fleet… Would like to see a more extensive
network of E-85 to justify current investments—it’s been 10 years. So, what would dual mode look like? How much network would need to be built before industry would build vehicles to fit? The more the system can be “backwards compatible,” the
73

b. More robust LRT or commuter rail system seems like a more prudent approach for equivalent funding. The long-term key to addressing our transportation concerns is through changing travel behavior, and rail would be better at that.
c. People will resist paying for what they already view as “paid for.” However, Pennsylvania and Colorado both point toward opportunities to take corridor rehabilitation and make it better. Are user fees a component? Are new technologies a component? Do you add new transit? If so, what does it look like? Choice and alternatives are very important—dual mode should look to improve options, not just expand what we already have.
d. No, because the cost to rebuild and upgrade the current system could and would be greater than going to a new system that supplements the current system.
• Assuming dual mode systems are viable and desirable, how would you propose financing
the infrastructure?
a. The automotive industry should be a side-by-side partner in dual mode development, due to the chicken-and-egg issue…it’s too risky for both sides to be too far out in front of the other. Automakers are very amicable to the idea of partnership—look at E-85 and hydrogen initiatives.
b. The change from fossil fuels to untaxed fuels will require a change in taxation to pay for the roads. This is a small issue; user-pay systems can move quicker than the technology. Miles driven taxes make more sense anyway.
c. Would have to rely on a major infusion of new capital, either from the government or other source (gas tax and vehicle registration won’t cut it). User fees to support an implementation cost of $40 million/mile does not seem reasonable to cover full costs.
d. Some options: increase in the gas tax would be required (we can’t deal with what we have with the current gas tax), or privatizing, or possible toll surplus money (but that won’t go over well with toll agencies).
e. Environmental sector strongly in favor of aligning how we finance transportation with revenue instruments that better manage and operate the system for high performance. New investments in transportation should be guided by what helps us benefit from performance enhancement and minimize emissions. Congestion charges and other user fees need not be applied only to new capacity but also to increasing share of existing capacity to help us minimize new capacity investments to meet mobility needs. Performance goals of minimizing environmental footprint. Recognize politics are difficult.
f. Transportation tax on all vehicles using the Texas system through a permit system (toll) based on a weight.
• There are some potential short term options to demonstrate dual mode systems. One is an
intercity driverless freight system (terminal to terminal), reducing the number of trucks on intercity highways. Another is to provide express-like service in an urban setting between large park-and-rides (similar to a taxi-like service). What is your opinion of
74
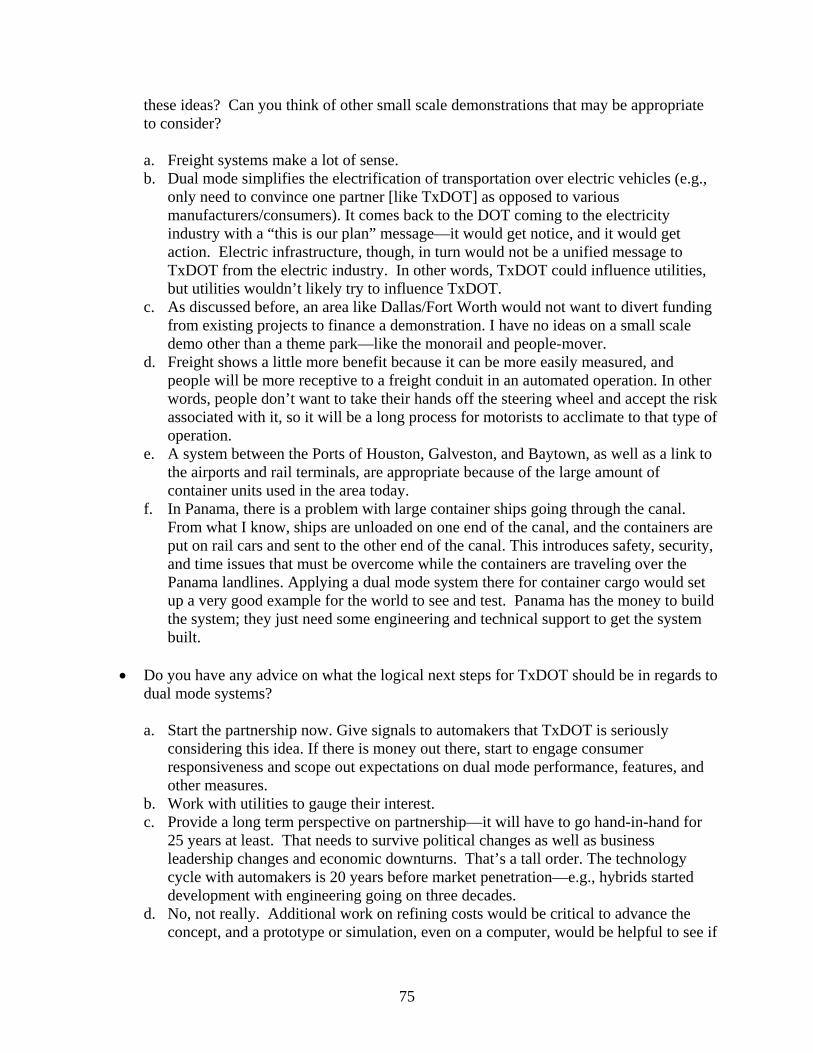
these ideas? Can you think of other small scale demonstrations that may be appropriate to consider?
a. Freight systems make a lot of sense. b. Dual mode simplifies the electrification of transportation over electric vehicles (e.g.,
only need to convince one partner [like TxDOT] as opposed to various manufacturers/consumers). It comes back to the DOT coming to the electricity industry with a “this is our plan” message—it would get notice, and it would get action. Electric infrastructure, though, in turn would not be a unified message to TxDOT from the electric industry. In other words, TxDOT could influence utilities, but utilities wouldn’t likely try to influence TxDOT.
c. As discussed before, an area like Dallas/Fort Worth would not want to divert funding from existing projects to finance a demonstration. I have no ideas on a small scale demo other than a theme park—like the monorail and people-mover.
d. Freight shows a little more benefit because it can be more easily measured, and people will be more receptive to a freight conduit in an automated operation. In other words, people don’t want to take their hands off the steering wheel and accept the risk associated with it, so it will be a long process for motorists to acclimate to that type of operation.
e. A system between the Ports of Houston, Galveston, and Baytown, as well as a link to the airports and rail terminals, are appropriate because of the large amount of container units used in the area today.
f. In Panama, there is a problem with large container ships going through the canal. From what I know, ships are unloaded on one end of the canal, and the containers are put on rail cars and sent to the other end of the canal. This introduces safety, security, and time issues that must be overcome while the containers are traveling over the Panama landlines. Applying a dual mode system there for container cargo would set up a very good example for the world to see and test. Panama has the money to build the system; they just need some engineering and technical support to get the system built.
• Do you have any advice on what the logical next steps for TxDOT should be in regards to
dual mode systems?
a. Start the partnership now. Give signals to automakers that TxDOT is seriously considering this idea. If there is money out there, start to engage consumer responsiveness and scope out expectations on dual mode performance, features, and other measures.
b. Work with utilities to gauge their interest. c. Provide a long term perspective on partnership—it will have to go hand-in-hand for
25 years at least. That needs to survive political changes as well as business leadership changes and economic downturns. That’s a tall order. The technology cycle with automakers is 20 years before market penetration—e.g., hybrids started development with engineering going on three decades.
d. No, not really. Additional work on refining costs would be critical to advance the concept, and a prototype or simulation, even on a computer, would be helpful to see if
75

the public is even receptive to the idea. This seems like the Texas response to “Texans won’t get out of their vehicles,” and this does not get to the fundamental issue of changing travel behavior.
e. No, other than maybe additional study. But unless there is a lot of money coming in from a new source, the likelihood for implementation is slim.
f. TxDOT needs to do a thorough evaluation of rail alternatives side-by-side with dual mode and consider a full bundle of primary, secondary, and tertiary impacts upon demand, land use, and other factors from any alternative. What would full-cost pricing of any infrastructure be if users were to pay for full externalities, including greenhouse cost mitigation? Hot spot analysis of corridors—take all into account.
g. Needs to be an evaluation of mitigation of impacts upon nearby communities—such as emission-based impact fees. Dual mode could factor in positively on this versus road capacity expansion. Holistic technology and alternatives comparison (including full-corridor road pricing and smart growth strategies to reduce average trip lengths). Need to consider a carbon-constrained world in long-term development.
h. Explain ozone and earth heating issues associated with the large amount of gas being used by the expected amount of vehicles. Show Texas how much money they will be losing if they do not begin to plan for the new vehicles’ load on the current system. Show the safety benefits around using the dual mode system.
A-4.2. Survey Responses Customer representatives were asked a variety of questions in the survey instrument. It should be noted that this survey is not to be viewed as a statistically valid, quantitative sample of shippers, commercial operators, or distributors. Rather, these results should only be used to illustrate potential opinions that may emerge from these sectors. The findings from the survey were: 1. Which of the following best describes your industry?
Which of the following best describes your industry?
Other, 12.5%
Energy Retail/ Production/
Wholesale, Distribution, 37.5%12.5%
Non-automotive Manufacturing,
12.5%
Transportation/ Warehousing,
25.0%
76

2. If you were to prioritize, from most important to least important, the following transportation investment needs, what would your ranking be?
Rank Preferred Solution
1 Expand existing highway and bridge infrastructure 2 Build and expand high capacity freight transport infrastructure 3 Rebuild existing highway and bridge infrastructure 4 Evaluate use of new innovative transportation concepts 5 Build and expand high capacity mass transit/rail 6 Reduce travel demand through land use and other controls
3. Please prioritize, from best option to worst option, how society should pay for these
transportation improvements.
Rank Preferred Financing Tool 1 (tie) Taxation on economic productivity (e.g., “sales tax,” “head tax”) 1 (tie) User fee (toll/fare) to pay back publicly financed infrastructure 3 (tie) Taxation on fuels (e.g., “the gas tax”) 3 (tie) User fee (toll/fare) to pay back privately financed infrastructure
4. If you had to choose between the following options, which would you choose?
Which is the better option for transportation
infrastructure development?
It is better to reinvest in existing
infrastructure (such as the highway system),
as substantial investment in personal vehicles, professional
expertise, and physical capital has already been made
43%
It is better to consider new infrastructure
options that are shown to be more
efficient and reliable, even if they require new investments in personal vehicles,
professional expertise, and physical infrastructure
57%
77

5. To your knowledge, which of the following best reflects your industry’s perspective on the availability of petroleum energy within the next 10 years?
Availability of Petroleum in Short Term
Increasingly scarce and expensive,
29%Rapidly scarce and highly expensive,
0%
Abundant and affordable,
0%
Available with declining
affordability, 71%
6. To your knowledge, which of the following best reflects your industry’s perspective on the availability of petroleum energy between 10 and 20 years?
Increasinglyscarce andexpensive,
58%
Available with declining
affordability, 14%
Abundant and affordable,
14%
Rapidly scarce and highly expensive,
14%
Availability of Petroleum in Medium Term
78

7. Which of these alternative transportation energy forms do you believe has the potential to become dominant in the next 10 to 20 years?
Potential Transportation Energy Source in Medium Term
70%
60%
50%
40%
30%
20%
10%
0%
Biofuels or synthetic
liquid fuels
Hydrogen gas or liquid
Electricity ElectricityGaseousreal time batteryfuels-
8. What is your initial reaction to the idea of constructing fixed guideways with electrification
for personal transportation purposes? For freight transportation?
Favorability of Dual Mode Systems
45%
40%
35%
30%
Very favorableFavorable 25%
Neutral/no opinionUnfavorable20%Very unfavorable
15%
10%
5%
0%
Personal Freight
79

80
9. If you were to prioritize, from most important to least important, the potential benefits of dual mode as listed below, what would your ranking be?
Rank Benefit
1 Reduced travel times 2 Reduced volatility in energy/fuel costs 3 Better travel time reliability 4 Improved safety at high speed 5 Zero emissions for vehicles on the guideways 6 Greater throughput capacity (per infrastructure dollar invested) 7 Reduced costs relative to highway capacity 8 Reduced driver costs 9 Sensitivity to driver hours of service rules 10 Improved security of shipments in route 11 Driverless/autopilot function in guideway mode 12 Improved economic development opportunities 13 Construction dollars/commitment of investment 14 Improved convenience for travel over 20 miles in length 15 Reduction in airport congestion
10. If you were to prioritize, from most important to least important, the potential concerns of
dual mode as listed below, what would your ranking be?
Rank Concern 1 May require changeover in passenger/freight fleet vehicles 2 Cost of building new infrastructure 3 Unproven technology for throughput 4 Reliability concerns 5 Availability/reliability of electric grid 6 Interface with existing roadway/highway network 7 Attractiveness/aesthetics of elevated guideway system 8 Erosion of fuel tax revenues 9 Urban sprawl 10 Negative impact on air travel 11 Security (due to concentrated population flows)

APPENDIX B: TABLE OF DUAL MODE AND PRT SYSTEMS
81

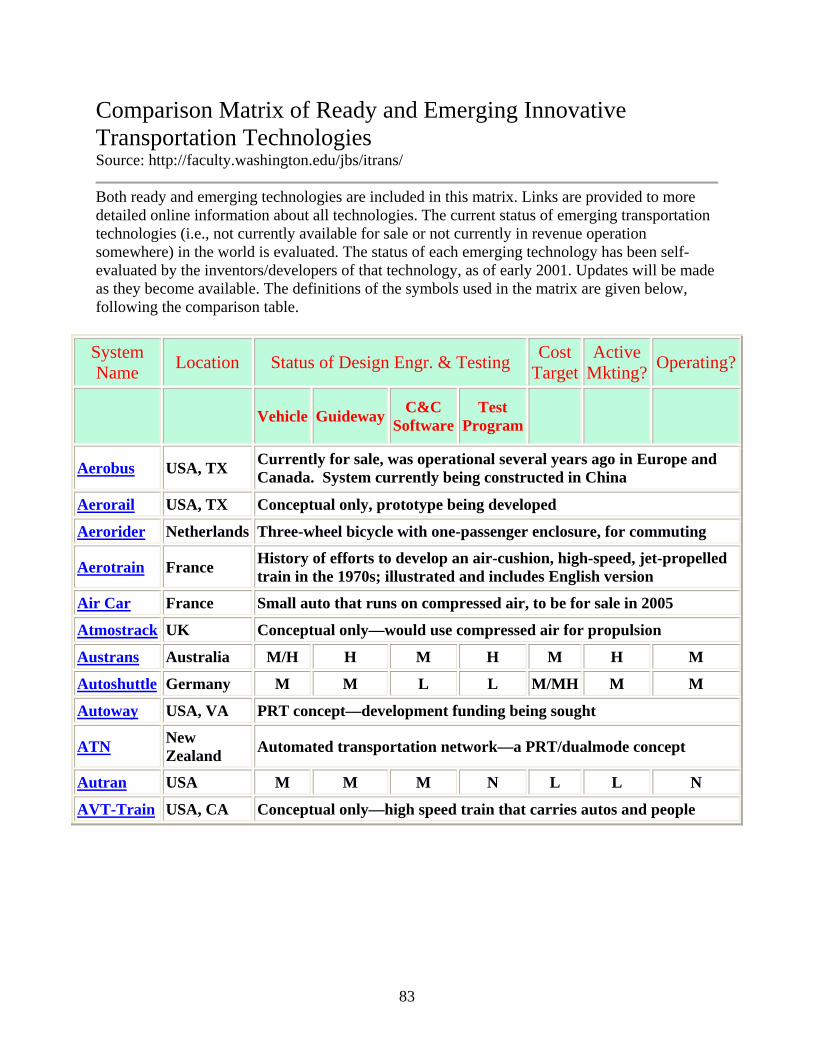
Comparison Matrix of Ready and Emerging Innovative Transportation Technologies Source: http://faculty.washington.edu/jbs/itrans/
Both ready and emerging technologies are included in this matrix. Links are provided to more detailed online information about all technologies. The current status of emerging transportation technologies (i.e., not currently available for sale or not currently in revenue operation somewhere) in the world is evaluated. The status of each emerging technology has been self-evaluated by the inventors/developers of that technology, as of early 2001. Updates will be made as they become available. The definitions of the symbols used in the matrix are given below, following the comparison table.
System Name Location Status of Design Engr. & Testing Cost
Target Active
Mkting? Operating?
Vehicle Guideway C&C Software
Test Program
Aerobus USA, TX Currently for sale, was operational several years ago in Europe and Canada. System currently being constructed in China
Aerorail USA, TX Conceptual only, prototype being developed
Aerorider Netherlands Three-wheel bicycle with one-passenger enclosure, for commuting
Aerotrain France History of efforts to develop an air-cushion, high-speed, jet-propelled train in the 1970s; illustrated and includes English version
Air Car France Small auto that runs on compressed air, to be for sale in 2005
Atmostrack UK Conceptual only—would use compressed air for propulsion
Austrans Australia M/H H M H M H M
Autoshuttle Germany M M L L M/MH M M
Autoway USA, VA PRT concept—development funding being sought
ATN
New Zealand Automated transportation network—a PRT/dualmode concept
Autran USA M M M N L L N
AVT-Train USA, CA Conceptual only—high speed train that carries autos and people
83

System Name Location Vehicle Guideway Software Test? Cost? Mkting? Operating?
Blade Runner
UK Uses vehicles with rubber tires and retractable steel wheels for dualmode capabilities, cargo and passenger modes
BT Korea High-capacity dualmode concept under development, website features excellent animations of system in operation, many application illustrations
Cabintaxi USA, MI Extensive test facility and development program completed in Germany in 1979. Shuttle system in operation since 1976. U.S. company pursuing private sector applications
Car Bus USA, CA Conceptual only, other versions called autobus and Personal Mass Transit
CargoRail USA, TX Cargo carrier version of MegaRail, under development
Capsi
South Africa Conceptual only, PRT approach uses small vehicles in a tube
City Mobility
Netherlands Conceptual only
City Shuttle USA, GA Conceptual only, designed to provide a shuttle service for major activity centers and other high density areas in the city
CompuCar Germany Conceptual only, small electric cars on automated guideway, dualmode possible eventually
Coaster Austria Test track and vehicles developed and undergoing testing, both alpine and urban versions being developed
CULOR USA L L L L L L L
CyberCab Netherlands H H H H L H H
CyberCab Finland Concept only, as described in 1996 book about the future
CyberTran
USA, CA, NY H H M/H M/H L M/H M/H
Dragonfly MonoMetro
UK Suspended monorail, final stages of design, prototype to follow, patents pending
Dualmode Vehicle
Japan Minibus that can be operated on conventional rail as well as roadways, prototype completed by Japan Railways, development continuing in 2005
Easy-Rider Finland A dynamic carpool service now in operation in Amsterdam
Evac. Tube Transport
USA, FL L/M L/M L/M L VL-MH M/H L/M
FlexiTrain New Zea. M M M L VL M L
84

System Name Location Vehicle Guideway Software Test? Cost? Mkting? Operating?
Flash USA, OK Conceptual only, small supported vehicle
Flyway Sweden L L L N VL M L
General Atomics, Urban Maglev
USA, CA One of FTA’s Urban Maglev contractors, prototype and test track operational, demonstration planned at California University in Pennsylvania
Gimbal Craft
USA H H L M VL M M—ops.
prototype available
Higherway USA, WA N N N N L L N
HighRoad USA,GA L H H N MH H N
HiLoMag USA, WA National dualmode system with high-capacity synchronous maglev guideways (conceptual only)
HSST maglev Linimo line
Japan
For sale, extensive test and demo program continuing, first application in Japan is almost completed. Has been studied in the U.S. under an FTA Urban Maglev contracts. First public service scheduled on Linimo line for March 2005
Hytran USA, IL Suspended monorail—conceptual, seeking development funding
Individual Mass Transit
USA, OR A three-tier dualmode concept, conceptual only
Intelligent Grouping Transport
UK, London
An area-wide, dial-a-ride concept, using advanced communications technologies—called Taxibus—utilizes relatively small vehicles
Interstate Traveler
USA, MI Maglev concept under development, includes palletized dualmode, cargo, solar driven hydrogen production and municipal utility capabilities
InTransSys USA, CO Dualmode concept, extensive documentation and video available
JPods USA, MN Small, suspended, computer controlled vehicles, development underway, very good slide show at their website
LEVX maglev by Magna-Force
USA, WA Prototype six-passenger vehicle being developed, uses permanent magnets for suspension and linear motors for propulsion, test track being constructed near Port Angeles, Washington
85

System Name Location Vehicle Guideway Software Test? Cost? Mkting? Operating?
MAGLEV 2000
USA, FL M M/H L L L/M L L
Magnemotion, Urban Maglev
USA, MA One of FTA’s Urban Maglev contractors, working toward demonstration project planned for near future, prototypes operating
Magnetrans USA, CA H M H M M H M
Magplane pipeline
USA, MA H H H H VL M H
Magplane passenger
USA, MA M M M L MH H N
Magtube, Inc. USA, CA Evacuated tube concept using Maglev, focused on moving freight
MegaRail USA, TX M M/H L L VL H L/M, Video available
Mezzanine Transit
USA, TX Conceptual only, being developed in Houston, TX, unique horizontal switching method
MicroRail USA, TX M H L L VL H Prototype early ’02
Mitchell USA, OR M H M H L M N—but ops. video avail.
Monomobile USA, OH M M L M VL M M
Modern Transport System Corporation
USA, CA Developing novel Maglev system, some prototype components currently operational
Modular Automated Individual Transport
European L L M L VL/L M N—good documents
ParkShuttle Netherlands Two systems in full operation (Amsterdam Airport since late 1997 and Rotterdam since early 1999); more systems being deployed
Parry People Mover
UK Features trams of several sizes, powered by a flywheel, no overhead wires. First application now (2003) underway in the UK
86

System Name Location Vehicle Guideway Software Test? Cost? Mkting? Operating?
Pathfinder USA, MI M L L L M M L
POSTECH PRT Project
Korea Research and development project at Pohang University, includes 40 m test track and operational vehicle, Phase II program completed 2003
PRISM USA, MI Dualmode concept being developed at Ford Research Laboratory
PRT 2000 USA, MA Development and test program completed in 2000, awaiting market interest, currently (2003) inactive
Personal Transportation System (PTS)
USA, CA A dualmode concept that features small dualmode vehicles that can also be operated on conventional city streets
Personal Electric Rapid Transit System (PERTS)
USA, VA Maglev, dualmode concept, developed at VPI, scale model constructed, video available (website down as of 1/13/05, to be resumed later)
Puget Pullway USA, WA A dualmode concept that utilizes a modification of existing freeways
RailCab Germany Modular automated railway system that combines a sophisticated undercarriage with the advantages of maglev. using existing railways—for both people and cargo
Rideway USA, CA Conceptual only, moving beltway with passive vehicles
Robocab USA, MD Small automated vehicles on exclusive guideway, prototype vehicle constructed and being tested
Roadrunner USA/UK A very large bus concept
RUF Denmark M/H H/M L H M M H
RUMBA Germany Conceptual only, tube transport concept
Schmid Peoplemover
Germany System for helping pedestrians get across heavily traveled roadways and other barriers to pedestrian movement
Segway USA Conceptual only—a palletized dualmode concept
Serpentine Switzerland H H H M VL M M
Skybikes, Bike Trains
USA Conceptual only—specially designed facilities for serious bike transport
SkyCabs
New Zealand Conceptual only, two-way travel on one monobeam
SkyTaxi Russia Conceptual, small rail vehicles on interesting elevated guideway, in-vehicle switches planned
87

System Name Location Vehicle Guideway Software Test? Cost? Mkting? Operating?
Sky Train USA, FL Redesigned to incorporate fully proven light rail components MH M/H N
SkyTran USA Conceptual only—high speed, small vehicle, low cost, maglev
Skyweb Express
USA, MN H H H M L H M
SmartSkyways USA, CO L L L N L L L
SMRTram USA, MD Conceptual—electric, large-vehicle, two-way travel with one lane
Surrey System USA, MD Conceptual—small automated dualmode vehicles operating in a tube
SwissMetro Switzerland Maglev vehicle in a tube, considerable research has been conducted
System 21 USA, SC M H M L MH H M/L
Taxibus IGT UK Minibuses operated so as to intelligently group passengers using modern telecommunications technology
TriTrack USA, TX H L N L VL L L
TubeXpress USA, NJ Prototypes built and tested, produce market-ready
TubeWay Germany Concept only, uses air pressure and capsules for passenger and cargo
Tubular Rail Texas, USA A unique, monorail-type system that does not require a conventional guideway, for high-speed mass transit applications
ULTra UK H H H H L H M
Unitran Russia Test facility constructed, testing underway. See website for details
Urbanaut USA,WA M M/H M/H MH H M M
VMTS USA, WA Conceptual only—uses large truck to haul small electric vehicles on freeways
Velotaxi Germany For 2 people, muscle-powered with electrical assist, available now
Whoosh UK Conceptual only—monorail that uses compressed air for propulsion
York PRT UK Appears to be a reincarnation of Raytheon’s PRT 2000 technology
Zhonghua-06 China Suspended, light-weight, maglev concept, initial testing underway
88

Symbols Used to Describe the Status of Design Engineering and Testing Programs for Each Technology
Vehicle Development H = Highly developed, fully built, being tested, or ready for testing M = Partially developed, some components/reduced scale prototype built and tested L = Still mostly on paper, some engineering studies completed N = All on paper or elsewhere
Guideway
H = Highly developed, full scale or scale model built, some testing accomplished M = Engineering design, analysis and cost studies completed L = Still mostly on paper, some engineering studies completed N = All on paper or elsewhere
Command and Control Software
H = Software fully developed, simulation capability tested, and available for application studies M = Software designed, partially developed, no simulation capability available as yet L = Concepts in mind, some preliminary studies completed N = Not much progress yet
Testing Program
H = Test track built and being used for vehicle and software testing and demonstrations M = Section of test track built, some testing accomplished L = Only small scale or prototype test facilities available N = No progress on test program other than planning so far
Cost Target (rough estimate of system capital cost, which includes all necessary components for operational system—contact vendor for specifics)
H = More than $30 million/mile ($18.75/km) MH = $20–30 million/mile ($12.5–$18.75/km) M = $10–20 million/mile ($6.25–12.5/km) L = $5–10 million/mile ($3.125–6.25/km) VL = Less than $5 million/mile ($3.125/km)
Active Marketing Program?
H = Established and active sales/marketing program, some market research undertaken M = Brochures, videos, extensive written materials, active website L = Some details and illustrations available N = Not ready for this yet
Operational System Available for Inspection?
H = Test facility in operation and can provide rides and be inspected M = Operating prototype available as are simulation results L = Illustrations and/or static models available
89

N = Nothing available so far
Requests for additions, deletions, improvement or correction should be sent to Jerry Schneider.
90

APPENDIX C: CRITICAL TECHNOLOGY ELEMENTS
AND READINESS LEVELS
91

93
Source: Defense Acquisition Guidebook
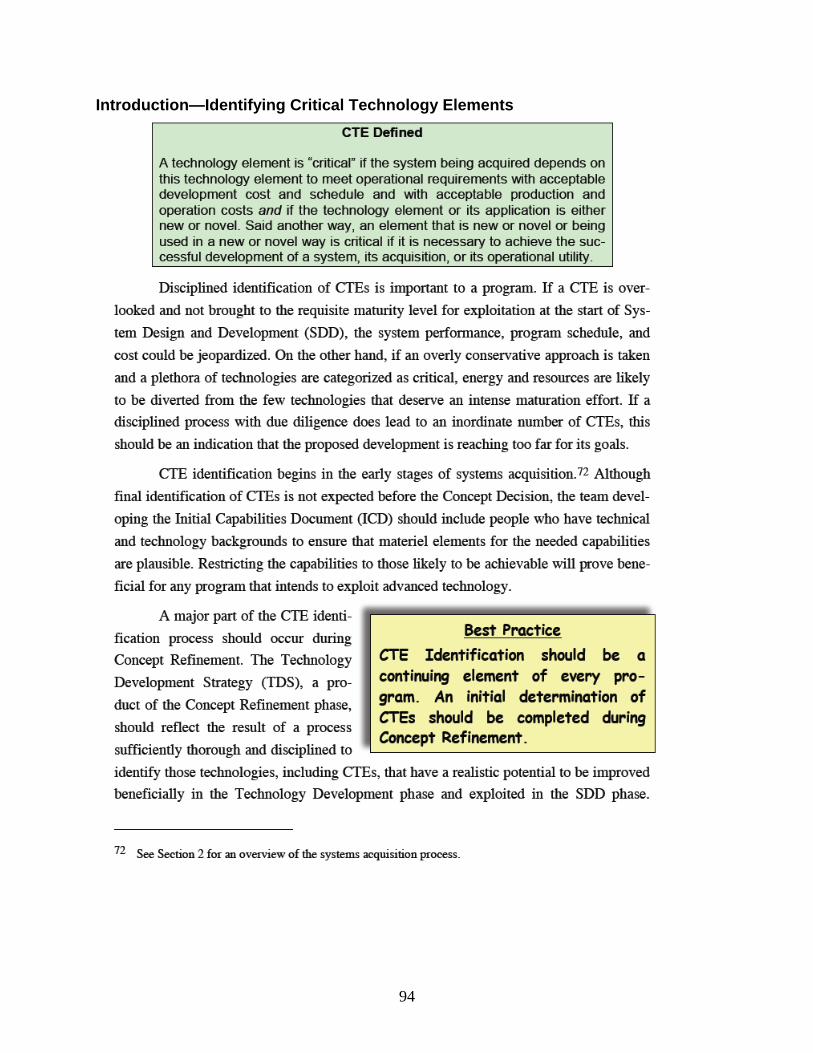
Introduction—Identifying Critical Technology Elements
94

95

96

97

98

99
100

101
102

103

104

105

106
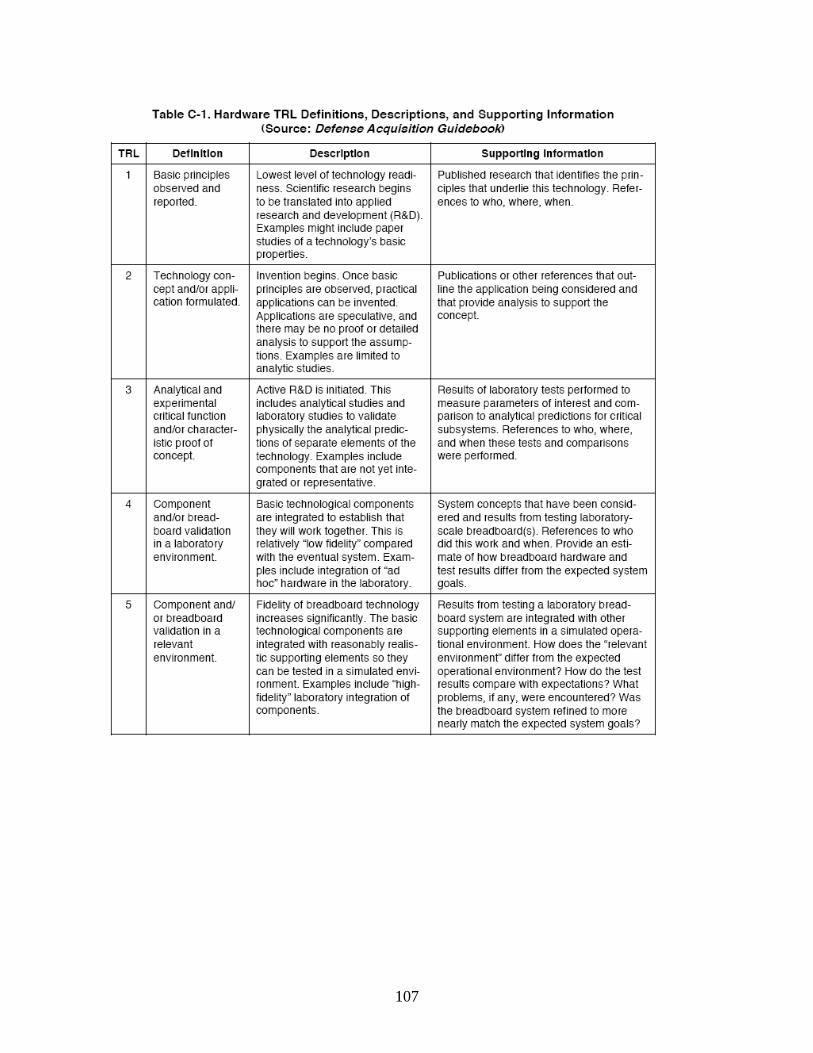
107
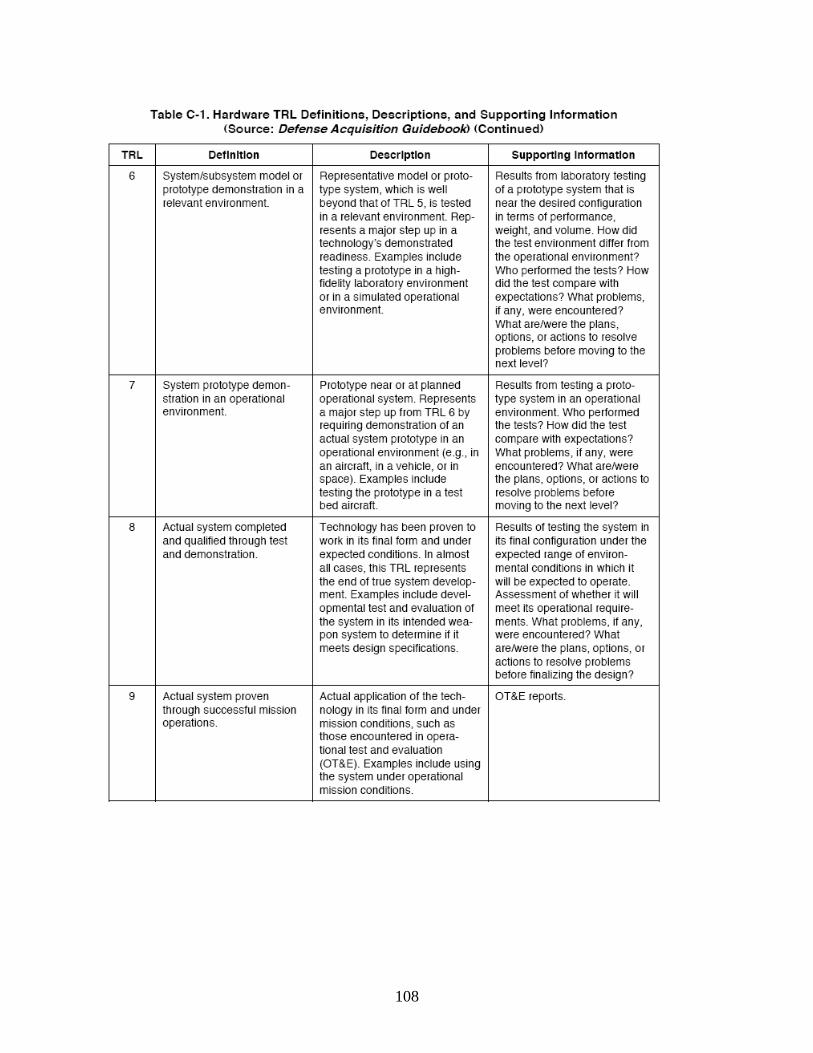
108

109

ASSESSING HARDWARE CTEs Applying the TRL definitions to assess the maturity of hardware technologies appears to be straightforward. For a particular technology, the level of technical readiness that best describes the accomplishments and evidence in light of the TRL definitions should be assigned. In practice, this approach is more difficult than it appears because the TRL definitions often fail to account for all real-life situations. TRL definitions involve several dimensions. One could be called the application level, which assumes values of device, component, subsystem, system, and system of systems. Another could be the environment, which assumes values of laboratory, mathematical model, physical simulation, field test, and operational use. Scale and performance levels are still other dimensions. Some of these dimensions are used explicitly in the TRL definitions, and some are not. In any event, the level of technical readiness is determined by a combination of these dimensions. When the accomplishment and evidence fail to match the definition, the assessor must use judgment regarding the relevance of what has been accomplished and ask whether the accomplishment is equivalent to the TRL definition. Of these dimensions, environment is perhaps the most difficult to interpret. Both TRL 5 and TRL 6 depend on demonstration in a relevant environment. While the specifics of a relevant environment depend on the technology, the criterion is as follows:
A relevant environment for the demonstration of a technology is a set of test conditions that provide confidence that skillful application of that technology to an item (component, subsystem, or system) will support the required (threshold) functionality of that item across the full spectrum of required operational employments.
This criterion intentionally avoids the word “prove” because that would establish a higher, sometimes unreasonable, standard. However, the need to support the full range of required operational employments implies that one or a few demonstrations conducted under the most favorable conditions are not adequate. If a body of data or accepted theory supports with confidence that the efficacy of a technology, though demonstrated only in some useful environment, can be extended to the full spectrum of employments, the demonstration can be considered to have been employed in a relevant environment.
110

Demonstration of a technology in a relevant environment requires successful trial testing that either (1) shows that the technology satisfies functional need across the full spectrum of operational employments, or (2) shows that the technology satisfies the functional need for some important operational employment and uses accepted techniques to extend confidence over all required operational employments.
The steps or activities in system development programs differ with the type of system. However, some of the steps and some of the terminology are generally applicable. Table C-5 lists numerous steps typical of hardware system development programs and indicates the TRL that is supported by this accomplishment. In this table, “Supported” means that the step is at least partial justification for assigning the indicated TRL. “Tested” means not just that a test was run, but also that the test results are consistent with the needs of the application. Note that the items under Accomplishment usually include an application level and an environment and sometimes include a scale or performance level. The accomplishments that support TRLs of 4 through 7 are of particular relevance to TRAs for Milestone B.
111


113
APPENDIX D: LITERATURE LIST


AASHTO. “Surface Transportation and Policy Recommendations for the National Surface Transportation Policy and Revenue Study Commission,” March 2007. Anderson, J. Edward, and Sherry Romig. Personal Rapid Transit II Progress-Problems-Potential, 1973 International Conference on Personal Rapid Transit, Minneapolis, Minnesota, University of Minnesota, December 1973. Anderson, J. Edward. “Some Lessons from the History of Personal Rapid Transit (PRT),” presented at the Conference on PRT and Other Emerging Transit Systems in Minneapolis, Minnesota, November 1996. AVT Business Plan. http://www.avt-train.com/bplan.html, accessed August 2007. Balaker, Ted, and Sam Staley. The Road More Traveled, Why the Congestion Crisis Matters More Than You Think and What We Can Do About It, Rowman and Littlefield Publishers, Inc., 2006. Barber, David B. Nuclear Energy and the Future: The Hydrogen Economy or the Electricity Economy, Institute for the Analysis of Global Security, http://www.iags.org/barber.pdf, accessed August 2007. Bishop, Richard J., and Rodney K. Lay. Where the Rubber Consorts with the Road: Observations on the Consortium Approach to Automated Highway System Transportation Research, Society of Automotive Engineers, SAE 970450, 1997. Bishop, Richard. Intelligent Vehicle Technology and Trends, Artech House ITS Library, 2005. BTS. National Household Travel Survey Quick Facts, Bureau of Transportation Statistics, U.S. Department of Transportation, http://www.bts.gov/programs/national_household_travel_survey/ daily_travel.html, accessed August 2007. Buehrer, Mark S. Wholistic Engineering, Applied to PRT & Dualmode Transportation, http://www.2020engineering.com/pdf/2020eels.pdf, accessed August 2007. Carnegie, Jon A., Alan M. Voorhees, and Paul S. Hoffman. Viability of Personal Rapid Transit in New Jersey, final report presented to Governor Jon S. Corzine and the New Jersey State Legislature, NJ Transit, February 2007. Chakravorti, Bhaskar. The Slow Pace of Fast Change Bring Innovations to Market in a Connected World, Harvard Business School Press, 2003. CIRT et al. Evaluation and Demonstration of Innovative City Transport, EDICT program final report to the European Commission DG Research, 2001. Corey, E. Raymond. Technology Fountainheads, The Management Challenge of R&D Consortia, Harvard Business School Press, 1997.
115

Cox, Wendell, Alan Pisarski, and Ronald D. Utt. 21st Century Highways Innovative Solutions to America’s Transportation Needs, Heritage Foundation, 2005. Dilger, Robert J. American Transportation Policy, Praeger Publishers, Connecticut, 2003. Dunn, James A., Jr. Driving Forces: The Automobile, Its Energies, and the Politics of Mobility, Brookings Institution Press, 1998. ENO. National Transportation Organizations Their Roles in the Policy Development and Implementation Process, 2002 edition, ENO Transportation Foundation, 2002. FHWA. Precursor Systems of Automated Highway Systems, resource materials, U.S. Federal Highway Administration, 1994. FHWA. Highway Statistics 2005, U.S. Department of Transportation, http://www.fhwa.dot.gov/ policy/ohim/hs05/index.htm, accessed August 2007. Fichter, Donn. “Urbmobile Synthesis,” New York State Department of Transportation Planning and Research Bureau, July 1970. Fiske, O.J. The Magtube Low Cost Maglev Transportation System, Launch Point Technologies, http://www.launchpnt.com/uploads/media/001_Fiske_Magtube_01.pdf, accessed August 2007. Garrison, William L., and Jerry D. Ward. Tomorrow’s Transportation: Changing Cities, Economies, and Lives, Artech House, Inc., 2000. Gibson, David V., and Everett M. Rogers. R&D Collaboration on Trial, Harvard Business School Press, 1994. Goodall, Randal, Denis Fandel, Alan Allan, Paul Landler, and Howard R. Huff. Long-Term Productivity Mechanisms of the Semiconductor Industry, SEMATECH International, 2002. Governor’s Business Council. Texas’ Roadways—Texas’ Future: A Look at the Next 25 Years of Roadway Supply, Demand, Cost, and Benefits, Governor’s Business Council Transportation Task Force, April 2003, http://www.texasgbc.org/pdfs/TX-Future.pdf, accessed August 2007. Heavenrich, Robert M. Light Duty Automotive Technology and Fuel Economy Trends: 1975 through 2006, Advanced Technology Division, Office of Transportation and Air Quality, U.S. Environmental Protection Agency, EPA420-R-06-011, July 2006, http://www.epa.gov/otaq/cert/mpg/fetrends/420s06003.htm, accessed August 2007. Heddle, Gemma, Howard Herzog, and Michael Klett. The Economics of CO2 Storage, MIT LFEE 2003—3 RP, http://lfee.mit.edu/public/LFEE_2003-003_RP.pdf, accessed August 2007. Heywood, John B., Malcolm A. Weiss, Andreas Schafer, Stephane A. Bassene, and Vinod K. Natarajan. The Performance of Future ICE and Fuel Cell Powered Vehicles and Their Potential
116
Fleet Impact, MIT LFEE 2003-004 RP, http://lfee.mit.edu/public/LFEE_2003-004_RP.pdf, accessed August 2007. Huber, Peter W., and Mark P. Mills. The Bottomless Well, Basic Books, 2005. Ioannou, Petros A. Automated Highway Systems, Plenum Press, 1997. Irving, Jack H., Harry Bernstein, C.L. Olson, and Jon Buyan. Fundamentals of Personal Rapid Transit, D.C. Heath and Company, 1978. ITS/VII. Intelligent Transportation Systems, Vehicle Infrastructure Integration, U.S. Department of Transportation, http://www.its.dot.gov/vii/index.htm, accessed August 2007. Levin, Joshua Zev. The Perfect Synthesis, http://www.evworld.com/article.cfm?storyid=744, accessed August 2007. London, Paul A. The Competition Solution: The Bipartisan Secret behind American Prosperity, AEI Press, 2005. Magnemotion. The M3 Urban Transportation System, http://www.magnemotion.com/ products/maglev/pdf/M3UrbanSystem.pdf, accessed August 2007. Mazza, Patrick, and Roel Hammerschlag. Carrying the Energy Future: Comparing Hydrogen and Electricity for Transmission, Storage, and Transportation, Institute for Lifecycle Environmental Assessment, June 2004, http://www.ilea.org/downloads/MazzaHammerschlag.pdf, accessed August 2007. McCrary Personal Transport System, http://www.mcpts.com/home.htm, accessed August 2007. McHenry, Bruce A. Long Range Vision for Transportation Technology, http://www.discussit.org/transportation/article/index.htm, accessed August 2007. MegaRail Transportation Systems, Inc. http://www.megarail.com/, accessed August 2007. Miller, William L., and Langdon Morris. Fourth Generation R&D Managing Knowledge, Technology, and Innovation, John Wiley & Sons, Inc., 1999. Monomobile. http://www.monomobile.com/, accessed August 2007. Moon, Henry. The Interstate Highway System, University of Toledo Ohio, Department of Geography and Planning, Association of American Geographers, 1994. Murdock, Steve H., Steve White, Nazrul Hoque, Beverly Pecotte, Xiuhong You, and Jennifer Balkan. The Texas Challenge in the Twenty-First Century: Implications of Population Change for the Future of Texas, Texas A&M University, Department of Rural Sociology, Center for Demographic and Socioeconomic Research and Education, December 2002.
117
NCHRP. Commuting in America III, The Third National Report on Commuting Patterns and Trends, Transportation Research Board, Transportation Research Board, National Research Council, National Academy Press, Washington D.C., 2006. NCHRP. Future Financing Options to Meet Highway and Transit Needs, Transportation Research Board, Transportation Research Board, National Research Council, National Academy Press, Washington D.C., Project 20-24(49), December 2006. National Academy of Engineering. Review of the Research Program of the FreedomCAR and Fuel Partnership: First Report, National Academy Press, November 2005. National Highway Traffic Safety Administration, Automotive Fuel Economy Program: Annual Update Calendar Year 2002, U.S. Department of Transportation, DOT HS 809 512, September 2003. Reynolds, Francis. The Revolutionary Dualmode Transportation System, http://faculty.washington.edu/jbs/rev/revcontents.htm, accessed August 2007. RUF International. http://www.ruf.dk/, accessed August 2007. Schafer, Andreas, and David G. Victor. “The Future Mobility of the World Population,” Transportation Research Part A, 34, 171-205, 2000. Schafer, Andreas. “Long Term Trends in Global Passenger Mobility,” The Bridge, National Academy of Engineering, winter 2006. Schrank, David, and Tim Lomax. The 2005 Urban Mobility Report, Texas Transportation Institute, The Texas A&M University System, http://mobility.tamu.edu, accessed August 2007. Schweizer, Jorg. Modular Automated Individual Transport—The Concept, http://www.maitint.org/, accessed August 2007. Sedor, Joanne, and Harry Caldwell. “The Freight Story: A National Perspective on Enhancing Freight Transportation,” FHWA, U.S. Department of Transportation, November 2002, http://www.ops.fhwa.dot.gov/freight/freight percent5Fanalysis/freight percent5Fstory/freight.pdf, accessed August 2007. Shladover, Steven, Joel VanderWerf, Mark A. Miller, Natalia Kourjanskaia, and Hariharan Krishnan. Development and Performance Evaluation of AVCSS Deployment Sequences to Advance from Today’s Driving Environment to Full Automation, California PATH Research Report UCB-ITS-PRR-2001-18, University of California Berkeley, August 2001. Skyweb Express. http://www.taxi2000.com/the_system.shtml, accessed August 2007. Stephan, Craig, John M. Miller, and Craig Davis. “A Programme for Individual Sustainable Mobility,” Journal of Vehicle Autonomous Systems, Intelligent Vehicle System, 2004.
118

Texas Department of Transportation. The Texas Transportation Challenge, May 2006, http://www.dot.state.tx.us/publications/government_and_public_affairs/challenge.pdf, accessed August 2007. Thornton, Richard D., Tracy Clark, and Brian Perreault. Linear Synchronous Motor Propulsion of Small Transit Vehicles, Proceedings of 2004 JRC: 2004 ASME/IEEE Joint Rail Conference, Baltimore, Maryland, RTD2004-66020, http://magnemotion.com/products/maglev/pdf/ JRC2004_MagneMotion_Paper.pdf, accessed August 2007. Transportation Research Board. Dualmode Transportation, proceedings of a conference conducted by the Transportation Research Board, TRB Special Report 170, National Research Council, National Academy Press, Washington D.C., 1976. Transportation Research Board. Review of the National Automated Highway System Research Program, TRB Special Report 253, National Research Council, National Academy Press, Washington D.C., 1998. Transportation Research Board. Review of the Research Program of the Partnership for a New Generation of Vehicles (PNGV): Seventh Report, National Research Council, National Academy Press, Washington D.C., 2001. TriTrack Dualmode Electric Car, http://www.tritrack.net/, accessed August 2007. U.S. Department of Commerce, Bureau of Economic Analysis. Gross Domestic Product by State, http://www.bea.gov/regional/gsp/, accessed August 2007. U.S. Department of Defense. Technology Readiness Assessment (TRA) Deskbook, May 2005, http://www.dod.mil/ddre/doc/tra_deskbook_2005.pdf, accessed August 2007. U.S. Department of Transportation. Table 5.5, Highway, Demographic, and Geographic Characteristics of Urbanized Areas in Texas: 2000, Bureau of Transportation Statistics, http://www.bts.gov/publications/state_transportation_statistics/texas/html/table_05_05.html, accessed August 2007. U.S. Department of Transportation. National Transportation Statistics 2007, Research and Innovative Technology Administration, Bureau of Transportation Statistics, http://www.bts.gov/publications/national_transportation_statistics/pdf/entire.pdf, accessed August 2007. U.S. Patent 6,619,212, Craig Stephan, John Miller, Craig Davis, Richard Anderson, Ford Motor Company, Method for Achieving and Maintaining Desired Speed on a Guideway System, September 2003. U.S. Patent 6,637,343. Craig Stephan, John Miller, Craig Davis, Richard Anderson, Ford Motor Company, System and Method for Controlling Flow of Vehicles, October 2003.
119
U.S. Patent 6,651,566. Craig Stephan, John Miller, Craig Davis, Richard Anderson, Ford Motor Company, Transportation System, November 2003. U.S. Patent 6,169,954. Homer T. McCrary, Intelligent Public Transit System Using Dualmode Vehicles, January 2001. U.S. Patent 6,198,994. Homer T. McCrary, Intelligent Public Transit System Using Dualmode Vehicles, March 2001. U.S. Patent 6,249,724. Homer T. McCrary, Intelligent Public Transit System Using Dualmode Vehicles, June 2001. U.S. Patent 6,276,542. Homer T. McCrary, Intelligent Public Transit System Using Dualmode Vehicles, August 2001. U.S. Patent 6,721,985. Homer T. McCrary, Intelligent Public Transit System Using Dualmode Vehicles, April 2004. U.S. Patent 6,923,124. Jerry Roane, TriTrack System of Mass Transit, August 2005. U.S. Patent 7,127,999. Jerry Roane, TriTrack System of Mass Transit, October 2006. U.S. Patent 6,401,625. Kirston Henderson, Machine for Transport of Passengers and Cargo, June 2002. U.S. Patent 6,435,100. Kirston Henderson, Machine for Transport of Passengers and Cargo, August 2002. U.S. Patent 6,401,625. Kirston Henderson, Machine for Transport of Passengers and Cargo, June 2002. U.S. Patent 6,615,740. Kirston Henderson, Machine for Transport of Passengers and Cargo, September 2003. U.S. Patent 6,742,458. Kirston Henderson, Machine for Transport of Passengers and Cargo, June 2004. U.S. Patent 6,834,595. Kirston Henderson, Power Rail Steering and Direction Control Apparatus, December 2004. U.S. Patent 6,837,167. Kirston Henderson, Elevated Open Center Transit Guideway with Open Mesh Screen Emergency Walkway, January 2005. U.S. Patent 6,039,135. Kirston Henderson, Machine for Transport of Passengers and Cargo, March 2000.
120

121
U.S. Patent 5,813,349. Palle Jensen, Transport System Composing a Dualmode Vehicle and Platform Layout for Said System, September 1998. U.S. Patent 5,845,583. Palle Jensen, Dualmode Transportation System and Power Unit, December 1998. U.S. Patent 6,523,480. Palle Jensen, Drive System for Transport System of the Dualmode Type, February 2003. U.S. Patent 6,443,683. Frank Randak, System for Transporting Vehicles Using Pallets and Trains, September 2002. U.S. Patent 3,470,827. General Motors, High Speed Land Transportation System, February 1967. U.S. Patent 3,470,828. Gordon Danby and James Powell, Superconducting Maglev, November 1967. U.S. Patent 5,517,924. U.S. Department of Energy, Magnetic Repulsion Guidance and Switching System, May 1996. Weiss, Malcolm A., John B. Heywood, Elizabeth M. Drake, Andreas Schafer, and Felix F. AuYeung. On the Road in 2020: A Life Cycle Analysis of New Automobile Technologies, Energy Lab Report MIT EL 00-003, Massachusetts Institute of Technology, October 2000, http://lfee.mit.edu/public/el00-003.pdf, accessed August 2007. Winiecki, Tad. Higherway Transport Research, http://higherway.us/higherway/mission.html, accessed August 2007. Zeidner, Larry, and Ralph Wood. The Collaborative Innovation Process, United Technology Research Center, http://www.triz-journal.com/archives/2000/06/a/index.htm, accessed August 2007. Zielinski, Susan. “New Mobility: The Next Generation of Sustainable Urban Transportation,” The Bridge, National Academy of Engineering, winter 2006.


123
APPENDIX E: GLOSSARY


AASHTO American Association of State Highway and Transportation Officials AHS Automated Highway System BTS Bureau of Transportation Statistics dB Decibels, a unit for expressing the relative intensity of sounds on a scale
from zero for the least perceptible sound to about 130 for the average pain level
Dual mode A vehicle/infrastructure design that allows vehicles in one mode to navigate
ordinary roads under driver control and in a second mode enter a guideway where electric power is provided to the vehicle in real time and the vehicle is computer controlled
EDICT Evaluation and Demonstration of Innovative City Transport, a European
transportation research and demonstration program FHWA Federal Highway Administration GDP Gross domestic product, a measure of economic output in dollars for the
United States Guideway A special infrastructure that enables real time power delivery and automated
computer control of vehicles ITS Intelligent transportation systems, a program to improve transportation safety
and mobility and enhance productivity through the use of advanced communications technologies
IVI Intelligent Vehicle Initiative NCHRP National Cooperative Highway Research Program OPEC Organization of Petroleum Exporting Countries Platooning Vehicles following closely behind one another to reduce aerodynamic drag
and to maximize throughput capacity of the infrastructure PMT Passenger miles traveled PNGV Partnership for Next Generation Vehicles PPP Public-private partnership
125

126
PRT Personal rapid transit, a guideway-based architecture for people movement
generally using small, lightweight vehicles with direct origin-to-destination service without intermediate stops
TRB Transportation Research Board, one of six major divisions of the National
Research Council—a private, nonprofit institution that is the principal operating agency of the National Academies in providing services to the government, the public, and the scientific and engineering communities
TTM Truck ton-miles, the number of freight tons that have been moved 1 mile via
truck VII Vehicle Infrastructure Integration, deployment of advanced vehicle-vehicle
and vehicle-infrastructure communications that could keep vehicles from leaving the road and enhance their safe movement through intersections
VMT Vehicle miles traveled VOC Volatile organic compounds