du pont 2q15 slides final
TRANSCRIPT

Conference Call
July 28, 2015
DuPont Second Quarter 2015 Earnings

1
Regulation G The attached charts include company information that does not conform to generally accepted accounting principles (GAAP).
Management believes that an analysis of this data is meaningful to investors because it provides insight with respect to ongoing operating
results of the company. These measures should not be viewed as an alternative to GAAP measures of performance. Furthermore, these
measures may not be consistent with similar measures provided by other companies. This data should be read in conjunction with
previously published company reports on Forms 10-K, 10-Q, and 8-K. These reports, along with reconciliations of non-GAAP measures to
GAAP are available on the Investor Center of www.dupont.com under Filings and Reports – Reconciliations and Other Data.
Reconciliations of non-GAAP measures to GAAP are also included with this presentation.
Forward-Looking Statements This document contains forward-looking statements which may be identified by their use of words like “plans,” “expects,” “will,” “believes,”
“intends,” “estimates,” “anticipates” or other words of similar meaning. All statements that address expectations or projections about the
future, including statements about the company’s strategy for growth, product development, regulatory approval, market position,
anticipated benefits of recent acquisitions, timing of anticipated benefits from restructuring actions, outcome of contingencies, such as
litigation and environmental matters, expenditures and financial results, are forward looking statements. Forward-looking statements are
not guarantees of future performance and are based on certain assumptions and expectations of future events which may not be realized.
Forward-looking statements also involve risks and uncertainties, many of which are beyond the company’s control. Some of the important
factors that could cause the company’s actual results to differ materially from those projected in any such forward-looking statements are:
fluctuations in energy and raw material prices; failure to develop and market new products and optimally manage product life cycles; ability
to respond to market acceptance, rules, regulations and policies affecting products based on biotechnology; significant litigation and
environmental matters; failure to appropriately manage process safety and product stewardship issues; changes in laws and regulations or
political conditions; global economic and capital markets conditions, such as inflation, interest and currency exchange rates; business or
supply disruptions; security threats, such as acts of sabotage, terrorism or war, weather events and natural disasters; ability to protect and
enforce the company’s intellectual property rights; successful integration of acquired businesses and separation of underperforming or non-
strategic assets or businesses, including timely realization of the expected benefits from the separation of Performance Chemicals. The
company undertakes no duty to update any forward-looking statements as a result of future developments or new information.
Developing Markets
Total developing markets is comprised of Developing Asia, Developing Europe, Middle East & Africa, and Latin America. A detailed list of
all developing countries is available on the Earnings News Release link on the Investor Center website at www.dupont.com.

2Q 2015 Financial Highlights* $ in millions, except EPS
2
2Q15 vs. 2Q14
EPS
Operating earnings** $1.18 1%
GAAP earnings $1.03 (10%)
Segment Operating Earnings** $1,586 (10%)
2Q15 vs. 2Q14
Consolidated Net Sales $8,595 (11%)
Currency Impact (5%)
Portfolio (2%)
Local Price & Product Mix (2%)
Volume (2%)
* Note that 2Q 2015 includes results for Performance Chemicals
** See appendix for reconciliations of Non-GAAP Measures
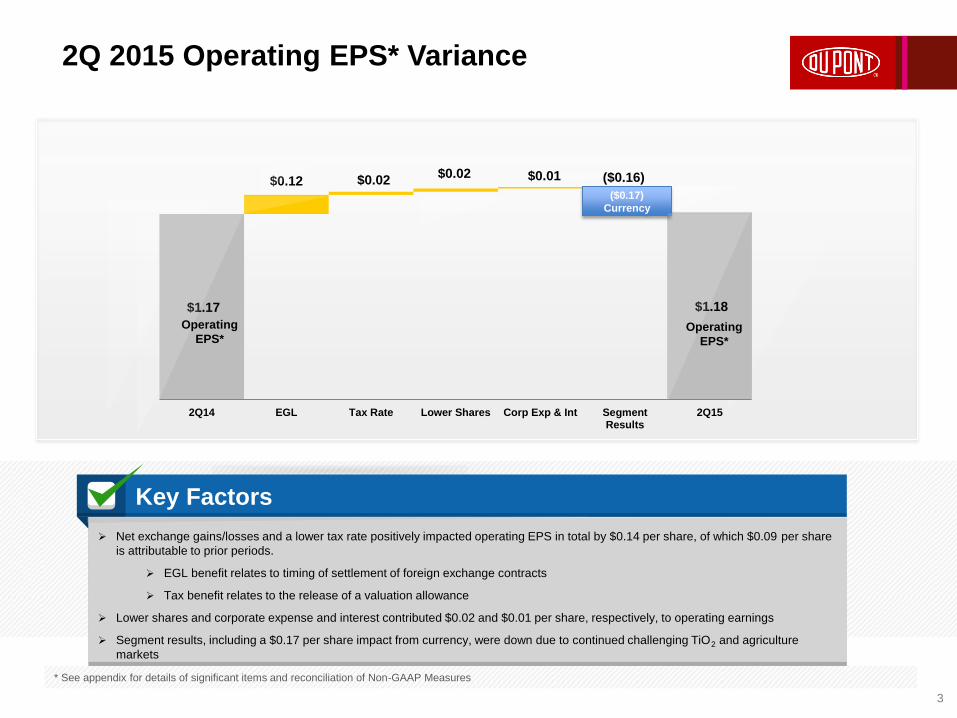
2Q 2015 Operating EPS* Variance
3
* See appendix for details of significant items and reconciliation of Non-GAAP Measures
Net exchange gains/losses and a lower tax rate positively impacted operating EPS in total by $0.14 per share, of which $0.09 per share
is attributable to prior periods.
EGL benefit relates to timing of settlement of foreign exchange contracts
Tax benefit relates to the release of a valuation allowance
Lower shares and corporate expense and interest contributed $0.02 and $0.01 per share, respectively, to operating earnings
Segment results, including a $0.17 per share impact from currency, were down due to continued challenging TiO2 and agriculture
markets
Key Factors
$1.17
$0.12 $0.02
$0.00
$0.02 $0.01
$1.18
2Q14 EGL Tax Rate Lower Shares Corp Exp & Int SegmentResults
2Q15
($0.16)
($0.17)
Currency
Operating
EPS* Operating
EPS*

Collaboration Speeds Innovation
2013 Highlights
Global Sales – Regional Highlights
4
U.S. & Canada 49%
Developing EMEA 6%
Developed EMEA 14%
Developing Asia 14%
Developed Asia 8%
Latin America 9%
2Q 2015 Sales by Region
2Q 2014 Sales by Region
U.S. & Canada 47%
Developing EMEA 6%
Developed EMEA 16%
Developing Asia 13%
Developed Asia 9%
Latin America 9%
Shifts mainly reflect the impact of currency movements particularly the EURO versus
the U.S. Dollar
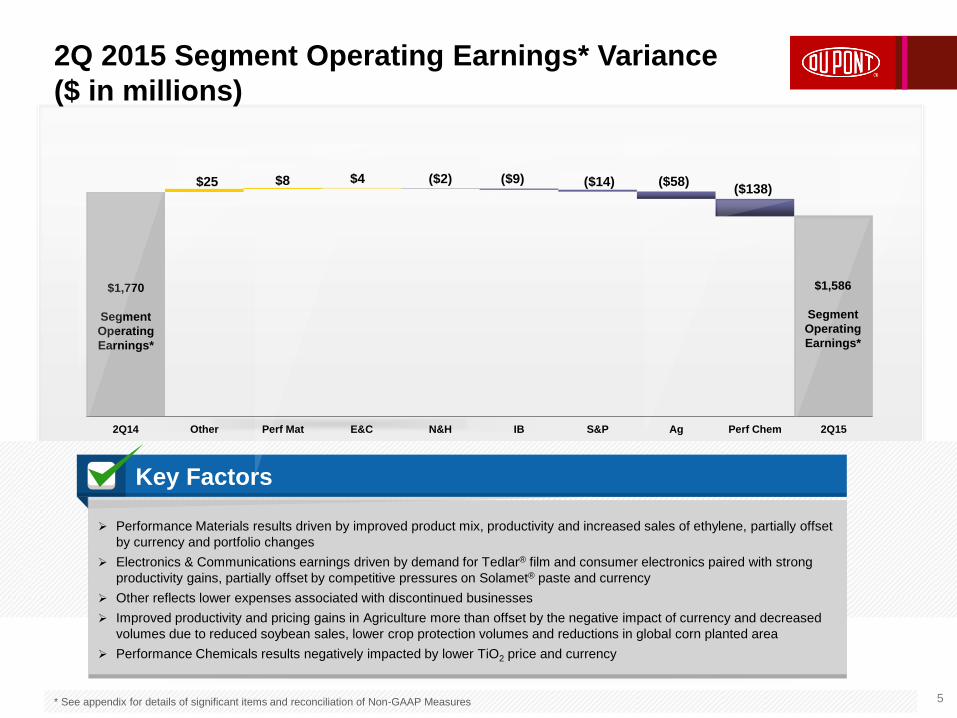
2Q 2015 Segment Operating Earnings* Variance
($ in millions)
5 * See appendix for details of significant items and reconciliation of Non-GAAP Measures
Performance Materials results driven by improved product mix, productivity and increased sales of ethylene, partially offset
by currency and portfolio changes
Electronics & Communications earnings driven by demand for Tedlar® film and consumer electronics paired with strong
productivity gains, partially offset by competitive pressures on Solamet® paste and currency
Other reflects lower expenses associated with discontinued businesses
Improved productivity and pricing gains in Agriculture more than offset by the negative impact of currency and decreased
volumes due to reduced soybean sales, lower crop protection volumes and reductions in global corn planted area
Performance Chemicals results negatively impacted by lower TiO2 price and currency
Key Factors
2Q14 Other Perf Mat E&C N&H IB S&P Ag Perf Chem 2Q15
$1,770
Segment
Operating
Earnings*
$25
$1,586
Segment
Operating
Earnings*
$4 ($2) $8 ($58) ($14) ($9) ($138)

Balance Sheet and Cash June 30, 2015
6
Free Cash Flow
• Slightly higher outflow than prior year
• Reflects expected seasonal working capital outflows
Balance Sheet
• $7.4B net debt**
• Increase from year end due to normal seasonal
working capital build
Expected Uses of Cash for Remainder 2015
• $2.0 billion share repurchase
• Capex spend est. $1.5B FY 2015, excluding
Performance Chemicals
• Continued growth investments in line with strategy
-4.0
-3.0
-2.0
-1.0
0.0
YTD 14 YTD 15
$ B
illi
on
s
0
4
8
12
16
Dec-13 Mar-14 Jun-14 Sep-14 Dec-14 Mar-15 Jun-15
$ B
illio
ns
Gross Debt Cash Net Debt**
Free Cash Flow*
Cash and Debt
* Free Cash Flow is cash provided by operating activities of ($2,045MM) and ($2,071MM) less purchases of plant, property and equipment of $938MM and $781MM for the six-
months ended June 30, 2015 and 2014, respectively.
** See appendix for reconciliation of Non-GAAP measures.

2013 Highlights
Other Highlights
7
• Redesign initiative on track, contributed $0.10 per share to operating earnings in the
quarter; on track to deliver ~$0.40 per share in incremental savings for full year 2015
• DuPont declares third quarter 2015 dividend of $0.38 per share
• Chemours separation completed July 1st
• The Board of Directors authorized the use of the distribution proceeds to repurchase shares as
follows: $2B to be purchased and retired by December 31, 2015 with the remainder to be
purchased and retired by December 31, 2016. The company expects to use an accelerated stock
repurchase plan in connection with the $2B buyback by year-end 2015.
Full Year 2015 Expectations and Outlook – Updated
for Completion of Spin of Chemours
8
• Net sales down mid-to-high-single digits versus prior year due to impact of
currency, portfolio changes and challenging Agriculture environment
• Operating EPS* earnings about $3.10 per share
• Excludes $0.80 per share in previously anticipated full year Performance Chemicals
earnings
• Includes currency headwind of ~$0.60 per share, excluding Performance Chemicals
• Base tax rate 22%
• Increase versus prior year due to expected geographic mix of earnings and absence
of US R&D credit
• Capital Expenditures ~$1.5B, excluding Performance Chemicals
• Items excluded from Operating Earnings*:
• Non-operating pension expense ~$0.28 per share; increase from 2014 due to
discount rates
• Transaction costs for Performance Chemical separation ~$0.04 per share in
continuing operations
* See appendix for reconciliation of Non-GAAP measures

Performance Materials*** Performance Polymers (DPP), Packaging & Industrial Polymers (P&IP)
9
2Q13 2Q14 2Q15
0%
5%
10%
15%
20%
25%
0
75
150
225
300
375
Ma
rgin
$ in
Millio
ns
2Q Comments
• Sales – Down 14 percent as 3 percent volume growth was more than
offset by the impacts of currency, the Glass Laminating
Solutions/Vinyls divestiture, and lower ethylene prices. Portfolio and
currency reduced sales by 13 percent.
• Segment volume increased 3 percent on increased ethylene sales.
Prior year ethylene sales were constrained due to planned
maintenance outage.
• Operating Earnings – Up 3 percent as higher volumes, stronger mix
and productivity more than offset $42 million of negative currency
impact and a negative impact from unplanned ethylene outage.
• Operating margins increased ~360 bps due to mix enrichment and
productivity
* Segment sales include transfers.
**See appendix for reconciliation of non-GAAP measures.
***Prior periods reflect reclassification of Viton® fluoroelastomers from Performance Materials to Performance Chemicals.
2Q Operating Earnings**
2Q Sales*
Vol 3%, Local Price -4%, Currency -7%, Port./Other -6%
$ in
Millio
ns
1,582
1200
1300
1400
1500
1600
1700
2Q14 Volume Local Price 2Q15(ex-curr…
Curr. Portf./Other
2Q15
1,365
3Q and Full Year Outlook
• 3Q: Sales – Down about ten percent due primarily to currency, and
lower ethylene prices.
• Operating Earnings – Down high teens percent as higher volumes are
more than offset by the impact of currency and lower ethylene prices.
PY ethylene prices were at record levels, exceeding $.70/lb.
• Prior year earnings included a $23 million gain from the sale of a
majority interest in a joint venture.
• Lower raw material costs expected to provide a favorable impact,
partially offset by lower ethylene prices
• Full Year: Anticipate FY sales down about 10 percent due primarily to
currency, portfolio changes, and lower ethylene prices. Operating
earnings down mid-single digits percent as volume growth is more
than offset by the negative impacts from currency and portfolio.

* Segment sales include transfers.
**See appendix for reconciliation of non-GAAP measures.
Electronics & Communications
10
2Q13 2Q14 2Q15
0%
5%
10%
15%
20%
0
25
50
75
100
125
Ma
rgin
$ in
Millio
ns
2Q Comments
• Sales – Down 13 percent as volume growth in Tedlar® film in
photovoltaics and products used in consumer electronics
applications was more than offset by the impact of competitive
pressures on sales of Solamet® paste, the negative impact of
currency and lower metals pricing
• Operating Earnings – Improved 4 percent as productivity gains
more than offset sales declines and a $3 million negative
impact from currency
3Q and Full Year Outlook
• 3Q: Sales – Down low-teens percent with continued solid
demand for Tedlar® film and products for consumer electronics
markets more than offset by lower Solamet® paste sales, the
negative impact of metals pricing and currency
• Operating Earnings – About flat as productivity actions are
expected to be offset by the impact of lower sales
• Launched newest Solamet® paste product PV19a in 2Q; first
in a series of new products with additional introductions later in
the year
• Full year: Sales – Down high-single digits percent on lower
metals prices and currency; Operating earnings –Up low-
single digits percent as productivity gains will more than offset
negative currency
2Q Operating Earnings**
2Q Sales*
Vol -7%, Local Price -4%, Currency -2%, Port./Other 0%
450
500
550
600
650
2Q14 Volume LocalPrice
2Q15(ex-curr& portf.)
Curr. Portf./Other
2Q15
$
in
Mil
lio
ns
617
534

Nutrition & Health
11
* Segment sales include transfers.
**See appendix for reconciliation of non-GAAP measures.
2Q13 2Q14 2Q15 0%
3%
6%
9%
12%
0
20
40
60
80
100
120
Ma
rgin
$ in
Millio
ns
2Q Comments
• Sales – 11 percent lower primarily due to a 9 percent negative
impact from currency and pass-through of lower commodity prices
in our soybean crush business
• Strong volume growth in probiotics, texturants, cultures, and
ingredient systems was offset by customer destocking and
competitive challenges in specialty proteins
• Operating Earnings – Decreased $2 million as productivity gains
were more than offset by the negative impact of currency of $12
million
• Continued improvement in operating margin (120 bp)
3Q and Full Year Outlook
• Continued momentum in probiotics, cultures, texturants and
ingredient systems; specialty protein market to remain competitive
• 3Q: Sales – Expected to be mid-single digits percent lower as
volume growth is more than offset by strong currency headwinds
• Operating Earnings – Expected to be high-single digits percent
lower as volume growth and productivity gains will be more than
offset by the negative impact of currency
• Full Year: Sales - expected to be mid-single digits percent lower
as volume gains are more than offset by currency; Operating
earnings – about flat as product margin expansion and productivity
are offset by currency; up low-teens percent ex-currency
2Q Operating Earnings**
2Q Sales*
Vol 0%, Local Price -1%, Currency-9%, Port./Other -1%
600
700
800
900
1000
2Q14 Volume LocalPrice
2Q15(ex-curr& portf.)
Curr. Portf./Other
2Q15
$ in
Millio
ns
926
826

Industrial Biosciences
12
2Q13 2Q14 2Q15 0.0%
5.0%
10.0%
15.0%
20.0%
0
10
20
30
40
50
60
Ma
rgin
$ in
Millio
ns
2Q Comments
• Sales – Down 9 percent as 5 percent higher bioactives
volumes were more than offset by the impact of currency,
lower prices and lower demand for biomaterials
• Volume growth in enzymes driven by animal nutrition, health
and personal care, and food market demand, partially offset by
lower biomaterials sales in key US markets
• Operating Earnings – Down 15 percent including a $6 million
negative impact from currency. Volume and productivity gains
were more than offset by lower prices.
3Q and Full Year Outlook
• 3Q: Anticipate higher volumes will be offset by the negative
impact of currency and softer US biomaterials sales resulting
in Sales down low single digit percent
• Operating Earnings – Up about low-teens percent versus prior
year on higher volumes and improved mix
• Bioactives volumes expected to benefit from new product
offerings coupled with improved biomaterial sales
• Full Year: Sales expected to be down mid-single-digits percent
due to currency. Operating earnings down low-single digits
percent as higher volumes, prices and improved mix more
than offset by currency
* Segment sales include transfers.
**See appendix for reconciliation of non-GAAP measures.
2Q Operating Earnings**
2Q Sales*
Vol 2%, Local Price -3%, Currency -8%, Port./Other 0%
150
200
250
300
350
2Q14 Volume LocalPrice
2Q15(ex-curr& portf.)
Curr. Portf./Other
2Q15
$ in
Millio
ns
317 288

Safety & Protection Protection Technologies (DPT), Building Innovations (BI), Sustainable
Solutions (DSS)
13
2Q13 2Q14 2Q15 0%
5%
10%
15%
20%
25%
0
50
100
150
200
250
Ma
rgin
$ in
Millio
ns
2Q Comments
• Sales – Down 10 percent on currency and portfolio impact
• Increased demand in medical packaging and protective
garments was offset by lower demand, particularly from the oil &
gas industry, for Nomex® fibers and Sustainable Solutions
offerings
• Operating Earnings – Down 7 percent as productivity
improvements were more than offset by $20 million of negative
currency impact
• Higher costs associated with the unplanned outage at
Chambers Works in 1Q 2015 continued to impact 2Q results
3Q and Full Year Outlook
• 3Q: Sales – Volume growth is more than offset by currency
and portfolio, resulting in sales down mid-single-digits on a
percent basis
• Operating Earnings – About even with prior year as volume
growth and continued productivity offset by currency
• Full Year: Sales – expected to be down low-single-digits as
volume growth will be more than offset by currency and
portfolio; Operating earnings – up low-single-digits on volume
growth and productivity
* Segment sales include transfers.
**See appendix for reconciliation of non-GAAP measures.
2Q Operating Earnings**
2Q Sales*
Vol 0%, Local Price 0%, Currency-5%, Port./Other -5%
* Segment sales include transfers.
**See appendix for reconciliation of non-GAAP measures.
750
850
950
1050
2Q14 Volume LocalPrice
2Q15(ex-curr& portf.)
Curr. Portf./Other
2Q15
1,029
925 $ in
Millio
ns
* Segment sales include transfers.
**See appendix for reconciliation of non-GAAP measures.
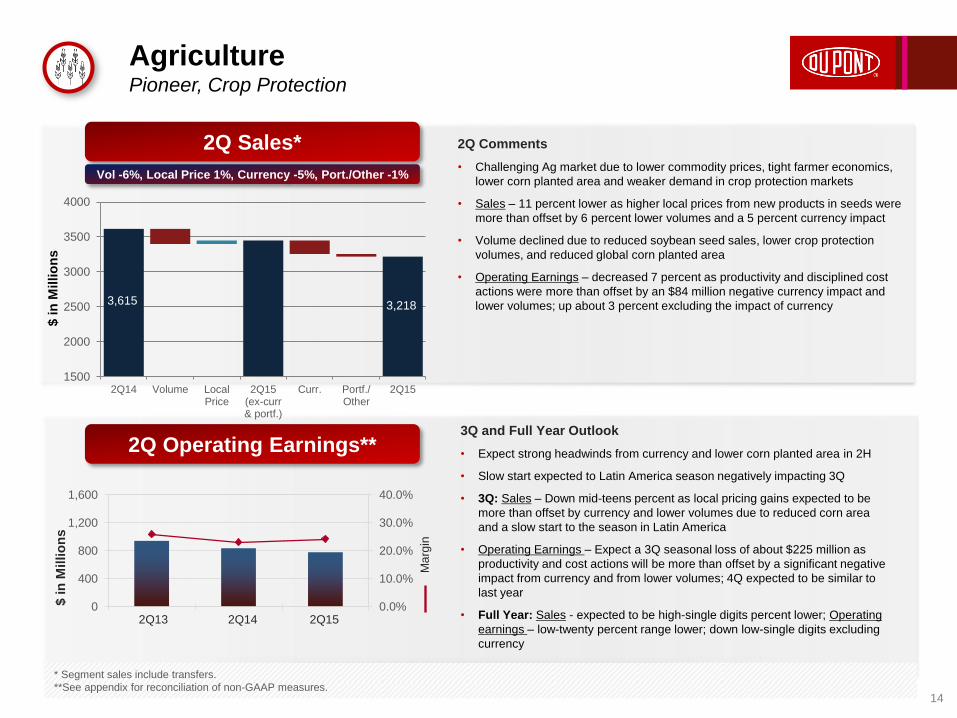
Agriculture Pioneer, Crop Protection
14
2Q13 2Q14 2Q15 0.0%
10.0%
20.0%
30.0%
40.0%
0
400
800
1,200
1,600
Ma
rgin
$ in
Millio
ns
3Q and Full Year Outlook
• Expect strong headwinds from currency and lower corn planted area in 2H
• Slow start expected to Latin America season negatively impacting 3Q
• 3Q: Sales – Down mid-teens percent as local pricing gains expected to be
more than offset by currency and lower volumes due to reduced corn area
and a slow start to the season in Latin America
• Operating Earnings – Expect a 3Q seasonal loss of about $225 million as
productivity and cost actions will be more than offset by a significant negative
impact from currency and from lower volumes; 4Q expected to be similar to
last year
• Full Year: Sales - expected to be high-single digits percent lower; Operating
earnings – low-twenty percent range lower; down low-single digits excluding
currency
2Q Comments
• Challenging Ag market due to lower commodity prices, tight farmer economics,
lower corn planted area and weaker demand in crop protection markets
• Sales – 11 percent lower as higher local prices from new products in seeds were
more than offset by 6 percent lower volumes and a 5 percent currency impact
• Volume declined due to reduced soybean seed sales, lower crop protection
volumes, and reduced global corn planted area
• Operating Earnings – decreased 7 percent as productivity and disciplined cost
actions were more than offset by an $84 million negative currency impact and
lower volumes; up about 3 percent excluding the impact of currency
2Q Operating Earnings**
2Q Sales*
Vol -6%, Local Price 1%, Currency -5%, Port./Other -1%
1500
2000
2500
3000
3500
4000
2Q14 Volume LocalPrice
2Q15(ex-curr& portf.)
Curr. Portf./Other
2Q15
3,615 3,218
$ in
Millio
ns
Performance Chemicals*** Titanium Technologies (DTT), Chemical & Fluoroproducts (DC&F)
15
2Q13 2Q14 2Q15 0%
5%
10%
15%
20%
25%
0
50
100
150
200
250
300
Ma
rgin
$ in
Millio
ns
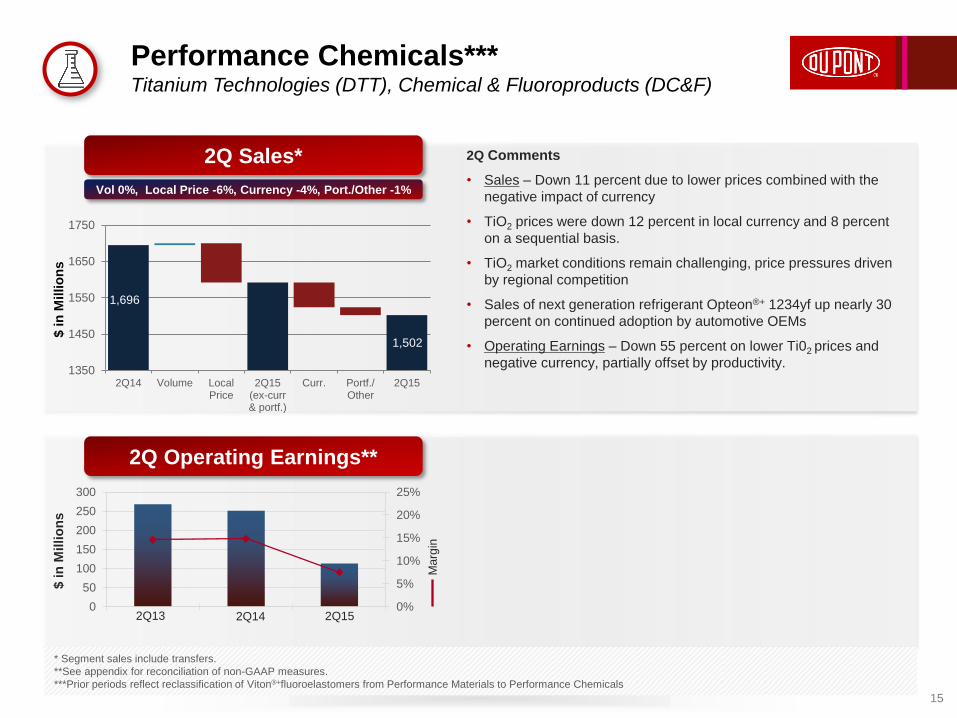
2Q Comments
• Sales – Down 11 percent due to lower prices combined with the
negative impact of currency
• TiO2 prices were down 12 percent in local currency and 8 percent
on a sequential basis.
• TiO2 market conditions remain challenging, price pressures driven
by regional competition
• Sales of next generation refrigerant Opteon®+ 1234yf up nearly 30
percent on continued adoption by automotive OEMs
• Operating Earnings – Down 55 percent on lower Ti02 prices and
negative currency, partially offset by productivity.
* Segment sales include transfers.
**See appendix for reconciliation of non-GAAP measures.
***Prior periods reflect reclassification of Viton®+fluoroelastomers from Performance Materials to Performance Chemicals
2Q Operating Earnings**
2Q Sales*
Vol 0%, Local Price -6%, Currency -4%, Port./Other -1%
1350
1450
1550
1650
1750
2Q14 Volume LocalPrice
2Q15(ex-curr& portf.)
Curr. Portf./Other
2Q15
$ in
Millio
ns
1,696
1,502
APPENDIX 1:
SECOND QUARTER 2015 SEGMENT COMMENTARY
This data should be read in conjunction with the Company’s second quarter earnings news
release dated July 28, 2015, DuPont’s 2Q 2015 Earnings Conference Call presentation
materials and reconciliations of non-GAAP to GAAP measures included in the presentation
materials and posted on the DuPont Investor Center website at www.dupont.com.
7/28/2015 16
Segment Commentary Second Quarter Earnings 2015
17
Performance Materials
Sales of $1.4B were down 14 percent as 3 percent volume growth was more than offset by the impacts of currency, the
Glass Laminating Solutions/Vinyls divestiture, and lower ethylene prices. Portfolio and currency reduced sales by 13
percent.
Segment volume increased 3 percent primarily due to increased ethylene sales and Performance Polymers growth in
North America and Europe. Prior year ethylene sales were constrained due to the planned maintenance outage.
Operating earnings were up 3 percent as higher volumes, stronger mix, and productivity more than offset $42 million of
negative impact from currency. Excluding the impact of currency, operating earnings would have increased by about 17
percent. An unplanned ethylene outage negatively impacted operating earnings. Operating margins increased ~360bps
due to mix enrichment and productivity.
In global automotive markets, demand is relatively soft as recent IHS forecasts show 2nd Quarter auto builds down ~1
percent on continued downward revisions. While the 3rd quarter auto builds forecast is higher than prior year, China
and Asia Pacific demand in general was sluggish in 2Q.
In the third quarter, we anticipate sales will be down about 10 percent and operating earnings down in the high teens due
primarily to currency and lower ethylene prices. In the prior year, spot ethylene prices were at record levels, exceeding
$.70 cents per lb which impacts the year over year comparison. We anticipate lower raw material costs will provide a
favorable impact, partially offset by lower ethylene prices. Excluding the impact of currency, we expect operating
earnings to be down mid-single-digits percent.
$17 million negative impact
Segment Commentary Second Quarter Earnings 2015
18
Performance Materials (continued)
For the full year, we anticipate sales will be down about 10 percent due primarily to currency, portfolio changes and
lower ethylene prices. Operating earnings are expected to be down mid-single digits percent as volume growth is more
than offset by the negative impacts from currency and portfolio. Excluding the impact of currency, we expect operating
earnings to be up high-single-digits percent.

In Electronics & Communications, operating earnings improved $4 million, or 4 percent as productivity gains more than
offset lower sales and a $3 million negative impact from currency. Excluding the impact of currency, operating earnings
would have increased by about 8 percent. Sales were 13 percent lower as volume growth in Tedlar® film in photovoltaics
and consumer electronics related businesses was more than offset by the impact of competitive pressures on sales of
Solamet® paste, the negative impact of currency and lower metals pricing.
We continue to expect global photovoltaic module installations will grow about 20 percent for the year driven by China,
the U.S. and Japan, supporting strong demand for our Tedlar® film products. In the second quarter we launched our
newest Solamet® paste product, PV19a. This is the first in a series of new, higher efficiency paste offerings and we
expect additional introductions later this year.
We expect third quarter sales to be down low-teens percent as increased demand for Tedlar® film and for products used
in consumer electronics applications are offset by the negative impact of lower Solamet® paste sales, metals pricing and
currency. Operating earnings are expected to be about flat as productivity actions are offset by the impact of lower sales.
Excluding the impact of currency, we expect operating earnings to be up mid-single-digits percent.
For the full year, sales are expected to be down high-single digits percent on lower sales of Solamet® paste, lower metals
prices and currency with operating earnings up low-single digits percent as productivity gains will more than offset the
negative impacts of currency. Excluding the impact of currency, we expect operating earnings to be up high-single-digits
percent.
Segment Commentary Second Quarter Earnings 2015
19
Electronics & Communications
Sales of $925 million were down 10 percent on 5 percent negative impact of currency and 5 percent negative impact from
the Sontara® divestiture. Increased demand for Tyvek® protective material, including medical packaging and protective
garments, was offset by lower demand from the oil and gas industry impacting Nomex® thermal resistant fiber and
Sustainable Solutions offerings.
Second quarter segment operating earnings of $195 million were down 7 percent as productivity improvements were more
than offset by $20 million of negative impact from currency and the Sontara® divestiture. Excluding the impact of currency,
operating earnings would have increased by about 3 percent. Higher costs associated with an unplanned outage at the
Chambers Works facility in the first quarter continued to impact operating earnings in the second quarter.
Operating margins improved 80 basis points year over year reflecting improved mix and continued productivity.
In the third quarter, sales are expected to be down in the mid-single digit percent range as volume growth will be more than
offset by the impact of currency and portfolio changes. Operating earnings will be even with prior year as continued
demand for our products, ongoing innovation, and continued operational productivity will be offset by the negative impact
of currency. Excluding the impact of currency, we expect operating earnings to be up mid-teens percent.
For the full year, sales are expected to be down in the low-single-digit percent range as volume growth in Tyvek®, Nomex®
and Kevlar® high-strength materials will be more than offset by the impact of currency and portfolio changes. Operating
earnings growth will be in the low-single-digit percent range, on continued demand for our products and operational
productivity. Excluding the impact of currency, we expect operating earnings to be up low-teens percent.
Segment Commentary Second Quarter Earnings 2015
20
Safety & Protection

Segment Commentary Second Quarter Earnings 2015
21
Industrial Biosciences
In Industrial Biosciences, sales were 9 percent lower as five percent higher bioactive volumes were more than offset by
the impact of currency, lower prices and lower demand for biomaterials. Volume growth in enzymes was driven by solid
demand in animal nutrition, health and personal care, and food markets. Biomaterial sales were lower on soft demand for
carpet in the US residential home improvement market and channel destocking.
Operating earnings of $50 million were down 15 percent including a $6 million negative impact from currency. Excluding
the impact of currency, operating earnings would have been about 5 percent lower than prior year. Continued volume and
productivity gains were more than offset by lower prices.
In the third quarter, we anticipate higher volumes will be offset by the negative impacts of currency and softer US
biomaterials prices resulting in sales down in the low single digit percent range.
We expect operating earnings up low-teens percent versus the prior year on higher volumes and improved mix.
Bioactives volumes are expected to benefit from new product offerings coupled with an improving volume outlook for
biomaterials. Excluding the impact of currency, we expect operating earnings to be up high-teens percent.
For the full year, we expect sales will be down mid-single digits percent due primarily to currency. Operating earnings are
expected to be down low-single digits percent as higher volumes, price and improved mix will be more than offset by
currency. Excluding the impact of currency, we expect operating earnings to be up mid-single-digits percent.
In Nutrition & Health, the business delivered solid results excluding significant headwinds from currency. Operating
earnings decreased $2 million as productivity gains mostly offset a $12 million negative impact from currency. Excluding
the impact of currency, operating earnings would have increased by about 10 percent. We delivered over 100 basis points
of operating margin improvement and have now grown operating margins year-over-year for eight consecutive quarters.
Sales were 11 percent lower, primarily due to a 9 percent negative impact from currency and the pass-through of lower
commodity prices in our soybean crush business. We continue to deliver solid growth in probiotics, texturants, cultures,
and ingredient systems, partially offset by lower volumes in the specialty protein market in North America as a result of
customer destocking and competitive challenges.
In the third quarter, we expect continued volume growth in most product lines and the specialty protein market to remain
very competitive. Sales are expected to be mid-single digits percent lower due to continued strong currency headwinds.
Operating earnings are expected to be high-single digits percent lower as the negative impact of currency will more than
offset volume growth and productivity gains. Excluding the impact of currency, we expect operating earnings to be up about
10 percent.
For the full year we now expect sales to be mid-single digits percent lower as volume gains are more than offset by
currency. Operating earnings are expected to be about flat as both product margin expansion and productivity gains are
offset by currency. However, excluding the impact of currency we would expect operating earnings to be low-teens percent
higher.
Segment Commentary Second Quarter Earnings 2015
22
Nutrition & Health

Segment Commentary Second Quarter Earnings 2015
23
Agriculture
In Agriculture, the industry continues to face challenging market conditions due to lower commodity prices and tight farmer
economics which led to lower corn planted area in North America and globally in the first half of the year. In crop protection
markets, we saw weaker market demand from farmers looking to reduce input costs and delay purchases, lower insect
pressure in Brazil and the impact of higher inventories in the Americas .
Second quarter Agriculture segment sales were $3.2 billion, down 11 percent, as higher local prices were offset by 6 percent
lower volumes and a 5 percent negative impact from currency. Seed sales were 7 percent lower and crop protection sales
were down 21 percent versus last year.
Despite 2015 being one of the most competitive seasons in recent years we have been able to realize local net price
increases for the quarter and across the northern hemisphere season. New products in corn and soybean seeds
demonstrate that even in a tough economic and competitive environment growers around the world continue to demand
DuPont innovations that improve their productivity and help them manage risk.
Volume for the segment declined 6 percent due to lower soybean seed sales, lower crop protection volumes due to weaker
market demand and reduced global corn planted area.
Second quarter operating earnings decreased by 7 percent as productivity, continued discipline in spending and pricing
gains were more than offset by about $84 million negative currency impact and from lower volumes. Excluding the impact of
currency, operating earnings would have grown about 3 percent. Operating margins increased about 110 basis points in the
quarter.

Segment Commentary Second Quarter Earnings 2015
24
Agriculture (continued)
As we turn to the second half of the year and the focus shifts to Latin America, we anticipate continuing strong headwinds
from currency, primarily the Brazilian real, which is about 40 percent weaker than a year ago, and from lower corn planted
area. The cutoff between third quarter and fourth quarter comes in the middle of the Latin America season to which we are
seeing a slow start as farmers remain cautious given the economic environment. For the third quarter we expect sales to be
down mid-teens percent as local pricing gains from new products are expected to be more than offset by very strong
currency headwinds, lower corn volumes and continued pressure on crop protection inputs. We expect a seasonal
operating loss in the third quarter of about $225 million as productivity and cost actions are more than offset by currency and
lower volumes. Fourth quarter operating earnings are expected to be similar to last year.
Looking at the full year, the company is reducing expectations for its Agriculture segment due to weaker demand in global
crop protection markets, reduced expectations for corn area in Latin America, and lower than expected soybean volumes in
North America. We now expect Agriculture segment sales to be high-single digits percent lower with operating earnings in
the low-twenty percent range below 2014 as local pricing gains, productivity and disciplined cost management are offset by
currency and lower volumes. Currency remains the primary factor in the decline in 2015 results. Excluding the impact of
weaker global currencies we expect operating earnings for the year would be down low-single digits percent.
While challenging markets in agriculture are likely to persist, we remain confident in long-term growth in demand for
agricultural products, in our strategy, and in our pipeline of new genetics, unique trait combinations and innovative crop
protection solutions. We recently received cultivation approval in Brazil for Leptra™ for insect control and are planning for
an introductory launch for the upcoming Safrinha season. Corn Event DP4114 is progressing towards commercialization
and we are testing it broadly across North America this summer in our IMPACT® trials as we await final import approvals in
key markets. In crop protection we continue to receive registrations of Cyazypyr® for insect control in additional countries,
are growing our seed treatment portfolio, and are preparing for new launches of Zorvec™ fungicide and Pyraxalt™ for insect
control in rice, pending regulatory approvals.
In Performance Chemicals, sales of $1.5 billion were down 11 percent due to lower prices combined with the negative
impact of currency.
Challenging industry fundamentals continued as TiO2 local prices declined 12 percent and currency remained a significant
headwind. On a sequential basis, Ti02 prices were down 8 percent reflecting continued competitive pressures and
regional competition. Second quarter Ti02 volumes were down 1 percent as volumes in the Americas and Asia Pacific
regions were below the prior year with Europe, Middle East and Africa volumes up in the low-single digits.
In Chemicals and Fluoroproducts, volumes were down 2 percent as lower demand in fluoropolymers, chemicals solutions
and fluorochemicals was partially offset by higher demand for the next generation refrigerant, Opteon® 1234yf, which was
up nearly 30 percent on continued adoption by automotive OEMS.
Segment operating earnings were down 55 percent due primarily to lower Ti02 prices and the negative impact of currency.
Excluding the impact of currency, operating earnings would have declined by about 38 percent.
Segment Commentary Second Quarter Earnings 2015
25
Performance Chemicals
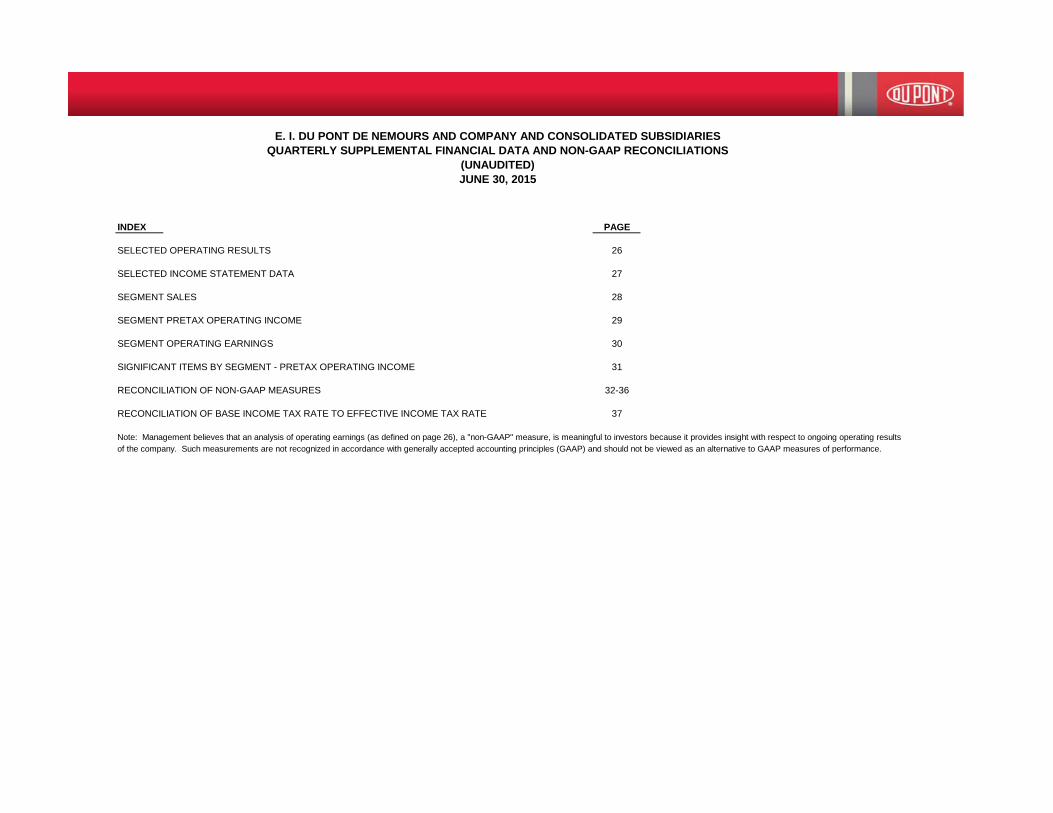
INDEX PAGE
SELECTED OPERATING RESULTS 26
SELECTED INCOME STATEMENT DATA 27
SEGMENT SALES 28
SEGMENT PRETAX OPERATING INCOME 29
SEGMENT OPERATING EARNINGS 30
SIGNIFICANT ITEMS BY SEGMENT - PRETAX OPERATING INCOME 31
RECONCILIATION OF NON-GAAP MEASURES 32-36
RECONCILIATION OF BASE INCOME TAX RATE TO EFFECTIVE INCOME TAX RATE 37
Note: Management believes that an analysis of operating earnings (as defined on page 26), a "non-GAAP" measure, is meaningful to investors because it provides insight with respect to ongoing operating results of the company. Such measurements are not recognized in accordance with generally accepted accounting principles (GAAP) and should not be viewed as an alternative to GAAP measures of performance.
E. I. DU PONT DE NEMOURS AND COMPANY AND CONSOLIDATED SUBSIDIARIESQUARTERLY SUPPLEMENTAL FINANCIAL DATA AND NON-GAAP RECONCILIATIONS
(UNAUDITED)JUNE 30, 2015
2Q15 Supplemental Financial Data and Non-GAAP Reconciliations 26 7/28/2015
E. I. DU PONT DE NEMOURS AND COMPANY AND CONSOLIDATED SUBSIDIARIES
Year Year Year Year Year2015 2Q15 1Q15 2014 4Q14 3Q14 2Q14 1Q14 2013 4Q13 3Q13 2Q13 1Q13 2012 4Q12 3Q12 2Q12 1Q12 2011
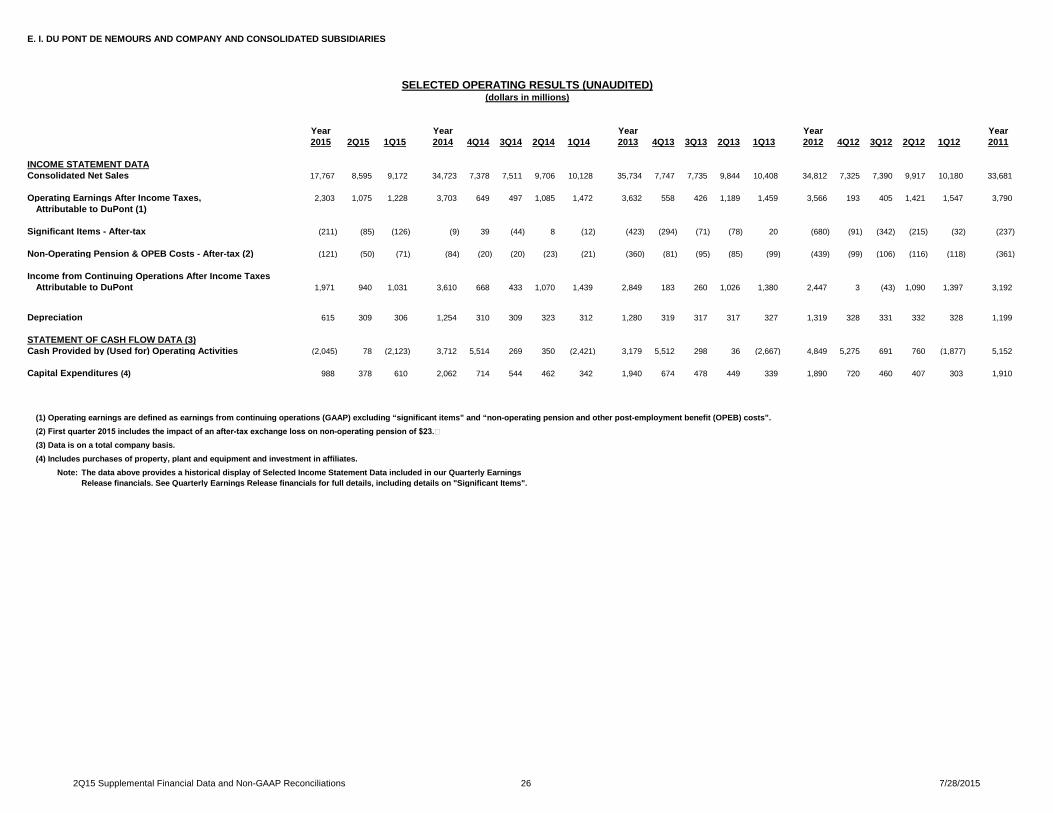
INCOME STATEMENT DATAConsolidated Net Sales 17,767 8,595 9,172 34,723 7,378 7,511 9,706 10,128 35,734 7,747 7,735 9,844 10,408 34,812 7,325 7,390 9,917 10,180 33,681
Operating Earnings After Income Taxes, 2,303 1,075 1,228 3,703 649 497 1,085 1,472 3,632 558 426 1,189 1,459 3,566 193 405 1,421 1,547 3,790 Attributable to DuPont (1)
Significant Items - After-tax (211) (85) (126) (9) 39 (44) 8 (12) (423) (294) (71) (78) 20 (680) (91) (342) (215) (32) (237)
Non-Operating Pension & OPEB Costs - After-tax (2) (121) (50) (71) (84) (20) (20) (23) (21) (360) (81) (95) (85) (99) (439) (99) (106) (116) (118) (361)
Income from Continuing Operations After Income TaxesAttributable to DuPont 1,971 940 1,031 3,610 668 433 1,070 1,439 2,849 183 260 1,026 1,380 2,447 3 (43) 1,090 1,397 3,192
Depreciation 615 309 306 1,254 310 309 323 312 1,280 319 317 317 327 1,319 328 331 332 328 1,199
STATEMENT OF CASH FLOW DATA (3)Cash Provided by (Used for) Operating Activities (2,045) 78 (2,123) 3,712 5,514 269 350 (2,421) 3,179 5,512 298 36 (2,667) 4,849 5,275 691 760 (1,877) 5,152
Capital Expenditures (4) 988 378 610 2,062 714 544 462 342 1,940 674 478 449 339 1,890 720 460 407 303 1,910
(1) Operating earnings are defined as earnings from continuing operations (GAAP) excluding “significant items” and “non-operating pension and other post-employment benefit (OPEB) costs”.(2) First quarter 2015 includes the impact of an after-tax exchange loss on non-operating pension of $23.(3) Data is on a total company basis.(4) Includes purchases of property, plant and equipment and investment in affiliates.
Note: The data above provides a historical display of Selected Income Statement Data included in our Quarterly EarningsRelease financials. See Quarterly Earnings Release financials for full details, including details on "Significant Items".
SELECTED OPERATING RESULTS (UNAUDITED)(dollars in millions)
2Q15 Supplemental Financial Data and Non-GAAP Reconciliations 27 7/28/2015
E. I. DU PONT DE NEMOURS AND COMPANY AND CONSOLIDATED SUBSIDIARIES
Year Year Year Year Year2015 2Q15 1Q15 2014 4Q14 3Q14 2Q14 1Q14 2013 4Q13 3Q13 2Q13 1Q13 2012 4Q12 3Q12 2Q12 1Q12 2011
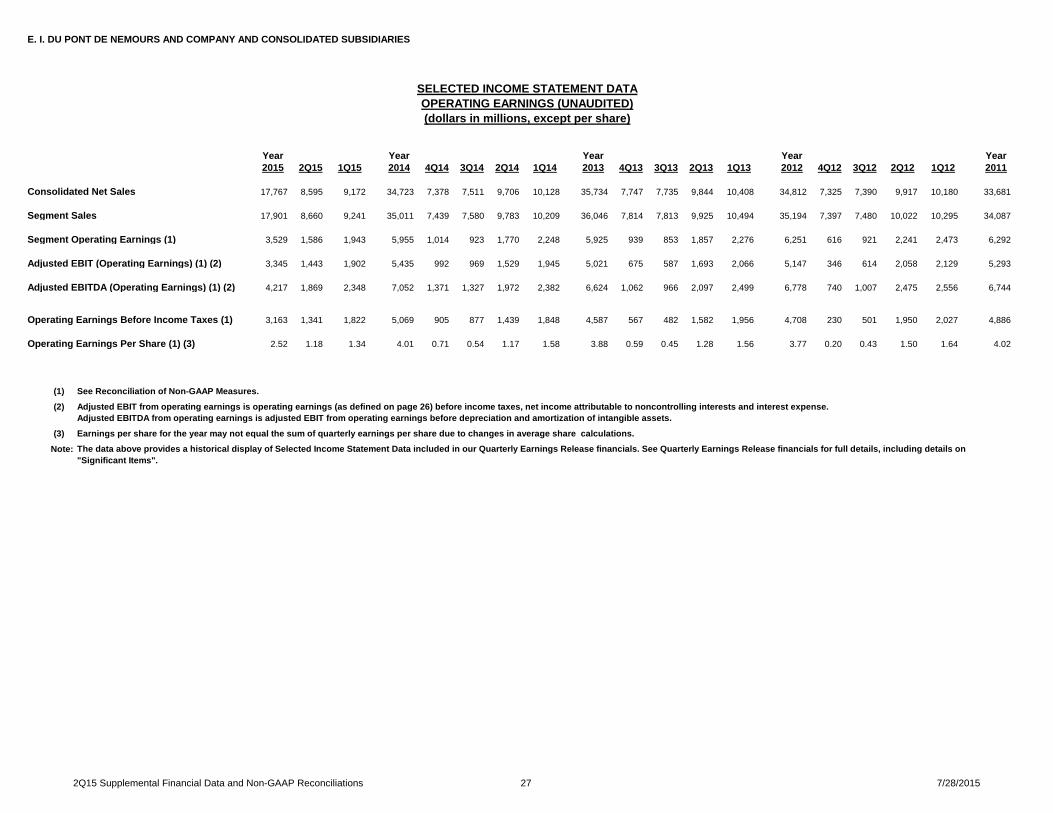
Consolidated Net Sales 17,767 8,595 9,172 34,723 7,378 7,511 9,706 10,128 35,734 7,747 7,735 9,844 10,408 34,812 7,325 7,390 9,917 10,180 33,681
Segment Sales 17,901 8,660 9,241 35,011 7,439 7,580 9,783 10,209 36,046 7,814 7,813 9,925 10,494 35,194 7,397 7,480 10,022 10,295 34,087
Segment Operating Earnings (1) 3,529 1,586 1,943 5,955 1,014 923 1,770 2,248 5,925 939 853 1,857 2,276 6,251 616 921 2,241 2,473 6,292
Adjusted EBIT (Operating Earnings) (1) (2) 3,345 1,443 1,902 5,435 992 969 1,529 1,945 5,021 675 587 1,693 2,066 5,147 346 614 2,058 2,129 5,293
Adjusted EBITDA (Operating Earnings) (1) (2) 4,217 1,869 2,348 7,052 1,371 1,327 1,972 2,382 6,624 1,062 966 2,097 2,499 6,778 740 1,007 2,475 2,556 6,744
Operating Earnings Before Income Taxes (1) 3,163 1,341 1,822 5,069 905 877 1,439 1,848 4,587 567 482 1,582 1,956 4,708 230 501 1,950 2,027 4,886
Operating Earnings Per Share (1) (3) 2.52 1.18 1.34 4.01 0.71 0.54 1.17 1.58 3.88 0.59 0.45 1.28 1.56 3.77 0.20 0.43 1.50 1.64 4.02
(1) See Reconciliation of Non-GAAP Measures.
(2) Adjusted EBIT from operating earnings is operating earnings (as defined on page 26) before income taxes, net income attributable to noncontrolling interests and interest expense. Adjusted EBITDA from operating earnings is adjusted EBIT from operating earnings before depreciation and amortization of intangible assets.
(3) Earnings per share for the year may not equal the sum of quarterly earnings per share due to changes in average share calculations.
Note:
SELECTED INCOME STATEMENT DATAOPERATING EARNINGS (UNAUDITED)(dollars in millions, except per share)
The data above provides a historical display of Selected Income Statement Data included in our Quarterly Earnings Release financials. See Quarterly Earnings Release financials for full details, including details on "Significant Items".

2Q15 Supplemental Financial Data and Non-GAAP Reconciliations 28 7/28/2015
E. I. DU PONT DE NEMOURS AND COMPANY AND CONSOLIDATED SUBSIDIARIES
Year Year Year Year Year2015 2Q15 1Q15 2014 4Q14 3Q14 2Q14 1Q14 2013 4Q13 3Q13 2Q13 1Q13 2012 4Q12 3Q12 2Q12 1Q12 2011
Agriculture 7,155 3,218 3,937 11,304 1,732 1,563 3,615 4,394 11,739 1,806 1,633 3,631 4,669 10,426 1,535 1,423 3,388 4,080 9,166 Electronics & Communications 1,055 534 521 2,393 573 623 617 580 2,549 642 638 653 616 2,701 622 607 795 677 3,173 Industrial Biosciences 573 288 285 1,258 322 318 317 301 1,224 326 305 304 289 1,180 300 292 300 288 705 Nutrition & Health 1,639 826 813 3,529 843 899 926 861 3,473 872 868 865 868 3,422 853 876 885 808 2,460 Performance Chemicals 2,866 1,502 1,364 6,497 1,564 1,646 1,696 1,591 6,932 1,671 1,781 1,837 1,643 7,450 1,644 1,794 2,043 1,969 8,055 Performance Materials 2,776 1,365 1,411 6,129 1,461 1,552 1,582 1,534 6,239 1,521 1,602 1,615 1,501 6,185 1,478 1,552 1,624 1,531 6,554 Safety & Protection 1,834 925 909 3,896 943 977 1,029 947 3,884 975 985 1,017 907 3,825 964 934 986 941 3,934 Other 3 2 1 5 1 2 1 1 6 1 1 3 1 5 1 2 1 1 40
Total Segment Sales 17,901 8,660 9,241 35,011 7,439 7,580 9,783 10,209 36,046 7,814 7,813 9,925 10,494 35,194 7,397 7,480 10,022 10,295 34,087
Elimination of Transfers (134) (65) (69) (288) (61) (69) (77) (81) (312) (67) (78) (81) (86) (382) (72) (90) (105) (115) (406)
CONSOLIDATED NET SALES 17,767 8,595 9,172 34,723 7,378 7,511 9,706 10,128 35,734 7,747 7,735 9,844 10,408 34,812 7,325 7,390 9,917 10,180 33,681
Note: The data above provides a historical display of selected data included in our Quarterly Earnings Release financials.
SEGMENT SALES
SEGMENT SALES (UNAUDITED)(dollars in millions)

2Q15 Supplemental Financial Data and Non-GAAP Reconciliations 29 7/28/2015
E. I. DU PONT DE NEMOURS AND COMPANY AND CONSOLIDATED SUBSIDIARIES
Year Year Year Year Year2015 2Q15 1Q15 2014 4Q14 3Q14 2Q14 1Q14 2013 4Q13 3Q13 2Q13 1Q13 2012 4Q12 3Q12 2Q12 1Q12 2011
Agriculture 1,948 774 1,174 2,668 492 (55) 789 1,442 2,132 (108) (102) 861 1,481 1,669 (103) (198) 682 1,288 1,566 Electronics & Communications 189 104 85 271 81 94 21 75 203 (38) 97 95 49 222 41 (99) 221 59 438 Industrial Biosciences 105 49 56 198 38 47 57 56 170 41 45 43 41 159 41 37 42 39 2 Nutrition & Health 188 99 89 365 75 100 97 93 305 87 81 61 76 270 22 64 105 79 76 Performance Chemicals 183 54 129 913 226 249 232 206 941 228 189 268 256 1,826 210 417 613 586 2,162 Performance Materials 636 309 327 1,590 262 370 665 293 1,264 278 367 332 287 1,073 263 223 325 262 1,031 Safety & Protection 492 308 184 742 188 201 178 175 694 213 171 172 138 562 130 92 181 159 661 Other (163) (60) (103) (391) (132) (83) (84) (92) (340) (91) (107) (55) (87) (412) (80) (75) (208) (49) (55)
TOTAL SEGMENT PRETAX OPERATING INCOME 3,578 1,637 1,941 6,356 1,230 923 1,955 2,248 5,369 610 741 1,777 2,241 5,369 524 461 1,961 2,423 5,881
Net Exchange Gains (Losses) (1) 90 26 64 135 122 218 (109) (96) (128) (73) (101) 35 11 (215) (54) (130) 50 (81) (146) Non-Operating Pension & OPEBs Costs (1) (153) (78) (75) (124) (30) (30) (34) (30) (539) (124) (142) (126) (147) (654) (147) (157) (174) (176) (540) Corporate Expenses (528) (283) (245) (999) (272) (232) (278) (217) (765) (183) (162) (206) (214) (948) (240) (233) (224) (251) (869) Interest Expense (211) (127) (84) (377) (87) (93) (94) (103) (448) (108) (108) (115) (117) (464) (117) (116) (117) (114) (447)
INCOME (LOSS) FROM CONTINUING OPERATIONS BEFORE INCOME TAXES 2,776 1,175 1,601 4,991 963 786 1,440 1,802 3,489 122 228 1,365 1,774 3,088 (34) (175) 1,496 1,801 3,879
(796) (230) (566) (1,370) (295) (352) (366) (357) (626) 61 35 (335) (387) (616) 38 135 (397) (392) (647)
INCOME (LOSS) FROM CONTINUING OPERATIONSAFTER INCOME TAXES 1,980 945 1,035 3,621 668 434 1,074 1,445 2,863 183 263 1,030 1,387 2,472 4 (40) 1,099 1,409 3,232
(1)
Note: The data above provides a historical display of selected data included in our Quarterly Earnings Release financials.
In the first quarter 2015, the impact of an exchange loss on non-operating pension of $23 is included within Net Exchange Gains and is excluded from Non-Operating Pension & OPEB Costs above.
SEGMENT PRETAX OPERATING INCOME (LOSS)
INCOME FROM CONTINUING OPERATIONS (UNAUDITED)(dollars in millions)
(Provision For) Benefit From Income Taxes on Continuing Operations
2Q15 Supplemental Financial Data and Non-GAAP Reconciliations 30 7/28/2015
E. I. DU PONT DE NEMOURS AND COMPANY AND CONSOLIDATED SUBSIDIARIES
Year Year Year Year Year2015 2Q15 1Q15 2014 4Q14 3Q14 2Q14 1Q14 2013 4Q13 3Q13 2Q13 1Q13 2012 4Q12 3Q12 2Q12 1Q12 2011
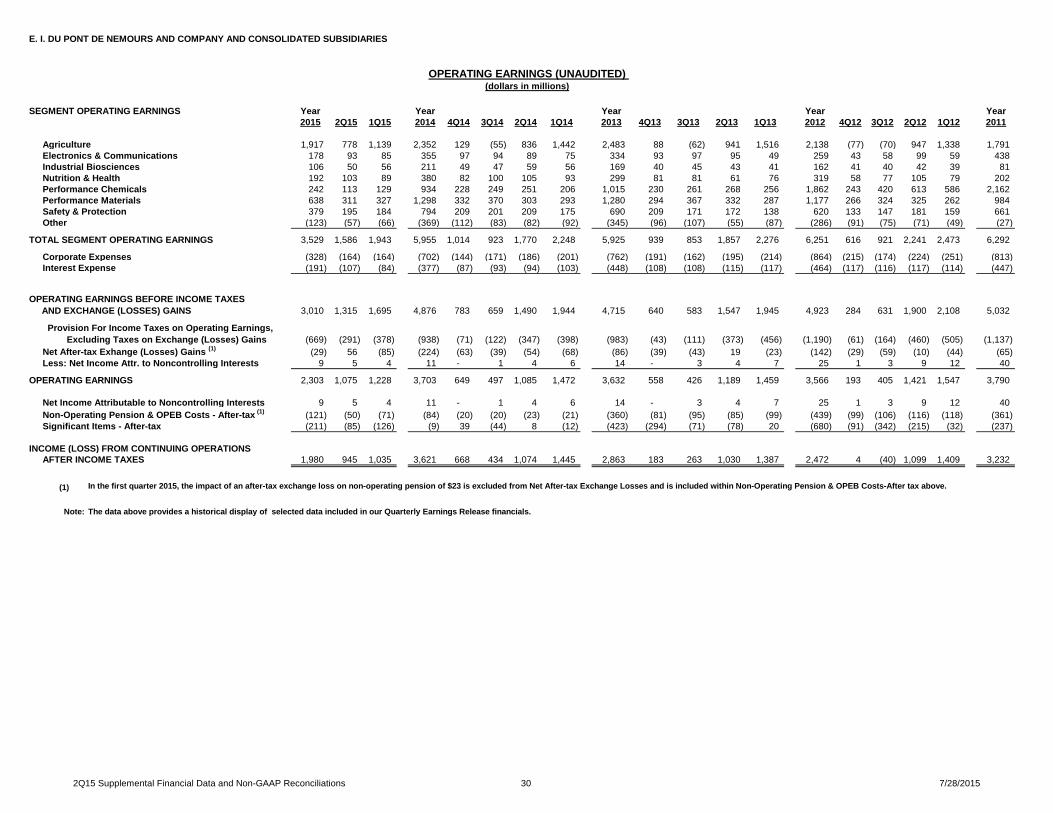
Agriculture 1,917 778 1,139 2,352 129 (55) 836 1,442 2,483 88 (62) 941 1,516 2,138 (77) (70) 947 1,338 1,791 Electronics & Communications 178 93 85 355 97 94 89 75 334 93 97 95 49 259 43 58 99 59 438 Industrial Biosciences 106 50 56 211 49 47 59 56 169 40 45 43 41 162 41 40 42 39 81 Nutrition & Health 192 103 89 380 82 100 105 93 299 81 81 61 76 319 58 77 105 79 202 Performance Chemicals 242 113 129 934 228 249 251 206 1,015 230 261 268 256 1,862 243 420 613 586 2,162 Performance Materials 638 311 327 1,298 332 370 303 293 1,280 294 367 332 287 1,177 266 324 325 262 984 Safety & Protection 379 195 184 794 209 201 209 175 690 209 171 172 138 620 133 147 181 159 661 Other (123) (57) (66) (369) (112) (83) (82) (92) (345) (96) (107) (55) (87) (286) (91) (75) (71) (49) (27)
TOTAL SEGMENT OPERATING EARNINGS 3,529 1,586 1,943 5,955 1,014 923 1,770 2,248 5,925 939 853 1,857 2,276 6,251 616 921 2,241 2,473 6,292
Corporate Expenses (328) (164) (164) (702) (144) (171) (186) (201) (762) (191) (162) (195) (214) (864) (215) (174) (224) (251) (813) Interest Expense (191) (107) (84) (377) (87) (93) (94) (103) (448) (108) (108) (115) (117) (464) (117) (116) (117) (114) (447)
3,010 1,315 1,695 4,876 783 659 1,490 1,944 4,715 640 583 1,547 1,945 4,923 284 631 1,900 2,108 5,032
(669) (291) (378) (938) (71) (122) (347) (398) (983) (43) (111) (373) (456) (1,190) (61) (164) (460) (505) (1,137) Net After-tax Exhange (Losses) Gains (1) (29) 56 (85) (224) (63) (39) (54) (68) (86) (39) (43) 19 (23) (142) (29) (59) (10) (44) (65) Less: Net Income Attr. to Noncontrolling Interests 9 5 4 11 - 1 4 6 14 - 3 4 7 25 1 3 9 12 40
OPERATING EARNINGS 2,303 1,075 1,228 3,703 649 497 1,085 1,472 3,632 558 426 1,189 1,459 3,566 193 405 1,421 1,547 3,790
Net Income Attributable to Noncontrolling Interests 9 5 4 11 - 1 4 6 14 - 3 4 7 25 1 3 9 12 40 Non-Operating Pension & OPEB Costs - After-tax (1) (121) (50) (71) (84) (20) (20) (23) (21) (360) (81) (95) (85) (99) (439) (99) (106) (116) (118) (361) Significant Items - After-tax (211) (85) (126) (9) 39 (44) 8 (12) (423) (294) (71) (78) 20 (680) (91) (342) (215) (32) (237)
INCOME (LOSS) FROM CONTINUING OPERATIONSAFTER INCOME TAXES 1,980 945 1,035 3,621 668 434 1,074 1,445 2,863 183 263 1,030 1,387 2,472 4 (40) 1,099 1,409 3,232
(1)
Note: The data above provides a historical display of selected data included in our Quarterly Earnings Release financials.
OPERATING EARNINGS (UNAUDITED) (dollars in millions)
In the first quarter 2015, the impact of an after-tax exchange loss on non-operating pension of $23 is excluded from Net After-tax Exchange Losses and is included within Non-Operating Pension & OPEB Costs-After tax above.
OPERATING EARNINGS BEFORE INCOME TAXES AND EXCHANGE (LOSSES) GAINS
Provision For Income Taxes on Operating Earnings, Excluding Taxes on Exchange (Losses) Gains
SEGMENT OPERATING EARNINGS

2Q15 Supplemental Financial Data and Non-GAAP Reconciliations 31 7/28/2015
E. I. DU PONT DE NEMOURS AND COMPANY AND CONSOLIDATED SUBSIDIARIES
SEGMENT PRETAX IMPACT OF Year Year Year Year YearSIGNIFICANT ITEMS 2015 2Q15 1Q15 2014 4Q14 3Q14 2Q14 1Q14 2013 4Q13 3Q13 2Q13 1Q13 2012 4Q12 3Q12 2Q12 1Q12 2011
Agriculture 31 (4) 35 316 363 - (47) - (351) (196) (40) (80) (35) (469) (26) (128) (265) (50) (225) Electronics & Communications 11 11 - (84) (16) - (68) - (131) (131) - - - (37) (2) (157) 122 - - Industrial Biosciences (1) (1) - (13) (11) - (2) - 1 1 - - - (3) - (3) - - (79) Nutrition & Health (4) (4) - (15) (7) - (8) - 6 6 - - - (49) (36) (13) - - (126) Performance Chemicals (59) (59) - (21) (2) - (19) - (74) (2) (72) - - (36) (33) (3) - - - Performance Materials (2) (2) - 292 (70) - 362 - (16) (16) - - - (104) (3) (101) - - 47 Safety & Protection 113 113 - (52) (21) - (31) - 4 4 - - - (58) (3) (55) - - - Other (40) (3) (37) (22) (20) - (2) - 5 5 - - - (126) 11 - (137) - (28)
TOTAL SIGNIFICANT ITEMS
BY SEGMENT - PRETAX 49 51 (2) 401 216 - 185 - (556) (329) (112) (80) (35) (882) (92) (460) (280) (50) (411)
Note: The data above provides a historical display of significant items included in our Quarterly Earnings Release financials.
SIGNIFICANT ITEMS BY SEGMENT - PRETAX OPERATING INCOME (UNAUDITED)(dollars in millions)
2Q15 Supplemental Financial Data and Non-GAAP Reconciliations 32 7/28/2015
E. I. DU PONT DE NEMOURS AND COMPANY AND CONSOLIDATED SUBSIDIARIES
Year Year Year Year Year2015 2Q15 1Q15 2014 4Q14 3Q14 2Q14 1Q14 2013 4Q13 3Q13 2Q13 1Q13 2012 4Q12 3Q12 2Q12 1Q12 2011
RECONCILIATION OF DILUTED EPS (1)
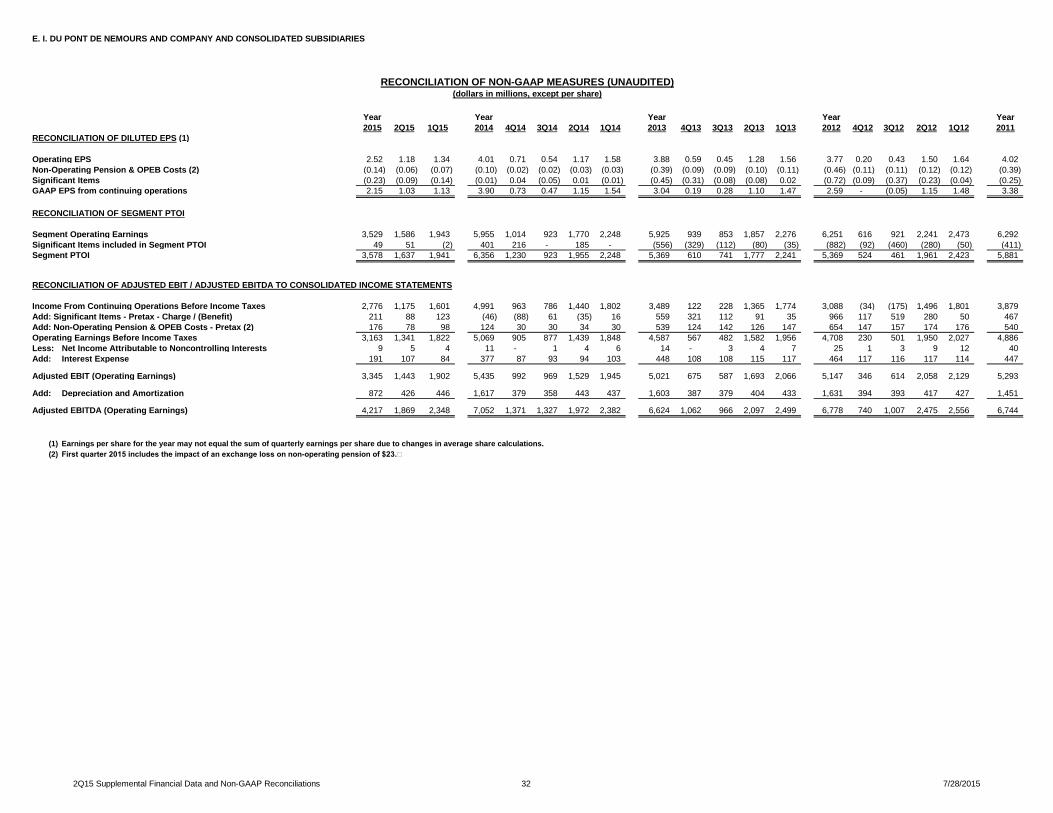
Operating EPS 2.52 1.18 1.34 4.01 0.71 0.54 1.17 1.58 3.88 0.59 0.45 1.28 1.56 3.77 0.20 0.43 1.50 1.64 4.02 Non-Operating Pension & OPEB Costs (2) (0.14) (0.06) (0.07) (0.10) (0.02) (0.02) (0.03) (0.03) (0.39) (0.09) (0.09) (0.10) (0.11) (0.46) (0.11) (0.11) (0.12) (0.12) (0.39) Significant Items (0.23) (0.09) (0.14) (0.01) 0.04 (0.05) 0.01 (0.01) (0.45) (0.31) (0.08) (0.08) 0.02 (0.72) (0.09) (0.37) (0.23) (0.04) (0.25) GAAP EPS from continuing operations 2.15 1.03 1.13 3.90 0.73 0.47 1.15 1.54 3.04 0.19 0.28 1.10 1.47 2.59 - (0.05) 1.15 1.48 3.38
RECONCILIATION OF SEGMENT PTOI
Segment Operating Earnings 3,529 1,586 1,943 5,955 1,014 923 1,770 2,248 5,925 939 853 1,857 2,276 6,251 616 921 2,241 2,473 6,292 Significant Items included in Segment PTOI 49 51 (2) 401 216 - 185 - (556) (329) (112) (80) (35) (882) (92) (460) (280) (50) (411) Segment PTOI 3,578 1,637 1,941 6,356 1,230 923 1,955 2,248 5,369 610 741 1,777 2,241 5,369 524 461 1,961 2,423 5,881
RECONCILIATION OF ADJUSTED EBIT / ADJUSTED EBITDA TO CONSOLIDATED INCOME STATEMENTS
Income From Continuing Operations Before Income Taxes 2,776 1,175 1,601 4,991 963 786 1,440 1,802 3,489 122 228 1,365 1,774 3,088 (34) (175) 1,496 1,801 3,879 Add: Significant Items - Pretax - Charge / (Benefit) 211 88 123 (46) (88) 61 (35) 16 559 321 112 91 35 966 117 519 280 50 467 Add: Non-Operating Pension & OPEB Costs - Pretax (2) 176 78 98 124 30 30 34 30 539 124 142 126 147 654 147 157 174 176 540 Operating Earnings Before Income Taxes 3,163 1,341 1,822 5,069 905 877 1,439 1,848 4,587 567 482 1,582 1,956 4,708 230 501 1,950 2,027 4,886 Less: Net Income Attributable to Noncontrolling Interests 9 5 4 11 - 1 4 6 14 - 3 4 7 25 1 3 9 12 40 Add: Interest Expense 191 107 84 377 87 93 94 103 448 108 108 115 117 464 117 116 117 114 447
Adjusted EBIT (Operating Earnings) 3,345 1,443 1,902 5,435 992 969 1,529 1,945 5,021 675 587 1,693 2,066 5,147 346 614 2,058 2,129 5,293
Add: Depreciation and Amortization 872 426 446 1,617 379 358 443 437 1,603 387 379 404 433 1,631 394 393 417 427 1,451
Adjusted EBITDA (Operating Earnings) 4,217 1,869 2,348 7,052 1,371 1,327 1,972 2,382 6,624 1,062 966 2,097 2,499 6,778 740 1,007 2,475 2,556 6,744
(1) Earnings per share for the year may not equal the sum of quarterly earnings per share due to changes in average share calculations.(2) First quarter 2015 includes the impact of an exchange loss on non-operating pension of $23.
RECONCILIATION OF NON-GAAP MEASURES (UNAUDITED)(dollars in millions, except per share)

2Q15 Supplemental Financial Data and Non-GAAP Reconciliations 33 7/28/2015
E. I. DU PONT DE NEMOURS AND COMPANY AND CONSOLIDATED SUBSIDIARIES
Jun-15 Mar-15 Dec-14 Sep-14 Jun-14 Mar-14 Dec-13 Sep-13 Jun-13 Mar-13 Dec-12 Sep-12 Jun-12 Mar-12 Dec-11CALCULATION OF NET DEBT
Cash and Cash Equivalents 4,746 3,622 6,910 3,982 4,174 3,782 8,941 7,005 6,685 6,555 4,284 3,418 3,506 3,410 3,586 Marketable Securities 556 125 124 566 173 67 145 184 211 26 123 105 50 191 433 Total Cash 5,302 3,747 7,034 4,548 4,347 3,849 9,086 7,189 6,896 6,581 4,407 3,523 3,556 3,601 4,019
Short-Term Borrowings and Capital Lease Obligations 647 1,621 1,423 3,889 2,506 2,019 1,721 4,204 3,315 2,006 1,275 4,564 3,696 3,593 817 Long-Term Borrowings and Capital Lease Obligations 12,088 8,763 9,233 9,279 9,292 9,298 10,741 10,755 10,765 11,279 10,465 10,502 11,254 11,232 11,736 Total Debt 12,735 10,384 10,656 13,168 11,798 11,317 12,462 14,959 14,080 13,285 11,740 15,066 14,950 14,825 12,553
Net Debt (Non-GAAP) 7,433 6,637 3,622 8,620 7,451 7,468 3,376 7,770 7,184 6,704 7,333 11,543 11,394 11,224 8,534
Year Year Year Year Year
2015 2Q15 1Q15 2014 4Q14 3Q14 2Q14 1Q14 2013 4Q13 3Q13 2Q13 1Q13 2012 4Q12 3Q12 2Q12 1Q12 2011CALCULATION OF FREE CASH FLOW
Cash Provided by (Used for) Operating Activities (2,045) 78 (2,123) 3,712 5,514 269 350 (2,421) 3,179 5,512 298 36 (2,667) 4,849 5,275 691 760 (1,877) 5,152 Less: Purchases of Property, Plant and Equipment 938 373 565 2,020 709 530 461 320 1,882 659 466 436 321 1,793 654 443 395 301 1,843 Free Cash Flow (2,983) (295) (2,688) 1,692 4,805 (261) (111) (2,741) 1,297 4,853 (168) (400) (2,988) 3,056 4,621 248 365 (2,178) 3,309
RECONCILIATION OF NON-GAAP MEASURES (UNAUDITED)(dollars in millions)

2Q15 Supplemental Financial Data and Non-GAAP Reconciliations 34 7/28/2015
E. I. DU PONT DE NEMOURS AND COMPANY AND CONSOLIDATED SUBSIDIARIES
Year Year Year Year Year2015 2Q15 1Q15 2014 4Q14 3Q14 2Q14 1Q14 2013 4Q13 3Q13 2Q13 1Q13 2012 4Q12 3Q12 2Q12 1Q12 2011
SEGMENT PTOI MARGIN % (PTOI / Segment Sales) (1)
Agriculture 27.2% 24.1% 29.8% 23.6% 28.4% -3.5% 21.8% 32.8% 18.2% -6.0% -6.2% 23.7% 31.7% 16.0% -6.7% -13.9% 20.1% 31.6% 17.1%Electronics & Communications 17.9% 19.5% 16.3% 11.3% 14.1% 15.1% 3.4% 12.9% 8.0% -5.9% 15.2% 14.5% 8.0% 8.2% 6.6% -16.3% 27.8% 8.7% 13.8%Industrial Biosciences 18.3% 17.0% 19.6% 15.7% 11.8% 14.8% 18.0% 18.6% 13.9% 12.6% 14.8% 14.1% 14.2% 13.5% 13.7% 12.7% 14.0% 13.5% 0.3%Nutrition & Health 11.5% 12.0% 10.9% 10.3% 8.9% 11.1% 10.5% 10.8% 8.8% 10.0% 9.3% 7.1% 8.8% 7.9% 2.6% 7.3% 11.9% 9.8% 3.1%Performance Chemicals 6.4% 3.6% 9.5% 14.1% 14.5% 15.1% 13.7% 12.9% 13.6% 13.6% 10.6% 14.6% 15.6% 24.5% 12.8% 23.2% 30.0% 29.8% 26.8%Performance Materials 22.9% 22.6% 23.2% 25.9% 17.9% 23.8% 42.0% 19.1% 20.3% 18.3% 22.9% 20.6% 19.1% 17.3% 17.8% 14.4% 20.0% 17.1% 15.7%Safety & Protection 26.8% 33.3% 20.2% 19.0% 19.9% 20.6% 17.3% 18.5% 17.9% 21.8% 17.4% 16.9% 15.2% 14.7% 13.5% 9.9% 18.4% 16.9% 16.8%
TOTAL SEGMENT PTOI MARGIN % 20.0% 18.9% 21.0% 18.2% 16.5% 12.2% 20.0% 22.0% 14.9% 7.8% 9.5% 17.9% 21.4% 15.3% 7.1% 6.2% 19.6% 23.5% 17.3%
SEGMENT OPERATING EARNINGS MARGIN % (Operating Earnings / Segment Sales) (1)
Agriculture 26.8% 24.2% 28.9% 20.8% 7.4% -3.5% 23.1% 32.8% 21.2% 4.9% -3.8% 25.9% 32.5% 20.5% -5.0% -4.9% 28.0% 32.8% 19.5%Electronics & Communications 16.9% 17.4% 16.3% 14.8% 16.9% 15.1% 14.4% 12.9% 13.1% 14.5% 15.2% 14.5% 8.0% 9.6% 6.9% 9.6% 12.5% 8.7% 13.8%Industrial Biosciences 18.5% 17.4% 19.6% 16.8% 15.2% 14.8% 18.6% 18.6% 13.8% 12.3% 14.8% 14.1% 14.2% 13.7% 13.7% 13.7% 14.0% 13.5% 11.5%Nutrition & Health 11.7% 12.5% 10.9% 10.8% 9.7% 11.1% 11.3% 10.8% 8.6% 9.3% 9.3% 7.1% 8.8% 9.3% 6.8% 8.8% 11.9% 9.8% 8.2%Performance Chemicals 8.4% 7.5% 9.5% 14.4% 14.6% 15.1% 14.8% 12.9% 14.6% 13.8% 14.7% 14.6% 15.6% 25.0% 14.8% 23.4% 30.0% 29.8% 26.8%Performance Materials 23.0% 22.8% 23.2% 21.2% 22.7% 23.8% 19.2% 19.1% 20.5% 19.3% 22.9% 20.6% 19.1% 19.0% 18.0% 20.9% 20.0% 17.1% 15.0%Safety & Protection 20.7% 21.1% 20.2% 20.4% 22.2% 20.6% 20.3% 18.5% 17.8% 21.4% 17.4% 16.9% 15.2% 16.2% 13.8% 15.7% 18.4% 16.9% 16.8%
19.7% 18.3% 21.0% 17.0% 13.6% 12.2% 18.1% 22.0% 16.4% 12.0% 10.9% 18.7% 21.7% 17.8% 8.3% 12.3% 22.4% 24.0% 18.5%TOTAL SEGMENT OPERATING EARNINGS MARGIN %
RECONCILIATION OF NON-GAAP MEASURES (UNAUDITED)
(1) Segment PTOI / Operating Earnings margin %'s for Other (which includes the previous Pharmaceuticals segment) are not presented separately above as they are not meaningful; however, the results are included in the Total margin %'s above.
2Q15 Supplemental Financial Data and Non-GAAP Reconciliations 35 7/28/2015
E. I. DU PONT DE NEMOURS AND COMPANY AND CONSOLIDATED SUBSIDIARIES
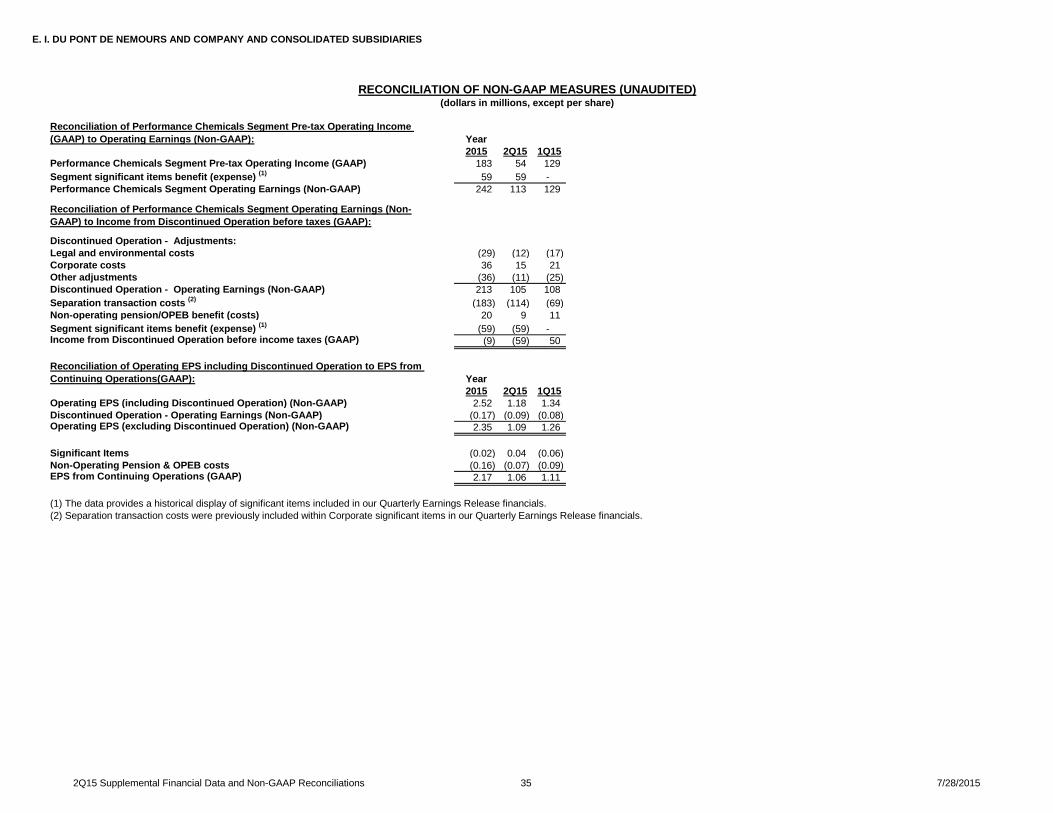
Reconciliation of Performance Chemicals Segment Pre-tax Operating Income (GAAP) to Operating Earnings (Non-GAAP): Year
2015 2Q15 1Q15Performance Chemicals Segment Pre-tax Operating Income (GAAP) 183 54 129 Segment significant items benefit (expense) (1) 59 59 - Performance Chemicals Segment Operating Earnings (Non-GAAP) 242 113 129
Reconciliation of Performance Chemicals Segment Operating Earnings (Non-GAAP) to Income from Discontinued Operation before taxes (GAAP):
Discontinued Operation - Adjustments: Legal and environmental costs (29) (12) (17) Corporate costs 36 15 21 Other adjustments (36) (11) (25) Discontinued Operation - Operating Earnings (Non-GAAP) 213 105 108 Separation transaction costs (2) (183) (114) (69) Non-operating pension/OPEB benefit (costs) 20 9 11 Segment significant items benefit (expense) (1) (59) (59) - Income from Discontinued Operation before income taxes (GAAP) (9) (59) 50
Reconciliation of Operating EPS including Discontinued Operation to EPS from Continuing Operations(GAAP): Year
2015 2Q15 1Q15Operating EPS (including Discontinued Operation) (Non-GAAP) 2.52 1.18 1.34 Discontinued Operation - Operating Earnings (Non-GAAP) (0.17) (0.09) (0.08) Operating EPS (excluding Discontinued Operation) (Non-GAAP) 2.35 1.09 1.26
Significant Items (0.02) 0.04 (0.06) Non-Operating Pension & OPEB costs (0.16) (0.07) (0.09) EPS from Continuing Operations (GAAP) 2.17 1.06 1.11
RECONCILIATION OF NON-GAAP MEASURES (UNAUDITED)(dollars in millions, except per share)
(1) The data provides a historical display of significant items included in our Quarterly Earnings Release financials.(2) Separation transaction costs were previously included within Corporate significant items in our Quarterly Earnings Release financials.
2Q15 Supplemental Financial Data and Non-GAAP Reconciliations 36 7/28/2015
E. I. DU PONT DE NEMOURS AND COMPANY AND CONSOLIDATED SUBSIDIARIES
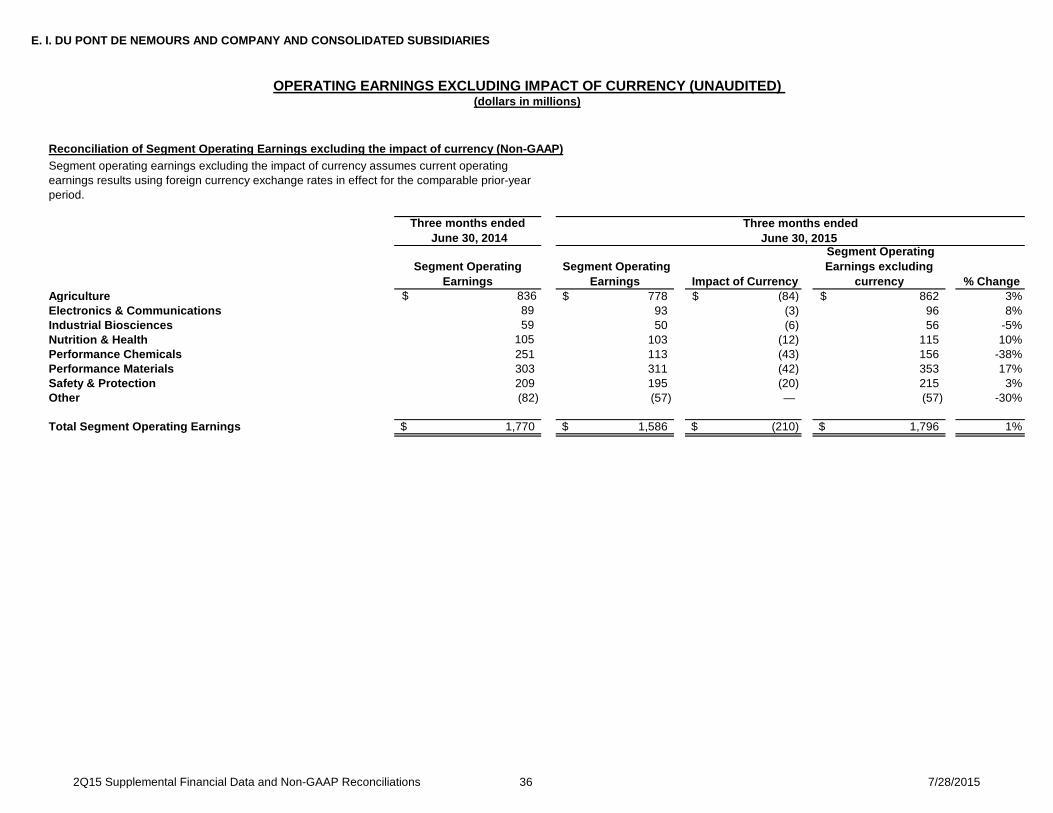
Reconciliation of Segment Operating Earnings excluding the impact of currency (Non-GAAP)
Three months ended June 30, 2014
Segment Operating Earnings
Segment Operating Earnings Impact of Currency
Segment Operating Earnings excluding
currency % Change Agriculture $ 836 778$ (84)$ 862$ 3%Electronics & Communications 89 93 (3) 96 8%Industrial Biosciences 59 50 (6) 56 -5%Nutrition & Health 105 103 (12) 115 10%Performance Chemicals 251 113 (43) 156 -38%Performance Materials 303 311 (42) 353 17%Safety & Protection 209 195 (20) 215 3%Other (82) (57) — (57) -30%
Total Segment Operating Earnings 1,770$ 1,586$ (210)$ 1,796$ 1%
Three months ended June 30, 2015
Segment operating earnings excluding the impact of currency assumes current operating earnings results using foreign currency exchange rates in effect for the comparable prior-year period.
OPERATING EARNINGS EXCLUDING IMPACT OF CURRENCY (UNAUDITED) (dollars in millions)

2Q15 Supplemental Financial Data and Non-GAAP Reconciliations 37 7/28/2015
E. I. DU PONT DE NEMOURS AND COMPANY AND CONSOLIDATED SUBSIDIARIES
2015 2014 2015 Outlook1 2014 Actual1
Effective income tax rate 19.6% 25.4% 31.0% 27.1%Significant items effect and non-operating pension/OPEB costs effect (0.1%) (1.1%) (5.2%) (1.7%)
19.5% 24.3% 25.8% 25.4%
Exchange gains (losses) effect2 2.6% (1.0%) (3.8%) (8.0%)Base income tax rate from continuing operations 22.1% 23.3% 22.0% 17.4%
(1) Represents the company's anticipated full year tax rates for 2015 and the actual full year tax rates for 2014, each on a continuing operations basis excluding Performance Chemicals.(2) The company does not forecast the impact of exchange gains (losses) on the projected tax rate.
Tax rate, from continuing operations, before significant items and non-operating pension/OPEB costs
Three months endedJune 30,
RECONCILIATION OF BASE INCOME TAX RATE TO EFFECTIVE INCOME TAX RATE (UNAUDITED)
Base income tax rate is defined as the effective income tax rate less the effect of exchange gains (losses), significant items and non-operating pension/OPEB costs.
Year ended December 31,

Copyright © 2014 DuPont or its affiliates. All rights reserved. The DuPont Oval Logo, DuPont™, The miracles of science™ and all products denoted with ™ or ® are registered trademarks or trademarks of E. I. du Pont de Nemours and Company or its affiliates.
Images reproduced by E. I. du Pont de Nemours and Company under license from the National Geographic Society.
Copyright © 2015 DuPont or its affiliates. All rights reserved. The DuPont Oval Logo, DuPont™, The miracles of science™ and all products, unless otherwise indicated, denoted with ™ or ® are registered trademarks or trademarks of E. I. du Pont de Nemours and Company or its affiliates.
+Viton® and Opteon® are registered trademarks of The Chemours Company.
Images reproduced by E. I. du Pont de Nemours and Company under license from the National Geographic Society.
© National Geographic Image