dtu international energy report 2014 wind energy — drivers
TRANSCRIPT

General rights Copyright and moral rights for the publications made accessible in the public portal are retained by the authors and/or other copyright owners and it is a condition of accessing publications that users recognise and abide by the legal requirements associated with these rights.
Users may download and print one copy of any publication from the public portal for the purpose of private study or research.
You may not further distribute the material or use it for any profit-making activity or commercial gain
You may freely distribute the URL identifying the publication in the public portal If you believe that this document breaches copyright please contact us providing details, and we will remove access to the work immediately and investigate your claim.
Downloaded from orbit.dtu.dk on: Dec 17, 2021
DTU International Energy Report 2014Wind energy — drivers and barriers for higher shares of wind in the global power generationmixLarsen, Hans Hvidtfeldt; Sønderberg Petersen, Leif
Publication date:2014
Document VersionPublisher's PDF, also known as Version of record
Link back to DTU Orbit
Citation (APA):Larsen, H. H., & Sønderberg Petersen, L. (Eds.) (2014). DTU International Energy Report 2014: Wind energy —drivers and barriers for higher shares of wind in the global power generation mix. Technical University ofDenmark. http://www.natlab.dtu.dk/english/Energy_Reports

DTU International Energy Report 2014
Edited by Hans Hvidtfeldt Larsen and Leif Sønderberg Petersen, DTU National Laboratory for Sustainable Energy
DT
U In
tern
ation
al Ene
rgy R
ep
ort 2
014
Wind energ
y — drivers and barriers for higher shares of w
ind in the global power generation m
ix Technical U
niversity of Denm
ark
Wind energy — drivers and barriers for higher shares of wind in the global power generation mix

DTU International Energy Report 2014Wind energy – drivers and barriers for higher sharesin the global power generation mix November 2014
Edited byHans Hvidtfeldt Larsen and Leif Sønderberg Petersen DTU National Laboratory for Sustainable Energy
Reviewed byMichael C. Robinson, PhD Chief ScientistEERE/WWPTOUS Department of EnergyUSA
Panagiotis ChaviaropoulosDirectorCenter for Renewable Energy Sources and SavingGreece
Editorial consultantCharles ButcherScience JournalistUK
Design e-Types Daily
PrintCoolgray
ISBN 978-87-550-3969-8

DTU International Energy Report 2014
Edited by Hans Hvidtfeldt Larsen and Leif Sønderberg Petersen, DTU National Laboratory for Sustainable Energy
Wind energy — drivers and barriers for higher shares of wind in the global power generation mix

Visual overview
Global perspectives for wind energy
Plans for wind energy deploymentDenmark’s goal is to get 50% of its power from wind by 2020. The European Technology Platform for Wind Energy (TPWind) sees wind energy as the leading renewable energy technology, providing up to 34% of EU electricity by 2030.– Read more in Chapter 5
Trends in wind energy technology developmentTo make wind energy fully commercially competitive with other energy sources in terms of the cost of energy (CoE) is the prima-ry driver in the technology development.– Read more in Chapter 6
Security of energy supplySecuring sustainable energy supply today and in the future is of utmost importance. Wind energy is an important contributor in this context.
Wind power forecastingImproved forecasting models and a shift from hourly to minute-based forecasts will reduce uncertainty in wind power production and the need for reserves.– Read more in Chapter 10
Global installed wind power capacity has increased from 48 GW in 2004 to around 320 GW at the end of 2013, an annual growth in the order of 20%. In 2030 onshore installed wind capacity is expected to exceed 1,000 GW and offshore might exceed 200 GW.
Reducing offshore CoEOffshore CoE can be reduced through up-scaling of turbines and industrialisation of other parts of the plant. The industry have a target of cutting costs by 40% by 2020.– Read more in Chapter 7
Blades evolveMany factors have aided the move to lighter blades, of which the most important has been the development of blades that are much more slender and flexible than their predecessors.– Read more in Chapter 6
Recycling routes are neededThe institutional and organisational structures for recycling wind turbines are still quite uncertain. There is a need to develop policies encouraging the recyclability of wind turbines. – Read more in Chapter 13
Designed for specific conditionsTo lower the CoE, designers have tailored the turbines even more carefully to the conditions under which they operate.– Read more in Chapter 6
Drive trains without gearsConventional wind turbines use gears. Several manufactures are introducing direct-drive generators without gearboxes in order to increase reliability.– Read more in Chapter 8
New concepts for towersNew concepts for towers include building them from serially produced concrete segments.– Read more in Chapter 8
Offshore HVDCOffshore wind farms connected to the grid through HVDC converters can provide important support for grid performance. – Read more in Chapter 7
Storage adds control capacityElectrical storage can provide additional control capacity that could replace the need for flexible thermal power generation.– Read more in Chapter 9
Ancillary servicesWind energy must take a larger responsibility for the stable operation of the energy system and provide system services, so called ancillary services.– Read more in Chapter 9
Balancing energy systems with high shares of windBalancing energy systems with very high shares of wind energy requires well-integrated grids with good interconnections. On the supply side, demand response will reduce balancing needs.– Read more in Chapter 9
Wind power and market signalsMore EU countries leave the feed-in tariffs. Wind power must interact better with the remainder of the power system, and should react to market signals.– Read more in Chapter 11
Environmental and social impacts of wind energyCompliance of wind farms with local environ-mental requirements, and social acceptance, are both important if wind energy is to reach its ambitious targets.– Read more in Chapter 12
Wind power creates jobsThe European Wind Energy Association estimates that by 2020 there will be 520,000 jobs in the European wind energy sector and almost 800,000 jobs by 2030. Globally 834,000 people were employed in the wind industry at the end of 2013.– Read more in Chapter 6 and 11

Contents
Chapter 1 Preface 9
Chapter 2 Summary and recommendations 10
Chapter 3 Synthesis 13
Chapter 4 Global energy perspectives with an emphasis on wind energy 19
Chapter 5 Danish and European plans for wind energy deployment 26
Chapter 6 Wind energy technology developments 32
Chapter 7 Offshore wind energy developments 43
Chapter 8 Emerging wind energy technologies 52
Chapter 9 Challenges and solutions for energy systems with high shares of wind energy 63
Chapter 10 Wind resource assessment and wind power forecasting 72
Chapter 11 Wind economics 79
Chapter 12 Environmental and social impacts of wind energy 86
Chapter 13 Recycling of wind turbines 91
Chapter 14 Index 98
Chapter 15 References 99


DTU International Energy Report 2014
Preface — Page 9
Wind energy offers great potential for reducing greenhouse gas emissions, securing sustainable en-ergy supply and creating new jobs.
In areas with good wind resources and favourable fi-nancing conditions, wind energy is now competitive with fossil fuel based energy technologies.
Over the past ten years, global accumulated installed wind power capacity has increased from approxi-mately 48 GW in 2004 to around 320 GW at the end of 2013, an average annual growth in the order of 20%.
Denmark has a goal of supplying 50% of its power consumption from wind by 2020. The European Technology Platform for Wind Energy (TPWind) sees wind energy as the leading renewable energy technology which could provide up to 34% of EU electricity by 2030.
Stronger global competition within the wind energy sector as well as from competing energy technologies has augmented the efforts for lowering the cost of energy (CoE) for wind power.
The abovementioned facts have led to renewed efforts in the technological development of wind turbine technology as well as for integrating larger amounts of wind energy in the energy systems.
This Report addresses a selection of scientific and technical issues relevant to further increase the share of wind power in the global electricity mix. It covers the assessment and forecasting of wind resources, the development of wind energy technologies, the integration of large amounts of fluctuating wind power in future energy systems, and the economic aspects of wind power.
Chapter 1
Preface
DTU International Energy Report series
DTU International Energy Reports deal with global, regional and national perspectives on current and future energy issues. Individual chapters of the Reports are written by DTU researchers in cooperation with leading Danish and international experts.
Each Energy Report is based on internationally recognised scientific mate-rial and is fully referenced. It is then refereed by independent international experts before being edited, produced and pub-lished in accordance with the highest international quality standards.
The target readership is DTU colleagues, collaborat-ing partners and customers, funding organisations, institutional investors, min-istries and authorities, and international organisations such as the EU, IEA, WEC and UN.

DTU International Energy Report 2014
Page 10 — Summary and recommendations
SummaryWithin the past ten years, cumulative global installed wind power capacity has increased from approximately 48 GW in 2004 to around 320 GW at the end of 2013, an average annual growth in the order of 20%. In 2030 onshore wind installed capacity is expected to exceed 1,000 GW, while offshore might exceed 200 GW.
Denmark has a goal of meeting 50% of its power consumption from wind by 2020. The European Technology Platform for Wind Energy (TPWind) sees wind energy as the leading renewable energy technol-ogy which could provide up to 34% of EU electricity by 2030.
To make wind energy fully commercially competitive with other energy sources in terms of the cost of energy (CoE) is the primary driver in the technology devel-opment. Another important issue is to improve the predictability and system services of wind energy production and hence to enable higher penetration in the grid.
Onshore wind power is becoming increas-ingly competitive with conventional fos-sil-based electricity generation. However, offshore wind power is still much more expensive than onshore. Offshore CoE can be reduced through upscaling of tur-bines and industrialisation of other parts of the plant, and the industry is on track to achieve its target of cutting costs by approximately 40% by 2020.
Emerging wind energy technologiesIf the 55 kW turbines of the mid-1980s were directly scaled up, the newest 6–8 MW turbines would weigh about 10 times as much as they do. To lower the CoE, designers have tailored the turbines even more carefully to the conditions un-der which they operate; advanced designs using less materials and higher reliability remain the main ways of reducing CoE for future turbine designs, too.
Many factors have aided the move to lighter blades, of which the most im-portant has been the development of blades that are much more slender and flexible than their predecessors. This de-velopment is leading to blades with new geometry with passive control, advanced thick airfoils and new processes and ma-terials. Several manufactures are intro-ducing direct-drive generators without gearboxes in order to increase reliability. New concepts for towers include build-ing them from serially produced concrete segments.
Balancing energy systems with high shares of wind energyThe integration of high shares of wind energy into today’s energy systems has several related, but separate, challenges due to the variability and predictability of the energy production.
The inherent uncertainty of wind power generation leads to deviations between forecast and actual wind production, and hence to unexpected fluctuations in the power supply. To minimise the effect of these fluctuations the system operator needs access to sufficient reserves. A high share of wind energy also means that wind energy must take a larger responsibility for the stable operation of the energy sys-tem and provide system services, which are known as ancillary services.
Demand control will reduce balancing needs on the supply side. Electrical stor-age can provide additional control capac-ity that could replace the need for flexible thermal power generation.
Chapter 2
Summary and recommendations
Many factors have aided the move to lighter blades, of which the most important has been the development of blades that are much more slender and flexible than their predecessors.
To make wind energy fully commercially competitive with other energy sources in terms of the cost of energy (CoE) is the primary driver in the technology development.

DTU International Energy Report 2014
Summary and recommendations — Page 11
Improved forecasting models and a shift from hourly to minute-based forecasts will reduce uncertainty in wind power production and need for reserves.
Wind power economy and market signalsFor wind power, a number of EU coun-tries leave the classic feed-in tariffs that paved the way for the cost reductions we have seen to date. The main reason is wind’s increasing market share: wind power now has to interact better with the remainder of the power system, and should react to market signals. The EU’s current legislative plans point towards a stronger future focus on cost reduction and competition.
The investment cost per kW for on-shore turbines today is typically around 1,200–1,400 €/kW (9,000–10,000 DKK/kW). The CoE ranges from approxi-mately 0.06–0.07 €/kWh (0.4–0.5 DKK/kW) at sites with low to medium av-erage wind speeds, to approximately
0.04–0.05 €/kWh (0.3–0.4 DKK/kW) in good coastal positions.
The CoE from offshore turbines in high-wind locations is close to 0.09 €/kWh (0.7 DKK/kWh) for a standard offshore installation with an investment cost of 3,000 €/kW (22,000 DKK/kW).
O&M costs are increasingly attracting more attention. Manufacturers are at-tempting to lower these significantly by developing new turbine designs that re-quire fewer regular service visits and less planned downtime.
Wind power creates jobsThe European Wind Energy Associa-tion estimates that by 2020 there will be 520,000 jobs in the European wind energy sector and almost 800,000 jobs by 2030. Globally 834,000 people were employed in the wind industry at the end of 2013.
There has been a shift from jobs requiring unskilled manpower to highly skilled jobs. For example in Denmark, jobs requiring master’s degrees and PhDs have grown consistently. Highly trained staff is scarce, and require intensive effort in education and research if their numbers are to grow.
Environmental and social impacts of wind energyThe compliance of wind farms with local and regional environmental requirements and guidelines, and the social acceptance
of wind power, are both essential if wind is to meet its ambitious targets for growth. Recent research in Denmark is seeking new opportunities to understand and im-prove the democratic processes linked to the construction of large facilities for wind energy and other renewables.
Recycling of wind turbines attracts greater attentionThe institutional and organisational struc-tures for recycling wind turbines are still quite uncertain. There is a need to develop policies encouraging the recyclability of wind turbines.
A high share of wind energy also means that wind energy must take a larger responsibility for the stable operation of the energy system and provide system services, which are known as ancillary services.
See our recommendations for academia, industry, and authorities on the next page.

DTU International Energy Report 2014
Page 12 — Summary and recommendations
Academia• The most important role of academia is to
develop the instruments and support the innovation in industry. The instruments are based on research and take the form of new knowledge, models, education and new ideas.
• It is important to find the right balance be-tween short-term and long-term objectives in future R&D. Incremental innovations will probably have a faster effect on CoE com-pared to long-term research, but in time the latter is likely to have more impact.
• There is a need for more R&D on metallic and composite materials for more efficient use and substitution in future wind turbine designs.
• There is a need for more R&D in ways to dismantle wind turbines into recyclable ma-terials and to look at the potential markets for products made from recycled materials.
• The use of rare earth materials is increasing, for example in magnets. There is a need for more R&D on recycling or recovery of rare earths and magnets.
• A challenge, both technical and economic, is to ensure that ancillary services continue to be provided at the lowest cost consistent with not compromising system security or reliability.
Industry• The wind industry is maturing and moving
in the direction of mass production. Thus the industry needs to learn from other sec-tors, such as car manufacturers, how to do that in a cost-competitive way.
• The largest growth rate of the wind sector is expected offshore. There might be a need for larger companies with the ability to de-velop, produce and deploy entire offshore wind farms.
• Industrial development of new smart power protection systems has the long-term potential to mitigate some of the present needs for ancillary services.
Authorities• It is important to continue with reliable
policies and stable support frameworks for R&D and industrial implementation, as well as fixed long-term targets for wind capacity growth.
• Regulators should pay attention to the system integration of wind power. This also needs to be reflected in the design of support systems (e.g. feed-in premiums, with guaranteed total income levels, in-stead of tariffs), and the design of markets for ancillary services.
• In the long term, adequate investment in-centives must be provided for controllable backup power.
• There is a need for policies that stimulate OEMs to design for recyclability. Valuable experience might be gained from compa-rable industries.
Recommendations
The following recommendations address issues that need attention if Denmark is to meet the ambitious targets set by the government for the growth of wind power.
§
§
§

DTU International Energy Report 2014
Synthesis — Page 13
Global wind energy perspectives
→ Global annual installed wind power capacity in 2013 amounted to a little more than 36 GW, a decrease of approximately 20% compared to 2012. Over the past ten years, global accumulated installed wind power capacity has increased from ap-proximately 48 GW in 2004 to around 320 GW at the end of 2013, an average annual growth in the order of 20%.
Several studies indicate that onshore wind installed capacity will exceed 1,000 GW in 2030. And offshore wind capacity might exceed 200 GW. Countries with the largest expected share of wind energy in their power systems in 2030 include Denmark, the leader, which is expected to produce more than 60% of its electricity from wind, followed by Germany and the UK, which may reach shares of 40–50%.
Danish and European plans for wind energy deployment
→ Denmark has a goal of supplying 50% of its domestic power consumption from wind by 2020.
The European Technology Platform for Wind Energy (TPWind) sees wind energy as the leading renewable energy technol-ogy which could provide up to one third of EU electricity by 2030.
The focus in EU research funding for wind energy has shifted towards more strategic long-term collaboration, in order to create clearer links between nationally funded projects and those with EU support.
Wind energy developments
→ In spite of the slowdown in global mar-kets, recent years have seen renewed effort in the technological development of wind turbine technology. This effort is driven by stronger global competition within the wind energy sector as well as the compet-ing energy technologies. This competition provides a pull towards lower cost of en-ergy (CoE), larger and more reliable wind turbines for offshore applications, and an increased interest in developing sites with low or moderate wind regimes. Thus the mainstream development trend in turbine technology is characterised by scaling up to turbines of larger rated capacity for both onshore and offshore applications,
larger rotors for higher capacity factors, and new drive train solutions, including direct-drive turbines without gearboxes.
The technology solutions are strongly influenced by the development of the international wind industry, with its global market for components. Contrary to what was expected a few years ago, the market has not consolidated into just a few large suppliers. The top ten compa-nies supply 69.5% of the market, and the next five largest suppliers, all from China, provide an additional 13.4%.
Onshore wind power is becoming increas-ingly competitive with conventional fossil- based electricity generation.
The shares of turbine costs, installation costs, infrastructure costs, and operat-ing costs in the levelized cost of energy (LCoE), (the price at which electricity must be generated from a specific source to break even over the lifetime of the project) depend on the project type: the turbine cost is typically more than half the total for onshore projects, but less than half for offshore projects.
The typical power of onshore turbines is 2–3 MW, whereas the largest offshore tur-bines range up to 8 MW and have rotor diameters up to 171 m. The same rotor size may be used for turbines with quite differ-ent power ratings, if these are targeted at different wind conditions. It is preferable to have a turbine producing a lower full rated power, for more days in a year, than
Chapter 3
Synthesis

DTU International Energy Report 2014
Page 14 — Synthesis
to have high power production for only a few days a year.
Offshore wind energy developments
→ Offshore wind power is still much more expensive than its onshore coun-terpart. The reasons for going offshore are many, but mostly relate to higher wind resources, less environmental impact and more available space. The drawbacks are increased operation and maintenance costs, and added capital expenditure, for instance for cabling and support struc-tures.
The most important short- to medium- term goal for the offshore wind industry is to lower LCoE. Offshore CoE can be reduced through upscaling of turbines and industrialisation of other parts of the plant, and the industry is on track to achieve its target of cutting costs by approximately 40% by 2020.
The evaluation of the CoE from offshore wind power must include the cost of the foundation, which will scale with the water depth of a specific installation site. Ad-ditionally it will scale with the rotor size, since the larger rotor creates bigger loads and hence needs a foundation that is both wider and thicker. Although the founda-tion is often more expensive than the tur-bine itself, its cost scales more slowly as the turbine size increases. As a result, it turns out that turbines much larger (>5 MW) than the current onshore size of 2–3 MW are more economical offshore due to the foundation cost.
Substantial research and development is needed to realise the Danish vision known as MegaVind, a public-private cooperation between the state, industry,
universities and venture capitalists to ac-celerate innovation in wind energy. To make MegaVind work, research needs to focus on those areas where RD&D is most cost-competitive:
• design;• site conditions;• support structures;• reliability and operation and mainte-
nance (O&M); • project development and planning;• business innovation; and• standards and certification.
Upgrading offshore gridsThe architecture favoured for the col-lection grids of offshore wind farms and their cable connections to land is expected to evolve from the 33 kV AC cables used at present. Future systems are likely to operate at 66 kV AC and above. Another possibility is DC collection grids linked to shore via either HVAC (high voltage alternating current) or HVDC (high voltage direct current) export ca-bles, especially as the offshore distance increases.
Offshore wind farms connected to the grid through HVDC converters can play an important role in supporting grid perfor-mance. Converters can also contribute to short-term stabilisation if they are com-bined with suitable energy sources.
Lowering costs of offshore wind servicesOffshore wind services (OWS) are the services needed to install, operate, main-tain, and decommission or repower an offshore wind farm through its life cycle. Over the life cycle of an offshore wind farm the actual O&M cost is estimated to account for 25–28% of the total LCoE. The opportunities to lower costs here include standardising technologies and
interfaces; improving communication and knowledge exchange within the OWS value chain; and securing the skills and qualifications necessary to provide OWSs safely, effectively and efficiently.
Standards and certification remove barriers
→ Much of the technology development and globalisation we have seen in the wind energy industry has been helped immensely by the development of inter-national standards. Standards can be used to share new technical knowledge and best practices, and to facilitate technical devel-opment by creating and maintaining an
Power (MW)
6.0
Rotor diameter (m)
146
Drive train
DD, PM,full converter
Model
Haliade
Manufacturer
Alstom
Power (MW)
6.0
Rotor diameter (m)
128
Drive train3-stage gear, DFIG,
partial converter
Model
SL6000
Manufacturer
Sinovel
Power (MW)
5.0
Rotor diameter (m)
136
Drive train
1-stage gear, PM, full converter
Model
M5000
Manufacturer
Areva
Power (MW)
5.0
G5MWRotor diameter (m)
128
Drive train
2-stage gear,PM, full converter
Model
Manufacturer
Gamesa
Power (MW)
8.0
Model
V164
Rotor diameter (m)
164
Drive train
1-stage gear,
PM, full converter
Manufacturer
Vestas
Power (MW)
7.5
Model
E126Rotor diameter (m)
126
Drive train
DD, Wound Cu, full converter
Manufacturer
Enercon
Power (MW)
7.0
Model
S7.0-171
Manufacturer
SamsungRotor diameter (m)
171
Drive train
1-stage gear,PM, full converter
Power (MW)
6.2
Model
6MRotor diameter (m)
126
Drive train
3-stage gear,
DFIG, partial converter
Manufacturer
Senvion
Power (MW)
5.0
Rotor diameter (m)
122
Drive train
3-stage gear,
DFIG, partial converter
Model
Bard 5.0
Manufacturer
Bard
Power (MW)
6.0
Model
SWT6.0-155Rotor diameter (m)
154
Drive train
DD, PM,full converter
Manufacturer
Siemens
Power (MW)
5.0
Model
XD115-5MW
Manufacturer
XEMECRotor diameter (m)
115
Drive train
DD, PM,full converter
Power (MW)6.0
Rotor diameter (m)146
Drive trainDD, PM,
full converter
ModelHaliadeManufacturerAlstom
Power (MW)6.0
Rotor diameter (m)128
Drive train 3-stage gear, DFIG,
partial converter
ModelSL6000ManufacturerSinovel
Power (MW)5.0
Rotor diameter (m)136
Drive train1-stage gear,
PM, full converter
ModelM5000ManufacturerAreva
Power (MW)5.0
G5MW
Rotor diameter (m)128
Drive train2-stage gear,
PM, full converter
Model
ManufacturerGamesa
Power (MW) 8.0Model V164
Rotor diameter (m) 164
Drive train 1-stage gear,PM, full converter
Manufacturer Vestas
Power (MW)7.5Model
E126
Rotor diameter (m)126
Drive trainDD, Wound Cu,
full converter
ManufacturerEnercon
Power (MW)7.0Model
S7.0-171ManufacturerSamsung
Rotor diameter (m)171
Drive train1-stage gear,
PM, full converter
Power (MW)6.2Model
6M
Rotor diameter (m)126
Drive train3-stage gear,
DFIG, partial converter
ManufacturerSenvion
Power (MW)5.0
Rotor diameter (m)122
Drive train3-stage gear,
DFIG, partial converter
ModelBard 5.0Manufacturer
Bard
Power (MW)6.0Model
SWT6.0-155
Rotor diameter (m)154
Drive trainDD, PM,
full converter
ManufacturerSiemens
Power (MW)5.0Model
XD115-5MWManufacturerXEMEC
Rotor diameter (m)115
Drive trainDD, PM,
full converter
Power (MW)6.0Rotor diameter (m)
146Drive trainDD, PM,full converter
ModelHaliade
ManufacturerAlstom
Power (MW)6.0Rotor diameter (m)
128Drive train 3-stage gear, DFIG,partial converter
ModelSL6000
ManufacturerSinovel
Power (MW)5.0Rotor diameter (m)
136Drive train1-stage gear, PM, full converter
ModelM5000
ManufacturerAreva
Power (MW)5.0
G5MW
Rotor diameter (m)128Drive train
2-stage gear,PM, full converter
Model
ManufacturerGamesa
Power (MW)
8.0
Model
V164Rotor diameter (m)
164Drive train
1-stage gear,PM, full converter
Manufacturer
Vestas
Power (MW)7.5
ModelE126
Rotor diameter (m)126Drive train
DD, Wound Cu, full converter
ManufacturerEnercon
Power (MW)7.0
ModelS7.0-171
ManufacturerSamsung
Rotor diameter (m)171Drive train
1-stage gear,PM, full converter
Power (MW)6.2
Model6M
Rotor diameter (m)126Drive train
3-stage gear, DFIG, partial converter
ManufacturerSenvion
Power (MW)5.0Rotor diameter (m)
122Drive train3-stage gear,DFIG, partial converter
ModelBard 5.0
ManufacturerBard
Power (MW)6.0
ModelSWT6.0-155
Rotor diameter (m)154Drive train
DD, PM,full converter
ManufacturerSiemens
Power (MW)5.0
ModelXD115-5MW
ManufacturerXEMEC
Rotor diameter (m)115Drive train
DD, PM,full converter
DTU International Energy Report 2014
Synthesis — Page 15
international market without technical barriers. However, increasingly compre-hensive technical standards can also be-come a barrier to technical development.
Emerging wind energy technologies
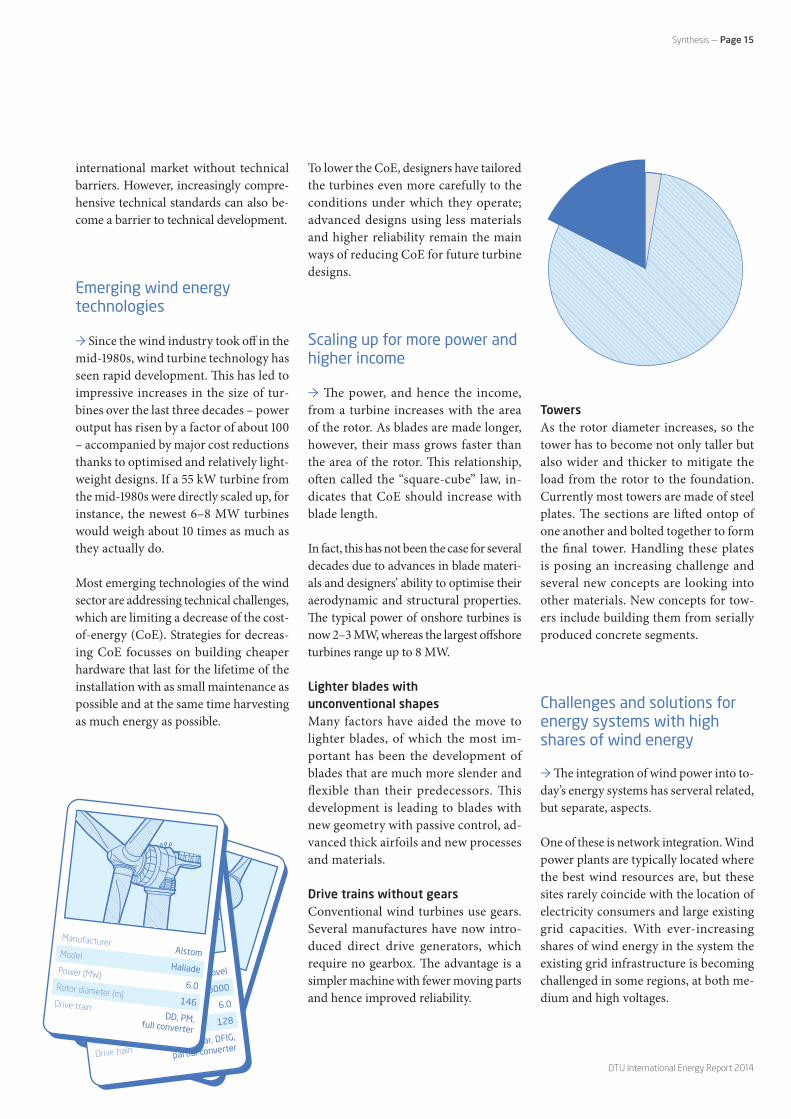
→ Since the wind industry took off in the mid-1980s, wind turbine technology has seen rapid development. This has led to impressive increases in the size of tur-bines over the last three decades – power output has risen by a factor of about 100 – accompanied by major cost reductions thanks to optimised and relatively light-weight designs. If a 55 kW turbine from the mid-1980s were directly scaled up, for instance, the newest 6–8 MW turbines would weigh about 10 times as much as they actually do.
Most emerging technologies of the wind sector are addressing technical challenges, which are limiting a decrease of the cost-of-energy (CoE). Strategies for decreas-ing CoE focusses on building cheaper hardware that last for the lifetime of the installation with as small maintenance as possible and at the same time harvesting as much energy as possible.
To lower the CoE, designers have tailored the turbines even more carefully to the conditions under which they operate; advanced designs using less materials and higher reliability remain the main ways of reducing CoE for future turbine designs.
Scaling up for more power and higher income
→ The power, and hence the income, from a turbine increases with the area of the rotor. As blades are made longer, however, their mass grows faster than the area of the rotor. This relationship, often called the “square-cube” law, in-dicates that CoE should increase with blade length.
In fact, this has not been the case for several decades due to advances in blade materi-als and designers’ ability to optimise their aerodynamic and structural properties. The typical power of onshore turbines is now 2–3 MW, whereas the largest offshore turbines range up to 8 MW.
Lighter blades with unconventional shapesMany factors have aided the move to lighter blades, of which the most im-portant has been the development of blades that are much more slender and flexible than their predecessors. This development is leading to blades with new geometry with passive control, ad-vanced thick airfoils and new processes and materials.
Drive trains without gearsConventional wind turbines use gears. Several manufactures have now intro-duced direct drive generators, which require no gearbox. The advantage is a simpler machine with fewer moving parts and hence improved reliability.
TowersAs the rotor diameter increases, so the tower has to become not only taller but also wider and thicker to mitigate the load from the rotor to the foundation. Currently most towers are made of steel plates. The sections are lifted ontop of one another and bolted together to form the final tower. Handling these plates is posing an increasing challenge and several new concepts are looking into other materials. New concepts for tow-ers include building them from serially produced concrete segments.
Challenges and solutions for energy systems with high shares of wind energy
→ The integration of wind power into to-day’s energy systems has serveral related, but separate, aspects.
One of these is network integration. Wind power plants are typically located where the best wind resources are, but these sites rarely coincide with the location of electricity consumers and large existing grid capacities. With ever- increasing shares of wind energy in the system the existing grid infrastructure is becoming challenged in some regions, at both me-dium and high voltages.
DTU International Energy Report 2014
Page 16 — Synthesis
Another aspect relates to long-term and medium-term integration. Production from wind power plants can be highly variable, depending on the availability of the wind resource.
The inherent uncertainty of wind power generation leads to deviations between forecast and actual wind production, and hence to unexpected fluctuations in the power supply. To minimise the effect of these fluctuations the system oper-ator needs access to sufficient reserves. A high share of wind energy also means that wind energy must take a larger re-sponsibility for the stable operation of the energy system and provide system services, which are known as ancillary services.
To balance energy systems with very high shares of wind energy it is necessary to have well-integrated grids with good interconnections to reduce balancing needs. Demand response, meanwhile, will reduce balancing needs on the sup-ply side. Electrical storage can provide additional control capacity that could replace the need for flexible thermal
power generation. Wind power plants themselves can also deliver some of the ancillary services.
The large-scale integration of wind energy into power systems will require integrated regulation strategies for the whole energy system, and these strategies will in turn draw from all the options mentioned above. Wind power plants will not only have to produce energy, but also contrib-ute to delivering ancillary services.
Improved forecasting reduces uncertainty
→ To reduce uncertainty in wind energy production a new European Wind Atlas will address such issues as the predicta-bility of wind, turbulence and loads on the wind turbines, the probability of ic-ing, and other weather-related influences on the installation or operating cost of wind power plants.
Wind power forecasts have historically focused on methodologies for predicting
generation at hourly intervals, because this is the shortest timescale on which electricity is traded in the existing mar-kets. However, experts in energy man-agement have argued that decreasing the scheduling time for generation and deliv-ery from hours to minutes would greatly facilitate the balancing of electricity pro-duction and consumption.
There is a long tradition of using “point forecasts” of wind power generation for dispatching and trading. However, such simple forecasts are known to be sub-op-timal for many operational problems. Nowadays the focus is moving towards new research areas such as frameworks for probabilistic estimation, and the use of probabilistic forecasts to aid decisions about electricity markets.
The most advanced type of forecast prod-uct is a scenario. This describes, for exam-ple, how the power output of a particu-lar wind farm is likely to vary over time. Scenarios have been widely used by re-searchers and practitioners to model wind power and to build advanced tools for operating and planning energy systems.
New approaches to wind economics
→ For wind power, a number of EU coun-tries leave the classic feed-in tariffs that paved the way for the cost reductions we have seen to date. One of the main rea-sons is wind’s increasing market share: wind power now has to interact better with the remainder of the power system, and should react to market signals.
The EU’s current legislative plans point towards a stronger focus on cost reduction and competition. This might be achieved by the wider use of tendering as a support

DTU International Energy Report 2014
Synthesis — Page 17
tool; tendering is currently used to deter-mine offshore support rates in France, for example. Moreover, cross-border cooper-ation as established by an EU Directive sees the light of day.
The capital costs of wind energy projects are dominated by the costs of the turbines themselves. Of the other cost components, the dominant ones are grid connection, electrical installation, and foundations. These auxiliary costs vary considerably, ranging from 20% to 30% of the total turbine costs.
For a standard onshore installation with an investment cost of 1,750 $/kW the cost ranges from approximately 7–9 US cent/kWh at sites with low to medium average wind speeds, to approximately 6–7 US cent/kWh in good coastal positions.
Energy from offshore turbines is considera-bly more expensive than that from onshore turbines. At a high-wind offshore position with a capacity factor of 50%, correspond-ing to wind conditions at the Danish Horns Reef 1 wind farm, the calculated cost of electricity is close to 12 US cent/kWh for a standard offshore installation with an investment cost of $3,900/kW.
O&M costs are increasingly attracting more attention. Manufacturers are at-tempting to lower these significantly by developing new turbine designs requir-ing fewer regular service visits and less planned downtime for maintenance.
Wind power creates jobs
→ Most forecasts agree that the wind energy market will grow with respect to installed new capacity, repowering, and O&M. The European Wind Energy As-sociation (EWEA) estimates that by 2020 there will be 520,000 jobs in the European wind energy sector and almost 800,000 jobs by 2030. The wind power industry is thus an important driver in the creation of new jobs.
Globally 834,000 people were employed in the wind industry at the end of 2013 – a rise of 11% compared to 2012. The highest growth is seen in emerging coun-tries such as China, where 365,000 people worked in the wind industry by the end of 2013 – a rise of 37% compared to 2012.
There has been a shift from jobs requiring unskilled labour to those that are highly skilled. In particular, jobs at master’s and PhD levels have grown consistently, and only unskilled job have fallen recently. Highly trained staff is scarce, however, and increasing the supply of skilled labour will require determined effort in educa-tion and research. The European wind industry is already finding it difficult to hire suitably trained staff.
Environmental and social impacts of wind energy
→ Compliance of wind farms with local and regional environmental requirements and guidelines, and social acceptance, are prerequisites if wind power is to meet its ambitious targets for growth.
To date only a limited amount of research has been done on the aesthetic impact of wind turbines on landscapes. No issue seems to be argued more strongly than that of landscape. Noise, another poten-tial problem, is partially subjective in the way it affects people’s perceived quality of life. Finally, the issue of shadow flicker requires a clear sky, a low sun, wind, and a particular wind direction in relation to the position of the sun and the observer.
Social acceptance of wind turbinesFor land-based developments, govern-ments have tended to focus their attention on overcoming the initial and obvious challenges of designing an appropriate support system, securing grid access, simplifying complicated planning pro-cedures and dealing with technical risks. But in many countries it is now becoming clear that the degree of social acceptance will determine the ultimate scale of the onshore wind industry.
Recent research in Denmark is look-ing towards new opportunities to un-derstand and improve the democratic processes linked to the construction of large wind farms and other renewable energy plants. A new Danish method of clarifying public concerns and ensuring that more views come to the fore has recently been applied.

DTU International Energy Report 2014
Page 18 — Synthesis
Recycling of wind turbines attracts greater attention
→ The end-of-life options for wind tur-bines are second-hand markets, refurbish-ing, recycling, and depositing. Blades are a major headache in the removal and recy-cling of wind turbines, and there is much uncertainty about how to get rid of them properly and safely. Electronic equipment is also a problem, since as much as 50% goes to landfill. Most life cycle assessment (LCA) and recycling studies of wind tur-bines focus on the blades, but there seems to be a need for more knowledge of how to recycle not only electronics but also other composite components like cables and hydraulic cabling.
The institutional and organisational structures relating to the dismantling and recycling of wind turbines are still quite uncertain.
Studies point out that there is a need to develop policies encouraging the recycla-bility of wind turbines, and to stimulate markets for second-hand turbines as well as the growth of independent operators.
Technologies for recycling composite materials are now available, but the in-vestment and operating costs mean that recovered glass fibres are currently more expensive than pristine ones. Commer-cial applications have therefore been very limited.
Chapter 4
Global energy perspectives with an emphasis on wind energyBy Kenneth Karlsson and Peggy Mischke, DTU Management Engineering; Asami Miketa and Nicholas Wagner, IRENA

2000 010
1,000
2,000
3,000
4,000
5,000
6,000
7,000
50,000
0
100,000
150,000
200,000
250,000
300,000
Capacity (MW) Capacity (MW)
02 03 04 05 06 07 08 09 10 11 12 20132000 01 02 03 04 05 06 07 08 09 10 11 12 2013
DTU International Energy Report 2014
Page 20 — Global energy perspectives with an emphasis on wind energy
1. Renewable energy capacity includes wind, solar PV, solar CSP, biomass, geothermal, pumped hydro, small & large hydro.
→ This chapter gives an overview of the cur-rent status of wind power globally and the growth in installed wind capacity over the
last decade. It reviews global projections of wind power growth in scenarios from various energy sys-tem models, and draws conclusions about the neces-sary conditions to scale-up wind energy in the future.
The future role of wind in the global energy mix was assessed from a number of energy modelling scenarios conducted by leading energy industry, research and international organizations. These in-clude the International Energy Agency (IEA), the In-ternational Renewable Energy Agency (IRENA), the International Institute of Applied Systems Analysis (IIASA), the Global Wind Energy Council (GWEC), Exxon Mobile and the US Department of Energy (US DoE). We compare a number of global energy scenarios involving different levels of ambition for future GHG targets to see how big a role wind power is expected to play. We then showcase estimates for the future realisable global and regional potential of wind power from IRENA’s recent renewable energy roadmap study (REmap) to 2030, which is based on inputs from a wide range of country experts and stakeholders.
Global wind power: current statusWind power installations globally have grown at around 25% a year since 2000. Wind has provided almost one third of global renewable1 power sector
capacity additions during 2001–2013 (IRENA, 2014). Global installed wind capacity at the end of 2013 was around 320 GW, including about 310 GW on-shore installations (Figure 1). Less than 2% of current global wind capacity is installed offshore (Figure 2).
The regions with most installed wind capacity today are China, the US, India and Europe. These are also the regions with the fastest growth in installed ca-pacity (Figure 3). Onshore wind installations were concentrated in China, followed by the EU and the US, whereas offshore wind installations were con-centrated in the EU, mainly in the UK, Denmark, Germany, and Belgium.
Wind power: Evaluating global projections towards 2050 To investigate what role wind energy can play at a global scale; we have reviewed the role of wind power in scenarios derived from global energy system mod-els produced by leading energy industry, research and international organisations. Their various pro-jections for wind power towards 2050 show a wide range: from a conservative 2500 TWh/y to an op-timistic 14000 TWh/y. The most progressive global wind power projections discussed here are published by Greenpeace, the Global Wind Energy Council and IRENA. The most conservative global wind power projections are presented by Exxon Mobile and the US Department of Energy. Table 1 summarises the main assumptions behind these scenarios and ranks
Figure 1 – Growth of global installed wind capacity, 2000 – 2013 (IRENA).
Figure 2 – Growth of global installed offshore wind capacity, 2000 – 2013 (IRENA).

ValueWind capacity by country
O�shore Wind capacity by country
0 91,413
Value0 3,681
DTU International Energy Report 2014
Global energy perspectives with an emphasis on wind energy — Page 21
Figure 3 – Regional distribution of total (top) and offshore (bottom) wind capacity in 2013 (IRENA).
Source: IRENA 2014, based on various sources including GWEC, Eurostat, IEA, EWEA and country submissions

DTU International Energy Report 2014
Page 22 — Global energy perspectives with an emphasis on wind energy
0
2,000
4,000
6,000
8,000
Win
d po
wer
gen
erat
ion
(TW
h)
10,000
12,000
14,000
16,000
2005 2010 2015 2020 2025 2030 2035 2040 2045 2050
Greenpeace Energy RevolutionGWEC Advanced WindIRENA REmap-EWWF 100% RenewableIIASA GEA MIX 450IIASA GEA EFF 450IEA ETP 2DIEA WEO 450ExxonMobile OutlookUS DoE high macro outlook
Figure 4 – Global wind generation up to 2050, as projected by seven different institutions (DTU).
them with regard to their ambition for the role of wind power in 2050.
The institutions and organisations referred in Table 1 often present several scenarios under different frame-work conditions and assumptions. Where there is a choice, we show the most ambitious GHG reduction scenarios with the most optimistic assumptions for wind power – a decision which underlines the pur-pose of this chapter, which is to illustrate how big a role wind power can play in the future global power system if development favours it. In order to provide a deeper understanding of an optimistic global wind power scenario, we focus more in depth on the recent IRENA renewable energy roadmap (REmap 2030) in the next paragraph.
Wind power prospects: Insights from IRENA’s renewable energy roadmap towards 2030 IRENA has developed a global renewable energy roadmap (REmap) that aims to double the share of renewables in the global energy mix by 2030. Known as REmap 2030, the roadmap was created through collaboration between IRENA, national experts within individual countries, and other stakeholders.
The IRENA REmap project shows how much wind power we can expect by 2030 with the policies that have already been implemented, and what could be achieved with new policies according to the REmap 2030 roadmap. This renewable energy roadmap is based on separate assessments from each country and region, without taking global synergies into account, and is focused on achieving a doubling of renewable energy, not necessarily a lowest cost energy pathway; however it shows that in general wind power is cost-effective when compared to con-vention generation sources.
The aspirational target for REmap 2030 derives from the United Nations Sustainable Energy for All (SE4All) initiative. REmap 2030 is a global gap analysis built on a collective study of major energy- consuming countries. For the country analysis, ex-isting national energy master plans, RE policy goals and targets were used to establish a reference case projecting the energy mix and power supply mix in 2030. Under this reference case, the share of renewables in world total final energy consumption would increase from 18% in 2010 (half of which is accounted for by traditional uses of biomass)

DTU International Energy Report 2014
Global energy perspectives with an emphasis on wind energy — Page 23
Ranking of wind power projections
Organization; Year of Study
Main scenario assumptions
most progressive Greenpeace; 2012
Greenpeace Energy Revolution scenario • goal of 100% renewable power by 2050• strong political commitment and international cooperation to keep global mean temperature rise below 2°C and a carbon price of $75 /tonne• hybrid/electric cars will predominate in 2050 and nuclear energy will be phased out
Global Wind Energy Council (GWEC); 2013
Advanced Wind Scenario of the Global Wind Energy Outlook• electricity demand is based on the IEA’s World Energy Outlook and projected to increase from 15000 TWh in 2005 to 29,000 TWh in 2030• current international renewable energy and CO² targets will be met• most ambitious vision to develop the full potential of global wind turbine manufacturing
International Renewable Energy Agency (IRENA); 2014
REmap-E (electrification) Case• based on SE4ALL targets, country based renewable and efficiency targets, including doubling of the global renewable energy share by 2030• increased electrification in energy end-use would create additional demand that would be met by mainly wind power• wind capacity would increase to 2050 GW by 2030, with total production of 5600 TWh/y. The normal REmap case envisions less
electrification, resulting in 1600 GW of wind capacity.
World Wildlife Fund (WWF); 2011
100% Renewable scenario • goal of 100% renewable energy by 2050• final energy consumption will peak in 2020 and then decrease to 261.4 EJ in 2050, down from 327.7 EJ in 2010• electrification in various sectors; in industry, the share of renewables will increase from 8% in 2010 to 79% in 2050;
new buildings will be near-zero-energy by 2030; modal shift from fuel to electricity in the transport sector
International Institute of Applied Systems Analysis (IIASA); 2012
MIX 450 ppm scenario of the Global Energy Assessment • scenario analysis with the bottom-up, technology-rich global MESSAGE integrated assessment model • critical social and environmental goals are met, such as stabilising global mean temperature rise at 2°C, enhancing energy security
through diversification of the energy supply, and attaining universal access to modern energy services by 2030• primary energy demand is expected to reach 700 EJ in 2050, up from 490 EJ in 2005• renewables will represent approximately 75% of primary energy by 2050• Mix pathway emphasising regional diversity at an intermediate level combined with advanced transport technologies
International Energy Agency; 2012
2 degree scenario of the Energy Technology Perspectives 2012• scenario analysis with a bottom-up, technology-rich global TIMES optimisation model • deployment of a low-carbon energy system, 80% chance of limiting global mean temperature rise to 2°C
(consistent with IEA WEO 450 scenario)• global primary energy demand will increase by 37% between 2009 and 2050• oil is partially replaced by a portfolio of three alternative fuels: electricity, hydrogen and biofuels
International Energy Agency; 2013
450 ppm CO²-eq scenario of the World Energy Outlook• based on the IEA's World Energy Model, which replicates the dynamics of energy markets using historical data on economic and
energy variables to generate projections • global primary energy demand will increase by 35% between 2010 and 2035• 80% chance of limiting mean global temperature increase to 2°C
International Institute of Applied Systems Analysis (IIASA); 2012
EFF 450 ppm scenario of the Global Energy Assessment • scenario analysis with the bottom-up, technology-rich global MESSAGE integrated assessment model • critical social and environmental goals are met, such as stabilising global mean temperature rise at 2°C, enhancing energy security
through diversification of the energy supply, and attaining universal access to modern energy services by 2030• primary energy demand is expected to reach 700 EJ in 2050, up from 490 EJ in 2005• renewables will represent approximately 75% of primary energy by 2050• efficiency pathway emphasising demand side and efficiency improvements combined with advanced transport technologies
ExxonMobil; 2014
Global Energy Outlook• scenario analysis based on Exxon Mobil Corporation’s internal estimates of energy demand, supply, and trends through 2040,
plus external sources including the IEA • global demand for energy is projected to rise by about 35% from 2010 to 2040• energy intensity will decrease by almost 45%; the share of fossil fuels in world energy demand will remain at nearly 78%
most conservative
US Department of Energy (US DoE); 2013
High macro scenario of the International Energy Outlook• projections are generated from the EIA’s World Energy Projection Plus (WEPS+) model • high macro-economic growth globally: 3.4% annually on average from 2008 to 2035• world total energy consumption will increase by 53% from 2008 to 2035• energy intensity will decline by just under 40% from the 2008 level; the price of oil is $125 per barrel in 2035; electricity generation
will increase by nearly 84%
Table 1 – Global wind energy scenarios from different leading energy institutions – ranking with respect to wind power projections (DTU).

Denmark
United Kingdom
Germany
Australia
Morocco
USA
Ukraine
France
China
Italy
Turkey
India
Japan
Mexico
Canada
Brazil
Ecuador
South Africa
South Korea
Saudi Arabia
Russia
Nigeria
UAE
Malaysia
Indonesia
0% 10% 20% 30% 40% 50% 60% 70% 80%
DTU International Energy Report 2014
Page 24 — Global energy perspectives with an emphasis on wind energy
Wind energy by country in 2030 (installed capacity and generation) as a percentage of total electricity generation, for the reference case (Ref) and for REmap 2030 case (IRENA).
REmap % Generation REmap % Capacity
Ref % Generation Ref % Capacity
Figure 5 – Wind energy by country in 2030.
2011 2012 201340,495 MW
7.2% 12.8% 17.5%
43,134 MW 37,478 MW

DTU International Energy Report 2014
Global energy perspectives with an emphasis on wind energy — Page 25
to 21% in 2030. Government-nominated country experts (REmap experts) and IRENA subject experts then identified additional technology options for deploying renewable energy beyond the reference case, and assessed their cost implications.
REmap explore ddifferent renewable energy de-ployment options with varying level of ambitions, leading to higher shares than the reference case. Up to 36% of renewable energy, measured in terms of the share in total final energy consumption (TFEC) is projected for 2030 when renewable energy de-ployment is combined with universal energy access and improved energy efficiency. Under the REmap case, the potential to deploy an additional 660 GW of wind capacity above the reference case was iden-tified, producing 4400 TWh/y from 1630 GW of total capacity by 2030. Wind energy becomes the fourth-largest source of power after coal, natural gas and hydro, and the third-largest renewable en-ergy source (if viewed in final energy terms, which include the share of renewables in the electricity consumption in the end-use sectors) in 2030 after biomass and hydro power. REmap also explored another deployment option in which increased electrification in energy end-use would create ad-ditional demand that would be met by renewable power, mainly wind power. This “REmap-E” case would increase wind capacity to 2050 GW, with total production of 5600 TWh/y by 2030. The study shows that the country with the largest expected share of wind energy in its power system in 2030 is Denmark (with over 60% of its electricity from wind), followed by Germany and the UK (40–50%). Further down the league are Australia, France and the US (20%), and then a group that includes China (15–20%).
Conclusion: Enabling conditions for scaling-up global wind powerThe future role of wind power on a global scale is set to increase further. The level of ambition towards wind electricity generation depends however on many factors and projections from the discussed studies vary considerably. The most optimistic
studies for wind energy are based on a strong po-litical commitment for a future low-carbon energy system and assume a global energy transition to-wards keeping global mean temperature rise below 2°C by 2050.
Progressive wind energy projections assume an installed wind capacity of up to 5000 GW in 2050. This assumes that about 4600 GW wind instal-lations (more than 14 times of the current level) would need to be manufactured, installed and grid-connected globally. Such an expansion of global wind capacity would mean that the wind turbine manufacturing industry would have to be able to build and install about 100 GW/year in 2020, and 200–250 GW/year from 2030 onwards when assuming a 20-year turbine life. The geographical patterns of onshore and offshore wind deployment are projected to diversify, based on country-specific conditions. Considerable additional investments in wind power are needed to implement any am-bitious renewable energy scenario. Reaching the wind capacities identified in REmap 2030 would for example require annual investments of $314 billion/y for onshore wind and $47 billion/y for offshore wind.
In summary we identify the following enabling key factors to scale-up wind energy in the future:
• Flexible electricity demand and transition to electricity-based energy systems, for example by increased electrification of the transport sector
• power systems, that are able to handle increas-ingly higher shares of intermittent power pro-duction, such as shown in Denmark
• progressive cost reduction of wind power tech-nologies
• continuous high investments in wind energy, that allow manufacturing and installation of about 100 GW/year globally

Chapter 5
Danish and European plans for wind energy deploymentBy Peter Hjuler Jensen and Søren Knudsen, DTU Wind Energy; Poul Erik Morthorst, DTU Management Engineering

DTU International Energy Report 2014
Danish and European plans for wind energy deployment — Page 27
→ The technology pillar of the European Energy Policy is the European Strategic Energy Technology Plan (SET-Plan). The
SET-Plan is a strategic plan to accelerate the devel-opment and deployment of cost-effective low-carbon technologies.
The implication for wind energy technology is clear: wind energy – offshore and onshore – must be affordable and competitive.
In this chapter we outline European policies di-rected towards the ambitious target of large-scale use of wind energy in the European electricity supply system, and the scenarios that foresee up to 34% of Europe’s electricity coming from wind by 2030. First, however, we address Danish energy policy and strategy in the context of wider Euro-pean plans.
Danish energy policy and strategy up to 2050Denmark has a long-term vision for an energy sys-tem independent of fossil fuels: by 2035 the Danish heat and power sector should rely only on renewable sources, and the total energy system, including trans-port and industry, should be totally decarbonised before 2050. An important milestone on the way is for wind power to supply 50% of Danish power con-sumption by 2020. To reach this short-term goal the Danish parliament has agreed on a significant increase in wind power up to 2020, including 1,000 MW of off-shore turbines, 500 MW of near-shore turbines, and a net increase of 500 MW in onshore wind capacity after accounting for the decommissioning of old turbines.
An energy system independent of fossil fuels is a demanding challenge, requiring an effective and cost-efficient transition from the existing energy system to one that is radically different. A new supply structure based on intermittent energy resources such as wind power will require a much more flexi-ble system, including a strong network of intercon-nectors to neighbouring countries, fast-responding backup and storage facilities for power and gas, and flexibility in the way consumers through demand side management use energy. Where the latter is concerned, heat pumps could be an important link between the power and heating sectors, while electric
vehicles – if introduced intelligently – could greatly benefit not only transport but also the power system, by facilitating the integration of variable renewable energy sources. Denmark already has well-developed energy connections to Germany, Norway and Sweden; recent proposals include new transmission lines to the UK and the Netherlands.
European plans for renewables in the energy supply systemThe EU member states have long-term targets in four different areas of energy policy:
1. A binding agreement to reduce greenhouse gases by 2020 by 20% compared to 1990.
2. A mandatory target for renewable energy sources: by 2020, 20% of the EU’s final energy demand has to be supplied by renewable tech-nologies such as wind, solar and biomass.
3. A voluntary agreement on energy efficiency, with the objective of cutting EU energy con-sumption by 20% by 2020 compared to a refer-ence projection.
4. A target of 10% renewable energy, including bio-fuels, in transport by 2020.
These targets will be achieved through the use of renewable energy sources that include wind, solar, hydro, tidal, geothermal energy and biomass. The aims include cutting greenhouse emissions and be-coming less dependent on imported energy, while encouraging technological innovation in industry and creating European jobs in the renewable energy industries.
Figure 6 presents the renewable energy targets of the EU27 member states for 2020 against their 2005 penetration level into the energy mix. This infor-mation is extracted from the National Renewable Action Plans for 2020.
European SET-Plan for the strategic development of energyOne of the major challenges in Europe is that the 28 members of the European market to a large extent

DTU International Energy Report 2014
Page 28 — Danish and European plans for wind energy deployment
National renewable energy targets as percentages of final energy consumption.
Share 2005
Target 2020
Figure 6 – National renewable energy targets as percentages of final energy consumption.
40% 50%
Denmark17% 30%
Sweden39% 50%
Finland29% 38%
Ireland3% 16%
Netherlands2% 14%Netherlands2% 14%
Belgium2% 13%Belgium2% 13%
Germany6% 18%Germany6% 18%
Italy5% 17%Italy5% 17%
Austria23% 34%
Austria23% 34%
Slovenia16% 25%Slovenia16% 25%
Czech Rep.6% 13%Czech Rep.6% 13%
Hungary4% 13%Hungary4% 13%
Slovakia7% 14%Slovakia7% 14%
Romania18% 24%
Romania18% 24%
Poland7% 15%
Poland7% 15%
Lithuania15% 23%Lithuania15% 23%
Latvia35% 42%Latvia35% 42%
Estonia18% 25%
Estonia18% 25%
Bulgaria10% 16%
Bulgaria10% 16%
Greece7% 18%Greece7% 18%
Cyprus3% 13%
Cyprus3% 13%
UK1% 15%UK1% 15%
Malta0% 10%Malta0% 10%
Luxemb.1% 11%Luxemb.1% 11%
France10% 23%
France10% 23%
Portugal21% 31%
Portugal21% 31%
Spain9% 20%
Spain9% 20%
40%50%
Denmark17% 30%
Sweden39% 50%
Finland29% 38%
Ireland3% 16%
Netherlands2% 14%Netherlands2% 14%
Belgium2% 13%Belgium2% 13%
Germany6% 18%Germany6% 18%
Italy5% 17%Italy5% 17%
Austria23% 34%
Austria23% 34%
Slovenia16% 25%Slovenia16% 25%
Czech Rep.6% 13%Czech Rep.6% 13%
Hungary4% 13%Hungary4% 13%
Slovakia7% 14%Slovakia7% 14%
Romania18% 24%
Romania18% 24%
Poland7% 15%
Poland7% 15%
Lithuania15% 23%Lithuania15% 23%
Latvia35% 42%Latvia35% 42%
Estonia18% 25%
Estonia18% 25%
Bulgaria10% 16%
Bulgaria10% 16%
Greece7% 18%Greece7% 18%
Cyprus3% 13%
Cyprus3% 13%
UK1% 15%UK1% 15%
Malta0% 10%Malta0% 10%
Luxemb.1% 11%Luxemb.1% 11%
France10% 23%
France10% 23%
Portugal21% 31%
Portugal21% 31%
Spain9% 20%
Spain9% 20%

DTU International Energy Report 2014
Danish and European plans for wind energy deployment — Page 29
have individual policies for energy, employment, climate and trade.
Through the SET-Plan the European Commission has therefore tried to establish an energy technology policy for the EU as a whole. This strategic plan aims to accelerate the development and deployment of cost-effective low-carbon technologies. The SET-Plan includes measures relating to planning, implemen-tation, resources, and international cooperation in energy technology.
Through the SET-Plan, the European Commission both formulates research policies and strategies for the European research area, and also tries to har-monise the research policies and strategies of the member countries by encouraging them to accept a Europe-wide energy strategy.
Two of the most important instruments in the im-plementation of the SET-Plan are the 2020 R&D pro-gramme and the European Wind Initiatives (EWI) strategies set out through the Wind Energy Technol-ogy Platform (TP-Wind) and the European Energy Research Alliance (EERA). The EWI strategies and the Strategic Research Agenda (SRA) serve as input to the Commission and the member states in their development of the 2020 European Energy Research Programmes.
European Wind Energy Technology PlatformIn 2006 the European wind energy sector launched the European Wind Energy Technology Platform (TP-Wind). As with other Technology Platforms in Europe, TP-Wind is supported financially by the European Commission. TP-Wind is composed of stakeholders from industry, government, civil society, R&D institutions, finance organisations and the wider power sector, at both member state and EU levels. It is the body with Europe’s broadest representation of both the wind power industry and
The primary objective is to work towards the more efficient and large-scale use of wind energy globally, with special focus on a high penetration of wind energy in the European energy supply system, by reducing the social, environmental and techno-logical costs of wind energy. TP-Wind published
its first Strategic Research Agenda (SRA) in 2008, followed by a revision in 2014. On the basis of the first SRA the European Commission published a Wind Energy Technology Road Map for the Eu-ropean research and demonstration programmes. TP-Wind is also responsible for the European Wind Initiatives (EWI), which are recommendations for the Commission’s 2–3 year R&D Framework pro-grammes, of which the latest is the 2020 RD&D programme.
The Commission uses the SRA and EWI reports as background, together with input from the member states, when formulating its European RD&D pro-gramme calls.
TP-Wind sees wind energy as the leading renewable energy technology. Given the right support, TP-Wind expects that wind energy could provide up to 34% of EU electricity by 2030. However, this target will not be achieved if the sector and policy makers think only in the short term. Long-term, strategic action in technology and policy research is fun-damental; TP-Wind facilitates the development of effective, complementary national and EU policy to build markets, as well as a collaborative strategy for technology development. Its aim is to achieve cost reductions that will ensure the full competitiveness of wind power, both onshore and offshore.
TP-Wind has developed very consistent SRA and EWI reports that the EU uses as the voice represent-ing the wind industry and the research community. These are also used in the member states as reference documents in the national wind energy research programmes. The EWI operates alongside the EERA programme presented in the next section.
EERA Joint Programme on Wind EnergyThe European Energy Research Alliance (EERA) is an instrument of the SET-Plan. It represents public research, and was established by leading European public research organisations including DTU. EERA focuses on medium- to long-term research, and complements the European Industrial Initiatives (EIIs) that fulfil a similar function for industrial R&D. EERA aims to strengthen, expand and optimise EU energy research capabilities through the sharing of

DTU International Energy Report 2014
Page 30 — Danish and European plans for wind energy deployment
world-class national facilities in Europe and the joint realisation of pan-European research programmes (EERA Joint Programmes). The primary focus of EERA is to accelerate the development of energy tech-nologies to the point where they can be embedded in industry-driven research. To achieve this, EERA streamlines and coordinates national and European energy R&D programmes.
The objective of the EERA Joint Programme on Wind Energy (JP Wind) is to plan and carry out excellent medium- to long-term research to support the Tech-nology Roadmap’s activities on wind energy (the EWI), including topics that influence the use and deployment of wind energy. The Joint Programme is formulated as a joint research programme under a number of strategic research themes, each with goals and planned activities. The participants have agreed on the basic structure for a common research pro-gramme in wind energy, and carry out their activities so as to make best use of competences, research facilities and other resources available within the partnership. The research programme is strategi-cally directed towards the scientific challenges that follow from the SET-Plan and the RES Directive: large-scale integration of wind power and acceler-ated deployment of offshore wind, including very large offshore wind turbines. JP Wind comprises six sub-programmes: Wind Conditions, Aerodynamics, Structures and Materials, Grid Integration, Offshore Wind Energy, and Research Facilities. An additional sub-programme on Wind Energy Economics is un-der development.
The aim of JP Wind is to foster better coordination and ultimately integration of European research activities in wind energy research, with the aim of accelerating the transition towards a low-carbon economy, and maintaining and increasing European competitiveness. Through its coordinating effect on the research communities, the Joint Programme should benefit future as well as current decisions on the setting of research priorities. JP Wind also aims to integrate its various capacities and resources – available through the joint research activities car-ried out among its partners – with other ongoing European and national projects.
Progress in implementing the European Wind Energy Research AreaThe vision of the development of the European Research Area (ERA) is a tremendous challenge. A central element has been the introduction of new instruments and mechanisms to stimulate joint pro-gramming between national and European research. The SET-Plan is the framework for the technology development pillar of the European Energy Policy.
The SET-Plan introduced two new R&D instruments. The first of these is the European Industrial Initia-tives, which have a short- to medium-term focus on demonstration and research, and operate through public-private partnerships in seven different tech-nology domains, including wind. The second is the European Energy Research Alliance (EERA) and its joint programmes.
Danish wind energy research has played a proactive role in the European arena for several years. A stra-tegic, partnership approach to international coop-eration is essential to ensure critical mass, develop synergies and ensure continuing “smart specialisa-tion” in research competences. This is essential if Denmark’s wind energy knowledge is to match the needs of the global wind industry and so to play its part in future markets. These partnerships and alliances have become increasingly important to the wind energy innovation chain both in Denmark and internationally.
Increased globalisation has accentuated the need to find new ways of collaborating, often in networks, wherever long-term effort is required. In the past, collaboration took place on an ad-hoc basis, from project to project. As mentioned above, however, a shift towards more strategic long-term collabo-ration based on an agreed programme is essential. The Commission is accordingly focusing more and more on such collaboration, including clear links between projects with national funding and those at European level.
The most recent example of this is the recently started IRPWIND project. With co-funding from the EU, IRPWIND will help the EERA JP Wind partners move

DTU International Energy Report 2014
Danish and European plans for wind energy deployment — Page 31
from a collaboration model based on ad-hoc project participation to a joint strategy and work plan. In short, IRPWIND should accelerate collaboration from its current voluntary status to create an integrated European programme for wind energy research.
Danish wind energy researchers, companies and the energy sector at large have all benefited from the global knowledge base in the past. The next steps – taking advantage of the internationalisation of wind energy research and innovation, and creating R&D collaborations with better coherence and direction
– require a clear strategy for internationalisation from Danish ministries and funding authorities. This is clear from the requirements of joint programming mechanisms including the EIIs and EERA.
Organisations performing research in wind energy must be active in influencing the development of research strategies for wind energy, since national authorities and the European Commission cannot handle this challenge by themselves. This calls for an international, proactive and strategic approach from universities.

Chapter 6
Wind energy technology developmentsBy Peter Hauge Madsen and Morten Hartvig Hansen, DTU Wind Energy; Niels Leergaard Pedersen, DTU Mechanical Engineering

DTU International Energy Report 2014
Wind energy technology developments — Page 33
→ This chapter describes the present main-stream development of the wind turbine technology at present. The turbine tech-
nology development trend is characterized by up-scaling to turbines with larger capacity for both onshore and offshore applications, larger rotors and new drivetrain solution, including the direct-drive solution without gearbox. The technology solutions are strongly influenced by the development of the international industry with a global market for com-ponents and a trend towards a “shared” develop-ment effort in collaboration between the OEM’s and component sub-suppliers. Wind turbine blades and towers are very large series-produced components, which costs and quality are strongly dependent on the manufacturing methods. The industrial wind energy sector is well developed in Denmark, and the competitive advantage of the Danish sector and the potential for job creation will be discussed. Finally, the ongoing development of standards and certification of technology and wind turbine plants will be described.
Global developmentIn spite of the slow-down of the global market de-velopment recent years have seen a renewed effort in the technological development of wind turbine technology. This effort is driven by a stronger global competition within the wind energy sector as well as the competing energy technologies. This com-petition provides a pull for lower cost-of-energy, the need for larger and more reliable wind turbines for offshore applications and an increased interest in development of sites with low or moderate wind regimes. Thus the main-stream turbine technology development trend is characterized by up-scaling to turbines with larger rated capacity for both onshore and offshore applications, larger rotors for higher ca-pacity factors and new drivetrain solution, including the direct-drive solution without a gearbox.
While the global annual new installed capacity was slightly reduced in 2013 to 36 GW (comparable to the installation rates in 2008–2009) reaching a total of 321 GW [1], the trend towards larger wind turbines continued with the average rated capacity of wind turbines reaching 1.926 MW in 2013. The slow-down of the installation world-wide was due to very large
declines in new installations in 2013 in USA and Spain, while Europe showed a minor decline. The Asian market picked up, led by China, which again in 2013 became the world’s largest market. The off-shore market has continued to grow with 1.7 GW installed in 2013 reaching a total of 6.8 GW. The offshore market is primarily in Northern Europe, only 5 % of the installed capacity is installed outside Europe (in Asia).
However, in spite of the industry becoming more and more international, the market diversification grows with turbines designed for different markets and applications, e.g. for low wind areas, cold climate, high altitudes or offshore. Hence, the average size of wind turbines installed in Denmark in 2013 was 3.326 MW, while turbines in India were in average 1.336 MW. The average size of turbines in USA and China was 1.719 MW and 1.841 MW, respectively, while the average size of installed wind turbines in Europe exceeded 2 MW.
Most of the installation in Denmark was offshore, which favours large wind turbines. The average rated capacity of wind turbines installed offshore in 2013 was 3.612 MW. At present there are 9 suppliers of wind turbines larger than 3 MW (6 European and 3 Chinese).
Even larger wind turbines are available or will be-come available in 2014, the largest of which is the 8 MW Vestas V164 with the prototype installed in Denmark early 2014.
In terms of market share, the trend towards larger wind turbines is very clear with the 2MW size range being the dominant for onshore application and a strong development of the multi-MW size range. The market share for various size ranges is shown in Table 2.
Other technology trends in addition to the up-scal-ing are the appearance of wind turbine versions with taller towers and longer blades for better per-formance in low wind regimes, e.g. for IEC classes II and III sites with annual average wind speeds of 8.5 m/s and 7.5 m/s in hub height, and increased use of direct drivetrain solutions, which in 2013

2011 2012 201340,495 MW
7.2% 12.8% 17.5%
43,134 MW 37,478 MW
DTU International Energy Report 2014
Page 34 — Wind energy technology developments
accounted for 28.1 % of the installed capacity. These technology trends will be further discussed in the following section.
Technology TrendsThe reduction of the cost-of-energy is the primary driver in the development for making wind energy commercially competitive to other energy sources. Innovative technical solutions for wind turbine de-sign such as new rotor design philosophies and driv-etrain concepts have been developed to bring down the turbine cost. Large volume manufacturing and installation costs are reduced by specialized tools such as robot assisted blade layup and vessels for fast and robust offshore installation. The operation costs are reduced by optimized maintenance programs based on new health monitoring systems. The shares of turbine costs, installation costs, infrastructure costs, and operation costs in the levelized cost-of-energy depend on the project type: the turbine cost is typically more than half for onshore but less than half for offshore projects. The high installation and infrastructure costs offshore explain the favouring of larger offshore turbines.
A secondary driver in the development of compet-itive wind energy is the increased security of wind energy production to enable a higher penetration on the grid. Increased capacity factors2 of wind turbines and higher controllability of wind farms are some of the current trends that focus on this objective.
Figure 7 shows rated power plotted versus rotor diam-eter of existing onshore and offshore wind turbines in the left plot and their capacity factors plotted versus rated power per rotor area in the right plot. Turbines with low rated power and large rotor diameters will have high capacity factors, while turbines with high rated power and relatively small rotor diameter will have low capacity factors. The three offshore 6.5 MW turbines with rotor diameters of 92 m, 100 m, and 109 m have the lowest capacity factors of about 14%, 16%, and 19%. The turbine with the highest capacity factor of about 47% is an onshore turbine with rated power of 1.5 MW and rotor diameter of 108 m. Note that the ca-pacity factors are here computed assuming an optimal power coefficient of 45%, a Rayleigh wind distribution with 7 m/s as average speed, and cut-in at 5 m/s and cut-out at 25 m/s. These assumptions are of course not representative for all turbines and sites; however, the site-dependent average speed has the largest influence on the capacity factors, thus Figure 7 can be used to compare the effect of changing rated power and rotor diameter on this competition parameter.
Hence, turbines with low rated power and large rotor diameters have high capacity factors, but they may not be more cost-efficient unless they are based on new advanced technologies. With conventional rotor design based on up-scaling, the blade mass and therefore the material and manufacturing costs for the rotor will increase with the power of three with the blade length, while the energy produc-tion will increase with the power of two. Figure 8 shows blade mass versus length for existing glass and carbon fiber blades. The purple curve shows the conventional cubic up-scaling of a 40 m glass fiber blade, whereas the red and blue curves show power law trend lines for the glass and carbon fiber blades, respectively. The exponent for the glass fiber blades is significantly lower than three, whereas the trend for the carbon fiber blades is less clear due to the low number of data points. The blade mass
Year 2011 2012 2013
Total MW supplied 40,495 43,134 37,478
Size range % of total MW supplied
<750 kW 0.6 % 0.1 % 0.1 %
750-1499 kW 6.6 % 3.5 % 2.8 %
1500-2500 85.7 % 83.5 % 79.6 %
>2500 kW 7.2 % 12.8 % 17.5 %
Table 2 – Wind turbine size classes by market share 2011–2013.
World Market Update 2013, March 2014, Navigant Research [1].
2. The capacity factor is the expected energy production over a given period normalized by the energy that could be produced when operating constantly at rated power over the same period. For a wind turbine, this factor is highly dependent on the wind speed distribution used for calculating the expected energy production.
2011 2012 201340,495 MW
7.2% 12.8% 17.5%
43,134 MW 37,478 MW

0
2
4
6
8
10
60 80 100 120Rotor diameter [m]
Rat
ed p
ower
[MW
]
140 160 18010
15
20
25
30
35
40
45
50
0 0.2 0.4 0.6 0.8 1(Rated power)/(Rotor area) [kW/m2]
Capa
city
fac
tor [
%]
0
2
4
6
8
10
60 80 100 120Rotor diameter [m]
Rat
ed p
ower
[MW
]
140 160 18010
15
20
25
30
35
40
45
50
0 0.2 0.4 0.6 0.8 1(Rated power)/(Rotor area) [kW/m2]
Capa
city
fac
tor [
%]
Glass exponent 2.13
Carbon exponent 2.95
0
5
10
15
20
25
30
35
40
45
50
35 45 55 65 75 85
Bla
de m
ass
[ton
]
Blade length [m]
Glass �ber
Carbon �ber Cubic upscaling of 40 blade
DTU International Energy Report 2014
Wind energy technology developments — Page 35
Rated power versus rotor diameter of existing onshore and offshore wind turbines (left plot) and their capacity factor versus rated power per rotor area (right plot).
onshore turbines offshore turbines
Capacity factors are computed assuming an optimal power coefficient of 45%, a Rayleigh wind distribution with 7 m/s as average speed, and cut-in at 5 m/s and cut-out at 25 m/s.
Data based on WMU 2013 [1].
trends for modern glass fiber blades have only been possible through the development of new rotor de-sign philosophies.
A key element in the new rotor design philosophy is the use of new high lift and relative thicker airfoils that allows for the design of more slender rotor blades, as illustrated in Figure 9. The power pro-ducing lift force is proportional to the blade width, also called the chord length of the airfoils, and the lift coefficient. If the lift coefficient is increased by design new airfoils or adding vortex generators to
existing airfoils for delayed flow separation (stall), then the chord length can reduced by the same fraction without compromising the total lift force. The absolute thickness of the blade must however remain the same to be able to carry the same lift force, thus these new airfoils must have a higher relative thickness.
Blade masses can be further reduced if new load reduction technologies are built into the blade itself by a sweep of the blade shape and/or by advanced layups of the fiber laminates in the blade. These
Wind turbine blade mass versus blade length of existing glass and carbon fiber blades. Based on data from [2] extended with the Siemens 75 m blade at 25 ton.
Figure 7 – Rated power versus rotor diameter.
Figure 8 – Wind turbine blade mass versus blade length.

2.0 traditionalhigh-lift1.5
1.0
0.5
0.0
2015105Angle of attack [deg.]
Lift
coe
�ci
ent
[ +]
0-5
-0.5
-1.0
DTU International Energy Report 2014
Page 36 — Wind energy technology developments
Figure 9 – llustration of a key element in the new rotor design philosophy.
Illustration of a key element in the new rotor design philosophy: the design and use of new high lift and relatively thicker airfoils allow for the design of more slender rotor blades because the shorter airfoil chords along the blade (reduced blade width) can be compensated by the higher lift coefficient.
advanced design concepts can create a passive struc-tural coupling between bending and twisting of the blade such that sudden increases in lift forces on the blade during a wind gust will be alleviated by the reduced angle of attack resulting from the twisting when the blade is bend under the increased loading.
Figure 10 illustrates the final result of the last thirty years of research and development in rotor design; the top blade is the Siemens B55 blade which in-cludes load reducing bend-twist couplings and high lift airfoils, whereas the bottom blade is an equally scaled version of a 30 year old blade designed with a linearly chord variation and old airfoils designed for glider aircrafts. Note that the Siemens 75 m blade with the mass of 25 ton which lays more than 5% be-low the state-of-the-art blade mass trend in Figure 8 is designed after the same principles as the B55 blade. This further decrease in blade mass is mainly due to the load reduction obtained by the advanced bend-twist couplings in these cutting-edge blades.
The trend of higher capacity factors of commercial turbines is also related to these new rotor design philosophies because lighter rotors with built-in load alleviating properties allow for replacing smaller and heavier rotors on existing turbine platforms with a larger rotor of equivalent weight and load contri-butions. Assuming that the manufacturing costs of
the blades and the loads transferred from the rotor to the remaining structure are similar for the new rotor of similar mass, the cost-of-energy based only on the turbine cost is reduced proportionally to the rotor area increase.
New drivetrain concepts represent another signifi-cant trend in the turbine technology development that aims towards lowering the turbine costs. New drivetrain concepts represent another significant trend in the turbine technology development that aims towards lowering the turbine costs. The pre-dominant drivetrain design has for some years been with a three-stage gearbox and a double-fed induc-tion generator (DFIG). This concept provides variable speed operation and can with the latest develop-ments meet grid requirements. In this concept only the rotor circuit is connected via a power converter and hence approximately one-third of the generator power passes through the converter with obvious cost advantages. The drawback compared to passing the full power output through a power converter is a more limited speed range and fewer options for regulation of the power output and provision of ancillary services from the turbine to the grid.
The primary competitor is the direct drive (DD) concept, which avoids the gearbox and transforms the main shaft torque directly to electric power by

DTU International Energy Report 2014
Wind energy technology developments — Page 37
Figure 10 – Thirty years of technology development.
Thirty years of technology development: State-of-the-art Siemens B55 blade (top) that includes load reducing bend-twist couplings and high lift airfoils versus a blade designed 30 years ago (bottom) up-scaled to the same length.
(with courtesy of Siemens Wind Power A/S)
a multi-pole generator with permanent magnets as is the case with the Siemens DD wind turbines or with wound magnets as used by Enercon. The main advantage of the DD concept is a mechanically much simpler drivetrain requiring less maintenance and with expected higher reliability. This reliability is advantageous especially for offshore wind turbine due to the high cost of access and repair. The DD concept is increasingly being used and present in 28.1% of all new capacity in 2013 [1].
Other drivetrain concept are being used, e.g. hybrid drivetrains combining one or two-stage gears with a multi-pole (permanent magnet) generator or hy-draulic drives, where a hydraulic pumps, accumula-tors and motors replace the gearbox and the power converter. Mitsubishi Heavy Industry currently has a 6 MW prototype of this concept. A fairly recent summary of current drivetrain options can be found in e.g. [8] or [9].
Manufacturing trendsWith the up-scaling of the wind turbines there is an increased need for test facilities which for the largest wind turbines are rather large and also very expensive. This makes a push toward further de-velopments in numerical simulation tools for the drivetrain that can facilitate a better understanding of the load situation of the involved components.
For these numerical tools to give reliable results the loads on the structure are needed and specifically also their variation in time. Having reliable load data the numerical tools can be used to estimate the fatigue life of e.g. the bearings or the gear-box.
With the need for larger, lighter and stronger struc-tures there is also an increase focus on the material design, keeping in mind that the wind turbine must be able to withstand the environment at the specific installation sight.
With the increase in size the number of sub- suppliers in the supply chain, capable of delivering the needed components, e.g. bearings, is also drastically reduced. It is highly important that steady and trusted supplies of high level components with competitive prices are available.
Competitive advantage and job creationAccording to World Market Update [1] the turbines installed in the world in 2013 were supplied by 62 OEM’s, of which 42 companies were from Asia, 18 from Europe and two were from North America. The top ten suppliers of wind turbines are listed in Table 3.
Contrary to what was expected a few years ago, the market has not consolidated with a few large

0
200
400
600
800
1,000
1,200
1,400
1,600
2003 04 05 06 07 08 09 10 11 2012
Kina USA Storbritannien Tyskland Danmark
DTU International Energy Report 2014
Page 38 — Wind energy technology developments
suppliers. The top-ten supplies 69.5 % of the market, and adding the delivery of turbines from the next five largest suppliers, all from China, provides an additional 13.4 % of the market.
Of any single country, China leads on the supply side. However, the Chinese manufacturers supply almost exclusively to the domestic market, and only Goldwind and Mingyang supply outside their home market, to one and four other countries, respectively [1]. This isolation is in contrast to the European
companies and GE on the top-10 list, which typi-cally are active on 15 markets with Vestas being in the lead on 27 markets. Being presence on many markets clearly creates robustness and is a strength.
One should be careful not to interpret the Chinese companies focus on the home market as lack of technology for the world market. Goldwind has manufactured direct-drive turbines for almost a decade, and a 6 MW turbine is under testing. United Power installed its 6 MW wind turbine in 2012 and Mingyang has a 2-bladed 6 MW turbine under testing. However, European and US industry has a stronger knowledge and experience basis. Much of the Chinese wind turbines are based on European technology, initially through licenses but now more through cooperation with European de-sign companies, by acquisition, or by setting up R&D departments.
That China as a country intends to be in the lead, not only in manufacturing, but also in the design and the know-how and -why is illustrated by the immense development of the scientific effort in China on wind energy. Figure 11 shows the development of scientific wind energy papers from the five most publishing countries in the world from a bibliometric analysis by Damvad in 2014 [5].
Most forecasts agree that the wind energy market will grow, both with respect to installed new capac-ity, repowering, and operation and maintenance. EWEA estimates in [6] that by 2020 there should be 520,000 jobs in the European wind energy sector and almost 800,000 jobs by 2030. The sector created 30% more jobs from 2007 to 2010 to reach nearly 240,000, while the EU unemployment simultane-ously rose by 9.6%. The trend is also that the manufacturing jobs follow the market and hence will grow the most in devel-oping markets. For a country like Denmark, which hosts two suppliers on the top-ten list (Vestas and Siemens), job creation is closely tied to the devel-opment of the offshore wind market in Northern Europe and to technology development. The num-ber of jobs has been fairly constant during the last five years at approximately 28,000. However, there
Figure 11 – Number of scientific publications from the five most publishing countries 2003–2012 [5].
Accu. MW 2012
Supplied MW 2013
Share 2013
Accu. MW 2013
Share accu.
Vestas (DK) 56,780 4,893 13.1 % 61,673 18.9 %
Goldwind (CN) 15,452 4,112 11.0 % 19,564 6.0 %
Enercon (DE) 29,370 3,687 9.8 % 33,057 10.1 %
Siemens (DK) 20,192 2,776 7.4 % 22,968 7.0 %
GE Wind (US) 37,108 2,458 6.6 % 39,566 12.1 %
Gamesa (ES) 27,745 2,069 5.5 % 29,814 9.1 %
Suzlon Group (IN) 23,582 1,995 5.3 % 25,577 7.8 %
United Power (CN) 7,323 1,488 4.0 % 8,811 2.7 %
Mingyang (CN) 4,159 1,297 3.5 % 5,456 1.7 %
Nordex (DE) 8,884 1,254 3.3 % 10,138 3.1 %
Others 58,962 11,448 30.5 % 70,410 21.5 %
Total 289,557 37,478 100 % 327,034 100 %
Table 3 – Top-10 wind turbine suppliers in 2013.
from World market Update 2013 [1].
China USA UK Germany Denmark

1.01
1.31
0.73
1.55
0.78
1.411.53
0.82
1.25
0.00
ChinaUSA UK
Germany
DenmarkJapan
CanadaSpain
India
France
0.20
0.40
0.60
0.80
1.00
1.20
1.40
1.60
0.950.95
80
100
120
140
160
180
200
2005 2006 2007 2008 2009 2010 2011
Ufaglærte Faglærte KVU MVU LVU PhD
DTU International Energy Report 2014
Wind energy technology developments — Page 39
Figure 12 – Relative impact of the ten most publishing countries 2003 – 2012 [5].
has been a shift from jobs requiring unskilled man-power to highly skilled jobs as shown in Figure 13 from [5].
Especially the jobs requiring master and PhD level have grown consistently, and only jobs for unskilled labor have fallen in the period. This development is fortunate in the sense that such jobs are associated with high value creation. However, highly trained staff is scarce, and require a strong effort on educa-tion and research to grow. In the EWEA study [7] the European industry already finds it difficult to hire suitably trained staff. EWEA estimates that there is currently a shortage of 7,000 qualified personnel required by the European wind energy sector each year, a figure that could increase to 15,000 by 2030 if the number of graduates taking courses relevant to the industry does not rise. However, the positive message is that nearly 50,000 additional trained staff will be needed by the industry by 2030. By that year, operations and maintenance will become the greatest source for new jobs and demand for trained staff.
Hence, maintaining and developing the competitive edge and jobs will require significant investments in education and research.
Standards and CertificationMuch of the technology development and the glo-balization of the wind energy industry have been
Figure 13 – Development of employees in the Danish wind energy sector.
Development of employees in the Danish wind energy sector according to level of education, 2005–2011,
index (2005=100) [5].
Unskilled Skilled Short higher edu. Medium higher edu. Long higher edu. PhD
immensely helped by the development of inter-national standards. The responsible standards or-ganization is IEC (International Electrotechnical Committee), which in 1988 formed the Technical committee TC88 with the task to prepare interna-tional wind energy standards. The scope for TC88 is
“To prepare international standards for wind turbines that convert wind energy into elec-trical energy. These standards address design requirements, engineering integrity, measure-ment techniques and test procedures. Their purpose is to provide a basis for design, qual-ity assurance and certification. The standards are concerned with all subsystems of wind turbines, such as mechanical and internal electrical systems, support structures and control and protection systems. They are in-tended to be used together with appropriate IEC/ISO standards.”
The development of standards has followed the general development of wind turbines: 1) Initially preparation of standards giving essential safety and functional requirements to assure the general safety and function of a new technology. 2) Test standards by which the performance can be compared and validated. 3) Conformity testing and certification as a means to document and instill confidence of a complex product to the market and authorities. 4) Standards for interfaces and components when

DTU International Energy Report 2014
Page 40 — Wind energy technology developments
wind turbines are becoming a recognized and sig-nificant element in power systems and where com-ponents are acquired on the international market.
Reference Title
IEC 61400-1:2005 +AMD1:2010
Wind turbines – Part 1: Design requirements
IEC 61400-2:2013 Wind turbines – Part 2: Small wind turbines
IEC 61400-3:2009 Wind turbines – Part 3: Design requirements for offshore wind turbines
IEC 61400-4:2012 Wind turbines – Part 4: Design requirements for wind turbine gearboxes
IEC 61400-11:2012 Wind turbines – Part 11: Acoustic noise measurement techniques
IEC 61400-12-1:2005 Wind turbines – Part 12-1: Power performance measurements of electricity producing wind turbines
IEC 61400-12-2:2013 Wind turbines – Part 12-2: Power performance of electricity-producing wind turbines based on nacelle anemometry
IEC TS 61400-13:2001 Wind turbine generator systems – Part 13: Measurement of mechanical loads
IEC TS 61400-14:2005 Wind turbines – Part 14: Declaration of apparent sound power level and tonality values
IEC 61400-21:2008 Wind turbines – Part 21: Measurement and assessment of power quality characteristics of grid connected wind turbines
IEC 61400-22:2010 Wind turbines – Part 22: Conformity testing and certification
IEC 61400-23:2014 Wind turbines – Part 23: Full-scale structural testing of rotor blades
IEC 61400-24:2010 Wind turbines – Part 24: Lightning protection
IEC 61400-25-1:2006 Wind turbines – Part 25-1: Communications for monitoring and control of wind power plants – Overall description of principles and models
IEC 61400-25-2:2006 Wind turbines – Part 25-2: Communications for monitoring and control of wind power plants – Information models
IEC 61400-25-3:2006 Wind turbines – Part 25-3: Communications for monitoring and control of wind power plants – Information exchange models
IEC 61400-25-4:2008 Wind turbines – Part 25-4: Communications for monitoring and control of wind power plants – Mapping to communication profile
IEC 61400-25-5:2006 Wind turbines – Part 25-5: Communications for monitoring and control of wind power plants – Conformance testing
IEC 61400-25-6:2010 Wind turbines – Part 25-6: Communications for monitoring and control of wind power plants – Logical node classes and data classes for condition monitoring
IEC TS 61400-26-1:2011 Wind turbines – Part 26-1: Time-based availability for wind turbine generating systems
IEC TS 61400-26-2:2014 Wind turbines – Part 26-2: Production-based availability for wind turbines
Reference Title
IEC/TS 61400-3-2 Ed. 1.0 Wind turbines – Part 3-2: Design requirements for floating offshore wind turbines
IEC/TS 61400-5 Wind turbines – Part 5: Wind turbine rotor blades
IEC 61400-6 Ed. 1.0 Wind Turbines: Tower and foundation design
IEC 61400-15 Ed. 1.0 Wind turbines – Part 15: Assessment of site specific wind conditions for wind power stations
IEC/TS 61400-26-3 Ed. 1.0 Wind turbines – Part 26-3: Availability for wind power stations
IEC 61400-27-1 Ed. 1.0 Wind turbines – Part 27-1: Electrical simulation models for wind power generation
IEC 61400-27-2 Ed. 1.0 Wind turbines – Part 27-2: Electrical simulation models for wind power generation – Wind power plants
PNW 88-477 Ed. 1.0 Future IEC 61400-415 Ed.1: Wind turbines – Part 415: Terminology
In addition to the normal revision of standards the following new publications are underway:
As of 2013 IEC has issued the following standards publications in the 61400 series [3]:

DTU International Energy Report 2014
Wind energy technology developments — Page 41
There are several critical issues for wind energy standardization. A wind turbine is a series-pro-duced industrial product that later is being im-plemented under site-specific condition. Firstly, this means that in general a wind turbine is not designed to the specific conditions that it will meet, but rather to typical conditions, as specified in wind turbine classes. In the committee draft for the fourth edition of IEC 61400-1 Design Criteria [4], the possible general type classes are defined in terms of the basic parameters Vref, the 10 min average extreme wind speed with 50 years return period, Vave, the annual average wind speed, and Iref, which specifies the turbulence level, as listed here in Table 4.
Clearly, safety and function can only be ensured for a wind turbine designed to such general classes, when the conditions at the site of application have been analyzed and conformity with the assumed basic parameters or resulting loads has been as-sured.
Secondly, standards are being used as the norma-tive requirements for certification by third parties. IEC standards have become the basis for many of the certifications with interpretations and supple-mentary requirements added from local national standards or private certification body guidelines. Almost all turbines are now certified. Certification of major components has become common. While certification by a qualified certification body means that the designer can enter into a dialogue on how to
Wind turbine class I II III S
Vref (m/s) 50 42.5 37.5
Valuesspecified
by thedesigner
Vave (m/s) 10 8.5 7.5
Vref,T (m/s) — 57 —
A+ Iref (-) — 0.18 —
A Iref (-) — 0.16 —
B Iref (-) — 0.14 —
C Iref (-) — 0.12 —
Table 4 – Basic parameters for wind turbine classes.
meet and document conformity with less stringent performance or functional requirements and hence not be limited in the development, the approach with a large number of certification bodies offering their services in several countries has led to harmo-nization issues.
Thirdly, a wind turbine plant is a complex system where random external conditions interact dynami-cally with the structural system with advanced con-trol and interdependent components. Well-designed components do not necessarily add up to a safe and well-functioning system; a reality that standardiza-tion needs to take into account.
Finally, although the wind energy technology can be considered mature in the sense of the existence of a commercial market, the technology development is rapid, as can be seen from the previous discussion of what is considered the main-stream technology. While standards can be used to share new technical knowledge and best practices, create and maintain an international market without technical barriers and hence facilitate technical development, the de-velopment of more and more comprehensive tech-nical standards may also be a barrier for technical development.
As most international markets base their technical requirements on IEC standards and require certifi-cation, standards and certification at this point has a good balance between ensuring safety and perfor-mance and instilling confidence in the technology, while also allowing and even facilitating further development. However, national regulations, limited understanding of the background of the standards and harmonization issues are serious challenges. Only by maintaining and developing standards, which are not overly descriptive and limiting, and by having very qualified certification bodies with mutual recognition, can international standards and certification be an effective tool to facilitate the technological development and the reduction of the cost of energy from wind energy.

DTU International Energy Report 2014
Page 42 — Wind energy technology developments
ConclusionsRecent years have seen a renewed effort in the tech-nological development of wind turbine technology from competition within the wind energy sector as well as the competing energy technologies. The main-stream turbine technology development trend is characterized by up-scaling to turbines with larger rated capacity for both onshore and offshore appli-cations, larger rotors for higher capacity factors and new drivetrain solution, including the direct-drive solution without gearbox.
The industry is international, and the old markets and suppliers from Europe and USA are challenged by Asia, in particular China. Maintaining and developing the competitive edge and jobs will require significant investments in education and research.
Standards and certification have been important in-struments for facilitating technical development and create an international market without technical bar-riers; care should be taken in the future development to avoid limiting the technical development, which is necessary for reducing the cost of energy from wind.

Chapter 7
Offshore wind energy developmentsBy Mathias Stolpe and Thomas Buhl, DTU Wind Energy; B. Mutlu Sumer, DTU MEK; Søren Kiil, DTU Chemical Engineering; Joachim Holbøll, DTU Electrical Engineering; Kalle Piirainen, DTU Management Engineering

0
1990 1993 1995 1998 2000 2003 2005 2008 2010 2013 2015
0.5
1.0
1.5
2.0
2.5
3.0
3.5
4.0
4.5
5.0
O�shore wind farm capital cost(2011£m/MW)
operational under construction contracted
Year operational
DTU International Energy Report 2014
Page 44 — Offshore wind energy developments
→ IntroductionOnshore wind power is becoming increas-ingly competitive with conventional fossil
based electricity generation. However, offshore wind power is still much more expensive than onshore wind energy. The reasons for going offshore are many fold but mostly due to higher wind resources, less environmental impact and more available space. The drawbacks are increased operation and maintenance cost and added capital expenditure mainly due to the offshore support structures but also to increased costs for cabling, transportation and installation. Since offshore wind farms lately have been moving further from shore and into deeper waters the trend in cost is increasing as seen in the Figure 14 below.
Substantial research and development is needed, to realise the Danish MegaVind4 vision from 2010. The focus of RTDI needs to target the most cost compet-itive areas. These are: Integrated design, Site condi-tions, Support structures, Reliability and Operation and Maintenance (O&M), Project development and planning, Business Innovation and Standards and certification.
Figure 14 – Cost trend for offshore wind farms.
Average cost in 2013 is about 3M£/MW.
Source: GL – Garrad Hassan3
DTU has numerous research projects within the mentioned target areas. This chapter will give a brief overview of a few of the activities within off-shore wind energy research, specifically 1) Support structure optimization, 2) Blade coatings for wind turbines; 3) Scour protection of foundations, 4) Off-shore HVDC and 5) Offshore wind services.
Support structure optimizationOffshore wind turbines are mounted on costly bot-tom-fixed support structures such as monopiles and jackets. The newly funded Danish research council project – ABYSS – at DTU Wind Energy develops novel mathematical models, reliable numerical optimization techniques and software for optimal structural design of cost effective bottom-fixed offshore wind turbine support structures for all relevant water depths in-cluding deep waters in excess of 50m. Deeper water deployment expands the area for erecting wind farms at locations with superior wind conditions. The ABYSS techniques take dynamic wind and wave loads, cost, life expectancy, manufacturing, and functional re-quirements accurately into account. Available design tools are far from capable of performing industrial
3. http://www.gl-garradhassan.com/assets/downloads/UK_Offshore_Wind_Charting_the_Right_Course.pdf
4. http://www.windpower.org/download/952/UK_megavind_report_ok.pdf

DTU International Energy Report 2014
Offshore wind energy developments — Page 45
structural optimization with this complex combina-tion of requirements and large number of dynamic loads. The results of ABYSS will lead to a faster and more automated design process, with capabilities to design mass-producible and reliable support struc-tures for deep waters and large wind turbines. The optimized designs have longer life expectancy and provide a decrease of cost of energy, contributing to achieving the national energy goals. The developed methods and tools are also immediately applicable to other industrial design in e.g. aerospace.
At the present stage the support structure optimi-zation tool developed at DTU Wind Energy is able to optimize jacket and monopile support structures with static load putting constraints on fundamental eigen frequencies, displacement, and stresses. The graphical user interface for the jacket optimization tool can be seen in Figure 15.
Following Table 5, which shows the potential CAPEX reduction for optimizing jacket support struc-tures can be as much as 6.2%. For a future wind farm development of e.g. Kriegers Flak (which is
Graphical User Interface for the JacketOpt structural optimization tool developed at DTU Wind Energy. This will include manufacturing constraints at the end of the project ABYSS.
600 MW) and assuming a cost of 3M£/MW as pre-viously mentioned, the potential cost reduction is 0.062 × 600 × 3 = 112M£ or roughly 1 billion Danish Kroner.
Scour protectionThe environments of most offshore wind farms are harsh, below as well as above sea level. To reduce costs without compromising safety it is important to have a detailed understanding of the entire struc-ture of each wind turbine, including its foundation, with both static and dynamic loading from the integrated turbine system as well as interactions with the seabed under nominal and extreme con-ditions. The foundation makes up about one third of the total capital cost of a wind turbine, so it is not surprising that much research has been done to understand the interaction between the water flow, the seabed and the structure itself.
A complicating factor is the fact that the seabed usu-ally consists of loose material – sand or silt – which moves under the influence of waves and currents. In some cases, large-scale sand waves may move across
Figure 15 – Graphical User Interface for the JacketOpt structural optimization tool.

SeabedFilter layer, tf
Pile
Cover layer, tc
Dp
DTU International Energy Report 2014
Page 46 — Offshore wind energy developments
the seabed with wavelengths of the order of 10–100 m and heights of 0.5–5 m.
Foundation structures may be of four types: mono-piles, tripods, jackets, and gravity bases. Monopiles are used for shallow waters (up to say 20–30 m deep), and the other types in deeper water. For all types of foundations there is a risk of heavy scour around the structure (Figure 16).
Scour threatens the stability of the turbine structure, so these structures are almost invariably surrounded by rocks to protect them (Figure 17). However, foun-dations without scour protection are sometimes used. [13]
Important in the design of the foundation and of the complete turbine structure are:1. maximum mechanical load, which determines
the size of the foundation and the depth to which it must extend below the seabed;
Potential Levelized Cost of Energy (LCoE) reduction for jacket design, split into CAPital Expenditure (CAPEX), Operational Expenditure (OPEX) and Annual Energy Production (AEP).
Source: BVG Associates 5
5. http://www.bvgassociates.co.uk/Portals/0/publications/BVG%20TCE%20Technology%20work%20stream%20report%20120525.pdf
Table 5 – Potential Levelized Cost of Energy (LCoE) reduction for jacket design.
Numerical simulation (using a k-omega turbulence model) of a scour hole around a model monopile. In this case the scour has grown until it reaches equilibrium. [9]
Innovation
Maximum technical potential impact Anticipated Impact FID 2020
CAPEX OPEX AEP LCOE CAPEX OPEX AEP LCOE
Improvements in jacket manufacturing -4.2% -0.6% 0.08% -3.0% -3.0% -2.9% 0.05% -2.0%
Improvements in jacket design -1.4% 0% 0% -09% -0.9% 0% 0% -0.6%
Improvements in jacket design standards -0.6% 0% 0% -0.4% -0.3% 0% 0% -0.2%
Total -4.0% -0.4% 0.05% -2.8%
Figure 16 – Numerical simulation. Figure 17 – Scour protection around a monopile. [11]
2. fatigue load, which sets the wall thickness of the foundation elements; and
3. eigenfrequencies (natural frequencies) of the complete structure, which influence the opera-tion of the turbine itself.
On a site where scour protection is not used, or has not yet been installed, the depth of the scour hole around the foundation strongly influences these three factors. Moreover, the depth of the scour hole changes continuously as the seabed around the foundation experiences alternate scour and backfilling in an ever-changing climate of waves and currents.[12]
Where scour protection is used, the hydrodynamics describing the flow around the protection are com-plex, involving interactions between the water flow, the structure and the seabed. The design variables are the thickness and extent of the rock layer, the size of the rocks, and the thickness of the so-called

DTU International Energy Report 2014
Offshore wind energy developments — Page 47
filter layer between the seabed and the covering layer of rocks.
Potential failure modes include sinking of the whole protection structure into the seabed, [11] and breakup of the cover layer as rocks are removed by the current, either across the top surface of the cover layer or around its edges (“edge scour”). [8] Also important are various soil processes, including sand waves and interactions between the seabed and the full depth of the foundation.
This set of problems offers great challenges to be understood through physical experiments and numerical modelling. A large-scale research pro-gramme to address these issues, Seabed Windfarm Interaction, was funded by DSF/Energy and Envi-ronment from 2008 to 2012. It was coordinated by B.M. Sumer, one of the authors of this chapter (http://sbwi.dhigroup.com).
Issues related to scour and scour protection are also on the agenda of MERMAID, a new large-scale EU project (Innovative Multi-purpose Offshore Plat-forms: Planning, Design and Operation; http://www.mermaidproject.eu/), which is coordinated by DTU Mechanic’s Fluid Mechanics, Coastal Engineering and Maritime Engineering section. The coordinator is Professor Erik Damgaard Christensen ([email protected]).
Finally, reference [10] discusses interaction between flows, structures and the seabed, including scour and scour protection, with a view to identifying the state of the art and current research challenges.
Blade coatings for wind turbinesErosion of industrial materials by impacting water droplets is a well-known event. Already during the 1940s, with the development of the aeronautical in-dustry, it was observed that exposure to rain was the origin of severe material damage. Likewise, blades in wind turbines are exposed to rain erosion. Research in this field is growing, driven by the fast develop-ment of the wind power industry during the last 10–15 years. The size of wind turbines has increased dramatically in recent years. Today turbines up to 8.0 MW and over 160 m rotor diameter are available,
where the tip velocity of the blades can reach a linear speed close to 100 m/s.
In the case of offshore wind turbines, blade ero-sion is particularly problematic; the repair or the replacement of blades is very costly. Due to the presence of sea salt aerosols in the air, blade erosion rates for offshore wind turbines are ap-proximately twice as high as the rates observed on inland wind turbines. As an example, over the past three years, more than 200 blades on 80 wind turbines have been repaired at the wind turbine park Horns Rev 1 off Blåvands Huk in Denmark [1]. The wind turbines were put into operation in 2002. Repairs have also taken place at other wind turbine parks: in Denmark at Rødsand and Mid-delgrunden, in Sweden at Lillgrund, in Germany at Baltic 1, in Britain at Barrow, North Hoyle, Kentish Flats, Scroby Sands, Thanet, and Robin Rigg, and in the Netherlands at OWEZ [1]. In addition to maintenance penalties, mechanical damage to the wind blades reduces the electrical efficiency of the wind turbines. Wind tunnel experiments estimate a 5% reduction of the power efficiency, depending of factors such as the type and degree of surface roughness of the blade [1].
Wind turbine blades are primarily made of fiberglass reinforced polymer composites. Skins are typically double-bias or triaxial fiberglass and the core is made of balsa or some kind of foam structure. Epoxy-based materials have been the preferred choice of binder due to their high strength, easy production and low cost. Carbon fibres are often used for local reinforcement. Blade composites are vulnerable to impact of solid particles (e.g. sand or insects) and rain droplets. Ultraviolet radiation and large tem-perature fluctuations can also damage the blades.
The use of high performance blade coating sys-tems provides efficient and cost-effective protection against rain erosion. These coating systems have the ability to absorb the energy from impacting droplets. Current coating systems consist, typically, of a putty layer which is applied for filling pores in the composite substrate, a primer to secure good adhesion of the subsequent coat and a flexible top-coat, usually a polyurethane based formulationn [2].
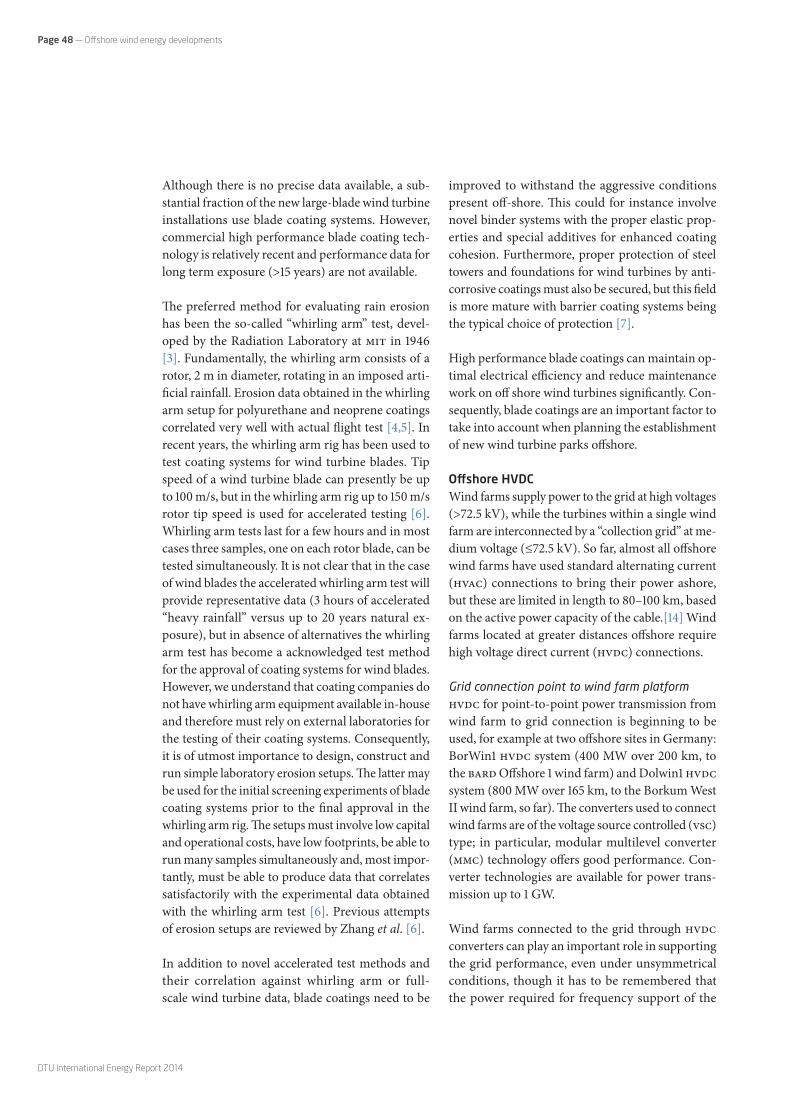
DTU International Energy Report 2014
Page 48 — Offshore wind energy developments
Although there is no precise data available, a sub-stantial fraction of the new large-blade wind turbine installations use blade coating systems. However, commercial high performance blade coating tech-nology is relatively recent and performance data for long term exposure (>15 years) are not available.
The preferred method for evaluating rain erosion has been the so-called “whirling arm” test, devel-oped by the Radiation Laboratory at MIT in 1946 [3]. Fundamentally, the whirling arm consists of a rotor, 2 m in diameter, rotating in an imposed arti-ficial rainfall. Erosion data obtained in the whirling arm setup for polyurethane and neoprene coatings correlated very well with actual flight test [4,5]. In recent years, the whirling arm rig has been used to test coating systems for wind turbine blades. Tip speed of a wind turbine blade can presently be up to 100 m/s, but in the whirling arm rig up to 150 m/s rotor tip speed is used for accelerated testing [6]. Whirling arm tests last for a few hours and in most cases three samples, one on each rotor blade, can be tested simultaneously. It is not clear that in the case of wind blades the accelerated whirling arm test will provide representative data (3 hours of accelerated “heavy rainfall” versus up to 20 years natural ex-posure), but in absence of alternatives the whirling arm test has become a acknowledged test method for the approval of coating systems for wind blades. However, we understand that coating companies do not have whirling arm equipment available in-house and therefore must rely on external laboratories for the testing of their coating systems. Consequently, it is of utmost importance to design, construct and run simple laboratory erosion setups. The latter may be used for the initial screening experiments of blade coating systems prior to the final approval in the whirling arm rig. The setups must involve low capital and operational costs, have low footprints, be able to run many samples simultaneously and, most impor-tantly, must be able to produce data that correlates satisfactorily with the experimental data obtained with the whirling arm test [6]. Previous attempts of erosion setups are reviewed by Zhang et al. [6]. In addition to novel accelerated test methods and their correlation against whirling arm or full-scale wind turbine data, blade coatings need to be
improved to withstand the aggressive conditions present off-shore. This could for instance involve novel binder systems with the proper elastic prop-erties and special additives for enhanced coating cohesion. Furthermore, proper protection of steel towers and foundations for wind turbines by anti-corrosive coatings must also be secured, but this field is more mature with barrier coating systems being the typical choice of protection [7].
High performance blade coatings can maintain op-timal electrical efficiency and reduce maintenance work on off shore wind turbines significantly. Con-sequently, blade coatings are an important factor to take into account when planning the establishment of new wind turbine parks offshore.
Offshore HVDCWind farms supply power to the grid at high voltages (>72.5 kV), while the turbines within a single wind farm are interconnected by a “collection grid” at me-dium voltage (≤72.5 kV). So far, almost all offshore wind farms have used standard alternating current (HVAC) connections to bring their power ashore, but these are limited in length to 80–100 km, based on the active power capacity of the cable.[14] Wind farms located at greater distances offshore require high voltage direct current (HVDC) connections.
Grid connection point to wind farm platformHVDC for point-to-point power transmission from wind farm to grid connection is beginning to be used, for example at two offshore sites in Germany: BorWin1 HVDC system (400 MW over 200 km, to the BARD Offshore 1 wind farm) and Dolwin1 HVDC system (800 MW over 165 km, to the Borkum West II wind farm, so far). The converters used to connect wind farms are of the voltage source controlled (VSC) type; in particular, modular multilevel converter (MMC) technology offers good performance. Con-verter technologies are available for power trans-mission up to 1 GW.
Wind farms connected to the grid through HVDC converters can play an important role in supporting the grid performance, even under unsymmetrical conditions, though it has to be remembered that the power required for frequency support of the

DTU International Energy Report 2014
Offshore wind energy developments — Page 49
grid must come from the wind. Converters can also contribute to short-term stabilisation if they are combined with suitable energy sources. However, a change from traditional mechanical inertia – in the form of rotating mass in turbines and generators in the power system to converter-based “inertia” re-quires investigation of the consequences. A converter designed to compensate for missing rotating inertia from power generators requires the possibility of large units for energy storage. New technologies like supercapacitors and superconducting magnetic energy storage (SMES) may be able to meet this need, but will require considerable research effort before they can be used in practice.
Another supportive function of a VSC converter is in connection with faults. With a suitable control scheme the converter can ensure fast and robust fault ride-through (FRT). [15]
A very challenging area of offshore HVDC transmis-sion is the need for multi-terminal HVDC systems. These would be required, for instance, to connect multiple large wind farms or to operate them as part of a grid with multiple international interconnectors. This topic requires research on converter control, protection systems and breaker technologies, plus investigation of how to implement these in different grid configurations.
HVDC collection gridThe use of HVDC for the collection grid within the wind farm seems an obvious idea, bearing in mind that DC available in all wind turbines with a con-verter after the generator. There are, however, many challenges to consider. [16] The main concern is the lack of DC voltages sufficiently high (30–60 kV) to minimize losses in the collection grid.
Solutions could include high-voltage generators combined with suitable series, parallel or hybrid connections between the turbines. Depending on the chosen topology, this would require either volt-age source controlled (VSC) or current source con-trolled (CSC) converters. If the generator voltage is not sufficiently high, DC–DC step-up converters can be used to reach medium voltage level. These con-verters are readily available, but such a system may
have no advantages compared to the conventional arrangement in which a DC–AC converter is followed by a transformer to increase the voltage. On top of these considerations, control and protection of an HVDC collection grid would pose a large number of challenges comparable to the ones in multi-terminal HVDC transmission grids.
Offshore Wind Services – perspectives from around the North SeaFor the purposes of this section Offshore Wind Services (OWS) are the services that are needed to install, operate and maintain and decommission or repower an offshore wind farm through its life cycle. In other words OWS comprises is the Balance of Plant services as well as Operations and Maintenance of the offshore wind turbines and other equipment of the farm. There is a wide industry consensus that the offshore wind industry needs to work towards lower Levelized Cost of Energy, and by extension lower life-cycle cost, to remain attractive and competitive option in the energy mix. Offshore wind is inherently costly in terms of the capital cost; up-front capital investment is up to twice that of an onshore farm [17], [18]. Over the life cycle of an offshore farm OWS comprise up to 46% of the life cycle cost of the farm including up-front investment and installation, while the actual O&M cost is estimated between 25–28% of total LCoE [18]–[20].
The difference between LCoE onshore and offshore is largely explained by environmental factors; for offshore, equipment have been specifically engi-neered for the marine environment, and installa-tion as well as operations and maintenance (O&M) have to be performed on water, frequently with specialized vessels [17],[18]. Nevertheless it is ex-pected that OWS will in its own part contribute to lowering LCoE.
In this section we discuss some of the cost driv-ers and challenges for OWS and opportunities to lower the cost through research, development and innovation, and lay out main areas for improve-ment for OWS. This section is based on data gath-ered within a project called European Clusters for Offshore Wind Servicing (ECOWindS, 2012–2015, see www.ecowinds.eu for more information), and

DTU International Energy Report 2014
Page 50 — Offshore wind energy developments
during interviews at EWEA Offshore 2013 and EWEA Annual Event 2014 (approximately 20 interviews on the exhibition floor).
We can break down the challenges for OWS to tech-nical and organizational/business, which have some overlap. The OWS can be further divided to two main phases, installation and operation. The major techni-cal challenges tend to revolve around lack of technical standards relating to key interfaces of components both in the installation phase and during operation. These interfaces include non-standard technical in-terfaces between the major componentry, but also non-standard tower access solutions, boat landings and helipads to name concrete examples. The flipside of the technical coin is technical and other standards that relate to humans interacting with the compo-nentry. Presently, for example, O&M workers have to be trained and certified for each technical platform separately. Often also multiple overlapping if not in-terchangeable Occupational Health and Safety (OH&S, often related to Health, Safety, Environmental and Quality – HSEQ – policies) training and certifications are required for crews working on same equipment in different jurisdictions.
Two intertwined underlying challenges that exacer-bate these issues are complexity of projects in terms engineering and delivery in complex value network
Level/Phase Installation Operation
Technical Depth and distance raise OWS cost and make installation more sensitive to weather windows. (Depth affects cost of foundation and installation in particular, distance affects both installation and operation)
Non-standard electro-mechanical interfaces Non-standard interfaces such as boat landings and helipads
Reliability of some key components (depending on mfg. OEM)
Non-technical Planning, zoning and permitting delays; grid connections and associated project management cost overruns
Dock and port availabilityAvailability of vessels; competition with oil&gas industry over the resources
Need for overlapping but separate technical and safety training and certifications
Table 6 – Challenges for OWS to technical and organizational/business.
and a lack of communication both horizontally and vertically in the value network between suppliers, original equipment manufacturers (OEMs), service providers, contractors, developers and operators. Complexity and poor communication in turn have their own effect to resource congestions and bottle necks in delivery, both in terms of availability of adequately specified equipment, ports and vessels as well as skilled and qualified labor.
The ECOWindS consortium is working closely with industry stakeholders on a roadmap to alleviate these challenges. The process includes an analysis of re-gional capabilities, setting goals and basic strategy for OWS and then populating that strategy with an action plan. The work is in progress at the time of the writing, and we present some preliminary conclusions.
The initiatives that have thus far been influenced by the ECOWindS are the Cost Reduction Platform initiated by Offshoreenergy.dk (Sommers, 2014) and the joint effort between DONG Energy and Atkins to design a standard inter-array sub-transformer sta-tion (“DONG Energy awards new contract for wind farm substation design to Atkins,” 2014; Juul, 2014).6
The most important short to mid-term goal for the offshore wind industry is lowering the LCoE. There is a broad consensus that this is achieved through
6. Sommers, M. (2014). Knowledge-sharing is the way forward. ON/OFF NEWS – Renewables, 14. DONG Energy awards new contract for wind farm substation design to Atkins. (2014, April 8). London, UK.

DTU International Energy Report 2014
Offshore wind energy developments — Page 51
industrialization, i.e. scaling up the volume of pro-duction and installation and leveraging the learning effects, and standardization along the value chain. Several addresses in EWEA Offshore 2013 argued that the industry is on track to achieve the targets of cost reduction by approximately 40% by 2020.
These targets are commonly shared within OWS. Within this framework, the main thrust of action
is proposedly organized to two three intertwined work streams on; 1) standardization in terms of techno logy, interfaces as well as OH&S and qualifica-tions, 2) setting up communication and knowledge exchange within the OWS value chain to enable streamlining operation and innovation towards cost saving solutions, and 3) securing skills and qualifications necessary to provide OWS safely, effectively and efficiently.

Chapter 8
Emerging wind energy technologiesBy Flemming Rasmussen, DTU Wind Energy; Jean-Claude Grivel, DTU Energy Conversion; Michael Havbro Faber, DTU Civil Engineering; Nenad Mijatovic, DTU Electrical Engineering; Asger Bech Abrahamsen, DTU Wind Energy

160
180
140
EnerconE126
VestasV164
AlstomHaliade
Repower6M
SinovelSL6000
SiemensSWT 6.0 154
SamsungS7.0 171
ArevaM5000D
(m)
P (MW)
XEMC
Bard
GamesaG5MW
120
5 6 7 8
DTU International Energy Report 2014
Emerging wind energy technologies — Page 53
→ IntroductionSince the wind industry took off in the mid-1980s, wind turbine technology has
seen rapid development. This has led to impressive increases in the size of turbines: over three decades, a 100-fold increase in power output has accompa-nied major cost reductions due to improvements in design. If today’s 6–8 MW turbines were created by simply scaling up 55 kW machines from the mid-1980s, they would weigh 10 times as much as they do now. This chapter will discuss emerging technologies that are expected to continue the development of the wind sector to embrace new markets and to become even more competitive.
Drivers for new technologiesMost emerging technologies in the wind sector ad-dress technical challenges that currently set a lower limit to the cost of electricity produced in a given environment. The cost of electricity (CoE) is propor-tional to the cost of the installed hardware (C) plus the cost of maintaining that hardware (M) over its lifetime, and inversely proportional to the amount of electricity (E) produced in that time:
Thus strategies for decreasing the CoE will focus on building cheaper hardware that needs as little maintenance as possible over its lifetime, and on harvesting as much energy as possible during that lifetime. A more general concept is the Levelized Cost of Energy (LCoE) where the interest rate of the financing and insurance is included.
Small versus large turbinesThe power and hence the income generated by a wind turbine increases with the area (A) of the rotor. For a horizontal-axis turbine, A = πR2, where R is the length of a rotor blade. Longer blades, however, also have to be thicker and wider. Thus the mass (m) of the blade will increase more or less in proportion to R3. Assuming that the cost of the blade is propor-tional to its mass, scaling up increases the cost of the blade faster than the income it generates. This relation is often called the “square-cube” law, and it applies in general for the whole turbine.
CoE = C E+ M (1)
Applying the square-cube law to Equation (1) sug-gests that as turbines are scaled up the CoE should increase approximately in proportion to the blade length. That this has not been the case for several decades is due to technical advances and new mate-rials and design concepts used for the blades as well as the rest of the turbine, and to engineers’ growing ability to optimise their aerodynamic, structural and dynamic properties.
Figure 18 shows the rotor diameter of the 10 larg-est turbines as of 2014 as a function of their rated power. The typical power of onshore turbines is now 2–3 MW, whereas the largest offshore turbines range up to 8 MW and have rotor diameters up to 171 m. The rotor area of a given turbine is utilized to capture as much of the wind available for a specific site and also to increase the capacity factor to give a more constant power production. In Figure 18 the different design strategies are clearly seen since a 120–130 m rotor is used for turbines with power ratings in the range from 5–7.5 MW.
Turbine configurationsAll the turbines illustrated in Figure 18 are horizon-tal- axis wind turbines (HAWT) with three blades. One might get the impression that this is the only configuration suitable for large-scale deployment of wind power, but in fact several other concepts have been proposed and some are under development.
Rotor diameter and rated power for the 10 largest turbines as of May 2014. [3] All the turbines shown are intended for offshore operation, but the size is expected to increase even further to utilize the expensive offshore foundations.
Figure 18 – Rotor diameter and rated power for the 10 largest turbines.

DTU International Energy Report 2014
Page 54 — Emerging wind energy technologies
We will discuss some of these emerging concepts before moving on to subsystems and components for three-bladed HAWTs.
The mainstream HAWT development has an impres-sive track record over the last 30 years. Following early successes with this type of turbine most R&D has concentrated on HAWTs, to great effect. At a more detailed level the concept has evolved over the years. The latest development is blades designed for strength rather than stiffness, with lower than optimum induction of the rotor. This results in very long, slender, flexible blades which compared to their predecessors sweep a bigger area and so capture more energy over the year for a given gen-erator size.
This successful evolution of the mainstream HAWT makes it difficult for radical new turbine configura-tions to compete, though it does set clear benchmarks for performance and cost. It is also hard to compare new designs that have not yet been built with field-proven turbine models. Advanced modelling and simulation tools are a great help here, however.
An example shows what happens when we convert a three-blade HAWT to a two-blade design with the same rotor diameter. Simulation shows that increas-ing the chord (width) of the blades by 50% yields a two-blade rotor with similar performance to that of the original three-blade rotor.[4] Although using two blades instead of three increases the load on each blade by 50%, the broader blade can be made from
thinner shels while still carrying the higher load. As a result, the two-blade rotor weighs only two-thirds as much as its three-blade counterpart.
A further modification could save even more weight. Two-blade turbines have the advantage that they can be fitted with “teetering” hubs, which reduce fatigue loads by not constraining the blades to a single plane of rotation. By reducing blade loads to around the same value as for the slenderer three-blade design, the teetering hub allows the use of a rotor that weighs only half as much as the original three-blade design.
Looking at this way, the two-blade design allows the use of a larger rotor – and hence captures more energy – than a three-blade rotor made from the same amount of material.
Disadvantages of the two-blade design include a 4% increase in aerodynamic losses at the blade tips, a 15% increase in the turbulent load on the rotor, and higher fatigue loads on the tower due to turbulence.These advantages and disadvantages relative to the mainstream turbine design need to be balanced in terms of their implications for the cost of electricity. The same is true of any novel design concept, and mathematical modelling needs to be backed up with a certain degree of actual product develop-ment before a realistic comparison can be made.
Figure 19a shows a two-blade horizontal-axis tur-bine in which only the outer part of each blade is
Figure 19 – Turbine configurations.
(a) A two-blade HAWT (Envision). [5]
(b) Vertical-axis wind turbine (VAWT) (Deepwind small-scale demonstrator). [6]
(c) Multi-rotor concept. [7]
a b c

DTU International Energy Report 2014
Emerging wind energy technologies — Page 55
fitted with pitch control. [5] Compared to a three-blade turbine this saves the weight of one blade and makes installation easier, especially offshore. This two-blade design can withstand extremely high winds, so it could be well suited to survive typhoons in Asia.
Figure 19b is a vertical-axis wind turbine (VAWT). Compared to a HAWT this has the advantage that there is no need for a yaw system to turn the rotor into the wind. [6] VAWT blades experience cyclic aerodynamic loads and constant gravity loads, while for HAWTs this situation is reversed. VAWTs thus have the potential to become more cost-efficient at power ratings above 10 MW, where gravity loads on HAWT blades become very large.
Figure 19c shows a multi-rotor concept in which a large structural frame holds several smaller tur-bines (either HAWTs or VAWTs).[7] This might re-duce scale-up costs by achieving large power ratings from relatively low-cost turbines manufactured in large numbers and standard sizes. Power would continue to flow even if one of the turbines failed, but on the other hand maintenance costs are likely to be higher than for a single turbine with the same output.
Components for horizontal-axis turbinesSeveral emerging technologies are found in specific turbine components such as blades, drive trains, towers, offshore foundations, power electronics, offshore cabling, and control systems.
BladesMany factors have aided the move to lighter blades. In the past, the most important of these has been the development of blades that are much thicker than their predecessors, especially near the hub. This increases their load-carrying capacity at the expense of aerodynamics, so an optimum trade-off is the objective.
During the last few years there has been an impor-tant move from design for stiffness (to stop blades hitting the tower) to design for strength, which im-plies a more economical use of materials.
This has been made possible by angling the blades into the wind (“upwind coning” and “pre-bend”) and by tilting the whole rotor upwards. These changes allow the use of more flexible blades, and corre-sponding higher deflections, while still maintaining safe clearance from the tower. Greater flexibility, however, presents a challenge with respect to pre-dicting the dynamic behaviour of the blades. Such designs are only possible thanks to advanced tools for simulating aeroelastic loads and stability – in-deed; these models have even predicted improve-ments in stability as a result of pre-bending.
An especially elegant consequence of increased flex-ibility is the ability to build passive load-reduction techniques directly into the blade structure. Tak-ing advantage of the unique attributes of composite materials, for instance, some blades are now being built in ways that couple their bending and twisting
(a) Blades with passive load reduction made by Siemens Wind Power.[8]
(b) Measuring blade deflection. (Reproduced with permision from Siemens Wind Power A/S) [9]
(c) Blade section with an active trailing edge controlled by pressurised air.[10]
Figure 20 – Blades.
a b c

DTU International Energy Report 2014
Page 56 — Emerging wind energy technologies
deformations in order to reduce loads. Another way to reduce loads is to curve or “sweep” the blades in their plane of rotation. Figure 20 shows such blades in operation (a), along with an experimental setup (b).
A combination of passive built-in aeroelastic tai-loring of the blade characteristics with innovative systems of trailing-edge control can considerably re-duce the fatigue loads on blades. Active trailing-edge control systems are being developed, though they have not yet been applied on commercial turbines (Figure 20c). Passive flow control devices such as vortex generators and Gurney flaps, meanwhile, are included in many new blades. They can also be retrofitted to older blades to improve flow conditions and increase power output.
The general trend in blade and rotor design is to-wards increased tailoring to give greater variation in aerodynamic, structural and aeroelastic charac-teristics along the span of the blade. Simultaneous optimisation of all these parameters produces blades with unconventional shapes that can be very far from straight in the unloaded condition. These very long blades, with a lot of pre-bend and sweep, are chal-lenging to build, and it is tempting to manufacture them in sections that can be glued together on site. This could allow pre-bent and swept blades to be built up from nearly straight sections fixed at small angles to one other.
Drive trainsConventional wind turbines use gears to match the slow rotation speeds of the blades and hub to the higher speeds required to drive a standard induc-tion generator connected directly to the grid. His-torically, gearboxes installed in wind turbines in some cases have turned out to have shorter lifetimes than they were designed for. This has increased the maintenance cost M as well as reduced the energy production E due to less availability of the turbine and resulted in a lower CoE than expected. The prob-lem has been solved by developing improved gears and – in onshore turbines –procedures to replace gearboxes quickly in old turbines.
Gearbox replacement is not an attractive idea in offshore turbines, however, because access is only
available during short periods of calm weather at sea. To improve the reliability of offshore turbines, manufacturers have therefore developed a range of drive train solutions containing one, two or three gearbox stages, or with no gears at all (Table 7).
Using a gearbox allows the generator to be kept rel-atively small because the power of the generator is proportional to its speed:
where Pgen is the generator power, Bg is the magnetic field strength in the air gap, As is the current load-ing of the stator windings, Vg is the volume of the generator, and ωg is the rotation speed. Thus if we reduce the rotation speed by reducing the gear ratio, we have to increase the volume of the generator to get the same power output. [11]
From Table 7 it is evident that many – and very different – drive train concepts are now appearing in offshore turbines. It remains to be seen whether any of them will become widely accepted as the off-shore wind sector grows. We can say, however, that the current trend is to remove as many stages of the gearbox as possible, in order to improve reliability, and to use medium-speed multi-pole permanent magnet generators. [11]
Permanent magnet generators use powerful mag-nets made from neodymium or other metals of the type known as rare earths elements. Compared to generators that rely on current-carrying coils for their magnetic fields, permanent magnet genera-tors have fewer moving parts and might be more reliable. Since commercial sources of rare earths element magnets are concentrated in Asia, there is concern that supplies may not be able to meet demand for the large magnets used in wind turbine generators. Other types of magnets can be used, but since these are weaker they would require larger generators.
The frequency of low- or medium-speed permanent magnet generators does not match the frequency of the grid, so all the power produced has to go through an electronic converter. This increases costs, but at the
Pgen ∼ Bg AsVg ωg (2)

Power (MW) 6.0
Rotor diameter (m) 146
Drive train DD, PM,full converter
Model Haliade
Manufacturer Alstom
Power (MW) 6.0
Rotor diameter (m) 128
Drive train 3-stage gear, DFIG,partial converter
Model SL6000
Manufacturer Sinovel
Power (MW) 5.0
Rotor diameter (m) 136
Drive train 1-stage gear, PM, full converter
Model M5000
Manufacturer Areva
Power (MW) 5.0
G5MW
Rotor diameter (m) 128
Drive train 2-stage gear,PM, full converter
Model
Manufacturer Gamesa
Power (MW)8.0
ModelV164
Rotor diameter (m) 164Drive train 1-stage gear,PM, full converter
ManufacturerVestas
Power (MW) 7.5
Model E126
Rotor diameter (m) 126
Drive train DD, Wound Cu, full converter
Manufacturer Enercon
Power (MW) 7.0
Model S7.0-171
Manufacturer Samsung
Rotor diameter (m) 171
Drive train 1-stage gear,PM, full converter
Power (MW) 6.2
Model 6M
Rotor diameter (m) 126
Drive train 3-stage gear, DFIG, partial converter
Manufacturer Senvion
Power (MW) 5.0
Rotor diameter (m) 122
Drive train 3-stage gear,DFIG, partial converter
Model Bard 5.0
Manufacturer Bard
Power (MW) 6.0
Model SWT6.0-155
Rotor diameter (m) 154
Drive train DD, PM,full converter
Manufacturer Siemens
Power (MW) 5.0
Model XD115-5MW
Manufacturer XEMEC
Rotor diameter (m) 115
Drive train DD, PM,full converter
DTU International Energy Report 2014
Emerging wind energy technologies — Page 57
Drive train details for the 10 largest turbines as of May 2014. [3,12] The turbines are ranked by rated power and then by rotor diameter.
Key: DD = direct drive, PM = permanent magnet generator, DFIG = doubly fed induction generator, wound Cu = generator using only electro magnets, full converter = all power goes through the electronics, partial converter = only generator rotor power goes through the electronics.
Table 7 – Drive train details for the 10 largest turbines as of May 2014.

DTU International Energy Report 2014
Page 58 — Emerging wind energy technologies
same time decouples the generator from the grid and so improves the “ride through” of grid faults.
Several other drive train concepts exist that are radically different from those found in the “top 10” list. Superconducting coils, for instance, could pro-vide magnetic fields even stronger than those of permanent magnet generators. Figure 21a shows how this might yield a direct drive generator that is compact enough to be mounted on the turbine hub, eliminating the need for a conventional nacelle [13]. The challenge is to integrate the cryogenic system needed to cool the superconducting coils.
Magnetic gears are a new type of power transmis-sion device originally developed at Sheffield Uni-versity in the UK. A magnetic gearbox uses two sets of magnets rotating on rings placed close together so that their magnetic fields interact. With more magnets on one side than the other, the device acts like a conventional gearbox – and with claimed similar efficiency – in converting both shaft speed and torque.
Figure 21b shows a magnetic gearbox integrated with a multi-pole generator, again mounted directly on the hub. [14] This arrangement is claimed to be more compact than either a direct-drive generator or a mechanical gearbox with a conventional wound generator. It contains more moving parts than a direct-drive power train, however, and also requires a relatively large quantity of permanent magnets.
A direct drive concept based on the weaker types of magnets that could be used if rare earth mag-nets were in short supply. The lower magnetic field strength requires a large-diameter generator which is supported like a bicycle wheel in the Sway concept, where the generator diameter is about 30 meters [11].
TowersAs the turbine diameter increases, the tower on which it is mounted must become not only taller but also wider, and made from thicker material, so that it can carry the increased load from the nacelle and rotor down to the foundation. This will clearly cost more.
Tower performance and cost depend on the ma-terial used. Currently most towers are made from steel plates up to 150 mm thick, which are rolled into tube sections that are welded together. These sections are then lifted on top of one another and bolted together to form the complete tower. Bend-ing and welding such thick plates is challenging, so designers are now looking into other materials such as concrete and even wood [15]. One idea is to cast concrete sections on site and then assemble these to create a tower.
Offshore foundationsThe installed cost of a turbine includes the cost of the foundation, which for offshore wind farms can exceed the capital cost of the turbine itself. As with towers, the size of the foundation scales
(a) Superconducting direct drive generator front-mounted in the “kingpin nacelle” configuration (INNWIND.EU). [13]
(b) Pseudo magnetic direct drive integrating a magnetic gearbox and a multi-pole generator (Magnomatics/DNV-GL). [14]
Figure 21 – Drive trains.
a b

DTU International Energy Report 2014
Emerging wind energy technologies — Page 59
Figure 22 – Offshore foundations.
with the square of the rotor diameter (times the tower height). For a given set of wind and wave conditions, it also scales linearly with water depth.
Expensive as offshore foundations are, it turns out that their costs scale relatively slowly with increas-ing turbine size, compared to the other contributors to the total installed cost. As a result, the economics of foundation design favour the use of turbines much larger than the typical 2–3 MW onshore tur-bine. This is clearly reflected in Figure 18, where almost all the turbines above 5 MW are aimed at offshore applications.
For water depths of 10–30 m the preferred foun-dation is a monopile (Figure 22a). This consists of a large-diameter steel tube hammered into the seabed, on top of which is a “transition piece” con-nected to the tower. A more innovative foundation is the jacket suction bucket (Figure 22b), which is sucked into the seabed by introducing a vacuum in the bucket part. In water 30–50 m deep a jacket
foundation is considered to be the most economic. For water deeper than 50 m a floating foundation (Figure 22c and d) is probably preferred.
Power electronicsAs Table 7 shows, most modern turbines use a full power electronic converter to allow variable-speed operation of the generator at frequencies different from that of the grid. This conversion usually begins with a set of semiconductor switches to rectify the AC power from the generator. The resulting DC current is fed to a capacitor bank, which is connected in turn to another set of semiconductor switches that chop up the DC to create an AC current at a frequency matching the electrical grid. This basic configuration can be realised in many topologies and with different numbers of semiconductor switches [20].
Although semiconductor switches are developing rapidly in terms of power ratings and reliability, they are still only used in small numbers and their cost is high [21]. Packaging is a key area of expertise:
a b
c d
Top: Bottom-mounted offshore foundations. (a) Monopile foundations
are used in most European offshore wind farms with typical water depths of 10–30 m (Reproduced with permission from Rambøll).[16]
(b) Suction bucket foundation for water depths of around 30-50 m (Reprocuced with permission from DONG ENERGY) [17].
Bottom: Floating off- shore foundations. (c) The Hywind concept,
here supporting a HAWT (Hild Bjelland Vik – Statoil ASA). [18]
(d) Deepwind concept supporting a VAWT. [19]

DTU International Energy Report 2014
Page 60 — Emerging wind energy technologies
it is challenging to make reliable electrical connec-tions to the semiconducting wafers themselves, and thermal cycling can create fatigue which shortens the life of the devices. In the future, silicon (Si) semi-conductor material might be replaced by silicon carbide (SiC), which can sustain higher operating temperatures.
A second central question for power electronics concerns the generator voltage. Most turbines have 690 V generators because that is the standard for general power electronics used in industry. As tur-bines continue to increase in size, however, this relatively low voltage will require the use of unreal-istically large currents.
Several commercial turbines, in fact, already use medium-voltage power converters. The problem with using voltages above 1 kV inside turbines is that this requires more stringent standards for design, construction and maintenance, and the associated switchgear and other equipment costs more.
One way to simplify the design of turbines – though not necessarily of complete wind farms – would be to export DC power to the collection grid (see next section). This would eliminate the need for the DC-to-AC stage of the power converter [22, 23].
Control of turbines, wind farms and gridsCentral to the successful implementation of wind power is not just the hardware, but also the control of that hardware. Since turbines operate in turbu-lent wind conditions, they experience loads that fluctuate greatly and are occasionally very high. Both extreme and fatigue loads reduce the lifetime of the machines.
The systems that control turbines have the primary job of trying to keep the power output to the grid as steady as possible. At the same time, however, suitably designed controllers could also mitigate mechanical load peaks by changing the pitch of individual blades, varying the generator speed, or damping oscillations in the drive train.
Any turbine control system needs an input signal that is linked to the behaviour of the system it is
trying to control. At present the main such signal is the wind speed at the turbine, as measured by an anemometer mounted on the nacelle.
An emerging alternative uses the principle of “light detection and ranging” (LIDAR) to measure wind speed some distance upwind of the turbine. LIDAR is an analogue of radar, using laser light instead of radio waves; particles or droplets in the path of the beam create reflections from which the air velocity can be calculated. Measuring the speed of a gust several seconds before it hits the turbine improves control by allowing the control system to take pre-emptive action.
Further into the future, the ability to measure wind speeds across the whole rotor diameter (Figure 23) and in front of the blades might eventually be used to control the individual sections of “smart blades”. This could allow the turbine to respond more efficiently to off-centre gusts and turbulence. [24]
LIDAR is also a useful tool for measuring the wind conditions at a site before a wind turbine or wind farm is installed. On new projects it might replace the use of tall meteorological masts.
The control aspects of wind power relate not only to individual turbines, but also to an increasing extent to a wind farm’s collective response to the wind and its interaction with the grid. This call for a wind farm controller that can take into account the responses of individual turbines to, for example, wake effects caused by their neighbours. Controlled shutdown of a wind farm in the face of an advancing storm is another important job of the main controller.
Learning from other industriesThis chapter has shown that the biggest technology changes are taking place in the offshore sector, yet turbines for onshore use still make up by far the biggest fraction of the installed wind power base.
Even though onshore and offshore technologies are developing differently, there is still considera-ble transfer of emerging offshore turbine technolo-gies to the onshore sector. An example of this is the ability to build longer rotor blades, which are used

DTU International Energy Report 2014
Emerging wind energy technologies — Page 61
(a) LIDAR could improve control by warning of gusts before they arrive at the turbine, and in future could even measure wind speeds across the whole rotor diameter.
(b) ZephIR LIDAR installed in the spinner of a NM80 2.3 MW wind turbine. [24]
Figure 23 – LIDAR.
for onshore turbines targeted at low wind speeds in the 2–3 MW class. Other examples are the option of direct drive and permanent magnet generators for most of the Siemens turbines, and growing use of full-scale converters in onshore turbines.
The challenge remains, however, to make wind more competitive with other power sources by continu-ing to introduce emerging technologies and new production methods into mainstream products. This calls for coordination between the medium- to long-term research performed by academia and the short- to medium-term R&D done by industry. Another important factor is the role of govern-ments, which can promote wind power by drawing up steady development tracks for the energy system as a whole and specify clear targets for wind energy. Our recommendations for academia, industry and government to foster the development of emerging wind energy technologies are:
Academia• Academic research should strive to expand the
technical limits of specific wind power tech-nologies, since these limits often determine the cost of wind energy.
• New technologies will always be expensive compared to mainstream technology, so we
need methodologies for assessing how emerg-ing wind technologies could affect the cost of energy.
• Incremental innovations generally have the fastest impact on LCoE, while the effect of long-term research targets might be more dramatic. What should be the balance between these approaches?
Industry• As the wind industry matures it is moving
towards mass production. Manufacturers can learn from other sectors, such as the automo-tive industry, how to do that in cost-compet-itive ways. Can shared technology platforms for the wind industry be developed, produced, maintained and decommissioned?
• The largest expansion of the wind sector is expected to be offshore. Lowering LCoE for off-shore wind power may require larger companies with the ability to develop, produce and deploy entire offshore wind farms by themselves.
Governments and industry associations• Clear formulations of future requirements for
energy systems will allow emerging wind tech-nologies to be developed appropriately.

DTU International Energy Report 2014
Page 62 — Emerging wind energy technologies
• Consistent support is required for long-term wind power research carried out by academia.
• Support for the industrial development of the wind sector may also be needed.
ConclusionsEmerging wind technologies often come about as a result of the need to enter new markets, such as offshore (shallow or deep water) and sites with low wind speeds. Their take-up is driven by the poten-tial to lower LCoE in these new markets, but they often move into more traditional markets once the technology matures.
We have shown above that the three-blade horizontal- axis turbine is the dominant design around which most current component development is based. The
most remarkable achievement of the last few years has been the increase in rotor size. This trend is expected to continue with the introduction of even more advanced blades, and perhaps also smarter blades with active control.
The drive trains of offshore turbines show a lot of variation, and it will be interesting to see whether geared or direct-drive designs come to dominate the offshore market. Finally, foundations and off-shore cabling call for rapid development, since they are essential in driving down LCoE for offshore wind power and making wind competitive with other energy sources.
Chapter 9
Challenges and solutions for energy systems with high shares of wind energyBy Kenneth Karlsson, Lena Kitzing and Jonas Katz, DTU Management Engineering; Poul Sørensen, Nicolaos Cutululis and Anca D. Hansen, DTU Wind Energy

DTU International Energy Report 2014
Page 64 — Challenges and solutions for energy systems with high shares of wind energy
→ Wind energy is becoming a significant player in energy systems, with ever-increasing market shares. 2013 was a record-breaking
year for wind in energy systems: in Spain, for instance, wind energy became the top supplier, providing 21.1% of the country’s overall electricity demand. In Ger-many, wind peaked at 59% of electricity demand for some one-hour periods, a performance matched by the US state of Colorado (60%). In Denmark, wind energy provided on average more than 30% of de-mand during the year, and hit a record of 90 hours during which wind energy production was higher than demand, peaking at an oversupply of 122%[1].
In the light of political targets to further increase the share of renewable energy in power systems, more regions of the world will see increasing average shares of wind power. Even more importantly, we will increasingly see situations of extreme over- or under-supply due to fluctuations in wind power pro-duction. This makes the operation of power systems more challenging. In general, power systems need to serve two basic requirements:
1. power should be available on demand; and
2. the voltage delivered to consumers should remain stable.
Power systems were originally designed around large-scale synchronous generators in the form of controllable thermal power plants. Wind power plants (WPPs), however, are asynchronous genera-tors. Integrating large shares of asynchronous gen-eration requires new approaches and solutions [2].
The integration of wind into today’s energy systems has three aspects that are separate, though related. The first is network integration. WPPs are typically sited in the best wind locations, which often do not coincide with centres of consumption or the avail-ability of sufficient existing grid capacity. To make best use of wind energy potential, sufficient grid capacity needs to be available to export power, and transmission bottlenecks should be minimised. With increasing shares of wind energy in the system, the existing infrastructure is challenged in some regions, at both medium- and high-voltage levels.
The second aspect relates to long-term and me-dium-term integration. Wind energy production can be highly variable, depending on the wind resource availability. At times each WPP will gen-erate at maximum capacity, yet on other occasions it will produce nothing. Sufficient alternative gen-eration capacity – or demand response – must therefore be available during times of low or no wind energy production. In the long term, ade-quate investment incentives must be provided for controllable backup power in order for sufficient capacity to be made available to the market. In the medium term (i.e. day-ahead), the expected ramping up and down by WPPs must be mirrored by sufficiently flexible units that can be dispatched so as to maintain the balance between power pro-duction and demand.
The third aspect relates to short-term integration. Here, the forecast errors in wind energy generation lead to mismatches between forecast and actual wind production, and hence to unexpected fluctu-ations in the power supply. This poses a challenge to system balancing. In the very short term – from seconds to minutes – the power system needs fast control in order to balance demand and supply and so maintain a stable voltage. To make this possible, the system operator requires access to sufficient re-serves and other services that are collectively known as ancillary services.
The focus of this chapter is mostly on short-term integration issues and the corresponding need for ancillary services. Here we should remember that policy and regulation influence the need for bal-ancing. Shorter gate-closure times in the power market, for instance, allow better forecasting and create the opportunity to re-dispatch generators before the need for balancing arises. Allowing new actors into the market, especially from the demand side, also helps providing the required services at the lowest possible cost.
Balancing energy systems with high shares of wind powerIn power systems, balancing is traditionally done by dedicated power capacity reserves. The details of how control is achieved are different for each

DTU International Energy Report 2014
Challenges and solutions for energy systems with high shares of wind energy — Page 65
system, depending on the reliability criteria de-fined for the system, the way reserves are traded in markets, and the extent of trading between neigh-bouring systems [3].
Wind energy increases the need for balancing be-cause of the wind power forecast error. Unexpected decreases in wind power production have the same effect as unexpected increases in demand. Experi-ence from Europe shows that wind shares of up to 20% may not require additional primary control capacity as long as the wind capacity is geograph-ically distributed over a wide area [2]. However, mismatches between forecast and actual wind power production will eventually have to be han-dled through balancing, and in particular via the secondary control capacity.
The largest challenges in integrating wind energy typically arise in situations which combine high wind production, low demand, limited or inflexible trade with neighbouring power systems, and low flexibility in the power plants that are operating or otherwise available [3].
So what can be done to balance energy systems with very high shares of wind? There are five main options:
1. Well-integrated grids with good interconnec-tions reduce balancing needs. Geographically large balancing areas decrease the need for balancing by evening out deviations in both demand and wind production. Increasing the geographical areas from which control capac-ity (reserves markets) can be obtained will decrease the costs of system operation, since it makes lower-cost options more accessible.
2. Good interconnections with the heat sector will reduce balancing needs in the power system. With combined heat and power (CHP) units as well as electrical boilers and heat pumps link-ing the heat and power sectors, the heat system can be used to counterbalance fluctuations on the power side, especially when heat storage is abundant.
3. Demand response will reduce balancing needs on the supply side.
4. Large-scale electricity storage can provide additional control capacity that could replace the need for flexible thermal power generation. The prospect of a large fleet of electric cars and an increasing share of heat pumps for domestic heating could be especially important in this respect.
5. WPPs themselves can deliver some ancillary services.
The large-scale integration of wind power into power systems will require us to find integrated regulation strategies for the whole energy system – a process that is likely to require all the options mentioned above. Wind power plants will have to play a role not only in producing energy, but also in delivering ancillary ser-vices. The following sections address this in more detail.
Ancillary servicesThis section provides an overview of the need for ancillary services in power systems, how this is af-fected by increased wind power penetration, and the potential for WPPs to provide these services.
The purpose of ancillary services from power gener-ating units is to ensure that the power system operates securely to provide reliable, high-quality power to customers via the grid. Ancillary services are vital because power systems are complex and vulnera-ble, and require appropriate operational rules and control systems to ensure their operational security and stability.
According to CIGRE [4] “definitions for ancillary ser-vices can differ significantly based on who is using the terms. While some definitions emphasise the importance of ancillary services for system security and reliability, others mention the use of ancillary services to support electricity transfers from gener-ation to load and to maintain power quality.” That distinction notwithstanding, ancillary services are usually understood as those services that are needed to ensure the power system stability as defined jointly by IEEE and CIGRE [5].

DTU International Energy Report 2014
Page 66 — Challenges and solutions for energy systems with high shares of wind energy
When the various definitions are translated into specific types of ancillary services, individual trans-mission system operators (TSOs) may include more or fewer of these specific types. This is not only be-cause of differences in the definitions, but also partly because some of the required properties of gener-ating plants are embedded in conventional power plants based on directly grid connected synchronous generators. TSOs of power systems with large shares of renewables, on the other hand, require new ancil-lary service products, because the modern installed renewable plants use power converters instead of directly connected synchronous generators.
Types of ancillary servicesThe most commonly discussed and generally ac-cepted ancillary services belong to the group known as active power reserves. These services are by nature related to the balancing described above, but whereas balancing focuses on the economic unit commit-ment and dispatch of individual generating plants, the purpose of reserves is to cope with imbalances that were not known when the power was traded on the day-ahead and possibly intra-day markets. Such imbalances typically occur due to errors in forecasting power demand and production; to rapid and unexpected plant shutdowns (“trips”), and to contingencies in the grid. The grid needs reserves that can respond quickly enough to cope with such unexpected imbalances.
In the past, active power reserves were categorised into primary, secondary and tertiary reserves, based on the sequence in which they were expected to operate. However, the definitions of those catego-ries have sometimes been confused. In 2007, the European transmission system operators (ETSO) [6] introduced an alternative categorisation of active power reserves based on the process that the reserve supports. This definition distinguishes frequency containment reserves (FCRs), frequency restoration reserves (FRRs), and replacement reserves (RRs). In this section we will use these categories, with the updated definitions from the ENTSO-E glossary [7].
In Denmark, Energinet.dk has published an ancillary services strategy for 2011–2015 [8]. This strategy de-fines “properties required to maintain power system
stability today” as a group of services that “are re-quired to ensure safe operation of the main power system and are not procured in the reserves market”. This group of services include short-circuit power, continuous voltage control, voltage support during faults, and inertia. All of these are addressed below.
As mentioned above, large-scale penetration of re-newable power plants has also created requirements for new ancillary services products, as exemplified by Irish [9], British [10], and Texan [11] grid codes. The new services addressed in this section are fast frequency response and inertia support, synchronis-ing power, and power oscillation damping.
Frequency containment reserves (FCRs)According to the ENTSO-E glossary [7] “frequency containment reserves (FCRs) means the operational reserves activated to contain system frequency after the occurrence of an imbalance.” FCRs are activated automatically as a response to frequency changes. FCRs are traditionally referred to as “primary re-serves”.
FCRs were introduced as an integral part of a large WPP for the first time at the Horns Rev offshore wind farm [12] and are now a feature of many modern WPPs. However, as far as WPPs are concerned, FCRs are usually only available as “down reserve”: a re-duction in supply to correct overfrequency on the grid. This is because wind power plants normally operate at their maximum possible output under the prevailing wind conditions, so they cannot provide “up reserves” to correct underfrequency when de-mand exceeds supply.
It is technically feasible to combine downward FCRs from WPPs with upward FCRs from flexible consump-tion (demand management) [13]. Another techni-cally feasible solution is to run WPPs in such a way that they are continuously down-regulated under normal conditions, allowing output to be increased when necessary. Because this involves the non-pro-duction of wind power that is actually available, it will usually only be profitable when power prices are zero or negative. Running a WPP in down-regu-lated mode requires a reliable estimate of the max-imum power available under the prevailing wind

DTU International Energy Report 2014
Challenges and solutions for energy systems with high shares of wind energy — Page 67
conditions, so as to make sure that the plant can actually provide its quoted reserve if necessary [14].
For a power system to be secure, enough FCRs must be available to handle any unexpected events, typically within 15 minutes. Today, the required amount of FCRs is shared between the TSOs in each synchronous area; the total corresponds to the size of the largest generation unit in the area, since the sudden loss of this unit is taken as the worst case. An individual TSO in a large synchronous area typically is required to provide only a fairly small amount of FCRs.
Power system studies usually assume that wind power will not influence the amount of FCRs needed. However, recent research has shown that the planned development of offshore WPP capacity in the power systems of northern Europe will increase the need for FCRs in the medium to long term (between 2020 and 2030) [15]. This is because the predicted massive concentration of WPP capacity will cause unpredicted changes in power delivery within 15 minutes, to an extent that will sometimes exceed the amount of FCRs available at present.
The amount of extra FCRs required by 2030 to cope with offshore wind power will vary according to the weather. In calm periods, when wind production is low, the need for extra FCRs will be modest; during strong winds it could be much higher. Since making FCRs available costs the TSOs money, we recommend the development of a new way to estimate the weath-er-dependent need for FCRs. For much of the time, a sufficiently accurate model could save money by reducing the required amount of FCRs.
Frequency restoration reserves (FRRs)According to the ENTSO-E glossary [7] “frequency restoration reserves (FRRs) means the active power reserves activated to restore system frequency to the nominal frequency.” FRRs are used not just to restore the frequency following upsets, but also to correct deviations from the scheduled power flows between different TSO areas.
Usually, FRRs should be fully activated within 15 minutes. This ensures that the previously activated FCRs are restored and allows the power system to
return from an “alert” state to normal operation after 15 minutes. In traditional terminology FRR covers both “secondary reserves”, which are acti-vated automatically, and “tertiary reserves”, which are traded on regulating power markets and thus activated manually. The term “contingency reserves” is also used [11].
The volume of FRRs needed depends on the share of wind power in the power system area. This is because the forecast errors typically increase with increased share of wind power, and FRRs are used to balance those forecast errors.
FRRs are usually provided by flexible conventional power plants, typically hydro power or gas-fired. FRRs can be imported from neighbouring power system areas if the interconnectors have sufficient capacity available. At present most power systems have enough FRRs; in northern Europe, for instance, Norwegian and Swedish hydro power provides FRRs in Denmark. In the future it will be important to maintain a flexible generation mix as wind power penetration increases, especially in electrical island power systems that are small synchronous areas such as Ireland, which cannot import FRRs.
When systems with high shares of wind power op-erate in conditions of high wind and low demand, economics indicate that the minimum possible number of conventional generators will be online, and that even these will operate close to their tech-nical minimum production limits. In such cases, provided that power prices are low or even negative, it may be profitable for WPP owners to provide down-regulation FRRs. Under most conditions, however, it is not profitable to provide FRRs from wind power.
As with FCRs, providing upward FRR from WPPs is technically feasible but generally not profita-ble, because this would require wind energy to be spilled continuously during normal operation. De-mand-side management is a much more favourable solution for upward reserves.
The EU-supported REserviceS project studied the benefits of providing reserves from renewables in

DTU International Energy Report 2014
Page 68 — Challenges and solutions for energy systems with high shares of wind energy
three cases representing different types of systems: the island system of Ireland [16], the “end-of-line” peninsula represented by Iberia [17], and a large north European case covering Germany, Poland, the Netherlands, Belgium, France, Great Britain, Denmark, Norway, Sweden and Finland [18]. The results clearly show that the benefits of getting ser-vices from renewables increase significantly as the penetration of renewables grows.
As an example, in Iberia, with 42% renewables, the additional annualised investment cost of making services available from renewables was estimated at €240 million/y, with corresponding benefits of approximately €660 million/y. The results also in-dicate that the benefits are highest in island systems (Ireland) and lowest in larger strongly intercon-nected systems (the north European case). The pro-ject shows that although in today’s power systems providing reserves from renewables creates very little profit; this will change in future power systems with much larger shares of renewables.
Replacement reserves (RRs)According to the ENTSO-E glossary [7] “replacement reserves (RRs) means the reserves used to restore/support the required level of FRRs to be prepared for additional system imbalances.” The term “regulating reserve” is also used [11].
The activation of RRs does not depend on changes in frequency or deviations from scheduled flow be-tween power system areas, and activation times may be up to several hours.
In principle, the necessary volume of RRs depends on the level of wind power penetration in the power system area, in the same way as for FRRs. For RRs it also depends on the generation mix in the system, however, because RRs are only needed if not enough non-activated FRRs are available. If baseload gener-ation comes from flexible hydro power plants, for example, these can provide high levels of FRRs, so there is no need for additional RRs. If the baseload units are inflexible nuclear plants, on the other hand, then the limited volume of FRRs needs to be restored by activation of RRs.
WPPs are rarely used to provide RRs. It is generally more attractive for WPPs to provide the short-term FRRs than the longer-term RRs.
Short circuit powerExisting power systems need the service known as short circuit power to maintain voltage during mo-mentary short circuits and ensure that protective equipment isolates the fault.
In the long term, the development of new smart pro-tection systems has the potential to eliminate at least some of the need for short circuit power.
Short circuit power is not always explicitly mentioned as an ancillary service, because it is embedded in synchronous generators and therefore sometimes taken for granted. A synchronous generator is able to provide a short circuit current many times greater than the rated current of the generator.
Power converters connecting modern wind turbines to the grid control the amount of current entering the grid. Today it is common practice to use this control to inject a certain short circuit current during voltage dips. Yet even when they are temporarily overloaded, wind turbine converters supply significantly less short circuit power than is available from synchronous gen-erators.
It is technically possible to provide more short circuit power from wind turbines by increasing the size of the grid-side converters, but this is not an economically sound solution. From an economic point of view it is also important to know that the need for short circuit power varies across the grid, so a general requirement for short circuit power from any generation unit will give rise to unjustified investment costs.
A more economical way to add short circuit power is to install synchronous condensers where needed. A synchronous condenser is a rotating machine that acts as an idling motor, giving control of reactive power and providing short circuit power. The Dan-ish TSO recently installed a synchronous condenser with the main purpose of ensuring sufficient short circuit power.

IRPΔ
1pu
∆P
SPPΔ
PODQΔI
P PODΔP
IR controllerIR controller
SP controllerSP controllertime
Load Angle
WPP power output
Active Power or Current Magnitude
WPP Active or Reactive Power output
Grid Frequency
WPP power output
time
time
time
time
time
POD controllerPOD controller
fΔ
dtdf /
Δδ
Δθ
IRPΔ
1pu
∆P
SPPΔ
PODQΔI
P PODΔP
IR controllerIR controller
SP controllerSP controllertime
Load Angle
WPP power output
Active Power or Current Magnitude
WPP Active or Reactive Power output
Grid Frequency
WPP power output
time
time
time
time
time
POD controllerPOD controller
fΔ
dtdf /
Δδ
Δθ
IRPΔ
1pu
∆P
SPPΔ
PODQΔI
P PODΔP
IR controllerIR controller
SP controllerSP controllertime
Load Angle
WPP power output
Active Power or Current Magnitude
WPP Active or Reactive Power output
Grid Frequency
WPP power output
time
time
time
time
time
POD controllerPOD controller
fΔ
dtdf /
Δδ
Δθ
DTU International Energy Report 2014
Challenges and solutions for energy systems with high shares of wind energy — Page 69
Continuous voltage controlVoltage control is traditionally provided to the transmission grid by conventional power plants equipped with synchronous generators. Modern WPPs also provide voltage control; if the wind tur-bines do not have sufficient reactive power capac-ity to support the voltage, then auxiliary reactive power equipment is used. Shunt capacitors and static VAR compensators (SVCs) are the cheapest solutions for this purpose.
Voltage control must be supplied close to where it is needed. WPPs are typically connected either to the distribution grid (onshore turbines) or to distant parts of the transmission grid, far from its
Figure 24 – A possible inertia response (IR) controller in a WPP.
Figure 25 – Synchronising power controller in a WPP.
Figure 26 – A WPP can be used as a damping device to control power oscillations.
“backbone” (offshore turbines). This means that voltage support from new WPPs may not be adequate over the entire transmission grid as the share of wind power increases. Under these conditions auxiliary reactive power may be needed in the transmission grid at locations where it cannot be supplied by a generating plant. SVCs will typically be the solution in such cases.
Voltage control during faultsTo prevent the voltage from dropping too low under fault conditions, the generation units need to inject reactive current into the fault. This is very similar to the need for short circuit power described above. As with short circuit power, reactive current can be

DTU International Energy Report 2014
Page 70 — Challenges and solutions for energy systems with high shares of wind energy
supplied by synchronous generators and, to a lesser extent, by wind turbine converters.
The first grid codes required only that wind power plants were capable of “riding through” grid faults. Most grid codes today, however, include specific requirements for the injection of current during and immediately after voltage dips. The aim is normally to ensure that enough reactive power is injected to support the voltage during the fault and immedi-ately after it is cleared. Some grid codes, however, give higher priority to injecting active current than reactive current. This is because the TSOs in question consider frequency stability (which is controlled by active current) to be at greater risk than voltage stability (controlled by reactive current).
Where wind turbines do not have enough reactive power capacity to support the voltage, auxiliary equipment is used. Shunt capacitors and SVCs are usually not sufficient in this case, because their re-active power capacity is proportional to the square of the voltage, so it falls significantly during voltage dips. Static synchronous compensators (STATCOMs) are more suitable because their reactive power capac-ity is proportional to the voltage, but the technically ultimate solution is a synchronous condenser.
Black start capabilityAlthough TSOs have extensive plans to prevent sys-tem blackouts, it is never possible to avoid the threat completely. In the event of a blackout, the system must be restored using generation units with “black start” capabilities.
Some grid codes, such as those used in the UK [10], require black start capability from WPPs. However, most TSOs do not want to use WPPs when restoring the system after a blackout, because the restoration process is often vulnerable to fluctuations in power.
Fast frequency response and inertia supportAs the penetration of wind power increases, the iner-tia embedded in power systems is decreasing. Inertia is an inherent property of conventional power plants with synchronous generators, but not of renewable generators connected through electronic converters.
Lower inertia means that under sudden load in-creases the frequency can dip very low, possibly causing under-frequency relays to trip generation units – which of course make the problem worse.
The negative rate of change of frequency (ROCOF) can also become critically high, tripping generation units connected to the distribution network, where ROCOF relays are often used to protect against unin-tentional islanding. (In the long term, new intelligent islanding detection systems have the potential to replace ROCOF relays.)
The loss of inertia in the power system due to the displacement of conventional power plants by WPPs has created a need for a new ancillary service to replace it. Thanks to the fast response time of WPP controllers and the energy stored in wind turbine rotors, it is technically feasible for WPPs to provide rapid, temporary power injection to limit both fre-quency error and ROCOF.
Figure 24 illustrates a possible inertia response (IR) controller in a WPP. Whereas embedded iner-tia responds immediately to ROCOF (df/dt), the IR controller will respond after a delay of a few line periods.7 The IR controller also responds to the frequency error Δf in a way similar to that used by a conventional speed governor to provide FCRs. However, power injection from the WPP can only be temporary – otherwise the wind turbines would lose too much rotational speed and therefore also their aerodynamic torque.
Synchronizing powerSynchronising power (SP) is an embedded feature of synchronous generators. It reduces the load angle between groups of synchronous generators in the power system. If the load angle becomes too high, the synchronous generators will lose torque and the system becomes unstable; at that point it needs to separate into two parts to avoid pole slipping and con-sequently oscillations and damage to the drive trains.
As with other types of reserves, an increase in the share of converter-connected renewable genera-tion decreases the amount of synchronising power
7. A line period is 20 ms in a 50 Hz system.

DTU International Energy Report 2014
Challenges and solutions for energy systems with high shares of wind energy — Page 71
available on the system. As a result, it may be nec-essary to introduce synchronising power as a new ancillary service product.
Figure 25 illustrates a synchronising power controller in a WPP. The controller responds to changes in either the rotor angle or the voltage angle at the point of connection of the WPP.
Power oscillation dampingPower oscillation damping is typically a feature embedded in the power system stabiliser (PSS) of synchronous generators. It damps the power oscil-lations in the power systems. Figure 26 illustrates how a WPP can be used as a damping device instead for a PSS. As depicted in the figure, the oscillations in the system can be damped by modulating either active or reactive power of WPP.
ConclusionThe largest challenges in the integration of wind energy typically arise in situations when there is high wind production, low demand, limited or inflexible trade with neighbours, and low flexibility in the other power plants connected to the system.
The solution to this balancing challenge has to be based on a mix of technical solutions and market incentives:• To make optimal use of the wind energy poten-
tial, sufficient capacity needs to be available to export power, and transmission bottlenecks should be minimised.
• In the long term, adequate investment incen-tives must be provided for controllable backup power, so that sufficient capacity can be made available to the market.
• In the medium term (i.e. day-ahead), the expected ramping up and down by WPPs must be mirrored by sufficiently flexible units that can be dispatched so as to maintain the balance between production and demand.
With respect to the ancillary services provided by WPPs, the general conclusion is that there are already technically feasible solutions based on a combination
of WPPs, demand-side response and auxiliary equip-ment. At the end of the day, the main technical and economic challenge is to ensure that these ancillary services are provided at the lowest cost that does not compromise system security or reliability. There is a need for R&D to ensure such development of suitable technology for future wind power plants and power systems.
The solutions adopted depend very much on the in-dividual types of ancillary services required:• Power reserves are by far the most costly an-
cillary service. The need for power reserves is currently not affected by wind power, but it will increase significantly in the medium to long term as power systems acquire massive amounts of renewable energy. Wind power can and should contribute to power reserves, possibly in combination with demand-side response, but there is also a need to ensure that future power systems retain a flexible generation mix.
• Short circuit power, continuous voltage control and voltage control during faults must be pro-vided locally. It is technically feasible and profita-ble to provide many of these forms of regulation from new wind power plants, but there will also be a need to install auxiliary equipment like shunt capacitors, reactors, SVCs, STATCOMs and syn-chronous condensers, independently of WPPs.
• Enhanced ancillary services will be needed in the future to ensure security when power systems are running with very low shares of syn-chronous generation. Under these conditions, power systems might otherwise lack sufficient inertia, synchronising power, and damping to prevent power oscillations.
• In the long term, the development of new smart protection systems may remove or mitigate some of the present needs for ancillary services. Replacement of existing overcurrent protection, for example, can reduce the need for short circuit power. Advanced islanding detection can replace existing ROCOF relays and thus reduce the need for very fast inertial response services.

Chapter 10
Wind resource assessment and wind power forecastingBy Henrik Madsen, Juan Miguel Morales and Pierre-Julien Trombe, DTU Compute; Gregor Giebel and Hans E. Jørgensen, DTU Wind Energy; Pierre Pinson, DTU Electrical Engineering

DTU International Energy Report 2014
Wind resource assessment and wind power forecasting — Page 73
→ What will be the cornerstone of grid oper-ators, balance responsible parties, energy policymakers, investors and traders in fu-
ture energy systems with large shares of fluctuating renewables like wind, wave and solar power?
To answer this question, let us look more closely at two of the major changes that the large-scale deployment of renewable energy and more par-ticularly wind energy, have already introduced in some countries and will produce in many other areas in the not so distant future.
In the first place, the power systems of the future will move away from the traditional pattern of cen-tralised power plants towards more flexible decen-tralised structures. Smaller power plants in the form of individual wind turbines, or clusters of turbines, will be spread over larger areas in order to harvest the wind resource in places offering the best en-ergy potential – balanced against economic viability, technical feasibility and environmental impact. At the same time, solar power panels will appear even in large cities.
The second change is inherent in the nature of the wind resource, which differs radically from con-ventional fossil fuels in two aspects. First, wind is highly nondispatchable, meaning that the output power of a wind farm can only be regulated (through curtailment) at the expense of lost power production. Second, wind is variable in both time and space, and can be predicted only with limited accuracy.
These changes imply that current practices for op-erating power grids and energy systems will most likely have to be revisited in order to integrate larger amounts of power from weather-dependent sources of energy. Coming back to our initial question, we can say without much doubt that the cornerstone of all the energy players’ activities will be the use of advanced decision support systems capable of processing large quantities of information, and of de-livering unique insights for managing power systems and mitigating the impact of weather variability. Such systems will include wind resource assessment and forecasting tools similar to those that we will present in the remainder of this chapter.
Advanced decision support systems form only a part of the solution for the large-scale decarbonisation of the energy system. Their effects will be magnified when used in combination with promising technolo-gies such as energy storage systems and demand side management (control of electricity consumption) (Meibom et al., 2013).
Wind resource assessmentInvestment decisions in wind power are driven to a large extent by the available wind resources at the sites under investigation. There are usually two steps to this. First, a wind atlas is made for a coun-try or region (Petersen and Troen, 2012). Based on this wind speed map, an investor can find the most likely places to explore properly. But a wind farm resource study based on a wind atlas alone is not usually considered enough to obtain funding from the banks. The second step is therefore to take on site measurements.
Best practice for measurements at the site of a pro-jected wind farm is to use a meteorological mast as tall as the intended hub height of the turbines, and to measure wind speed at several heights including the World Meteorological Organisation standard height of 10 m above ground level. Measurements should be taken for at least a year, and preferably sev-eral years so as to account for climatological effects. Those measurements are then fed into a microscale wind flow model, which calculates the annual energy production (AEP) of the proposed wind farm, with some assumptions about turbine type, hub height and precise location. The flow models used vary significantly in accuracy and complexity. Linear flow models, which are essentially based on the mass consistency of the airflow, do well in gentle terrain without steep hills or large changes in roughness (like forest edges or land-sea borders). More com-putationally intensive models, such as those based on computational fluid dynamics (CFD), Reynolds Averaged Navier-Stokes (RANS) or large eddy sim-ulation (LES) algorithms are required for complex terrain, increasing the calculation time by a factor of 1,000 or more.
The most recent example of a wind atlas is the Wind Atlas for South Africa (WASA; www.wasaproject.info).

DTU International Energy Report 2014
Page 74 — Wind resource assessment and wind power forecasting
In 2008 the government of South Africa, funded by the Danish Embassy, commissioned the most com-prehensive wind atlas of the country to date. DTU Wind Energy, in conjunction with local partners, installed 10 tall met masts across the most populated areas of South Africa. Data collected over three years was fed into the Weather Research & Forecasting (WRF) model, which yielded a forecast spanning eight years with a 3 km horizontal resolution for the wind atlas (Figure 27), and a second 24-year forecast at 9 km resolution for variability studies and long-term corrections. This allowed good verification of the results against the measured data.
The method used to produce the wind atlas is based on a generalisation of wind climatologies derived from mesoscale modelling. This post-processing generalised method has been used extensively in a number of wind resource assessment studies, particularly within the KAMM-WAsP method (see below). This is the first wind atlas study to use this generalisation on the WRF-model output.
A speciality of the WASA is that it includes a detailed wind resource study produced by coupling the calcu-lated regional wind fields to a microscale wind flow modelling program known as WAsP (www.wasp.dk). Since the 1980s, this flow model and associated soft-ware has been a standard way to calculate the wind resource at a specific turbine site in the vicinity of a meteorological mast. In the WASA, a full WAsP analy-sis was done on a 250 m grid for the whole coloured region (Figure 27), so the siting of wind turbines can start directly from a calculated wind climate at any place covered by the wind atlas.
This was a considerable help to the fledgling South African wind power industry. According to the South African Wind Energy Association: “In 2011 there were eight wind turbines in the country but today five wind farms [are] in full operation, 15 more [are] under construction and a further seven [are] about to reach financial closure. Together, these would provide 1,983 MW of power to the national grid.” (IOL, 2014).
Figure 27 – Mean wind speed at 100 m above ground in most of South Africa.
Mean wind speed at 100 m above ground in most of South Africa, modelled by WAsP. The black dots represent the locations of the meteorological masts used for verification.

DTU International Energy Report 2014
Wind resource assessment and wind power forecasting — Page 75
The next step in wind atlas work will be the new Euro-pean Wind Atlas, which will address not only the wind resource in the target area but also such issues as the predictability of the wind, turbulence, the mechanical loads on wind turbines, the probability of icing, and other influences on the installation or operating cost of wind power plants. Additionally, the science in the calculation chain, especially at the interfaces between mesoscale and microscale modelling, will be inves-tigated in more detail, and the whole flow modelling chain will be validated and assessed using a number of dedicated measurement campaigns.
Wind power forecastingAssessing the wind resource essentially consists of estimating the unconditional distribution of the wind and the corresponding power that can be generated from it. However, many operational problems involv-ing wind energy require information on the dynamic behaviour of the wind, and hence its conditional dis-tribution in space and time – especially in terms of the future output power of wind power plants.
A recent survey revealed that 94% of transmission system operators (TSOs) think that integrating sig-nificant amount of wind power into power systems will largely depend on the accuracy of wind power forecasts (Jones, 2010). Software for online wind power forecasting at both wind farm and regional levels has been used in Denmark since the mid-1990s (Madsen et al., 1994).
Wind power forecasting systems are extensively used in countries that already have significant wind power penetration, such as Denmark, Spain and Germany, with respective levels of 33.2%, 16.3% and 10.8% (Wilkes and Moccia, 2013). These systems tradi-tionally rely on both meteorological and statistical approaches. They use meteorological models to describe the physics of the atmosphere. Statistical models then take the meteorological forecasts as input to improve their calibration, converting wind speed forecasts to power forecasts. Finally, the pro-grams quantify the inherent uncertainty of their deterministic forecasts.
It has been demonstrated that using several me-teorological forecasts as input leads to significant
improvements in forecast accuracy. Nielsen et al. (2007) found that the use of two or more meteoro-logical forecasts produced a 10–15% improvement in the accuracy of forecasts of wind power production for the Klim wind farm (Figure 28) in Denmark. The left panel shows the predictive performances of single meteorological forecasts while the right panels show their corresponding performance when these forecasts are combined 2 by 2 or 3 by 3. These forecasts are produced by three different models, namely the Deutscher Wetterdienst (DWD) model, the HIRLAM (HIR) model from the Danish Meteor-ological Institute, and the MM5 model which is the fifth generation of NCAR Mesoscale Model. The best results (that is, lowest RMS score) are obtained when 3 meteorological forecasts are combined. For an overview of the challenges in wind power forecast-ing from a physical perspective, we refer to Focken and Lange (2006). Likewise, Pinson (2013) discusses wind power forecasting challenges from a statistical perspective. In the remainder of this chapter we focus on some of the most important characteristics of wind power forecasts.
Wind power forecast characteristicsDifferent wind integration problems call for different types of wind power forecasts. More specifically, these forecasts should be generated with charac-teristics that meet the requirements specified by end-users (Nielsen et al., 2011). These characteristics include the scale in time and space, the forecast lead time (often referred to as the forecast horizon), and the update frequency.
Timescale: Wind power developments have histori-cally focused on methodologies for generating hourly wind power forecasts (Giebel et al., 2011). This is most likely due to the structure of the electricity markets, which trade electricity over time units of one hour. However, experts in energy management have argued that increasing the scheduling frequency of electricity generation and delivery from hours to minutes would greatly facilitate the balancing of production and con-sumption (Energy GE, 2010). Grid operators agreed that a sub-hour approach would be helpful when han-dling large amounts of wind power in power systems (Jones, 2011). This calls for new approaches capable of capturing the intra-hour variability of wind power

0 3 6 9 12 15 18 21 24
2,0
002,
500
3,0
003,
500
RM
S (k
W)
Hours since 00Z Hours since 00Z
0 3 6 9 12 15 18 21 242,
000
2,5
003,
000
3,5
00
RM
S (k
W)
DWD DWD.HIRDWD.MM5(grd)DWD.MM5(lp)HIR.MM5(grd)HIR.MM5(lp)MM5(grd).MM5(lp)DWD.HIR.MM5(lp)
HIRMM5 (grd)MM5 (lp)
DTU International Energy Report 2014
Page 76 — Wind resource assessment and wind power forecasting
All the forecasts were produced with WPPT (Wind Power Prediction Tool: www.enfor.dk/products/wppt.html) but with different meteorological forecasts used as input. (left) Forecasts from a single meteorological input. (right) Forecasts with various combinations of meteorological forecasts as input. The models used to generate the different meteorological forecasts were DWD (Deutscher Wetterdienst), HIRLAM (Danish Meteorological Institute) and MM5 (the fifth generation of the NCAR Mesoscale Model). The best forecast performance is seen when DWD, HIR and MM5 inputs are combined in the WPPT forecasting software.
generation, potentially through the use of new data sources such as weather radar observations (Trombe et al., 2013).
Frequency update: The underlying philosophy in statistical forecasting is to use historical data to train models that then predict the future. As time passes, changes in several “hidden factors” influ-ence the generation of wind power. One of these hidden factors is the response of the wind turbine fleet to the wind flow (i.e. the power curve), which changes over time as new turbines are added and other turbines grow old. It is also well known that dirty turbine blades can decrease production by up to 20%. Changes in the roughness of the surround-ings (e.g. trees dropping their leaves) also require rapid updates to the forecasting models. In a context where the timely delivery of forecasts to end-users is crucial, it is essential to develop forecasting schemes that can be updated rapidly, without the need to repeat the time-consuming training stage. Such schemes can be set up through the use of adaptive and recursive estimation methods (Madsen, 2008; Møller et al., 2008; Pinson, 2012).
Horizon: Wind is variable on a wide range of times-cales, from minutes to years. Accurate wind power
Figure 28 – Forecasts for the Klim wind farm in Denmark.
forecasts are therefore needed over many different time horizons. Forecasts up to six hours ahead allow optimal management of reserve capacities in the event that one or more power plants fail to meet their scheduled production. Forecasts in the range 0–48 hours are needed to participate in electricity mar-ket auctions and dispatch the electricity produced. Forecasts on timescales of weeks and months are needed to plan maintenance of wind power plants and transmission lines.
From point to probabilistic forecasts“Point forecasts” are single-valued: they specify only the expected or most likely value of the system under investigation. In wind energy there is a long tradition of using point forecasts for dispatching and trading activities, for instance (Giebel et al., 2011).
However, such inputs are known to be suboptimal for many operational problems, since they only give a very limited account of what can happen in the future. Indeed, forecasts of stochastic processes – such as those that depend on the weather – are by nature uncertain.
The real value of a point forecast can therefore only be appraised when the forecast is presented

5 10 15 20 25 30 35 40 450
10
20
30
40
50
60
70
80
90
100
look−ahead time [hours]
pow
er [%
of
Pn]
90%80%70%60%50%40%30%20%10%pred.meas.
5 10 15 20 25 30 35 40 450
10
20
30
40
50
60
70
80
90
100
look−ahead time [hours]
pow
er [%
of
Pn]
90%80%70%60%50%40%30%20%10%pred.meas.
DTU International Energy Report 2014
Wind resource assessment and wind power forecasting — Page 77
Source: Pinson et al., 2007.
Figure 29 – Point and probabilistic forecasts of wind power generation versus measurements.
with information quantifying its uncertainty in the form of a predictive quantile, interval or even the full density distribution (Figure 29) (Pinson, 2013). Nowadays the focus is on new research areas such as probabilistic estimation frameworks based on stochastic differential equation (SDE) models (Møller et al., 2013; Iversen et al., 2014); models that can account for spatio-temporal correlations in wind power forecast errors in a probabilistic fashion (Tastu et al., 2014a); and the integration of probabilistic forecasts into decision-making problems, particu-larly electricity markets (Morales et al., 2014).
From probabilistic to scenario forecastsProbabilistic forecasts as illustrated in Figure 29 do not describe how prediction errors persist in time. A full description of this persistence is very important for applications containing start-stop or storage con-siderations, among others. Pinson et al., 2009, and Nielsen et al., 2011 demonstrated that neglecting the existence of this persistence could imply seriously wrong decisions on the size of a storage system.
The most advanced forecast product that is currently available for wind power prediction software, both in the technical literature and on the market, is what operations researchers call a scenario (Pinson, 2013).
A scenario is essentially a plausible conditional realisa-tion of a stochastic process – describing, for instance, the power output of a particular wind farm over time.
In the same manner that the outcome of a random variable is a single value, the outcome of a stochastic process is a scenario: a series or time-indexed vector of values representing a potential time evolution of the stochastic process. An infinite number of sce-narios is thus theoretically required to carry the full information – predictive densities, time dependence of forecast errors, etc. – about the stochastic process they represent.
The concept of a scenario can be easily extended to multivariate stochastic processes, when describing, for example, the power outputs of various geographically dispersed wind farms. In such a case, each scenario sampled from the multivariate stochastic process represents a plausible spatiotemporal evolution of the process. An example of such scenarios is given in Figure 30 for two regions of Denmark. Two dif-ferent techniques are used for generating a set of 5 scenarios for lead times up to 43 hours ahead. The first technique does not take into account the spa-tio-temporal dependencies between the 2 regions whereas the second technique does. The resulting

0 10 20 30 40
020
4060
8010
0
horizon [hours]
pow
er [%
Pn]
90%80%70%60%50%40%30%20%10%pred.meas
Scenario 1Scenario 2Scenario 3Scenario 4Scenario 5
0 10 20 30 40
020
4060
8010
0
horizon [hours]
pow
er [%
Pn]
90%80%70%60%50%40%30%20%10%pred.meas
Scenario 1Scenario 2Scenario 3Scenario 4Scenario 5
0 10 20 30 40
020
4060
8010
0
horizon [hours]
pow
er [%
Pn]
90%80%70%60%50%40%30%20%10%pred.meas
Scenario 1Scenario 2Scenario 3Scenario 4Scenario 5
0 10 20 30 40
020
4060
8010
0
horizon [hours]
pow
er [%
Pn]
90%80%70%60%50%40%30%20%10%pred.meas
Scenario 1Scenario 2Scenario 3Scenario 4Scenario 5
DTU International Energy Report 2014
Page 78 — Wind resource assessment and wind power forecasting
sets of scenarios are more consistent in space and do not evolve as random walks when respecting spati-otemporal dependencies. Scenarios are also referred to by meteorologists as ensemble forecasts, and by forecasters as path-time trajectories.
Scenarios have been widely used by researchers and practitioners to model wind power. The reason for their well-deserved popularity is that the informa-tion contained in a good set of wind power scenarios can be fully exploited by techniques of optimisation under uncertainty, in particular by stochastic pro-gramming, to build advanced tools for operating and planning energy systems. This has spurred re-searchers to design tools to generate good scenario representations of the wind power stochastic process.
Alongside scenario generation tools, scenario reduc-tion techniques have also been proposed. These aim to select a small subset of scenarios to render the associated stochastic programming problem com-putationally tractable, while retaining much of the information contained in the original much larger set (Morales et al., 2014).
Figure 30 – Scenarios generated for two areas in Denmark.
ConclusionMore than 30 years of research on wind resource as-sessment and wind power forecasting have led to the application of advanced tools for supporting decisions in the development as well as the operation phase of wind energy projects, including the siting of future wind farms or trading wind energy on energy mar-kets. Yet, many challenges remain in view of making wind energy more viable, cheaper and integrating larger amounts of wind power into power systems.
This chapter presented the future challenges for im-proving wind resource assessment and wind power forecasting tools. New and improved wind atlas is under developement. They will integrate an in-creased number of factors such as wind predictabil-ity, loads of the wind turbines or even the probability of icing. As for the wind power forecasting tools, the way forward is to develop better probabilistic forecasts, and develop solutions for integrating this type of information into decision- making problems.
Scenarios generated for two areas in Denmark; (left) ignoring spatio-temporal effects; (right) taking these effects into account.
Source: Tastu et al., 2014b.

Chapter 11
Wind economics By Poul Erik Morthorst and Juan Miguel Gonzales, DTU Management Engineering; Sascha Schröder, EWE NETZ GmbH, Germany

0
5
10
15
20
25
30
35
40
45
GW
Denmark
20052010
20152020
20052010
20152020
20052010
20152020
20052010
20152020
20052010
20152020
Germany Netherlands Spain United Kingdom
0
5
10
15
20
25
30
35
40
45
GW
Denmark
20052010
20152020
20052010
20152020
20052010
20152020
20052010
20152020
20052010
20152020
Germany Netherlands Spain United Kingdom
0
5
10
15
20
25
30
35
40
45
GW
Denmark
20052010
20152020
20052010
20152020
20052010
20152020
20052010
20152020
20052010
20152020
Germany Netherlands Spain United Kingdom
DTU International Energy Report 2014
Page 80 — Wind economics
→ Accumulated global installed capacity of wind energy has increased from approx-imately 48 GW in 2004 to more than 321
GW at the end of 2013, an annual growth of more than 20%. A large part of this development is of course driven by national and regional incentive schemes and subsidies. However, onshore turbines are to an increasing extent becoming economically competitive with conventional power production, especially when sited at locations with high wind speeds and in countries with comparatively high power prices.
Wind power is used in a number of different applica-tions, including both grid-connected and stand-alone electricity production, as well as water pumping. This section analyses the economics of wind energy pri-marily in relation to grid-connected turbines, which account for the vast bulk of installed turbines.
Renewables targets and supportThanks to its abundant resources and cost-competi-tiveness among renewable energy technologies, wind
Development of installed capacity in selected countries.
2005/2010/2015/2020
Offshore Onshore
Data: Beurskens et al. (2011)
power will be a cornerstone of the future energy sec-tor in the EU. Installed wind capacity across all the EU member states is expected to quintuple, to more than 200 GW, between 2005 and 2020 (Beurskens et al., 2011). The historical development pathways of wind power in different EU countries have var-ied considerably: early movers like Denmark had already achieved relatively large installed onshore capacities by 2005, whereas most other countries plan to carry on building new onshore wind farms until 2020 (Figure 31).
A similar development can be observed for offshore wind power, although again it differs between coun-tries. Denmark, which has been a forerunner, envis-ages the erection of a single new offshore wind farm by 2020, whereas the other countries bordering the North Sea plan to install dozens of GW between 2015 and 2020. These plans reflect both the space occupied by onshore wind power in these densely populated countries and the cost decreases expected for offshore wind power in the future. In summary, these factors are leading to a shifting ratio between
Figure 31 – Development of installed capacity in selected countries.
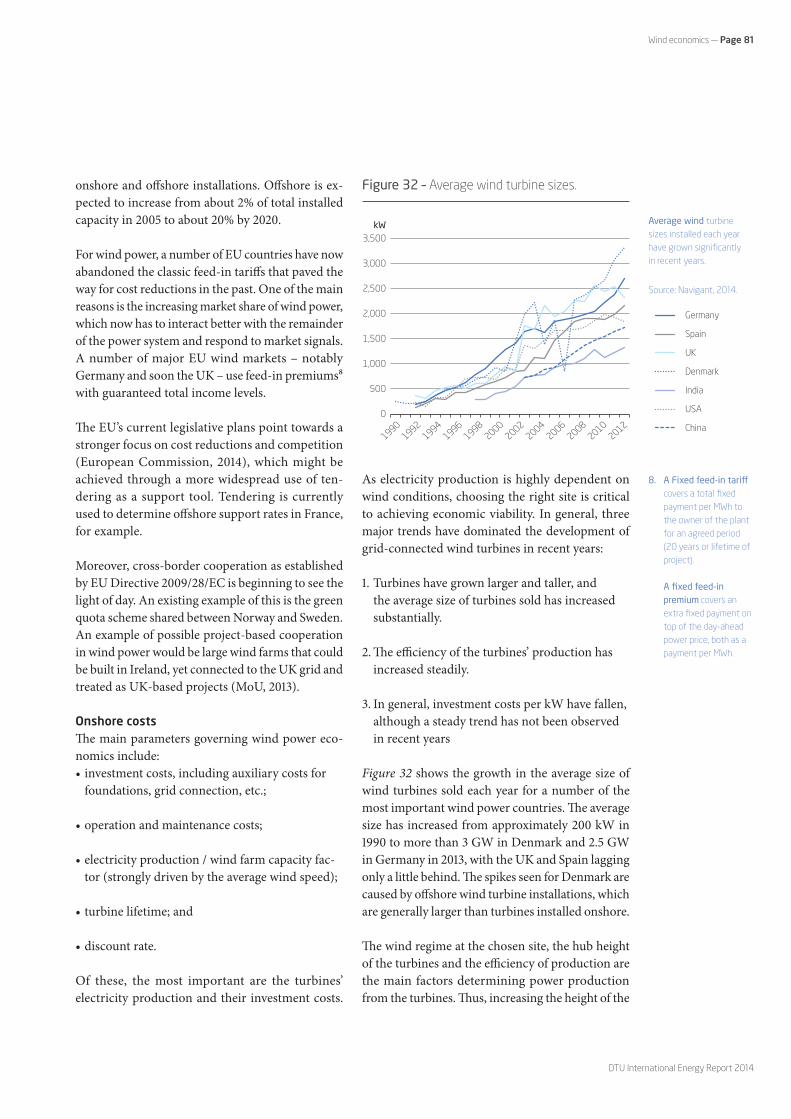
19901992
19941996
19982000
20022004
20062008
20102012
0
500
1,000
1,500
2,000
2,500
3,000
3,500kW
Germany
Spain
UK
Denmark
India
USA
China
19901992
19941996
19982000
20022004
20062008
20102012
0
500
1,000
1,500
2,000
2,500
3,000
3,500kW
Germany
Spain
UK
Denmark
India
USA
China
DTU International Energy Report 2014
Wind economics — Page 81
8. A Fixed feed-in tariff covers a total fixed payment per MWh to the owner of the plant for an agreed period (20 years or lifetime of project). A fixed feed-in premium covers an extra fixed payment on top of the day-ahead power price, both as a payment per MWh.
onshore and offshore installations. Offshore is ex-pected to increase from about 2% of total installed capacity in 2005 to about 20% by 2020.
For wind power, a number of EU countries have now abandoned the classic feed-in tariffs that paved the way for cost reductions in the past. One of the main reasons is the increasing market share of wind power, which now has to interact better with the remainder of the power system and respond to market signals. A number of major EU wind markets – notably Germany and soon the UK – use feed-in premiums8 with guaranteed total income levels.
The EU’s current legislative plans point towards a stronger focus on cost reductions and competition (European Commission, 2014), which might be achieved through a more widespread use of ten-dering as a support tool. Tendering is currently used to determine offshore support rates in France, for example.
Moreover, cross-border cooperation as established by EU Directive 2009/28/EC is beginning to see the light of day. An existing example of this is the green quota scheme shared between Norway and Sweden. An example of possible project-based cooperation in wind power would be large wind farms that could be built in Ireland, yet connected to the UK grid and treated as UK-based projects (MoU, 2013).
Onshore costsThe main parameters governing wind power eco-nomics include:• investment costs, including auxiliary costs for
foundations, grid connection, etc.;
• operation and maintenance costs;
• electricity production / wind farm capacity fac-tor (strongly driven by the average wind speed);
• turbine lifetime; and
• discount rate.
Of these, the most important are the turbines’ electricity production and their investment costs.
As electricity production is highly dependent on wind conditions, choosing the right site is critical to achieving economic viability. In general, three major trends have dominated the development of grid-connected wind turbines in recent years:
1. Turbines have grown larger and taller, and the average size of turbines sold has increased substantially.
2. The efficiency of the turbines’ production has increased steadily.
3. In general, investment costs per kW have fallen, although a steady trend has not been observed in recent years
Figure 32 shows the growth in the average size of wind turbines sold each year for a number of the most important wind power countries. The average size has increased from approximately 200 kW in 1990 to more than 3 GW in Denmark and 2.5 GW in Germany in 2013, with the UK and Spain lagging only a little behind. The spikes seen for Denmark are caused by offshore wind turbine installations, which are generally larger than turbines installed onshore.
The wind regime at the chosen site, the hub height of the turbines and the efficiency of production are the main factors determining power production from the turbines. Thus, increasing the height of the
Average wind turbine sizes installed each year have grown significantly in recent years.
Source: Navigant, 2014.
Figure 32 – Average wind turbine sizes.

0
200
400
600
800
1,000
1,200
1,400
1,600
1,800
Denmark 2009 –10 Denmark 2013
€/kW
Fundation, land,network etc
Turbine
0
200
400
600
800
1,000
1,200
1,400
1,600
1,800
US 2002-3 US 2009-10
US 2013standard
US 2013Low wind
€/kW
Total cost for Turbineinstallation
DTU International Energy Report 2014
Page 82 — Wind economics
turbines has by itself yielded higher power produc-tion. Similarly, methods for measuring and evalu-ating the wind speed at a given site have improved substantially in recent years, so the siting of new turbines has improved. Thanks to better equipment design, electricity production efficiency has also improved significantly over recent years.
Capital costs of wind energy projects are dominated by the cost of the turbines themselves.9 Of the other contributors, the most important are typically grid connection, electrical installation and foundations, though road construction and financial costs may also account for substantial fractions of the total. For onshore turbines, the auxiliary costs add up to 20–30% of the total turbine costs, depending on the country of installation and the size of the turbines.
The total cost per kW of installed wind power ca-pacity differs between installations and between countries, as exemplified in Figure 33. The cost of land-based turbines today is typically in the range 1,200–1,400 €/kW, and is very similar in the US (1,260 €/kW) and Denmark (1,350 €/kW). Figure 33 is based on a limited amount of data, however, so the results might not be representative.
Operations and maintenance (O&M) costs relate to a limited number of cost components: insurance, planned maintenance, repairs, spare parts and
Total investment cost, including turbine, foundation, grid connection etc., for selected projects in Denmark (left) and the US (right). Source: Danmarks Vindmølle forening (2014) and Wiser et al. (2012b). Updated to 2013 prices.
Figure 33 – Total investment cost.
9. i.e. the “ex works” cost: this includes the cost of the turbine itself, blades, tower, and transport to the site, but excludes site work, foundations, and grid connection costs.
administration. Some of these cost components can be estimated with relative ease. For insurance and regular maintenance, for example, it is possible to obtain standard contracts covering a considerable portion of the wind turbine’s total lifetime. On the other hand, the costs of repairs and related spare parts are much more difficult to predict. Although all the components of O&M costs tend to increase with the age of the turbine, this trend is especially noticeable for repairs and spare parts.
O&M costs constitute a sizeable share of the total annual costs of a wind turbine. For a new turbine, O&M costs might easily average 20–25% of the total levelized cost per kWh produced over the lifetime of the turbine. On an annual basis, O&M costs might start at 10–15% for a new turbine, rising to at least 20–35% by the end of the turbine’s life.
O&M costs are attracting increasing attention. Man-ufacturers are attempting to lower them significantly by developing new turbine designs that are more reli-able and require fewer, shorter, regular service visits.
Offshore costsOffshore wind power is experiencing a steep rise in installed capacity, primarily via projects in north-ern European waters. The European dominance in the worldwide offshore market is illustrated in Figure 34 only from 2010 onwards, the first Asian

2000 2002 2004 2006 2008 2010 2012 2014 2016
10,000
8,000
6,000
4,000
2,000
Esti
mat
ed C
apit
al C
ost
(201
0$/k
W)
installed
Annual Capacity Weighted Average Cost
Bubble size represents project capacity in MW
Source: NREL O�shore Wind Project Database
EU
USAsia
construction contracted approved
DTU International Energy Report 2014
Wind economics — Page 83
and US offshore projects emerged, while costs in-creased considerably around this year. They depend heavily on water depth and distance to shore, which is why a progress towards cost reductions cannot be observed yet. After a fairly small number of small offshore projects close to the coast, the larger projects being built from 2010 onwards are located in deeper waters are require longer cables to shore. More specifically, the Danish Energy Agency and Energinet.dk (2012) estimate that foundation costs rise by 0.3 Mill. Euro/MW for every 10 meters of additional water depth. At distances beyond typi-cally 50 km from shore, the connection is done by an HVDC system instead of AC systems for techni-cal reason. The required installations lead to con-siderably higher costs. For these reasons, general conclusions about cost components of offshore wind projects are to be handled with care. The mentioned factors should be remembered when looking at average prices.
Cost of energyThe turbine’s power production is the single most important factor in the unit cost of power. Figure 35
shows the calculated cost per kWh as a function of the prevailing wind regime.10 These costs range considerably depending on the capacity factor and thus how windy the chosen site is.
For a standard onshore installation with an invest-ment cost of $1,750 /kW (€1,330/kW) the cost ranges from approximately 7–9 US cent/kWh at sites with medium average wind speeds to approximately 6–7 US cent/kWh at good coastal positions. In Europe, good coastal sites are mostly to be found on the coasts of the UK, Ireland, France, Denmark and Norway. Medium wind areas are mostly located inland in central and southern Europe – Germany, the Netherlands, France, Spain and Italy – but also in the north, in inlands parts of Sweden, Finland and Denmark. In many cases local conditions signif-icantly influence the average wind speed at a specific site, so big differences in the wind regime are to be expected even for neighbouring areas.
As Figure 35 shows, energy from offshore turbines is considerably more expensive than that from on-shore turbines. At a high-wind offshore position
Source: Tegen et al., 2013
Figure 34 – Reported capital costs for offshore wind projects (2000–2016).
10. The figure uses the capacity factor to represent the wind regime. The capacity factor is defined as the number of full load hours per year divided by the total number of hours per year (8760). Full load hours are calculated as the turbine’s average annual production divided by its rated power. The higher the capacity factor (and hence the number of full load hours), the higher the wind turbine’s production at the chosen site.

15 20 25
China
European Low-Medium Wind Areas US Great Plains
Europe O�shore Projects
30 35 40 45 50
35
30
25
20
15
10
5
0
Leve
lized
cos
t of
Ene
rgy
[US
Cent
2005
/kW
h]
Capacity Factor [%]15 20 25 30 35 40 45 50
35
30
25
20
15
10
5
0Le
veliz
ed c
ost
of E
nerg
y [U
S Ce
nt20
05/k
Wh]
Capacity Factor [%]
O�shore USD 5,000/kWhO�shore USD 3,900/kWhO�shore USD 3,200/kWhOnshore USD 2,100/kWhOnshore USD 1,750/kWhOnshore USD 1,200/kWh
O�shore Discount rate = 10%O�shore Discount rate = 7%O�shore Discount rate = 3%Onshore Discount rate = 10%Onshore Discount rate = 7%Onshore Discount rate = 3%
DTU International Energy Report 2014
Page 84 — Wind economics
with a capacity factor of 50%, corresponding to wind conditions at the Danish Horns Reef 1 wind farm, the calculated cost of electricity is close to 12 US cent /kWh for a standard offshore installation with an investment cost of $3,900/kW (€3,000/kW).
Wind and the power marketGrid-connected wind turbines in general sell their power to the market. As wind resources are inex-haustible and free, the marginal production cost of power from a wind turbine is close to zero. On the other hand, the availability of wind resources is strongly contingent on short-term weather condi-tions. Consequently, any attempt to plan the oper-ation of an electric energy system containing wind farms must cope with the variable and uncertain nature of wind power production.
The effect of wind power production on spot prices can largely be attributed to the so-called merit- order effect: since its marginal cost is virtually zero, wind power production enters the aggregated supply curve in the spot market from the left-hand side, pushing the spot price down. In fact, in spot mar-kets with a high penetration of wind power, zero or even negative prices are no longer uncommon. In parallel, the variability of wind power production naturally increases price volatility. Furthermore, this
How the estimated levelized cost of onshore and offshore wind energy varies with capacity factor for different project costs (left) and discount rates (right) (Wiser et al., 2012a).
Figure 35 –
direct cause-and-effect relationship is exacerbated by the fact that accommodating the fluctuating wind commits the system to extra operational costs, as conventional power plants operate at part load for more of the time and are subject to more cycling and start-ups.
Since wind power production cannot be perfectly predicted in advance, backup power resources are required to cover wind power forecasting errors at short notice. The operating costs associated with these backup resources are referred to as regulation costs. It is generally expected that as the penetra-tion of wind in a power system increases, so do the regulation costs. These costs are passed on to the wind power producers through the balancing market. It is therefore critical for the integration of wind power to keep regulation costs bounded and low.
Employment and wind powerThe wind power industry is an important driver in the creation of new jobs. In the EU as a whole, and in most of its member states, an expanding wind industry is one of the promising options to cope with current high levels of unemployment. Jobs are to be found in manufacturing, installing, operating and maintaining wind turbines.

DTU International Energy Report 2014
Wind economics — Page 85
According to the International Renewable Energy Agency, the global wind industry employed 834,000 people at the end of 2013 – a rise of 11% compared to 2012. The highest growth is seen in emerging countries such as China, where 365,000 people were employed in the wind industry by the end of 2013, an increase of 37% compared to 2012.
The EU had 328,000 wind industry workers by the end of 2013, an increase of 21% compared to 2012. In the offshore wind industry Europe accounts for most global employment, with 58,000 workers; most of these are in the UK, followed by Germany. By 2013 approximately 27,000 people were employed in the wind industry in Denmark.
Employment expectations for the wind industry are large. According to the European Commission a big expansion of renewables could generate more than 3 million jobs by 2030.
Conclusions and recommendations• Most important for the development of wind
power, including competitiveness with power from conventional sources, are continuing and reliable policies with stable support frameworks and fixed long-term targets for wind capacity development.
• The share of wind power in the energy system is increasing fast. Thus it is increasingly impor-tant to pay attention to the system integration of wind power. This also needs to be reflected in the design of support mechanisms (e.g. feed-in premiums instead of tariffs) and of markets for ancillary services.
• Special attention has to be paid to offshore wind power development, where considerable cost re-ductions are still needed. The good news is that significant potential for savings seems to exist; analysis is required to show how this potential can best be exploited.
• In many cases tendering procedures are used for new offshore wind farms. It is important that these procedures are designed to attract a large number of bidders, increasing competition and lowering the cost of energy produced. More international coordination is also needed so that member states do not drive up the cost of new offshore wind farms.
• Other barriers, such as public acceptance, do exist for wind power. It is increasingly important that such barriers are addressed if member states want to develop strong wind power industries.

Chapter 12
Environmental and social impacts of wind energyBy Kristian Borch1, Niels-Erik Clausen1 and Geraint Ellis², 1) Technical University of Denmark, 2) Queens University Belfast

DTU International Energy Report 2014
Environmental and social impacts of wind energy — Page 87
→ The most common reasons for non- tech-nical delays to wind energy projects are local resistance and poor strategic spatial
planning. This chapter looks at the environmental and social impacts of wind energy and discusses how the public can gain trust in the public planning and private project management processes.
Wind farms’ compliance with local and regional envi-ronmental requirements, and their social acceptance, is prerequisites for meeting the ambitious targets that have been set for wind energy.
While the nominal cost of obtaining an environmen-tal permit for a wind farm might be just a few percent of the total project cost, it is clear that the planning and environmental permitting process can influence the project’s schedule, and hence indirectly its cost. A delay of only a few months can have a significant impact on the project economics, since it delays in-come from the sale of electricity. In the worst case, a court case or other conflict may lead a project to be cancelled all together.
A recent example of a project that was seriously delayed and finally cancelled is the London Array offshore wind farm in the UK, which was planned in two phases with a final capacity of 1,000 MW. The first phase, rated at 630 MW, entered operation in 2013. In February 2014 the consortium behind London Array Phase 2 (370 MW) cancelled the project after having worked on it since 2003. The failure was mainly due to planning uncertainty related to the red-throated diver, a protected seabird. Previously, planning issues related to two other seabirds, the Sandwich tern and the common scoter, led respectively to the cancel-lation of the Docking Shoal and Shell Flat projects (Jensen, 2014).
For land-based wind farms, the environmental im-pact assessment carried out before construction be-gins falls into two parts. On one hand we must con-sider the impact on people and the landscape; on the other, the effect on flora, fauna and biodiversity. The following sections discuss three particular concerns:• visual and landscape impact;• noise; and• shadow flicker.
Visual impactOf all of the issues involved in siting a wind farm, none seems to be argued more strongly than that of landscape. Perhaps this is not surprising, because from both environmental and socioeconomic view-points landscape is considered one of the most im-portant natural resources (Bishop et al., 2007). This trend has been noted worldwide and the strongest opinions voiced are usually those related to protect-ing the scenic qualities of the landscape (Bishop et al., 2007, Lothian, 2008).
This issue has gained momentum in recent years mainly because of the growing number of wind power developments (as a consequence of govern-ment renewable energy targets) and the increasing size of wind turbines. It is also more hotly contested than in the construction of traditional thermal power plants because the lower energy density of wind farms requires them to be spread over larger areas.
To date there has been only a limited amount of research on the aesthetic impact of wind turbines on landscapes, but the preferred approach has been as-sessment through photographs, visualisations from points of interest, and verbal descriptions (Figure 36) (Bishop et al., 2007).
NoiseNoise is defined as any unwanted sound (Rogers et al., 2002). As with visual impact, the effect of noise is partly subjective because it affects people and their perceived quality of life. The environmental im-pact of noise depends upon many parameters and physical effects, and as such it is difficult, though not impossible, to model. The difference between visual and audible impact, however, is that a defi-nite threshold can be established for noise impact, and this has been done in many countries. In 2011 Denmark became the first country to establish a sep-arate limit for low-frequency noise (below 160 Hz), as measured inside homes (Danish Environmental Protection Agency, 2014).
There are two potential sources of noise associated with wind turbines: aerodynamic and mechanical. Aerodynamic noise is now the more important of the two.

DTU International Energy Report 2014
Page 88 — Environmental and social impacts of wind energy
Mechanical noise is created by the machinery inside the nacelle of the turbine. Although this includes components such as yaw drives, cooling fans and hydraulics, the dominant sources of noise are the gearbox and the generator (Pedersen et al, 2003). These noises are usually of constant frequency, since they are generated by rotating equipment, and they are transmitted along the structure of the turbine (the tower and nacelle) before being emitted from its surface (Rogers et al., 2002). Occasionally this may create pure tones, in contrast to most noise emitted from wind turbines, which is a mixture containing a large range of frequencies (“white noise”). For noise containing pure tones the Danish regulations impose a penalty of 5 dB(A).
During the last 20 years, mechanical noise in wind turbines has been reduced to the point where it is no longer the dominant source of wind turbine noise (Pedersen et al, 2003, Rogers et al., 2002). This has mainly been done through improved acoustic insu-lation (Leloudas et al, 2007) and component mount-ings, but also through technological innovations such as low-speed cooling fans and changing the finish on gear teeth (Rogers et al., 2002). Another reason that mechanical noise is now less important than aerodynamic noise is a consequence of the increased size and especially tower height of wind turbines.
Noise impact is modelled and evaluated against national requirements using commercial software
Figure 36 – Visualisation of 1.75 MW (93 m) and 3.6 MW (150 m) turbines.
packages such as WindFarm, DNV-GL Windfarmer and WindPro.
Shadow flickerShadow flicker describes the pulsing change in light intensity that is observed when the blades of a wind turbine pass periodically through sunlight in front of an observer. Obviously this requires a clear sky, a low sun, wind to turn the blades, and a particular wind direction in relation to the position of the sun and the observer. Levels of shadow flicker are generally not regulated explicitly but guidelines do exist in most countries, either for acceptable maximum levels of flicker or for the distance within which any flicker effects must be mitigated. In Denmark there is no firm rule, but the guideline states that shadow flicker should be evaluated for observers between 500 m and 1,000 m from any turbine, and that any particular house should see no more than 10 hours of flicker per year. It is generally considered that observers further than 1 km from the turbine see the turbine as just another static obstacle in front of the sun, so shadow flicker is not an issue at this distance.
Social acceptanceFor land-based developments, governments have tended to focus their attention on overcoming the initial and obvious challenges of designing an appropriate support system, securing grid access, simplifying planning procedures, and dealing with technical risks. However, this approach can only deliver so much.

DTU International Energy Report 2014
Environmental and social impacts of wind energy — Page 89
Visualisation of 1.75 MW (93 m) turbines (left) and 3.6 MW (150 m) turbines (right) from a Danish project in Gisselbæk Danish Energy Authority (2010).
Renewable development actually takes place in a society made up of people – people who may be suspicious of new technologies, feel sceptical of the motives of developers, or see the changes to cher-ished landscapes as too high a price to pay for the benefits of wind energy. Indeed it appears that the consequences of this have not been fully grasped.
Governments and developers have often not felt it necessary to consider the social dynamics around wind energy projects, largely because opposition groups in the past have been small, scattered and ineffective. Many anti-wind groups are now becom-ing more broadly organised, however, and in some cases they are beginning to influence national energy policy. Indeed, in many countries it is now becoming clear that it will be social acceptance that determines the ultimate scale of the onshore wind industry.
We are now seeing the implications of this across the northern hemisphere, with some local and national contexts – political, social and cultural – proving particularly challenging to the social acceptance of new wind energy projects. Opposition may take on different dynamics and characters according to the type and location of the proposed project, though the largest projects seem to offer the greatest challenges. Sometimes local objections may be stimulated by a lack of trust in consenting authorities. Opposition may be the result of a poorly designed or located project, or it can arise because host communities think it is unfair that the places they love will be
spoiled, while the project owners will derive the monetary benefit.
This is becoming a major challenge in many coun-tries with major wind energy schemes, from the US to Japan. In Australia, local concerns were the driving force for the state of Victoria to adopt a new 2 km setback distance that has crippled the wind industry there. In the UK, while the country forges ahead with ambitious offshore schemes, the ruling Conservative party has pledged to remove all sup-port from onshore wind farms after the next election, having judged this to be a key voting issue for many of its supporters.
Ireland has been developing onshore wind as a key element in its economic recovery, with the ambitious intention of becoming an energy-exporting nation. However, the country had a major setback recently after a massive wind scheme planned to generate electricity for the UK market attracted a storm of objections. The adverse publicity was so great that it may have damaged national perceptions of the wind industry and spurred objector groups throughout the country.
There are therefore major challenges to the rollout of onshore wind, and while different countries will continue to experiment with the best models for extending their renewable energy capacity, the extent of onshore wind will ultimately depend on how host communities relate to new projects. While this may

DTU International Energy Report 2014
Page 90 — Environmental and social impacts of wind energy
never be an easy process, there are ways in which relations can be improved. These include more open and transparent decision-making, community in-vestment in renewables, devolving carbon budgets to individual communities, and enhanced community input to national energy strategies.
One would expect that many of the problems dis-cussed above could be solved by offshore develop-ments, because of their relatively remote location (Scott, 2007; Strachan et al., 2006). However, off-shore wind projects have seen considerable oppo-sition from a range of individuals and organisations in Northern Ireland, the Republic of Ireland (Ellis et al. 2007), and Cape Cod in the US (Kempton et al., 2005). Apparently noise is the only problem that vanishes at sea (Hagget, 2008).
The case of DenmarkDenmark is approaching saturation point for on-shore wind, given current technologies and proce-dures for public involvement. One would expect the industry to have foreseen this situation, since this is not the first time in history that a technology has encountered opposition from the public (Gibbons, 1999; Borch et al.3 2003). However, an unpublished survey carried out at the recent wind power summit in Barcelona (EWEA, 2014) revealed that the industry has only a weak analysis of risk of social acceptance or social impact. Some developers and operators even refuse to talk about social acceptance.
Nonetheless, the industry has made some attempts to address the opposition. Examples are the work to reduce noise emissions from turbines, and wind acceptance campaigns such as actonfacts.org (in-ternational), Vindinfo.dk (Denmark) and yes2wind (UK). While innovations to reduce the environ-mental impact of wind farms are always welcome, however, it is doubtful whether “rational” infor-mation campaigns improve acceptance by people who oppose wind power projects. They may even have the opposite effect. People’s opinions of wind turbines are highly subjective and are influenced by numerous factors (Ladenburg, 2009).
But as mentioned previously, lessons learned from poorly designed or badly located projects can be
used constructively to increase local involvement. In turn, this can help to earn their recognition of wind power as a better alternative to fossil fuels – even if this is only until new renewable energy technologies are mature enough to supplement wind power on a large scale and at reasonable cost.
Recent research (wind2050.dk) is looking towards new opportunities to understand and improve the democratic processes linked to the construction of large wind farms and other renewable energy plants. A new method of clarifying public concerns and bringing new perspectives to the fore has recently been applied: a web crawler searches the Internet for websites that mention wind turbines – such as debate forums and feature articles – and charts the points of view expressed, from generalities all the way down to individual wind farms. This can help to paint a full picture of the considerations that need to be shown in the planning and project management of wind farms and the organisation of public consultation meetings.
Recommendations for science, industry and policyIn a modern and democratic society people need to be not only informed but also empowered in making decisions that they believe have consequences for their daily lives. Public participation is often believed to be “the solution” in gaining social acceptance for tech-nologies. However, public participation and the em-powerment of local communities can easily be coun-terproductive if ambiguity is mistaken for uncertainty.
Uncertainty can be addressed through information and technical problem solving. Ambiguity is a com-pletely different matter: rational argument is inef-fective here because the problem is a fundamental difference in values. Unfortunately for the progress of wind power, developers and governments tend to neglect many views and concerns of society as a whole, beyond a narrow scientific approach or the business models favoured by industry.
A more constructive approach would be to give con-sideration to these concerns rather than simply to dismiss them as nonsense. The question for science, industry and policy is thus not whether to empower the public, but how.

Chapter 13
Recycling of wind turbinesBy Per Dannemand Andersen and Alexandra Bonou, DTU Management Engineering; Justine Beauson and Povl Brøndsted, DTU Wind Energy

DTU International Energy Report 2014
Page 92 — Recycling of wind turbines
→ Wind turbines are one of the most environ-mentally sound technologies for producing electricity, and wind energy has very low
environmental impacts. Within the life cycle of a wind turbine, however, the decommissioning phase has been identified as a blind spot when analysing the environmental impacts of wind power. Most previous impact analyses have focused primarily on the operational phase of the turbine’s life cycle, and in some cases also on the manufacturing and installation phases.
Because the wind turbine industry is relatively young, there is only a limited amount of practical experience in the removal and recycling of wind turbines. This is particularly true of offshore wind turbines, which are a fairly recent phenomenon. However, wind turbine recycling is rising up the agendas of policymakers, researchers and industri-alists. Several studies of the environmental impact of wind turbines have been carried out recently, along with technology development projects related to turbine recycling, especially for blades. Some man-ufacturers have also set targets for the recyclability of their wind turbines [1].
Deployment and decommissioning plansHow big is the problem? How many turbines do we need to decommission, and when?
The development phase of a new type of wind tur-bine might take five years. The planning of a large offshore wind farm might take 5–10 years. Most wind turbines have a design lifetime of 20–25 years. The decisions we take today on the design of wind
turbines and wind farms will therefore affect de-commissioning and recycling 30–40 years in the future – a rather distant point.
An older study identified a number of factors affect-ing the future market volume of wind turbines, and consequently the total amount of material used and ultimately to be recycled or disposed of [2]. The same study also identified factors affecting the design of future wind technology, and consequently the types of materials to be used (Table 8).
By the end of 2013 wind power had a total global installed capacity of 318 GW, a figure that had risen by approximately 40 GW annually from 2009 to 2013 [3]. Several organisations have developed scenarios for the future growth of the market. These include the International Energy Agency (IEA), which has pub-lished two such scenarios [4]. In the “2DS” scenario (an average global temperature rise of 2°C), 1,400 GW of wind power will be installed by 2030 and 2,300 GW by 2050. The more ambitious “hiRen” (high renew-ables) scenario envisages 1,600 GW of wind power by 2030 and 2,700 GW by 2050. Other organisations have suggested even higher future market volumes. The Global Wind Energy Council, the international trade association for the wind power industry, sug-gests 2,500 GW of installed wind power by 2030 and 4,800 GW by 2050. These figures do not distinguish between onshore and offshore sites.
By 2013 a typical offshore wind turbine had a capacity of approximately 4 MW and a rotor diameter of 120 m. The sizes of future turbines are more difficult to predict. The study mentioned above extrapolated
Table 8 – Factors determining the future amounts and types of wind turbine materials used and ultimately recycled or disposed [2].
Key factors affecting the future market development of wind turbines – determining the total amount of material used and ultimately recycled or disposed of:
Factors affecting the design of future wind technology – determining the types of material used and ultimately recycled or disposed of:
• National climate and energy policies• Future power market structures• R&D expenditure (public and industrial)
• New materials (replacement of steel, new composites, superconduct-ing materials, etc.)
• Design concepts and main components (power electronics, control strategies, superconducting materials, etc.)
• Grid conditions (grid structure, power quality, etc.)

DTU International Energy Report 2014
Recycling of wind turbines — Page 93
Component Mass (tonnes)
Tower 143.0
Nacelle 2.3
Hub 13.3
Blades 19.5
Nose cone 0.3
Transformer/converter 5.0
Generator 6.5
Gearbox 16.0
Bed frame 10.5
Main shaft 5.1
Table 9 – Masses of the major components of a 2 MW turbine [5].
to suggest that the most common turbine size in the period 2020–2030 will be 10 MW [2]. A newer study has based its conclusion on an existing 2 MW turbine [5] (Table 9).
The 40 GW of turbines installed annually in the pe-riod 2009–2013 will reach the end of their operating lives during 2029–2033. Anticipating the IEA hiRen scenario, it is possible to make a rough estimate of the amount of material that will need to be recycled in the long term (Table 10). We assume that 1/20 of the capacity installed by 2030 will need to be de-commissioned by 2050; the same estimate for blade material can be found in a recent German study [6].
By comparison, vehicles reaching the end of their lives are estimated to reach a mass of 14 million tonnes per year by 2015 in Europe alone [7].
Future challenges for decommissioning and recyclingEarly life-cycle assessment (LCA) studies of offshore wind farms have concluded that environmental im-pacts come from three main sources [8, 9]:
• bulk waste from the tower and foundations (e.g. from steel production), even though a high percentage of the steel is recycled;
• hazardous waste from components in the nacelle (e.g. from alloy steel);
• greenhouse gases (e.g. CO2 from steel manufac-turing and solvents from surface coatings).
These results indicated that further analysis should take into account changes in the materials used in the tower and the foundations, as well as changes in the design of components in the nacelle (e.g. direct-drive designs and greater use of power electronics).
Cables play an important part in recycling plans for offshore wind farms [8]. Offshore sites require many kilometres of heavy cables of complex/composite construction to resist the harsh environment of the sea. There is a considerable environmental impact from the manufacture of the cables, and since they consist of many different materials, cables are also difficult to dismantle for recycling.
There are some uncertainties and limitations re-garding LCA studies of offshore wind turbines. In particular, the specific processes needed for dis-mantling and recycling, which are crucial to the
40 GW decommissioned annually by 2029–2033
80 GW decommissioned annually by 2050
Steel and cast iron (tower, hub, bed frame, main shaft) – 86t/MW 3,440,000 t 6,880,000 t
Alloys (generator, gearbox) – 11t/MW 440,000 t 880,000 t
Blades – 10t/MW 400,000 t 800,000 t
Table 10 – Rough global estimates of recycled masses of key wind turbine components in the future.

Unc
erta
inty
on
how
to h
andl
e
Importance (damaging e�ects)
med
ium
high
low
low
medium high
Blades
Nacelle
Organisation
FoundationGen. and gear
HydraulicsTower
Electro. and cables
Dismantling
DTU International Energy Report 2014
Page 94 — Recycling of wind turbines
environmental profile, are not known. Many material recovery processes were not included in these early analyses. Another example of the limitations of many environmental impact studies for wind turbines is that they tend to neglect land use, which is generally considered a critical point elsewhere. Newer LCA studies of wind turbines point to two uncertainties in assessing lifetime environmental impact [10]. The first relates to what will happen to materials and components, in particular the blades, at the end of their lives: will they be recycled, or dumped in landfills? The second area of uncertainty is about decisions taken on servicing and maintenance dur-ing the operating life of the turbines. Together, these two uncertainties create an uncertainty of 14–20% in the predicted life-cycle environmental impact of wind turbines [10].
As mentioned above, what happens at the end of a turbine’s life has a considerable influence on its overall environmental impact. The options are: sec-ond-hand sales of complete turbines; refurbishment to extend the working lives of turbines in their orig-inal settings; remanufacturing and re-use of com-ponents; recycling; and landfill.
Some studies include only remanufacturing and recycling. Remanufacturing is the process of return-ing a used component to its original specifications,
while recycling recovers the material value without concern for the functional value of the component [5]. However, there exists a second-hand market for used wind turbines. Turbines considered too old or too small for mature markets such as Denmark and Germany can be refurbished and sold in less mature markets such as Eastern Europe and Latin America, giving operators practical experience at low cost [11]. This second-hand market has recently surged.
Another option is to extend the working life of tur-bines by updating them with newer or refurbished components. Some independent operators, like the DMP Group, specialise in refurbished components for wind turbines. “Repowering” a wind farm usually implies replacing old turbines with newer and larger ones. In that sense it is the site that gets repowered and not the individual turbines.
If old turbines cannot be re-used economically they must be dismantled, their components recycled wherever possible, and the remainder dumped or incinerated. Many components have a commercial value because they contain materials such as steel and copper, and most turbine components are well known to established recycling companies. However, the consequences of recycling increased numbers of generators containing rare-earth magnets are not well studied.
An older study assessed the environmental impact and uncertainties related to decommissioning wind turbines (Figure 37) [2]. The study found that blades constitute a major problem, and there is much un-certainty about how to get rid of them properly and safely. The problem lies in the fibreglass composite used for blades. Fibreglass is a low-value material and the dust produced when the blades are cut up creates a hazardous working environment. Empty nacelles are also hard to recycle because they con-tain many different types of materials, including composites and PVC foam. Electronics and cables are less problematic, since the recycling industry is used to handling these.
A newer study indicates that dismantling and “reverse logistics” might be more costly than the original in-stallation phase [5].
Figure 37 – Assessment of the environmental impact and uncertainties.
Assessment of the environmental impact and uncertainties involved in dismantling, recycling and disposing of wind turbines and their components [5]

DTU International Energy Report 2014
Recycling of wind turbines — Page 95
Based on information from companies the authors of this chapter have assessed the recycling or dis-posal rate of wind turbines built using current technology (Table 11). Electronic components are notable for their low recycling rate, such that up to 50% needs to be treated as waste. Since most LCA and recycling studies of wind turbines focus on the blades, there seems to be a need for better knowledge of how to recycle electronics and other composite components like cables and hydraulic hoses.
Institutional issuesA recent British study of the incentives for recy-cling composite wind turbine blades in Europe analysed the legislative regime for the recycling of blades, and found it to be quite comprehensive. Blade recycling is subject to EU Directives on issues such as landfill, vehicles (the End of Life Vehicles Directive), waste incineration, waste electrical and electronic equipment (WEEE), and the Waste Framework [7].
Also important may be the EU rules on extended producer responsibility (EPR), which has been ap-plied to a number of sectors such as vehicles and
Material Recycling/Disposal rate (%) Disposal method
Ferrous high alloy 98 Recycling
Ferrous metal 95 Recycling
Steel Recycling
Aluminium and aluminium alloys 95 Recycling
Copper, magnesium, nickel, zinc and their alloys
98 Recycling
Precious metals and other non-ferrous metals and alloys
98 Recycling
Plastics, rubber and other organic materials 100 Incineration with energy recovery
Electronics 50 Recycling with energy recovery
Batteries 100 Recycling
Concrete, bricks etc. 64 Landfill
Sand and gravel 0 Remains in the ground after wind farm is dismantled
Blades 95 Landfill or recycling
Remaining materials Incineration or landfill
Source: Based on authors’ analysis of information from companies.
Table 11 – Recycling rates and disposal routes for wind turbine components.
electronic and electrical equipment [7]. Under EPR, manufacturers are responsible for the life cycle im-pact of their products [12].
This complexity emphasises the importance of knowledge exchange and knowledge development in the interaction between the design, dismantling and recycling phases for wind turbines. Furthermore, the institutional and organisational structure required to dismantle and recycle offshore wind turbines was until recently quite uncertain [2, 5].
Who will actually dismantle and remove the turbines at the end of their lives? Three business models can be identified. In the first, this is the job of established independent operators in the removal and recovery sector. In the second model, which is a variation of the first, specialist independent operators will carry out most of the work, but the blade materials will be recycled by an emerging class of start-up firms set up to take advantage of this opportunity.
The third model involves collaboration and strategic alliances between wind turbine producers (Original Equipment Manufacturers) and the removal and recovery industry. Of the three, this model is the
DTU International Energy Report 2014
Page 96 — Recycling of wind turbines
best adapted to the expected regulatory changes towards extended product liability and increased producer responsibility. It might also be preferred by the wind turbine manufacturers (OEMs), since it will help them to feed knowledge back into their product development processes and so benefit from designing for recyclability [5].
However, there seems to be a need to further ana-lyse the societal and environmental consequences of these business models and perhaps others. In particular, studies show the need for development policies to encourage recyclability and to stimulate markets for second-hand turbines and independent recycling operators [5].
Recycling fibreglassAs indicated above, it is well known that fibreglass blades can create recycling problems. Several dec-ades of research have now resulted in practical methods for recovering and recycling glass fibre and other materials from composites. [13, 14, 14A] Unfortunately, high investment and processing costs mean that the recovered glass fibres are more expen-sive than pristine ones, so commercial applications have therefore been limited. The Danish company ReFiber used pyrolysis to recover glass fibres from wind turbine blades for re-use in thermal insulation, but after five years of operation the company ceased trading in 2007 for economic reasons.
The recovery processes are primarily chemical and thermal in nature, with processing temperatures in the range 300–700°C. [15, 16] The most-studied techniques are the fluidised bed, a thermal oxida-tion process operating at around 450°C; [17] py-rolysis, which decomposes organic molecules into smaller ones in an inert atmosphere at temperature of 300–700°C;[18–21] and supercritical fluids (see below).[22–24]
Heating glass fibres to temperatures above 250°C has been shown to degrade their mechanical prop-erties. [14, 23, 25–28] This limits the use of recovered glass fibres in high-performance composite. One of the challenges is therefore to reduce the operating temperature of the recycling processes. Supercritical fluids are promising in this respect. Many fluids at
temperatures and pressures just above their critical points have interesting properties, including high solvent power and liquid-like density combined with gas-like diffusivity and viscosity.
The European project EURECOMP (2009–2012) in-vestigated the use of water to dissolve the matrix material in glass fibre reinforced polyester, but the results were unpromising at temperatures below 300°C. [22–24]
Another project, Genvind (2012–2016), is now run-ning in Denmark with the aim of finding recycling and re-use solutions for wind turbine blade materi-als. Because the reasons for decommissioning blades are diverse (most often they are still intact), the pro-ject is considering several scenarios and process steps, from dismantling to re-use of complete blades. The project’s many partners, from both industry and universities, are working to develop suitable technologies and future industrial applications.
Another route might be to produce cement by using decommissioned turbine blades and other waste composites as both a fuel and a raw material. The polymer component of the composite acts as a fuel, while the glass leaves a silica-rich ash that can substi-tute for some of the sand normally required to make cement. The Lägerdorf cement plant in Germany, operated by Holcim, is already doing this, incorpo-rating up to 50% of fibreglass ash into the clinker. The company claims that the resulting cement is no different from normal in terms of quality and applications. [28]
PerspectivesBased on the above, we can make some recommen-dations for research, industry and policy.
First, there is a general need for more accurate data to improve LCA calculations relating to wind tur-bines. This may be especially important for decisions concerned with service and maintenance. These are considered key issues in driving down the cost of electricity produced by wind power, yet they have environmental consequences that may not yet be fully understood. Better data is also needed for the recycling of wind turbine components and materials,

DTU International Energy Report 2014
Recycling of wind turbines — Page 97
especially blades. Since materials are responsible for the largest fraction of the total life-cycle emissions from wind turbines, uncertainties in data on recy-cling have a big influence on the LCA of the turbines as a whole.
Second, design for recyclability is high on the agenda in many industries, including wind power. However, there is a need for better understanding of likely material substitution in future turbine designs. There may also be a need for more knowledge on how to dismantle turbines and break down complex com-ponents into recyclable materials.
Third, there is a need to know more about the po-tential markets for products made from recycled materials. There are established markets for scrap steel and alloys, but there is limited knowledge about the market for secondary products from wind tur-bine recycling, such as composite matrix materials derived from blades.
Fourth, as wind turbines become more technolog-ically advanced, the use of rare earth materials is increasing, especially in magnets. We need to know
more about how to recycle or recover magnets and rare earths.
Fifth, we need policies to stimulate OEMs to design for recyclability, for example through extended pro-ducer responsibility within a product service system framework. Valuable experience could be learned from other industries.
Sixth, the current rapid rise in wind power pro-jects in the longer term is creating new business opportunities for second-hand turbines, refurbished components, turbine dismantling services, and recy-cling of materials. Further into the future, policies to stimulate such markets and entrepreneurial activities might be needed.
As the global installations of wind turbines increase to develop issues related to the decommissioning of wind turbines becomes increasingly higher on the agenda – both in policy making, among research-ers and in industry. This chapter has touched upon the most important of aspects related to this issue. However, in a longer perspective much knowledge is still needed.


DTU International Energy Report 2014
Index — Page 99
Chapter 14
Index
A
AEP 46, 73Ancillary services 12, 16, 36, 64, 66, 71, 85, 102
C
Capacity factors 13, 33, 34, 36, 42CFD 73CoE 9, 12, 13, 15, 53, 56CSC 49
E
EERA 29, 30ENTSO 66, 67, 68, 102ERA 30EWEA 17, 38, 50, 51, 90, 101, 102, 103EWI 29
F
FCRs 66, 67, 70Feed-in tariffs 5, 11, 12, 16, 81, 85FRRs 66, 67, 68
G
GWEC 20, 23, 101, 104
H
HAWT 53, 55HIR 75, 76HVAC 14, 48HVDC 4, 14, 44, 48, 83, 101
I
IEA 9, 20, 23, 92, 101, 104IIASA 20, 23, 101IRENA 19, 21, 22, 23, 24, 101IRPWIND 30
L
LES 73Levelized cost of energy 13, 104LIDAR 60, 61
N
NCAR 75, 76
O
OEMs 12, 50, 96, 97O&M 14, 17, 44, 49, 50, 82OWS 14, 49, 51
R
RANS 73
S
SET-Plan 27, 29, 30SMES 49SRA 29
T
TP-Wind 29TSOs 66, 67, 70, 75
V
VAWT 55VSC 48, 49, 101
W
WASA 73, 74WAsP 74WPP 64, 66, 67, 69, 70WPPT 76


DTU International Energy Report 2014
References — Page 101
Chapter 4
1. IRENA (2014): REmap 2030: A Renewable Energy Roadmap, June 2014. IRENA, Abu Dhabi. www.irena.org/remap
2. IEA ETP (2012) http://www.iea.org/etp/
3. IEA WEO (2012) http://www.worldenergyoutlook.org/
4. Exxon Mobile (2014): The Outlook for Energy: A View to 2040. http://corporate.exxonmobil.com/en/energy/energy-outlook
5. Greenpeace (2011): The Energy [R]evolution. http://www.greenpeace.org/international/en/campaigns/climate-change/energyrevolution/
6. GWEC (2012): Global Wind Energy Outlook 2012, 4th edition. http://www.gwec.net/publications/global-wind-energy-outlook/
7. IIASA Global Energy Assessment . http://www.globalenergyassessment.org/
8. WWF Energy Report: 100% Renewable http://wwf.panda.org/what_we_do/footprint/climate_carbon_energy/energy_solutions22/renewable_energy/sustainable_energy_report/
9. US DoE IEO (2013) http://www.eia.gov/forecasts/archive/aeo13/
Chapter 6
1. World Market Update 2013 , March 2014, Navigant Research
2. S. Wittrup, 2011: ”Mega-vindmøller stiller nye krav til vingeteknologien”, Ingeniøren, http://ing.dk/artikel/mega-vindmoller-stiller-nye-krav-til-vingeteknologien-123513
3. www.iec.ch/tc88, TC88 Wind Turbines
4. IEC 61400-1 , edition 4 Committee Draft, Wind turbines – Part 1: Design Criteria, July 2014
5. Forsknings- og erhvervsmæssige styrkepositioner i den danske vindenergisektor , Damvad, Maj 2024
6. Green Growth – The impact of wind energy on jobs and the economy, EWEA Report, April 2012
7. Workers wanted – The EU wind energy sector skills gap, EWEA Report, August 2013
8. World Market Update 2010 , March 2011, Navigant research
9. Wind Energy – The Facts , European Wind Energy Association (EWEA), Earthscan, 2009.
Chapter 7
1. S. Wittrup , Ingeniøren (weekly Danish newspaper). 1 (Nov.11, 2013) 10 – 11.
2. N. Dalili, A. Edrisy, R. Carriveau: A review of surface engineering issues critical to wind turbine performance, Renew. Sust. Energ. Rev. 13 (2009) 428–438.
3. C.R. Seward, S.J. Pickles, E.J. Coad, M. Watt, J.E. Field: Studies of rain erosion mechanisms in a of IR transmitting ceramics – including coated samples, University of Cambridge. Report SPC-92-4032 (1994) 1 – 206.
4. G.F. Schmitt: Flight test-whirling arm correlation of rain erosion resistance of materials, Air Force Materials Laboratory, USA. Report AFML-TR-67-420 (1968) 1 – 31.
5. C.J. Hurley, G.F. Schmitt: Development and calibration of a mach 1.2 rain erosion test apparatus, Air Force Materials Laboratory, USA. Report AFML-TR-70-240 (1970) 1 – 68.
6. Zhang, S., Dam-Johansen, K., Nørkjær, S., Bernad Jr., P.L., Kiil, S.: Erosion of wind turbine blade coatings – Design and analysis of jet-based laboratory equipment for performance evaluation, Accepted for publication, Prog. Org. Coat., October 2014.
7. Sørensen, P.A., Kiil, S., Weinell, C.E., Dam-Johansen, K.: Anticorrosive coatings – a review. JCT Research, 6(2) 135 – 177 (2009)
8. Petersen, T.U. et al. (2013): Edge scour around scour protection at wind turbine foundations. Paper to be submitted to Coastal Engineering. The paper is a part of T.U. Petersen’s PhD Thesis study conducted at the Technical University of Denmark under the supervision of B.M. Sumer.
9. Roulund, A., Sumer, B.M., Fredsøe, J. and Michelsen, J. (2005): Numerical and experimental investigation of flow and scour around a circular pile. J. Fluid Mechanics 534, 351 – 401.
10. Sumer, B.M. (2014): Flow-structure-seabed interactions in coastal and marine environments. J. Hydraulic Res., 52, Number 1, 1 – 13.
11. Sumer, B.M. and Nielsen, A.W. (2013): Sinking failure of scour protection at wind turbine foundation. Proceedings of the Institution of Civil Engineers–Energy, 166, EN4, 170 – 188.
12. Sumer, B.M., Petersen, T.U., Lucatelli, L., Fredsøe, J., Musumeci, R.E. and Foti, E. (2013): Backfilling of a scour hole around a pile in waves and current. J. Waterway, Port, Coastal and Ocean Engineering, ASCE 139, 9 – 23.
13. Wittrup, S. (2012): “Horseshoe vortex washes out the sediment around offshore wind turbines”, an article published in Ingeniøren/energi&miljø, 16. January, 2012. In Danish. http://ing.dk/artikel/125792-hestesko-hvirvler-vasker-bunden-omkring-havvindmoeller-vaek
14. R. Sharma: Electrical structure of future off-shore wind power plant with a high voltage direct current power transmission, Ph.D.-thesis, Technical University of Denmark, Department of Electrical Engineering, 2011.
15. Sharma, Ranjan; Wu, Qiuwei; Cha, Seung-Tae; Jensen, Kim H.; Rasmussen, Tonny Wederberg; Østergaard, Jacob: Power Hardware In The Loop Validation of Fault Ride Through of VSC HVDC Connected Offshore Wind Power Plants, Journal of Modern Power Systems and Clean Energy, Vol. 2, No. 1, 2014, p. 23 – 29.
Chapter 15
References

DTU International Energy Report 2014
Page 102 — References
16. Fujin Deng: Design and Control of A DC Grid for Offshore Wind Farms, Ph.D.-thesis, Department of Energy Technology, Aalborg University, 2012.
17. M. I. Blanco: “The economics of wind energy,” Renew. Sustain. Energy Rev., vol. 13, no. 6 – 7, pp. 1372–1382, Aug. 2009.
18. R. Green and N. Vasilakos: “The economics of offshore wind,” Energy Policy, vol. 39, no. 2, pp. 496 – 502, Feb. 2011.
19. Roland Berger Strategy Consultants: “Offshore Wind Toward 2020: On the Pathway to Cost Competitiveness,” 2013.
20. S. Azau and Z. Casey, Eds.: Wind in our Sails: The coming of Europe’s offshore wind energy industry. Brussels, BE: European Wind Energy Association, 2011.
Chapter 8
1. Vestas website , www.vestas.com (visited May 2014)
2. Siemens Wind Power website , http://www.energy.siemens.com/hq/en/ renewable-energy/wind-power/ (Visited May 2014)
3. Eize de Vries: “The top 10 biggest turbines in the world”, Wind Power Monthly 2014.
4. L. Bergami, H. Aagaard Madsen, F. Rasmussen: “A Two-Bladed Teetering Hub configuration for the DTU 10 MW RWT: loads considerations”, Proceedings of EWEA 2014.
5. Eize de Vries: “Close up–Envision’s 3.6MW offshore machine”, Wind Power Monthly, 2 February (2012). Anders Rebsdorf , Envision Energy (Denmark), www.envisioncn.com
6. DeepWind project , www.deepwind.eu (Visited May 2014).
7. P. Jamieson and M. Branney: “Multi-rotors: a solution to 20 MW and beyond?”, Energy Procedia 24, p. 52 – 59 (2012).
8. Peter Fuglsang , Siemens Wind Power A/S. www.siemens.dk/windpower.
9. Peter Fuglsang , Siemens Wind Power A/S. www.siemens.dk/windpower.
10. H. Aagaard Madsen, T.L. Andersen, L. Bergami, J. E. Jørgensen, T. Schettler, P. Michels, M. Schoebel, M. Heisterberg, M.B. Christensen, A. Candela Garolera, J. Holbøll: “Towards an industrial manufactured morphing trailing edge flap system for wind turbines”, Proceedings of EWEA 2014.
11. Henk Polinder et al.: ”Trends in Wind Turbine Generator Systems”, IEEE Journal of Emerging And Selected Topics in Power Electronics, Vol. 1, No. 3 (2013), pp. 174 – 185.
12. Web sites of top 10 biggest turbines: www.vestas.com, www.enercon.de, www.shi.samsung.co.kr, www.senvion.com, www.energy.siemens.com, www.alstom.com, www.sinovel.com, www.areva.com, www.gamesacorp.com, www.bard-offshore.de and www.xemc.com.cn .
13. A.B. Abrahamsen, N. Magnusson, D. Liu, E. Stehouwer, B. Hendriks and H. Polinder: “Design study of a 10 MW MgB2 superconductor direct drive wind turbine generator”, Proceedings of EWEA 2014.
14. C. Kirby, S. Calverley, E. Stehouwer and B. Hendriks: “Front-mounted magnetically-geared pseudo direct drive generator”, Proceedings of EWEA 2014.
15. S. Engström, T. Lyrner, M. Hassanzadeh, T. Stalin and J. Johansson: “Tall towers for large wind turbines”, Elforsk rapport 10:48 (2010).
16. Klaus Andersen , Department Offshore Wind – Esbjerg, Rambøll , www.ramboll.com.
17. Rune B. Nielsen: ”Innovative suction bucket jacket foundation hits ground bed”, Dong Energy media release, 28 August 2014. www.dongenergy.com.
18. D. Snieckus: “IN DEPTH: Statoil’s Hywind 2”, Recharge March 3 (2014).
19. H. G. Svendsen, K. O. Merz: “Control System for Start-up and Shut-down of a Floating Vertical Axis Wind Turbine”, Energy Procedia 35 (2013) 33 – 42.
20. F. Blåbjerg, M. Liserre and Ke Ma: “Power Electronics Converters for Wind Turbine Systems”, IEEE Transactions o n Industry Applications 48, p. 708 – 717 (2012).
21. R. Allan, Power Electronics: “SiC: A Rugged Power Semiconductor Compound To Be Reckoned With”, Power Electronics January 31 (2012).
22. Ranjan Sharma: “Electrical Structure of Future Off-shore Wind Power Plant with a High Voltage Direct Current Power Transmission”, PhD Thesis, Technical University of Denmark (2011).
23. T. Bayar: “Subsea Cables Bring Offshore Wind Power to the People”, RenewableEnergyWorld.com, December 19 (2013).
24. T. Mikkelsen et al.: ”A spinner-integrated wind lidar for enhanced wind turbine control”, Wind Energy 16, p. 625 – 643 (2013).
Chapter 9
1. http://www.renewableenergyworld.com/rea/blog/post/2013/12/postcard-from-the-future-122-wind-power-in-denmark
2. Söder, L. and Ackermann T.: 2012, Wind Power in Power Systems, Chapter 4 in Wind Power and Power Systems, Second Edition, T Ackermann (Ed.), John Wiley & Sons, Ltd.
3. Söder, L., Abildgaard, H., Estanqueiro, A., Hamon, C., Holttinen, H., Lannoye, E., Gomez-Lazaro, E., O’Malley, M., Zimmermann, U.: 2012, Experience and challenges with short-term balancing in European systems with large share of wind power, IEEE Transactions on Sustainable Energy 3(4), 853 – 861.
4. Ancillary Services: an overview of International Practices. ISBN: 978-2-85873-123-7. Cigré. October 2010
5. P. Kundur, J. Paserba, V. Ajjarapu, G. Andersson, A. Bose, C. Canizares, N. Hatziargyriou, D. Hill, A. Stankovic, C. Taylor, T. Van Cutsem, V. Vittal: Definition and Classification of Power System Stability. IEEE/CIGRE Joint Task Force on Stability Terms and Definitions. IEEE Transactions on Power Systems, Vol. 19, No. 2, pp. 1387 – 1401. May 2004.
6. 4th ETSO Report on Balance Management Harmonisation and Integration. January 2007. http://www.marketcoupling.com/document/1000/ETSO%20-%20Report%20on%20Balance%20Management%20Harmonisation%20and%20Integration.pdf.
7. https://emr.entsoe.eu/glossary/bin/view/ENTSO-E+Common+Glossary/?cid=248
8. Energinet.dk’s ancillary services strategy 2011 – 2015.
9. DS3: System Services Consultation – New Products and Contractual Arrangements. Eirgrid and SONI. June 2012.
10. THE GRID CODE. Issue 5 Revision 7. March 2014. National Grid Electricity Transmission plc

DTU International Energy Report 2014
References — Page 103
11. ERCOT CONCEPT PAPER. Future Ancillary Services in ERCOT. Electric Reliability Council of Texas, 2013.
12. Jesper Runge Kristoffersen and Peter Christiansen: Horns Rev offshore wind farm: its main controller and remote control system. Wind Engineering Volume 27, No 5 2003, p 351 – 360
13. Zhao Xu, Jacob Østergaard, and Mikael Togeby: Demand as Frequency Controlled Reserve. IEEE Transactions on Power Systems Vol 26, pp 1062 – 1071. August 2011.
14. Giebel, Gregor; Göçmen Bozkurt, Tuhfe; Sørensen, Poul Ejnar; Niels Kjølstad Poulsen, Jesper Runge-Kristoffersen: PossPOW: Possible Power of Offshore Wind power plants.
15. Cutululis, Nicolaos Antonio; Altiparmakis, Argyrios; Litong-Palima, Marisciel; Detlefsen, Nina; Sørensen, Poul Ejnar: Market and system security impact of the storm demonstration in task-forces TF2. TWENTIES Deliverable D16.6 (2013).
16. Andrej Gubina: REserviceS. Onshore wind supporting the Irish grid. D5.1 Irish Case Study Report. December 2013.
17. Juha Kiviluoma, Miguel Azevedo, Hannele Holttinen, Gustavo Quiñonez Varela: REserviceS D5.3. Iberian case study (transmission system). January 2014
18. Juha Kiviluoma, Miguel Azevedo, Hannele Holttinen, Argyrios Altiparmakis, Nicolaos Cutululis: REserviceS D5.4. Frequency reserves from wind power and PV in a large footprint. February 2014.
Chapter 10
1. Energy, G. E. (2010): Western wind and solar integration study (No. NREL/SR55047434). National Renewable Energy Laboratory (NREL), Golden, CO.
2. Focken U, and Lange M. (2006): Physical approach to short-term wind power prediction. Springer.
3. Giebel G, Brownsword R, Kariniotakis G, Denhard M, and Draxl C. (2011): The state-of-the-art in short-term prediction of wind power: A literature overview. ANEMOS.plus. Available at: http://www.prediktor.dk/publ/GGiebelEtAlStateOfTheArtInShortTermPrediction_ANEMOSplus_ 2011.pdf IOL. (2014) Available at: http://www.iol.co.za/scitech/science/environment/windenergypoweringahead-1.1705277#.U6 QLbLHp_CY
4. Iversen EB, Morales JM, Møller JK, and Madsen H. (2014): Probabilistic forecasts of solar irradiance using stochastic differential equations. Environmetrics, 25(3), 152 – 164.
5. Jones LE. (2011): Strategies and decision support systems for integrating variable energy resources in control centres for reliable grid operations. Available at: http://www1.eere.energy.gov/wind/pdfs/doe_wind_integration_report.pdf
6. Madsen, H. (2008): Time Series Analysis, Chapman and Hall.
7. Madsen H, Jensen US, and Pelgrum U. (1994): The development of a forecasting model for the prediction of wind power to be used in central dispatch centres. In EWEC 1994, Thessaloniki.
8. Meibom P, Hilger KB, Madsen H, and Winther D. (2013): Energy Comes Together in Denmark; The Key to a Future Fossilfree Danish Power System, IEEE Power and Energy Magazine, 11, 46 – 55.
9. Morales JM, Conejo AJ, Madsen H, Pinson P, and Zugno M. (2014): Integrating Renewables in Electricity Markets Operational Problems,” International Series in Operations Research and Management Science, Springer, New York, US. ISBN: 978 1 4614 9411 9.
10. Møller JK, Madsen H, and Nielsen HAa. (2008): Time Adaptive Quantile Regression. Computational Statistics and Data Analysis, 52, 1291 – 1303.
11. Møller JK, Pinson P, and Madsen H. (2013): Probabilistic forecasts of wind power generation by stochastic differential equation models. DTU Technical Report.
12. Nielsen HAa, Nielsen TS, and Madsen H (2011): An overview of wind power forecast types and their use in large scale integration of wind power. In Proceedings of the 10th International Workshop on Large scale Integration of Wind Power into Power Systems as well as on Transmission Networks for Offshore Wind Plants, Aarhus, Denmark, October 25 – 26 2011.
13. Nielsen HAa, Nielsen TS, Madsen H., Pindado MJSI, and Marti I (2007): Optimal combination of wind power forecasts. Wind Energy, 10 (5): 471 – 482
14. Petersen EL, and Troen I. (2012): Wind conditions and resource assessment. Wiley Interdisciplinary Reviews: Energy and Environment, 1(2), 206 – 217.
15. Pinson P, Nielsen HAa, Møller JK, Madsen H, and Kariniotakis GN. (2007): Non-parametric probabilistic forecasts of wind power: required properties and evaluation. Wind Energy, 10(6), 497 – 516.
16. Pinson P, Papaefthymiou G, Klöckl B and Verboomen J. (2009): Dynamic sizing of energy storage for hedging wind power forecast uncertainty. IEEE Power Engineering Society General Meeting 2009, Calgary, Canada
17. Pinson P (2012): Very short-term probabilistic forecasting of wind power with generalized logit-Normal distributions. Journal of the Royal Statistical Society, Series C, 61(4), 555 – 576
18. Pinson P (2013). Wind energy: Forecasting challenges for its operational management. Statistical Science, 28(4), 564 – 585.
19. Tastu J, Pinson P, Trombe PJ, and Madsen H. (2014a): Probabilistic forecasts of wind power generation accounting for geographically dispersed Information. IEEE Transactions on Smart Grid. 5(1), 480 – 489.
20. Tastu J, Pinson P, and Madsen H. (2014b): Space-time trajectories of wind power generation: Parameterized precision matrices under a Gaussian copula approach. Lecture Notes in Statistics: Modeling and Stochastic Learning for Forecasting in High Dimension, In press.
21. Trombe PJ, Pinson P, Vincent C, Bøvith T, Cutululis NA, Draxl C, Giebel G, Hahmann AN, Jensen NE, Jensen BP, Le NF, Madsen H, Pedersen LB, and Sommer A. (2013): Weather radars – The new eyes for offshore wind farms? Wind Energy. Available Online.
22. Wilkes J and Moccia J. (2013). Wind in power: 2012 European statistics. EWEA The European Wind Energy Association. Available at: http://www.ewea.org/fileadmin/files/library/publications/statistics/Wind_in_power_annual_statistics_2012.pdf
Chapter 11
1. Beurskens, L., Hekkenberg, M., and Vethman, P. (2011): Renewable energy projections as published in the National Renewable Energy Action Plans of the European member states – covering all 27 EU member states with updates for 20 member states.ECN/European Environmental Agency. ECN-E–10-069, 28 November 2011.
2. Danish Energy Agency/Energinet.dk. (2012): Technology data for energy plants. May 2012.
3. Danmarks Vindmølleforening (2014): Personal information.
4. European Commission, (2014): Guidelines on State aid for environmental protection and energy 2014 – 2020 (2014/C 200/01).

DTU International Energy Report 2014
Page 104 — References
5. Green, Richard; Vasilakos, Nicholas. (2011): The economics of offshore wind. Energy Policy (39): 496 – 502.
6. Hobohm, Jens; Krampe, Leonard; Peter, Frank; Gerken, Andree; Heinrich, Peter; Richter, Maik. (2013): Cost reduction potentials of offshore wind power in Germany. Prognos/Fichtner. Study commissioned by Stiftung Offshore-Windenergie.
7. IEA. (2010): Energy Technology Perspectives – Scenarios and Strategies to 2050. Paris.
8. MoU,( 2013): Memorandum of Understanding between the Minister for Communications, Energy and Natural Resources of Ireland and the Department of Energy and Climate Change of the United Kingdom on cooperation in the energy sector. Dublin, 24 January 2013.
9. Navigant (2013): World Market Update, A BTM Wind report, 26. March 2014
10. Schröder, Sascha Thorsten; Jørgensen, Birte Holst. (2011): Energy Supply Technologies: Wind Power. IEA Committee on Energy Research and Technology – Experts’ Group on R&D Priority Setting and Evaluation. Monitoring Progress towards a Clean Energy Economy, Paris.
11. Tegen, S.; Lantz, E.; Hand, M.; Maples, B.; Smith, A.; Schwabe, P. (2013): 2011 Cost of Wind Energy Review. NREL/TP-5000-56266.
12. Wiser, R., Yang, Z., Hand, M., Hohmeyer, O., Infield, D., Jensen, P. H., Nikolaev, V., O’Malley, M., Sinden, G., and Zervos, A. (2012a): Wind energy, chapter 7, pages 535 – 607. Renewable energy sources and climate change mitigation – special report of the Intergovernmental Panel on Climate Change, Cambridge University Press.
13. Wiser, R; Lantz, E.; Bolinger, M.; Hand, M (2012b): Recent developments in levelized cost of energy from U.S. Wind Power projects, February 2012.
Chapter 12
1. Bishop, I.D. and Miller, D.R., (2007): Visual assessment of offshore wind turbines: The influence of distance, contrast, movement and social variables. Renewable Energy, 32(5), pp. 814 – 831.
2. Borch, K., Lassen, J., and Jørgensen, R.B. (2003): EU reflects European public opinion. Letter 2. Nature Biotechnology 21(9): 976 – 976
3. Danish Energy Authority (2010): Kort om Vindmøller
4. BTM Consult (2014): World Market Update. Navigant Research, March 2014
5. Ellis, G., Barry, J., & Robinson, C. (2007): Many ways to say ‘no’, different ways to say ‘yes’: applying Q-methodology to understand public acceptance of wind farm proposals. Journal of environmental planning and management, 50(4), 517 – 551.
6. Gibbons, M. (1999): Science’s new social contract with society. Nature 402 supp.: c81 – c84
7. Haggett, C. (2008): Over the sea and far away? A consideration of the planning, politics and public perception of offshore wind farms. Journal of Environmental Policy & Planning, 10(3), 289 – 306.
8. Jensen, K., DONG Energy (2014): presentation at Annual meeting in the Danish Research Consortium for Wind Energy 2014).
9. Kempton, W., Firestone, J., Lilley, J., Rouleau, T. & Whitaker, P. (2005): The offshore wind power debate: views from Cape Cod, Coastal Management, 33, pp. 119 – 149.
10. Ladenburg, J. (2009): “Stated Public Preferences For Onshore and Offshore Wind Power Generation- A Review”. WIND ENERGY 12 (2): 171 – 181. doi:10.1002/we.308.
11. Leloudas, G., Zhu, W.J., Sørensen, J.N., Shen, W.Z. and Hjort, S., (2007): Prediction and reduction of noise from a 2.3 MW wind turbine, Journal of Physics: Conference Series 2007, IOP Publishing, pp. 012 – 083.
12. Lothian, A. (2008): Scenic perceptions of the visual effects of wind farms on South Australian landscapes. Geographical Research, 46(2), pp. 196 – 207.
13. Pedersen, E. (2003): Noise annoyance from wind turbines: a review. Naturvårdsverket.
14. Rogers, A.L. and Manwell, J.F., (2002): Wind turbine noise issues. Renewable Energy Research Laboratory, Amherst, pp. 1 – 19.
15. Scott, K. N. (2006): Tilting at offshore windmills: regulating wind farm development within the renewable energy zone, Journal of Environmental Law, 18(1), pp. 89 – 118.
16. Strachan, P. A., Lal, D. & von Malmborg, F. (2006): The evolving UK wind energy industry: critical policy and management aspects of the emerging research agenda, European Environment, 16, pp. 1 – 18.
17. Verbong, G. P. J., & Geels, F. W. (2010): Exploring sustainability transitions in the electricity sector with socio-technical pathways. Technological Forecasting and Social Change, 77(8), 1214 – 1221. doi:10.1016/j.techfore.2010.04.008
Chapter 13
1. Vestas: “Recyclability. Vestas abides by a strict definition of recyclability,” 2014. Retrieved from: http://www.vestas.com/en/about/sustainability#!recyclability
2. P. D. Andersen, M. Borup, and T. Krogh: “Managing long-term environmental aspects of wind turbines: a prospective case study,” Int. J. Technol. Policy Manag., vol. 7, no. 4, p. 339, 2007.
3. GWEC: “GLOBAL WIND STATISTICS 2013,” Brussels. 2014. Retrieved from: http://www.gwec.net/wp-content/uploads/2014/02/GWEC-PRstats-2013_EN.pdf
4. OECD/IEA: “Technology Roadmap Wind Energy 2013 Edition,” Paris. 2013.
5. K. Ortegon: “Preparing for end of service life of wind turbines.,” J. Clean. Prod., vol. 39, 2013.
6. E. Albers, H. Seifert, and U. Kühne: “Recycling of Wind Turbine Rotor Blades – Fact or Fiction?,” DEWI MAGAZIN, 34, Feb. 2009.
7. R. Cherrington: “Producer responsibility: Defining the incentive for recycling composite wind turbine blades in Europe.,” Energy Policy, vol. 47, 2012.
8. H. Hassing: “Livscyklusvurdering af vindmøller,” PSO 1999., Fredericia, 2001.
9. S. Properzi and H. Herk-Hansen: “Life cycle assessment of a 150 MW offshore wind turbine farm at Nysted/Roedsand, Denmark,” Int. J. Environ. Sustain. Dev., vol. 1, no. 2, p. 113, 2002.
10. E. Martínez, E. Jiménez, J. Blanco, and F. Sanz: “LCA sensitivity analysis of a multi-megawatt wind turbine,” Appl. Energy, vol. 87, no. 7, pp. 2293 – 2303, Jul. 2010.
11. K. Daubney: “Repowering trends enlivens second-hand turbine market,” Windpower Monthly, June. 2013. Retrieved from: http://www.windpowermonthly.com/article/1183990/repowering-trend-enlivens-second-hand-turbine-market.
12. K. Larsen: “Recycling wind,” Reinf. Plast., vol. 53, no. 1, pp. 20 – 25, Jan. 2009.
13. J. R. Kennerley, R. M. Kelly, N. J. Fenwick, S. J. Pickering, and C. D. Rudd: “The characterisation and reuse of glass fibres recycled from scrap composites by the action of a fluidised bed process,” Compos. Part A Appl. Sci. Manuf., vol. 29, no. 7, pp. 839 – 845, Jul. 1998.

DTU International Energy Report 2014
References — Page 105
14. J. L. Thomason, L. Yang, and R. Meier: “The properties of glass fibres after conditioning at composite recycling temperatures,” Compos. Part A Appl. Sci. Manuf., vol. 61, pp. 201 – 208, Jun. 2014. J. Beauson, H. Lilholt and P. Brøndsted: ”Recycling solid residues recovered from glass fibre-reinforced composites – A review applied to wind turbine blade materials,” Journal of Reinforced Plastics and Composites, published online 9 June 2014.
15. S. J. Pickering: Management, Recycling and Reuse of Waste Composites. Elsevier, 2010, pp. 65 – 101.
16. S. J. Pickering: “Recycling technologies for thermoset composite materials — current status,” Compos. Part A Appl. Sci. Manuf., vol. 37, no. 8, pp. 1206 – 1215, Aug. 2006.
17. S. J. Pickering, R. M. Kelly, J. R. Kennerley, C. D. Rudd, and N. J. Fenwick: “A fluidised-bed process for the recovery of glass fibres from scrap thermoset composites,” Compos. Sci. Technol., vol. 60, no. 4, pp. 509 – 523, Mar. 2000.
18. W. Kaminsky: Management, Recycling and Reuse of Waste Composites. Elsevier, 2010, pp. 192 – 213.
19. M. Blazsó: Management, Recycling and Reuse of Waste Composites. Elsevier, 2010, pp. 102 – 121.
20. R. E. Allred and L. D. Busselle: “Tertiary Recycling of Automotive Plastics and Composites,” J. Thermoplast. Compos. Mater., vol. 13, no. 2, pp. 92 – 101, Mar. 2000.
21. D. Akesson, Z. Foltynowicz, J. Christeen, and M. Skrifvars: “Microwave pyrolysis as a method of recycling glass fibre from used blades of wind turbines,” J. Reinf. Plast. Compos., vol. 31, no. 17, pp. 1136 – 1142, Aug. 2012.
22. S. Pimenta and S. T. Pinho: “Recycling carbon fibre reinforced polymers for structural applications: technology review and market outlook.,” Waste Manag., vol. 31, no. 2, pp. 378 – 92, Feb. 2011.
23. G. Oliveux, J.-L. Bailleul, and E. L. G. La Salle: “Chemical recycling of glass fibre reinforced composites using subcritical water,” Compos. Part A Appl. Sci. Manuf., vol. 43, no. 11, pp. 1809 – 1818, Nov. 2012.
24. C. C. Kao, O. R. Ghita, K. R. Hallam, P. J. Heard, and K. E. Evans: “Mechanical studies of single glass fibres recycled from hydrolysis process using sub-critical water,” Compos. Part A Appl. Sci. Manuf., vol. 43, no. 3, pp. 398 – 406, Mar. 2012.
25. W.F. Thomas: “An investigation of the factors likely to affect the strength properties of glass fibres,” Physics and Chemistry of Glass, 1, 4 – 18, 1960.
26. J.L. Thomason, J. Ure, L. Yang, C.C. Kao: “Mechanical study on surface treated glass fibres after thermal conditioning,” ECCM15 – 15th European Conference on Composite Materials. Venice. 2012.
27. J. L. Thomason, C. C. Kao, J. Ure, and L. Yang: “The strength of glass fibre reinforcement after exposure to elevated composite processing temperatures,” J. Mater. Sci., vol. 49, no. 1, pp. 153 – 162, Sep. 2013.
28. S. Feih, E. Boiocchi, G. Mathys, Z. Mathys, A. G. Gibson, and A. P. Mouritz: “Mechanical properties of thermally-treated and recycled glass fibres,” Compos. Part B Eng., vol. 42, no. 3, pp. 350 – 358, Apr. 2011.
14a.

DTU International Energy Report 2013
ENERGY STORAGE OPTIONS FOR FUTURE SUSTAINABLE ENERGY SYSTEMS
Edited by Hans Hvidtfeldt Larsen and Leif Sønderberg Petersen / DTU National Laboratory for Sustainable Energy / November 2013
Drivers and challenges for
energy development
t
ech
nol
ogy
Syst
em
s an
d
implem
entation
Barriers for
DTU International Energy Report 2012Energy efficiency improvementsA key element in the global transition to non-fossil energy
Edited by Hans Hvidtfeldt Larsen and Leif Sønderberg Petersen
DTU National Laboratory for Sustainable Energy
November 2012
Risø Energy Report 10Energy for smart cities in an urbanised world
Risø-R-1778(EN) November 2011 Edited by Hans Larsen and Leif Sønderberg Petersen
Risø Energy Report 8The intelligent energy system infrastructure for the future
Risø-R-1695(EN) September 2009 Edited by Hans Larsen and Leif Sønderberg Petersen
Risø Energy Report 9
Risø-R-1729(EN) November 2010Edited by Hans Larsen and Leif Sønderberg Petersen
Non-fossil energy technologies in 2050 and beyond
Risø Energy R
eport 9R
isø National Laboratory for Sustainable Energy, Technical U
niversity of Denm
ark
Risø Energy Report 9
Edited byHans Larsen and Leif Sønderberg Petersen
Reviewed byDiana Urge-Vorsatz, Central European University, HungaryLars J. Nilsson, Lund University, Sweden
Editorial consultantCharles Butcher, Science Journalist, UK
Copyright: Risø National Laboratory for Sustainable Energy, Technical University of Denmark, 2010
Risø-R-1729(EN)
ISBN 978-87-550-3812-7
ISBN 978-87-550-3813-4(Internet)
ISSN 0106‐2840
Recent volumes of DTU International Energy Report
Energy storage options for future sustainable energy systems, 2013November 2013. ISBN 978-87-550-3968-1
Energy storage technologies can be defined as technologies that are used to store energy in the form of thermal, electrical, chemical, kinetic or potential energy and discharge this energy whenever required. Energy storage technologies and systems are diverse and provide storage services at timescales from seconds to years. One of the great challenges in the transition to a non-fossil energy system with a high share of fluctuating renewable energy sources, such as solar and wind, is to align consumption and production in an economically satisfactory manner. This Report provides convincing evidence that energy storage can provide the necessary balancing power to make this possible.
Energy efficiency improvements – a key element in the global transition to non-fossil energy, 2012November 2012. ISBN 978-87-550-3965-0
Increasing energy efficiency, much of which can be achieved through low-cost measures, offers huge potential for reducing CO² emissions during the period up to 2050. With this background the report addresses the global, regional and national challenges in pursuing energy efficiency improvements, together with the main topics in research and development for energy efficiency. The report also analyses a selection of barriers hindering the broader implementation of energy efficiency improvements. Finally it gives examples of how more stringent performance standards and codes, as well as economic incentives, can unlock energy efficiency potential and scale up the financing of energy efficiency improvements.
Energy for smart cities in an urbanised world, 2011November 2011. ISBN 978-87-550-3905-6
Volume 10 takes as its point of reference the rapid urbanisation of the world. The report addresses energy related issues for smart cities, including energy infrastructure, onsite energy production, transport, economy, sustainability, housing, living and governance, including incentives and barriers influencing smart energy for smart cities.
Non-fossil energy technologies in 2050 and beyond, 2010November 2010. ISBN 978-87-550-3812-7The report analyses the long-term outlook for energy technologies in 2050 in a perspective where the dominating role of fossil fuels has been taken over by non-fossil fuels, and CO² emissions have been reduced to a minimum. Against this background, the report addresses issues like: How much will today’s non-fossil energy technologies have evolved up to 2050? Which non-fossil energy technologies can we bring into play in 2050, including emerging technologies? What are the implications for the energy system? Further the report analyses other central issues for the future energy supply: The role of non-fossil energy technologies in relation to security of supply and sustainability; System aspects in 2050; Examples of global and Danish energy scenarios in 2050.
The intelligent energy system infrastructure for the future, 2009September 2009. ISBN 978-87-550-3755-7
The report takes its point of reference in the need for the development of a highly flexible and intelligent energy system infrastructure which facilitates substantial higher amounts of renewable energy than today’s energy systems. The report presents a generic approach for future infrastructure issues on local, regional and global scale with focus on the energy system.
An overview of the complete report series is available at → www.natlab.dtu.dk/english/Energy_Reports

DT
U In
tern
ation
al Ene
rgy R
ep
ort 2
014
Wind energ
y — drivers and barriers for higher shares of w
ind in the global power generation m
ix Technical U
niversity of Denm
ark