dtt iab 14sept_v01
TRANSCRIPT

IAB report on online ad-spendH1 2011
September 2011
interactiveadvertisingbureau

IAB report on online ad-spend H1 2011 2
Introduction and summary
IAB report on online ad-spend H1 2011 3
This report provides us with a more detailed look at the growth drivers of our industry, e.g. automated trading which is clearly getting up to speed.
Businesses who provide their data make this report possible. This report is a benchmarking tool for the participants that will allow them to compare themselves to the industry.
We hope you enjoy reading this report. We welcome feedback for further improvement and hope to see even greater participation in the future.
It has been four months since the IAB and Deloitte published the online advertising spend report for The Netherlands in this new format. We are happy to report that the first edition received great feedback and that the current edition – which covers 2011 H1 – had even more respondents taking part.
Introduction
“Innovation in the digital advertising industry can only take place if we have all neccesary insights concerning the market. This reports deliveres this foundation.”
“Data is only as reliable as the level of participation. A more than representative sample of online businesses support this study by sharing their data and we are proud to see that the participation has increased.”
Joris van HeukelomChairman IAB
Roel van RijsewijkDeloitte Online Business Innovation
IAB report on online ad-spend H1 2011 4
Executive Summary
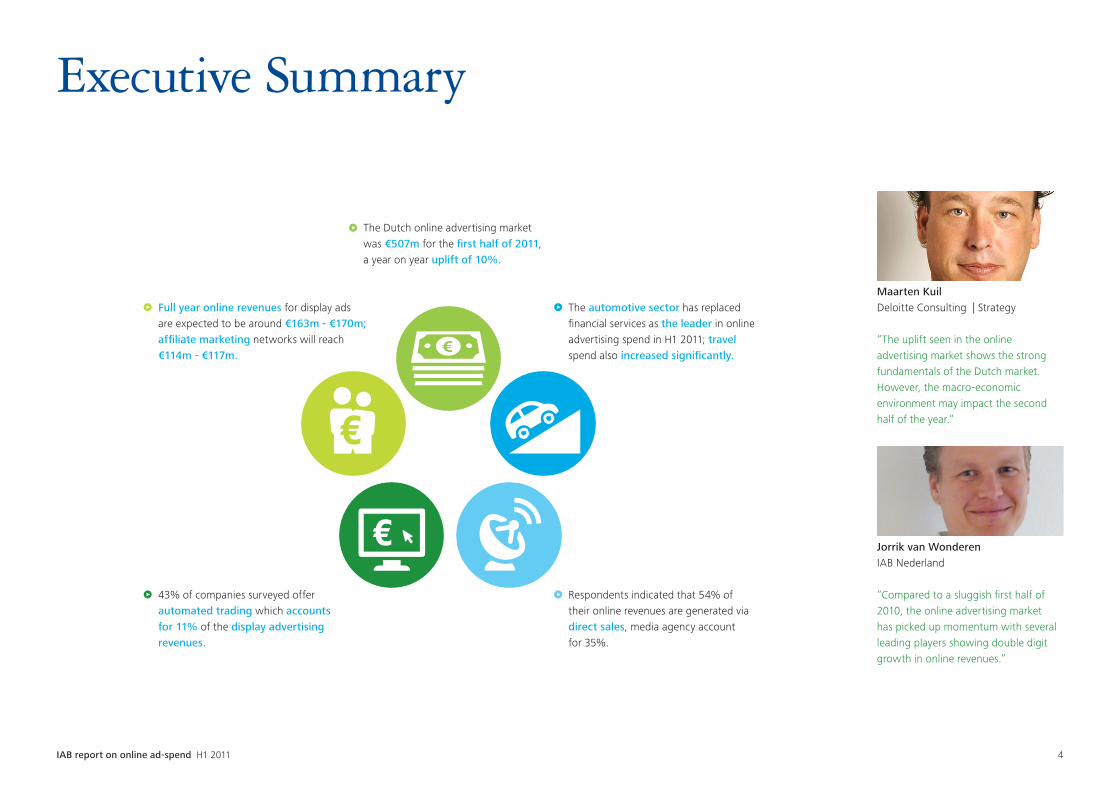
The Dutch online advertising market was €507m for the first half of 2011, a year on year uplift of 10%.
The automotive sector has replaced financial services as the leader in online advertising spend in H1 2011; travel spend also increased significantly.
Full year online revenues for display ads are expected to be around €163m - €170m; affiliate marketing networks will reach €114m - €117m.
Respondents indicated that 54% of their online revenues are generated via direct sales, media agency account for 35%.
43% of companies surveyed offer automated trading which accounts for 11% of the display advertising revenues.
“The uplift seen in the online advertising market shows the strong fundamentals of the Dutch market. However, the macro-economic environment may impact the second half of the year.”
“Compared to a sluggish first half of 2010, the online advertising market has picked up momentum with several leading players showing double digit growth in online revenues.”
Maarten KuilDeloitte Consulting | Strategy
Jorrik van Wonderen IAB Nederland

IAB report on online ad-spend H1 2011 5
H1 2011 Results
IAB report on online ad-spend H1 2011 6
Online advertising market
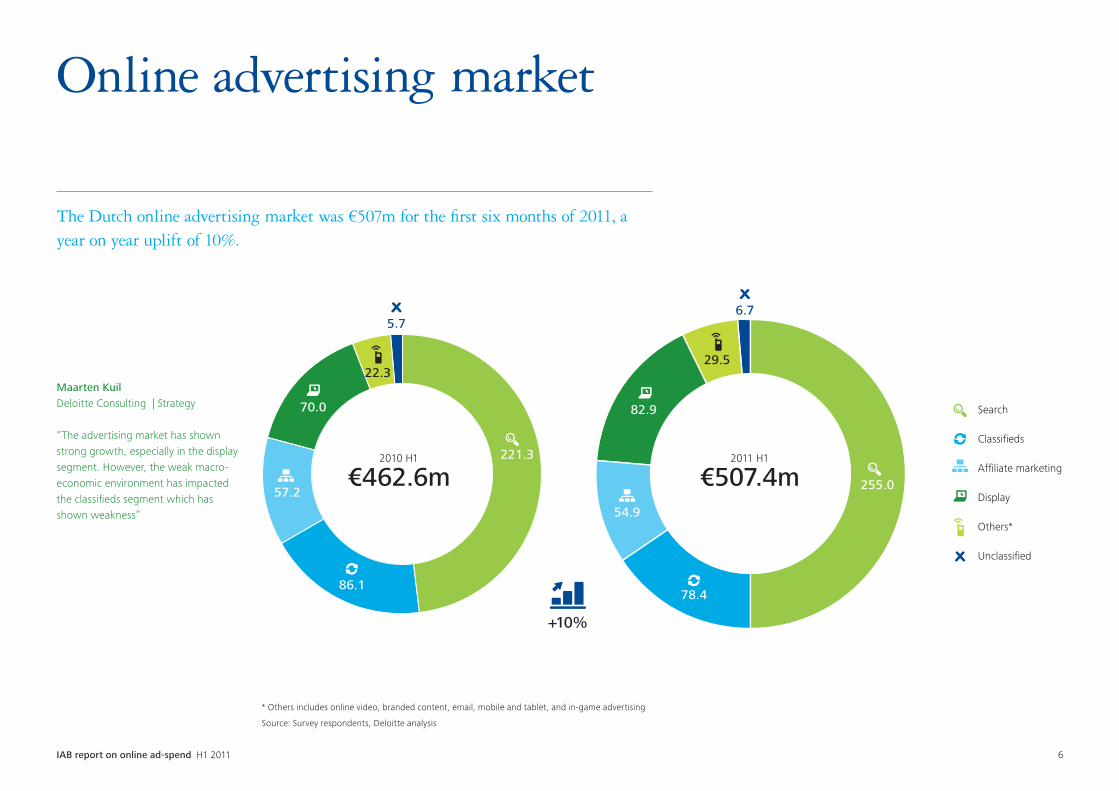
The Dutch online advertising market was €507m for the first six months of 2011, a year on year uplift of 10%.
* Others includes online video, branded content, email, mobile and tablet, and in-game advertising
Source: Survey respondents, Deloitte analysis
+10%
221.3
86.1
57.2
70.0
22.3
5.7
Search
Classifieds
Affiliate marketing
Display
Others*
Unclassified
6.7
29.5
82.9
54.9
78.4
255.0
2010 H1
€462.6m 2011 H1
€507.4m
Maarten KuilDeloitte Consulting | Strategy
“The advertising market has shown strong growth, especially in the display segment. However, the weak macro-economic environment has impacted the classifieds segment which has shown weakness”

IAB report on online ad-spend H1 2011 7
Details others categories
The market for online video posted only modest growth in the first half of 2011, mobile ads grew fast but remained small.
Segmentation performed based on reported survey data
Note: Online video excludes revenues from international Google properties including YouTube
Source: Survey respondents, Deloitte analysis
Branded content E-mail Mobile / TabletOnline video
16.6
13.1
10.2
6.2
1.3
1.81.2
0.2
+484%-29%
+64%
+27%
2011 H1
2011 H1
2010 H1
2010 H1
In-game
0.2
1.0
-80%
2011 H1
20
10 H1 2011 H120
10 H1
2011 H12010
H1
“While consumers are ready for mobile advertising, major advertisers are yet to get their game together.”
“The trend of online audiovisual communication combined with TV will grow even further into audiovisual planning instead of standalone TV or online planning. The type of screen does not matter anymore - it is the message that counts.”
Thijs KempersWegener
Jacqueline HeemskerkFox Channels Benelux
Break up of other revenues (€m)*

IAB report on online ad-spend H1 2011 8
Shares of advertising and visitors
Within traditional publishers, there remains a significant variety in the ratio of the share of wallet and share of visitors.
Advertising share / visitors share
Low
Average
High
0
2
4
6
8
10
12
Number of publishers
SoW
/ S
oR
111111111212111
0.0 0.2 0.3 0.5 0.6 0.7 0.8 0.9 1.1 1.31.6 1.7
2.9
5.6
10.7
1.0
Note: Excluding classifieds, search and affiliate marketing networks
Source: Survey respondents; Deloitte analysis
Comments
• The power ratio of the participating publishers shows a great diversity. The power ratio is calculated through dividing the Share of Wallet by the Share of Reach.
• Publishers with a specific target audience received a high advertising share relative to its visitors share.
IAB report on online ad-spend H1 2011 9
Top five industries
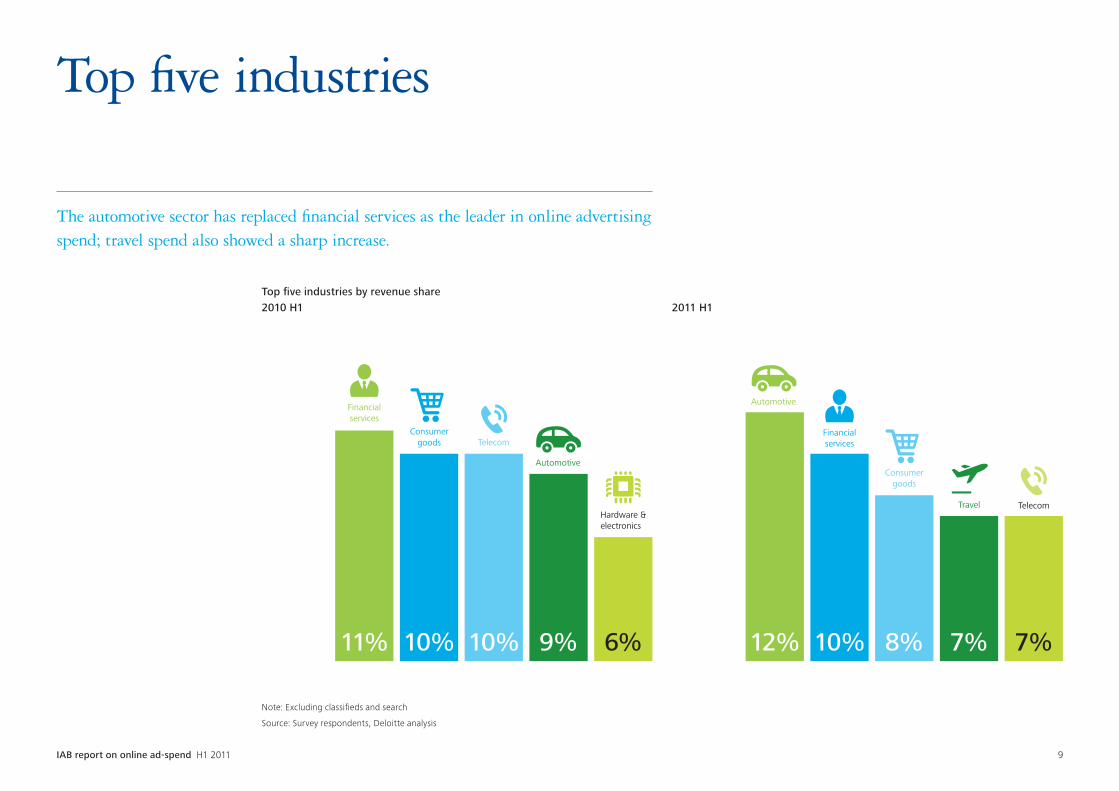
The automotive sector has replaced financial services as the leader in online advertising spend; travel spend also showed a sharp increase.
Top five industries by revenue share2010 H1 2011 H1
Automotive
Financialservices
Consumergoods Telecom
Automotive
Hardware &electronics
11% 10% 10% 9% 6%
Travel
12% 10% 8% 7% 7%
Financialservices
Consumergoods
Telecom
Automotive
Note: Excluding classifieds and search
Source: Survey respondents, Deloitte analysis
IAB report on online ad-spend H1 2011 10
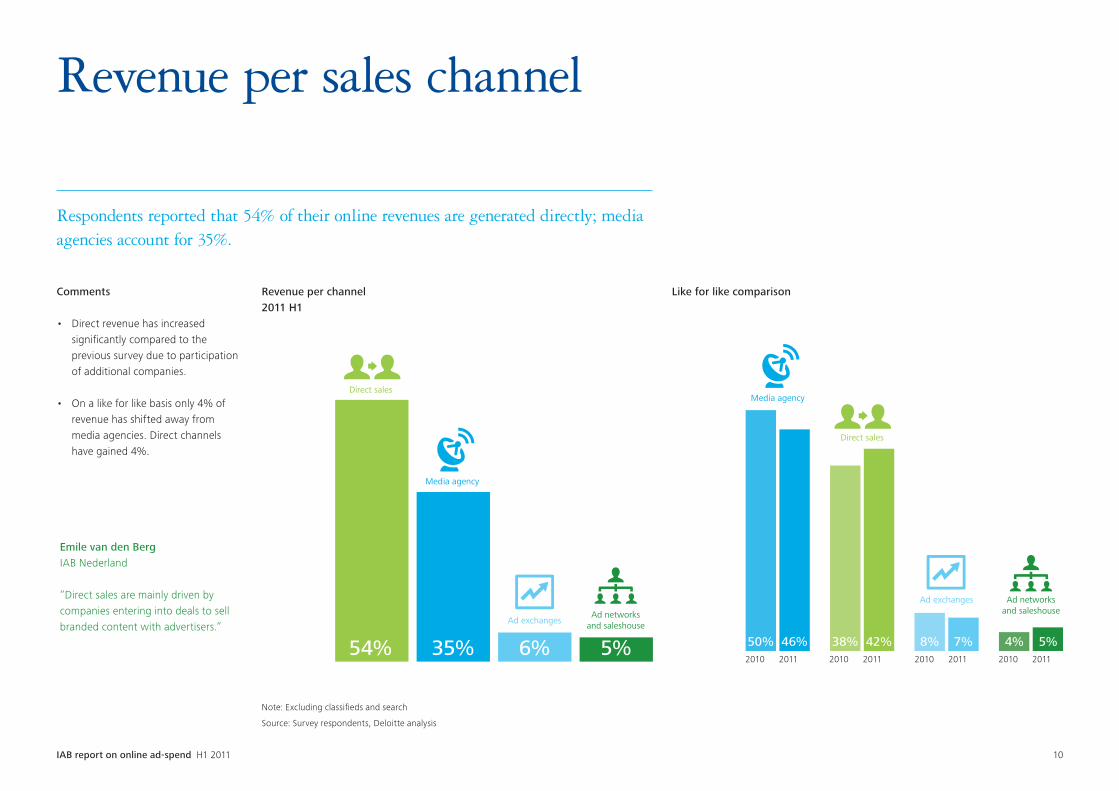
Revenue per channel2011 H1
Direct sales
Media agency
Ad exchangesAd networks
and saleshouse
35%54% 6% 5%
Media agency
Direct sales
Ad exchanges
50% 46% 38% 42% 8% 7% 4% 5%
Ad networksand saleshouse
Like for like comparisonComments
• Direct revenue has increased significantly compared to the previous survey due to participation of additional companies.
• On a like for like basis only 4% of revenue has shifted away from media agencies. Direct channels have gained 4%.
Respondents reported that 54% of their online revenues are generated directly; media agencies account for 35%.
Emile van den BergIAB Nederland
“Direct sales are mainly driven by companies entering into deals to sell branded content with advertisers.”
Note: Excluding classifieds and search
Source: Survey respondents, Deloitte analysis
Revenue per sales channel
IAB report on online ad-spend H1 2011 11
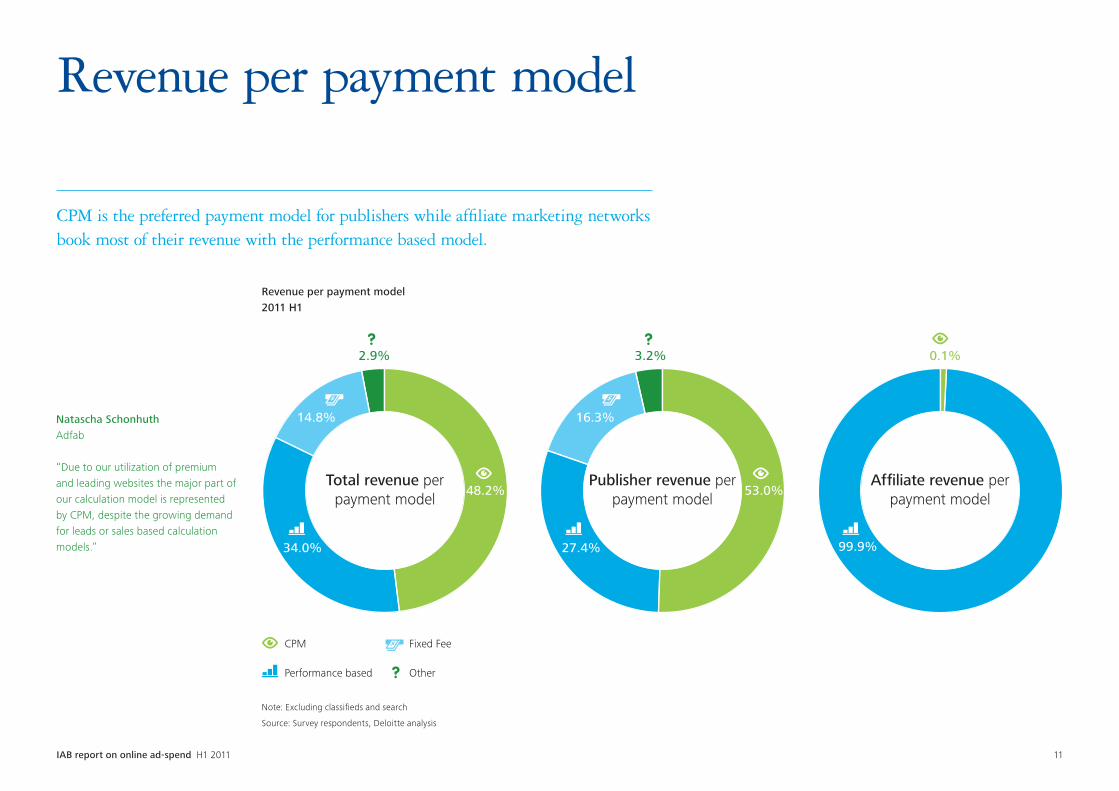
CPM is the preferred payment model for publishers while affiliate marketing networks book most of their revenue with the performance based model.
Revenue per payment model
Revenue per payment model2011 H1
Note: Excluding classifieds and search
Source: Survey respondents, Deloitte analysis
Natascha Schonhuth Adfab
“Due to our utilization of premium and leading websites the major part of our calculation model is represented by CPM, despite the growing demand for leads or sales based calculation models.”
48.2%
34.0%
14.8%
2.9%
53.0%
27.4%
16.3%
3.2% 0.1%
99.9%
CPM
Performance based
Fixed Fee
Other
Total revenue per payment model
Publisher revenue per payment model
Affiliate revenue per payment model

IAB report on online ad-spend H1 2011 12
11%
89%
43%
57% 68%
32%
Automated trading
Revenue from automated trading
# Companies offering automated trading
Companies offering automated trading
(weighted)*
43% of companies surveyed offer automated trading which is responsible for 11% of the revenues from display advertising.
Automated trading revenues
Automated trading revenues2011 H1
Note: Excluding classifieds and search
Source: Survey respondents, Deloitte analysis
* Weighed – Total revenue from companies offering automated trading (43% of all companies)
accounts for 68% of the total online advertising revenue
Janneke NiessenImprove Digital
“Automated trading has been growing significantly in the last year and we expect strong growth in the next years as well. Real-time bidding (RTB) has been shown to be an important driver for this growth in automated trading.”

IAB report on online ad-spend H1 2011 13
Direct revenues34%
Ad network / saleshouse16%
Automated trading agencies5%
Media agency29%
Ad exchange12%
Agency trading desks4%
Surveyed companies indicate their revenue sources for online advertisements through real-time bidding are quite evenly distributed.
Automated trading channels
Origin of display ads through automated trading 2011 H1
Note: Excluding classifieds and search
Source: Survey respondents (9), Deloitte analysis
Tim GeenenBanner Connect
“We are increasing the efficiency and scale in online advertising with more technology and automation. Real-time bidding, automated marketplaces and audience buying/selling are the key drivers of this change and we believe that this will create a solid ground for double digit growth numbers the next few years.”

IAB report on online ad-spend H1 2011 14
Outlook

IAB report on online ad-spend H1 2011 15
Revenue growth expectations
We foresee a market growth of 20% for 2012 based on the weighted average growth expectations of survey respondents.
Expectations of revenue growth
200%150%100%50%40%30%15%10%
1 1 2 1 7 2 3 2 1 1 1 13
7%5%4%0% 20%
number of respondents(total of 26)
Weighted average growth expectation*
Low
Average
High
2012 expectations
*Average growth expectation calculated by weighting responses with company revenue
Source: Survey respondents, Deloitte analysis
Maarten KuilDeloitte Consulting | Strategy
“Most companies have strong growth expectations with 21 respondents expecting 10% or more growth; naturally smaller companies are expecting to grow faster than larger ones.”

IAB report on online ad-spend H1 2011 16
CPS CPC CPL Fixed Fee CPM
022011
2012 11
2
4
5
13
97Which payment model will grow
fastest in 2012? (by number of respondents)
Which payment model will grow fastest in 2011?
Payment model growth expectations
Most respondents expect CPM and Fixed fee to remain the preferred payment models in 2012 with CPM remaining dominant.
Natascha Schonhuth Adfab
“Given the extended demand for content integration, our calculation model for fixed fee agreements is rising exponentially and this tendency will probably continue to do so.”
Thijs KempersWegener
“CPM is the most transparent and honest payment model for advertiser and publisher. It is not fair to award a consumer action to one single banner view or click.”
Source: Survey respondents, Deloitte analysis
IAB report on online ad-spend H1 2011 17
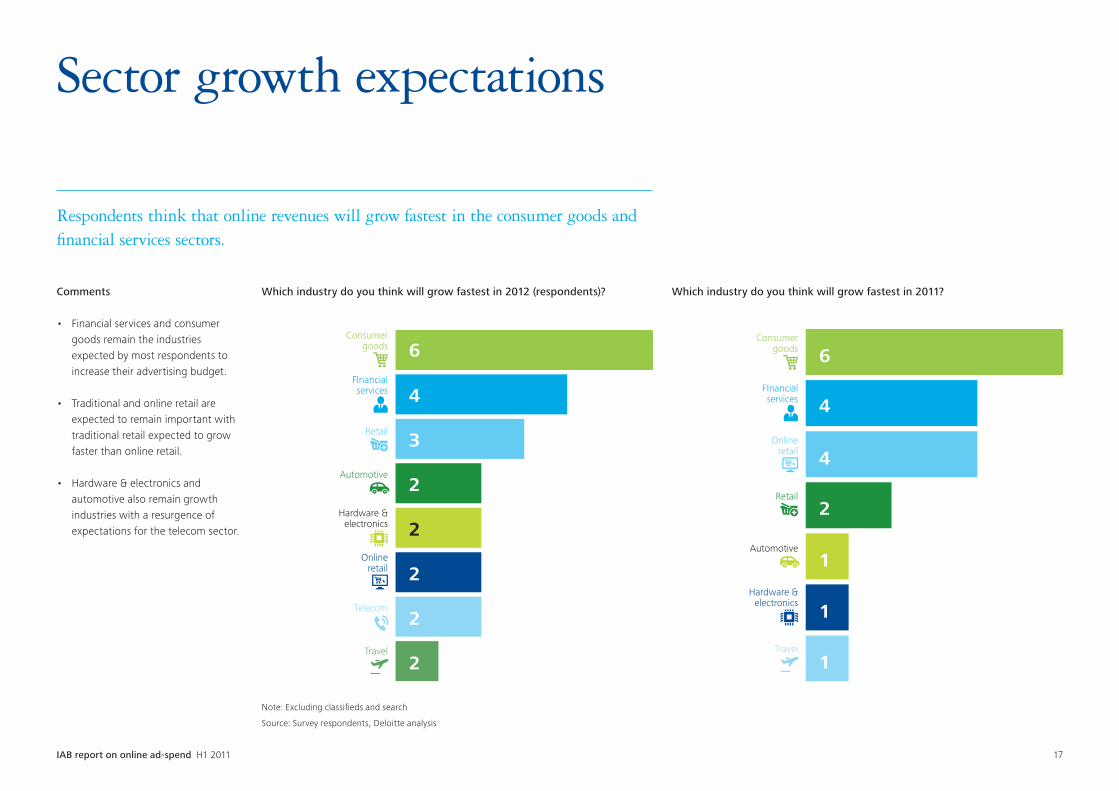
4
6
3
2
2
2
2
2
Hardware &electronics
Online retail
Telecom
Travel
Automotive
Retail
FInancial services
Consumergoods
6
4
4
2
1
1
1
Hardware &electronics
Online retail
Travel
Automotive
FInancial services
Consumergoods
Retail
Which industry do you think will grow fastest in 2012 (respondents)? Which industry do you think will grow fastest in 2011? Comments
• Financial services and consumer goods remain the industries expected by most respondents to increase their advertising budget.
• Traditional and online retail are expected to remain important with traditional retail expected to grow faster than online retail.
• Hardware & electronics and automotive also remain growth industries with a resurgence of expectations for the telecom sector.
Respondents think that online revenues will grow fastest in the consumer goods and financial services sectors.
Sector growth expectations
Note: Excluding classifieds and search
Source: Survey respondents, Deloitte analysis
IAB report on online ad-spend H1 2011 18
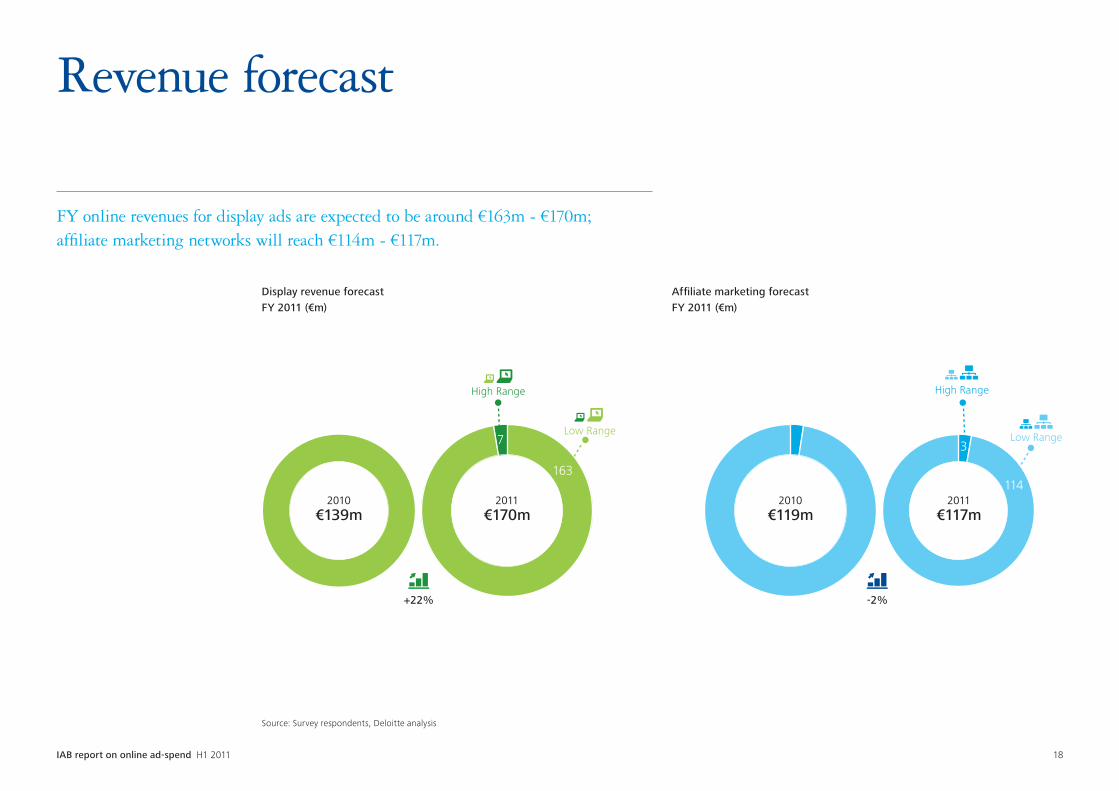
Revenue forecast
FY online revenues for display ads are expected to be around €163m - €170m; affiliate marketing networks will reach €114m - €117m.
Source: Survey respondents, Deloitte analysis
-2%+22%
2010€139m
2011€170m
2010€119m
2011€117m
High Range
114163
37Low Range
High Range
Low Range
Display revenue forecast FY 2011 (€m)
Affiliate marketing forecast FY 2011 (€m)

IAB report on online ad-spend H1 2011 19
Appendix

IAB report on online ad-spend H1 2011 20
Online advertising market
• The report includes included data from 32 companies including the largest publishers in The Netherlands e.g. TMG, Sanoma Media, Wegener Media and Microsoft.
• Together, these companies represent nearly 334 websites and comprise over 77% of total reach (based on STIR). Corrections for other sites not reported by STIR are based on Comscore data.
• Figures are based on data as reported by survery respondents and has not been independently verified.
• Wherever needed we have used tools such as statistical instead of regression analysis to make estimations regarding issues like total advertising spend.
• Based on the information provided by survey participants, figures have been adjusted for double counting.
Search and classifieds estimates
• Due to limited availability of company data we estimated the market size for search and classifieds based on market data.
• Together with the taskforce search from the IAB we defined the search market and estimated the market size.
• Attempts were made to verify data with market leader Google but due to company regulations they could not comment on our findings.
• The classified market is based on publicly available market estimates. Due to limited data input current classified market size could not be verified.
Methodology

IAB report on online ad-spend H1 2011 21
Online advertising market
• Display advertising revenue: Generated by advertising on publishers’ sites, where size and location on the site are agreed upon. For example banners, skyscrapers, medium rectangles, leaderboards and rich media.
• Online classifieds & directories: Revenue generated by publishing a classified add on a website.
• Branded content (content integration): A fusion of content and advertising which may or may not include ad elements such as display advertising, brand logos, advertorial or pre-roll video.
• E-mail marketing: Revenue generated by publishing the ad within the content of e-mail newsletters. Both display adds and sponsored content.
• Online video advertising: Revenue generated by advertising in, on or around online video. Standard formats are pre-roll, mid-roll and post-roll. The ad can be published during, before or after the online video.
• In-game advertising: Revenue generated by advertising, where the ad is published within a computer game (bought by a retailer), or within an online video game (via a console, pc, mobile, laptop with internet connection).
• Dedicated mobile: Revenue generated by advertising unique to mobile and tablets. For example apps and mobile websites.
Search and classifieds estimates
• CPM: Cost per Mille = Payment model where the advertiser pays per thousand impressions.
• CPL: Cost per Lead = Payment model that is based on the number of leads generated. A lead is an online conversion where the consumer shares its contact details and indicates a specific interest.
• CPC: Cost per Click = Payment model based on the number of clicks on an advertisement.
• CPS: Cost per Sale = Payment model based on the number of sales generated.
• Fixed Fee: Payment model based on a fixed fee.
Definitions

IAB report on online ad-spend H1 2011 22
Name of company
1 Adfab
2 Adfactor
3 Adlantic Online Advertising B.V.
4 Affilinet Nederland B.V.
5 Bannerconnect
6 Elsevier B.V.
7 FD Mediagroep
8 Fox Networks
9 Funda Real Estate B.V.
10 HDC Media
11 Hi-media Nederland B.V.
12 IMNetworks B.V.
13 Kluwer
14 Microsoft
15 MTV Networks
16 OMG/Netdirect
Name of company
17 Persgroep Advertising
18 RTL Nederland Interactief
19 Sanoma Media
20 SBS
21 Smartclip
22 Ster
23 Telegraaf Media Groep
24 Testnet Online Advertising
25 The Mbuyu Community B.V.
26 TTG Sulake
27 VNUMedia
28 WebAds Interactive Advertising
29 Webregio Media
30 Wegener Media B.V.
31 Zoom.in
List of survey participants
Note: several anonymous participants have delivered partial data for this report

IAB report on online ad-spend H1 2011 23
Jorrik van Wonderen IAB Research Manager Tel: +31 (0)20 531 51 19Email: [email protected]
Jorrik is responsible for Dutch IAB research including the IAB / Deloitte Ad Spend Study, all IAB commissioned research and assisting IAB members with their research projects. He is also responsible for shaping the IAB knowledge base so that it meets members’ needs moving forward.
Maarten KuilDeloitte Consulting | StrategyTel: +31 (0)6 12 345 133Email: [email protected]
Maarten is responsible for the National Media accounts within Deloitte Consulting. He has over 14 years experience in strategic, organizational and multi-disciplinary projects. He is specialized in strategy development, strategic due diligence/M&A, business case development and performance improvement.
Roel van RijsewijkDeloitte Online Business InnovationTel: +31 (0)6 52 615 087Email: [email protected]
Roel is a Director with the Risk Services practice from Deloitte with more than 10 years of experience in risk consulting for companies in the Technology, Media & Telecommunications (TMT) industry. Roel leads one of Deloitte’s main innovation projects on ethics and trust in a digital world and is co-founder of Deloitte’s Online Business Innovation group.
For questions concerning this research feel free to contact:
Contact details

Disclaimer: Deloitte refers to one or more of Deloitte Touche Tohmatsu Limited, a UK private company limited by guarantee, and its network of member firms, each of which is a legally separate and independent entity. Please see www.deloitte.com/about for a detailed description of the legal structure of Deloitte Touche Tohmatsu Limited and its member firms.
Deloitte provides audit, tax, consulting, and financial advisory services to public and private clients spanning multiple industries. With a globally connected network of member firms in more than 150 countries, Deloitte brings world-class capabilities and high-quality service to clients, delivering the insights they need to address their most complex business challenges. Deloitte’s approximately 182,000 professionals are committed to becoming the standard of excellence.
This publication contains general information only, and none of Deloitte Touche Tohmatsu Limited, its member firms, or their related entities (collectively, the “Deloitte Network”) is, by means of this publication, rendering professional advice or services. Before making any decision or taking any action that may affect your finances or your business, you should consult a qualified professional adviser. No entity in the Deloitte Network shall be responsible for any loss whatsoever sustained by any person who relies on this publication.
© 2011 Deloitte The Netherlands