dtrace: dynamic tracing for solaris -
TRANSCRIPT

DTrace: Cantrill, Shapiro 3/11/02 Sun Proprietary/Confidential: Internal Use Only 1
Bryan Cantrill(bmc@eng)
DTrace: Dynamic Tracing For Solaris
Solaris RAS/Performance
Mike Shapiro(mws@eng)
Solaris Kernel Technologies

DTrace: Cantrill, Shapiro 3/11/02 Sun Proprietary/Confidential: Internal Use Only 2
Bryan Cantrill(bc30992@japan)
DTrace: Dynamic Tracing For Solaris
Solaris RAS/Performance
Mike Shapiro(ms36066@sfbay)
Solaris Kernel Technologies
ITO
PS APPR
OVED

DTrace: Cantrill, Shapiro 3/11/02 Sun Proprietary/Confidential: Internal Use Only 3
A Modern Tracing Framework
" Must have zero probe effect when disabled" Must allow for novel tracing technologies
" Must allow for thousands of probes
" Must allow arbitrary numbers of consumers" Unwanted data must be pruned as early as
possible in the data chain
" Data must be coalesced whenever possible, and as early as possible

DTrace: Cantrill, Shapiro 3/11/02 Sun Proprietary/Confidential: Internal Use Only 4
The DTrace Vision" Build a tracing framework that provides
concise answers to arbitrary questions" Enable quantum leap in performance
analysis and engineering
" Improve RAS through continuous tracing
" Accelerate project development" Eliminate DEBUG and other special kernels:
all facilities available in production

DTrace: Cantrill, Shapiro 3/11/02 Sun Proprietary/Confidential: Internal Use Only 5
IBM MVS Tracing
" MVS provided wealth of tracing facilities, notably GTF and CTRACE
" IPCS console provided commands to enable, filter, and display GTF, CTRACE trace records
" Extensive probes provided for base operating system, channel programs
" GTRACE() assembler macro used to record data in a user program; can later be merged

DTrace: Cantrill, Shapiro 3/11/02 Sun Proprietary/Confidential: Internal Use Only 6
GTF Example" Operator console:
START GTF.EXAMPLE1AHL103I TRACE OPTIONS SELECTED−−SYSM,USR,DSP00 AHL125A RESPECIFY TRACE OPTIONS OR REPLY UREPLY 00,UAHL031I GTF INITIALIZATION COMPLETE
" IPCS GTFTRACE output:
DSP ASCB 00F44680 CPU 001 PSW 070C1000 TCB 00AF2370 R15 80AF2858 R0 00000001 R1 FDC9E5D4
GMT−07/02/89 00:29:08.155169...

DTrace: Cantrill, Shapiro 3/11/02 Sun Proprietary/Confidential: Internal Use Only 7
GTF Example" Operator console:
START GTF.EXAMPLE1AHL103I TRACE OPTIONS SELECTED−−SYSM,USR,DSP00 AHL125A RESPECIFY TRACE OPTIONS OR REPLY UREPLY 00,UAHL031I GTF INITIALIZATION COMPLETE
DSP ASCB 00F44680 CPU 001 PSW 070C1000 TCB 00AF2370 R15 80AF2858 R0 00000001 R1 FDC9E5D4
GMT−07/02/89 00:29:08.155169...
address spacecontrol block
processorstatus word
taskcontrol block
saved registervalues
dispatchevent on CPU1

DTrace: Cantrill, Shapiro 3/11/02 Sun Proprietary/Confidential: Internal Use Only 8
VTRACE
" Kernel tracing framework developed early in Solaris 2 (1991)
" Provided a C macro to designate a probe site; some probe effect even when disabled
" Additionally, applications could issue fast trap to record events in in-kernel buffer
" In-kernel buffers could be continuously read out and streamed to disk

DTrace: Cantrill, Shapiro 3/11/02 Sun Proprietary/Confidential: Internal Use Only 9
VTRACE, cont.
" Scalable and lightweight when enabled
" Fair coverage: ≈1,000 trace points
" Used to solve real performance problems" As a result of disabled probe effect,
required a special kernel " Fell into disrepair during 64-bit port

DTrace: Cantrill, Shapiro 3/11/02 Sun Proprietary/Confidential: Internal Use Only 10
TNF
" Trace Normal Form tracing framework introduced in Solaris 2.5
" Originally a user-level framework (LSARC 1993/650); kernel support tacked on (PSARC 1994/165)
" Like VTRACE, provides C macro to designate a probe site; induces load, compare and branch even if disabled

DTrace: Cantrill, Shapiro 3/11/02 Sun Proprietary/Confidential: Internal Use Only 11
TNF, cont." Uses pseudo per-CPU buffering, resulting
in suboptimal CPU scaling
1 5 10 15 20 250
500
1000
1500
2000
2500
3000
TNF Performance
CPUs
Nan
osec
onds
per
pro
be

DTrace: Cantrill, Shapiro 3/11/02 Sun Proprietary/Confidential: Internal Use Only 12
TNF, cont." Some of TNF’s failings:
� Too few probes (≈30 probes in common kernel code)
� Crude filtering (only based on process ID, and even then doesn’t work for scheduling events)
� No control over data generated by each probe
� Doesn’t allow for continuous collection of data
� Doesn’t correlate kernel data to application activity
� Bizarre data format designed for use only in postmortem analysis

DTrace: Cantrill, Shapiro 3/11/02 Sun Proprietary/Confidential: Internal Use Only 13
KernInst" Kernel instrumentation tool developed at
Wisconsin [Tamches, Miller, et al.]" User-level daemon performs run-time
register analysis of kernel object code
" Code patches, trampoline code, and instrumentation are inserted using driver
" Overcomplicated by living outside of core OS
" Does not provide sufficient predicate support" Unsafe probe insertion causes OS failure!

DTrace: Cantrill, Shapiro 3/11/02 Sun Proprietary/Confidential: Internal Use Only 14
Linux DProbes
" Dynamic instrumentation kit for Linux kernel [ Moore, IBM LTC, et al. ]
" Replaces kernel text with breakpoint trap that vectors to user RPN probe program
" Also provides access to Intel debug registers
" Currently under active development
" DProbes facility not part of stock kernel" Significant safety issues (more later ...)

DTrace: Cantrill, Shapiro 3/11/02 Sun Proprietary/Confidential: Internal Use Only 15
Competitive Landscape
user/kernel/merged
probe coverage
disabled probe effect
scalability
safety
extensibility
data filtering
arbitrary recording
self describing
run-time analysis
stock availability
stable abstractions
Feature GTF vtrace TNF KInst DProbe Notes
M M M K K users want combined timelineof user and kernel events
framework must provide sufficientprobes to solve most problems
ideal framework has zero probeeffect when disabled
concurrent probe firings mustscale to arbitrary number of CPUs
no way for user to induce fatalmachine or OS failure
framework should allow easyaddition of probes and providers
users should be able to filter onarbitrary conditions at probe site
users should be able to recordarbitrary data on probe firing
type information available toconsumers for all recorded data
run-time analysis tools should beprovided, not just post-mortem
tracing facilities must beavailable on production systems
framework must provide stableabstractions for layered tools

DTrace: Cantrill, Shapiro 3/11/02 Sun Proprietary/Confidential: Internal Use Only 16
Providers
" Tracing frameworks have historically been tied to a single tracing methodology
" Conversely, new tracing methodologies have had to invent their own frameworks
" In DTrace, the tracing framework is formally separated from tracing providers
" Allows for faster adoption of and provides significant leverage for novel tracing methodologies

DTrace: Cantrill, Shapiro 3/11/02 Sun Proprietary/Confidential: Internal Use Only 17
Probes
" A trace point in DTrace is called a probe
" A probe is identified by a tuple consisting of Provider, Module, Function and Name
" Probes may have Module and Function unspecified (such probes are said to be unanchored)
" Each probe has a unique 32-bit ID

DTrace: Cantrill, Shapiro 3/11/02 Sun Proprietary/Confidential: Internal Use Only 18
Predicates and Actions
" Idea: Provide flexible boolean expressions that can control tracing activities, e.g.if ( pid == process of interest) then trace data of interest
" Must allow completely arbitrary queries to be formulated by user or layered tool
" Must evaluate at probe firing time to prune data stream at earliest opportunity

DTrace: Cantrill, Shapiro 3/11/02 Sun Proprietary/Confidential: Internal Use Only 19
Provider Interface
" Provider makes available all known probes" Framework calls into provider to enable a
specific probe" Framework handles multiplexing of
multiple consumers of a single probe
" Provider indicates that an enabled probe is hit by calling dtrace_probe (), specifying probe ID

DTrace: Cantrill, Shapiro 3/11/02 Sun Proprietary/Confidential: Internal Use Only 20
dtrace_probe ()
" dtrace_probe () is called to take appropriate actions (if any) when an enabled probe is hit
" Can be called from any context in which C may be called, e.g.:� From high-level interrupt context
� While interrupts are disabled
� In synchronization primitives (e.g. mutex_enter ())
� While dispatcher locks are held

DTrace: Cantrill, Shapiro 3/11/02 Sun Proprietary/Confidential: Internal Use Only 21
dtrace_probe (), cont.
" Disables interrupts for its duration� Substantially simpler than implementing lock-free
data structures
� Prevents preemption, CPU migration
� As fast as performing an atomic memory operation
� Synchronous cross calls can be used to guarantee that no threads remain in critical section
" Converts probe ID to internal data structure for further processing

DTrace: Cantrill, Shapiro 3/11/02 Sun Proprietary/Confidential: Internal Use Only 22
dtrace_probe (), cont.
" Iterates over a per-probe chain of enabling control blocks (ECBs)
" Each ECB corresponds to an enabling of a probe
" The ECB abstraction allows:� A given consumer to have multiple, different
enablings of a single probe
� Disjoint consumers to have disjoint enablings of a single probe

DTrace: Cantrill, Shapiro 3/11/02 Sun Proprietary/Confidential: Internal Use Only 23
Enabling Control Blocks
" Each ECB contains:� An optional predicate
� A list of one or more actions
� A pointer to an array of per-CPU buffers
" Each ECB has a corresponding enabled probe ID (EPID)
" EPID space is per consumer

DTrace: Cantrill, Shapiro 3/11/02 Sun Proprietary/Confidential: Internal Use Only 24
Enabling Control Blocks, cont.
" Actions are taken on an ECB if and only if:� There does not exist a predicate, or
� The predicate evaluates to a non-zero value
" Actions may identify data to be stored into a trace record
" Actions need not generate trace data� May update variable state (more later)
� May affect system state in a defined way (e.g. breakpoint, panic)

DTrace: Cantrill, Shapiro 3/11/02 Sun Proprietary/Confidential: Internal Use Only 25
Trace RecordsEPID data EPID
data EPID data
data, cont.
EPID data
" Record size is constant per ECB (and therefore per EPID)
" Records consist of 32-bit EPID, followed by some amount of data
" Library determines record size and layout using a separate EPID dictionary

DTrace: Cantrill, Shapiro 3/11/02 Sun Proprietary/Confidential: Internal Use Only 26
Trace Records, cont.
" Library’s EPID dictionary can be built dynamically: as a new EPID is seen in the data stream, the library queries for the corresponding record size and layout
" Separating the data stream from the metadata stream facilitates run-time analysis tools
" Lack of data/metadata separation is a serious deficiency in TNF

DTrace: Cantrill, Shapiro 3/11/02 Sun Proprietary/Confidential: Internal Use Only 27
Buffers
" Buffers are per consumer, per CPU" Buffers are always allocated in pairs: an
active buffer and a spare buffer" A buffer is consumed by:
� Issuing a synchronous cross call to the corresponding CPU to switch active buffer with spare buffer
� Copying out used portion of newly spare buffer (formerly the active buffer) to user-level

DTrace: Cantrill, Shapiro 3/11/02 Sun Proprietary/Confidential: Internal Use Only 28
Buffer Management
" If buffer is full when a data-generating action is taken, a per-buffer drop count is incremented and no action is taken
" It is up to consumers to minimize drop counts by reading buffers sufficiently often
" Drop counts are copied out to user-level alongside buffer data; consumers always know if data is incomplete

DTrace: Cantrill, Shapiro 3/11/02 Sun Proprietary/Confidential: Internal Use Only 29
Buffer Management, cont.
" A consumer may optionally indicate that a buffer is to be treated as a ring buffer
" Ring buffers wrap on overflow, writing over older data
" Consumers can avoid data loss by reading buffer sufficiently often
" Useful primarily to provide “black box” style event recording

DTrace: Cantrill, Shapiro 3/11/02 Sun Proprietary/Confidential: Internal Use Only 30
Function Boundary Tracing
" Would like a probe before every function entry and after every function return
" Would like to implement probes by hot patching kernel text only when enabled -- thereby avoiding performance effect when disabled
" But how to hot patch text?

DTrace: Cantrill, Shapiro 3/11/02 Sun Proprietary/Confidential: Internal Use Only 31
Branch Insertion?
" Idea is to patch probe point to be an annulled branch-always into a jump table
" Must perform static analysis to ascertain dead registers
" Analysis must somehow statically determine trap level; failure to do so can induce RED state exception
" e.g. KernInst

DTrace: Cantrill, Shapiro 3/11/02 Sun Proprietary/Confidential: Internal Use Only 32
Software Trap Insertion?
" Idea is to patch desired code to be a trap-always instruction
" Must perform static analysis to avoid placing trap-always instruction where trap level can be non-zero
" Failure to do so can induce RED state exception
" e.g. Hot Diagnosis

DTrace: Cantrill, Shapiro 3/11/02 Sun Proprietary/Confidential: Internal Use Only 33
Branch Insertion, revisited
" If we only patch a function’s initial save instruction, we solve both of the problems with branch insertion:� Trap level is implicitly considered: code at TL > 0
may not arbitrarily issue a save
� Register analysis is obviated by the save: immediately after the save, locals and outputs are dead

DTrace: Cantrill, Shapiro 3/11/02 Sun Proprietary/Confidential: Internal Use Only 34
Entry PatchingFunction
save %sp, −0xc0, %spldx [%i0+ 0x3b0], %l6...
We patch the save instruction to be an annulled branch-always into a per-probe entry in a per-module jump table

DTrace: Cantrill, Shapiro 3/11/02 Sun Proprietary/Confidential: Internal Use Only 35
Entry PatchingFunction
ba,a . + offsetldx [%i0+ 0x3b0], %l6...
Per module FBT table...save %sp, −0xc0, %spset probe_id , %o0mov %i0, %o1...sethi %hi( pc − 4), %g1call dtrace_probeor %g1, %lo( pc − 4), %o7...
The jump table entry:
� Performs the patched-over save� Moves the inputs into the outputs� Sets %o7 to be (patched_pc - 4)� Calls dtrace_probe ()
DTrace: Cantrill, Shapiro 3/11/02 Sun Proprietary/Confidential: Internal Use Only 36
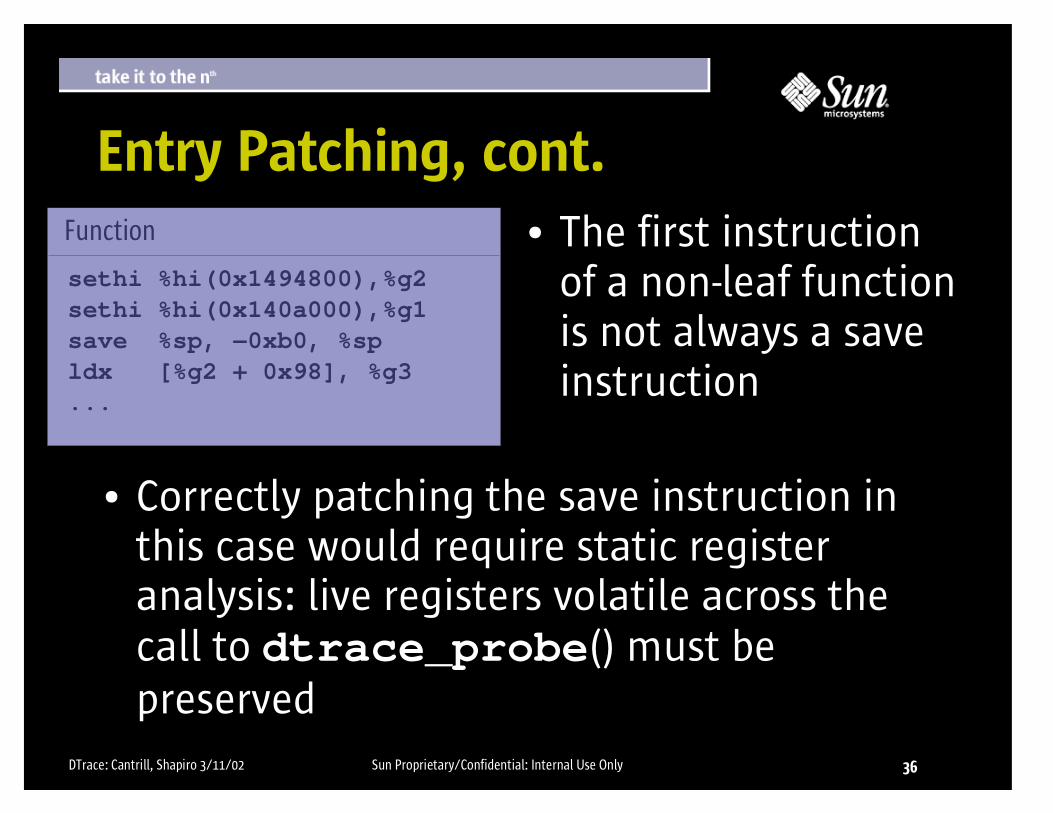
sethi %hi(0x1494800),%g2sethi %hi(0x140a000),%g1save %sp, −0xb0, %spldx [%g2 + 0x98], %g3...
Function
Entry Patching, cont.
" Correctly patching the save instruction in this case would require static register analysis: live registers volatile across the call to dtrace_probe () must be preserved
" The first instruction of a non-leaf function is not always a save instruction

DTrace: Cantrill, Shapiro 3/11/02 Sun Proprietary/Confidential: Internal Use Only 37
Entry Patching, cont.
" We instead patch the first instruction to be the annulled branch-always
" In this case, the jump table entry:� Performs a MINFRAME save
� Moves the inputs into the outputs
� Calls dtrace_probe ()
� Performs a restore
� Branches back to (patched_pc + 4) with the patched-over instruction in the delay slot

DTrace: Cantrill, Shapiro 3/11/02 Sun Proprietary/Confidential: Internal Use Only 38
ba,a . + offsetsethi %hi(0x140a000),%g1save %sp, −0xb0, %spldx [%g2 + 0x98], %g3...
Function
Entry Patching, cont.Per module FBT table...save %sp, −MINFRAME, %spset probe_id , %o0mov %i0, %o1...call dtrace_probemov %i4, %o5restoreba . + offsetsethi %hi(0x1494800), %g2...

DTrace: Cantrill, Shapiro 3/11/02 Sun Proprietary/Confidential: Internal Use Only 39
...0x17c: mov 1, %i00x180: ret0x184: restore
Function
Return Patching
" ret/restore couplets can be patched in much the same way as save instructions
" The ret is patched to be an annulled branch-always into a jump table entry

DTrace: Cantrill, Shapiro 3/11/02 Sun Proprietary/Confidential: Internal Use Only 40
...0x17c: mov 1, %i00x180: ba,a . + offset0x184: restore
Function
Return Patching, cont.Per module FBT table...set probe_id , %o0mov 0x180, %o1call dtrace_probemov %i0, %o2retrestore...
The jump table entry:
� Calls dtrace_probe (), passing both the return value and the offset of the ret
� On return from dtrace_probe (), performs the ret/restore couplet

DTrace: Cantrill, Shapiro 3/11/02 Sun Proprietary/Confidential: Internal Use Only 41
...0x17c: stx [%g2], %g30x180: call mutex_exit0x184: restore %g0,%l0,%o0
Function
Return Patching, cont.
" ret/restore couplets are not the only way to return from a non-leaf routine
" call/restore and jmpl/restore couplets are used to implement tail-call elimination

DTrace: Cantrill, Shapiro 3/11/02 Sun Proprietary/Confidential: Internal Use Only 42
...0x17c: stx [%g2], %g30x180: ba,a . + offset0x184: restore %g0,%l0,%o0
Function
Return Patching, cont.Per module FBT table...set probe_id , %o0mov 0x180, %o1call dtrace_probemov %i0, %o2call mutex_exitrestore %g0,%l0,%o0...Principle is the same:
� control-transfer instruction is patched to be an annulled branch-always
� Jump table entry performs control-transfer/restore couplet upon return from dtrace_probe ()

DTrace: Cantrill, Shapiro 3/11/02 Sun Proprietary/Confidential: Internal Use Only 43
...0x17c: ldx [%g2], %g30x180: jmpl %g3,%o70x184: restore %g0, %g2,%o0
Function
Return Patching, cont.
" Must preserve operands volatile across the call to dtrace_probe () (i.e., inputs and globals)
" Both jmpl and restore can operate on register operands

DTrace: Cantrill, Shapiro 3/11/02 Sun Proprietary/Confidential: Internal Use Only 44
...0x17c: ldx [%g2], %g30x180: ba,a . + offset0x184: restore %g0,%g2,%o0
Function
Return Patching, cont.Per module FBT table...mov %g3, %l1mov %g2, %l2set probe_id , %o0mov 0x180, %o1call dtrace_probemov %i0, %o2jmpl %l1, %o7restore %g0,%l2,%o0...
� The volatile registers are moved into unused locals
� The instructions using the volatile operands are restructured to be in terms of the local

DTrace: Cantrill, Shapiro 3/11/02 Sun Proprietary/Confidential: Internal Use Only 45
Choosing Eligible Functions
" Always err on the side of caution: if a function looks like it’s trying to be clever or appears otherwise strange, don’t create probes for it
" Only create probes for functions containing both a patchable entry and a patchable return
" (Well, plus resume_from_zombie ())

DTrace: Cantrill, Shapiro 3/11/02 Sun Proprietary/Confidential: Internal Use Only 46
dtrace(1M) syntax
dtrace [ -i id ]
[ -P prov ]
[ -m [ prov: ] mod ]
[ -f [[ prov: ] mod: ] func ]
[ -n [[[ prov: ] mod: ] func: ] name ]
demo 1

DTrace: Cantrill, Shapiro 3/11/02 Sun Proprietary/Confidential: Internal Use Only 47
Language Design" The kernel is written in C, so the natural
choice for low-level predicates is C:
curthread−>t_cpu−>cpu_id == 0 &&
curthread−>t_cpu−>cpu_idle_thread ==
curthread ...
" The Kernel Stabs project (PSARC 2001/021) provided native type info in CTF, so it is possible to build a dynamic evaluator
" Same language for predicates and actions

DTrace: Cantrill, Shapiro 3/11/02 Sun Proprietary/Confidential: Internal Use Only 48
Introducing “D”
" Complete access to native kernel C types" Complete access to statics and globals
" Complete support for all ANSI-C operators
" Support for strings as a first-class citizen" Support for built-in variables (timestamp,
curthread, arguments, machine regs, etc.)" Compiler provided as a library API

DTrace: Cantrill, Shapiro 3/11/02 Sun Proprietary/Confidential: Internal Use Only 49
module
symtabCTF
module
symtabCTF
Implementing D
module
symtabCTF
drv/dtrace
DIF engine
DIF
libdtrace.so.1
parser
codegen
assembler
module
symtabCTF
module
symtabCTF
module cache
symtabCTF
lexer
disassembler
svc routines
dtrace(1M)Clients send D expressions tolibrary for compilation
Compiler stack producesD Intermediate Format (DIF)objects that can be boundto probe locations
DTrace driver stores DIF in thekernel and executes programat probe firing time

DTrace: Cantrill, Shapiro 3/11/02 Sun Proprietary/Confidential: Internal Use Only 50
DIF Architecture
" Small RISC architecture ideal for simple emulation or on-the-fly code generation� variable number of 64-bit registers (%r0 = 0)
� 64-bit arithmetic and logical instructions
� 1, 2, 4, and 8-byte safe memory loads
� standard branches and condition codes
� instructions to access variables, strings
� ~50 opcodes, ~200 line emulator (plus some supporting routines for loads, variables, etc.)

DTrace: Cantrill, Shapiro 3/11/02 Sun Proprietary/Confidential: Internal Use Only 51
DIF Example
" D expression: “curthread−>t_cpu ”
" DIF code:ldgs 256, %r1 ! 256 = "curthread"
setx 0x00000000.000000a8, %r2
add %r1, %r2, %r1
ldx [%r1], %r1
ret %r1
" DIF object: DIF
• text section• string table• variable table• return type
DTrace: Cantrill, Shapiro 3/11/02 Sun Proprietary/Confidential: Internal Use Only 52
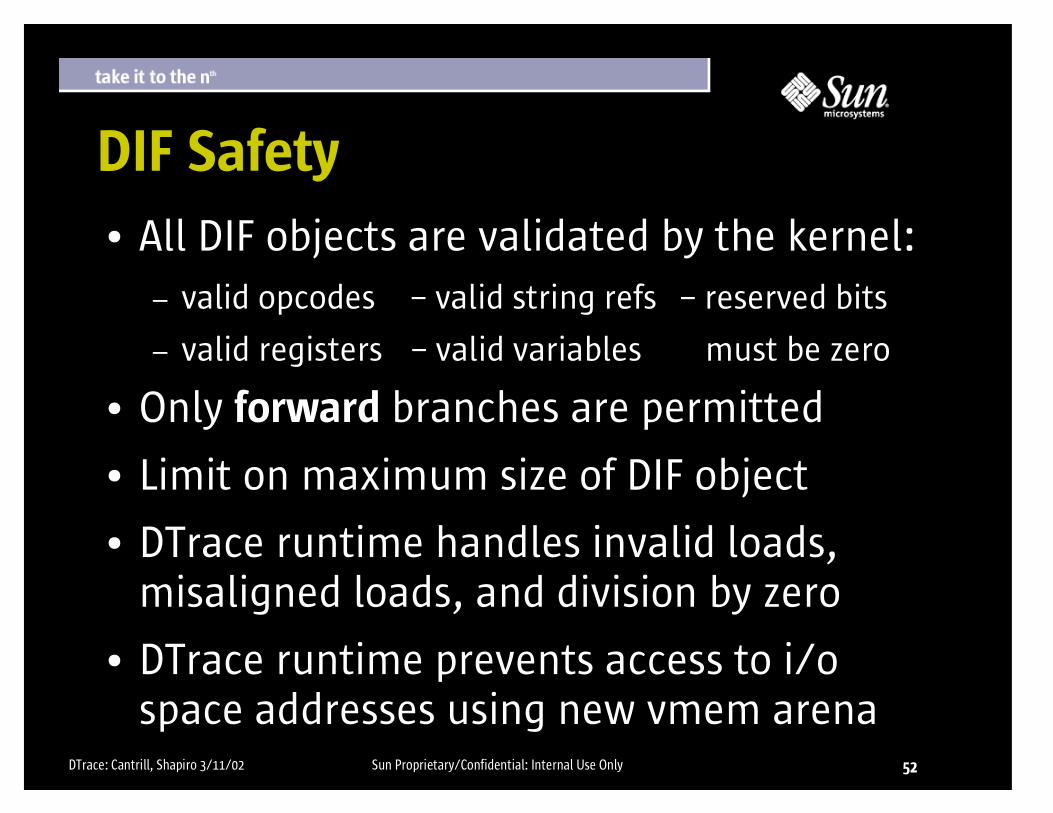
DIF Safety" All DIF objects are validated by the kernel:
� valid opcodes – valid string refs – reserved bits
� valid registers – valid variables must be zero
" Only forward branches are permitted
" Limit on maximum size of DIF object" DTrace runtime handles invalid loads,
misaligned loads, and division by zero
" DTrace runtime prevents access to i/o space addresses using new vmem arena

DTrace: Cantrill, Shapiro 3/11/02 Sun Proprietary/Confidential: Internal Use Only 53
DIF Load Safety
" DIF engine load routines check alignment and i/o space arena before issuing load
" Per-CPU DTrace fault protection flag is set
" If hment search fails and protection is on, sfmmu sets fault flag and issues done instead of calling sfmmu_pagefault ()
" Failed load aborts processing of current ECB

DTrace: Cantrill, Shapiro 3/11/02 Sun Proprietary/Confidential: Internal Use Only 54
D Strings" First-class strings provided to avoid
ambiguity of char* and char[] in C
" Quoted strings are assigned string type" Scalars can be promoted to string type using
new stringof() operator
" Operators <, <=, >, >=, !=, == overloaded as strcmp(3C); promote char* and char[]:
curthread−>t_procp−>p_user.u_comm == "ksh"

DTrace: Cantrill, Shapiro 3/11/02 Sun Proprietary/Confidential: Internal Use Only 55
D Limitations
" Still need to find some solution for #defines that are used as flag bits:
(curthread−>t_proc_flag & TP_PRVSTOP)
" Preprocessor approach possible but messy
" Ideally extend compiler or tools and CTF to support association directly in C source
" Solution would also benefit other debugging tools (e.g. mdb(1) ::print )

DTrace: Cantrill, Shapiro 3/11/02 Sun Proprietary/Confidential: Internal Use Only 56
Linux DProbes Comparison
" RPN-like IR developed in advance of forthcoming high-level language
" Safety issues not thoroughly considered:� user can induce panic if probes are placed improperly
� user can modify registers, memory, write to i/o ports
� validation performed in tool and libraries, not kernel
� infinite loop problem handled by forcing user to specify jmp_max=123 in probe program

DTrace: Cantrill, Shapiro 3/11/02 Sun Proprietary/Confidential: Internal Use Only 57
dtrace(1M) syntax
dtrace [ -i id [ predact ]] [ -P prov [ predact ]] [ -m [ prov: ] mod [ predact ]] [ -f [[ prov: ] mod: ] func [ predact ]] [ -n [[[ prov: ] mod: ] func: ] name [ predact ]]
predact ⇒ [ / predicate / ] { action }
demo 2

DTrace: Cantrill, Shapiro 3/11/02 Sun Proprietary/Confidential: Internal Use Only 58
demo 2dtrace(1M) example
# dtrace −n ´write32:entry
/ curthread−>t_procp−>p_user−>u_comm == "ksh" /
{ trace(curthread−>t_procp−>p_pidp−>pid_id) }´
dtrace: ’write32:entry’ matched 1 probe.
CPU ID FUNCTION:NAME
0 6796 write32:entry 115575
0 6796 write32:entry 115575
0 6796 write32:entry 115575
0 6796 write32:entry 100392
0 6796 write32:entry 100392
0 6796 write32:entry 100392

DTrace: Cantrill, Shapiro 3/11/02 Sun Proprietary/Confidential: Internal Use Only 59
Variables" Idea: allow D actions to instantiate,
manipulate, and record variables" Variables can also be used by predicates to
alter control flow and correlate events" Variable species:
� scalar variables: integers, strings
� associative arrays: arbitrary (key, value) collections
" Variable scope:� global per client instance
� thread-local per client instance

DTrace: Cantrill, Shapiro 3/11/02 Sun Proprietary/Confidential: Internal Use Only 60
Scalar Variables in D" Variables instantiated by D assignment
operators: = += −= *= /= %= &= ^= |= <<= >>= ++ −−
" Variable type determined by first assignment
" Variables initially assigned zeroes
" Definitions cached in libdtrace client state
DIFID Name Type Scope
1 "foo" int global
2 "bar" str global
3 "baz" int thread
1 "foo" int global3 "baz" int thread
ldgs 1, %r1...

DTrace: Cantrill, Shapiro 3/11/02 Sun Proprietary/Confidential: Internal Use Only 61
Variable Scope
" Global variables named by plain identifiers" TLS variables accessed and instantiated by
overloading “curthread−> ”
" D compiler precedence rules:� C type names defined in kernel (ANSI-C rules)
� DTrace built-in variable names
� Global and static variable names defined in kernel
� User-defined variable names

DTrace: Cantrill, Shapiro 3/11/02 Sun Proprietary/Confidential: Internal Use Only 62
Associative Arrays in D
" Arrays named by identifier [ expression-list ]" Initially filled with zeroes just like scalars
" Entry can be freed by setting it to zero
" Type signature of key and value determined by first assignment; enforced thereafter
" Examples:uids[curthread−>t_procp−>p_cred−>cr_uid]++;
a[curthread, args[0]] = args[1];

DTrace: Cantrill, Shapiro 3/11/02 Sun Proprietary/Confidential: Internal Use Only 63
Value Consistency
" Important to provide semantic consistency for data used in both predicate and actions:/ foo == 3 / { trace(foo) }
/ dnlc_nentries < 10 / { trace(dnlc_nentries) }
" Kernel data consistency can be achieved by taking a snapshot prior to ECB processing
" Variables pose greater challenges:/ dnlc_nentries < 10 / { foo = 0 }
/ foo++ && bar++ / { trace(foo + bar) }

DTrace: Cantrill, Shapiro 3/11/02 Sun Proprietary/Confidential: Internal Use Only 64
Variable Consistency
" Variable group must be self-consistent and consistent w.r.t. other modifying ECBs:/ dnlc_nentries < 10 / { foo = 0 }
/ foo++ && bar++ / { trace(foo + bar) }
" Consistency is achieved by locking variables in a defined order (by ID)
" Only need to do this when variables are used in both predicate and action
DTrace: Cantrill, Shapiro 3/11/02 Sun Proprietary/Confidential: Internal Use Only 65
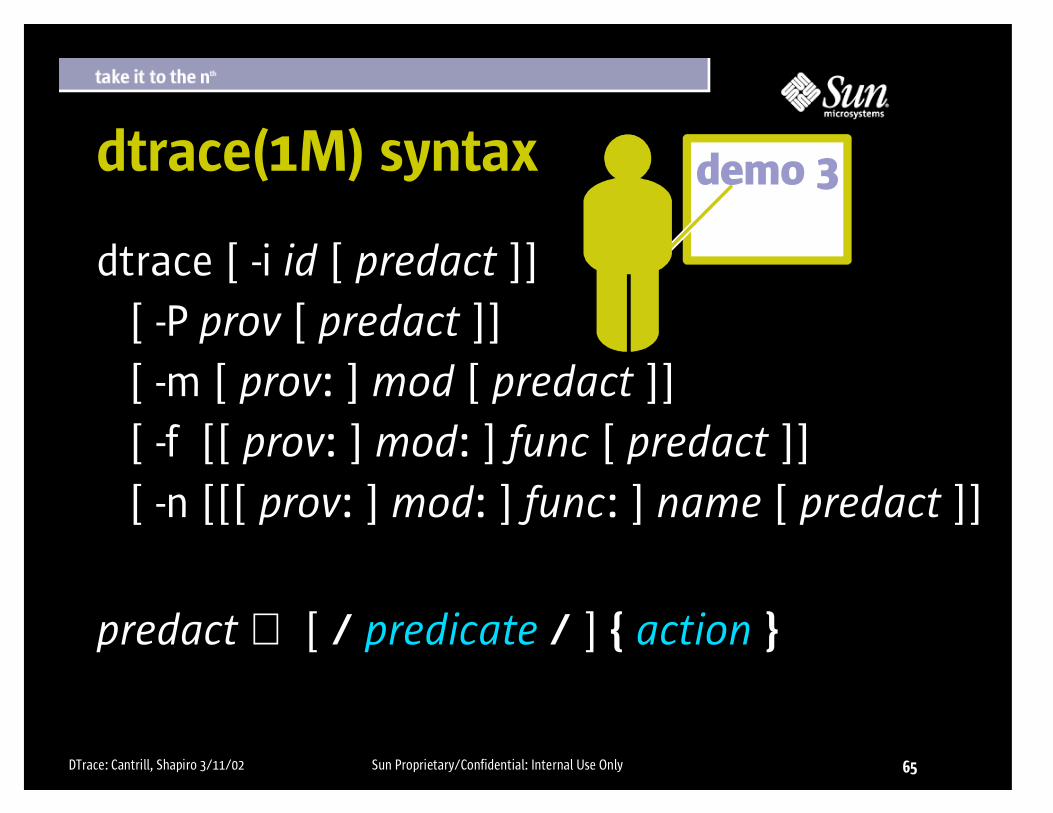
dtrace(1M) syntax
dtrace [ -i id [ predact ]] [ -P prov [ predact ]] [ -m [ prov: ] mod [ predact ]] [ -f [[ prov: ] mod: ] func [ predact ]] [ -n [[[ prov: ] mod: ] func: ] name [ predact ]]
predact ⇒ [ / predicate / ] { action }
demo 3
DTrace: Cantrill, Shapiro 3/11/02 Sun Proprietary/Confidential: Internal Use Only 66
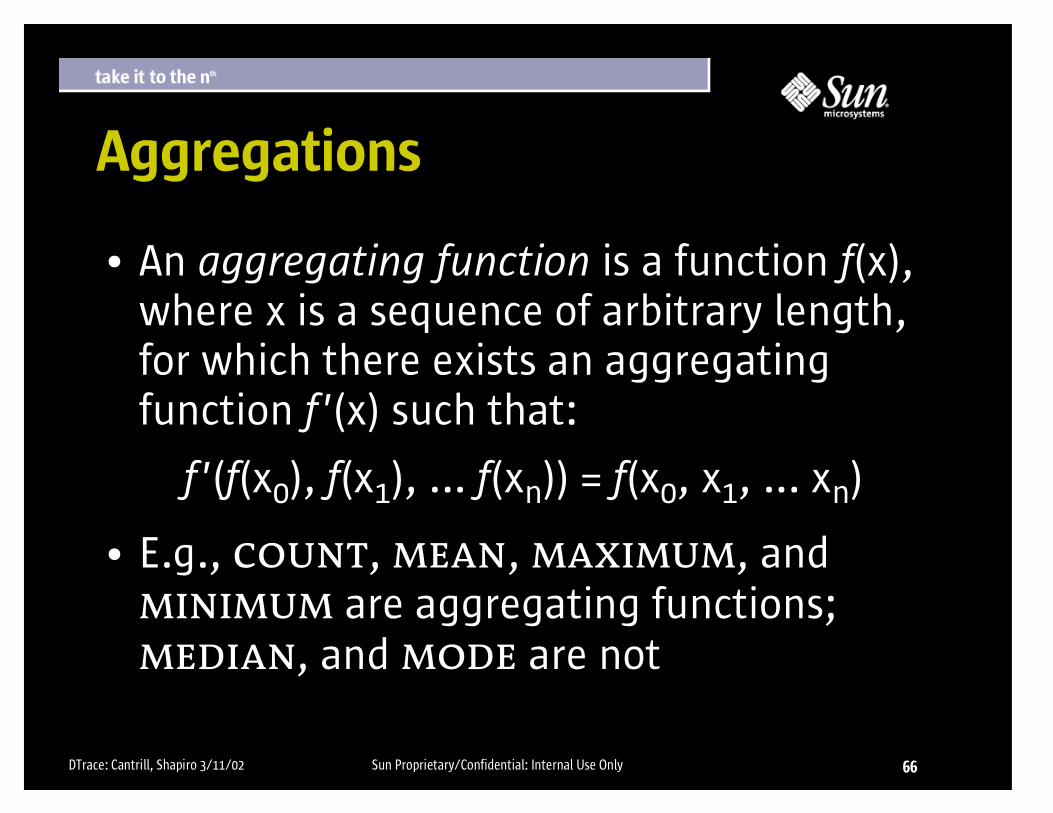
Aggregations
" An aggregating function is a function f(x), where x is a sequence of arbitrary length, for which there exists an aggregating function f'(x) such that:
f'(f(x0), f(x1), ... f(xn)) = f(x0, x1, ... xn)
" E.g., count, mean, maximum, and minimum are aggregating functions; median, and mode are not

DTrace: Cantrill, Shapiro 3/11/02 Sun Proprietary/Confidential: Internal Use Only 67
Aggregations, cont.
" When data is to be processed using an aggregating function, the implementation can be made very efficient:� Trace records need not be generated; only the
intermediate results from the aggregating function need to be stored
� Intermediate results from aggregating functions can be stored per CPU, thereby eliminating data sharing
� Aggregating function can be periodically performed on all per CPU intermediate results to derive system-wide result

DTrace: Cantrill, Shapiro 3/11/02 Sun Proprietary/Confidential: Internal Use Only 68
Aggregations, cont.
" An aggregation is an associative table keyed by an n-tuple where each value is the result of an aggregating function
" n-tuple consists of a list of D expressions" Aggregating functions are provided by the
framework
" Framework provides a single aggregation per consumer

DTrace: Cantrill, Shapiro 3/11/02 Sun Proprietary/Confidential: Internal Use Only 69
Aggregations, cont.
" Current aggregating functions:� max(expr): the intermediate result is set to the
greater of the intermediate result and expr
� count: increments the intermediate result
� quantize(expr): the intermediate result consists of 64 power-of-two buckets; the bucket corresponding to expr is incremented
� avg(expr): the intermediate result consists of a count and a total; the count is incremented and the total is increased by expr

DTrace: Cantrill, Shapiro 3/11/02 Sun Proprietary/Confidential: Internal Use Only 70
Aggregation Example
" For example, maximum kernel bcopy () size by command name: � Enable probe with function “bcopy ”, name
“entry ”� Aggregate on:
curthread−>t_procp−>p_user.u_comm
� Set aggregating function to “max(arg2 )”

DTrace: Cantrill, Shapiro 3/11/02 Sun Proprietary/Confidential: Internal Use Only 71
Aggregation Implementation
" Aggregations are implemented using the same buffer infrastructure as trace buffers
" Buffer switching and copying thus fall out" Aggregations are an associative table;
buffering is complicated by the presence of hash table metadata

DTrace: Cantrill, Shapiro 3/11/02 Sun Proprietary/Confidential: Internal Use Only 72
EPID value key EPID
key value EPID key
value
EPID key
hash buckets
hash keys
value
" Data grows from start of buffer
" Metadata grows from end of buffer
" Only data is copied out
" EPID is in data record, but is not considered to be part of the key
Aggregation Implementation

DTrace: Cantrill, Shapiro 3/11/02 Sun Proprietary/Confidential: Internal Use Only 73
Aggregation Implementation
" Library applies aggregating function to consumed data, using formerly consumed data as intermediate result
" Allows the kernel to discard the metadata contents of consumed aggregation buffers
" Allows drops to be easily eliminated in long-running aggregations

DTrace: Cantrill, Shapiro 3/11/02 Sun Proprietary/Confidential: Internal Use Only 74
dtrace(1M) syntax
dtrace [ -i id [ aggact ]] [ -P prov [ aggact ]] [ -m [ prov: ] mod [ aggact ]] [ -f [[ prov: ] mod: ] func [ aggact ]] [ -n [[[ prov: ] mod: ] func: ] name [ aggact ]]
aggact ⇒ [ / predicate / ]
"[" expr-list "]" = aggregating-func (arg-list)
demo 4

DTrace: Cantrill, Shapiro 3/11/02 Sun Proprietary/Confidential: Internal Use Only 75
DTrace During Boot" Normally, consumer is a process with
DTrace pseudodevice open" However, would like to be able to trace
during boot — before processes can run
" Introduce anonymous state:� Predicates and actions for anonymous state are
specified via driver's configuration file
� Command has option to generate configuration file
� Anonymous state may later be grabbed by a consuming process

DTrace: Cantrill, Shapiro 3/11/02 Sun Proprietary/Confidential: Internal Use Only 76
DTrace During Boot, cont." Use of DTrace during boot revealed that
each text page for libc is retrieved from disk three times! (see 4647351)
" Using probe in page_destroy () with an appropriate predicate revealed source to be calls to ufs_flush ()
" ufs_flush () is called in fsck (1M) and again before remount of root filesystem
" Fixing this is a huge win: 8 seconds on X1

DTrace: Cantrill, Shapiro 3/11/02 Sun Proprietary/Confidential: Internal Use Only 77
dtrace(1M) syntax
dtrace -a - claim anonymous state -A - generate .conf file for anonymous tracing
demo 5

DTrace: Cantrill, Shapiro 3/11/02 Sun Proprietary/Confidential: Internal Use Only 78
Lockstat Provider" Lockstat provider implements hot patching
of synchronization primitives
" Provides “block ,” “spin ,” “acquire ” and “release ” probes for mutex_enter (), rw_enter (), etc.
" lockstat (1M) will be reimplemented as a DTrace consumer
" Long-standing RFEs (e.g., lock statistics per thread or per process) simply fall out

DTrace: Cantrill, Shapiro 3/11/02 Sun Proprietary/Confidential: Internal Use Only 79
Profile Provider
" Provides unanchored probes based on profile interrupt
" Probes implemented as high level cyclics" Currently no way to specify arbitrary rate;
provider makes available ten probes with different hard-coded rates
" Arbitrary rates may be available via private consumer/provider interface

DTrace: Cantrill, Shapiro 3/11/02 Sun Proprietary/Confidential: Internal Use Only 80
TL>0 Provider
" UltraSPARC-specific provider will be implemented to allow probes when trap level (TL) is greater than zero
" Non-trivial: dtrace_probe () cannot be called from TL>0 context
" Provider will use dynamic trap table interposition, as used in trapstat (1M), ttrace and atrace

DTrace: Cantrill, Shapiro 3/11/02 Sun Proprietary/Confidential: Internal Use Only 81
TL>0 Provider, cont.
" Implementation will be excruciating, but payoff is substantial:� Huge quantity of data available via trap table
interposition
� Will benefit enormously from DTrace’s ability to prune and coalesce data
" Using technology first developed in atrace , TL>0 provider will be able to optionally provide address traces

DTrace: Cantrill, Shapiro 3/11/02 Sun Proprietary/Confidential: Internal Use Only 82
" trapstat (1M) will be reimplemented as a DTrace consumer
" TRAPTRACE will be obviated; equivalent functionality will be dynamic
" Example questions answered:� TLB misses per process, per page
� Window spill traps on a per-function basis
� All memory references in a specific function for a specific process
TL>0 Provider, Cont.

DTrace: Cantrill, Shapiro 3/11/02 Sun Proprietary/Confidential: Internal Use Only 83
Probes in C Source Code
" Permit users to define probes in C source as TNF and VTRACE did, but improve syntax:
TNF_PROBE_5(strategy, "io blockio", /* CSTYLED */,
tnf_device, device, bp−>b_edev,
tnf_diskaddr, block, bp−>b_lblkno,
tnf_size, size, bp−>b_bcount,
tnf_opaque, buf, bp,
tnf_bioflags, flags, bp−>b_flags);
" Probe should look like a normal function call" Enhance compiler to handle code generation
and argument type descriptions

DTrace: Cantrill, Shapiro 3/11/02 Sun Proprietary/Confidential: Internal Use Only 84
Traditional Approaches
" D-cache hot but inflexible:
if (tracing_on)
trace(arg1, arg2, ...);
" D-cache cold but more flexible:
if (this_probe_on)
trace(arg1, arg2, ...);
" Both implementations bloat I-cache footprint

DTrace: Cantrill, Shapiro 3/11/02 Sun Proprietary/Confidential: Internal Use Only 85
Compiler-Assisted Approach
maj = getmajor(bp−>b_edev);...
ldx [%i0 + 0xa8], %g2 ! bp−>b_edevmov −1, %g3srl %g3, 0, %g3 srlx %g2, 0x20, %g2and %g2, %g3, %g2 ! %g2 = getmajor(b_edev)...retrestore %g0, 0, %o0 ! return (0);

DTrace: Cantrill, Shapiro 3/11/02 Sun Proprietary/Confidential: Internal Use Only 86
Compiler-Assisted ApproachTRACE("myprobe", bp);maj = getmajor(bp−>b_edev);...
ldx [%i0 + 0xa8], %g2 ! treat as potential callmov −1, %g3srl %g3, 0, %g3 srlx %g2, 0x20, %g2and %g2, %g3, %g2 ! %g2 = getmajor(b_edev)...retrestore %g0, 0, %o0 ! return (0);nop ! patch point for branchmov %i0, %o0 ! assemble probe argument.stabs "myprobe", id, location, arg−type, ...

DTrace: Cantrill, Shapiro 3/11/02 Sun Proprietary/Confidential: Internal Use Only 87
Compiler-Assisted ApproachTRACE("myprobe", bp);maj = getmajor(bp−>b_edev);...
ba,a args1 ! branch to arg assemblymov −1, %g3srl %g3, 0, %g3 srlx %g2, 0x20, %g2and %g2, %g3, %g2 ! %g2 = getmajor(b_edev)...retrestore %g0, 0, %o0 ! return (0);call trampoline ! jump to trampoline codemov %i0, %o0 ! assemble argument.stabs "myprobe", id, location, arg−type, ...

DTrace: Cantrill, Shapiro 3/11/02 Sun Proprietary/Confidential: Internal Use Only 88
C Probe Applications
" Probes in C source code can be used to convert all kernel ASSERT() instances into probes that can be enabled in production
" Probes can also be placed in C source code to facilitate fault injection testing
" Debug printf code that is not replaced by FBT probes can be replaced with C probes

DTrace: Cantrill, Shapiro 3/11/02 Sun Proprietary/Confidential: Internal Use Only 89
Basic Block Tracing
" Compiler -xa (tcov) and -xpg (gprof) options generate instrumented code that can be used for basic block coverage, profiles
" DTrace “BBT” provider can be implemented to publish block sites as DTrace probes
" Kernel modules can be compiled using these options for coverage testing
" RIP: uts/common/os/unix_bb.c

DTrace: Cantrill, Shapiro 3/11/02 Sun Proprietary/Confidential: Internal Use Only 90
Fast-Trap Tracing
" DTrace will reserve fast-trap entry point(s) for tracing user-level activities
" DTrace “FTT” provider can also provide limited access to set of input arguments
" Traps can be generated using handcoded assembly or libc assembly wrapper
" Traps can also be inserted by user-level code generators (e.g. HotSpot JVM)

DTrace: Cantrill, Shapiro 3/11/02 Sun Proprietary/Confidential: Internal Use Only 91
Interface Stability
" Problem: want to allow tools outside of O/N to reliably layer on top of DTrace
" Extend probe description tuple to include probe stability (i.e. attributes(5) data)
" Most of kernel is Unstable, but DDI routines and types can be Evolving
" D compiler can provide a “lint” mode to warn developers of unstable dependencies

DTrace: Cantrill, Shapiro 3/11/02 Sun Proprietary/Confidential: Internal Use Only 92
Stable Abstractions
" We can also create more stable abstractions at DTrace API layer, e.g. proc(4) structures
" Compiler could provide proc_t *psinfo
" Library performs necessary transformations:psinfo−>pr_flag ⇒ curthread−>t_procp−>p_flag
psinfo−>pr_nlwp ⇒ curthread−>t_procp−>p_lwpcnt
psinfo−>pr_uid ⇒ curthread−>t_procp−>p_cred−>cr_uid
psinfo−>pr_sid ⇒ curthread−>t_procp−>p_sessp−>s_sid
...

DTrace: Cantrill, Shapiro 3/11/02 Sun Proprietary/Confidential: Internal Use Only 93
Translators" TNF users burdened with task of translating
between abstraction and implementation:� ls -lL /dev/dsk/* to deal with dev_t mappings
� PIDs/LWP ids ⇔ proc_t/klwp_t addresses
� filenames ⇔ vnode_t addresses, inode numbers
" DTrace could support pluggable translators in or out of kernel to handle mappings
" D compiler can attempt to map predicate to available state by searching for translation

DTrace: Cantrill, Shapiro 3/11/02 Sun Proprietary/Confidential: Internal Use Only 94
Trace Files
" DTrace will provide efficient access to saved trace data and data formatting features
" DTrace library will provide stable API for reading and writing trace files
" Lesson from crash dumps: put everything needed to interpret data in the trace file
" Files from one system, OS revision should be readable on another system or OS revision

DTrace: Cantrill, Shapiro 3/11/02 Sun Proprietary/Confidential: Internal Use Only 95
File Formatheader
indices
EPID dictionary
kernel meta-data
EPID data ...
File header and meta-data for eachtrace record generated in advance
• ASCII and DIF predicate• EPID record description• data length• data types
• module name, id• symbol table• string table• CTF section
Probe data can be streamed out to fileusing record id while tracing active
• Module cache of symbol and type data can be written once tracing is complete
EPID data ...
EPID data ...
EPID data ...

DTrace: Cantrill, Shapiro 3/11/02 Sun Proprietary/Confidential: Internal Use Only 96
Conclusion
user/kernel/merged
probe coverage
disabled probe effect
scalability
safety
extensibility
data filtering
arbitrary recording
self describing
run-time analysis
stock availability
stable abstractions
Feature GTF vtrace TNF KInst DProbe
M M M K K
DTrace
M

DTrace: Cantrill, Shapiro 3/11/02 Sun Proprietary/Confidential: Internal Use Only 97
For more information ...
" Copies of this presentation and other documents available at http://dtrace.eng
" Questions to [email protected]" E-mail [email protected]
to join the interest list
" Meetings for near-term consumers
" Project documentation, schedules, and other information forthcoming

DTrace: Cantrill, Shapiro 3/11/02 Sun Proprietary/Confidential: Internal Use Only 98
Bibliography 1" Hundt, Robert. “HP Caliper - An Architecture for Performance
Analysis Tools.” USENIX First Workshop on Industrial Experiences with Systems Software, Oct., 2000.
" Moore, Richard J., “Dynamic Probes and Generalised Kernel Hooks Interface.” Atlanta Linux Showcase, Oct., 2000. (see http://oss.software.ibm.com/developerworks/opensource/linux/projects/dprobes/)
" Tamches, Ariel, and Barton P. Miller. “Fine-Grained Dynamic Instrumentation of Commodity Operating System Kernels.” Third Symposium on OSDI, Feb., 1999.
" Tamches, Ariel, and Barton P. Miller. “Using Dynamic Kernel Instrumentation for Kernel and Application Tuning.” Int’l Journal of High-Performance Applications, Fall, 1999.
" Weaver, David L., and Tom Germond, eds. The SPARC Architecture Manual, Version 9, Prentice-Hall, Inc., 1994.

DTrace: Cantrill, Shapiro 3/11/02 Sun Proprietary/Confidential: Internal Use Only 99
Bibliography 2" Buck, Bryan, and Jeffrey K. Hollingsworth. “An API for Runtime
Code Patching.” Int’l Journal of High-Performance Applications, Winter, 2000.
" Dai, Peng, and Thomas W. Doeppner, Jr. “VTRACE and Communication Performance Analysis.” Computer Science Technical Report CS-95-36, Brown University, Nov., 1995.
" Hollingsworth, Jeffrey K., Barton P. Miller, and Jon Cargille. “Dynamic Program Instrumentation for Scalable Performance Tools.” Proceedings of the Scalable High Performance Computing Conference, May, 1994.
" Johnson, Mark W. “The ARM API, Version 2.” Tivoli Systems, Austin, Texas. June 1996.
" Klivansky, Miroslav. “Collecting TNF I/O Traces.” Sun Microsystems, Santa Clara, CA. May, 1999.

DTrace: Cantrill, Shapiro 3/11/02 Sun Proprietary/Confidential: Internal Use Only 100
Bibliography 3" Larus, James R., and E. Schnarr, “EEL: Machine-Independent
Executable Editing.” PLDI, June, 1995.
" Srivastava, A., and Eustace, A., “ATOM: A System for Building Customized Program Analysis Tools.” SIGPLAN Conference on Programming Language Design and Implementation, May, 1994.
" IBM OS/390 V2R10.0 MVS Authorized Assembler Services Reference, Volume 2 (ENFREQ-IXGWRITE) GC26-1765-13
" IBM OS/390 V2R10.0 MVS Diagnosis Procedures SY26-1082-03
" IBM OS/390 V2R10.0 MVS Diagnosis Reference SY26-1084-09
" IBM OS/390 V2R10.0 MVS IPCS Commands GC26-1754-09