dsit_pro-poor transport economics
TRANSCRIPT

8/10/2019 DSIT_Pro-Poor Transport Economics
http://slidepdf.com/reader/full/dsitpro-poor-transport-economics 1/13
Socially Sustainable Transport Training – Session 18
Pro-Poor Transport Economics(Andrew McIntyre / Scott Ferguson)
8/10/2019 DSIT_Pro-Poor Transport Economics
http://slidepdf.com/reader/full/dsitpro-poor-transport-economics 2/13
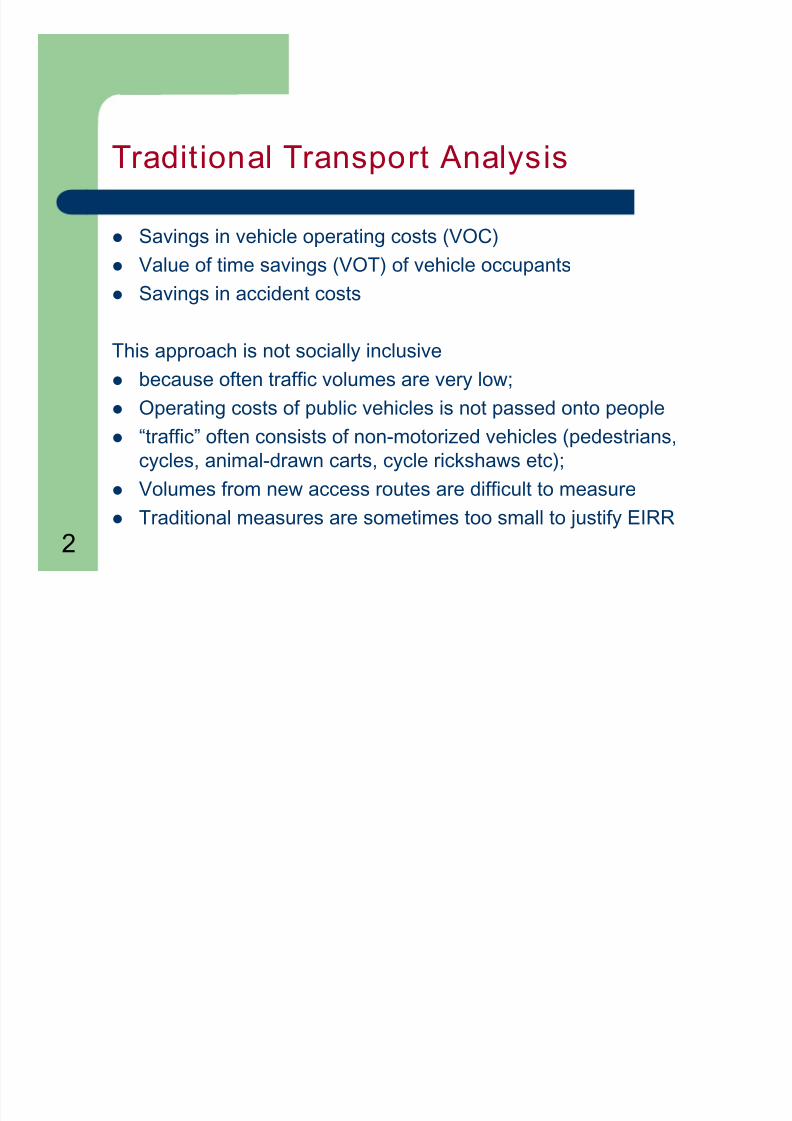
Traditional Transport Analysis
Savings in vehicle operating costs (VOC)
Value of time savings (VOT) of vehicle occupants
Savings in accident costs
This approach is not socially inclusive
because often traffic volumes are very low;
Operating costs of public vehicles is not passed onto people “traffic” often consists of non-motorized vehicles (pedestrians,
cycles, animal-drawn carts, cycle rickshaws etc);
Volumes from new access routes are difficult to measure
Traditional measures are sometimes too small to justify EIRR
2

8/10/2019 DSIT_Pro-Poor Transport Economics
http://slidepdf.com/reader/full/dsitpro-poor-transport-economics 3/13
Transport Demand Forecasts/Surveys
For passenger movements, the ultimate transport objective
is to satisfy people’s demands for mobility and access (notvehicle movements)
Time savings is one desirable objective, but so areminimizing travel and associated costs (these are oftenforgotten or ignored)
Many surveys measure traffic movements without
understanding travel demands (trip purpose and travelneeds)
Ask “who does what, to where, how often, and at whatcost?”
Also look at other data sources, cases studies (proxies)
3

8/10/2019 DSIT_Pro-Poor Transport Economics
http://slidepdf.com/reader/full/dsitpro-poor-transport-economics 4/13
How to ensure transport systems andservices are inclusive?
Understand the travel needs of various stakeholder
groups – not just vehicle owners – especially whenpublic investment is used - inequitable
Public transportation by definition is more inclusive,
but are systems and services provided in a manner
that is truly inclusive?
We should be able to test this hypothesis and ratethe degree of inclusiveness – is this feasible for ADB
transport projects?
4

8/10/2019 DSIT_Pro-Poor Transport Economics
http://slidepdf.com/reader/full/dsitpro-poor-transport-economics 5/13
Transport Purposes
Livelihood – shopping, collect wood
Production – work or farm
Services – education, health
Social Purposes – family, community
5

8/10/2019 DSIT_Pro-Poor Transport Economics
http://slidepdf.com/reader/full/dsitpro-poor-transport-economics 6/13
What types of surveys are beingconducted for ADB projects?
Daily vehicle counts and time of day counts
O/D surveys __________________________________________________________________________________________________________________________________________________________
What about?
Passenger counts (cars, buses, bicycles)
Pedestrian counts
Trip purpose and frequency surveys
Household surveys (targeting communities orspecific groups)
Multi-modal network analysis (urban planning)
6

8/10/2019 DSIT_Pro-Poor Transport Economics
http://slidepdf.com/reader/full/dsitpro-poor-transport-economics 7/13
Inform Project Design
Amenity - Toilets, markets, road stalls
Access – infrastructure, transport
Multiple purpose – stations, roads
Integrated design – tourism, health
Cash/Benefit transfers - (fuel, tolls) Land Use Planning
Alternatives - ICT
7

8/10/2019 DSIT_Pro-Poor Transport Economics
http://slidepdf.com/reader/full/dsitpro-poor-transport-economics 8/13
Examples of EIRR –Rural Roads India
Case Study measured with/without
Change in incomes of poor (6-9% of poor above BPL) Education Access = improved literacy = earnings increase
(10% poor become literate increase income 40%)
Education Access = improved literacy = lower population =
more surplus / household (population growth rate 1.6% less)
Health Access = improved health = less absenteeism from work= increased income (5% less days absent x wage)
Social capital
8

8/10/2019 DSIT_Pro-Poor Transport Economics
http://slidepdf.com/reader/full/dsitpro-poor-transport-economics 9/13
EIRR Rural Road India
9

8/10/2019 DSIT_Pro-Poor Transport Economics
http://slidepdf.com/reader/full/dsitpro-poor-transport-economics 10/13
Other Studies
PNG – Valuing benefits HDM4 – noise, dust (‘80s)
Laos – contingent valuation benefits China - Poverty Alleviation ranking
Ghana – participatory approach to technical ranking
WB – benefits just can’t be measured
WB Bhutan – EIRR reduced 12% to need for 5-6% WB Vietnam – matching propensity for poor
households to use options
10

8/10/2019 DSIT_Pro-Poor Transport Economics
http://slidepdf.com/reader/full/dsitpro-poor-transport-economics 11/13
Social Capital
Consists of the networks, norms, relationships, values and
informal sanctions that shape the quantity and co-operative
quality of a society’s social interactions
Includes bonding, bridging, linking
Good social capital can result in:
– high levels of and growth in GDP;
– more efficiently functioning labour markets;
– higher educational attainment;
– lower levels of crime;
– better health;
– more effective institutions of government.
Difficult to quantify except through case study11

8/10/2019 DSIT_Pro-Poor Transport Economics
http://slidepdf.com/reader/full/dsitpro-poor-transport-economics 12/13
Methods to Quantify Some SocialBenefits
Human capital approach – return on an investment measured
as the person’s renewed or increased production
Revealed preferences - Human behavior can reveal
preferences and thus economic value
– household production function – eg. avertive expenditure
– hedonic pricing method – comparative pricing of similar
Contingent valuation - hypothetical survey methods to elicit
willingness to pay (WTP) values for goods in a hypotheticalmarket
12

8/10/2019 DSIT_Pro-Poor Transport Economics
http://slidepdf.com/reader/full/dsitpro-poor-transport-economics 13/13
Conclusion
Understand that they may not be quantifiable
Use good examples If possible, prepare good Case Studies
Please share any other ideas……..
13