dry weight - annual dialysis...
TRANSCRIPT
Ahmad
Dry Weight
Fluid Overload, Assessment & Management
Suhail Ahmad
Ahmad
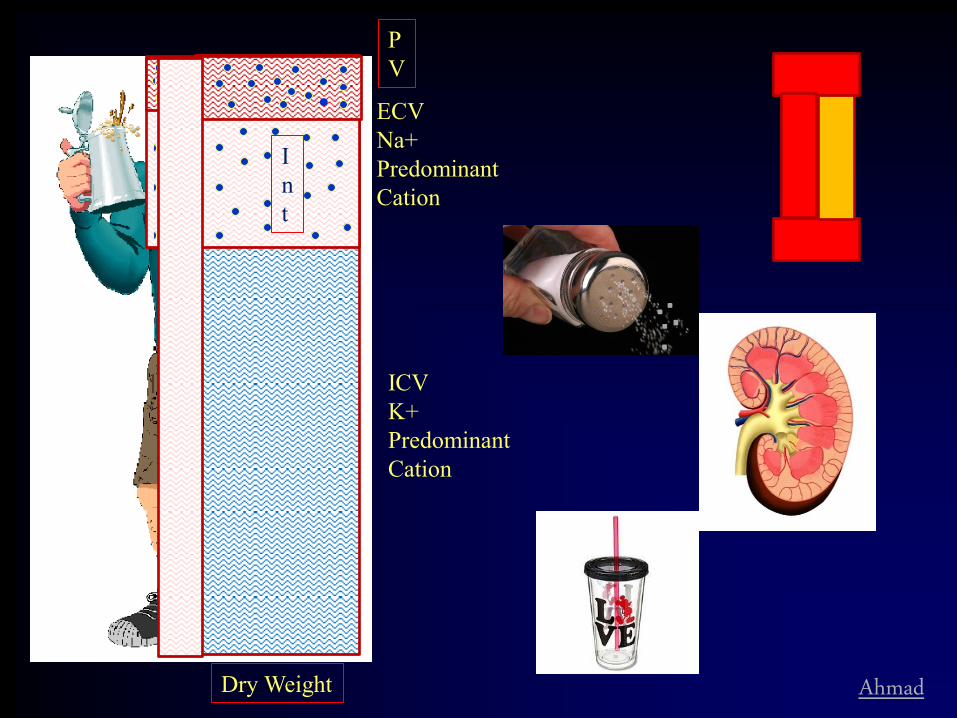
ICV K+ Predominant Cation
ECV Na+ Predominant Cation
P V
I n t
Dry Weight

Ahmad
Majority of Patients are in Fluid Excess State
• Significant Diuresis and Weight Loss Following Renal Transplantation
• Published Data – Jones CH, J Ren Nutr 12:209,2002; Perez-Garcia R, Nephrol Dial Transplant 16:98,2001; Charra B, Nephrol Physiol93:94,2003 etc.
0
2
4
6
8
10
12
PD HD
% Body weight reduction after transplant
p<0.05
Sofue et al, Clin Exp Nephrol, 2012

Ahmad
Dry Weight
“The reduction of BP to hypotensive levels during UF, represented the achievement of dry weight status” (w/o Anti-HTN Meds.)
-Thomson, Arch Int Med,1967
Post-dialysis Weight at which: • Inter-dialytic & Next Pre-dialysis BP is
Normal • No Manifestation of ECV Excess • No Manifestation of ECV Depletion
Ahmad
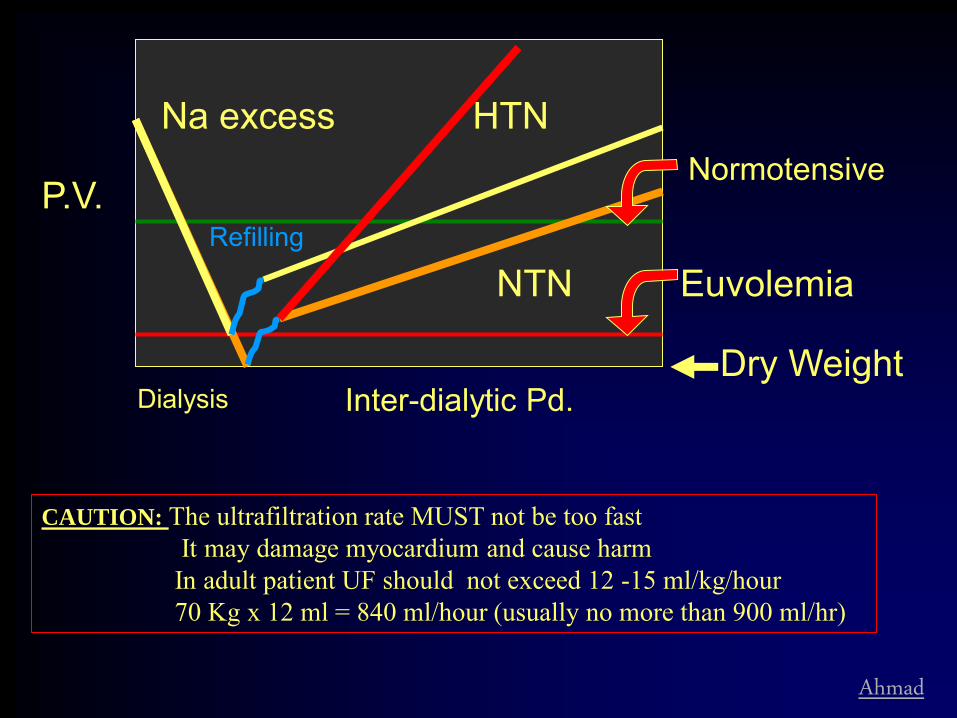
Dialysis Inter-dialytic Pd.
Na excess Normotensive
Euvolemia
P.V.
HTN
NTN
Dry Weight
Refilling
CAUTION: The ultrafiltration rate MUST not be too fast It may damage myocardium and cause harm In adult patient UF should not exceed 12 -15 ml/kg/hour 70 Kg x 12 ml = 840 ml/hour (usually no more than 900 ml/hr)
Ahmad
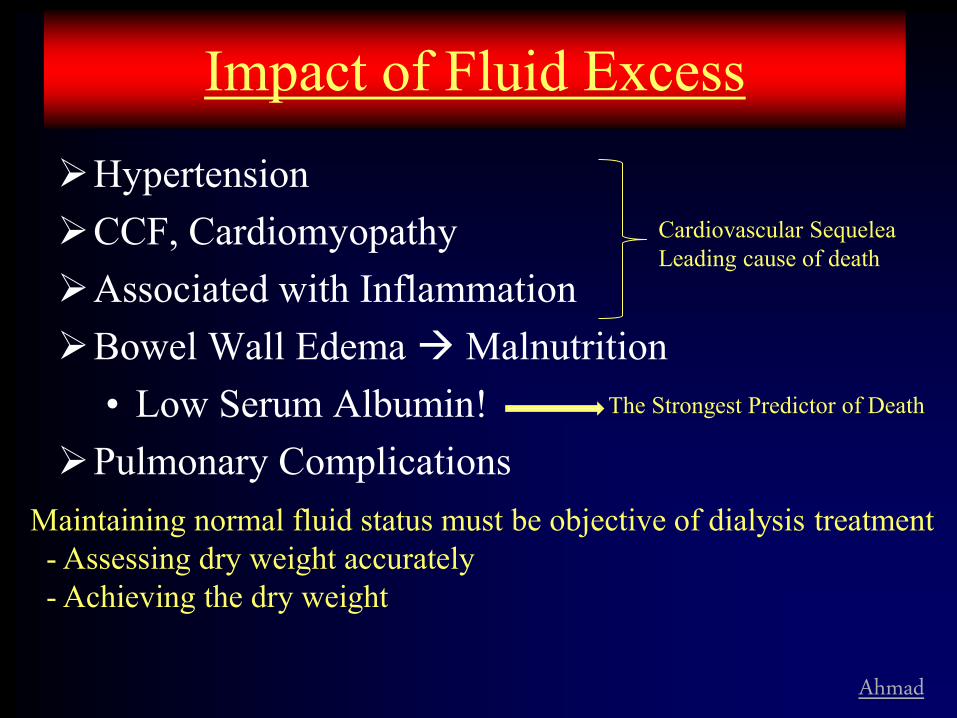
Impact of Fluid Excess
Hypertension CCF, Cardiomyopathy Associated with Inflammation Bowel Wall Edema Malnutrition
• Low Serum Albumin! Pulmonary Complications
Maintaining normal fluid status must be objective of dialysis treatment - Assessing dry weight accurately - Achieving the dry weight
Cardiovascular Sequelea Leading cause of death
The Strongest Predictor of Death
Ahmad
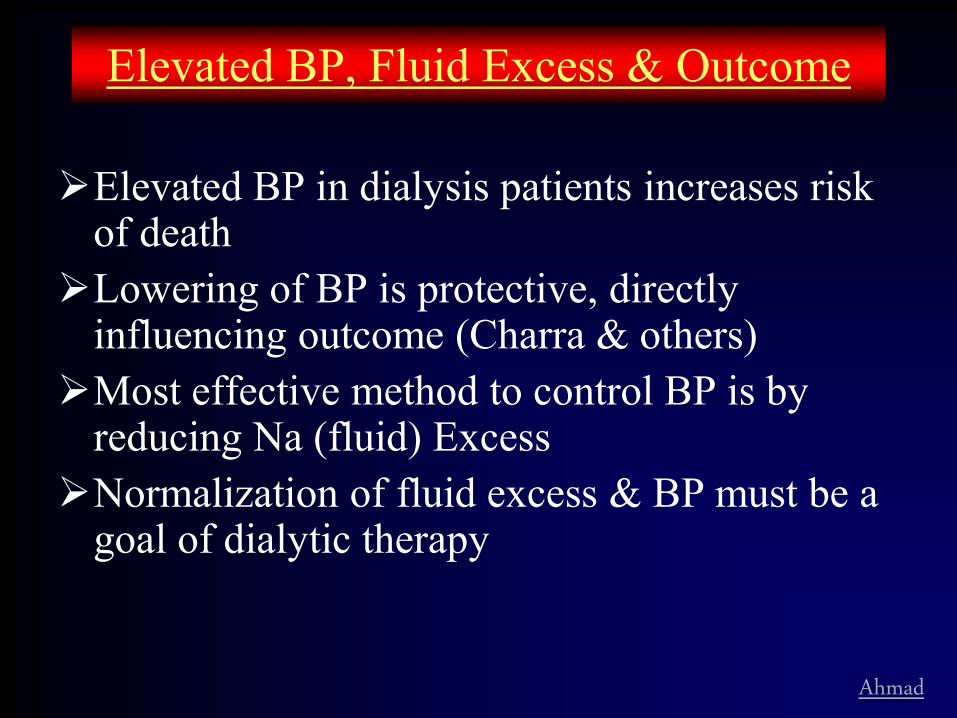
Elevated BP, Fluid Excess & Outcome
Elevated BP in dialysis patients increases risk of death
Lowering of BP is protective, directly influencing outcome (Charra & others)
Most effective method to control BP is by reducing Na (fluid) Excess
Normalization of fluid excess & BP must be a goal of dialytic therapy
Ahmad
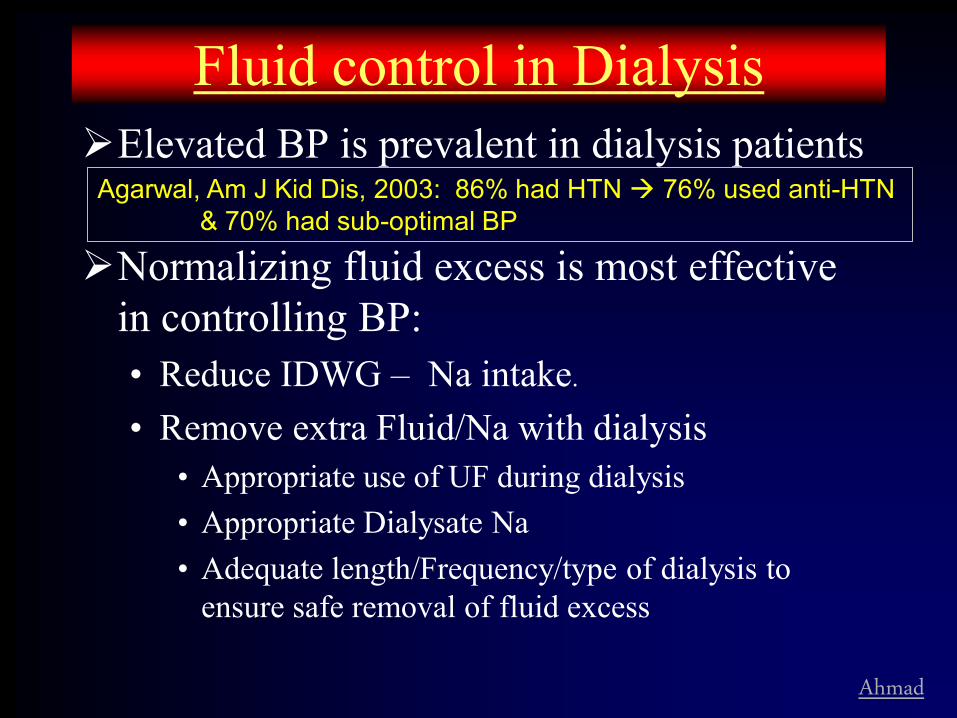
Fluid control in Dialysis Elevated BP is prevalent in dialysis patients
Normalizing fluid excess is most effective
in controlling BP: • Reduce IDWG – Na intake.
• Remove extra Fluid/Na with dialysis • Appropriate use of UF during dialysis • Appropriate Dialysate Na • Adequate length/Frequency/type of dialysis to
ensure safe removal of fluid excess
Agarwal, Am J Kid Dis, 2003: 86% had HTN 76% used anti-HTN & 70% had sub-optimal BP

Ahmad
Reducing IDWG
Na Restriction Most Effective Constant Nagging About water (Fluid)
Restriction (w/o Na restriction): • Ineffective • Causes Discomfort • Causes Unnecessary Guilt
Emphasize Na Restriction ~2 gram/day

Ahmad
IDWG:Na Vs. Water Restriction A Prospective Controlled Study
0
0.5
1
1.5
2
2.5
3
P<0.005
IDWG, Kg
Severe Na & Unrestricted Water Intake.
Usual Na & Water Restriction
Rigby-Mathews, 99
Patients Randomized to (One Mid-week Interdialytic Period): 1. Restricted Na & UNRESTRICTED Water Intake. 2. Usual Na & Water Restriction
Ahmad
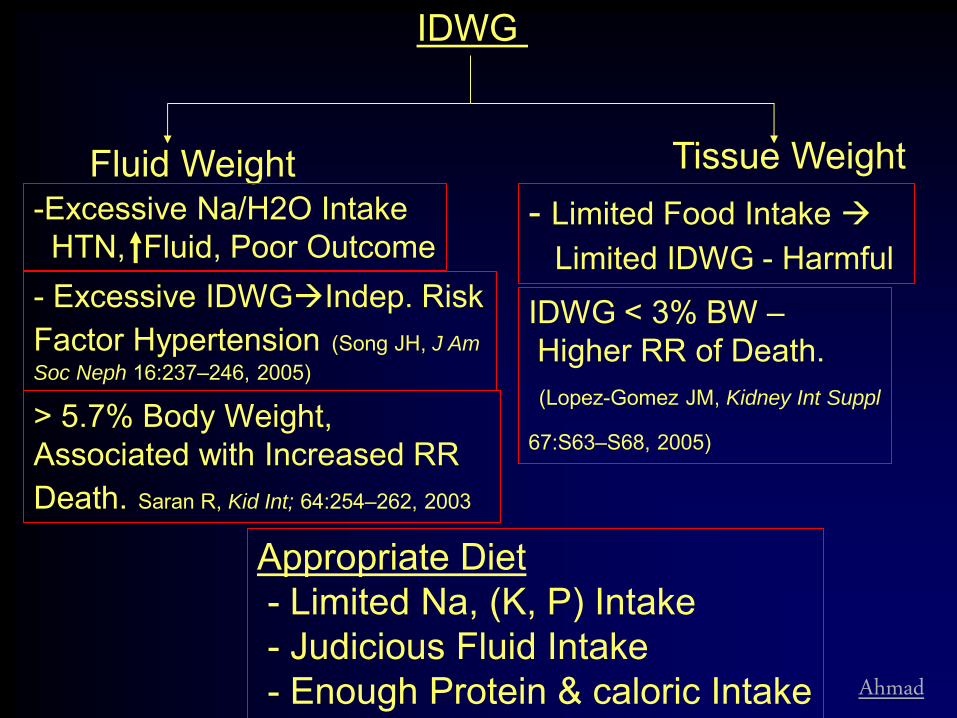
IDWG
Fluid Weight Tissue Weight
Appropriate Diet - Limited Na, (K, P) Intake - Judicious Fluid Intake - Enough Protein & caloric Intake
> 5.7% Body Weight, Associated with Increased RR Death. Saran R, Kid Int; 64:254–262, 2003
- Excessive IDWGIndep. Risk Factor Hypertension (Song JH, J Am
Soc Neph 16:237–246, 2005)
- Limited Food Intake Limited IDWG - Harmful IDWG < 3% BW – Higher RR of Death. (Lopez-Gomez JM, Kidney Int Suppl
67:S63–S68, 2005)
-Excessive Na/H2O Intake HTN, Fluid, Poor Outcome

Ahmad
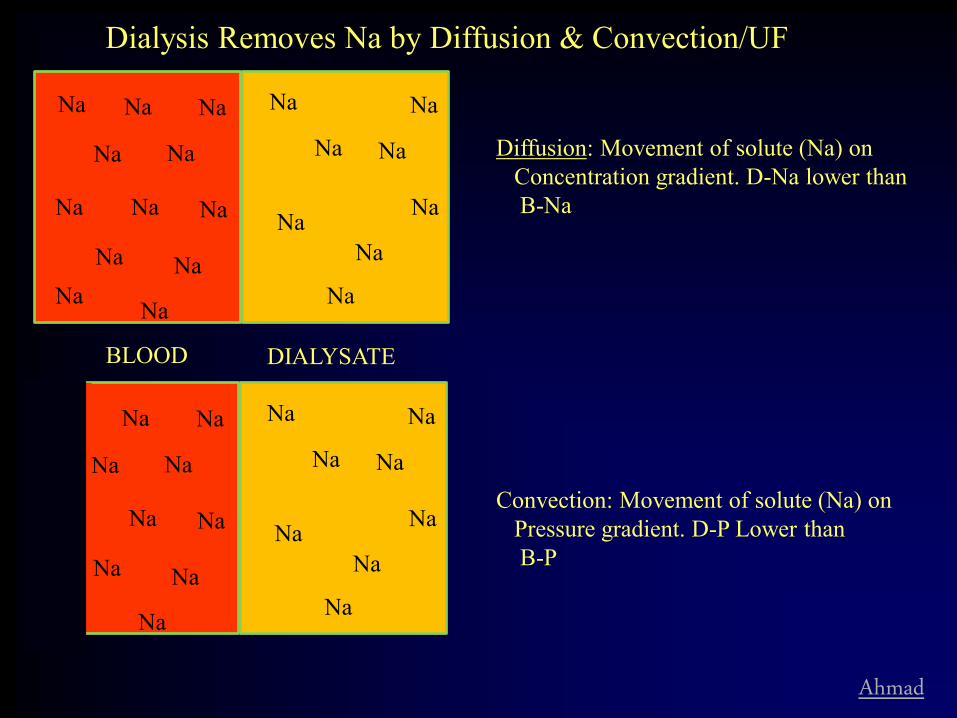
Na (Fluid) Removal by Dialysis
Ahmad
Dialysis Removes Na by Diffusion & Convection/UF
Na Na Na
Na
Na
Na Na
Na
Na
Na
Na
Na
Na
Na
Na
Na
Na
Na
Na Na
Diffusion: Movement of solute (Na) on Concentration gradient. D-Na lower than B-Na
Na Na Na
Na
Na
Na Na
Na
Na
Na
Na
Na
Na
Na
Na
Na
Na
Na
Na Na
Convection: Movement of solute (Na) on Pressure gradient. D-P Lower than B-P
Na
Na
Na
BLOOD DIALYSATE

Ahmad
Evolution of HD Technique In 1960s:
• Dialysate Na <130; Low Na Diet; Longer Dialysis Good BP Control
In 70s-80s (till now): • High Efficiency Shorter HD: Hypotension • Increase in Dialysate Na ~135Less Dialytic
Complications • BUT More HTN • Increase in mortality (? Na)
• Standard dialysate Na 140

Dialytic Na Removal Challenges
• Despite Na gradient difference and significant weight loss (UF) • Often patients are left in positive Na
balance at the end of the treatment?
Gibbs-Donnan Effect

Sodium balance with dialysis (Flanigan, 1998)
• Av. predial. Na 137.7, D-Na ~142, Av. weight loss 2.2 Kg
• Calculated Na balance +85 mEq (Na retained, despite 2.2 Liters UF)
• Several studies have shown the limitation of dialysis for Na removal by diffusion + convection (particularly with standard dialysate of 140 Na)

Diffusion –
Gradient between B- Na and D-Na
Lower than total serum Na Indirectly proportional to albumin
Diffusible Na, that is not: electrochemically attached to protein, and other non-diffusible anions These ‘attachments’ are dependent on pH and concentrations of anions.
Diffusible Na -
Na Na Na
Na
Na
Na Na
Na Na
Na
Na Na
Na
Na
Na
Na
Na
Na
Na Na
Na
alb.
alb.
Na
Na
Na X
Na Diffusion –
Gradient between diffusible B-Na and D-Na
Na

Na Na
Na
Na
Na
Na Na
Na Na
Na
Na Na
Na
Na
Na
Na
Na
Na
Na Na
Na
alb.
alb.
Na
Na
Na Na
Clinical Example: Total serum Na = 140 Dialysate Na = 137 Expected gradient +3 However, Diffusible Na = 135 Gradient = -2
Convection – Gradient independent However ultrafiltrate will only remove Na not ‘attracted’ to anions Or, the ultrafiltrate is relatively hyponatremic to serum: UF- Na < Serum- Na, In previous example UF Na = 135 mEq/L UF
Na
Na
Na
Na
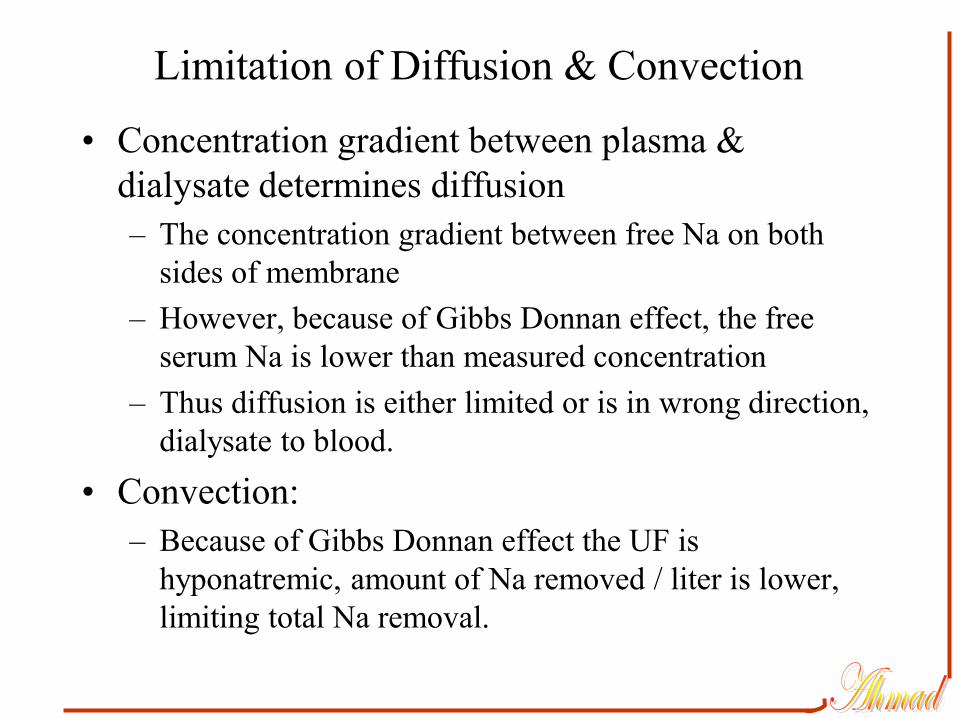
Limitation of Diffusion & Convection
• Concentration gradient between plasma & dialysate determines diffusion – The concentration gradient between free Na on both
sides of membrane – However, because of Gibbs Donnan effect, the free
serum Na is lower than measured concentration – Thus diffusion is either limited or is in wrong direction,
dialysate to blood. • Convection:
– Because of Gibbs Donnan effect the UF is hyponatremic, amount of Na removed / liter is lower, limiting total Na removal.
Na
Na
Na
Na
Na
Na
Na Na
Na
alb.
alb.
Na
Na
Na
Na
Na Na Na
Na
Na
Na
Na
Na Na
alb.
alb.
alb.
alb.
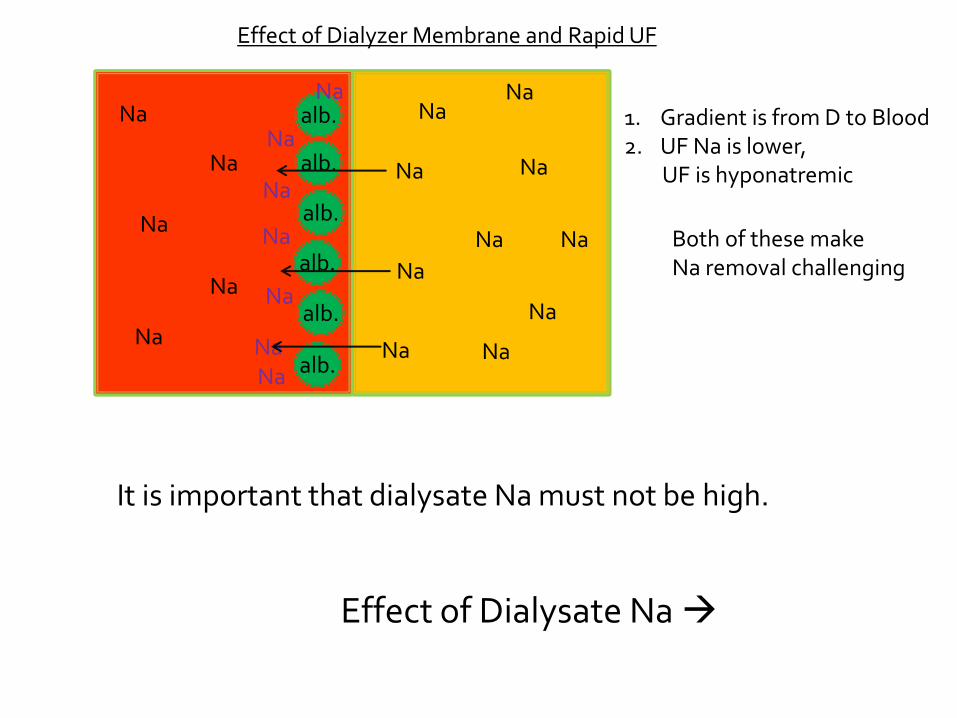
Effect of Dialyzer Membrane and Rapid UF
1. Gradient is from D to Blood 2. UF Na is lower, UF is hyponatremic
Both of these make Na removal challenging
It is important that dialysate Na must not be high.
Effect of Dialysate Na
Ahmad
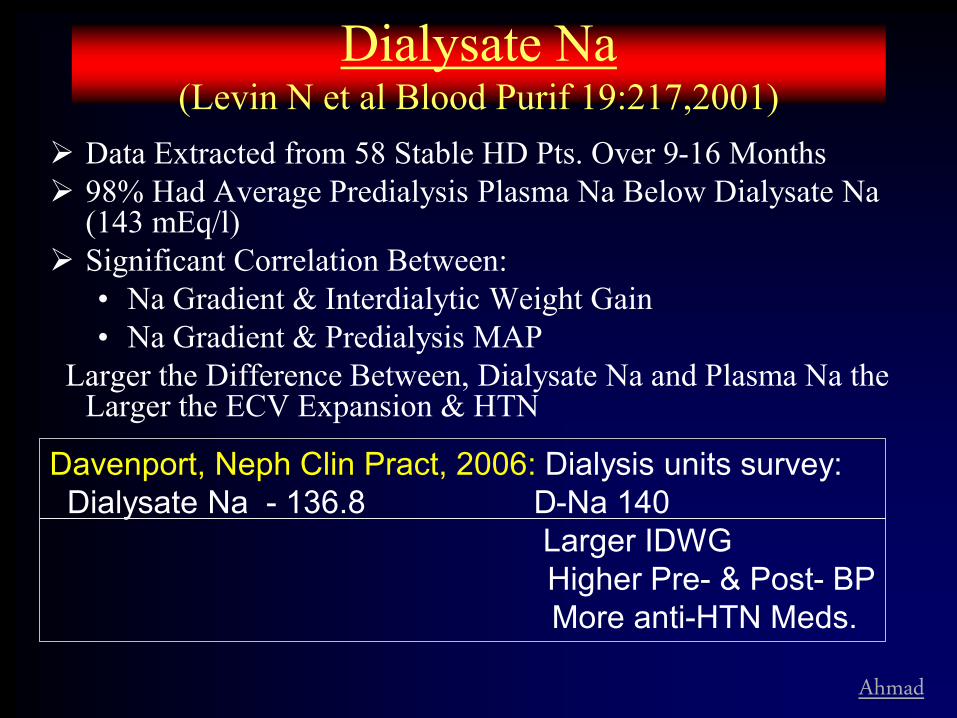
Dialysate Na (Levin N et al Blood Purif 19:217,2001)
Data Extracted from 58 Stable HD Pts. Over 9-16 Months 98% Had Average Predialysis Plasma Na Below Dialysate Na
(143 mEq/l) Significant Correlation Between:
• Na Gradient & Interdialytic Weight Gain • Na Gradient & Predialysis MAP
Larger the Difference Between, Dialysate Na and Plasma Na the Larger the ECV Expansion & HTN
Davenport, Neph Clin Pract, 2006: Dialysis units survey: Dialysate Na - 136.8 D-Na 140 Larger IDWG Higher Pre- & Post- BP More anti-HTN Meds.

Ahmad
Implications of current trends toward prescribing high dialysate sodium in hemodialysis.
Santos S F F , Peixoto A J CJASN 2008;3:522-530
©2008 by American Society of Nephrology

Data is accumulating that it leads to positive Na balance and hypertension
Increased Na is harmful Very selective and limited/No use of Na
modeling
Use UF modeling, lower temperature, reducing IDWG, increasing dialysis time etc.

Ahmad
Reaching Dry Weight
Inaccurate Assessment of Dry Weight Intra-dialytic Hypotension Poor Understanding of IDWG Poor Cardio-vascular Status
• Older Patients with Multi-system Problems
• Diabetics with Poor Vascular & Autonomic Response
Major Barriers:

Ahmad
Assessment of Dry Weight Clinically:
• BP • JVP • Pulmonary Exam • Edema / anasarca
Use of devices and Lab Tests: • ANP • Others, Bio-impedance

Ahmad
1. Increased BP 2. Central Venous Pressure (JVP) 3. Edema & Anasraca 4. Fluid in Lungs (Pulm.Edema) 5. Increased Trans-cellular space (Ascitis, Pl. Effusion etc.)
Signs of ECV Excess

Ahmad
ECV Determination
Only accurate laboratory method is radio-labelled determination of ECV/plasma/water
Bio-impedence determination provides information about ECW, ICW & nutrition • However its accuracy is controversial • Requires equipment and trained staff
Careful clinical examination is most practical and useful method

Ahmad
Reaching Dry Weight
Inaccurate Assessment of Dry Weight Intra-dialytic Hypotension Poor Understanding of IDWG Poor Cardio-vascular Status
• Older Patients with Multi-system Problems
• Diabetics with Poor Vascular & Autonomic Response
Major Barriers:

Ahmad
Preventing Hypotension
1. UFR Vs. Re-equilibration Rate

Intra- Cellular
Inter- stitial PV
Na excess – ECV Excess
Free Water Excess
Intra- Cellular
Inter- stitial PV
Pcap
OncC
Arteriole Venule
Capillary
Movement of Fluid Between Plasma & Interstitium Occurs at the Capillary Level Governed by Starlings Forces
Jf = Kf (Pcap + OncInt) – (OncC + PInt)

Intra- Cellular
Inter- stitial PV
UFR Slower Than Refill Rate From Interstitial Space - No PV
No Hypotension
UFR Faster Than Refill Rate PV Depletion
Hypotension
Normal RER 15-18 ml/kg/hr Recomm. UFR <13ml/kg/hr
Ahmad
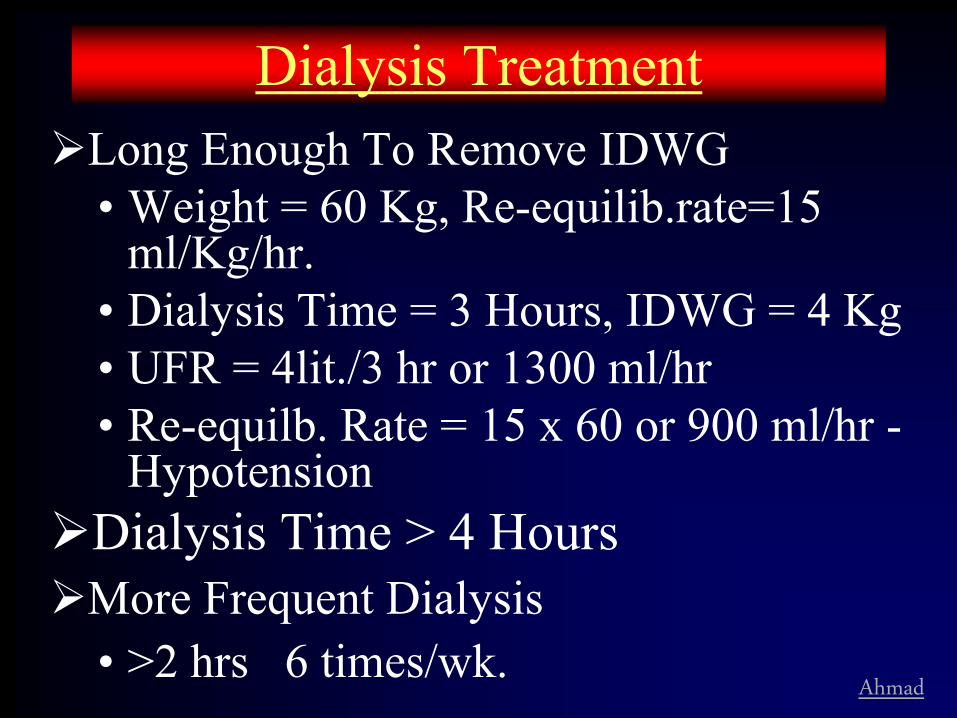
Dialysis Treatment Long Enough To Remove IDWG
• Weight = 60 Kg, Re-equilib.rate=15 ml/Kg/hr.
• Dialysis Time = 3 Hours, IDWG = 4 Kg • UFR = 4lit./3 hr or 1300 ml/hr • Re-equilb. Rate = 15 x 60 or 900 ml/hr -
Hypotension Dialysis Time > 4 Hours More Frequent Dialysis
• >2 hrs 6 times/wk.

Ahmad
Preventing Hypotension
2. Effect of Osmolarity

Osmolarity
Hemodialysis
Osmoles H2O
UF
Osmolar Drop Shrinks
ECV (PV) More Than caused by UF
Hypotension
Normal Response to Blood Loss
HR
SVR
BP is Maintained
In Uremia Response to UF
HR
SVR
Separate the Osmolar
Drop From UF Hypotension
Osmol.
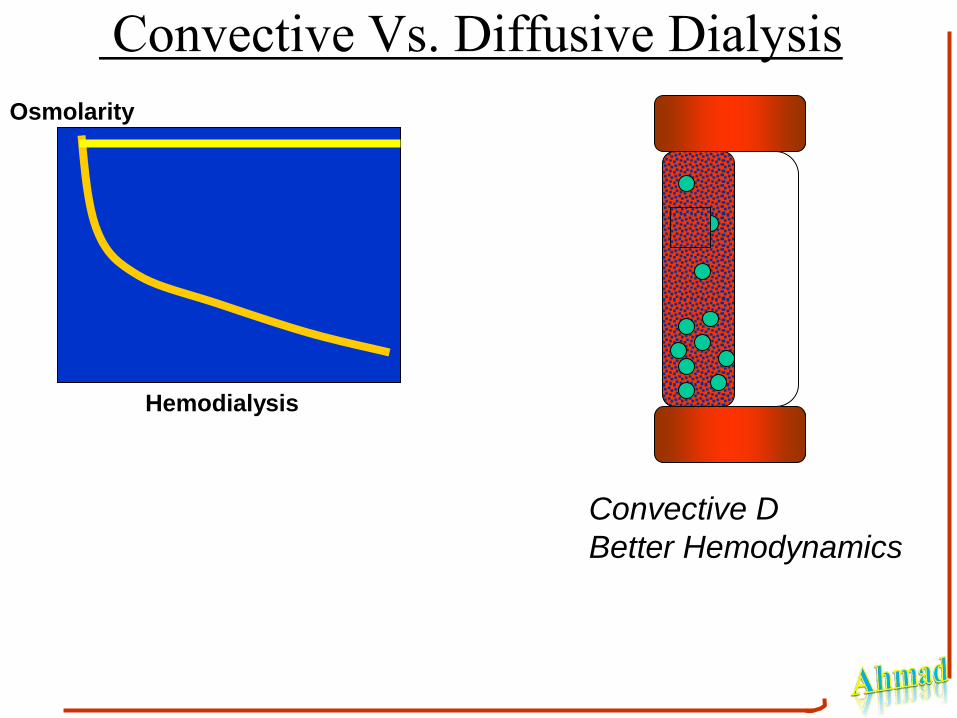
Convective Vs. Diffusive Dialysis Osmolarity
Hemodialysis
Convective D
Better Hemodynamics

Ahmad
UF Profiling
High UFR in the beginning followed by a gradual
reduction in UFR

Ahmad
Blood Vol. (%) UFR (l/h)
-20
-10
0
2
4
0 60 120 180 240 300 Lopot et al, Int J Artif Org 20:91,’97
Blood Vol. (%) UFR (l/h)
0 60 120 180 240 300 -40
-20
0
4
6
2
Stiller et al, Trans Am Soc Artif Int Org 35:S532,’89
Blood Volume Response to UF Modelling
STEPPED UF INTERMITTENT UF

Ahmad
UF Profiling Reported to Decrease Hypotensive
Episodes Appears to Be More Effective Than Na
Profiling Increase in IDWG not reported More Studies Needed:
• Type of Profile • Long Term Effects

Controlling Na Fluid Excess Limit IDWG by adjusting Na intake Dialysis must be long enough to remove
fluid excess safely (UFR <13 ml/Kg/hr) The dialysate Na must be low enough to aid
diffusive loss more importantly prevent positive Na balance. • Balance between dialytic symptoms and Na
removal Use convective dialysis to prevent
hypotension
Ahmad
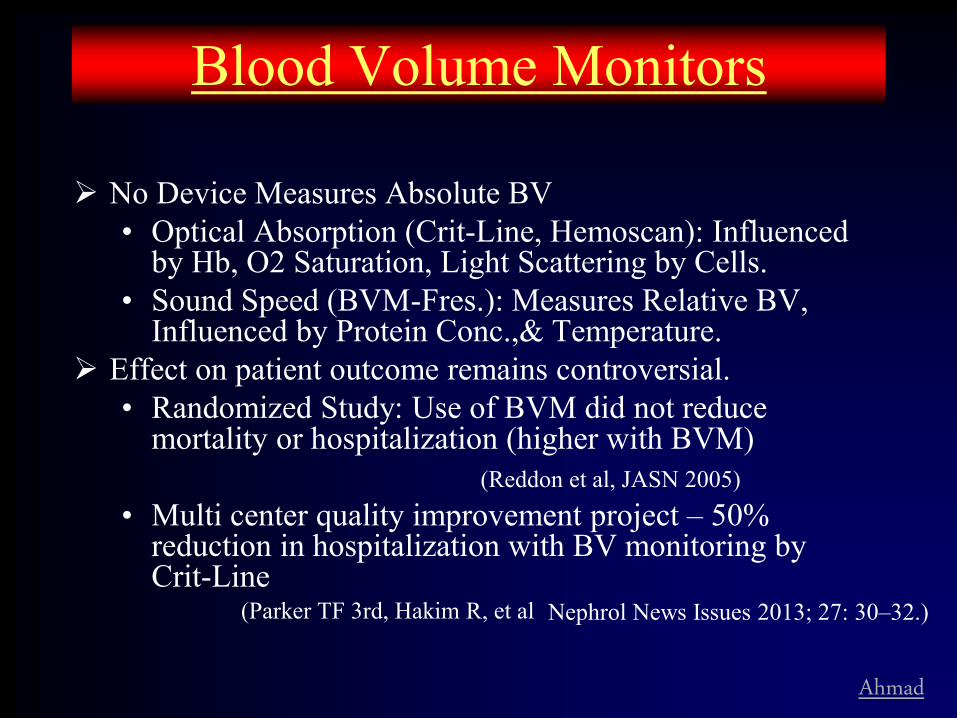
Blood Volume Monitors
No Device Measures Absolute BV • Optical Absorption (Crit-Line, Hemoscan): Influenced
by Hb, O2 Saturation, Light Scattering by Cells. • Sound Speed (BVM-Fres.): Measures Relative BV,
Influenced by Protein Conc.,& Temperature. Effect on patient outcome remains controversial.
• Randomized Study: Use of BVM did not reduce mortality or hospitalization (higher with BVM)
(Reddon et al, JASN 2005) • Multi center quality improvement project – 50%
reduction in hospitalization with BV monitoring by Crit-Line
(Parker TF 3rd, Hakim R, et al Nephrol News Issues 2013; 27: 30–32.)
Ahmad
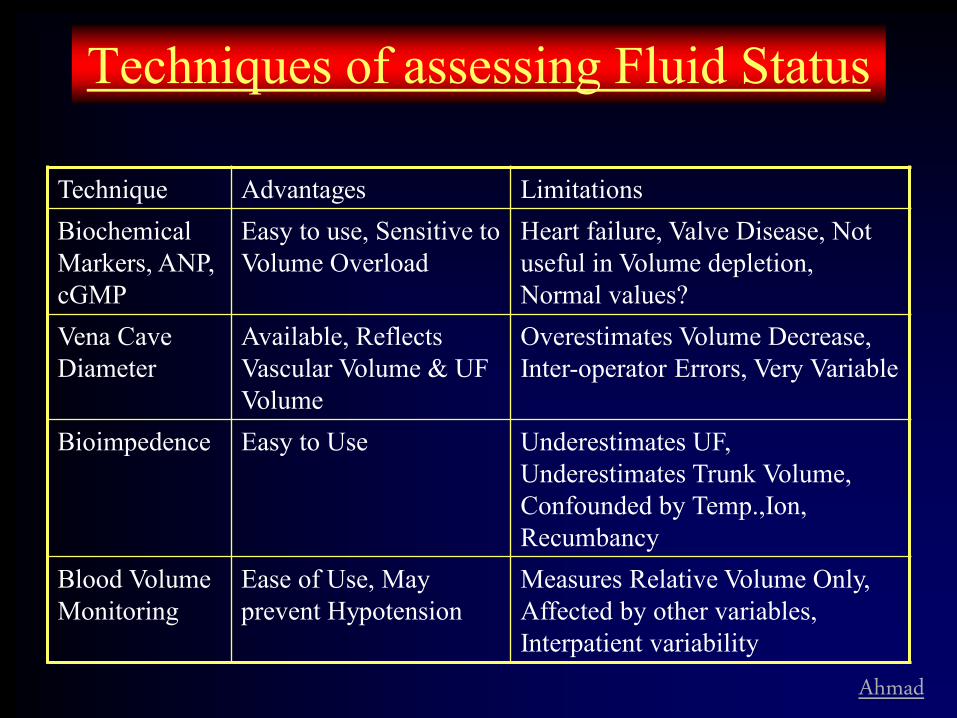
Techniques of assessing Fluid Status
Technique Advantages Limitations Biochemical Markers, ANP, cGMP
Easy to use, Sensitive to Volume Overload
Heart failure, Valve Disease, Not useful in Volume depletion, Normal values?
Vena Cave Diameter
Available, Reflects Vascular Volume & UF Volume
Overestimates Volume Decrease, Inter-operator Errors, Very Variable
Bioimpedence Easy to Use Underestimates UF, Underestimates Trunk Volume, Confounded by Temp.,Ion, Recumbancy
Blood Volume Monitoring
Ease of Use, May prevent Hypotension
Measures Relative Volume Only, Affected by other variables, Interpatient variability

Ahmad
v
The BV monitor can non-invasively and continuously measure percentage change in BV. The Crit-Line measures HCT, oxygen saturation, and calculates hemoglobin.
v
Non-dialyzable substances such as RBC and Protein concentration Can be monitored in the art. blood line.
As plasma water is ultrafiltered, the Increase in concentration of these particles Will be proportional to the decrease in Plasma water.
The slope of the curve will reflect Ultrafiltration Vs Re-equilibration
Blood Volume Monitoring

Ahmad
BVM advantages & limitations BVM only monitor the percentage change in
blood volume during dialysis. Device is helpful in preventing too fast UF leading
to hypotension and cardiac issues Device seems to be helpful in convincing patients
to allow adequate UF Limitations:
• The effect of change in RBC volume with a decrease in osmolarity can influence the results.
• It does not provide any information about ECV
status, only a % change in blood volume
Effect on patient outcome is controversial

Ahmad
Intradialytic Hypotension (Prevention)
Slower UF, UF Modeling? Increased Dialysate Na, Na Modeling. Risk of +Ve
Na Balance Remove BP Meds. (Use Short Acting) Lower Dialysate Temperature Dialysate Buffer, Avoid Acetate Avoid Large Meals During HD Prevent Arrhythmia, Improve Cardiac Fx SUF; UF modeling Avoid Low Dialysate Ca Treat Lower Hct.

Ahmad
Anti-hypertensive Medications
Normal response to UF is to SVR & HR
• BP = CO x SVR BP is maintained
BP medications work by: • Reducing SVR; Reducing CO; or Both
BP medication interfere with normal response to UF, thus reaching DW
HR
VR
BP
UF
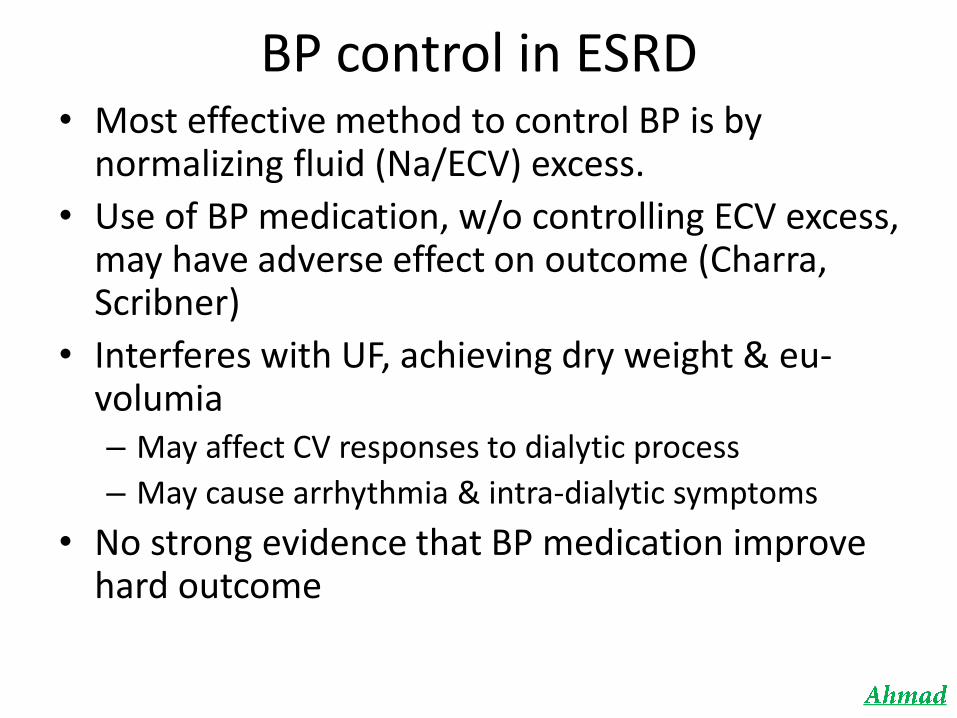
BP control in ESRD • Most effective method to control BP is by
normalizing fluid (Na/ECV) excess.
• Use of BP medication, w/o controlling ECV excess, may have adverse effect on outcome (Charra, Scribner)
• Interferes with UF, achieving dry weight & eu-volumia – May affect CV responses to dialytic process
– May cause arrhythmia & intra-dialytic symptoms
• No strong evidence that BP medication improve hard outcome

However, • Home BP is more predictive of outcome than
dialytic BP
• During the inter-dialytic period BP may increase to hypertensive levels and BP medications may help?
• In non-ESRD,BP medications have been shown to: – Improve cardiac remodeling – ACEI/ ARB (CCB)
– Improve outcome after coronary events (B-blockers)
– Improve CCF (MRA, B-blockers, ACEI/ARB)
– Remodel arterial wall thickening (ACEI)
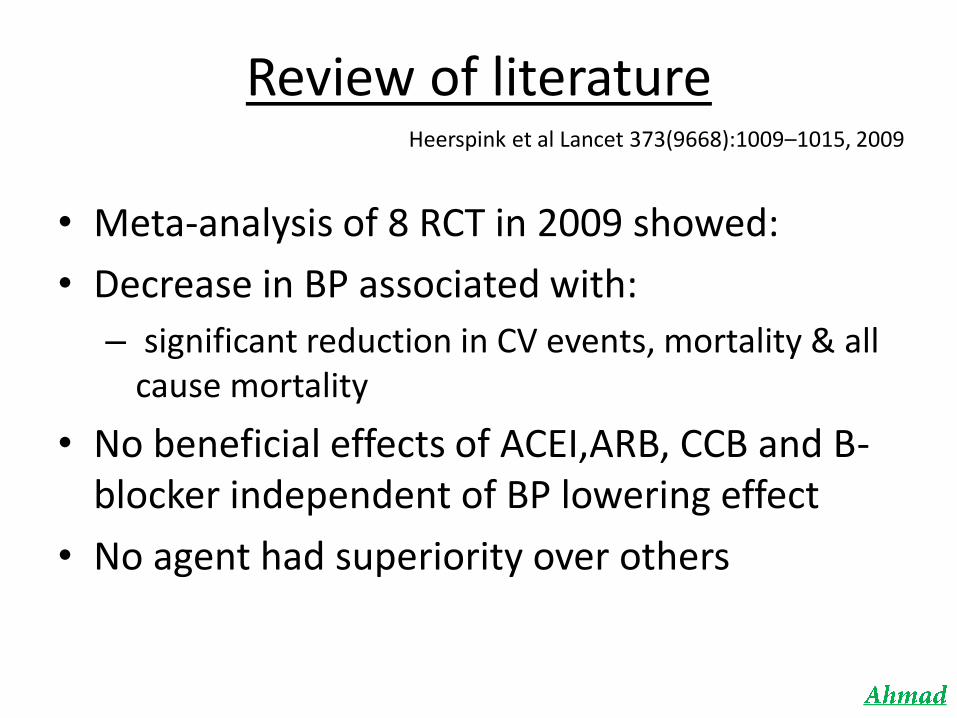
Review of literature
• Meta-analysis of 8 RCT in 2009 showed:
• Decrease in BP associated with:
– significant reduction in CV events, mortality & all cause mortality
• No beneficial effects of ACEI,ARB, CCB and B-blocker independent of BP lowering effect
• No agent had superiority over others
Heerspink et al Lancet 373(9668):1009–1015, 2009

BP Medications: ACEI & ARB
• ACEI are dialyzed ARBs are not
• ACEI increase cytokines more than ARB (Ahmad et al)
– More risk of allergic reactions, angioedema with ACEI
• Both are associated with risk of hyperkalemia
• Supporting evidence for benefit is not as strong as in non ESRD population
• My bias is to use ARB (if you have to)
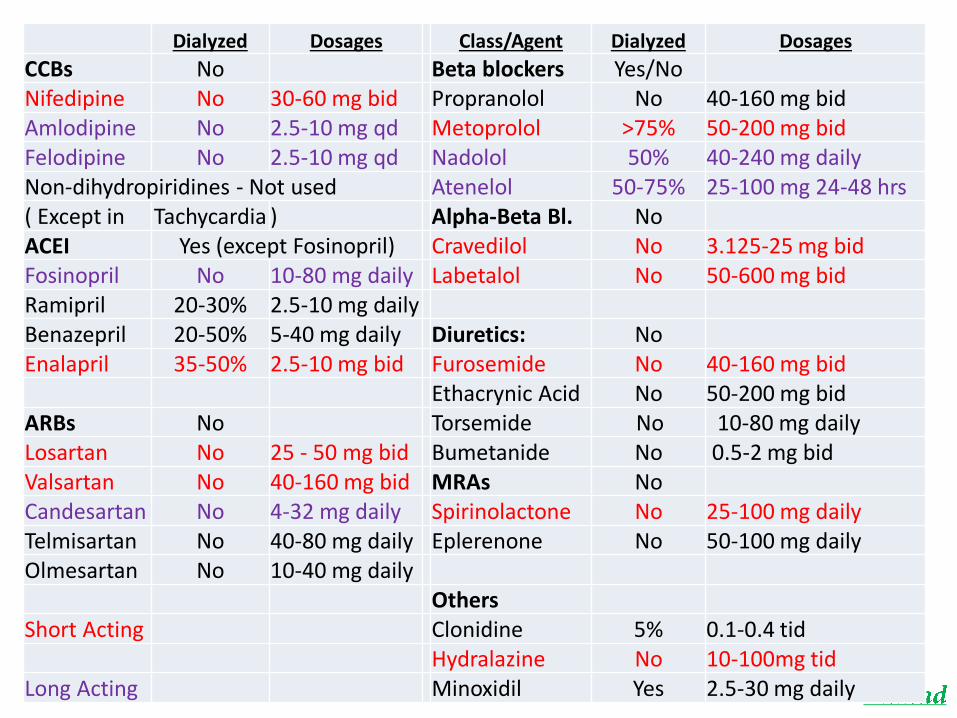
Dialyzed Dosages Class/Agent Dialyzed Dosages
CCBs No Beta blockers Yes/No Nifedipine No 30-60 mg bid Propranolol No 40-160 mg bid Amlodipine No 2.5-10 mg qd Metoprolol >75% 50-200 mg bid Felodipine No 2.5-10 mg qd Nadolol 50% 40-240 mg daily Non-dihydropiridines - Not used Atenelol 50-75% 25-100 mg 24-48 hrs ( Except in Tachycardia ) Alpha-Beta Bl. No ACEI Yes (except Fosinopril) Cravedilol No 3.125-25 mg bid Fosinopril No 10-80 mg daily Labetalol No 50-600 mg bid Ramipril 20-30% 2.5-10 mg daily Benazepril 20-50% 5-40 mg daily Diuretics: No Enalapril 35-50% 2.5-10 mg bid Furosemide No 40-160 mg bid
Ethacrynic Acid No 50-200 mg bid ARBs No Torsemide No 10-80 mg daily Losartan No 25 - 50 mg bid Bumetanide No 0.5-2 mg bid Valsartan No 40-160 mg bid MRAs No Candesartan No 4-32 mg daily Spirinolactone No 25-100 mg daily Telmisartan No 40-80 mg daily Eplerenone No 50-100 mg daily Olmesartan No 10-40 mg daily
Others Short Acting Clonidine 5% 0.1-0.4 tid
Hydralazine No 10-100mg tid Long Acting Minoxidil Yes 2.5-30 mg daily

Ahmad
General Guideline Use Short-acting Anti-hypertensive Maintain accurate record of BP Meds Reduce and Stop BP Meds. As Dry Weight is
Reached Re-establish Dry Weight:
• Nutritional Status Improves • Concurrent Illness Malnutrition • After Hospitalization • Social Status Change
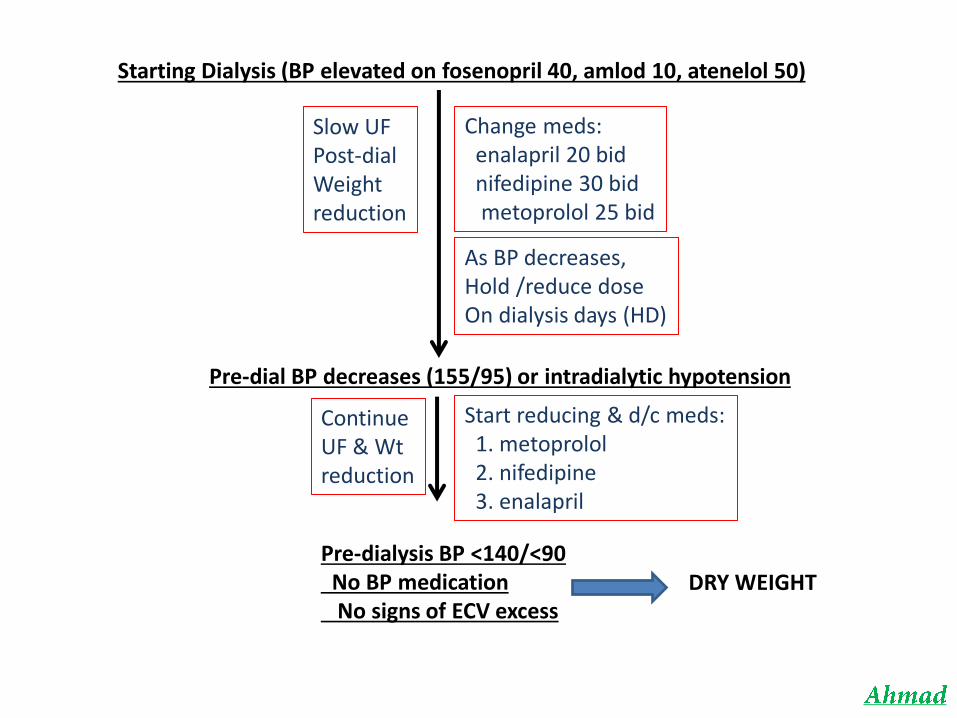
Starting Dialysis (BP elevated on fosenopril 40, amlod 10, atenelol 50)
Slow UF Post-dial Weight reduction
Change meds: enalapril 20 bid nifedipine 30 bid metoprolol 25 bid
As BP decreases, Hold /reduce dose On dialysis days (HD)
Pre-dial BP decreases (155/95) or intradialytic hypotension
Continue UF & Wt reduction
Start reducing & d/c meds: 1. metoprolol 2. nifedipine 3. enalapril
Pre-dialysis BP <140/<90 No BP medication No signs of ECV excess
DRY WEIGHT
Ahmad
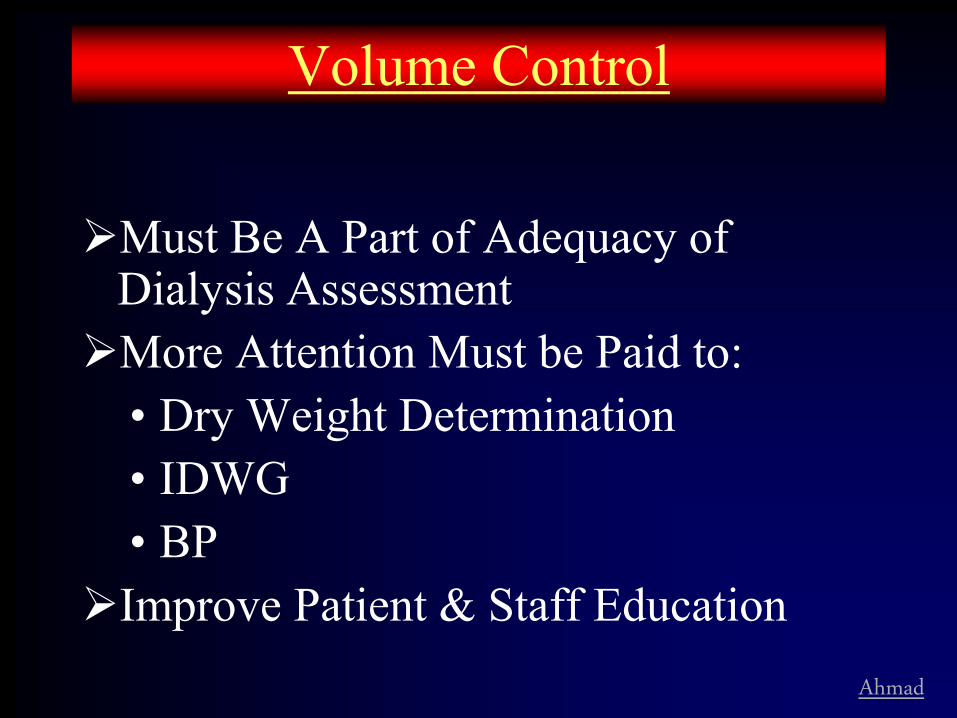
Volume Control
Must Be A Part of Adequacy of Dialysis Assessment
More Attention Must be Paid to: • Dry Weight Determination • IDWG • BP
Improve Patient & Staff Education