dry matter partitioning and root growth in an annual wheat
TRANSCRIPT

Dry matter partitioning and root growth in an annual
wheat, a perennial wheatgrass and four
perennial wheat derivatives
by
Jesmin Aktar
B.Sc. Agri. (Hons.), Khulna University
MS (Agronomy), BSMR Agricultural University, Bangladesh
A thesis submitted to Charles Sturt University for the Degree of
Doctor of Philosophy
School of Agricultural and Wine Sciences
Faculty of Science
March 2016

ii
Certificate of Authorship
I hereby declare that this submission is my own work and to the best of my
knowledge and belief, understand that it contains no material previously published or
written by another person, nor material which to a substantial extent has been
accepted for the award of any other degree or diploma at Charles Sturt University or
any other educational institution, except where due acknowledgement is made in the
thesis [or dissertation, as appropriate]. Any contribution made to the research by
colleagues with whom I have worked at Charles Sturt University or elsewhere during
my candidature is fully acknowledged.
I agree that this thesis be accessible for the purpose of study and research in
accordance with normal conditions established by the Executive Director, Library
Services, Charles Sturt University or nominee, for the care, loan and reproduction of
thesis, subject to confidentiality provisions as approved by the University.
Name : Jesmin Aktar
Signature :
Date : 23 March 2016
iii
Acknowledgements
This thesis signifies not only my effort at the console, it is a milestone in a
decade of work at Charles Sturt University on perennial wheat. Since joining this
team, I have been given the opportunity to learn about research tools used in cutting
edge research on perennial wheat. First and foremost, I wish to express my
appreciation and thanks to my principal supervisor, Professor Len J. Wade, for
including me in his research team; you have been a tremendous mentor for me. I
would like to thank you for encouraging me in my research and for allowing me to
grow as a research scientist. I would also like to thank my supervisors, Dr. Sergio J.
Moroni, for being my primary resource for getting my science questions answered
and instrumental in helping me complete this thesis. I express my gratitude to Dr.
Mark Norton for his comments and suggestions. I would especially like to thank Mr.
Kerry Schirmer for his continuous and generous support throughout my experimental
period in both the lab and in the field. I would also like to express my gratitude to the
support service providers, Richard Hayes and Matt Newell, for providing perennial
wheat germplasms seed throughout the experiment and for soil sampling on the trial
set up in Cowra, NSW. Special thanks to Dr. Philip Larkin for including me and
giving me the opportunity to write up a scientific review article on perennial wheat
and to incorporate some of my findings.
I would also like to thank Ms. Jennifer Locker, Kamala Anggamuthu and Ms.
Sarah Boothey for providing administrative and financial advice and support
throughout my study. I thank the Graham Centre for Agricultural Innovation for
supporting me to attend conferences. I want to express my gratitude to the Future
Farm Industries CRC (FFICRC) for assisting me and providing partial funding to
support my work.

iv
I also thank the wonderful staff in the Agronomy and the other laboratories for
always being so helpful and friendly. People here are genuinely nice and want to help
you out and I’m particularly glad to have been given the opportunity to work with
many including David Thompson, Rhonda Beecher and Darren. I also thank Dr. Phil
Eberbach for providing soil for my experiment. I acknowledge many others
including Ms Shamima Sultana, Natalie Allison, John Broster, Darren Collins,
Richard Early for assisting me in dealing with in a range of laboratory, controlled
environment and field experimental issues.
I appreciate the assistance of Cassily Charles and Nathan Ning for language
support and proofreading of this thesis, Sharon for data analysis courses and Dr.
Sandra Savocchia for providing support as the PhD coordinator. I am also in debt to
the following people for their support: Shanta, Marefa, Fahima, Nazish, Nipa, Nilufa,
Tonmoye, Bithika, Anne, Shimu, Shamima, Shahana, Kayle, Soumi, Saba, Nazmul,
Mostafa and Iftekhar.
Words cannot express how grateful I am to my beloved husband, Dr. Shamsul
Haque, for encouraging me throughout this experience, and my kids, Shafwan and
Nubaid, for all of the sacrifices that they’ve made. A special thanks to my parents
(Mohammad Jahangir Hossain and Mrs Laily Begum), my siblings (Sohag, Parvin
and Sumon), and other family members; your prayers for me were what sustained me
this far.
I would like to thank Charles Sturt University for awarding me a Faculty of
Science Compact Scholarship, which facilitated my aspiration to complete the study.
Finally and most importantly I thank my God, Allah the almighty, for letting
me survive through all of the difficulties.
Thank you,
Jesmin Aktar

v
I dedicate this thesis to my parents for their constant
support and unconditional love.
I love you all dearly.

vi
Abstract
The development of perennial wheat could provide further options in the mixed
farming systems of southern Australia, including greater flexibility in grain and/or
forage production, while also providing improved ecosystem services. In recent
studies, newly-developed perennial wheat derivatives, between bread wheat
(Triticum aestivum L. [6n]) and perennial grass (e.g. Thinopyrum intermedium [6n]),
have been reported to survive, regrow and produce grain in fields at Cowra NSW, for
up to four years.
Following this initial proof of concept, this thesis examines the growth of
perennial wheat derivatives in greater detail, under controlled conditions in large soil
columns in a screen-house, and with some further field validation at Cowra. In each
case, an annual wheat and a perennial grass were used as controls, for comparison
with selected perennial wheat derivatives. First, the research examined the patterns of
survival, regrowth, dry matter production and partitioning over three years, to
determine attributes associated with sustained survival, regrowth and performance.
Second, the research addressed how these patterns may change in response to
limitations in the source, sink or both, to determine differences in sink priority, and
hence, circumstances that produce any yield trade-off between annual and perennial
growth habits. Third, the research examined whether perennial genotypes allocate
more dry matter to roots, and if this can result in greater extraction of soil water from
depth under prolonged water deficit. This was done to determine whether improved
resource capture or greater initial dry matter at the beginning of a regrowth season
can significantly extend the growing season of perennial wheat.
The first study with perennial wheat derivatives over successive generations
proved their ability to survive and produce and increase root biomass in older plants.
Grain yield was lower in perennials than in annual wheat, with the yields being
vii
similar in the first-and second-year of growth in perennial wheat derivatives, but
increasing in the third year of growth. Some three-year-old perennial wheat
derivatives produced2–3 fold more grain per plant than annual wheat controls. The
above-ground biomass in three-year-old plants was 2–7 fold greater in perennial
wheat derivatives than in annual wheat. In better performing perennial wheat
derivatives and perennial grass root growth was found to be 2 fold greater in the first
year and this increased to be 3–12 fold greater in older perennial wheat derivatives
and perennial grass. Perennial wheat derivatives and perennial grass produced more
tillers, biomass, and root growth with increasing plant age, all of which were likely
contributors to the consistent regrowth and survival of these plants in successive
years.
In the second study, resource allocation priorities with source or sink
manipulation were explored in perennial wheat derivatives and perennial grass, and
the outcomes were compared to those for annual wheat in two experiments. Under
sink manipulation (the reduction of spikelets from one side of the spike), greater
amounts of the available resources were translocated to the remaining seed, resulting
in a larger seed size. This may indicate the potential for yield improvement as a
result of breeding developments in perennial wheat and grass genotypes. In
comparison, a smaller seed size and more biomass in the source-reduced study may
have been correlated with greater priority being allocated to survival rather than
grain production in perennial wheat derivatives and perennial grass, relative to
annual wheat.
In the third study, the association of root growth and soil water extraction for
the provision of drought resistance in perennial wheat derivatives and perennial grass
in extended drying down conditions were investigated. After water was withheld,
promising perennial wheat genotypes with more extensive and deeper root systems
viii
showed greater water extraction from deeper within the soil and, in turn, longer plant
survival. This is the first comprehensive study with a third-year-old stand of
perennial wheat derivatives and perennial grass that provides evidence of drought
resistance directly due to the extensive root system and water extraction from deeper
soil depths, thus confirming the hydrological benefits of perennial wheat during
drought.
Perennial wheat derivatives showed variable responses in regrowth in different
planting seasons and subsequent years, and produced more biomass and root growth.
Increased root growth enabled plants to access soil water from greater soil depths,
and was found in controlled conditions and in the field. The most promising
derivatives were able to approach or exceed the perennial grass performance in
similar conditions. These results added support to previous reports and provide a
novel contribution to the growing literature on perennial wheat. In particular, I found
source-sink balance in relation to the effects of plant age on resource acquisition and
partitioning trends, indicating that perennial wheat have some physiological traits to
withstand extended drying.

ix
Table of Contents
Certificate of Authorship ....................................................................................................... ii
Acknowledgements ................................................................................................................ iii
Abstract ................................................................................................................................... vi
Table of Contents .................................................................................................................... ix
Chapter 1: General Introduction ............................................................................................. 19
Chapter 2. Literature Review ................................................................................................. 24
2.1 Introduction ............................................................................................................ 24
2.2 History of perennial wheat development and current research .............................. 27
2.3 Challenges in perennial wheat development .......................................................... 33
2.3.1 Breeding strategy and associated problems for perennial wheat development
34
2.3.2 Resistance and tolerance to diseases in perennial wheat ................................ 35
2.3.3 Perenniality vs. productivity trade-offs .......................................................... 37
2.4 Source and sink relationships in cereal plants with an annual or perennial growth
habit 39
2.5 Water use in perennials in relation to moisture deficit ........................................... 44
2.5.1 General reactions of plants to soil moisture deficit ........................................ 45
2.5.2 Crop development and growth- phenology, yield and moisture deficit ......... 48
2.5.3 Drought survival in perennial grasses ............................................................ 50
2.5.4 Drought resistance and annual wheat ............................................................. 52
2.6 Discussion of the literature reviewed ........................................................................... 53
Chapter 3 ................................................................................................................................ 56
Seasonal comparison on root growth and dry matter partitioning in four perennial wheat
derivatives, a perennial grass and an annual wheat. ............................................................... 56
Abstract .................................................................................................................................. 56
3.1 Introduction ............................................................................................................ 57
3.2 Materials & Methods .............................................................................................. 62
3.2.1 Experimental location and soil columns preparation...................................... 62
3.2.2 Experimental design ...................................................................................... 63
3.2.3 Selection of genotypes .................................................................................... 63
3.2.4 Cultural management...................................................................................... 64
3.2.5 Measurements ................................................................................................. 65
3.2.6 Statistical analysis .......................................................................................... 67

x
3.3 Results .................................................................................................................... 67
3.3.1 Cultural conditions ......................................................................................... 67
3.3.2 Phenology in successive growing season regrowth and within season
comparison ..................................................................................................................... 68
3.3.3 Total dry matter production and partitioning to above- and below-ground
components ..................................................................................................................... 70
3.3.4 Root dry weight in different soil depth increments ...................................... 72
3.3.5 Grain yield and yield parameters .................................................................... 73
3.3.6 Dry matter allocation in regrowth in well-watered and water deficit condition
in three successive years ................................................................................................. 75
3.3.7 Within season comparison for dry matter allocation in regrowth .................. 75
3.4 Discussion .............................................................................................................. 76
3.5 Conclusion .............................................................................................................. 82
3.6 Acknowledgments .................................................................................................. 82
3.7 References .............................................................................................................. 83
3.8 Figures and tables ................................................................................................... 85
Chapter 4. ............................................................................................................................... 98
Source-sink manipulation on dry matter partitioning in perennial wheat .............................. 98
Abstract .................................................................................................................................. 98
4.1 Introduction ............................................................................................................ 98
4.2 Materials and methods .......................................................................................... 102
4.2.1 Experiment 1 ................................................................................................ 102
4.2.1.5 Sink limitation .............................................................................................. 104
4.2.2 Experiment 2 ................................................................................................ 104
4.2.3 Statistical analysis ........................................................................................ 107
4.3 Results .................................................................................................................. 107
4.3.1 Experiment 1 ................................................................................................ 107
4.3.2 Experiment 2 ................................................................................................ 111
4.4 Discussion ............................................................................................................ 114
4.5 Conclusion ............................................................................................................ 117
4.6 References ............................................................................................................ 118
4.7 Tables and figures ................................................................................................ 121
Chapter 5 .............................................................................................................................. 130
Root growth and water extraction by perennial wheat derivatives....................................... 130
Abstract ............................................................................................................................ 130
5.1 Introduction .......................................................................................................... 131
5.2 Materials and methods .......................................................................................... 133

xi
5.2.1 Experimental design ..................................................................................... 134
5.2.2 Treatments .................................................................................................... 134
5.2.3 Measurements and calculations .................................................................... 135
5.2.4 Statistical analysis ........................................................................................ 139
5.3 Results .................................................................................................................. 139
5.3.1 Water loss (%) .............................................................................................. 139
5.3.2 Volumetric water content (VWC) ................................................................ 140
5.3.3 Root dry weight (RDW) ............................................................................... 141
5.3.4 Relative water content (RWC) ..................................................................... 141
5.3.5 Stomatal conductance ................................................................................... 142
5.3.6 Phenology ..................................................................................................... 142
5.3.7 Total dry matter ............................................................................................ 143
5.3.8 Field validation ............................................................................................. 144
5.4 Discussions ........................................................................................................... 145
5.5 Conclusions .......................................................................................................... 151
5.6 Acknowledgements .............................................................................................. 152
5.7 References ............................................................................................................ 153
5.8 Figures and tables ................................................................................................. 155
Chapter 6. General discussion, conclusion and future work direction ................................. 164
6.1 General discussion ...................................................................................................... 164
6.1.1 Regrowth, dry matter production and partitioning pattern in perennial wheat over
generations and in seasonal comparison: ..................................................................... 165
6.1.2 Summer regrowth in dry season (DS): ................................................................ 168
6.1.3 Resource allocation pattern in perennial and annual growth habit and their
changes with source and sink manipulation: ................................................................ 168
6.1.4. Water extraction and root growth in extended drying down tolerance in perennial
and annual wheat: ......................................................................................................... 169
6.1.5 Ecosystem services and disservices provided by perennial grain crop: ............. 170
6.2 Conclusion .................................................................................................................. 173
6.3 Directions for future studies ....................................................................................... 174
Chapter 7. References ........................................................................................................... 176

xii
List of manuscripts prepared for publications
Journal papers
Seasonal comparison on root growth and dry matter partitioning in four perennial
wheat derivatives, a perennial grass and an annual wheat. Manuscript in
preparation.
Source-sink manipulation on dry matter partitioning in perennial wheat.
Manuscript in preparation.
Root growth and water extraction by perennial wheat derivatives. Manuscript in
preparation.
Conference papers
Aktar J, Moroni S, Norton M, Wade LJ (2015) Patterns of dry matter production,
allocation and water use in perennial wheat. In '17th ASA conference'.
Hobart, Australia. (Eds T. Acuña, C. Moeller, D Parsons and M Harrison).
(Agronomy Society Australia). www.agronomy2015.com.au.
Aktar, J., Moroni, J. S., Norton, M. R., & Wade, L. J. (2013). Above- and below-
ground dry matter of four perennial wheat derivatives. Paper presented at the
4th International Symposium of Forage Breeding, a Satellite Symposium of
the 22nd International Grassland Congress, 23–25 September 2013. Agri Bio,
Centre for Agri Bioscience La Trobe University, Bundoora 3083 Melbourne,
Victoria.

xiii
Other publication
Larkin PJ, Newell MT, Hayes RC, Aktar J, Norton MR, Moroni SJ, Wade LJ (2014)
Progress in developing perennial wheats for grain and grazing. Crop and
Pasture Science 65:1147-1164.

xiv
List of Figures
Chapter 2
Figure 1. Schematic diagram of source-Sink manipulation in perennial wheat ..................... 41
Chapter 3
Figure 1 The maximum and minimum temperatures (oC), and the solar radiation (shaded
yellow) recorded during ......................................................................................................... 88
Figure 2 The relative humidity (%), evapotranspiration (mm), rainfall (mm) and pan
evapotranspiration (mm) recorded for the experimental period. ............................................ 89
Figure 3 The number of days to flowering (left (number of days after sowing or last stubble
cut) (a, b, c) and plant height (cm) (d, e, f) are shown for one annual wheat, four perennial
wheat derivatives, and one perennial grass, in the of 2011 (a and, d) ,2012 (b and , e), and
2013(c and, f). cropping years LSDs (P=0.05) 3.046 for days to flowering, and 20.99 for
plant height. ............................................................................................................................ 90
Figure 4. The number of tillers (left hand side) (a, b, c) and the number of ears (d, e, f) (right
hand side) are shown for four perennial wheat derivatives, one perennial grass, and one
annual wheat grown in the cropping year of 2011(a and d), 2012 (b and e), 2013 (c and f).
Cropping years LSDs (P=0.05) were 15.84 for number of tillers, and 7.08 for number of ears.
Further details of statistical significance of dry matter components are presented in Table 2.
................................................................................................................................................ 91
Figure 5 Total above-ground dry matter (with components) and total root dry matter in one
annual wheat, 4 perennial wheat derivatives, and one perennial grass at six harvests : a) at
flowering 2011; b) at physiological maturity in the first wet season, December 2011; c) at the
first dry season regrowth, April 2012; d) at physiological maturity in the second wet season,
December 2012; e) at the second dry season regrowth, April 2013; and f) at physiological
maturity in the third wet season, December 2013. LSDs for total above-ground dry matter
and total root dry matter were 22.54 and 7.297, respectively, at P=0.05. Further details of
statistical significance of dry matter components are presented in Table 2. .......................... 92
Figure 6. Root dry weight presented as the Square root of (RDW + 0.5) over soil depth
increments for five harvests for three years: a) wet season 1 at flowering time 2011; b) at
physiological maturity, December 2011 (WS1); c) at the end of dry season regrowth, April
2012; d) at physiological maturity, December 2012(WS2); and e) at physiological maturity,
December 2013(WS3). The Level of Significance is stated as significant (*) or not
significant (ns). The original root dry weight is stated in the upper scale as (RDW) for the
same data point stated in SQRT (RDW+0.5). ........................................................................ 93
Figure 7. Grain weight per plant (left hand side) and harvest index (right hand side) a
represented for four perennial wheat derivatives, one perennial grass and one annual wheat
grown in the harvest year of 2011(a and d), 2012(b and e), and 2013 (c and f). LSDs for
grain weight per plant and harvest index were 3.293 and 0.184, respectively, at P=0.05.
Further details of statistical significance of dry matter components are presented in Table 2.
................................................................................................................................................ 94
Figure 8. Grain number per ear (left hand side) and single grain weight(g) (right hand side)
are presented for four perennial wheat derivatives, one perennial grass, and one annual wheat
grown in the harvest year of 2011(a and d),2012(b and e),and 2013 (c and f).. LSDs for grain
number per ear and single grain weight 11.84 were 0.008076, respectively, at P=0.05.

xv
Further details of statistical significance of dry matter components are presented in Table 2.
................................................................................................................................................ 95
Figure 9. Above-ground dry matter (g) for dry-season water deficit plotted against well-
watered, for one annual wheat (Wedgetail), four perennial wheat derivatives(CPI-
147235a,CPI-147280b,OK7211542,11955) and one perennial grass(CPI-148055) are
presented for over four harvests: DS2012 ( after first dry season regrowth at end of April
2012), WS2012 (after second wet season regrowth, December 2012 at the end of December
2012, DS2013 (harvested after second dry season regrowth at end of April 2013) and
WS2013 ( harvested after third wet season regrowth at end of December 2013). In each case,
DM under DS-WD is plotted against its equivalent DM under WW in the same season,
relative to the 1:1 line. The linear regression between WD and WW is also shown, together
with its statistical significance. ............................................................................................... 96
Figure 10. A within-season comparisons of regrowth generation and thus, above- and below-
ground dry matter production annual wheat Wedgetail, four perennial wheat derivatives
(CPI-147235a, CPI-14280b, OK7211542, 11955), one perennial grass (CPI-148055), and
over three consecutive over wet seasons (2011-13). Different generations are compared
across planting times with the same season. LSDs for total above-ground dry matter and total
root dry matter were 44.42 and 6.65, respectively, at P=0.05. ............................................... 97
Chapter 4
Figure 1. Daily maximum and minimum temperature recorded during the experimental
periods (a). Maximum temperature, minimum temperature and rainfall in the experimental
site during the study period for ambient Vs shade conditions (b), and the long term average
for ambient conditions (c). ................................................................................................... 122
Figure 2. Number of tiller plant-1
and number of ears plant-1
for one annual wheat
(Wedgetail), one perennial wheat (CPI-147235a) and one perennial grass (CPI-148055) in
control (open ambient condition without any manipulation), source (plants under shade
cloth), sink (spikelets of one side of the ear removed) and both (combined use of shade cloth
and spikelets of one side of the ear removed) source and sink manipulation. LSD 0.05 values
for number of tiller and ear per plant was 38.24 and 8.91 respectively. Further details of
statistical significance of dry matter components are presented in Table 2.Data included
annual wheat one year old plant and three year old perennial wheat and perennial grass in
2013 at Charles Sturt University, New South Wales, Australia. .......................................... 123
Figure 3. Dry matter partitioning per plant for one annual wheat (Wedgetail), one perennial
wheat (CPI-147235a) and one perennial grass (CPI-148055) in control (open ambient
condition without any manipulation), source (plants under shade cloth), sink (Spikelets of
one side of the ear removed) and both (combined use of shade cloth and spikelets of one side
of the ear removed) source and sink manipulation . LSD 0.05 values for spike, leaf, stem,
crown and root was 10.3, 4.9, 17.24, 8.2 and 5.53 respectively. Further details of statistical
significance of dry matter components are presented in Table 2. Data included annual wheat
one year old plant and three year old perennial wheat and perennial grass in 2013 at Charles
Sturt University, New South Wales, Australia. ...................... Error! Bookmark not defined.
Figure 4. Grain weight (g) plant-1
and harvest index for one annual wheat (Wedgetail), one
perennial wheat (CPI-147235a) and one perennial grass (CPI-148055) in control (open air
without any manipulation), source (plants under shade cloth), sink (Spikelets of one side of
the ear removed) and both (combined use of shade cloth and spikelets of one side of the ear
removed) source and sink manipulation. . LSD 0.05 values for grain weight and harvest index
was 2.569 and 0.05336 respectively. Further details of statistical significance of dry matter

xvi
components are presented in Table 2. Data included annual wheat one year old plant and
three year old perennial wheat and perennial grass in 2013 at Charles Sturt University, New
South Wales, Australia. ........................................................................................................ 125
Figure 5. Number of grains plant-1
and single grain weight (mg) for one annual wheat
(Wedgetail), one perennial wheat (CPI-147235a) and one perennial grass (CPI-148055) in
control (open ambient condition without any manipulation), source (plants under shade
cloth), sink (spikelets of one side of the ear removed) and both (combined use of shade cloth
and spikelets of one side of the ear removed) source and sink manipulation . LSD 0.05 values
for grains per plant and single grain weight was 48.34 and 7.917 respectively. Further details
of statistical significance of dry matter components are presented in Table 2. Data included
annual wheat one year old plant and three year old perennial wheat and perennial grass in
2013 at Charles Sturt University, New South Wales, Australia. .......................................... 126
Figure 6. ºBRIX value as recorded at different node position (N1 as 1st node from the base to
N7 as 7th node from the base) of annual wheat (AW), perennial grass (PG), perennial wheat
(PW) and annual grass (AG) at four different treatment conditions (Both, control, sink and
source). The interaction effect, the effect of different annual and perennial wheat types and
effect of different treatments are presented in panel a, b and c, respectively. The LSD0.05
values for the interaction of node position and wheat type in panel b is 5.05 and LSD0.05
values for treatment (in panel c) is 1.91. .............................................................................. 127
Figure 7. ºBRIX value were presented for mean of the genotypes, perennial wheat (Ot-38)
and perennial grass (CPI-148055) at left hand side and annual wheat (Wedgetail), perennial
wheat (CPI-147235a), and Perennial grass (Thinopyrum elongatum), were presented at right
hand side of the graph at flowering (sampling at flowering plants grown at open ambient
condition without any manipulation) control ( sampling at physiological maturity plants
grown at open ambient condition without any manipulation), source (sampling at
physiological maturity plants grown at plants under shade cloth), sink (sampling at
physiological maturity plants grown at Spikelets of one side of the ear removed) and both
(sampling at physiological maturity plants grown at combined use of shade cloth and
spikelets of one side of the ear removed) source and sink manipulation. The Source sink
manipulation treatment was significant and LSD0.05 was 5.12. Data included annual wheat
one year old plant and three year old perennial wheat and perennial grass in 2013 at Charles
Sturt University, New South Wales, Australia. .................................................................... 128
Figure 8. Apparent contributions of different sources of dry matter for spike dry weight;
Wedgetail, Kharkov, CPI-147235a, Ot-38, CPI-148055. The dry matter components that
contributed to spike dry weight for each genotypes in each Source sink manipulation
treatment were plotted against the measured spike dry weight, to establish the likely sources
for spike dry weight in each case: DMa contribution of current photosynthesis equation (5),
DMab contribution from leaf stem redistribution equation (6), DMabc leaf stem crown
redistribution equation (7) and DMabcd leaf stem crown root redistribution equation (8). ... 129
Chapter 5
Figure 1. The range of maximum and minimum temperature throughout the experimental
period is mentioned in panel (a). A comparative study to measure the variation in maximum
and minimum temperature inside (30 min difference) and outside (in each day) of rain
shelter along with relative humidity (yellow bar) are presented in lower panel of this figure
(b). ........................................................................................................................................ 155
Figure 2. Water loss (%) plotted against days after withheld irrigation. Capped line indicates
least significance difference value (P = 0 .05) ..................................................................... 156

xvii
Figure 3. Volumetric water content plotted against soil depth. Capped line indicates least
significance difference (P=0.05). ......................................................................................... 157
Figure 4. Root dry weight (RDW) presented as square root of (RDW + 0.5) plotted against
soil depth for 6 genotypes and LSD 0.05 values 0.5141. ........................................................ 157
Figure 5. Relative water content in control (dotted line) and extended drying down condition
(solid line). Capped lines represent least significant differences (P=0.05) values for control
and extended drying down condition. .................................................................................. 158
Figure 6. Stomatal conductance in upper and lower leaf plotted against days after withheld
irrigation for one annual wheat, four perennial wheat derivatives and for one annual grass in
extended drying down condition. Capped line indicates least significant difference value
(P=0.05) ................................................................................................................................ 159
Figure 7. Volumetric water content in four location in field validation for perennial wheat
CPI-147235a, perennial grass CPI-148055 and annual wheat in different field conditions in
New South Wales Australia. ................................................................................................ 160
Figure 8. Root dry weight for perennial wheat CPI-147235a, perennial grass CPI-148055 and
annual wheat in field conditions a) Cowra mix 2014 b) Cowra G x E c) Cowra mix 2015
d)Wagga G x E in New South Wales Australia. ................................................................. 161

- xviii -
List of Tables
Chapter 2
Table 1. A comparative study of perennial wheat performance with respect to grain yield and
regrowth potential................................................................................................................... 30
Chapter 3
Table 1. Pedigree of genotypes used in this experiment.in these experiments. ...................... 85
Table 2. Overall data summary, averaged across genotypes, with LSD and AOV ............... 87
Chapter 4
Table 1. Pedigree for genotypes used for the experiment 2 ................................................. 121
Table 2. Summary of means of the performance of different genotypes among the treatments
(i) and Summary of ANOVA (ii) arranged according to source sink manipulation (a) and
cultivars (b) for one annual wheat (Wedgetail), one perennial wheat (CPI-147235a) and one
perennial grass (CPI-148055) in control (open ambient condition without any manipulation),
source (plants under shade cloth), sink (Spikelets of one side of the ear removed) and both
(combined use of shade cloth and spikelets of one side of the ear removed) source and sink
manipulation. Data included annual wheat one year old plant and three year old perennial
wheat and perennial grass in 2013 at Charles Sturt University, New South Wales, Australia.
The level of significance is described as * (if P<0.05) and ns (Non-significant). ............... 122
Table 3. Summary of means of the performance of different genotypes among the treatments
and Summary of ANOVA arranged according to source sink manipulation and genotypes
for one annual wheat (Wedgetail), perennial wheat derivatives (CPI-147235a, Ot-38) and
perennial grasses ( Thinopyrum elongatum, CPI-148055) in control (open ambient condition
without any manipulation), source (plants under shade cloth), sink (Spikelets of one side of
the ear removed) and both (combined use of shade cloth and spikelets of one side of the ear
removed) source and sink manipulation. Data included annual wheat one year old plant and
two year old perennial wheat and perennial grass in 2014 at Charles Sturt University, New
South Wales, Australia. The level of significance is described as * (if P<0.05) and ns (Non-
significant). ........................................................................................................................... 124
Chapter 5
Table 1. Phenology for one annual wheat, four perennial wheat derivatives and for one
annual grass in extended drying down condition ................................................................. 162
Table 2. Total dry matter at harvest for one annual wheat, four perennial wheat derivatives
and for one annual grass in extended drying down condition. ............................................. 163
- 19 -
1 Chapter 1
General introduction
The wheat-sheep farming system of southern Australia is characterised by low
levels of production due to poor soils, low and erratic rainfall, and low levels of
inputs. The replacement of perennial native vegetation with annual crops generally
threatens system sustainability (Glover et al. 2010), and in southern Australia this is
due to the movement of water and nutrients below the shallow root zone of annual
crops leading to water table rise, acidification, and salinity (Angus et al. 2001). The
development of perennial grain crops could reduce these concerns and offer more
flexibility in existing farming systems by providing grain and grazing options that
are potentially more compatible with environmental sustainability. Recently,
perennial wheat derivatives, developed through wide hybridisation between bread
wheat (Triticum aestivum L. [6n]) and perennial grass (e.g.Thinopyrum
intermedium[6n]), have been reported to survive, regrow, and produce grain in the
field in southern Australia, for up to four years (Larkin et al. 2014). This proof-of-
concept confirms that further research is worthwhile to develop a perennial wheat.
Consequently, this thesis commences by reviewing the literature on perennial grains,
especially in relation to perennial wheat (Chapter 2).
Bell et al.(2008) examined how perennial wheat may fit within the current
farming system of southern Australia, and its prospective contribution to farm
economic profitability, using the MIDAS model (Model of an Integrated Dryland
Agricultural System). The benchmark in grain yield for perennial wheat to be
economically profitable was 65% of annual wheat when they received an equal grain

- 20 -
price, or was 40% of annual wheat with a contribution of just 800 kg ha-1
of
additional forage. Hayes et al. (2012) evaluated 150 perennial wheat derivatives over
three years under field conditions in southern Australia. Several perennial wheat
derivatives persisted for three years, and their grain yield ranged from 2–135% of
annual wheat yield over three successive years. In a separate study in the USA,
perennial wheat derivatives were reported to produce benchmark yields of 50% of
annual wheat for two years, but their regrowth was not consistent (Jaikumar et al.
2012). These reports suggest perennial wheat is capable of meeting the grain yield
and forage benchmarks indicated by Bell et al. (2008), especially if reliable regrowth
and grain contribution can be attained in successive years of regrowth. This would be
essential for perennial wheat to be a viable option for farmers. Consequently, this
thesis examines cycles of perennial wheat regrowth as a baseline, and this is reported
in Chapter 3.
Perennial wheat is expected to produce a lower yield than annual wheat, at
least in the early stages of its development, following wide hybridisation. Grain yield
is expected to be lower in perennial wheat generally, as it needs to allocate resources
to enable regrowth, rather than devote all reserves to grain (DeHaan et al. 2005;
Murphy et al. 2009). DeHaan et al. (2005) found that perennials developed greater
dry matter in successive cycles, especially root dry matter, than annually replanted
bread wheat, and had more extensive root systems even in the early growth stages.
With deeper roots, the perennials may be able to acquire additional resources beyond
those available to the annual crop, so additional resource capture could compensate
for lower sink priority to grain, relative to roots, stem bases, and lateral buds (Glover
et al. 2010). The differential pattern of dry matter allocation between annuals and
perennials warrants further investigation, as does the putative enhancement of

- 21 -
resource capture and its consequences for dry matter allocation. Both remain to be
experimentally tested in perennial wheat.
Any reduction in source, or sink, or both may change the trade-off between
grain yield and perenniality. In a study with grain sorghum, Fischer and Wilson
(1975) initially manipulated sink size without altering the source, and demonstrated
that any dry matter in excess of grain sink capacity accumulated in roots and other
plant parts. Likewise, the manipulation of the source, sink, or both altered sink
priority and patterns of dry matter partitioning, and hence, grain yield. A similar
approach could be used to explore how sink priority and dry matter allocation differs
between annuals and perennials. Consequently, the effects of reductions in source,
sink, or both, on sink priority and patterns of dry matter partitioning are examined in
annual wheat, perennial wheat and a perennial grass, and this is reported in
Chapter 4.
The larger root system in a perennial grass was reported to access deeper soil
layers and extract additional reserves of water and nutrients from depth (Zhou et al.
2014). Longer lived and potentially larger root systems in perennial grasses were
able to produce more above- and below-ground biomass than in annual grasses (Cox
et al. 2006). Perennial wheat derivatives, with potential for greater resistance to
water deficit and poor soil conditions, could be better suited to situations in which
annual wheat performance is poor (Bell et al. 2010). There is currently no
information about water use by perennial wheat derivatives, or about how water use
may change in successive regrowth cycles, relative to that in annually replanted
wheat. This is reported in Chapter 5.

- 22 -
The questions outlined above are based on evidence usually obtained from
field experiments, but often without the detailed and balanced measurements needed
to properly explore the cycles of regrowth and dry matter allocation in relation to
resource capture, especially below ground, in root growth and water use. In order to
better understand these whole-plant relationships in survival, regrowth and
performance over cycles, the principal experiments were conducted in large soil
columns, each with a single plant, and with many soil columns used to facilitate
repeated sampling through the life cycle, and across replicates. To validate the
responses obtained in soil columns, field experiments were strategically sampled,
and results compared with other literature where available. The process-based
evidence, together with their field validation, were used to consider the wider
implications of the results for farming systems improvement, perennial wheat
agronomy, selection of improved perennial wheats, and their ecosystem
consequences.
The major objective of the study was to investigate the performance of
representative, currently available perennial wheat derivatives in regrowth, dry
matter production and allocation, water extraction and grain contribution, relative to
that of annual wheat and perennial grass representative of the parental materials. In
this research, four diverse perennial wheat derivatives were used, because of their
better productivity and regrowth potential for their respective genetic complexity,
based on field performance in southern Australia. The annual wheat, perennial grass
and four perennial wheat derivatives were studied in large soil columns under
ambient field conditions in a screen-house at Charles Sturt University, with
validation from field experiments in Wagga Wagga and Cowra.

- 23 -
The specific aims of this study were to:
quantify the development, regrowth, root and shoot dry matter production and
partitioning of annual wheat, perennial grass and perennial wheat derivatives,
and how these change over growth cycles and within years under well-
watered conditions;
explore how these patterns change with source limitation (shading), sink
limitation (spikelet removal), and both (source and sink limitation), under
well-watered conditions; and
quantify the change in dry matter production and partitioning patterns of
annual wheat, perennial grass and perennial wheat derivatives under extended
water deficit (WD), especially in relation to changes in root growth and water
extraction

- 24 -
2 Chapter 2
Literature review
2.2 Introduction
Annual crops are produced from 70% of the world’s cultivated land and supply
80% of total food production (Pimentel et al. 2012). Although annual crops are
profitable to farmers (Borlaug 2007), they may cause various environmental
problems such as soil erosion (Glover 2005; Murphy et al. 2010), and as a result,
mono-cropping is unlikely to be sustainable in the long term (Cassman et al. 2003).
The inclusion of perennials is expected to stabilise more fragile environments
(Cransberg and McFarlane 1994; Lefroy and Stirzaker 1999; Cox et al. 2006; Pannell
and Ewing 2006; Bell et al. 2008). Consequently, efforts to develop perennial crops
are warranted to diversify and stabilise agro-ecosystems (Glover 2005; Pimentel et
al. 2012; Wade 2014).
Annual crop production is likely to create environmental problems (Gantzer et
al. 1990; Randall et al. 1997; Huggins et al. 2001; Tilman et al. 2001; Dinnes et al.
2002), such as degradation and erosion of soil, dryland salinity, nutrient leaching,
eutrophication (Hatton and Nulsen 1999; Tilman et al. 2001; DeHaan et al. 2005),
and pesticide contamination (DeHaan et al. 2005). On the other hand, perennial grain
crops have the potential to improve the sustainability of agro-ecosystems, while still
allowing grain production to continue (Wagoner 1990; Scheinost et al. 2001; Bell et
al. 2006).
Perennial plants that can mimic the characteristics of the native vegetation may
have the ability to significantly diminish ecosystem problems (Dunin et al. 1999;
Jackson 2002; Ridley and Pannell 2006). There are possible benefits to perennial
crops, such as the expected reduction in tillage, that should lead to enrichment of soil

- 25 -
organic matter, conservation of soil, and reduced requirement for fertiliser, partly due
to remobilisation of nutrients from depth (Robertson et al. 2000; Scheinost et al.
2001; DeHaan et al. 2005; Cox et al. 2006; Glover et al. 2010b; Vogel 2013).
The pollution of surface and ground water due to nitrate leaching from
agricultural land has long been recognised as a major problem (Addiscott 1996).
Ridley et al. (2001) studied nitrate leaching losses from both annual pastures
(subterranean clover, Trifolium subterraneum, and annual ryegrass, Lolium rigidum)
and perennial pastures (cocksfoot, Dactylis glomerata, and phalaris, Phalaris
aquatica L.) under rotational sheep grazing, with and without lime. When averaged
over three years, annual nitrogen losses were found to be 33% to 45% lower in
unlimed and limed perennial pastures than in annual pastures under similar
treatments; especially in the wettest year when losses were 42 to 50% lower in the
perennial pastures. The reduced total nitrate (NO3-) leaching losses of
5–8 kg.N.ha-1
year-1
in perennial pastures provide evidence that perennial systems
could greatly reduce nitrogen leaching losses through nutrient translocation by
longer-lived and deeper root systems (Crews 2005) and greater microbial
immobilisation to making up biological N2 fixation to maximise ecological
intensification among inputs and associated ecosystem services (Crews et al. 2016).
Haynes and Francis (1993) reported higher aggregate stability under perennial
ryegrass than under annual pastures in a temperate region of South Africa. Soil
organic carbon (C), potassium sulfate-extractable C, microbial biomass C, and
aggregate stability were all higher under the perennial pastures (Milne and Haynes
(2004). Perennial grains would also be expected to provide similar soil quality
benefits. Indeed, initial results for Kernza wheatgrass (Thinopyrum intermedium
(Host) Barkworth and D.R. Dewey), indicated that their roots were able to capture
nutrients and soil water from greater soil depths (with nitrate leaching reduced by

- 26 -
86%), in comparison to the roots of annual winter wheat (Culman et al. 2013).
Perennial grain crop systems might also be expected to support a larger, healthier and
more diverse natural enemy population compared to existing annual cropping
systems (Clark et al. 1997; Bale et al. 2008).
Production costs may be less due to reduced tillage (Bell et al. 2006; Jaikumar
et al. 2012) and improved environmental ecosystem services (Ridley et al. 2001;
Crews 2005), which assist profitability (Bell et al. 2008) even in marginal lands (Cox
et al. 2006). Light interception, rainwater use, and nutrient absorption are often
superior in perennials because they have a longer growing season (Cox et al. 2006).
Additional benefits can be obtained by including substitute perennials with higher
grain protein and micronutrient contents (Piper and Kulakow 1994; Sacks et al.
2003; DeHaan et al. 2005; Cox et al. 2006) to improve and diversify diets for human
and animal nutrition, and to increase the market value of production for increased
farmer livelihood (Murphy et al. 2009; Strand 2010). A dual-purpose perennial crop
contribution in both forage and grain could provide greater economic benefits to
farmers (Watt 1989).
Perennial grain crops have not evolved from natural selection, rather only
occurring from development through artificial selection (Van Tassel et al. 2010).
Partial amphiploids, containing durum or common wheat genomes with a substantial
portion of the genome of one or another perennial species of the genus Thinopyrum,
are commonly referred to as perennial wheat (Cox et al. 2006). Efforts to develop
perennial grains initially targeted increasing grain yield and reducing soil erosion
(Glover et al. 2010a). Alternatively, herbaceous perennials could be domesticated
with robust seed production (Wagoner et al. 1990; DeHaan et al. 2005; Cox et al.
2006;Van Tassel et al. 2010).

- 27 -
Durum wheat (Triticum turgidum ssp. dicoccoides), barley (Hordeum
spontaneum), and oats (Avena sterilis) were the first grain species chosen for
domestication 10,000 years ago, because they were the highest yielding species
amongst the wild annual grass progenitors (Cox et al. 2006). Although the yields of
wild perennial grass species are lower than those of wild annuals, they are often
comparable to those of other annual progenitors, e.g. wild barley and wild wheat.
Among the cereal crops (maize, rye, rice and sorghum) receiving attention for
perennial development (Wagoner 1990), wheat has received the most attention, with
priority given to its development for rainfed conditions (Bell et al. 2008), and for
diverse climatic conditions in different global regions (Cox et al. 2006; Vogel 2013).
As annual cereals dominate in crop production, little attention has been devoted
to the development of perennial crops or their agronomic management. Thus, efforts
to develop perennial wheat seem justified to improve system sustainability and
flexibility of future farming systems, especially those involving livestock.
2.3 History of perennial wheat development and current research
The first large perennial wheat breeding program, using wide hybridisation
between wheat and wheatgrass species, was initiated by Russian scientists in the
Soviet Republic in the 1920’s (Jakubziner 1958; Tsitsin and Lubimova
1959;Wagoner 1990). Due to limitations such as inconsistent perenniality, unwanted
agronomic features, and spikelet sterility, breeding efforts in the Soviet Union were
discontinued in the 1960s (Wagoner et al. 1990). In the United States, the
Department of Agriculture hybridised domestic wheat with wheatgrass (Agropyron
spp.) and developed around 100 perennial wheat derivatives (Vinall and Hein 1937).
Some efforts towards perennial wheat development continued into the 1940s and
1950s with an emphasis on grain yield. Perennial wheat derivatives developed in the
- 28 -
breeding program at the University of California were able to yield about 70% of
annual wheat, and included lines with disease resistance traits for rusts and root
rots.Many of the disease resistance traits of perennial wheat derivatives were
introgressed through crop breeding into annual wheat to provide improved disease
resistance. As the breeding objective was high yield and this was not achieved, the
project was discontinued (Suneson and Pope 1946; Suneson 1959). Perennial wheat
lines derived from these early programs were able to survive, but their seed size was
small (Vinall and Hein 1937). At the Rodale Institute, early attention was also
devoted to the grass parent used to contribute the perennial habit, Thinopyrum
intermedium (Host), with interest in improving its grain yield, quality, and resistance
to drought (Wagoner 1990). Throughout this early period, problems were
encountered with the wheat-wheatgrass hybrids created during the 1920–1980
period. They were meiotically unsteady, lacked spikelet fertility, and possessed a
host of undesirable agronomic traits such as small seed size, proneness to lodging,
poor winter durability and low rates of survival. Truly perennial forms of wheat were
never developed between the 1920s and 1980s. It was observed that grain yields of
perennial wheat derivatives dropped substantially after the first year and most hybrid
forms required re-seeding after only 2–3 years (Wagoner 1990).
Perennial wheat derivatives, developed through wide crosses between durum or
common wheat with perennial grass species of the genus, Thinopyrum, resulted in
wide variations in chromosome number, associated with the production of sterile
progenies, making it difficult to progress (Cox et al. 2006).Progress in perennial crop
development by wide hybridisation would depend on the genetic complexity of both
the domesticated and related wild species (Cox et al. 2002; Dehaan et al. 2011).
Recent advances in plant breeding, cytogenetics, and molecular biology may increase
the probability of developing truly perennial, high-yielding grain crops. Resource
- 29 -
allocation (i.e. plant carbon distribution) in perennial crops for perennation and seed
production might be insufficient to achieve both yield, survival and regrowth, may
be assisted using advanced plant breeding methodologies, including the alternative
approach to wide hybridisation, viz. domestication of the perennial grass (e.g.
Thinopyrum intermedium) (DeHaan et al. 2005).
Research on perennial crops is being undertaken at a number of institutions
around the world including Washington State University, Michigan State University,
Texas Agricultural and Mechanical University, and The Land Institute (TLI) in
Salina, Kansas, USA; University of Manitoba, Canada; Australia’s Future Farm
Industries Cooperative Research Centre; the Swedish University of Agricultural
Sciences; Yunnan Academy of Agricultural Science in China; and the University of
Buenos Aires in Argentina (Cox et al. 2010).
The problem of being able to combine the capacity for survival and regrowth
(for perenniality from the perennial grass) with the capacity to retain spikelet fertility
(for grain yield from the annual crop) is illustrated for perennial wheat derivatives
from reports of how well derivatives have performed in initial field evaluations
(Table 1).

- 30 -
Table 1.A comparative study of perennial wheat performance with respect to grain
yield and regrowth potential.
Country Years of
study
Regrowth potential in
successive years
Grain yield
compared to
annual wheat
References
Washington
State
University,
USA
2005–2006
2006–2007
Winter survival.
Successful in 2005–
2006, but did not
survive 2006–2007
during second year of
growth.
44% in first
year
Murphy et
al. (2010)
Michigan
State
University,
USA
2008–2010 Strong variation in
regrowth with
different plantings.
Planting in 2008
showed successful
regrowth in following
2 years, whereas 2009
plantings were unable
to regrow in 2010.
50%
achieved in
both the first
and second
year
Jaikumar et
al. (2012)
Cowra,
NSW,
Australia
2008–2010 Successful regrowth
in 3 years of up to
61% of observed
entries. Thirty-four
percent of observed
entries persisted and
produced grain yield
for 2 years.
Yield ranged
from 2–135%
of annual
wheat yield
(large
variability
among the
cohort)
Hayes et al.
(2012)
Australia 2008–2012
Plants survived up to
4 years in the field,
with 6 derivatives
contributing yield
over 4 years.
Grain yield
declined in
longest
surviving
entries over 4
consecutive
years and
contributed
up to 40% of
annual wheat
yield
Larkin et al.
(2014)

- 31 -
2.3.1 Progress with perennial wheat performance
Several studies have evaluated perennial wheat derivatives performance. Hayes
et al. (2012) studied 150 perennial wheat derivatives in southern Australian
conditions at Cowra, New South Wales and identified the potential for breeding and
selection for desired agronomic traits from the population variation. They also found
variation in the regrowth ability, and grain yields for entries up to three years of age
(Hayes et al.2012). Larkin et al. (2014) used available perennial wheat derivatives to
confirm perenniality and the possibility of achieving the required benchmark forage
and grain yields, which were proposed to be 800 kgha-1
of forage and grain
yield,40% of annual wheat, based on a modelling assessment by Bell et al. (2008) in
profitable grain yield under Australian conditions. Larkin et al. (2014)showed that
selected perennial wheat derivatives were able to produce a 10-fold increase in root
growth in the second year of stand establishment and to contribute grain yields of up
to 75%,with forage production being cumulatively comparable to re-sown annual
wheat (cv. Wedgetail) in Australia..
In a field study with thirty one F5 and five F6 perennial wheat breeding lines
located at three locations in Washington State, USA, Murphy et al. (2010) found that
second-year perennial wheat breeding lines had survival rates of 18–81%, and were
able to produce grain yields of 44% of annual wheat yields on average. Jaikumar et
al. (2012) studied agronomic performance in a field study for two years in the USA
with perennial wheat and perennial rye. These authors found little effect of plant age
on grain yield and yield components in both the first and second year, although grain
yields were on average half of that of the annual wheat. These patterns were due to
modified early spring regrowth and later flowering in the second year, and early
season forages (biomass yield is not high at this period) with added forage
production possibility was indicative to achieve required benchmark.

- 32 -
At TLI, perennial wheat derivatives were unable to survive the hot summer of
Kansas after the first year’s grain harvest (Cox et al. 2006). At Kellogg Biological
Station of Michigan State University, four accessions of perennial wheat from
Washington State University (WSU) were evaluated: in year two, perennial wheat
yielded 50% in comparison to that of the annual wheat, and perennial wheat was able
to regrow with 50–100% of plants surviving. However, by year three, regrowth was
extremely low and variable, with no accession showing more than 10% survival, and
over half of the plots had no survivors (Jaikumar et al. 2012). Poor regrowth and
survival was attributed to a warm spring coupled with hot, dry weather in the late
summer and intense weed pressure. At three rainfed locations in Washington State
University, 31 perennial wheat derivatives yielded on average 44% of that of the
annual wheat in the first year, but did not survive the second winter (Murphy et al.
2010).
Hayes et al. (2012) evaluated 150 perennial wheat and wheatgrass derivatives
from TLI, WSU, and elsewhere over 3 years in the field at the Cowra Research
Station in southern Australia. In the first year, 16 perennial wheat derivatives had
grain yields of more than 40%, and three of them even were able to provide 65% of
that of the annual wheat grain yield. Grain yields varied among perennial wheat
derivatives between 2–135% of the annual wheat yield, with survival ranging from
20–38%. However, regrowth was evidenced in 61% of observed perennial wheat
derivatives, and low regrowth scores were associated with high levels of plant
mortality and even higher regrowth scores were not associated with grain yield in
some perennial genotypes (CPI-147258a). They found 58 perennial wheat derivative
genotypes were able to regrow and produce grain in the second year, and 32 of these
yielded more than 40% of the annual wheat yield and 21 of these yielded more than
65% of the annual wheat yield(Hayes et al.2012). Fewer genotypes produced grain in

- 33 -
their third year. Thus, currently grain yields in perennial wheat derivatives are less
than 40% of those from replanted annual wheat, but the diversity in characteristics
exhibited by the derivatives suggests that there is potential for further improvement
(Newell et al. 2010).
The biological feasibility of the perennial wheat derivatives was evident, as
some could persist and yield grain over three years in the field. Subsequently, Larkin
et al. (2014) reported that six of the perennial wheat derivatives were able to survive,
regrow, and produce grain in field conditions in southern Australia for up to four
years. While this result is promising, Larkin et al. (2014) concluded that further
research on perennial wheat derivatives was needed to broaden the genetic base, thus
widening the gene pool, and to evaluate derivatives over a wider range of
environmental conditions.
2.4 Challenges in perennial wheat development
If perennial grain systems are characterised by a longer presence in the field,
one risk is that perennial grain crops may act as a ‘green bridge’ for disease-causing
pathogens to move to productive annual cereal crops, lowering their yield potentials,
and threatening food security. Wide crosses with perennial grasses could lead to the
incorporation of undesired traits into perennial grains, such as rhizomatous habit with
potential for weediness. Any reduction in grain quality following out-crossing may
require grain segregation and separate marketing, so that prices of premium wheats
are not penalised. Consequently, breeding strategies are needed, not only to address
the ability to regrow and set seed, but also to minimise problems with diseases,
weediness, and poor grain quality. These problems are regularly cited as the reason
for why donors may be reluctant to invest in perennial grains.

- 34 -
2.4.1 Breeding strategy and associated problems for perennial wheat
development
The established breeding strategy in economically important annual cereal
crops is to improve traits like disease resistance, drought resistance, grain quality,
and grain yield. The worldwide distribution of landraces offers valuable sources of
genes in cereals. However, pressures on cultivated land, including the need to grow
high-yielding cultivars for food security, may result in the loss of traditional varieties
and landraces.
Perennial wheat derivatives developed through wide crossing between wheat
and perennial grasses (e.g. Triticum / Thinopyrum) often face difficulties in
chromosome pairing and in having an unstable number of chromosomes. For
example, back crossing with annual wheat resulted in an unstable chromosome
number and segregation in traits like perenniality (Cox et al. 2002). In that instance,
back crossing with the perennial parent was proposed to reduce problems in
segregation (Anamthawat-Jonsson 1996). This approach was not advocated by Bell
et al. (2010), as dilution of the wheat genome in the derivative by further doses of the
perennial grass would likely result in dilution of grain characteristics and a loss of
yield potential. To support this, the choice of a perennial parent with a smaller
genome was reported to result in more stable progeny and hence, crosses involving
the diploid perennial wheatgrass, Thinopyrum elongatum, would be preferred (Cox et
al. 2002; Murphy et al. 2010). The perennial wheat breeding programme at WSU
backcrossed progeny of Triticum / Thinopyrumcrosses with annual wheat, obtaining
derivatives that were successful in post-sexual cycle regrowth (Murphy et al. 2010).
This may be attributed to the choice of the diploid perennial grass parent,
Thinopyrum elongatum, rather than its more complex hexaploid relative, Thinopyrum

- 35 -
intermedium, and backcrossing would have increased the proportion of annual wheat
genes in the progeny.
Hayes et al. (2012) examined cytogenetic stability in the derivatives and
concluded that a complete set of chromosomes (2n=14) from the perennial parent
was needed in order to ensure spikelet fertility and grain set. These relationships
were explored further by Larkin et al. (2014), who examined chromosome numbers
and cytogenetic compositions resulting from various crosses. They confirmed
crossing with Thinopyrum elongatum was a better strategy in order to reduce the
numbers of chromosomes segregating. Critically, Larkin et al. (2014) proposed a
breeding strategy for perennial wheat, based on selection among segregating
breeding populations, derived by intercrossing F1s, each the product of a Triticum
aestivum / Thinopyrum elongatum cross. The intent was to ensure every chromosome
in the cross had a partner, to reduce cytogenetic problems, and assist the expression
of regrowth (full genome of the perennial grass parent present) and spikelet fertility
(full genome of the annual wheat parent present).
2.4.2 Resistance and tolerance to diseases in perennial wheat
Perennial wheat derivatives could have a major drawback as a carrier of
disease-causing pathogens. The level of disease threat, or any possible risks, from
perennial cereal grains on existing crop production, needs to be known. An increased
pressure of soil-borne fungal pathogens and root pathogens may be more evident as
roots and crowns of perennial wheat derivatives persist in the soil over a longer time.
This greater longevity of living plant tissue in perennial wheat derivatives may be
favourable for pathogen build-up over time. Secondly, the longer growing seasonal
length of the perennial wheat derivatives may help the survival of pathogens from
year to year and may create a ‘green bridge’ for pathogens. However, the long-term

- 36 -
survival of perennial species is dependent upon genetic resistance to prevent disease
load overwhelming them. The ability of pathogens to survive in live tissue
throughout the year in tropical perennial crops, such as bananas, was used as
evidence of a possible disease threat via perennial wheat derivatives (Singh and
Singh 2005; Ploetz 2007).
Wide crosses often face genetic incompatibility and the risk of transferring
undesirable traits from the wild species. For example, Baum and Appels (1991)
found evidence of reduced flour quality in newly-developed bread wheat when new
genes were incorporated for disease resistance (stem rust, leaf rust, powdery mildew)
from wide crosses between rye and wheat. Nevertheless, Jones et al. (1995) reported
wide crosses contributed robust sources of disease resistance, including for difficult-
to-control diseases like barley yellow dwarf virus, Cephalosporium stripe (caused by
Cephalosporium gramineum),and eyespot (caused by Pseudocerosporella
herpotrichoides), and wheat streak mosaic virus.
In Australia, the major disease threats for annual wheat from perennial wheat
derivatives include leaf rust (Puccinia triticina), stripe rust (Puccinia striiformis),
stem rust (Puccinia graminis f. sp.tritici), wheat streak mosaic virus (WSMV, caused
by the pathogen Pseudocercosporella herpotrichoides), and barley yellow dwarf
virus (BYDV) (Bell et al. 2010). Diseases can be controlled by the strategic use of
chemicals, allelopathic weeds, or host dilution via the use of species mixtures or
polycultures instead of a monoculture (Bockus and Shroyer (1998). Conventional
strategies, such as crop rotations and tillage, would be removed in perennial wheat
systems, but management practices, such as the use of cultivar mixtures, grazing,
and/or burning, and breeding for genetic resistance to major disease threats, may help
control the incidence of disease within perennial wheat systems. Additional
resilience to soil pathogens could accrue from induced activity of symbiotic

- 37 -
mycorrhizae, and increased beneficial biology with continuous cover (Cox et al.
2005).
Genetic modification of perennial species by pyramiding pathogen resistance
genes may also prevent higher disease incidence (Scheinost et al. 2001). Wide
genetic diversity in perennial maize, with a range of disease resistance traits within
genotypes is considered an advantage (Buckler et al. 2001). There may be
opportunities to include both intra- and inter-species genetic diversity to improve the
durability of genetic resistance against diseases in perennial grains (Cox et al. 2005).
Interestingly, longer periods of natural selection have allowed resistance genes to
accumulate in wild perennials. Thus, perennial wheat derivatives have shown
resistance to diseases for which annual wheat is vulnerable (Singh and Singh 2005;
Ploetz 2007; Glover et al. 2010a).
Compared with their annual analogues, perennial wheat derivatives have
excellent resistance to diseases, like eyespot (caused by the pathogen,
Tapesiayallundae), tan spot or yellow spot (caused by the pathogen, Pyrenophora
triticirepentis), WSMV, BYDV, and Fusarium head blight diseases (caused by
pathogen Fusarium culmorum) (Jones et al. 1995; Jauhar and Peterson 1996; Chen et
al. 1998; Fedak and Han 2004; Xu et al. 2009; Hayes et al. 2012).
2.4.3 Perenniality vs. grain yield trade-offs in perennial wheat derivatives
Resource acquisition and resource allocation patterns are the driving forces for
growth and reproduction. Annual grain crops might allocate a higher proportion of
their resources towards seed production as the ultimate priority, as survival for more
than one season is not an issue for annuals. In plants of perennial habit, resource
allocation must support both seed production and survival; thus, allocation priorities
are expected to be different from annuals.

- 38 -
Perennials allocate resources to vegetative storage organs to ensure multi-year
survival and seed production (Bazzaz et al. 2000). These resource allocations could
be viewed as alternative sink demand, (resource-demanding tissues), that compete
with grain production from a common resource pool. Thus, competition for resource
allocation between grain and vegetative parts is expected to differ between perennial
and annual grain crops. Through plant breeding in perennial grains, however, it
might be possible to re-allocate carbon from excess biomass production to grain
yield. As evidenced in green revolution annual crops (Evans 1998), plant breeding
was able to increase harvest index and yield by increasing dry matter allocation to
grain.
Grain yield potentials in relation to perenniality were assessed by Bell et al.
(2008) for the economic feasibility of perennial wheat production in marginal
cropping areas in Australia. They found perennial wheat to be economically feasible
if it yielded only 60% of that of annual wheat, with no additional forage gains.
Forage production potentialities in perennial wheat was found to be economically
feasible if the crop yielded 40% of annual wheat yields, with 800 kg ha-1
of forage
was produced. While some evidence to date suggests that perennial wheat can
achieve yields up to 70% of good annual wheat cultivars in the first year, more data
is needed on how, and under what conditions, perennial grains are able to achieve
these yields, and if they lose other benefits in the process (Bell et al. 2008).
Trade-offs between a perennial life history and seed production were evident in
perennial taxa, such as Helianthemum squamatum (L.) Dum. Cours (Cistaceae)
(Aragón et al. 2009), with resource trade-offs being evident in carbon, nitrogen
(Wheelwright and Logan 2004), phosphorus (Zotz and Richter 2006) and other
elements. Amongst these, carbon was considered the most important for use in
assessing resource trade-offs, as carbohydrates provided a multipurpose energy

- 39 -
source that could be transported easily around the plant and invested in other
assimilates. For these reasons, carbon was deemed the most suitable element for
evaluation of the cost of reproduction in annual versus perennial growth habit
(Reekie and Bazzaz 1987), which agronomically is expressed as dry mass.
2.5 Source and sink relationships in cereal plants with an annual or perennial
growth habit
An understanding of how the physiological factors may limit yield is
important, especially in the comparisons between growth habits, viz. annual wheat,
perennial wheat and a perennial forage grass. It is important to evaluate whether
yield in each case is controlled by the availability of substrates (source limited) or by
the capability of the plant to use available assimilates for growth (sink limited)
(Patrick 1988), and how this may vary between growth habits, and under
environmental stress. Research on the effect of source and sink ratio after anthesis
were reviewed in annual wheat (Zamski and Schaffer 1996), but to my knowledge
there are no reports of comparable studies in perennial wheat derivatives.
Photoassimilate allocation among organs might be different at grain filling in
perennials, as may the source or sink organs that control the partitioning of
assimilates during that period (Bakker 1995). Some studies (Evans and Rawson
1970; Richards 1996) stated that photosynthesis of the flag leaf blade along with the
spike alone might be able to meet the demands of the spikes throughout grain-filling
in annual wheat. Richards (1996) undertook a study on irrigated spring wheat, and
found grain yield not to be constrained by source. On the other hand, increases in
grain weight were correlated with reduced grain number after anthesis in north-west
Mexico (Fischer and HilleRisLambers 1978a; Ledent et al. 1985), implying that a
source limitation could arise during grain filling. Cruz-Aguado et al. (1999) reported

- 40 -
a source limitation in patterns of dry matter partitioning in spring wheat, especially
from a November (autumn) sowing. Thus, the nature of limitations differed between
environments. These contradictory results suggest that genotype by environment
interactions are likely to be strong in source-sink relationships, and in determining
priorities in the allocation of assimilate to meet grain demand relative to other sinks
(Ma et al. 1990). A study with source-sink manipulations found that yield could be
sink (the number of grains m−2
) and source limited (Zamski and Schaffer 1996).
Thus source-sink relationships during the grain filling period are important to study
to reveal different behaviours of plant types.
The flag leaf blade provided the major supply of assimilates towards grains
during grain filling in annual wheat (Rawson et al. 1976). Removal of the flag leaf
resulted in compensatory enhancement of the photosynthetic activity of lower leaves
and other green parts (Koch 1996), and also evidence of remobilisation of stored
carbohydrates in wheat (Triticumaestivum L.) and barley (Hordeum vulgare L.) from
reserve pools to vegetative tissues (Schnyder 1993). In another study with the
perennial plant, lucerne (Medicagosativa L.), Kim et al. (1991) used defoliation to
manipulate the source and sink, and reported the impact on priorities for resource
allocation within shoots, and for the regrowth of new shoots away from stems and
tap roots, which were the major sinks in intact plants. Lucerne was studied under
greenhouse conditions in relation to source-sink manipulation by defoliation at
flowering, and was found to experience a significant reduction in pod numbers, with
the youngest fertile pods being the most affected. Vegetative growth with
competition from reproductive development at the same time was another key factor
for poor seed yield (Genter et al. 1997).
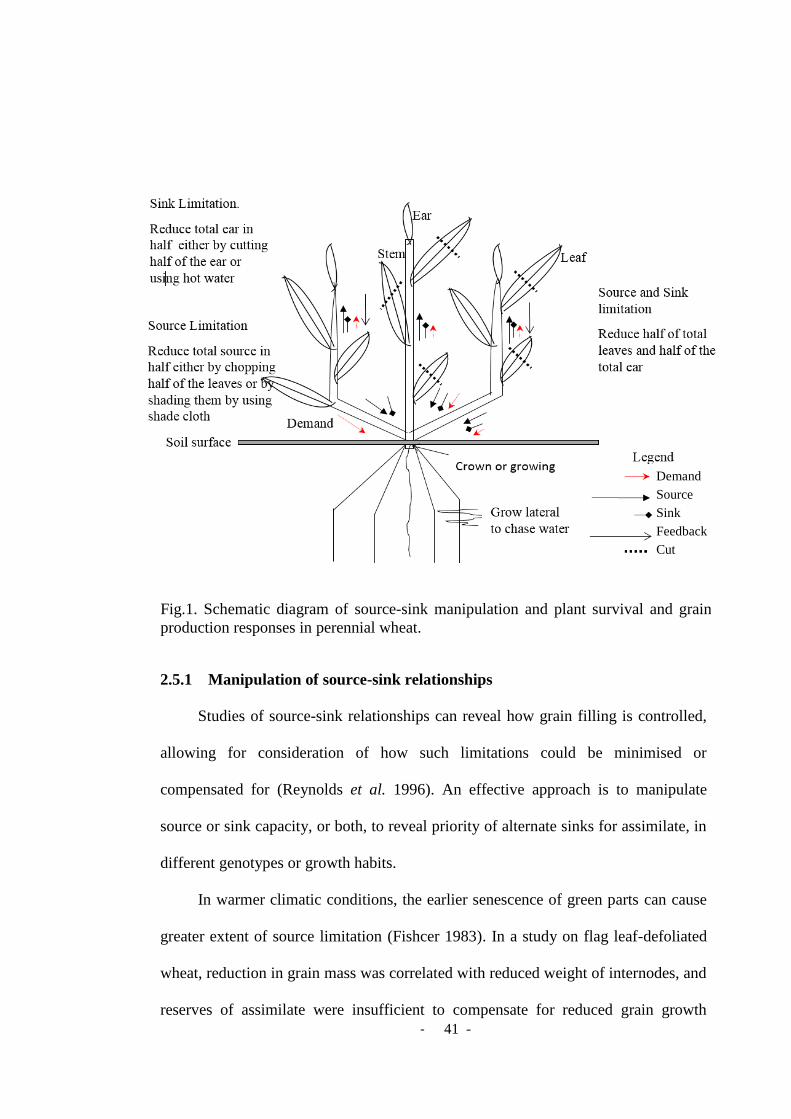
- 41 -
2.5.1 Manipulation of source-sink relationships
Studies of source-sink relationships can reveal how grain filling is controlled,
allowing for consideration of how such limitations could be minimised or
compensated for (Reynolds et al. 1996). An effective approach is to manipulate
source or sink capacity, or both, to reveal priority of alternate sinks for assimilate, in
different genotypes or growth habits.
In warmer climatic conditions, the earlier senescence of green parts can cause
greater extent of source limitation (Fishcer 1983). In a study on flag leaf-defoliated
wheat, reduction in grain mass was correlated with reduced weight of internodes, and
reserves of assimilate were insufficient to compensate for reduced grain growth
Fig.1. Schematic diagram of source-sink manipulation and plant survival and grain
production responses in perennial wheat.
Demand
Source
Sink
Feedback
Cut

- 42 -
during grain filling (Cruz-Aguado et al. 1999). The amount of the source available at
anthesis can determine an upper limit to potential sink size, and hence, yield potential
(Bakker 1995), especially during the early stages of grain formation, when
endosperm cell number is determined (Brocklehurst 1977; Wardlaw 1994).
The reduction in grain size by shading at anthesis reduces the total amount of
photosynthate able to be allocated for grain growth. However, source manipulation at
anthesis might exert control over the final allocation of dry weights in wheat plants.
Similar findings were observed by Fischer and Wilson (1975b), who reported that
total allocation of dry matter was significantly reduced by 11 g per plant and that
seed yield was reduced by 2.3 g per plant at early shading. In sorghum, Fischer and
Wilson (1975b) reported differences in grain size due to inter-spikelet competition at
anthesis, which was not explained by photosynthate supply. However, lower leaves
more exposed to sunlight may lead to an increase in the supply of photosynthate to
the roots, and this might have affected their production of growth regulators.
Evidence has also shown that xylem-borne ABA may be able to be transferred to
plant reproductive structures and manipulate their development, presumably by
controlling the gene expression that directs cell division and carbohydrate metabolic
enzyme activity in drought conditions (Liu et al. 2005).
Fischer and Wilson (1975a) undertook stand thinning to increase light
availability to remaining plants in the stand, and hence, increased source availability,
which subsequently increased yield at all plant densities. These authors concluded
that increased photosynthate supply might be associated with increased grain yield
up to a certain upper limit, beyond which further increases in sink size are needed to
increase yield potential further (Fischer and Wilson 1975c).
Fischer and Wilson (1975a) also reported that source manipulation at any level
(increase or decrease) can affect grain yield and individual grain size. For example,

- 43 -
they reported enlarged individual grain sizes of 25%, 53% and 46% as a result of
increased source availability following stand thinning, when the plants were exposed
to increased light during post-initiation, pre-anthesis and post-anthesis periods,
respectively (Fischer and Wilson 1975b).
If sink size is manipulated, then compensatory changes in canopy
photosynthesis may also occur. When the demand of the wheat ear is altered during
grain filling, considerable changes in flag leaf carbon trade may happen as a reaction
to this alteration. Carbohydrates accumulate in the leaves of substitute sinks if flag
leaf photosynthate is restricted to such a level (Bakker 1995). This is supported by
the results of (Fischer and HilleRisLambers 1978b), who found a positive
relationship among cultivars with respect to the weight of their remaining grains, and
the possibility of increased individual grain weight, when light was enhanced.
When sink capacity was reduced in young inflorescences by spikelet removal,
storage increased in the remaining grains, with compensatory increases in grain size
(Fischer and Wilson 1975a). Such studies allow reflection on the utility of alternate
sinks under source-sink limitation (Fischer and Wilson 1975c; Schnyder 1993). For
example, Fischer and Wilson (1975c) reported that in all removal (one third of
spikelets) treatments, excess assimilates other than those required for grain
production could be stored in other plant parts. When demand for assimilates was
reduced by spikelet removal, there was little change in partitioning of above-ground
dry weight, but a significant increase in root dry matter in sorghum. Since perennials
possess substantial alternative sinks, when grain capacity is reduced by spikelet
removal, distribution of available assimilate into alternate sinks is expected to be
more flexible than it is for annuals.
In annual wheat in particular, stems need special consideration because of their
continuing competition between the developing higher internodes and reproductive
- 44 -
parts in the weeks prior to anthesis (Wardlaw 1968; Bingham 1972; Patrick 1972;
Brooking and Kirby 1981; Siddique et al. 1989). In addition, temporary storage of
carbohydrate in the stem is crucial under stressful situations (Bidinger et al.
1977;Blum et al. 1994; Wardlaw and Willenbrink 1994;Seidel 1996).Genotypic
differences in dry matter distribution and patterns of translocation from the stem
have been reported (Blum et al. 1994). Comparable analyses with perennial grains
and perennial grasses have not been reported.
In wheat, both the source and sink were considered to be yield-limiting factors
at different periods of grain growth (Walpole and Morgan 1970). Finally, Fischer and
Wilson (1975b) ruled out transport system capacity of the culm from anthesis
onwards as a limitation, as its restriction showed no important effect on seed yield.
Thus, dry weight increase of any sink may result from current photosynthesis,
translocation of reserve assimilates from another sink, or both. In a study with
rainfed lowland rice in India, Kumar et al. (2006) observed the contribution of
current photosynthesis from stems and leaves, but in cultivars with enhanced leaf
senescence capacity at grain filling, grain yield was stabilised under drought.
Quantitative manipulation and analysis of source-sink relationships should reveal
whether differences in sink priority exist between annual wheat, perennial grass and
perennial wheat derivatives.
2.6 Water use in perennials in relation to moisture deficit
Resistance to water deficit and capacity to endure dry soil conditions may be
required for perennial wheat to survive the hot dry summers in southern Australia, in
order to regrow in autumn and produce grain in the following spring. Hybridisation
with perennial wild relatives of wheat, with potentially greater resistance to abiotic
- 45 -
and biotic stresses in such harsh field conditions, especially those in which annual
wheat currently underperforms, could be a useful option.
With growing concerns about food security being under pressure from
continuing population increases, there is a need to secure crop productivity against
water limitations. Emphasis is now being placed on water use efficiency to achieve
greater production from the water available (Blum 2010). Even high-yielding and
irrigated areas often experience short periods of water deficit within the growing
season in most years, and in some years more severe water deficits can be
encountered.
2.6.1 General reactions of plants to soil moisture deficit
Plant responses to water deficit have been characterised to follow three
strategies: dehydration escape, dehydration avoidance, and dehydration tolerance
(Ludlow and Ng 1974; Levitt 1980). Ludlow and Muchow (1990)provided insight
about fundamental processes involved in determining yield under water limited
conditions and considered assimilate remobilisation, osmotic adjustment, increased
rooting depth and density, control of stomatal conductance, higher transpiration
efficiency, high temperature tolerance, and genetic variability as contributors to yield
by providing plant survival in water limited environments. In the first strategy of
dehydration escape, plants are able to complete their life cycle before the onset of
severe water deficit conditions, or alternatively, escape the incidence of severe
drought during sensitive growth stages via appropriate phenology.
Second, the ability to ‘avoid’ water deficit is defined by the plant being able to
maintain a high tissue water content or higher tissue water potential, to ensure not
only survival, but also maintain function, and hence productivity. This is the main
difference between the avoidance and tolerance strategies. For the avoidance

- 46 -
strategy, the plant can still be productive, as it strives to obtain more resources, or to
meter its use, so the plant can still transpire to some extent and grow. For the
tolerance strategy, the water deficit is more severe, so all the successful plant can do
is stay alive. In a study involving field and model analysis in relation to water
deficits in soybean, cowpea and black gram, it was found that cowpea provided
higher yields and that this was related to its ontogenetic flexibility under water-
limited conditions(Sinclair et al. 1987).
Kirkegaard et al. (2007)demonstrated that avoidance traits, specifically deeper
roots, in annual wheat could result in additional water acquisition from deeper soil
layers during grain filling, and that this water translated to a significant increase in
grain yield, with a higher water use efficiency from that extra water use later in grain
fill. Presently, there are no published data showing that perennial wheat has a better
root system than annual wheat. However, perennial wheat is expected to show some
advantage in having a more extensive root system and being capable of using subsoil
water to increase grain yield and crop water use efficiency, as evidenced in annual
wheat. Kirkegaard and Lilley (2007) reported that the usefulness of stored subsoil
water was greater during the grain filling period of annual wheat in more productive
environments, in which grain demand was greater. The largest response happens to
be on soils of high water-holding capacity, where water can be available for later.
Stage 1 plant is like well - watered, Stage 2 is avoidance, where the plant is still
functioning, but there is pressure to maintain access to resources. Stage 3 is
tolerance, in which the plant stays alive in the hope of obtaining relief from the
stressor. The plant may achieve avoidance by capturing additional water resources
via a deeper or more extensive root system, or by minimising loss of water via
stomatal regulation, canopy manipulation to reduce heat load, and/or a reduction in
green leaf area to reduce transpiration. If the plant is not under stress, there is no

- 47 -
need for deep roots to capture water. If the plant is under severe stress, and no
resources are available in the deeper soil regions, deep roots cannot help to capture
resources that do not exist. Deep roots assist under water deficit conditions when
additional resources are available in the deeper soil regions for grain fill, and the
plant can use them, i.e. the plant has roots there, and has a canopy for transpiration.
Lucerne extracted an amount of 50 mm of water per year within a root zone up to 2.3
m and occasionally it can extract soil water beyond this depth (Brown et al., 2010),
suggesting that it is has better crop adaptability to dry land environments (Rogers et
al., 2016).
Thirdly, the ability to ‘tolerate’ water deficits implies that the plants are able to
continue to function despite partial dehydration; tissue water content and tissue water
potential are not maintained to the same degree as with dehydration-avoiding plants.
Under these conditions, the plants must instigate some protective measures in order
to maintain function and survive. For example, cell and tissue turgor can be
maintained via osmotic adjustment, by lowering osmotic potential to compensate for
lowered water potential. Dehydration tolerance is also important, whereby
osmoprotectants accumulate, including breakdown products available for
reconstruction when the water deficit is relieved. Cell elasticity can assist in the
maintenance and protection of active sites in cell walls under partial dehydration. In
this condition, water content is lower, so further water loss is minimised. Osmotic
adjustment may be needed to tolerate low tissue water potential (Morgan 1984).
Other dehydration-tolerance traits include low epidermal conductance and cell wall
extensibility. Perennial native grasses that grow in dry environments may have some
tolerance traits that should be sought to be included in perennial wheat.
- 48 -
At the grain filling stage, drought stress causes a reduction in plant water status
and photosynthesis. Thus, drought at this stage encourages the exchange of stem
reserves in water-soluble carbohydrates and their allocation to grains or other priority
sinks (Blum 1998, 2005). Ovenden (2015) explored water soluble carbohydrate
accumulation and the potential for genetic control in relation to improvement of
these traits, and found strong environmental interactions for well-watered and water
deficit for both water soluble concentration and total water soluble carbohydrate per
square metre.
Summer dormancy is found in temperate perennial grasses (e.g. cocksfoot, tall
fescue (Festuca arundinacea)) in semi-arid environments, and specifically in long
dry summer environments (e.g. Mediterranean climates in southern Australia) (Reed
1996; Norton et al. 2006). A similar summer dormancy approach might enable
perennial wheat to survive in the drier areas of Australia’s cropping zone.
2.6.2 Crop development and growth-phenology, yield and moisture deficit
Annual and perennial wheat derivatives are different in growth habits. Annual
wheat follows a vegetative phase until spike initiation, then it undergoes a
reproductive phase until flowering, with stem elongation and ear development, and
lastly grain filling. Perennial wheat initially goes through a similar growth phase to
annual wheat until after harvest when it begins to regrow from the crown base. After
regrowth, perennial wheat may continue to remain in the vegetative habit, or
flowering and seed set may occur in inducible conditions.
Perennial crops may exhibit dormancy; an adaptive response that enables
survival in unfavourable environmental conditions (Salazs and Ievinsh 2004).
Summer dormancy was observed in Mediterranean climates during the hot and dry
summers that threatened plant survival. By blocking metabolic processes, summer
- 49 -
dormant plants remained dormant (Hoen 1968). In an earlier study, Laude (1953)
found evidence of summer dormancy in the perennial grasses, Poa scabrella and Poa
bulbosa, even in well-watered conditions over dry summers.
Mechanisms used by perennial forage plants include dehydration avoidance,
dehydration tolerance (Levitt 1980; Turner 1986) and summer dormancy (Volaire
and Norton 2006). Norton et al. (2009) recommended that plants be tested under full
irrigation or a midsummer storm event to measure summer dormancy. In contrast
winter dormancy was seen in plant species at high latitudes under severe winters thus
following the opposite conditions.
Most agricultural produce (cereals, grain legumes, and fruit) comes from
reproductive development, and because most crops experience water shortage at
various stages of their life cycle. The impact of drought on reproductive development
is very important. The responses to drought observed in both natural and agricultural
communities are often of significant adaptive importance.
After the onset of drought, growth is affected by two processes: one that is
responsible for hastening growth and the other that is responsible for the delay of
growth. Of the two phenomena, the delaying mechanism is easiest to explain,
apparently being due to the pause of development of the shoot apex and possible
cessation of all cell division throughout severe stress. Thus, with severe drought
stress, there was a delay into anthesis for each day's delay in rewatering (Angus and
Moncur 1977). The deferral of leaf ageing observed within vegetative plants by
(Ludlow and Ng 1974) may be a related process, and it is probable that many
physiological processes are suspended during conditions of severe stress, only to be
restarted when the stress is relieved.
Ouk et al. (2006) studied drought resistance in rain fed lowland rice in a series
of experiments with 15 contrasting genotypes under well-watered and managed

- 50 -
drought conditions at two sites for 5 years in Cambodia. A drought response index
(DRI), grain yield-adjusted for variation in potential yield, and water level (WLREL)
around flowering — an index of the severity of water deficit at the time of flowering,
were calculated. This was done to determine if DRI or WLREL were responsible for
yield reduction due to drought resistance or available water at flowering, i.e. drought
escape.
The hastening mechanism of development within conditions of mild stress is
more difficult to explain. One suggestion is that increased leaf temperature might
accompany water stress (Slatyer 1969), which hastens development similar to that of
an increase associated with higher ambient temperature. Another possibility is that
the plant adjusts to stress by modifying the normal sequence of development, perhaps
so that fewer cell divisions are required before anthesis. Angus and Moncur (1977)
reported that water stress can be a vital factor affecting the phasic development of
field crops, and although it is a less important influence than temperature or day
length, it clearly must be included during developmental models if they are to predict
the timing of crops within an accuracy of a few days.
2.6.3 Drought survival in perennial grasses
Volaire et al. (1998) conducted a field study in France where the perennial
forage grasses cocksfoot and perennial ryegrass (Lolium perenne L.) were grown in
well-watered conditions and then subjected to a prolonged summer drought
(80 days), and observed systematic differences between them. Superior drought
survival was found to be associated with deeper root systems and greater water
uptake from deeper soil depths, with greater dehydration tolerance in surviving
leaves expressed as lower water and osmotic potentials, and greater reserves of
water-soluble carbohydrates (WSC) (including glucose, sucrose, raffinose,

- 51 -
myoinositol, and fructans) in stubbles. These developmental and physiological traits;
including a deeper root system, osmotic adjustment and water status maintenance,
ensured greater survival of tillers and leaves, and contributed to plant survival and
persistence under prolonged drought conditions, which was consistent with that
found by other authors (Silsbury 1964; White et al. 1992; Barker et al. 1993).
Drought resistance responses of growing tissues were different from those of
older tissues, with immature tissues often showing greater resistance to water deficit
(Barlow et al. 1980; West et al. 1990). Coverings on surviving meristematic organs
like leaf bases and apices within the older sheaths helped to protect against
evaporative and heat stresses. Consequently, drought resistant grass genotypes
exhibited a combination of adaptive responses to delay dehydration in the surviving
organs. Monosaccharides, sucrose, and fructans have been shown to accumulate in
leaf bases (Volaire et al. 1998). Demel et al. (1998) argued that fructans helped to
maintain membrane integrity under dehydration by preventing lipid condensation and
phase transitions. Likewise, greater accumulation of fructans in leaf tissues, mainly
in leaf sheaths and elongating leaf bases, and greater accumulation of sucrose in
roots, were found to be correlated to the acquisition of drought resistance in
perennial ryegrass (Amiard et al. 2003).
In a study that investigated heat stress alone, and in combination with drought,
Jiang and Huang (2001) found that the maintenance of higher photosynthesis, leaf
photochemical efficiency, evapotranspiration, leaf relative water content, root
growth, and lower electrolyte leakage were useful traits for drought resistance in tall
fescue cv ‘Mustang’ (Festuca arundinacea L.), in contrast to perennial rye grass cv
‘Brightstar II’. Finally, Kemp and Culvenor (1994) reviewed grazing and drought
resistance of perennial grasses in Australia in relation to plant survival and
productivity and observed that plants with more and/or larger tillers, and with deeper

- 52 -
root systems, had a better chance of survival in drought, due to greater capacity to
extract soil water from depth.
2.6.4 Drought resistance and annual wheat
Crop responses to water deficit conditions can be measured by considering
reliable parameters for quantifying the plant water stress response. Leaf water
potential, a reliable parameter for wheat under drought, was found to differ
significantly between genotypes (Singh et al. 1990), but Sinclair and Ludlow (1985)
argued leaf relative water content (RWC) was a better and more stable indicator of
water status than leaf water potential under drought. Schonfeld et al. (1988) reported
capability of some lines that maintained a higher level of RWC under drought were
more resistant than those where RWC was lower and argued RWC to be a desirable
selection trait for drought resistance in winter wheat. Larbi and Mekliche (2004)
argued that the RWC and leaf senescence were suitable, easy, and quick indirect
screening options that maintained a higher green leaf area and higher RWC in
drought resistant genotypes under water deficit conditions. Kamoshita et al. (2004)
found that osmotic adjustment was more important in rice (Oryzasativa L.) under
prolonged drought conditions, and a superior recovery ability was associated with a
larger plant size at the end of the drought period rather than the plant water status
during drought. Osmotic adjustment was greater during prolonged drought periods
(ca. 0.7 MPa) than during shorter drought periods (ca. 0.5 MPa), and lower osmotic
adjustment was mostly associated with a higher leaf water potential. Genotypic
variation in osmotic adjustment was observed, but there was no clear relationship
between osmotic adjustment and biomass production during drought periods. These
patterns of response of rice seedlings to drought and rewatering in the greenhouse
helped to explain the patterns of adaptation of rainfed lowland rice in the field.

- 53 -
Jongdee et al. (2002) found that maintenance of leaf water potential was a better
measure of drought resistance than osmotic adjustment in the field.
Extensive and large root systems may be another selection trait for drought
resistance in wheat. Indeed, Hurd (1974) reported that extensive root systems
supported early stand establishment and resource reallocation and were a contributor
to high yield under drought in wheat in 12 years of systematic breeding in Canada.
More recently, Palta et al. (2011) explored the utility of having a large root system in
adapting wheat to dry environments using unpublished data from glasshouse and
field experiments. These authors found a strong association for increased leaf vigour,
with a larger early established root system being able to capture water and nitrogen
early in the season, thus, facilitating the later capture of additional water during grain
filling.
2.7 Discussion of the literature reviewed
Perennial grain crop options were considered capable of potentially
contributing grain and forage, without ignoring the environmental issues associated
with high-yielding annual crop-based systems. Long-term breeding efforts with
perennial grain crops face difficulties like lower grain yield, smaller sized seed,
unreliable perenniality, high plant mortality, unsteady genetic constitution, and
outmoded agronomic attributes. However, progress in modern plant breeding,
cytogenetics and molecular biology in the latest wheat perennial breeding research
were able to boost this program, by exploring currently available germplasm over
diverse environmental conditions. Field research in Australia has demonstrated that
some perennial wheat derivatives are capable of persisting for up to 3–4 years while
contributing some grain and forage, thereby providing evidence of the feasibility of
developing a perennial wheat crop.

- 54 -
A successful perennial wheat crop would show regrowth in subsequent years,
and ideally, would show grain yield achieving the benchmarks of 65% of annual
wheat for grain alone, or of 40% of annual wheat for grain, with 800 kg forage, in
each year of regrowth. The present literature from USA and Australia suggests a
number of derivatives are able to meet the benchmarks in the first year, but regrowth
and subsequent performance were unreliable. Further research is clearly needed in
this area, particularly with regard to understanding the underlying processes.
Resource allocation and distribution attributes in perennial crops would differ
from those of annual crops. In successive years, these attributes might also change in
resource reallocation as the plant ages. Available literature on this issue was not
comprehensive enough to understand perennial wheat resource allocation, as a grain
crop through successive years of regrowth and perennation.
In order for a grain crop to succeed in a specific region, it may require a special
trait to adapt in that region. Perennial wheat crops in Australia will require
significant drought resistance to successfully adapt to the environment. However, the
true potential of drought resistant attributes in perennial wheat in Australia is yet to
be discovered and presented in the literature, including whether derivatives can
produce deeper roots that extract water from deeper soil layers during prolonged
drought.
Perennial wheat may provide in time a more sustainable crop option with an
ability to provide ecosystem services, while still contributing grain or forage in a
more environmentally friendly way. This thesis will examine various aspects of
perennial wheat derivatives and perennial grass production regarding their potential
influence on biomass production and root growth from the point of view of
agronomy, physiology and water use efficiency in different conditions to provide
more information in perennial wheat literature. The studies detailed in Chapters 3–5

- 55 -
will answer questions about the grain and biomass productivity of perennial wheat
over time, changes in resource acquisition and allocation patterns in perennial wheat
derivatives in relation to the source-sink balance, and in water use efficiency under
prolonged water deficit conditions. An annual wheat and a perennial grass are used
as controls for the perennial wheat derivatives. The goal of this literature review and
the following experimental studies is to contribute to the growing literature on
perennial grain crops, and to address both fundamental and applied questions
regarding a new and highly unusual plant growth form.

- 56 -
3 Chapter 3:
Seasonal comparison on root growth and dry matter partitioning in
four perennial wheat derivatives, a perennial grass and an annual
wheat
Abstract
Perennial crops, as a great provider of ecosystem services and the provision of
grain and grazing for livestock, are considered to be an interesting form of crop
within a mixed farm cropping system. Perennial wheat derivatives developed from
wide crosses of bread wheat and perennial grass were found to be able to survive and
regrow without reseeding in the USA, and to be able to produce grain for up to 4
years in Australia. Performance of four perennial wheat derivatives, a perennial grass
and annual wheat in root growth and dry matter production were studied (1) in a
comparison allowing their growth in different seasons over three years, (2) in a
comparison within the same season with replanting in every year, so that different
aged plants were compared in same season, and (3) with different water regimes over
a dry season to compare their performance in wet season regrowth. Dry matter
partitioning patterns were found to be greater in perennial wheat derivatives than in
annual wheat during regrowth in older plants. Perennial wheat derivatives showed
greater capacity in survival and root growth in older plants. Watering regimes and
seasonal effects on dry matter and grain production were varied in response to these
parameters. Promising perennial wheat derivatives were able to attain above- and
below-ground dry matter similar to a perennial grass, and grain yields were nearly
equivalent to those of annual wheat. Agronomic performance of three-year-old

- 57 -
perennial wheat derivatives and perennial grass were compared with two-year-old
and one-year-old plants in the same season and in different seasons in the same
location with annual wheat for three years under controlled ambient growing
conditions. The best performing perennial wheat produced a similar grain yield to
that of annual wheat in the first and second year of regrowth, and in the third year of
regrowth produced 2–3fold more grain yield per plant compared to that of annual
wheat. The above-ground biomass was found to be 2–7 fold greater in perennial
wheat derivatives than in annual wheat. Root growth was found to be 2 fold greater
in better performing perennial wheat derivatives and grass in the first year of plant
growth. Root growth increased further to be 3–12fold more than that for annual
wheat in both older perennial wheat derivatives and perennial grass in the second and
third years. Perennial wheat derivatives and perennial grass were found to produce
more tillers, biomass, and root growth with increasing plant age. Consistent regrowth
and survival in the following years, and reliable root growth with better grain yield,
in perennial wheat derivatives and perennial grass requires further selection for the
target environment.
Key words: Perenniality, dry matter allocation
3.1 Introduction
The crop-livestock mixed-farming system of southern Australia is
characterised by low production levels, due to poor soils with low and erratic rainfall,
and low inputs (Turner 2004). The replacement of perennial native vegetation with
annual crops threatens system sustainability generally (Glover et al. 2010). In
southern Australia, the movement of water and nutrients below the shallow root zone
of annual crops has led to rising water tables, acidification and salinity (Angus et al.
2001). Among the wide range of perennial grains worthy of consideration, perennial
- 58 -
wheat remains a key priority as wheat is the major grain crop grown throughout the
world and is the predominant grain produced in southern Australia.The option to
replace annual wheat (in marginal environments, or in parts of the farm, where
neither wheat nor pasture is most favoured) with perennial wheat (a wide cross
between perennial grass and bread wheat, which would be able to regrow like a
perennial grass and produce grain like wheat each year), would provide forage and
grain in a more stable mixed-farming system, with greater flexibility and increased
integration of livestock.
Perennial wheat is still in the process of development, and there are relatively
few studies of grain yield under agronomic field conditions (Larkin et al. 2014).
Perennial wheat is not a naturally occurring plant, but it might be developed through
wide crossings between annual wheat, such as durum (Triticum durum) or common
bread wheat (Triticum aestivumL.), with any of several perennial grass relatives, but
most commonly with intermediate wheatgrass (Thinopyrum intermedium) (Cox et al.
2006). Research in perennial wheat breeding commenced in the early 1900s in the
former Soviet Union. These early studies focused on yield, but this was not
successful economically, as yield declined in subsequent regrowth years.
Unfortunately, few of these data have been easily accessible to researchers in other
countries. More recently, the environmental potential of perennial wheat to improve
environmental sustainability in agriculture systems has attracted renewed research
attention. Despite the anticipated environmental benefits, however, much uncertainty
remains about the degree to which perennial wheat produce lower grain yields
compared to annual wheat, as the perennial plants may need to allocate resources to
enable regrowth, rather than devote all of their reserves to grain (DeHaan et al. 2005;
Murphy et al. 2009; Glover et al. 2010; Glover and Reganold 2010). If perennial
habits were to allow perennial wheat to develop deeper roots, however, perennial
- 59 -
wheat may acquire additional resources, and, depending on additional production and
allocation of dry matter from those additional resources, perennial wheat may be able
to invest for regrowth as well as contribute a reasonable grain yield (Glover et al.
2010). This concept remains to be critically tested.
The feasibility of perennial wheat into the current farming system, and its
potential contribution to economic profitability, was examined by (Bell et al. 2008)
using the Model of an Integrated Dry land Agricultural System (MIDAS). MIDAS is
a whole-farm bio-economic model developed in Western Australia, which was
programmed to allow perennial wheat to be chosen as a candidate enterprise across
contrasting land units in the model farm. In this way, MIDAS was used to assess
which land units were suitable for perennial wheat based on comparative economic
value to the whole farm. The results showed that perennial wheat could be
economically profitable if the grain yield was 65% of that of annual wheat when they
received an equal grain price, or for dual purposes, if the yield was 40% of that of
annual wheat with a contribution of just 800 kgha-1
of additional forage (Bell et al.
2008). Murphy et al. (2010) reported that grain yield in perennial wheat derivatives
was up to 93% of that of annual wheat yield in the first year of plant growth.
Jaikumar et al. (2012) found that perennial wheat derivatives in the second year of
plant growth produced a similar grain yield to that in the first year (50% of the
annual wheat yield). Hayes et al.(2012) evaluated 150 perennial wheat and
wheatgrass derivatives over three years under Australian conditions at Cowra, New
South Wales, and reported that several perennial wheat derivatives persisted and
produced grain over three successive years. In a continued field study of 84 perennial
wheat derivatives, including 58 previously untested and 26 promising entries from
the initial field evaluation study, Larkin et al. (2014) reported an ability to produce
grain yields of up to 75% of that of annual wheat in the highest-yielding perennial

- 60 -
wheat lines, although the best yielders in the first year failed to regrow effectively in
the second year. Nevertheless, six perennial wheat derivatives were able to survive
and produce grain for up to four years in the field. This research has clearly shown
that the development of perennial wheat should be feasible, as the best entries have
up to 4 years survival, regrowth and grain yield, and have already exceeded the 65%
and 40% thresholds of annual wheat yield for economic viability as grain or dual-
purpose crops (Bell et al. 2008). However, research with perennial wheat, regarding
its resource allocation at the whole plant level (including resource allocation for
survival expressed as root growth) remains untested.
The agronomic potential of perennial wheat might be further explained with
data on dry matter production and partitioning, both above- and below-ground, in
relation to plant age. In older plants, the established root system might be better able
to support regrowth early in the growing season, and might allow yields to be
maintained in subsequent years. Alternatively, disease invasion might interfere with
crop establishment and reduce subsequent crop survival. Seasonal conditions may
also influence crop establishment and dry matter production. The same crop might
produce different above- and below-ground dry matter under different seasonal
conditions. Thus, the agronomic potential of perennial wheat, relative to annual
wheat and perennial grass, should be compared over cycles of regrowth.
In addition, comparison should also be made over generations within the same
season, so seasonal confounding can also be removed. In this way, dry matter
production, root growth, and partitioning would be excluded from seasonal
confounding with plant age. One study in the USA did consider such seasonal
confounding of plant age (Jaikumar et al.2012), but extreme weather conditions in
the second year negated the comparisons. Consequently, the within-season

- 61 -
comparison over generations remains to be tested. A further question relates to any
consequence of water deficit during the dry season on the performance of the
subsequent wet season ratoon crop. This also remains to be tested.
Consequently, this study examines the dry matter production and partitioning
of four perennial wheat derivatives over three years, relative to one annual wheat
‘parent’ and one perennial grass ‘parent’, including how these patterns change in
successive regrowth cycles. In order to quantify above- and below-ground response,
the experiments were conducted in large soil columns in the screen-house, under
well-watered conditions. Additional soil columns were established to permit regular
destructive sampling, and also to permit additional comparisons. The consequences
of moderate dry season water deficit on subsequent wet season regrowth and yield
were examined in one subsidiary experiment. A second subsidiary experiment used
further plantings in successive years to allow comparisons across generations in well-
watered conditions in the same season, in the absence of seasonal confounding. The
guiding hypotheses were:
If perennial wheat derivatives are grown for three years under well-watered
conditions with replanting of annual wheat every year, then:
a) Perennial wheat derivatives and perennial grass might show trade-offs in
allocation to seeds in comparison to annual wheat in their first year, second year and
third year of growth due to their perennial habit.
b) Perennial wheat derivatives and perennial grasswould be able to capture additional
resources as an advantage of their perennial habit, and might be able to allocate
additional dry matter produced from those extra resources to benefit regrowth, forage
and grain yield in contrast to annual wheat.

- 62 -
c) Dry matter allocation patterns in annual wheat, perennial wheat derivatives and
perennial grass might differ in relation to annual or perennial growth habits in plants
of different ages, and when compared over generations within the same season.
d) Survival and regrowth patterns might be different under well-watered and water
deficit conditions over three years within perennial wheat derivatives and perennial
grass.
3.2 Materials and methods
3.2.1 Experimental location and soil columns preparation
We conducted this study in large soil columns in an open-topped, side-netted
enclosure in the Horticulture Precinct of Charles Sturt University, located in Wagga
Wagga, New South Wales, Australia (latitude: 35.05°S, longitude: 147.35
°E,
elevation: 219 m). The soil columns were established in 150 cm long PVC tubes of
10 cm diameter. The soil columns were filled to the same weight with homogenised
soil. The weight of individual column at field capacity was ~26 kg and placed above
ground. The soil volume of each column was 1.17 m3
with a surface area of 314 cm2.
Hajri et al. (2016) used pots with 20 cm diameter with 15 plants per pot, while Ward
et al. (2011) used 0.24 m3 of soil volume suggest soil column used in this study was
larger enough for root study.
A hole was drilled into the basal sealed cap to permit the drainage of excess
water. The columns were filled with granitic loamy sand soil (bulk density ~ 1.7 Mg
m-3
).

- 63 -
3.2.2 Experimental design
The experiment was laid out in a split-plot design with six genotypes replicated
three times as the basis of each sampling unit. Within each replicate, there were 20
sampling units of the six genotypes available for subsequent destructive
measurements over the three year period and the six entries comprised one annual
bread wheat, four perennial wheat derivatives and one perennial grass.
3.2.3 Selection of genotypes
Annual bread wheat (Triticum aestivum L.) cultivar ‘Wedgetail,’ a dual-
purpose longer-duration wheat designed for the wheat-sheep farming system of
southern Australia, was chosen as the annual wheat control for this study. Four
perennial wheat derivatives were selected for this study, based on their contrasting
field performance from a germplasm pool of 150 derivatives evaluated in the field at
Cowra in New South Wales (Hayes et al. (2012). For their levels of cytogenetic
complexity, these perennial wheat derivatives provided better performance with
higher yielding ability along with a lower harvest index, higher kernel weight, and
comparatively better regrowth ability, relative to other comparable perennial wheat
derivatives studied in the field.The four selected perennial wheat derivatives (CPI-
147235a, CPI-147280b, OK7211542, 11955) were wide crosses between bread
wheat and perennial grasses, which varied in resource allocation and survival. They
also differed in cytogenetic complexity, based on the source of the perennial grass
parent: CPI-147235a (Th. elongatum 2n diploid); CPI-147280b (Th. intermedium 6n
hexaploid); OK7211542 (Th. ponticum 8n decaploid); 11955 (Agropyron spp.
unknown manyploid > 8n) (Table 1). Perennial tall wheatgrass (Thinopyrum
intermedium) CPI-148055 was chosen as the perennial grass control, because of its
superior regrowth ability, and because T. intermedium was most commonly used as

- 64 -
the parent to confer perennial growth habit among the 150 derivatives tested in
Cowra. Wedgetail and CPI-148055 represented the ‘parents’ used to develop the
perennial wheat derivatives, in general, for comparison.
3.2.4 Cultural management
Seeds, treated with fungicide BAYTAN T (active ingredients Triadimenol
150 gL-1
and Triflumenol 150 gL-1
in 100 ml per 100 kg wheat seed), were sown on
7 May 2011, and after emergence, stands were thinned to one plant per soil column.
In subsequent years, new plantings of the four perennial wheat derivatives, the
perennial grass and the annual wheat were conducted on 5 May 2012 and 8 May
2013, to permit the intended comparisons over generations within seasons. On the
same replanting dates, the annual wheat was also re-sown into the annual wheat
columns in all remaining sampling units, again to permit the intended wet season
comparisons. The annual wheat, Wedgetail, was absent from dry season
comparisons. At the end of each growing season, in about December (the end of the
wet season) and May (the end of the dry season), the plants were cut back to 8–
10 cm in plant height to allow regrowth to occur in the perennial genotypes in the
following season. The severed biomass was removed.
The watering regime was maintained using a dripper irrigation system and
done up to field capacity in different intervals as required in specified treatment
conditions (well-watered and water-deficit conditions). For the well-watered
conditions, the soil columns were watered to field capacity at fortnightly intervals
throughout the experiment. For the dry season water deficit only conditions, affected
soil columns were watered at monthly intervals during the dry season only; from
grain harvest at the end of one wet season, until the removal of dry season biomass at

- 65 -
the commencement of the next wet season. Heavy rainfall over saturation was
counted as a watering event and scheduled accordingly.
All-purpose soluble fertiliser (Yates Thrive N: P: K ratio as 25:5:8.8) was
applied as a solution to each soil column at monthly intervals throughout the
experiment. To make the solution, 5g of the fertiliser was mixed to 1.8 L of water,
i.e. 30 mL of solution was applied to each column. No other nutrients were applied
as soil organic carbon was adequate (4925 mg/kg) in amount. Insecticide Confidor
(active ingredient 0.125 g/L Imidacloprid) was sprayed against leaf sucking insects,
and fungicide BUMPER (active ingredient Propiconazole 418 g/L) was sprayed
against leaf rust as needed.
3.2.5 Measurements
Total dry matter allocation was measured in six harvests. In the first year of
plant growth, two harvests were taken: Harvest 1 (First wet season a) at flowering in
October–November 2011, and Harvest 2 (First wet season b) at maturity in
November–December 2011. In the second year of growing, two harvests were also
taken: Harvest 3 at the end of first dry season April 2012, and Harvest 4 (Second wet
season harvest) at maturity in November–December 2012.In the third year of
growing, two further harvests were taken: Harvest 5 (Second dry season harvest) at
the end of April 2013, and Harvest 6 (Third wet season harvest) at maturity in
November–December 2013.
During each harvest, the shoot was cut at the soil surface and separated into
crowns, leaves, stems and spikes for measuring biomass allocation in different plant
parts. At the time of sampling, the PVC tubes of the large soil columns were cut in
half lengthwise to expose the soil core, which was then cut into 10 cm sections. Each
depth increment was washed using the ‘root washer’ and clean root samples were

- 66 -
collected. All root samples were dried in a dehydrator at 70 ºC for 48 hours and dry
weight was recorded. During the first year, the first harvest was done at anthesis (GS
65) (between October and November 2011), but was dependent upon the growth
stage of the individual genotype. The second harvest was done at the ripening stage
(GS 89) (between November and December), and again, it was dependent upon the
growth stage of the individual genotype. These two harvests represented the plant
growth during the ‘wet season’ of the first year (WS1), the typical wheat growing
season in south-eastern Australia. At maturity, all remaining plants were defoliated to
8 to 10 cm from the soil surface. This would allow quantification of the regrowth
potential of the perennial genotypes during the summer dry season.Seed heads from
each genotype were separated and cleaned by hand using a customised tabletop
thresher. Subsamples of seeds were selected randomly and weighed, and seeds were
counted to determine single seed mass.
After the summer season (dry season DS1), the third harvest took place in
April 2012, when most of the perennials were at anthesis (GS 65), except for the
annual wheat, which was not grown during the dry season. Again, the remaining soil
columns were defoliated as described above. The annual wheat cultivar, Wedgetail,
was re-sown on 5 May 2012. The fourth harvest took place at maturity (GS 89), and
again was dependent upon the growth stage of the individual genotype, between
November and December 2012. This harvest represented plant growth during the
‘wet season’ of the second year (WS2).
After the summer season (dry season DS2), the fifth harvest took place in April
2013, when most of derivatives were at anthesis (GS 65), again except for the annual
wheat, which was not grown during the dry season. The remaining pots were again
defoliated as described earlier. The annual wheat, cv. Wedgetail, was re-sown
on8 May 2013. The sixth and final harvest took place at maturity (GS 89), and again

- 67 -
it was dependent upon the growth stage of the individual genotype, between
November and December 2013. This harvest represented plant growth during the
‘wet season’ of the third year (WS3).
Thermal time was calculated from the average centigrade temperature {(max +
min)/2} of each day over a given time period and presented as Growing degree days
(GDD).
3.2.6 Statistical analysis
Available data were analysed statistically using analysis of variance (ANOVA)
at different treatment levels using GenStat 16th
edition (GenStat® for Windows10.0,
VSN Int. Ltd, UK, 2013). The ANOVA involved using genotypes as the main plot
effect and harvest years as the sub plot. The Least Significant Difference (P<0.5) was
calculated to test whether there were significant differences among treatments.
3.3 Results
3.3.1 Cultural conditions
The temperature, relative humidity, potential evapotranspiration and rainfall
data measured for the study period are presented in Fig. 1 and 2. Analysis of weather
data revealed that the observed weather parameters were close to the long-term
average, with mean monthly maximum and minimum temperature varying from a
maximum of 44°C in January to a minimum of -5
°C in July. The hottest summer of
the three years was observed in 2012. The annual total rainfall at the experimental
site during the duration of this study (~3 years) was 1460 mm, which was close to the
long-term total annual rainfall (572 mm) for this location.

- 68 -
3.3.2 Overall data summary
Treatment means (main effects), and statistics on significance of genotype,
harvest year, and genotype x harvest year are presented in Table 2.
All sources of variation for plant height at flowering, number of tillers per
plant, total root dry matter, grain weight per plant, single grain weight, harvest index,
grain number per plant, and crown dry weight were statistically significant (Table 2).
However, the genotype by harvest year interaction was not significant for number of
ears per plant, total shoot dry matter and grain number per ear. Genotype was a
significant source of variation for all traits. Harvest year was a significant source of
variation for all traits except grain number per ear. In general, the perennial wheat
derivatives CPI-147235a and 11955, and the perennial grass CPI-148055, were
largest for many growth parameters including root and shoot dry weights. However,
annual wheat, Wedgetail, had a higher grain number per ear and the lowest root dry
weight. The interactions between genotypes and harvest year were significant for
several growth and yield components, as examined further below.
3.3.3 Phenology in successive growing season regrowth and within season
comparison
All genotypes established well after planting in May, 2011. Flowering in the
first wet season (WS1) occurred at about 175 days after sowing in the perennial
wheat derivatives, with the annual wheat about 15 days earlier and the perennial
grass about 10 days later (Fig. 3abc). The thermal time (Growing Degree Day, GDD)
showed similar pattern as flowering days with on an average 2070 GDD, with annual
wheat about 1645 GDD. In the perennial wheat derivatives, flowering occurred on
average at 180, 180, 150 days after last stubble cut over the three wet seasons,
several days earlier in the Wedgetail annual wheat, and several days later in the

- 69 -
perennial grass CPI-148055, especially in year 3. Except for the perennial grass, CPI-
148055, which flowered at around 200 days in each season, time to flowering
decreased in the third year, by about 20 days in CPI-147235a, and by about 30 days
in the other perennial wheat derivatives. The GDDs were increased in second year in
all of the varieties except 11955, however, it reduced in third year in all of the
perennial wheat derivatives except perennial grass, CPI-148055.
For plant height (Fig. 3def), OK7211542, CPI-147235a and 11955 were about
20 cm taller than other entries in the first year wet season (WS1), and differences in
plant height increased in the second year wet season (WS2). CPI-148055 joined the
tall group, which averaged 110 cm in WS2, with CPI-146280b at 85 cm and
Wedgetail at 65 cm. In WS3, differences in plant height were not statistically
significant, but ranged from 85 to 110 cm.
On average, there were about 30 tillers per plant in WS1 (Fig. 4abc), with
fewer in Wedgetail, and more in OK7211542. Wedgetail consistently had the fewest
tillers, averaging 12 per plant over the three seasons. There tended to be an increase
in the number of tillers per plant in the perennial wheat derivatives with time,
especially in 11955 in WS3. Likewise, in the perennial grass CPI-148055, there was
a large increase to 135 tillers per plant in WS3.
The number of ears per plant (Fig. 4def) was about half of the number of tillers
per plant in WS1, with fewer ears in Wedgetail, and more in OK7211542 and 11955.
In Wedgetail, the number of ears per plant remained consistently lower for the
perennial wheat derivatives in WS2 and WS3. The number of ears per plant
generally increased in the perennials with time, especially in 11955 and CPI-148055,
each of which increased to about 45 ears per plant in WS3.

- 70 -
3.3.4 Total dry matter production and partitioning to above- and below-
ground components
There was an increase in total dry matter production in the first year (Fig. 5)
from flowering (Fig.5a) to maturity (Fig.5b) during the first wet season in 2011. In
the second year, there was a reduction in regrowth total dry matter production during
the first dry season (Fig. 5c) and an increase in total dry matter production during the
second wet season harvest at maturity in 2012 (Fig.5d), which was even greater than
that during the first wet season harvest at maturity(Fig.5b). A similar trend was found
in the third year of growth, in which lowest regrowth and poor dry matter production
occurred during second dry season harvest (Fig.5e) and highest total dry matter
occurred during the end of the third wet season harvest in 2013 (Fig.5f).
Regrowth and the amount of above- and below-ground dry matter in the dry
season was less than (Fig. 5c) the amount of dry matter produced in the wet season
(Fig. 5b). Perennial wheat genotype 11955 experienced the greatest (25 g/plant)
above-ground dry matter production and the perennial wheatgrass, CPI-148055,
experienced the greatest root biomass (5 g/plant) growth at the end of first dry season
(Fig. 5c). Dry season regrowth in the second year (Fig. 5e) was poor in the
derivatives. However, the perennial wheat grass (CPI-148055) experienced the
greatest (5 g/plant) above-ground dry matter production out of all of the derivatives
at the end of second dry season. The higher incidence of plant death might have been
due to the very dry summer coupled with lower regrowth. No root sampling was
done during the second dry season, so more soil columns were available for later
sampling.
The perennial wheat derivatives, OK7211542 and CPI-147280b, showed
similar patterns of dry matter production from flowering to maturity in the first year

- 71 -
of growth. However, biomass at maturity during the first wet season (Fig. 5b) was
decreased at the end of first dry season (Fig. 5c). However, lowest above-ground
biomass was found at the end of second dry season (Fig. 5e). Highest dry matter was
found in the third year of growth for all perennial derivatives during the third wet
season (Fig. 5f).
Dry matter partitioning in above-ground biomass showed an increasing pattern
in successive years for the perennial wheat and perennial grass derivatives (Fig. 5).
There was more above-ground biomass in the third year than in the first year for the
same derivatives. This pattern of biomass allocation varied in magnitude depending
on the derivatives, but was found in both the perennial wheat derivatives and the
perennial grass. The amount of biomass accumulation in third year plants was highest
(170 g/plant) in the perennial wheat derivative, CPI-147235a, but similar growth was
found during the third wet season among all derivatives. A similar trend was found
for biomass allocation in successive years for the perennial wheat derivative, 11955,
and this was statistically similar to that for CPI-147235a.
The perennial grass, CPI-148055, showed evidence of more above-ground
biomass allocation. In the first year, it experienced comparatively slower biomass
production compared to that for the perennial wheat derivatives. However, in later
years, dry matter allocation showed 2–3 times more biomass production so that it
increased in above-ground biomass to similar levels to that for the perennial wheat
derivatives, CPI-147235a and 11955.
The annual wheat, Wedgetail, (50 g/plant) showed consistent above-ground
biomass production in successive growth seasons. The lowest dry matter production
occurred in the annual wheat in all growing seasons. Its inability to regrow in dry
seasons and consistent absence in both dry seasons (Dry season 2011 and 2012)
reflected the annual nature of its growth habit.

- 72 -
Dry matter allocation differences within above-ground dry matter varied
significantly between perennial and annual growth habits (Table 1). Perennial grass
allocated more dry matter in crowns and leaf–straw and less in spikes in the three
consecutive years of regrowth, compared to the perennial wheat derivatives and
annual wheat. Interestingly at the same condition, perennial wheat derivatives were
found allocating significantly greater amounts of dry matter to crowns, leaf-straw
and spikes than annual wheat. However, dry matter allocation patterns were greater
in older perennial growth habits (highest in year 3, followed by in year 2, than in
year 1) for perennial wheat and perennial grass, whereas, the annual growth habit
pattern was consistently similar for Wedgetail annual wheat in three successive years
of regrowth.
Root growth increased in all perennials in successive years (Fig. 5). In year 1,
the root growth in perennial wheat derivatives varied from 2.24 to 4.94 g/plant, and
this growth increased five-fold in year 2 and 15-fold in year 3.
In successive years of regrowth, lowest root growth (5 g/plant) was found
consistently under replanted annual wheat. This root growth in perennial grass was
greater than in perennial wheat derivatives in successive harvests, and root growth
ranged from 2 to 36 g/plant. Among the perennial wheat derivatives, highest root
growth was found in all years in the perennial wheat derivative, CPI-147235a, which
was statistically similar to that of the perennial wheat derivatives, OK7211542 and
11955.
3.3.5 Root dry weight in different soil depth increments
The root biomass of perennial wheat derivatives were found in deeper soil
layers over sampling times. By contrast, in Wedgetail annual wheat, roots were not
found below 120 cm soil depth.

- 73 -
Root dry weight increased exponentially in perennial derivatives over
successive growing seasons (Fig. 6). Perennial wheat had average root dry weights in
soil layers up to 60 cm deeper soil depth (0.7 to 5.1 g). At soil depths of 60–120 cm,
average root dry weight was 0.7 to 1.5 g; and at depths of 120–150 cm, root dry
weight was 0.7 to 1.25 g in year 1, 2 and 3 of successive years of growth.
Interestingly, the perennial grass, CPI-148055, had the highest root dry weight of all
perennial wheat derivatives and also had more roots in deeper soil layers. Even in dry
season regrowth, the perennial grass, CPI-_148055, produced more root dry weight
compared to perennial wheat derivatives in the same growing season (Fig. 6c).
Annual wheat consistently experienced the least root dry weight production
along with shallower soil depth (present at 120 cm deeper soil layer) throughout the
three years (Fig. 6). Among the perennial wheat derivatives, higher root dry weight
was evident in the perennial wheat genotypes, CPI-147235a and 11955, and in the
perennial grass, CPI-14728055, in successive growing seasons. The perennial
derivative, CPI-147280b, had the lowest root dry weight of all perennial derivatives
and showed the presence of roots in similar soil depths as annual wheat.
3.3.6 Grain yield and yield parameters
Grain weight per plant (Fig. 7abc) was low and variable in the annual wheat,
Wedgetail, due to severe bird damage in the screen-house. This was despite efforts in
placing netting over individual replicates, and even in the bagging of ears of
individual plants. More robust netting systems were installed in the third year, but
nevertheless, grain weights from the annual wheat, Wedgetail, should be considered
to be underestimates, even in year 3. Fortunately, this was not a problem for the other
entries, which did not attract any feeding activity. Amongst the perennial wheat
derivatives, grain weight averaged about 2 g per plant in WS1, but was higher in
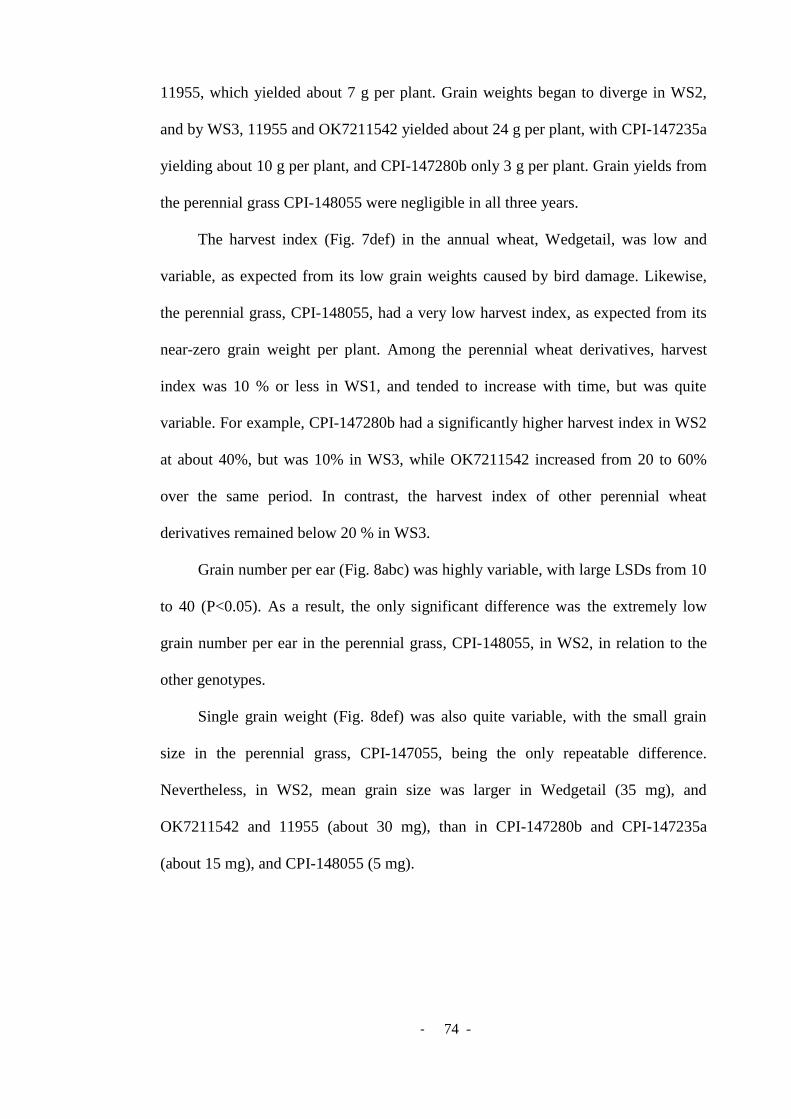
- 74 -
11955, which yielded about 7 g per plant. Grain weights began to diverge in WS2,
and by WS3, 11955 and OK7211542 yielded about 24 g per plant, with CPI-147235a
yielding about 10 g per plant, and CPI-147280b only 3 g per plant. Grain yields from
the perennial grass CPI-148055 were negligible in all three years.
The harvest index (Fig. 7def) in the annual wheat, Wedgetail, was low and
variable, as expected from its low grain weights caused by bird damage. Likewise,
the perennial grass, CPI-148055, had a very low harvest index, as expected from its
near-zero grain weight per plant. Among the perennial wheat derivatives, harvest
index was 10 % or less in WS1, and tended to increase with time, but was quite
variable. For example, CPI-147280b had a significantly higher harvest index in WS2
at about 40%, but was 10% in WS3, while OK7211542 increased from 20 to 60%
over the same period. In contrast, the harvest index of other perennial wheat
derivatives remained below 20 % in WS3.
Grain number per ear (Fig. 8abc) was highly variable, with large LSDs from 10
to 40 (P<0.05). As a result, the only significant difference was the extremely low
grain number per ear in the perennial grass, CPI-148055, in WS2, in relation to the
other genotypes.
Single grain weight (Fig. 8def) was also quite variable, with the small grain
size in the perennial grass, CPI-147055, being the only repeatable difference.
Nevertheless, in WS2, mean grain size was larger in Wedgetail (35 mg), and
OK7211542 and 11955 (about 30 mg), than in CPI-147280b and CPI-147235a
(about 15 mg), and CPI-148055 (5 mg).
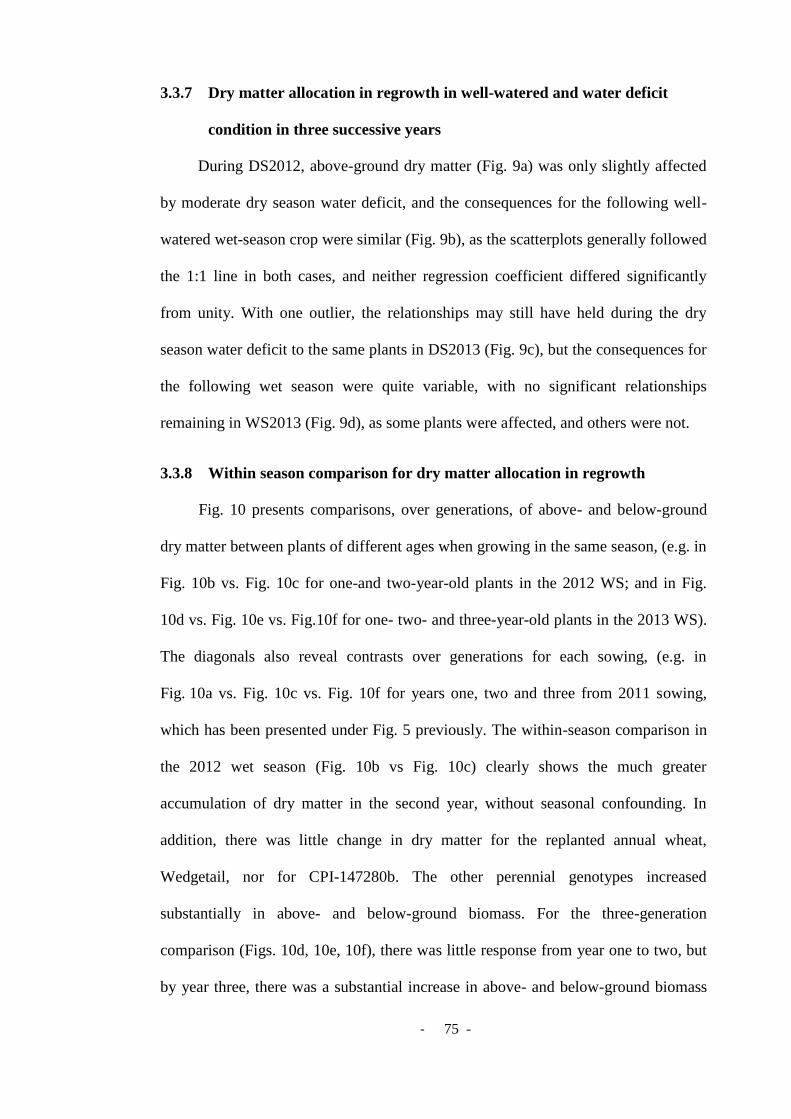
- 75 -
3.3.7 Dry matter allocation in regrowth in well-watered and water deficit
condition in three successive years
During DS2012, above-ground dry matter (Fig. 9a) was only slightly affected
by moderate dry season water deficit, and the consequences for the following well-
watered wet-season crop were similar (Fig. 9b), as the scatterplots generally followed
the 1:1 line in both cases, and neither regression coefficient differed significantly
from unity. With one outlier, the relationships may still have held during the dry
season water deficit to the same plants in DS2013 (Fig. 9c), but the consequences for
the following wet season were quite variable, with no significant relationships
remaining in WS2013 (Fig. 9d), as some plants were affected, and others were not.
3.3.8 Within season comparison for dry matter allocation in regrowth
Fig. 10 presents comparisons, over generations, of above- and below-ground
dry matter between plants of different ages when growing in the same season, (e.g. in
Fig. 10b vs. Fig. 10c for one-and two-year-old plants in the 2012 WS; and in Fig.
10d vs. Fig. 10e vs. Fig.10f for one- two- and three-year-old plants in the 2013 WS).
The diagonals also reveal contrasts over generations for each sowing, (e.g. in
Fig. 10a vs. Fig. 10c vs. Fig. 10f for years one, two and three from 2011 sowing,
which has been presented under Fig. 5 previously. The within-season comparison in
the 2012 wet season (Fig. 10b vs Fig. 10c) clearly shows the much greater
accumulation of dry matter in the second year, without seasonal confounding. In
addition, there was little change in dry matter for the replanted annual wheat,
Wedgetail, nor for CPI-147280b. The other perennial genotypes increased
substantially in above- and below-ground biomass. For the three-generation
comparison (Figs. 10d, 10e, 10f), there was little response from year one to two, but
by year three, there was a substantial increase in above- and below-ground biomass

- 76 -
in the perennial grass CPI-148055 and also in the perennial wheat derivatives CPI-
147235a, and 11955. The below-ground responses of the perennial grass in both final
years of comparison were notably higher than perennial wheat derivatives of the
same growing season.
3.4 Discussion
3.4.1 Phenology, regrowth, biomass production over successive years
This study reported differences in shoot and root growth and dry matter
allocation in annual wheat, perennial wheat derivatives and perennial grass, for three
successive years. Perennial wheat and perennial grass showed delayed phenology
consistent with the observation that perennial grasses have a tendency for a later
flowering time compared to congeneric annuals (Garnier et al. 1997). However,
fewer days to flowering were needed in year 3 in perennial wheat derivatives in this
study, which was consistent with findings in perennial wheat and perennial rye in
older plants (Jaikumar et al. 2012). This change of flowering earlier is vital for
perennials in relation to drift of harvest time, and might be used to achieve better
protection against insect pest attack, escape from drought or from vulnerable weather
challenges. Regrowth was successful in three consecutive years in perennial wheat
derivatives and perennial grass. The number of tillers per plant was an important
measure to understand regrowth ability in perennial derivatives in the following
growth seasons. The high rate of regrowth ability in the successive wet seasons was
encouraging in perennial wheat and in perennial grass, with more tillers per plant
(Fig. 4a, 4b and 4c). In contrast, their regrowth in the dry season was poor, with
fewer tillers per plant (data not shown), and reduced biomass accumulation (Fig. 5c
and 5e). Overall, strong seasonal differences in regrowth ability were found in this
study, with hot and dry weather in summer underlying poor dry season regrowth,
- 77 -
especially in 2013.This pattern was consistent with failure to achieve regrowth in the
second year of perennial wheat and perennial rye in Michigan in the USA (Jaikumar
et al. 2012). The perennial wheat genotypes evaluated here were chosen based on
their regrowth ability in the field at Cowra, with a dense stand as an essential
agronomic criterion (Hayes et al.2012). These genotypes were cool temperature-
adapted, being developed from winter wheats in the USA.
In this study, the extreme seasonal variability in perennial wheat and perennial
grass indicated a need for further breeding efforts seeking improved adaptation to the
hot dry summers in southern Australia, including rigorous regrowth potential with
dependable perenniality. In successive years of plant age, the decline in grain yield of
perennial wheat derivatives in the field was attributed to the increase in plant
mortality with age (Larkin et al. 2014), inconsistent regrowth under hot dry summers
(Hayes et al. 2012; Jaikumar et al. 2012), and heavy weed pressure in the second
year of regrowth (Weik et al. 2002). Generally, grain yield potential declined due to
failure of plants to survive under harsh summer (Hayes et al. 2012; Jaikumar et
al.2012) or harsh winter (Lammer et al. 2004; Murphy et al. 2010) conditions. This
interaction of genotype and environmental factors controlled regrowth and reflected
on yield potential for perennial wheat derivatives and perennial grass in successive
years of plant age.
Biomass production of perennial grain crops could be economically feasible as
a provider of additional forage (Bell et al. 2008). In this study, perennial wheat
derivatives and perennial grass produced more dry matter than annual wheat. Surplus
forage during dry season regrowth, when annual wheat was absent, would be
especially valuable.
Biomass production in perennials is generally higher than in annuals. With
long breeding histories, some of the currently domesticated perennials, although

- 78 -
producing lower grain yield, were able to produce higher total above-ground dry
matter than their annual analogues(DeHaan et al. 2005). Above-ground biomass in
perennial sorghum was 62% of annual sorghum (Piper and Kulakow (1994) and
Jaikumar et al. (2012)reported that the additional impact of plant age on biomass was
less in perennial wheat and rye in Michigan, as one and two-year-old perennial plants
both produced only half that of their annual analogues. Perennial grass biomass
tripled in the second year in Miscanthus (Clifton-Brown and Lewandowski 2002),
and similarly in Arundo donax (Mantineo et al. 2009) and in switch grass (Schmer et
al. 2010) for the first three years. However, the greater biomass in aged plants, with
no change or little increase in seed yield, would translate to a decline in the harvest
index in perennials with an increase in plant age. The increase in harvest index
occurs by reallocating more carbon through plant breeding might improve yield, as
achieved in annual crops in Green Revolution (Evans 1998).
Throughout three years of regrowth, root growth deeper in the soil profile was
greater in perennial wheat derivatives and in perennial grass than in annual wheat,
whose roots were unable to attain depths below 120 cm (Fig. 6). Root dry weight
decreased in dry season regrowth (Fig. 6c) as was evidenced from last observed wet
season regrowth (Fig. 6b) in similar perennial wheat derivatives and perennial grass.
This pattern was essentially consistent with the findings of a study with intermediate
wheat grass in Kansas, which found 25–40% of roots died off and grew back each
year (Cox et al. 2006). Interestingly, perennial grass showed greater resource
allocation to root growth, and was the highest of all the perennial genotypes in the
third year of regrowth.
This ability of allowing greater resource allocation to extensive root growth
throughout the growing season and in deeper soil layers, as shown in this study,

- 79 -
might allow greater water extraction, nutrient uptake, and reduced losses to
groundwater, with the potential for enhanced resource capture to benefit yield in
subsequent years. This hypothesis is examined further in Chapter 5.
3.4.2 Trade-offs in allocation to seeds in different plant age
Grain yield per unit area is the basic measure of productivity, whereas
individual seed size is important for seedling vigour, and also for ease of harvest,
milling, utilisation and food quality. Cox et al. (2006) reported that seed yield and
seed size were lower for both wild annual and perennial crops than those of annual
grain crops, and that wild perennials produced fewer seeds than wild annuals.
DeHaan et al. (2005) predicted that artificial selection in a properly managed
breeding program could potentially generate perennial grain crops with acceptable
yields while improving seed size. In this study, grain yields of perennial wheat
derivatives and perennial grass generally increased over the three successive growing
seasons. Consistent with the first hypothesis, first-year yield in perennial wheat and
perennial grass derivatives were consistently lower than the annual wheat: perennial
wheat derivatives and perennial grass yielded 0.009 to 6.47 g plant-1
, while second-
year yields were 0.3 to 7 g plant-1
, and third -year yields were 0.1 to 26 g plant-1
.
Lower initial grain yield in perennial wheat derivatives and perennial grass was
consistent with that found for other studies. A recent study confirmed these findings
for perennial wheat, with lower grain yield by 26 to 42% of annual wheat (Hayes et
al. 2012)in Australian conditions. Further research explored84 perennial wheat
derivatives in Australia, and found that first-year grain yield of perennial wheat
derivatives and perennial grass varied from 2.72 to 75% of annual wheat yield
(Larkin et al. 2014). In the contrasting environment of the USA, a perennial wheat
study found grain yield to be 50% of that of the annual wheat (Jaikumar et al. 2012)

- 80 -
and a separate study of 31perennial wheat lines reported grain yields of
approximately 44% (ranged from 20 to 93% ) of that of the annual wheat (Murphy
et al. 2010).After the first year of growth, perennial wheat derivatives differed in
subsequent patterns, with some declining (CPI-147280b and CPi-148055) and others
increasing (CPI-147235a, Ok7211542, 11955) in yield after the second year.
Larkin et al. (2014) reported that four perennial wheat derivatives persisted and
increased in grain yield with time. This confirmed the biological feasibility of
perennial wheat derivatives in being able to produce grain over successive years of
regrowth. Previous studies of perennial forage grasses have provided conflicting
evidence on grain yield potential in successive years of regrowth. Grain yield in
Pennisetum polystachyon and Andropogon gayanus increased between the first and
second year, but declined thereafter (Mishra and Chatterjee 1968). Grain yield
increased in the perennial grass red fescue, Festuca rubra (Canode 1968),and
doubled in the second year in desert wheatgrass, Agropyron desertorum (Canode and
Law 1978). Grain yields were generally stable over the first few years in Kentucky
bluegrass, Poa pratensis (Chastain et al. 1997), orchard grass, Dactylis glomerata
(Fulkerson 1980) and perennial ryegrass, Lolium perenne (Mueller-Warrant and
Rosato 2002). In contrast, yield declined after the first year in the perennial grasses,
Russian wild rye, Elymus junceus (Lawrence and Ashford 1964) and timothy,
Phleum pratense (Fulkerson 1980).
Among studies on perennial wheat derivatives, Jaikumar et al. (2012)reported
that the second-year yield of perennial wheat derivatives were approximately equal
to the first year grain yield (50% of the annual wheat yield). In another study,(Hayes
et al. 2012)found that second-year perennial wheat grain yield was highly variable,
ranging from about 1% to over 1000% of the first-year yield (depending on the

- 81 -
accession). In this study, second- and third-year grain yield increased 2- to 6-fold
compared to first-year grain yield in perennial wheat derivatives.
3.4.3 Survival and regrowth under differing water regimes
Under dry-season water deficit, above-ground dry matter production was lower
than under well-watered condition, more so in the second dry season, and more
variable, especially in the following wet season, and more so in the second following
wet season cycle in 2013 (Fig.9).Tillering capacity was considered a determinant of
drought resistance (Sharma and Verma 1983), with weaker tiller growth and greater
tiller mortality associated with delay in the commencement of regrowth.
Nevertheless, some perennial wheat derivatives were able to produce more above-
ground dry matter by the end of wet season. But by the end of wet season 3 in 2013,
water deficit soil columns with greater tiller mortality and weaker regrowth produced
less biomass than previously. These results from the controlled dry-season water
deficit assist in explaining why regrowth was inconsistent and unreliable among
perennial wheat derivatives in the field (Hayes et al. 2012; Jaikumar et al. 2012).
The lower grain yields in perennial wheat derivatives could be a reflection of
lower dry matter allocation to grain, consistent with their perennial nature, combined
with lower initial plant population density, lower reproductive tiller number, smaller
individual kernel mass, and lower harvest index. Larkin et al. (2014) reported that
1000-kernel mass in perennial grass was six times less than in annual wheat.
Jaikumar et al. (2012) reported that kernel mass was 31–56 % smaller in perennial
wheat than in annual wheat. Piper and Kulakow (1994) reported 35% lower kernel
mass and 16% lower reproductive allocation in perennial sorghum than in annual
sorghum.

- 82 -
3.5 Conclusion
Perennial wheat derivatives were able to survive for three years and
contributed greater above- and below-ground dry matter, than annual wheat
especially in year 3. This was confirmed by the within-season comparison, which
clearly demonstrated greater dry matter in the third year, without confounding by
seasonal conditions. While some perennial wheat derivatives were able to regrow
following dry season water deficit (DS-WD), a second cycle of DS-WD severely
penalised subsequent DM and yield in WS2013. Currently available perennial wheat
derivatives were developed in the USA for harsh winters, so would not be expected
to survive and perform well under southern Australian conditions. Despite this, some
did survive and perform, and the variation evident suggests prospects for further
improvement. New gene exploration might ensure more reliable regrowth, biomass
and yield production. Selection for drought resistance and high yield potential may
assist in the development of improved perennial wheat derivatives.
3.6 Acknowledgments
We acknowledge funding support obtained for this research from Charles Sturt
University (CSU) and the Future Farm Industries Cooperative Research Centre (FFI–
CRC). Special thanks to Mr. Kerry Schirmer for assistance in crop management and
root washing, and to Richard C. Hayes and Matthew T. Newell for providing seeds
for this study. Special thanks to Washington State University, The Land Institute,
CIMMYT and the Centre for Molecular Biotechnology, Russian State Agrarian
University for permission for the use of their germplasm.

- 83 -
3.7 References
Angus J, Kirkegaard J, Peoples M (2001) Rotation, sequence and phase: research on
crop and pasture systems. In 'Proceedings of the 10th Australian Society of
Agronomy Conference, Hobart'
Bell L, Byrne F, Ewing MA, Wade LJ (2008) A preliminary whole-farm economic
analysis of perennial wheat in an Australian dryland farming system.
Agricultural Systems 96, 166-174.
Canode CL (1968) Influence of Row Spacing and Nitrogen Fertilization on Grass
Seed Production1. Agron. J. 60, 263-267.
Canode CL, Law AG (1978) Influence of Fertilizer and Residue Management on
Grass Seed Production1. Agron. J. 70, 543-546.
Chastain T, Kiemnec G, Cook G, Garbacik C, Quebbeman B, Crowe F (1997)
Residue management strategies for Kentucky bluegrass seed production.
Crop science 37, 1836-1840.
Clifton-Brown JC, Lewandowski I (2002) Screening< i> Miscanthus</i> genotypes
in field trials to optimise biomass yield and quality in Southern Germany.
European Journal of Agronomy 16, 97-110.
Cox T, Glover JD, Van Tassel DL, Cox CM, DeHAAN LEER (2006) Prospects for
developing perennial grain crops. BioScience 56, 649-659.
DeHaan L, Van Tassel D, Cox T (2005) Perennial grain crops: a synthesis of ecology
and plant breeding. Renewable Agriculture and Food Systems 20, 5-14.
Evans LT (1998) 'Feeding the ten billion: plants and population growth.' (Cambridge
University Press).
Fulkerson R (1980) Seed yield responses of three grasses to post-harvest stubble
removal. Canadian Journal of Plant Science 60, 841-846.
Garnier E, Cordonnier P, Guillerm J, Sonié L (1997) Specific leaf area and leaf
nitrogen concentration in annual and perennial grass species growing in
Mediterranean old fields. Oecologia 111, 490-498.
Glover J, Reganold J, Bell L, Borevitz J, Brummer E, Buckler E, Cox C, Cox T,
Crews T, Culman S (2010) Increased food and ecosystem security via
perennial grains. Science(Washington) 328, 1638-1639.
Glover J, Reganold JP (2010) Perennial Grains: Food Security for the Future-
Developing perennial versions of our major grain crops would address many
of the environmental limitations of annuals while helping to feed an
increasingly hungry planet. Issues in Science & Technology 26, 41.
Hajri, H., Mhadebi R, Ghorbel A, Armstrong J, Ben Salem-Fenayou A. (2016).
Physiological and leaf ultrastructural characteristics of perennial ryegrass
(Lolium perenne L.) biotypes from Tunisia under sulfonylurea herbicide
application. Scientia horticulturae 207: 28-32.
Hayes RC, Newell MT, DeHaan LR, Murphy KM, Crane S, Norton MR, Wade LJ,
Newberry M, Fahim M, Jones SS, Cox TS, Larkin PJ (2012) Perennial cereal
crops: An initial evaluation of wheat derivatives. Field Crops Research 133,
68-89.
Jaikumar NS, Snapp SS, Murphy K, Jones SS (2012) Agronomic Assessment of
Perennial Wheat and Perennial Rye as Cereal Crops. Agronomy Journal 104,
1716-1726.
Lammer D, Cai X, Arterburn M, Chatelain J, Murray T, Jones S (2004) A single
chromosome addition from Thinopyrum elongatum confers a polycarpic,
perennial habit to annual wheat. Journal of experimental botany 55, 1715-
1720.

- 84 -
Larkin PJ, Newell MT, Hayes RC, Aktar J, Norton MR, Moroni SJ, Wade LJ (2014)
Progress in developing perennial wheats for grain and grazing. Crop and
Pasture Science 65 1147-1164.
Lawrence T, Ashford R (1964) Seed yield and morphological development of
Russian wild ryegrass as influenced by grazing. Canadian Journal of Plant
Science 44, 311-317.
Mantineo M, D’Agosta GM, Copani V, Patanè C, Cosentino SL (2009) Biomass
yield and energy balance of three perennial crops for energy use in the semi-
arid Mediterranean environment. Field Crops Research 114, 204-213.
Mishra M, Chatterjee B (1968) Seed production in the forage grasses Pennisetum
polystachyon and Andropogon gayanus in the Indian tropics. Trop. Grassl 2,
51-56.
Mueller-Warrant GW, Rosato S (2002) Weed Control for Stand Duration Perennial
Ryegrass Seed Production. Agronomy journal 94, 1192-1203.
Murphy K, Hoagland LA, Reeves PG, Baik BK, Jones SS (2009) Nutritional and
quality characteristics expressed in 31 perennial wheat breeding lines.
Renewable Agriculture and Food Systems 24, 285.
Murphy K, Lyon SR, Balow KA, Jones SS (2010) Post-sexual cycle regrowth and
grain yield in Thinopyrum elongatum × Triticum aestivum amphiploids.
Plant Breeding 129, 480-483.
Piper JK, Kulakow PA (1994) Seed yield and biomass allocation in Sorghum bicolor
and F1 and backcross generations of S. bicolor× S. halepense hybrids.
Canadian Journal of Botany 72, 468-474.
Sando W (1935) HYBRIDS OF WHEAT, RYE, AEGILOPS AND HAYNALDIA A
Series of 122 Intra-and Inter-Generic Hybrids Shows Wide Variations in
Fertility. Journal of Heredity 26, 229-232.
Schmer MR, Mitchell R, Vogel K, Schacht W, Marx DB (2010) Spatial and temporal
effects on switchgrass stands and yield in the Great Plains. BioEnergy
research 3, 159-171.
Sharma S, Verma C (1983) Performance of Cenchrus ciliaris Linn. strains in an arid
rangeland of western Rajasthan. Annals of Arid zone
Turner NC (2004) Agronomic options for improving rainfall-use efficiency of crops
in dryland farming systems. Journal of Experimental Botany 55, 2413-2425.
Ward, P, Palta J and Waddell H (2011). Root and shoot growth by seedlings of
annual and perennial medic, and annual and perennial wheat. Crop and
Pasture Science 62(5): 367-373.
Weik L, Kaul HP, Kübler E, Aufhammer W (2002) Grain Yields of Perennial Grain
Crops in Pure and Mixed Stands. Journal of Agronomy and Crop Science
188, 342-349.

- 85 -
3.8 Figures and tables
Table 1a. Pedigree of genotypes used in this experiment.
No. Genotypes Reported pedigree Country
of origin
Source Source
reference
1 Wedgetail T. aestivum Australia (Cultivar) EGA
Wedgetail
2 CPI-147235a T. aestivum(CS) / T.
elongatum/ T.
aestivum (M)
USA WSU PF5R1-0009
3 CPI-
147280b
T. Carthlicum / T.
intermedium / T.
aestivum
USA TLI B374-6-16
4 OK7211542 Partial amphiploid
derived from T.
aestivum / T.
Ponticum
USA CSIRO (Sando 1935)
5 11955 Triticumspp. /
Agropyronspp.hybrid
USA NSW
DPI
-
6 CPI-148055 T. intermedium USA TLI IWG 3182
Abbreviations: CS-Chinese Spring; M- Madsen are all cultivars of T. aestivum.

- 86 -
Table 1b. Chemical analysis of soil used in this experiment.
Soil parameter Amount present Unit
Calcium, soluble/exchangeable 1.9 cmol/kg
Effective Cation Exchange Capacity 2.5 cmol/kg
Conductivity (1:5 soil/water) 53.5 µS/cm
Magnesium, soluble/exchangeable 0.255 cmol/kg
Extractable Phosphorus (Colwell) 20 mg/kg
pH (1:5 soil/water) 7.2 pH units
Potassium, soluble/exchangeable 0.345 cmol/kg
Sodium, soluble/exchangeable 0.165 cmol/kg
Total Kjeldahl Nitrogen 305.5 mg/kg
Total Organic Carbon 4925 mg/kg

- 87 -
Table 2. Overall data summary, averaged across genotypes, with LSD and AOV.
Source of variation Plant
height
(cm)
Tillers
/plant
Ears/
plant
Shoot dry
matter (g)
Root
dry
matter
(g)
Grain
weight
(g/plant)
Single
grain
weight
(g)
Harvest
index
Grains
/plant
Grains
/ear
Crown
dry
weight
(g)
Leaf-
stem dry
weight
(g)
Spike
dry
weight
(g)
Gen
oty
pe
(G)
Wedgetail 79.2 10.4 7.4 21.1 2.8 4.6 0.029 0.252 148.6 20.7 1.2 13.7 6.1
CPI-147235a 104.1 32.8 18.8 70.1 9.5 5.5 0.016 0.107 296.3 15.4 5.7 50.1 14.4
CPI-147280b 79.2 24.1 13.8 38.0 8.8 2.7 0.017 0.178 162.9 19.5 4.4 27.9 7.2
OK7211542 103.1 37.7 21.7 47.4 10.2 10.1 0.023 0.271 406.3 16.6 7.1 32.6 19.5
11955 103.5 45.1 25.9 94.2 15.2 12.9 0.034 0.120 349.2 14.2 9.6 58.7 22.7
CPI-148055 93.0 68.3 26.1 84.0 20.3 0.2 0.005 0.004 36.6 2.1 21.3 57.7 4.5
Har
ves
t
(H)
Wet Season 2011 84.9 27.5 13.1 40.7 3.8 2.0 0.015 0.053 109.6 9.3 3.5 28.7 8.4
Wet Season 2012 97.8 27.4 15.1 42.8 11.3 4.3 0.022 0.208 193.2 15.2 4.9 27.8 7.3
Wet Season 2013 98.3 54.4 28.8 93.9 18.3 11.7 0.025 0.205 397.1 19.7 16.2 63.9 21.5
Genotype Significance ** ** ** ** * ** ** ** ** * ** ** **
LSD 12.1 9.1 10.0 31.9 4.2 1.9 0.005 0.075 50.6 11.8 5.0 26.9 4.7
Harvest Significance ** ** ** ** ** ** ** ** ** NS ** **
LSD 8.6 6.5 7.1 22.5 3.0 1.3 0.003 0.106 35.8 8.4 3.5 19.0 3.3
G × H Significance * ** NS NS ** ** ** ** ** NS ** NS **
LSD 21.0 15.8 17.3 55.2 7.3 3.3 0.008 0.184 87.7 20.5 8.6 46.6 8.1

- 88 -
Sola
rRad
iati
on (
MJ/
sqm
)
0
5
10
15
20
25
30
35
40
45
Experimental periods
May
/11
Jun/1
1
Jul/
11
Aug/1
1
Sep
/11
Oct
/11
No
v/1
1
Dec
/11
Jan/1
2
Feb
/12
Mar
/12
Ap
r/1
2
May
/12
Jun/1
2
Jul/
12
Aug/1
2
Sep
/12
Oct
/12
No
v/1
2
Dec
/12
Jan/1
3
Feb
/13
Mar
/13
Ap
r/1
3
May
/13
Jun/1
3
Jul/
13
Aug/1
3
Sep
/13
Oct
/13
No
v/1
3
Dec
/13
Jan/1
4
Feb
/14
Tem
per
ature
(oC
)
-5
0
5
10
15
20
25
30
35
40
45
Maximum
Minimum
Fig.1. The maximum and minimum temperatures (°C), and the solar radiation (shaded yellow)
recorded during the experimental period.

- 89 -
Fig.2. The relative humidity (%), evapotranspiration (mm), rainfall (mm) and pan
evapotranspiration (mm) recorded for the experimental period.
May
/11
Jun/1
1
Jul/
11
Aug/1
1
Sep
/11
Oct
/11
No
v/1
1
Dec
/11
Jan/1
2
Feb
/12
Mar
/12
Ap
r/1
2
May
/12
Jun/1
2
Jul/
12
Aug/1
2
Sep
/12
Oct
/12
No
v/1
2
Dec
/12
Jan/1
3
Feb
/13
Mar
/13
Ap
r/1
3
May
/13
Jun/1
3
Jul/
13
Aug/1
3
Sep
/13
Oct
/13
No
v/1
3
Dec
/13
Jan/1
4
Feb
/14
Rel
ativ
e H
um
idit
y (
%)
0
20
40
60
80
100
Maximum RH%
Minimum RH%
ET
(m
m)
-20
-10
0
Rai
nfa
ll (
mm
)
0
20
40
60
80
100
Pan
Evap
ora
tion
(m
m)
-20
-10
0

- 90 -
Fig.3. The number of days (number of days after sowing or last stubble cut) to
flowering (a, b, c) with thermal time (Growing Degree Day °C) presented as yellow
bars and plant height (d, e, f) shown for one annual wheat, four perennial wheat
derivatives, and one perennial grass, in the of 2011(a and, d),2012(b and e),and
2013(c and f)cropping years. LSDs (P=0.05) 3.046 for days to flowering, and 20.99
for plant height.
0
50
100
150
200
0
20
40
60
80
100
120
OK
72
11
54
2
CP
I-1
47
28
0b
Wed
get
ail
CP
I-1
47
23
5a
11
95
5
CP
I-1
47
28
05
5
0
20
40
60
80
100
120
Pla
nt
hei
gh
t (c
m)
0
20
40
60
80
100
120
OK
72
11
54
2
CP
I-1
47
28
0b
Wed
get
ail
CP
I-1
47
23
5a
11
95
5
CP
I-1
47
28
05
5
Da
ys
to f
low
erin
g
0
50
100
150
200
OK
72
11
54
2
CP
I-1
47
28
0b
Wed
get
ail
CP
I-1
47
23
5a
11
95
5
CP
I-1
47
28
05
5
0
50
100
150
200
(a) (d)
(b)
(c)
(e)
(f)
0
500
1000
1500
2000
2500
0
500
1000
1500
2000
2500
0
500
1000
1500
2000
2500
Gro
win
g D
egree
Da
y (
oC
)

- 91 -
Fig.4.The number of tillers (left hand side) (a, b, c) and the number of ears (d, e, f)
(right hand side) for four perennial wheat derivatives, one perennial grass, and one
annual wheat grown in the cropping year of 2011(a and d), 2012 (b and e), and 2013
(c and f). Cropping year LSDs (P=0.05) were 15.84 for number of tillers, and 7.08
for number of ears. Further details of statistical significance of dry matter
components are presented in Table 2.
0
25
50
75
100
125
0
25
50
75
100
125
Wed
get
ail
CP
I-1
47
23
5a
CP
I-1
47
28
0b
OK
72
11
54
2
11
95
5
CP
I-1
48
05
5
0
25
50
75
100
125
Ear
pla
nt-1
0
25
50
75
100
125
Wed
get
ail
CP
I-1
47
23
5a
CP
I-1
47
28
0b
OK
72
11
54
2
11
95
5
CP
I-1
48
05
5
Til
ler
pla
nt-1
0
25
50
75
100
125
Wed
get
ail
CP
I-1
47
23
5a
CP
I-1
47
28
0b
OK
72
11
54
2
11
95
5
CP
I-1
48
05
5
0
25
50
75
100
125
(a) (d)
(b)
(c)
(e)
(f)

- 92 -
Fig. 5. Total above-ground dry matter (with components) and total root dry matter in
one annual wheat, four perennial wheat derivatives, and one perennial grass at six
harvests: a) at flowering 2011;b) at physiological maturity in the first wet season,
December 2011;c) at the first dry season regrowth, April 2012;d) at physiological
maturity in the second wet season, December 2012;e) at the second dry season
regrowth, April 2013;and f) at physiological maturity in the third wet season,
December 2013. LSDs for total above-ground dry matter and total root dry matter
were 22.54 and 7.297, respectively, at P=0.05. Further details of statistical
significance of dry matter components are presented in Table 2.
(a)
-50
0
50
100
150
Root
Crown
(b)
(c)
-50
0
50
100
150
(d)
(f)
Wed
get
ail
CP
I-147235a
CP
I-147280b
OK
7211542
11955
CP
I-148055
(e)
Wed
get
ail
CP
I-147235a
CP
I-147280b
OK
7211542
11955
CP
I-148055
-50
0
50
100
150
Dry
matt
er (
g
pla
nt-1
)
Root
Crown
Leaf & Stem
Spike
Root
Crown
Leaf & Stem
Spike
Root
Crown
Leaf & Stem
Spike Spike

- 93 -
Fig.6. Root dry weight presented as the square root of (RDW + 0.5) over soil depth
increments for five harvests for three years: a) wet season 1 at flowering time 2011;
b) at physiological maturity, December 2011 (WS1); c) at the end of dry season
regrowth, April 2012; d) at physiological maturity, December 2012(WS2); and e) at
physiological maturity, December 2013(WS3). The level of significance is stated as
significant (*) or not significant (ns). The original root dry weight is stated in the
upper scale as (RDW) for the same data point stated in SQRT (RDW+0.5).
SQRT(RDW+0.5)SQRT(RDW+0.5)0.0 0.5 1.0 1.5 2.0 2.5 3.0 3.5 4.0
Soil
dep
th (
cm)
5
15
25
35
45
55
65
75
85
95
105
115
125
135
145
0 0.5 1.75 3.5 8.5 15.5RDW
0.0 0.5 1.0 1.5 2.0 2.5 3.0 3.5 4.0
Soil
dep
th (
cm)
5
15
25
35
45
55
65
75
85
95
105
115
125
135
145
Soil
dep
th (
cm)
5
15
25
35
45
55
65
75
85
95
105
115
125
135
145
Soil
dep
th (
cm)
5
15
25
35
45
55
65
75
85
95
105
115
125
135
145
5
15
25
35
45
55
65
75
85
95
105
115
125
135
145
0 0.5 1.75 3.5 8.5 15.5RDW
Wedgetail
CPI-147235a
CPI-147280b
OK7211542
11955
CPI-148055
Soil
dep
th (
cm)
*
*
*
*
*
*
*
ns
*
ns
nsns
ns
ns
ns
*
*
*
*
*
*
*
*
*
*
*
*
ns
ns
ns
ns
ns
ns
ns
ns
nsns
ns
*
*
*
*
*
*
*
*
*
*
**
*
*
*
*
*
*
*
*
*
*
*
ns
ns
nsns
*
*
*
a) b)
c) d)
e)

- 94 -
Fig.7. Grain weight per plant (left hand side) and harvest index (right hand side) for
four perennial wheat derivatives, one perennial grass and one annual wheat grown
in the harvest year of 2011(a and d), 2012(b and e), and 2013(c and f). LSDs for
grain weight per plant and harvest index were 3.293 and 0.184, respectively, at
P=0.05. Further details of statistical significance of dry matter components are
presented in Table 2.
0
5
10
15
20
25
0.0
0.2
0.4
0.6
Wed
get
ail
CP
I-1
47
23
5a
CP
I-1
47
28
0b
OK
72
11
54
2
11
95
5
CP
I-1
48
05
5
0.0
0.2
0.4
0.6
Har
ves
t In
dex
0.0
0.2
0.4
0.6
Wed
get
ail
CP
I-1
47
23
5a
CP
I-1
47
28
0b
OK
72
11
54
2
11
95
5
CP
I-1
48
05
5
Gra
in w
eigh
t /
pla
nt
0
5
10
15
20
25
Wed
get
ail
CP
I-1
47
23
5a
CP
I-1
47
28
0b
OK
72
11
54
2
11
95
5
CP
I-1
48
05
5
0
5
10
15
20
25
(a) (d)
(b)
(c)
(e)
(f)

- 95 -
Fig.8. Grain number per ear (left hand side) and single grain weight(g) (right hand side)
for four perennial wheat derivatives, one perennial grass, and one annual wheat grown in
the harvest year of 2011(a and d),2012(b and e),and 2013(c and f). LSDs for grain
number per ear and single grain weight 11.84 were 0.008076, respectively, at P=0.05.
Further details of statistical significance of dry matter components are presented in
Table 2.
0
10
20
30
0.000
0.010
0.020
0.030
0.040
Wed
get
ail
CP
I-1
47
23
5a
CP
I-1
47
28
0b
OK
72
11
54
2
11
95
5
CP
I-1
48
05
5
0.000
0.010
0.020
0.030
0.040
Sin
gle
gra
in w
eigh
t (g
)
0.000
0.010
0.020
0.030
0.040
Wed
get
ail
CP
I-1
47
23
5a
CP
I-1
47
28
0b
OK
72
11
54
2
11
95
5
CP
I-1
48
05
5
Gra
in n
um
ber
/ear
0
10
20
30
Wed
get
ail
CP
I-1
47
23
5a
CP
I-1
47
28
0b
OK
72
11
54
2
11
95
5
CP
I-1
48
05
5
0
10
20
30
(a) (d)
(b)
(c)
(e)
(f)

- 96 -
Fig.9. Above-ground dry matter (g) for dry-season water deficit plotted
against well-watered, for one annual wheat (Wedgetail), four perennial wheat
derivatives (CPI-147235a,CPI-147280b,OK7211542,11955), and one
perennial grass(CPI-148055) over four harvests: (a) DS2012 (after first dry
season regrowth at end of April 2012), (b) WS2012 (after second wet season
regrowth, December 2012 at the end of December 2012, (c) DS2013
(harvested after second dry season regrowth at end of April 2013) and (d)
WS2013 (harvested after third wet season regrowth at end of December
2013). In each case, DM under DS-WD is plotted against its equivalent DM
under WW in the same season, relative to the 1:1 line. The linear regression
between WD and WW is also shown, together with its statistical significance.
WW
0 5 10 15 20 25
WD
0
5
10
15
20
25DS-2012
y = 0.5682x + 2.5495
R2 = 0.6562 ; N = 9
WW
0 5 10 15 20 25
WD
0
5
10
15
20
25DS-2013
y = 0.1502x + 1.5495
R2 = 0.1465 ; N = 5
WW
0 50 100 150 200 250
WD
0
50
100
150
200
250WS-2013
y = -0.0796x + 102.19
R2 = 0.011; N = 9
WW
0 20 40 60 80 100
WD
0
20
40
60
80
100WS-2012
y = 0.5068x + 16.462
R2 = 0.6114 ; N = 15
(a) (b)
(d)(c)

- 97 -
Fig. 10. Within-season comparisons of regrowth generation and thus, above- and
below-ground dry matter production for the annual wheat Wedgetail, four
perennial wheat derivatives (CPI-147235a, CPI-14280b, OK7211542, 11955),
and one perennial grass (CPI-148055)over three consecutive wet seasons (2011–
13). Different generations are compared across planting times with the same
season and presented as (a) Sowing — May 2011,Harvest — December2011, (b)
Sowing — May 2012, Harvest — December, 2012,, (c) Sowing — May 2011,
Harvest — December 2012, (d)Sowing — May 2013,Harvest — December
2013, (e)Sowing — May 2012, Harvest — December 2013, , and (f )Sowing —
May 2011, Harvest — December 2013. LSDs for total above-ground dry matter
and total root dry matter were 44.42 and 6.65, respectively, at P=0.05.
Sowing- May, 2011
Harvest- Dec, 2012
Above ground
Below groundSowing- May, 2012
Harvest- Dec, 2012
Dry
mat
ter
(g/p
lan
t)
-50
0
50
100
150
200
Above ground
Below ground
Sowing-May, 2011
Harvest-Dec, 2013W
edget
ail
CP
I-1
47
23
5a
CP
I-1
47
28
0b
Ok
72
11
54
2
11
95
5
CP
I-1
48
05
5
Sowing-May, 2012
Harvest-Dec, 2013
Wed
get
ail
CP
I-1
47
23
5a
CP
I-1
47
28
0b
Ok
72
11
54
2
11
95
5
CP
I-1
48
05
5
Sowing-May, 2013
Harvest-Dec, 2013
Wed
get
ail
CP
I-1
47
23
5a
CP
I-1
47
28
0b
Ok
72
11
54
2
11
95
5
CP
I-1
48
05
5
Dry
mat
ter
(g/p
lan
t)
-50
0
50
100
150
200
Sowing- May, 2011
Harvest-Dec, 2011
-50
0
50
100
150
200
Above ground
Below ground
Dry
mat
ter
(g/p
lant)
Sowing- 1/5/2011
Harvest-1/12/2012
-50
0
50
100
150
200
Above ground
Below ground
Dry
mat
ter
(g/p
lant)
Wet
Sea
son
201
1W
et S
easo
n 2
01
2W
et S
easo
n 2
01
3
First Year Second Year Third Year
(a)
(b) (c)
(d) (e) (f)

- 98 -
4 Chapter 4
Source-sink manipulation on dry matter partitioning in
perennial wheat
Abstract
Resource allocation patterns were examined in source and sink manipulation
conditions in a controlled ambient Australian environment in two experiments. The
first experiment compared annual wheat against three-year-old perennial wheat
derivatives and perennial grass, and the second experiment compared annual wheat
against two-year-old perennial wheat derivatives and perennial grass. Resource
allocation priorities differed between annual and perennial growth habits over the
plant life span. For example, annual wheat contributed more resources towards seed
yield, while perennial wheat contributed more resources for the purpose of survival
in a summer or harsh winter climate. A change in source or sink demands within a
specific environment could lead to a change in resource allocation priorities. An
increase in average seed size compared to that under control conditions may have
resulted from a restriction in seed number, while a decrease in seed size could have
resulted from a source limitation observed in the perennial wheat derivative, CPI-
147235a. Alternatively, a smaller seed size and greater biomass may have been
correlated with a greater priority allocated to survival rather than grain yield in the
perennial grass, CPI-148055. This is explored for annual wheat, perennial wheat
derivatives and perennial grass in this chapter.
4.1 Introduction
Source-sink manipulation has been an important research topic because it may
lead to a better understanding of barriers to yield improvement (Fischer et al. 1977;
González et al. 2014). The extent to which plant productivity is determined by source

- 99 -
limitation (availability, or the capacity to generate photoassimilate by
photosynthesis), as opposed to sink limitation (allocation, or the potential capacity to
accumulate, store, or metabolise the photosynthetic products) is of continuing
research interest. Source and sink control are only appropriate terms within a certain
environment, and at a certain level of allocation; that is, a plant sink-limited at a
certain level of seed production, or within a specific environment, could become
source-limited at higher levels of seed production or under specific environmental
pressures (Flore and Layne 1999).The crop yield is the final balance between the
supplies of assimilate (source) and the capacity of using available assimilates for
grain development (sink). Any changes to the source or sink or their interactions
changes the source-sink balance in plants and thus can influence crop yield.
Assimilates are carbohydrates and sugars that are used in grain filling, and are
produced by photosynthetic activities by functional green areas of the plants. On the
other hand, grain number and their potential size determine the sink strength of the
plant.
Source or sink limitation may be correlated with resource levels (Shipley 2002)
or life forms (like trees, shrubs, grasses) as a function of annual or perennial life
history (Marañón and Grubb 1993). Sink-limitation may be more pronounced in
perennials than annuals due to longer periods available for resource accumulation
and more conservative reproductive strategies (Masnatta and Ravetta 2011).
Alternatively, Arp (1991) hypothesised that the presence of larger vegetative sinks in
perennials could make them more source-limited than similar annuals. In a study
with perennial rye (Secale cereale × Secale strictum (C. Presl) C. Presl subsp.
strictum (syn. Secale montanum Guss.)) forages, perennial wheat derivatives
(Triticum aestivum L. × Thinopyrum elongatum (Host) D. R. Dewey), and their

- 100 -
annual analogues, Jaikumar et al. (2014) reported interactions between life history
and source-sink dynamics.
Studies of source and sink manipulation require modifying the plant’s ability to
produce, or use, photosynthate, by altering source and sink capacity, for example, in
woody perennials such as cherry (Prunus cerasus L. and Prunus avium (L.) L.) (Flore
and Layne 1999), in maize crops (Zea mays L.), soybean (Glycine max L.) and wheat
(Triticum aestivum) (Borrás et al. 2004), annual wheat (Fischer and Wilson 1975),
and perennial wheat (Jaikumar et al. 2014). Various studies with annual wheat
identified different limitations in different situations: a sink constraint in the
vegetative periods (Harrison et al. 2010), a source limitation immediately prior to
anthesis (Amthor 2001), and co-limitations throughout grain filling particularly in
modern cultivars (Borrás et al. 2004). Cruz-Aguado et al. (1999) reported that
carbohydrate concentration at anthesis determined whether wheat was source- or
sink-limited, and that this affected the number of florets fertilised, with plants only
fertilising and retaining those florets they could easily fill. Yield potential in
perennial wheat was only 50–70 % of that of annual wheat (Murphy et al. 2010;
Jaikumar et al. 2012). Nevertheless, source-sink balance might be different in
perennial wheat that requires contributions of assimilate to fodder for livestock,
residual biomass for improved ground cover against soil erosion, and improved
water balance against salinity (Angus et al. 2001; Bell et al. 2010; Glover et al.
2010). However, incorporating foreign chromatin from perennial genomes such as
Thinopyrum elongatum may decrease sink capacity and other agronomic
characteristics, relative to an annual wheat plant type, at least in the short term
(Reynolds et al. 2001). In a field study, Jaikumar et al. (2014) compared perennial
wheat and perennial rye with their annual analogues over one year, and measured
changes in the source-sink balance of shoots manipulated in terms of carbohydrate

- 101 -
pools (comprised of starch, soluble fructans, insoluble fructans, sucrose, glucose, and
fructose), regrowth ability, and changes in grain size. They concluded that perennial
wheat was sink-limited for grain filling in all cases. Jaikumar et al. (2014) found that
perennial cereals functioned below their maximum photosynthetic capacity, and that
regrowth in the next season was not affected by the source–sink balance. Jaikumar et
al. (2014) worked with perennials within the first year of plant growth and did not
measure the roots. Hence, further studies of the source-sink balance are required at
the whole plant level, particularly investigating the role of roots as an alternate sink
over a duration of more than one year. Such studies may examine source-sink
manipulation and patterns of resource allocation as affected by life history, or growth
habit, using replanted annual wheat and the regrowth of perennial wheat derivatives
and perennial grass.
Consequently, in this study, source (partial shading) and sink (removal of some
spikelets) were manipulated to examine patterns of resource availability and
allocation in an annual wheat, four perennial wheat derivatives, and a perennial
grass, under well-watered conditions. Presumably, the perennials must invest in
vegetative structures for regrowth in the next year, so the priority of the ear as a sink
may be reduced, and this may be exacerbated under stress. Likewise, when the grain
sink is limited, perennials may prioritise sinks for regrowth, whilst annuals may
promote later tillers for grain production. Such a study should provide information
about how life history affects the prioritisation of resource allocation in annual
wheat, perennial wheat derivatives and perennial grass, which has implications for
perennial wheat improvement under different environmental and managerial regimes,
and for different products.

- 102 -
The study reported here was designed to: a) determine how the resource
allocation patterns changed with source limitation (shading), sink limitation (spikelet
trimming from one side of the ear ), and source and sink limitation (both) in the
patterns of dry matter production and partitioning of ‘Wedgetail’annual wheat
cultivar, perennial wheatgrass species and perennial wheat derivatives under well-
watered conditions; and b) assist in understanding the differences in sink priority
among annuals and perennials, particularly differences in the prioritisation of dry
matter allocation to fill grain versus the investment in regenerative structures, and
how this may change under stress. The implications for perennial wheat breeding are
discussed including grain and fodder considerations.
4.2 Materials and methods
This study comprised two experiments, conducted in soil columns in the
screen-house at Charles Sturt University, Wagga Wagga, New South Wales (latitude:
35.05°S, longitude: 147.35
°E, elevation: 219 m) using the same experimental set-up
as described previously (Chapter 3, Section 3.2).
4.2.1 Experiment 1
4.2.1.1 Experimental design
The experiment was laid out in a split-plot design, with six genotypes used in
Chapter 3 replicated three times as the experimental unit. As in Chapter 3, the soil
columns were sown on 7 May 2011. Checking for dead plants at three years of plant
age in the third wet season 2013 was done after the perennial entries had survived
two wet seasons and two dry seasons. During this time, more missing genotypes in
different treatments were observed. Younger perennial plants were not used in this
study, since they can have a higher allocation of resources to root growth, which

- 103 -
might affect resource allocation and source-sink balance. Three representative
genotypes including an annual wheat (Wedgetail), perennial wheat derivative (CPI-
147235a) and a perennial grass genotype (CPI-148055) were available for this study,
and treatments were imposed during the third wet season from the remaining plants.
The annual wheat, Wedgetail, was replanted on 5 May 2012 and 8 May 2013, as in
Chapter 3 and maintained with similar management as perennial wheat derivatives
and perennial grass to create similar cropping soil. Again, at the end of each season,
the perennial wheat and perennial grass plants were cut back leaving 8–10 cm plant
height to allow regrowth in the following seasons. Crop management was as
described for the well-watered treatment in Chapter 3.
4.2.1.2 Treatments
Four source-sink manipulation treatments were imposed: control, source
limitation, sink limitation, and both source and sink limitation. These treatments
were imposed from spike emergence until physiological maturity in the third wet
season, under well-watered conditions. The details are as follows:
a. Control
Well-watered controls were maintained for comparison with the other
treatments.
b. Source limitation
At spike emergence, shade cloth was used to reduce incoming
photosynthetically active radiation (PAR) by approximately 70% relative to the
control treatment. Care was taken in establishing the supporting framework to ensure
air circulation in the canopy was adequate.

- 104 -
c. Sink limitation
At spike emergence, spikelets were removed from one side of each ear, as they
emerged from the flag leaf. This treatment reduced potential spikelet number to half
of that of the control, for each genotype.
d. Both source and sink limitation
This treatment simultaneously received both source and sink limitations. At
spike emergence, soil columns were transferred to the shade, and half of the spikelets
were removed, as described above.
4.2.1.3 Measurements
Regular observations for phenological development were recorded for
flowering, plant height, tiller number, and ear number. Plants were harvested at
maturity and the single seed mass measured as described in Chapter 3 Section 3.4.2;
shoots separated into crown, leaf plus stem, spike and grain; roots separated into
10 cm depth increments; and the dry weights were recorded.
4.2.2 Experiment 2
Because a number of perennial plants died in Experiment 1, reducing the
number of soil columns with perennial plants available for sampling, the experiment
was repeated with additional genotypes, and with additional measurements. Three
replicates of twelve genotypes were planted in Experiment 2 (Table 1), but again,
there was considerable plant death, with sufficient plants remaining for only two
replicates of five genotypes. In addition, there were two missing columns for Ot-38,
which were allocated to the both treatment. There were no spare columns available
for any additional sampling. A hot summer and harsh dry weather prevailing at the
site (Chapter 3; Fig. 1) contributed to lower survival.

- 105 -
4.2.2.1 Experimental design
The experiment was laid out in a split-plot design, with twelve genotypes
replicated three times as the experimental unit. In this case, the soil columns were
sown on 8 May 2013, and treatments were imposed during the second wet season,
after the perennial entries had survived one wet season and one dry season. The
annual wheat, Wedgetail, was replanted on 5 May 2014. At the end of each season,
the plants were maintained following cultural management as described for the well-
watered treatment in Chapter 3.4.1 to 3.4.2.
4.2.2.2 Genotypes
Twelve genotypes were selected for the repeat experiment, including one
annual wheat, six perennial wheat derivatives, and five perennial grasses. These
genotypes were chosen based on survival, regrowth and yield contribution in field
evaluations at Cowra and Woodstock in New South Wales (Hayes et al. 2012; Larkin
et al. 2014). In addition, the genotypes were chosen such that each perennial wheat
derivative had a representative for its annual wheat and its perennial grass parent in
the list. Accordingly, perennial wheat derivatives of increasing genomic and
cytogenetic complexity were selected, from CPI-147235a to OT-38, to OK72. In
addition, a cross with Triticum durum instead of Triticum aestivum was also
represented. Further details are presented in Table 1.
4.2.2.3 Measuring carbohydrate using BRIX
On each sampling occasion, one tiller (the primary tiller) was cut at ground
level and placed into a zip lock plastic bag (on ice in an esky), and taken to the
laboratory. Leaves were removed from the sampled tiller and the stem separated at
each node. Each internode was then squeezed separately using a garlic press to
extract the sap. The sap samples were measured with a handheld BRIX refractometer
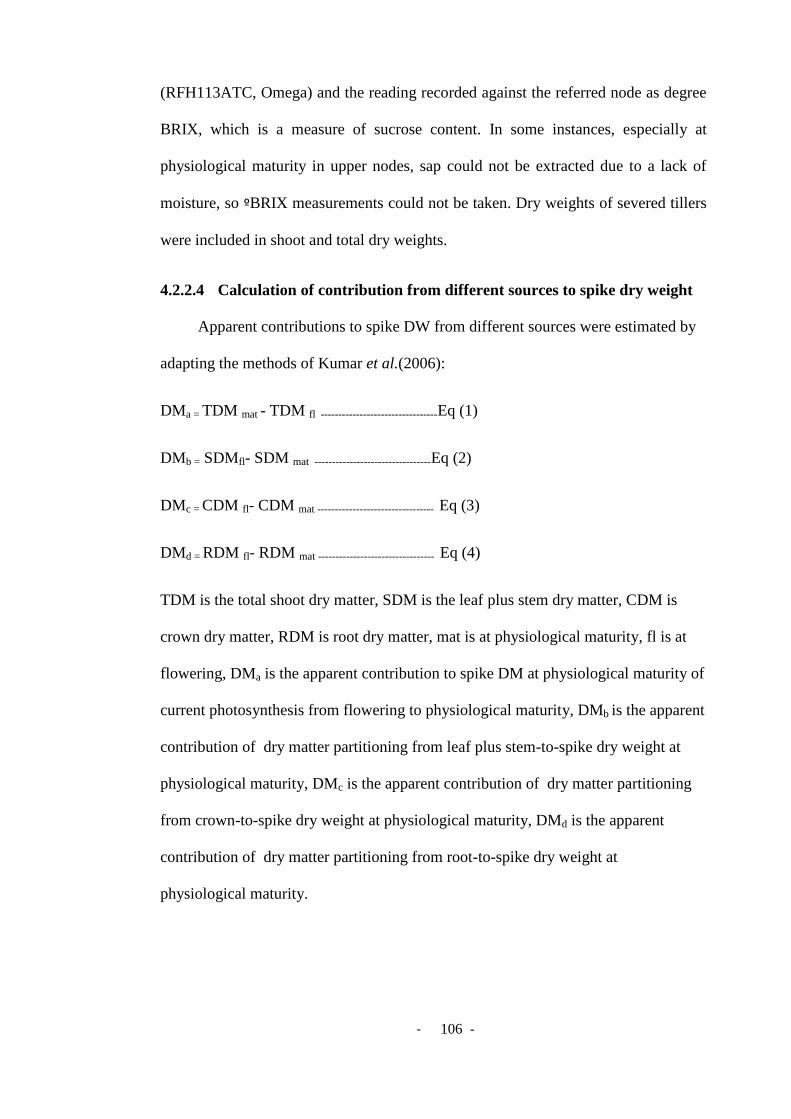
- 106 -
(RFH113ATC, Omega) and the reading recorded against the referred node as degree
BRIX, which is a measure of sucrose content. In some instances, especially at
physiological maturity in upper nodes, sap could not be extracted due to a lack of
moisture, so ºBRIX measurements could not be taken. Dry weights of severed tillers
were included in shoot and total dry weights.
4.2.2.4 Calculation of contribution from different sources to spike dry weight
Apparent contributions to spike DW from different sources were estimated by
adapting the methods of Kumar et al.(2006):
DMa = TDM mat - TDM fl ---------------------------------Eq (1)
DMb = SDMfl- SDM mat ---------------------------------Eq (2)
DMc = CDM fl- CDM mat --------------------------------- Eq (3)
DMd = RDM fl- RDM mat --------------------------------- Eq (4)
TDM is the total shoot dry matter, SDM is the leaf plus stem dry matter, CDM is
crown dry matter, RDM is root dry matter, mat is at physiological maturity, fl is at
flowering, DMa is the apparent contribution to spike DM at physiological maturity of
current photosynthesis from flowering to physiological maturity, DMb is the apparent
contribution of dry matter partitioning from leaf plus stem-to-spike dry weight at
physiological maturity, DMc is the apparent contribution of dry matter partitioning
from crown-to-spike dry weight at physiological maturity, DMd is the apparent
contribution of dry matter partitioning from root-to-spike dry weight at
physiological maturity.

- 107 -
Measured values of spike dry weight were then compared with estimates from:
Current photosynthesis (DMa) --------------------------------- Eq (5),
Current photosynthesis + leaf stem redistribution (DMab) -------------------------Eq (6),
Current photosynthesis + leaf stem + crown redistribution (DMabc) ---------Eq (7),
Current photosynthesis + leaf stem + crown + root redistribution (DMabcd) ----Eq (8)
4.2.3 Statistical analysis
A split-plot design was used in this experiment, where genotypes was the main
plot and source-sink manipulation was the sub-plot. To conduct analysis of variance
(ANOVA) for different sampling occasions, source-sink manipulation was tested
against main plot error as genotypes, and genotype and its interaction with source-
sink manipulation were tested against the residual error. Least Significant
Differences (P<0.05) were calculated to examine statistical significance among
treatments, genotypes and their interaction. Statistical analysis was conducted using
Genstat 16th
edition (GenStat® for Windows10.0, VSN Int. Ltd, UK, 2013). The
figures were drawn using Sigmaplot 10 software. Regressions were obtained using
Microsoft Excel.
4.3 Results
4.3.1 Experiment 1
4.3.1.1 Maximum and minimum temperature and rainfall at the experimental
site
Maximum and minimum temperature and rainfall are shown in Fig. 1 for the
additional period (2013–14) in addition to in Chapter 3 Fig.1 and 2 for Experiment 1.

- 108 -
The temperature varied from 44 C to -5 C. The hot and dry summer was observed in
the month of January in 2012 during the experimental period.
4.3.1.2 Summary of ANOVA
Treatment was a significant source of variation for days to flowering, and the
yield components only (Table 2). While grain weight, grain number and harvest
index were largest in the control treatment, single grain weight was largest in the sink
treatment. Genotype was a significant source of variation for all traits except plant
height. In general, the perennial grass, CPI-148055,had the highest values for many
growth parameters such as days to flowering, tiller and ear number, and biomass of
most plant components. The perennial wheat, CPI-147235a, had the highest stem dry
weight and grain number per plant, while Wedgetail had the highest spike dry
weight, grain weight, single grain weight and harvest index. The interactions
between treatment and genotype were significant for tiller number, spike dry weight
and the yield components, as examined below.
4.3.1.3 Flowering days and plant height
Genotypes differed significantly in time to flowering, from 140 days in
Wedgetail to 172 days in CPI-147235a and 214 days in CPI-148055 (Table 2).
Flowering occurred 14 days earlier in the Sink treatment with half of the spikelet
removal. Plant height averaged 100 cm and did not vary significantly among the
genotypes. Although Wedgetail was 9 cm shorter and CPI-148055 was 5 cm taller,
these differences were not significant for plant height.
4.3.1.4 Number of tillers/plant and number of ears/plant
Tiller number per plant differed significantly with genotype, and in its
interaction with treatment (Fig. 2). In the control treatment, Wedgetail, CPI-147235a

- 109 -
and CPI-148055 had 15, 40 and 130 tillers per plant, respectively. In CPI-148055,
tiller number tended to increase under sink limitation, but decreased significantly
under source limitation. While a similar pattern was expressed in CPI-147235a, it
was non-significant, as was also found in Wedgetail, whose tiller number remained
stable. Ear number per plant was the same across treatments, but genotypes differed
with Wedgetail, CPI-147235a and CPI-148055 averaging about 14, 27 and 46 ears
per plant, respectively. Genotypes differed strongly in the proportion of their tillers
forming ears, with Wedgetail at 92%, CPI-147235a at 60%, and CPI-148055 at only
37%.
4.3.1.5 Number of grains per plant and single grain weight
In Wedgetail and the perennial wheat derivative (CPI-147235a), grain number
per plant was significantly reduced (about halved) by source limitation, and more
severely reduced (about quartered) by sink limitation, although these differences
were not significant in CPI-148055, which had very few filled grains per plant
(Fig. 5). In Wedgetail and CPI-147235a, the combination of both source and sink
limitation resulted in similar grain numbers to source limitation alone. In the control
treatment, CPI-147235a had 500 grains per plant, Wedgetail had 270 grains per
plant, and CPI-148055 had only 27 grains per plant.
For single grain weight in Wedgetail and CPI-147235a (Fig. 5), source
limitation significantly decreased grain size, but a sink limitation significantly
increased it, with both limitations combined being intermediate. Grain size was very
small and unresponsive in CPI-148055. In the control treatment, genotypes differed
significantly in mean grain weight, from about 4 mg in CPI-148055 to 20 mg in CPI-
147235a to 36 mg in Wedgetail.

- 110 -
4.3.1.6 Grain weight per plant and harvest index
Under control conditions, Wedgetail and CPI-147235a contributed grain
weights of about 9 and 10 g per plant, respectively, while CPI-148055 yielded only
0.1 g per plant (Fig. 4). The source-sink limitations reduced grain weight per plant
significantly in Wedgetail and CPI-147235a, but not in CPI-148055. The reduction
tended to be less under sink limitation alone, but this did not differ significantly from
source and both source and sink limitations. In combination, grain weight per plant
was low and unresponsive in CPI-148055.
Under control conditions (Fig. 4), the harvest index was 20% in Wedgetail,
which was significantly greater than in CPI-147235a and CPI-148055, with harvest
indices of 8% and 7%, respectively. Source-sink limitations significantly reduced the
harvest index only in Wedgetail, halving it under sink limitation, and reducing it
further under source limitation, with both resulting in an intermediate response.
Reductions in the harvest index were non-significant for the limitation treatments in
CPI-147235a and CPI-148055.
4.3.1.7 Dry matter partitioning
Genotypes differed significantly in their biomass allocation (Fig. 3), but
source–sink treatment had no significant effect and the interaction between genotype
and treatment was also non-significant, except for spike dry weight. Unfortunately,
the significant interaction for spike dry weight was mainly due to bird damage,
which affected spike dry weight in Wedgetail under control and sink limitations,
despite the efforts with netting and ear bagging. In contrast, shade cloth proved an
effective barrier to birds for Wedgetail, in the shade and both treatments. In the
absence of bird damage, presumably the control would have significantly exceeded
the limitation treatments in spike dry weight in Wedgetail, as it had in CPI-147235a.

- 111 -
In contrast, CPI-148055 was non-responsive, and the treatments did not differ
significantly.
CPI-148055 had a significantly greater total dry weight, root dry weight, leaf dry
weight and crown dry weight per plant than the other genotypes (Table 2). CPI-
147235a had a significantly greater stem dry weight, and was similar to CPI-148055
in having a significantly higher shoot dry weight than Wedgetail. Wedgetail and CPI-
147235a both had significantly greater spike dry weights than CPI-148055.
4.3.2 Experiment 2
4.3.2.1 Meteorological data
Fig. 1 shows the meteorological condition for Experiment 2 (2012–14) for the
additional period (2013–14), with an overlapping experimental period in the same
site as Experiment 1 (climate data was presented for 2011–13 in Chapter 3 Fig.2 in
this thesis), with Fig. 1b showing the comparison between ambient and shade
conditions, and Fig. 1c showing the long-term means for ambient conditions.
4.3.2.2 Plant growth
Table 3 shows that the source-sink treatments had no effect on plant growth
and dry matter partitioning characteristics, but genotype had a statistically significant
effect (P<0.05) on plant height, numbers of tillers and ears per plant, and shoot and
root dry weight. The five genotypes averaged 216 days to flowering. The perennial
wheat derivatives, CPI-147235a and OT-38, were 35 cm taller than Wedgetail and
the two perennial grasses (Thinopyrum elongatum and CPI-148055). CPI-148055
had the most tillers, but fewest spikes per plant. The perennial grasses had
significantly lower shoot dry weights, but significantly higher root dry weights than
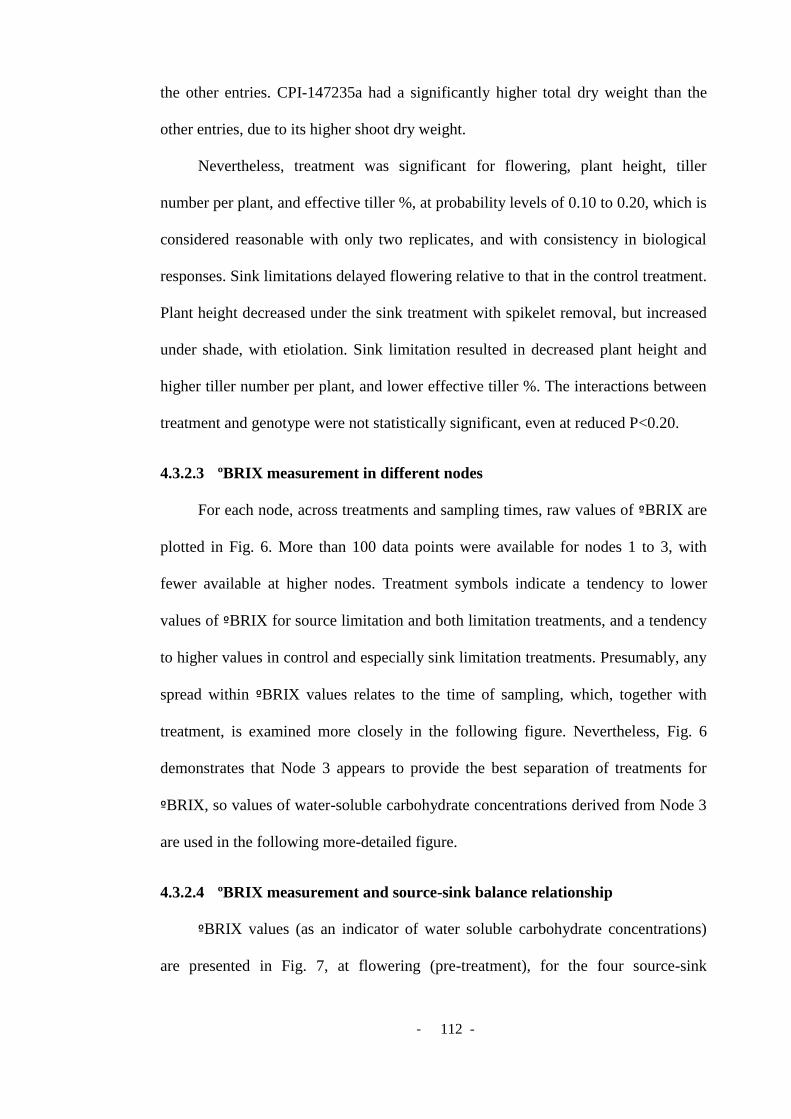
- 112 -
the other entries. CPI-147235a had a significantly higher total dry weight than the
other entries, due to its higher shoot dry weight.
Nevertheless, treatment was significant for flowering, plant height, tiller
number per plant, and effective tiller %, at probability levels of 0.10 to 0.20, which is
considered reasonable with only two replicates, and with consistency in biological
responses. Sink limitations delayed flowering relative to that in the control treatment.
Plant height decreased under the sink treatment with spikelet removal, but increased
under shade, with etiolation. Sink limitation resulted in decreased plant height and
higher tiller number per plant, and lower effective tiller %. The interactions between
treatment and genotype were not statistically significant, even at reduced P<0.20.
4.3.2.3 ºBRIX measurement in different nodes
For each node, across treatments and sampling times, raw values of ºBRIX are
plotted in Fig. 6. More than 100 data points were available for nodes 1 to 3, with
fewer available at higher nodes. Treatment symbols indicate a tendency to lower
values of ºBRIX for source limitation and both limitation treatments, and a tendency
to higher values in control and especially sink limitation treatments. Presumably, any
spread within ºBRIX values relates to the time of sampling, which, together with
treatment, is examined more closely in the following figure. Nevertheless, Fig. 6
demonstrates that Node 3 appears to provide the best separation of treatments for
ºBRIX, so values of water-soluble carbohydrate concentrations derived from Node 3
are used in the following more-detailed figure.
4.3.2.4 ºBRIX measurement and source-sink balance relationship
ºBRIX values (as an indicator of water soluble carbohydrate concentrations)
are presented in Fig. 7, at flowering (pre-treatment), for the four source-sink

- 113 -
limitation treatments, at 10 days after flowering, and at maturity, for the mean and
five individual genotypes.
At flowering, reference values of BRIX were 30 in Thinopyrum intermedium
CPI-148055 and its perennial wheat derivative Ot-38, and slightly lower at 24 in
Thinopyrum elongatum and its perennial wheat derivative CPI-147235a.
Unfortunately, no reference value at flowering was available for the Wedgetail
annual wheat.
Values of ºBRIX tended to be maintained in the control treatment, and were
maintained or even slightly increased under the sink limitation treatment. ºBRIX was
lower in the both limitation treatment, and in the source limitation treatment when
Thinopyrum intermedium was present. ºBRIX was slightly lower at maturity than at
10 days after flowering. Values of ºBRIX were low in Wedgetail in the control,
perhaps as a result of bird damage. Assuming Wedgetail’s value in control should
have been higher, it followed a similar pattern across treatments to other entries, but
at lower values of ºBRIX throughout. This needs to be properly tested.
4.3.2.5 Contribution to spike dry weight from different sources
The results on apparent contribution of different sources of assimilates to spike
dry weight have been presented in Fig 8. For Wedgetail, CPI-147235a and T.
elongatum, DMabcd (current + leaf/stem + crown + roots) may have been the best
predictor of spike DW, while for OT-38 and T. intermedium CPI-148055, the best
predictors seem to have been DMab and DMabc, respectively (i.e. without roots).
Importantly, the best predictor’s forCPI-148055, OT-38 and T. elongatum fell on the
1:1 line, but 235a was slightly lower and parallel, while Wedgetail was also parallel
but much lower, perhaps due to investment in spike structure.

- 114 -
4.4 Discussion
4.4.1 Resource allocation pattern changes in source-sink manipulation
In our experiment annual wheat showed lower stem dry matter at maturity in
the source limitation treatment and in both the source and sink limitation treatment
condition than under control conditions. Demand by the grain was controlled by
stem reserve mobilisation (Madani et al. 2010). Stored excess carbohydrate in stem
tissues could protect against source-sink interactions throughout the life span and in
varied environmental conditions in grasses (Ruuska et al. 2006). In annual wheat,
carbohydrate was stored in stem progressively until the rapid grain filling stage when
this reserve partitioned to the grain development (Ruuska et al. 2006).The trend
observed in annual wheat is consistent with that in the previous literature, which has
found that shading promoted the use of stem reserves in barley plants for grain filling
(Bonnett and Incoll 1993). In wheat, each gram of assimilates from stem
remobilisation has been reported to produce 0.93 grams of grain (Gent 1994).
Previous research comparing annual wheat to perennial wheat by Jaikumar et al.
(2014) found evidence of annual wheat being co-limited (little change in seed mass
to changes in source : sink balance), and similar findings were reported by other
researchers (Borrás et al. 2004; Reynolds et al. 2005; Alvaro et al. 2008).
In this experiment, sink strength was manipulated through removal of the
spikelets from one side of the ear, and this might also reduce source strength by
reducing green parts of spikelets. However, the small reduction in green parts might
have a negligible impact on current photosynthesis when compared to total area of
green plants and their contribution to grain growth. A contribution of 35% of
growing grain requirement was potentially supplied by spike photosynthesis (Evans
and Rawson 1970). Thus, the trimming of spikelets of one side of the ear might

- 115 -
effectively increase the assimilate availability for the remaining grains. A shading
treatment investigated the effect of reducing incident sunlight by ~70% from control
conditions to manipulate the source and evaluated the effect of reducing assimilate
supply from photosynthesis, as well as the redistribution of assimilates and
carbohydrates and sugars on grain yield and total dry matter partitioning for
perennial wheat and perennial grass (and compared the effects to those for annual
wheat). These two techniques were combined to manipulate the source and sink and
termed as source and sink manipulation for this experiment.
Source and sink balance when manipulated by shading during grain filling
causes source limitation, and thus increased demand from the growing kernels
primarily dependent on stem and spike reserves for a source of carbon to support the
grain filling process. Shade cloth used in this study reduced light by 70%, so
photosynthesis would be limited compared to under unshaded conditions.
McCormick et al. (2006) found reductions of total sucrose in a study investigating
the relationship between photosynthetic source tissue and shading in sugarcane
(Saccharum spp.) by using a black sleeve constructed from 90% shade cloth.
4.4.2 Sink priority differences in source-sink manipulation
Carbohydrate partitioning in whole plants is dependent on the nature of the
plant life cycle (Thompson and Stewart 1981). Annual grain plants use all of their
reserve carbohydrates for viable seed production as they only have one chance of
reproduction before their life cycle ends. However, perennials store carbohydrates in
stems, roots, and rhizomes for regrowth in the following season. Sugarcane, a
perennial grass, has high concentrations of stored carbohydrates in stems and
rhizomes(Matsuoka and Garcia 2011). The photosynthetic rate in sugarcane species
has also been found to be inversely related to the sucrose accumulation (Irvine 1975;

- 116 -
Pollock et al. 2003). Thus, carbohydrate partitioning patterns depends on the growth
habits and life spans of annual and perennial plants.
In our study, perennial wheat showed evidence of being less sensitive to source
limitation than annual wheat as indicated by there being little reduction in stem dry
weight compared in the control plants. Increased seed mass in sink manipulation
revealed that the perennial wheat was sink-limited. This finding of sink limitation in
perennial wheat has also been reported by previous studies (Jaikumar et al. 2014).
The mechanism by which perennial wheat met the increased sink demand might be
explained by translocation of more reserves from stem and leaf to support grain
growth. We observed a greater degree of changes in these components compared in
the control plants and longer lived green leaves in association with showing less
midday depression.
We found a higher root allocation in perennial grass and this confirmed the
existence of a secondary sink and showed evidence of a response to the source:sink
changes. Perennial grass showed little change in seed mass and more root allocation
in sink manipulation as a physiological response to changes in the source:sink
manipulation in a similar direction in larger effects. Continued regrowth of new
tillers and leaves in perennial grass might be involved in maintaining reproductive
allocation at lower levels using large carbohydrate reserves. This conservative
resource allocation strategy might promote survival under different environmental
conditions in perennials and thus longer life spans. Perennials maximise efficiency
by maintaining larger reserves in roots, and supporting survival over longer life
spans. Although in early stages of development annuals and perennials have similar
root shoot ratios; perennials differ from congeneric annuals by allocating energy to
roots at later ontogenetic stages (Garnier 1992). Root allocation varied among

- 117 -
perennials and perennial grass had the highest root allocation amongst the perennials
(Larkin et al. 2014). These patterns were found to exist in the case of annual wheat,
and perennial wheat and perennial grass in this study.
The extent of dry matter partitioning was lower for annual wheat and perennial
wheat derivatives from the actual redistribution in Experiment 2 (Fig. 11) in source-
sink manipulation conditions. The results of the contribution of dry matter
redistribution patterns in annual wheat compared with perennial wheat and perennial
grass in source-sink manipulations was found to contribute to spike dry weight in the
perennial grasses and one of the perennial wheat derivatives, OT-38. Partitioning of
dry matter used in the adaptation of rainfed lowland rice explained the redistribution
patterns under drought stress, as reported by Kumar et al. (2006).
4.5 Conclusion
Perennial wheat derivatives and perennial grass showed more sink limitation
than annual wheat and demonstrated compensatory responses in their seed size and
root growth in relation to changes in the source-sink balance. Perennial grass showed
no substantial change in biomass in response to sink manipulation. Resource
allocation towards root growth and a failure to produce grain were more important
for survival and persistence in perennial grass.

- 118 -
4.6 References
Alvaro F, Royo C, García del Moral L, Villegas D (2008) Grain filling and dry
matter translocation responses to source–sink modifications in a historical
series of durum wheat. Crop Science 48, 1523-1531.
Amthor JS (2001) Effects of atmospheric CO 2 concentration on wheat yield: review
of results from experiments using various approaches to control CO 2
concentration. Field Crops Research 73, 1-34.
Angus J, Kirkegaard J, Peoples M (2001) Rotation, sequence and phase: research on
crop and pasture systems. In 'Proceedings of the 10th Australian Society of
Agronomy Conference, Hobart'
Armstrong J, Stevenson T (1947) The effects of continuous line selection in
Triticum-Agropyron hybrids. Empire J Exp Agric 15, 51-64.
Arp W (1991) Effects of source‐sink relations on photosynthetic acclimation to
elevated CO2. Plant, Cell & Environment 14, 869-875.
Banks P, Xu S, Wang R-C, Larkin P (1993) Varying chromosome composition of
56-chromosome wheat× Thinopyrum intermedium partial amphiploids.
Genome 36, 207-215.
Bell L, Wade LJ, Ewing MA (2010) Perennial wheat: a review of environmental and
agronomic prospects for development in Australia. Crop and Pasture Science
61, 679-690.
Bonnett G, Incoll L (1993) Effects on the Stem of Winter Barley of Manipulating the
Source and Sink during Grain-filling I. CHANGES IN ACCUMULATION
AND LOSS OF MASS FROM INTERNODES. Journal of Experimental
Botany 44, 75-82.
Borrás L, Slafer GA, Otegui MaE (2004) Seed dry weight response to source–sink
manipulations in wheat, maize and soybean: a quantitative reappraisal. Field
Crops Research 86, 131-146.
Cruz-Aguado JA, Reyes F, Rodes R, Perez I, Dorado M (1999) Effect of Source-to-
sink Ratio on Partitioning of Dry Matter and14C-photoassimilates in Wheat
during Grain Filling. Annals of Botany 83, 655-665.
Evans L, Rawson H (1970) Photosynthesis and Respiration by the Flag Leaf and
Components of the Ear During Grain Development In Wheat. Australian
Journal of Biological Sciences 23, 245-254.
Fischer K, Wilson G (1975) Studies of grain production in <I>Sorghum bicolor</I>
(L. Moench). IV.* Some effects of increasing and decreasing photosynthesis
at different stages of the plant's development on the storage capacity of the
inflorescence. Australian Journal of Agricultural Research 26, 25-30.
Fischer R, Aguilar I, Laing D (1977) Post-anthesis sink size in a high-yielding dwarf
wheat: yield response to grain number. Crop and Pasture Science 28, 165-
175.
Flore J, Layne DR (1999) Photoassimilate production and distribution in cherry.
HortScience 34, 1015-1019.
Garnier E (1992) Growth analysis of congeneric annual and perennial grass species.
Journal of Ecology, 665-675.
Gent MP (1994) Photosynthate reserves during grain filling in winter wheat.
Agronomy Journal 86, 159-167.
Glover J, Reganold J, Bell L, Borevitz J, Buckler E, Cox C, Cox S, Crews T, Culman
S, DeHaan L (2010) Increasing Food and Ecosystem Security through
Perennial Grain Breeding. Journal Title 2010, 06-24.

- 119 -
González FG, Aldabe ML, Terrile II, Rondanini DP (2014) Grain Weight Response
to Different Postflowering Source: Sink Ratios in Modern High-Yielding
Argentinean Wheats Differing in Spike Fruiting Efficiency. Crop Science 54,
297-309.
Harrison MT, Kelman WM, Moore AD, Evans JR (2010) Grazing winter wheat
relieves plant water stress and transiently enhances photosynthesis.
Functional Plant Biology 37, 726-736.
Hayes RC, Newell MT, DeHaan LR, Murphy KM, Crane S, Norton MR, Wade LJ,
Newberry M, Fahim M, Jones SS, Cox TS, Larkin PJ (2012) Perennial cereal
crops: An initial evaluation of wheat derivatives. Field Crops Research 133,
68-89.
Irvine JE (1975) Relations of photosynthetic rates and leaf and canopy characters to
sugarcane yield. Crop Science 15, 671-676.
Jaikumar NS, Snapp SS, Murphy K, Jones SS (2012) Agronomic Assessment of
Perennial Wheat and Perennial Rye as Cereal Crops. Agronomy Journal 104,
1716-1726.
Jaikumar NS, Snapp SS, Flore JA, Loescher W (2014) Photosynthetic Responses in
Annual Rye, Perennial Wheat, and Perennial Rye Subjected to Modest
Source:Sink Ratio Changes. Crop Sci.54, 274-283.
Jenkins BC, Mochizuki A (1957) 'A new amphiploid from a cross between Triticum
durum and Agropyron elongatum (2n.'
Larkin PJ, Newell MT, Hayes RC, Aktar J, Norton MR, Moroni SJ, Wade LJ (2014)
Progress in developing perennial wheats for grain and grazing. Crop and
Pasture Science 65 1147-1164.
Madani A, Rad AS, Pazoki A, Nourmohammadi G, Zarghami R (2010) Wheat
(Triticum aestivum L.) grain filling and dry matter partitioning responses to
source: sink modifications under postanthesis water and nitrogen deficiency.
Acta Scientiarum. Agronomy 32, 145-151.
Marañón T, Grubb PJ (1993) Physiological basis and ecological significance of the
seed size and relative growth rate relationship in Mediterranean annuals.
Functional Ecology, 591-599.
Masnatta W, Ravetta D (2011) Seed-yield and yield components response to source–
sink ratio in annual and perennial species of< i>
Lesquerella</i>(Brassicaceae). Industrial Crops and Products 34, 1393-
1398.
Matsuoka S, Garcia AAF (2011) Sugarcane underground organs: going deep for
sustainable production. Tropical Plant Biology 4, 22-30.
Mujeeb-Kazi A, Cortes A, Gul A, Farooq M, Majeed F, Ahmad I, Bux H, William
M, Rosas V, Delgad R (2008) Production and cytogenetics of a new
Thinopyrum elongatum/Triticum aestivum hybrid, its amphiploid and
backcross derivatives. Pak. J. Bot 40, 565-579.
Murphy K, Lyon SR, Balow KA, Jones SS (2010) Post-sexual cycle regrowth and
grain yield in Thinopyrum elongatum × Triticum aestivum amphiploids.
Plant Breeding 129, 480-483.
Oram R, Schroeder H (1992) Phalaris aquatica L.(phalaris) cv. Holdfast. Animal
Production Science 32, 261-262.
Pollock C, Farrar J, Tomos D, Gallagher J, Lu C, Koroleva O (2003) Balancing
supply and demand: the spatial regulation of carbon metabolism in grass and
cereal leaves. Journal of Experimental Botany 54, 489-494.

- 120 -
Reynolds M, Calderini D, Condon A, Rajaram S (2001) Physiological basis of yield
gains in wheat associated with the LR19 translocation from Agropyron
elongatum. In 'Wheat in a Global Environment' pp. 345-351. (Springer).
Reynolds M, Pellegrineschi A, Skovmand B (2005) Sink‐limitation to yield and
biomass: a summary of some investigations in spring wheat. Annals of
Applied Biology 146, 39-49.
Ruuska SA, Rebetzke GJ, van Herwaarden AF, Richards RA, Fettell NA, Tabe L,
Jenkins CL (2006) Genotypic variation in water-soluble carbohydrate
accumulation in wheat. Functional Plant Biology 33, 799-809.
Sando W (1935) HYBRIDS OF WHEAT, RYE, AEGILOPS AND HAYNALDIA A
Series of 122 Intra-and Inter-Generic Hybrids Shows Wide Variations in
Fertility. Journal of Heredity 26, 229-232.
Shipley B (2002) Trade‐offs between net assimilation rate and specific leaf area in
determining relative growth rate: relationship with daily irradiance.
Functional Ecology 16, 682-689.
Thompson K, Stewart A (1981) The measurement and meaning of reproductive
effort in plants. American Naturalist, 205-211.
Van Tassel DL, DeHaan LR, Cox TS (2010) Missing domesticated plant forms: can
artificial selection fill the gap? Evolutionary Applications 3, 434-452.

- 121 -
4.7 Tables and figures
Table 1. Pedigree for genotypes used in Experiment 2.
No. Genotypes Reported pedigree Country of
origin Source
Source
reference
1 Wedgetail T. aestivum Australia (Cultivar) EGA Wedgetail
2 CPI-147235a
T. aestivum (CS) / T.
elongatum / T. aestivum
(M)
USA WSU PF5R1-0009
3 Thinopyrum
elongatum Thinopyrum elongatum
Israel and
Mediterranean
France
USDA-
ARS,
Logan,
Utah via
CSIRO
(Larkin et al.
2014)
4 Ot-38
Partial amphiploid derived
from Triticum aestivum /
Thinopyrum intermedium
Former USSR CSIRO
Otrastajuscaja
38 ,
(Banks et al.
1993)
5 CPI-148055 T. Intermedium USA TLI IWG 3182
6 Ok7211542
Partial amphiploid derived
from T. aestivum / T.
ponticum
USA
CSIRO
(Sando 1935)
7
Goshawk /T.
elongatum
A 2n = 56 amphiploid
between bread wheat
Goshawk “s” and
Thinopyrum elongatum
(2n = 14)
Mexico
CIMMYT
Via CSIRO
(Mujeeb-Kazi et
al. 2008)
8
Kharkov
/Agropyron
elongatum
A 2n = 56 amphiploid
between bread wheat
Kharkov and Agropyron
species
USA AWCC,AU
S6770
(Armstrong and
Stevenson 1947)
9
Stewart
/Agropyron
elongatum
A 2n = 42 amphiploid
between durum wheat cv
Stewart and Thinopyrum
elongatum ( 2n = 14)
USA AWCC,AU
S20238
(Jenkins and
Mochizuki
1957)
10 Tyrell tall
wheat grass
Thinopyrum ponticum(cv.
Tyrell) Introduced
(Hayes et al.
2012)
11 Uplands
Cocksfoot
Dactylisglomeratassp.
hispanica Zamora, Spain
http://pericl
es.ipaustrali
a.gov.au/pb
r_db/
CPI134670
12 Holdfast
phalaris
Phalaris aquatic L
(phalris) cv. Holdfast (Oram and Schroeder 1992)

- 122 -
Table 2.Growth, dry matter partitioning and yield components of different genotypes and source-sink balance manipulation treatments presented
below as (a) mean of source-sink balance treatments and genotypes (b mean of source sink balance treatments, genotypes and their interactions
for one annual wheat (Wedgetail), one perennial wheat (CPI-147235a) and one perennial grass (CPI-148055) in control, source, sink and both
treatments. Data included one-year-old annual wheat and three-year-old perennial wheat and perennial grass in 2013 at Charles Sturt University,
New South Wales, Australia. The level of significance is described as * (if P<0.05), ** (if P<0.001) and ns (non-significant).
(a) Mean of source-sink balance treatments and genotypes.
Flowering
days
Plant
height
(cm)
Number
of
tillers /
plant
Number
of ears /
plant
Leaf
dry
weight
Stem
dry
weight
Spike
dry
weight
Crown dry
weight
Root dry
weight
Number
of grains
/ plant
Single
grain
weight
(mg)
Grain
weight
(g) /
plant
Harvest
index
Treatment
Control 179.7 99.1 62.7 28.4 22 65.6 13.6 23 18 256.2 20.17 6.27 0.0841
Source 178.2 104 56.8 26.9 22 60.3 11.8 16.2 15.4 128.9 9.92 1.64 0.0203
Sink 164.7 104.4 64.1 27.9 21 61.8 8.6 19.2 19.7 70.7 30.5 2.84 0.0435
Source and sink 178.8 91.2 64 33.7 23 55.4 12 19.7 16.8 142.6 13.76 1.86 0.0309
Genotypes
Wedgetail 139.8 91.5 15.7 14.4 8 21.4 15.6 3.3 3.9 171.6 30.99 4.46 0.0959
CPI-147235a 172.4 106 46 27.4 23 93.7 12.5 6.8 12.2 257.9 22.05 4.95 0.0379
CPI-148055 213.8 101.5 123.9 45.8 34 67.2 6.4 48.6 36.3 19.2 2.74 0.05 0.0003

- 123 -
(b) Mean of source-sink balance treatments, genotypes and their interactions.
Floweri
ng days
Plant
height
(cm)
Number
of
tillers /
plant
Number
of ears /
plant
Leaf dry
weight
Stem dry
weight
Spike dry
weight
Crown
dry
weight
Root
dry
weight
Number
of grains
per plant
Single
grain
weight
(mg)
Grain
weight
(g) /
plant
Harvest
index
Treatment
Level of significance * ns ns ns ns ns ns ns ns ** ** ** *
LSD at P 0.05l 8.55 14.94 22.08 10.29 5.70 19.91 5.95 9.47 6.39 57.88 4.571 1.483 0.03
Genotypes
Level of significance * ns ** ** ** ** * ** ** ** ** ** **
LSD at P 0.05l 7.40 12.94 19.12 8.91 4.90 17.24 5.15 8.2 5.53 50.13 3.959 1.284 0.03
Treatment X genotypes
Level of significance ns ns * ns ns ns * ns ns * ** * *
LSD at 5 P 0.05l 14.81 25.88 38.24 17.82 9.80 34.48 10.30 16.4 11.07 48.34 7.917 2.569 0.05

- 124 -
Table 3. Summary of means for source-sink balance manipulation treatments and different genotypes and ANOVA results arranged
according to source-sink manipulation and genotypes for one annual wheat (Wedgetail), perennial wheat derivatives (CPI-147235a, Ot-38)
and perennial grasses (Thinopyrum elongatum, CPI-148055) in control, source, sink and both source and sink manipulation treatments. Data
included one-year-old annual wheat and two-year-old perennial wheat and perennial grass in 2014 at Charles Sturt University, New South
Wales, Australia. The level of significance is described as * (if P<0.05) and ns (non-significant).
Flowering in
days
Plant height
(cm)
Spike no Tiller no. Effective
tillers
(%)
Above-ground
dry matter
(g/plant)
Below-
ground dry
matter
(g/plant)
Total dry
matter
(g/plant)
Treatment (T)
At physiological
maturity in control Condition
198.20 62.04 11.51 19.94 82.09 44.20 11.25 55.47
Source 208.70 68.69 14.63 22.09 76.33 50.2 11.59 63.40
Sink 236.40 57.52 11.83 27.88 68.43 45.74 13.01 59.12
Both source and sink 220.00 70.36 13.17 14.01 96.75 51.83 12.78 64.69
Genotype (G)
Wedgetail 220.60 46.91 14.66 14.87 100.00 46.61 5.42 54.97
CPI-147235a 219.30 85.56 13.91 16.96 87.20 65.46 6.62 72.48
Ot-38 214.70 82.61 16.3 26.26 67.41 47.67 4.49 55.62
Thinopyrum elongatum 208.10 58.81 14.54 15.17 97.53 34.41 21.53 54.98
CPI-148055 214.90 41.36 4.10 44.05 40.39 35.04 24.79 61.60
LSD (Treatment) 31.13 ns 14.52 ns 5.08 ns 10.54 ns 18.80 ns 9.73 ns 2.97 ns 12.25 ns
P value 0.099 0.177 0.618 0.148 0.115 0.361 0.439 0.499
LSD (Genotype) 32.87 ns 17.43* 5.83* 11.83* 21.51* 11.25* 2.83* 10.71 ns
P value 0.883 0.001 0.007 0.009 0.001 0.001 0.001 0.057
LSD (T × G) 71.01 ns 33.12 ns 11.59 ns 24.04 ns 33.75 ns 22.19 ns 6.78 ns 19.22 ns
P value 0.596 0.549 0.442 0.170 0.255 0.872 0.556 0.849

- 122 -
Fig.1. Daily maximum and minimum temperature recorded during the experimental
periods (a); maximum temperature, minimum temperature and rainfall at the
experimental site during the study period for ambient Vs shade conditions (b); and
the long-term average for ambient conditions (c).
(c) 2013Month March
Apr
May
Jun
Jul
Aug
Sep
Oct
Nov
Dec
Jan
Feb
Mean monthly
maximum
temperature, °C
28.3 24.1 18.2 14.8 14.5 15 20.1 23.4 27.1 31.6 33.9 33
Mean monthly
temp
(minimum, °C)
14.5 9.3 6 4.4 4.8 5.2 6.9 5.9 9.3 15 17.5 18.4
Total rainfall
(mm) 36.4 7.2 55.2 97.4 36.2 47.6 33.8 12.6 5.6 21.4 18.8 42.2
Long term
Mean total
rainfall (mm)
45.8 40.4 50.8 50.1 54.2 50.6 48.7 57.2 45 45.9 39.8 41.7
Feb/13 Mar/13 Apr/13 May/13 Jun/13 Jul/13 Aug/13 Sep/13 Oct/13 Nov/13 Dec/13 Jan/14 Feb/14 Mar/14
Tem
per
ature
oC
-10
0
10
20
30
40
50
Maximum temperature
Minimum temperature
2013
0
10
20
30
40
50
outside vs Out/max
outside vs Out/Min
(a)
inside temperature
Tem
per
ature
oC
19-Nov 26-Nov 3-Dec 10-Dec 17-Dec 24-Dec 31-Dec
(b)

- 123 -
Fig.2. Number of tillers plant-1
and number of ears plant-1
for one annual wheat
(Wedgetail), one perennial wheat (CPI-147235a) and one perennial grass (CPI-
148055) in control (open ambient condition without any manipulation), source
(plants under shade cloth), sink (spikelets of one side of the ear removed) and both
(combined use of shade cloth and spikelets of one side of the ear removed) source
and sink manipulation treatments. LSD0.05 values for number of tillers and ears per
plant were38.24 and 8.91, respectively. Further details of statistical significance of
dry matter components are presented in Table 2.Data included one-year-old annual
wheat and three-year-old perennial wheat and perennial grass in 2013 at Charles
Sturt University, New South Wales, Australia.
CPI-147235a
0
20
40
60
80
100
120
140
Treatments
Control Source Sink Both
CPI-148055
0
20
40
60
80
100
120
140
Wedgetail
0
20
40
60
80
100
120
140
Tiller No.
Ear no.
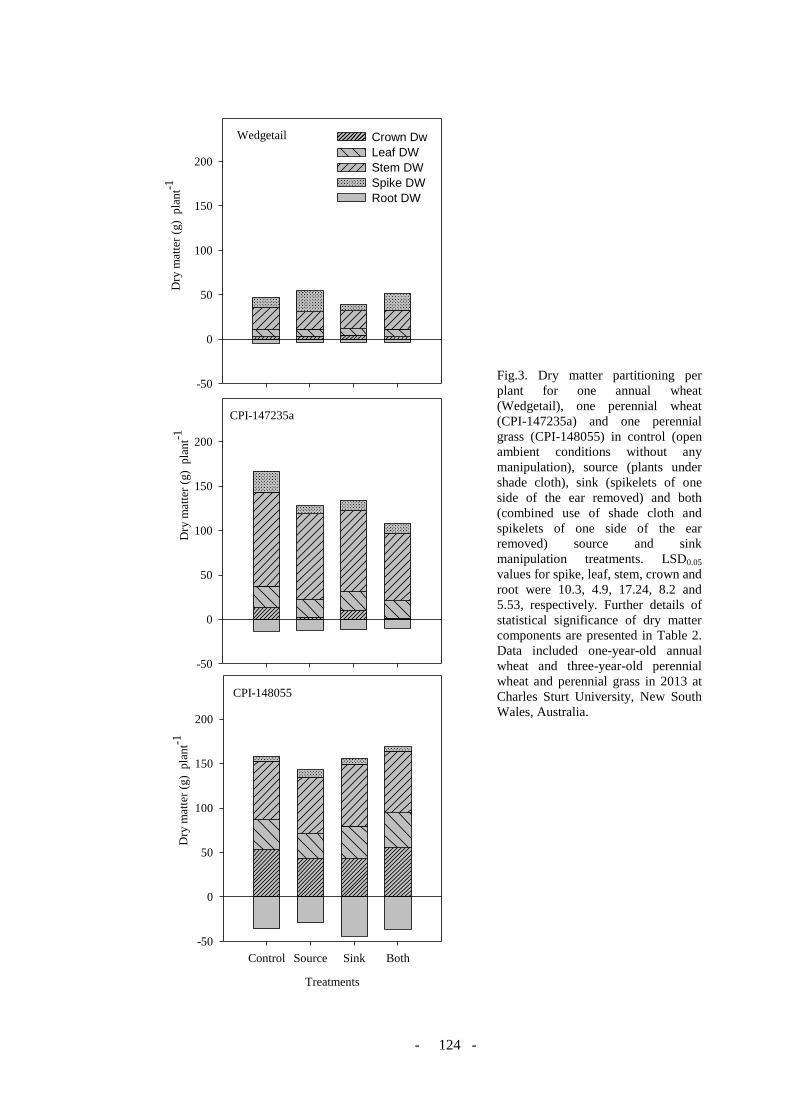
- 124 -
Wedgetail
-50
0
50
100
150
200
Crown Dw
Leaf DW
Stem DW
Spike DW
Root DW
CPI-147235a
-50
0
50
100
150
200
Treatments
Control Source Sink Both
CPI-148055
-50
0
50
100
150
200
Dry
mat
ter
(g)
pla
nt-1
Dry
mat
ter
(g)
pla
nt-1
Dry
mat
ter
(g)
pla
nt-1
Fig.3. Dry matter partitioning per
plant for one annual wheat
(Wedgetail), one perennial wheat
(CPI-147235a) and one perennial
grass (CPI-148055) in control (open
ambient conditions without any
manipulation), source (plants under
shade cloth), sink (spikelets of one
side of the ear removed) and both
(combined use of shade cloth and
spikelets of one side of the ear
removed) source and sink
manipulation treatments. LSD0.05
values for spike, leaf, stem, crown and
root were 10.3, 4.9, 17.24, 8.2 and
5.53, respectively. Further details of
statistical significance of dry matter
components are presented in Table 2.
Data included one-year-old annual
wheat and three-year-old perennial
wheat and perennial grass in 2013 at
Charles Sturt University, New South
Wales, Australia.

- 125 -
(a) WedgetailG
rain
wei
gh
t (g
) pla
nt-1
0
2
4
6
8
10
12
Har
ves
t in
dex
0.0
0.1
0.2
0.3
0.4
0.5
0.6
Grain weight (g) plant-1
HI
(b) CPI-147235 a
0
2
4
6
8
10
12
Har
ves
t in
dex
0.0
0.1
0.2
0.3
0.4
0.5
0.6
(c) CPI-148055
Control Source Sink Both
0.00
0.02
0.04
0.06
0.08
0.10
0.12
Har
ves
t in
dex
0.00
0.02
0.04
0.06
0.08
0.10
Gra
in w
eigh
t (g
) pla
nt-1
Gra
in w
eigh
t (g
) pla
nt-1
Fig.4. Grain weight (g) plant-1
and harvest index for one annual wheat (Wedgetail), one
perennial wheat (CPI-147235a) and one perennial grass (CPI-148055) in control (open
air without any manipulation), source (plants under shade cloth), sink (spikelets of one
side of the ear removed) and both (combined use of shade cloth and spikelets of one
side of the ear removed) source and sink manipulation treatments. LSD0.05 values for
grain weight and harvest index were 2.569 and 0.05336, respectively. Further details of
statistical significance of dry matter components are presented in Table 2. Data included
one-year-old annual wheat and three-year-old perennial wheat and perennial grass in
2013 at Charles Sturt University, New South Wales, Australia.

- 126 -
Fig.5. Number of grains plant-1
and single grain weight (mg) for one annual wheat
(Wedgetail), one perennial wheat (CPI-147235a) and one perennial grass (CPI-148055) in
control (open ambient conditions without any manipulation), source (plants under shade
cloth), sink (spikelets of one side of the ear removed) and both (combined use of shade cloth
and spikelets of one side of the ear removed) source and sink manipulation treatments.
LSD0.05 values for grains per plant and single grain weight were 48.34 and 7.917,
respectively. Further details of statistical significance of dry matter components are
presented in Table 2. Data included one-year-old annual wheat and three-year-old perennial
wheat and perennial grass in 2013 at Charles Sturt University, New South Wales, Australia.
(a) Wedgetail
0
100
200
300
400
Sin
gle
gra
in w
eigh
t (m
g)
0
10
20
30
40
50
Grain no. plant-1
Single grain weight (mg)
(b) CPI-147235 a
0
100
200
300
400
Sin
gle
gra
in w
eigh
t (m
g)
0
10
20
30
40
50
(c) CPI-148055
Control Source Sink Both
0
10
20
30
40S
ingle
gra
in w
eigh
t (m
g)
0
1
2
3
4
5
Nu
mb
er o
f gra
ins
pla
nt-1
N
um
ber
of
gra
ins
pla
nt-1
N
um
ber
of
gra
ins
pla
nt-1

- 127 -
Fig.6. ºBRIX values as recorded at different node positions (N1 as first node from the base
to N7 as seventh node from the base) of annual wheat (AW), perennial grass (PG) and
perennial wheat (PW) under four different treatment conditions (both, control, sink, and
source). The interaction effect, the effect of different annual and perennial wheat types and
effect of different treatments are presented in panel a, b and c, respectively. The LSD0.05
value for the interaction of node position and wheat type (in panel b) is 5.05 and LSD0.05
value for treatment (in panel c) is 1.91.

- 128 -
Fig.7. ºBRIX values for the means of the genotypes, perennial wheat (Ot-38) and perennial
grass (CPI-148055) (left hand side of the graph) and annual wheat (Wedgetail), perennial
wheat (CPI-147235a), and perennial grass (Thinopyrum elongatum) (right hand side of the
graph) at flowering (sampling plants at flowering after they have been grown under open
ambient conditions without any manipulation), control (sampling plants at physiological
maturity, that have been grown under open ambient conditions without any manipulation),
source (sampling plants at physiological maturity plants grown that have been grown under
shade cloth), sink (sampling plants at physiological maturity half of the total spikelets of
each ear ) and both source and sink (sampling plants at physiological maturity that have been
grown under the combined use of shade cloth and half of the total spikelets of each ear)
manipulation. The source-sink manipulation treatment was significant and LSD0.05 was 5.12.
Data included one-year-old annual wheat and two-year-old perennial wheat and perennial
grass in 2013 at Charles Sturt University, New South Wales, Australia.
CPI-148055
Treatments
Now Control Source Sink Both
Wat
er s
olu
ble
com
po
un
ds
0
5
10
15
20
25
30
Flowering
Flowering+10
Harvest
Ot-38
Treatments
Now Control Source Sink
Wat
er s
olu
ble
com
po
un
ds
0
5
10
15
20
25
30
Flowering
Flowering+10
Harvest
Mean
Treatments
Now Control Source Sink Both
Wat
er s
olu
ble
com
po
un
ds
0
5
10
15
20
25
30 Flowering
Flowering+10
Harvest
CPI-147235a
Treatments
Now ControlSource Sink Both
Wat
er s
olu
ble
com
po
un
dss
0
5
10
15
20
25
30
Flowering
Flowering + 10
Harvest
Wedgetail
Treatments
Now Control Source Sink Both
Wat
er s
olu
ble
com
po
un
ds
0
5
10
15
20
25
30
Flowering
Flowering + 10
Harvest
Thinopyrum elongatum
Treatments
Now Control Source Sink Both
Wat
er s
olu
ble
com
po
un
ds
0
5
10
15
20
25
30
BR
IX v
alu
e
Flowering Flowering
Flowering Flowering
Flowering Flowering
BR
IX v
alu
e

- 129 -
Fig.8.Apparent contributions of different sources of dry matter for spike dry weight;
Wedgetail, Kharkov, CPI-147235a, Ot-38, CPI-148055.The dry matter components that
contributed to spike dry weight for each genotype in each source-sink manipulation
treatment were plotted against the measured spike dry weight, to establish the likely sources
for spike dry weight in each case: DMa contribution of current photosynthesis equation (5),
DMab contribution from leaf stem redistribution equation (6), DMabc leaf stem crown
redistribution equation (7) and DMabcd leaf stem crown root redistribution equation (8).
Spike Dry weight (g plant-1)
0 10 20 30
Dry
mat
ter
(g p
lant-
1)
0
10
20
30
DMa
DMab
DMabc
DMabcd Spike vs DMa: -5.4603
Spike vs DMa: 13.4714
Spike vs DMab: -5.4603
control
sink
source
Mean
DMa
DMab
DMabc
DMabcd
Spike vs abcd
both
Spike Dry weight (g plant-1)
0 10 20 30
Dry
mat
ter
(g p
lant-
1)
0
10
20
30
DMa
DMab
DMabc
DMabcd
Spike vs DMab: 1.2637
control
sink
source
Ot-38
DMa
DMab
DMabc
DMabcd Spike vs abcd
both
Spike Dry weight (g plant-1)
0 10 20 30
Dry
mat
ter
(g p
lant-
1)
0
10
20
30
DMa
DMab
DMabc
DMabcd
control
CPI-148055
source
Spike vs DMab: --
Spike vs abcd
both
Spike Dry weight (g plant-1)
0 10 20 30
Dry
mat
ter
(g p
lant-
1)
0
10
20
30
DMa
DMab
DMabc
DMabcd
control
sink
source
Wedgetail
both
Spike Dry weight (g plant-1)
0 10 20 30
0
10
20
30
control
sink
source
CPI-147235a
Dry
mat
ter
(g p
lant-1
)
both
Spike Dry weight (g plant-1)
0 10 20 30
Dry
mat
ter
(g p
lant-
1)
0
10
20
30
DMa
DMab
DMabc
DMabcd
Spike vs DMa: 5.3081
Spike vs DMab: 3.6966
control
sink
source
Thinopyrum elongatum

- 130 -
5 Chapter 5
Root growth and water extraction by perennial wheat derivatives
Abstract
In this study, perennial wheat derivatives and perennial grass were examined
for the association of root growth and soil water extraction providing drought
avoidance during extended drying down conditions. Four perennial wheat derivatives
and a perennial grass genotype of a third-year stand were compared to the annual
wheat, Wedgetail, under both well-watered and extended drying down conditions in
Australia. The criteria for drought resistance were survival for longer under drought,
greater maximum root depth, and greater capacity to extract soil water. Successful
genotypes were able to extract more water from depth (i.e. avoidance strategy),
obtain more water and maintain hydration by effective metering of water, using it
productively for dry matter production and in root growth. After water was withheld,
the drought-resistant perennial wheat derivatives CPI-147235a, Ok7211542) and
perennial grass genotypes (CPI-148055) formed extensive root systems at deeper
depths (evidenced at 150cm soil layer) and showed greater water extraction from
deeper soil layers and longer survival. This was the first comprehensive study, with
third-year stands of perennial wheat derivatives and perennial grass providing
evidence of drought resistance as a benefit of extensive root systems and greater
water extraction from deeper soil layers, which was also consistent with potential
benefits for improved system sustainability.
Keywords: Drought, water extraction, root growth, perennial wheat, relative water
content, stomatal conductance, water deficit, maximum root depth.

- 131 -
5.1 Introduction
The incidence of drought is predicted to be more severe and protracted in the
next 30–90 years over many land areas (Dai 2013). Under the climatic changing
context, drought has been, and is becoming an acute problem constraining plant
growth and terrestrial ecosystem productivity, in many regions all over the world,
including Australia. Australia’s agro-climatic regions were reviewed for the
perennial wheat potentials and found promising (Bell et al. 2010). To contribute to
environments of prolonged drought, perennial wheat would need to apply a
combination of three strategies:(1) ‛escaping' the drought period through appropriate
phenology and summer dormancy; (2) ‛avoiding’ or minimising water deficit
through roots accessing deep soil water; and (3) adopting tolerance mechanisms to
that slow water loss such as osmotic adjustment, dehydration tolerance, etc.
The sustainability of environmental systems is threatened by the replacement
of perennial native vegetation with annual crops (Glover et al. 2010), which can lead
to water table rises, acidification and salinity due to the movement of water and
nutrients below the shallow root zone (Angus et al. 2001).Environmental
sustainability can be restored without discontinuing grain production by using the
perennial version of grain crops as an alternative crop production system. This could
also provide environmental advantages through resource uptake commonly lost
below the root zone of annual wheat. Perennial wheat has been developed by
hybridising annual wheat with perennial wild relatives (Wagoner 1990) and would
provide improved environmental services (Ridley et al. 2001; Crews 2005). Despite
these environmental services, perennial wheat would produce lower grain yield as
resource allocation in perennials might differ from that in annuals. Physiological
trade-offs may occur between persistence and grain yield in perennials to allocate
resources to enable the regrowth (DeHaan et al. 2005; Murphy et al. 2009).

- 132 -
Perennials would have more extensive root systems than annuals by the second year
of stand establishment (Blum 2010) and even in the early growth stage (DeHaan et
al. 2005). With deeper roots, the perennials might be able to acquire additional
resources (Glover et al. 2010). Annual wheat access to subsoil water has been shown
to increase crop water use efficiency three times with respect to total seasonal water
use and two times in regards to post-anthesis water use under similar environmental
conditions(Kirkegaard et al. 2007). During the first year of stand establishment,
perennial grass showed a higher level of dehydration tolerance than annual wheat by
surviving on low soil moisture (Larkin et al. 2014).
A number of studies have explored the potential to grow perennial wheat in
Australian conditions. The profitability of perennial wheat in mixed crop-livestock
farming systems was explored using MIDAS, a bio-economic model (Bell et al.
2008). Environmental and agronomic prospects were reviewed (Bell et al. 2010).
Germplasms produced in the USA (amphiploid lines developed by crossing T.
elongatum X Triticum aestivum, with the recurrent parent T. aestivum) (Murphy et al.
2010) were evaluated and the biological feasibility of perennial wheat was confirmed
in field conditions(Hayes et al. 2012). Several more detailed experiments evaluated
forage-biomass production under serial defoliation, dry matter partitioning over
growth cycles and dehydration tolerance and survival during drought (Larkin et al.
2014).
Water use efficiency of perennials might be different in relation to plant age
and in different soil moisture conditions compared to that of annuals in subsequent
years. The aim of this paper is to provide information with regards to water
extraction of three-year-old perennial wheat in response to an extended drying down
period, and thereby to assess the hydrological benefits. If perennial wheat derivatives
grow in prolonged soil moisture deficit conditions, then the ability to extend roots

- 133 -
deeper into the profile to extract further water and reach the lower limit of plant-
available water will be more compared to that for the annual wheat cultivar,
Wedgetail. During extended drought events, perennial wheat derivatives may show
greater drought resistance than annual wheat. Trade-offs between productivity,
survival and regrowth are expected as a mechanism of living plants in response to
soil moisture deficit. In a multi-year experiment (between 2011 and 2013), perennial
wheat derivatives of three-year-old and a perennial grass and annual wheat were
assessed under extended drought conditions, especially in relation to changes in root
growth and water extraction from deeper soil layers. The guiding hypotheses of this
study were:
(1) During periods of extended drought, third-year stands of perennial grass and
perennial wheat derivatives would be able to achieve higher water extraction from
deeper soil layers than annual wheat.
(2) Resource allocation and trade-offs between productivity, survival and regrowth
would be different in perennial grass and perennial wheat derivatives compared to in
annual wheat in response to soil moisture deficit conditions.
5.2 Materials and methods
Two experiments were conducted to address these objectives. The first
experiment examined plant response to prolonged water deficit under controlled
conditions in soil columns in the screen-house. The second experiment involved the
sampling of roots and soil water from field experiments in Wagga Wagga and
Cowra, for field validation purposes.

- 134 -
5.2.1 Experimental design
The experiment was conducted in soil columns in the screen-house at Charles
Sturt University, Wagga Wagga, New South Wales (latitude: 35.05oS, longitude:
147.35oE, elevation: 219 m) using the same experimental set-up as described in
Chapter 3. The experiment was laid out in a split-plot design, with six genotypes
replicated three times as the basis of each experimental or sampling unit. As in
Chapter 3, the soil columns were sown on 7 May 2011, and treatments were imposed
during the third wet season, after the perennial genotypes had survived two wet
seasons and two dry seasons. The annual wheat, Wedgetail, was replanted each year,
on 5 May 2012 and 8 May 2013, as is Chapter 3. Again, at the end of each season,
plants were cut leaving 8–10 cm from the soil surface at the end of December and
May each year. Cultural management was as described for well watered in Chapter 3,
until treatments were imposed during wet season three in 2013.
5.2.2 Treatments
Four treatments were imposed from 13 August 2013, when perennial plants
were at maximum tillering stage in the third cycle of wet-season regrowth:
5.2.2.1 Well-watered:
Two sampling units were retained in the screen-house, with watering continued
at fortnightly intervals throughout the experiment. One sampling unit was harvested
after the wet season crop reached physiological maturity, as a control for the water
deficit treatment (5.2.2.2).
5.2.2.2 Water deficit:
Two sampling units were transferred to a rainout shelter. Water was withheld
from maximum tillering until physiological maturity of the main stem, which was
defined as 80% senesced. One sampling unit was harvested at physiological maturity.

- 135 -
5.2.2.3 Well-watered and rewatered:
The second sampling unit was cut back to 8–10 cm in plant height and allowed
to regrow for 28 days, and was then harvested as a control for the water deficit and
rewatered treatment (5.2.2.4).
5.2.2.4 Water deficit and rewatered:
The second experimental unit was moved back to the screen-house were cut to
a height of 8–10 cm and allowed to regrow for 28 days, and was then harvested to
assess capacity for regrowth following prolonged water deficit.
A layer of fine gravel (5–8 mm crushed gravel used for an8–10 mm thick
layer) was applied to each soil column prior to treatment imposition, to reduce
evaporation loss from the soil surface. In all other periods and treatments, soil
columns were watered at fortnightly intervals. For the rewatering treatments, the first
watering was applied after cutting the straw, to commence the 28-day regrowth
period.
5.2.3 Measurements and calculations
5.2.3.1 Meteorological data
The meteorological conditions prevailing during the experimental period were
presented in Fig. 1a. The temperature and relative humidity inside the rain shelter
were measured using data loggers and found to fluctuate relative to the temperature
and relative humidity outside of the screen-house (Fig. 1b).
5.2.3.2 Phenology
Plant height, number of tillers per plant, number of ears per plant, days for
flowering and harvest days (defined as 80% of senescence) were presented in

- 136 -
Table 1. The perennial wheat derivative (CPI-147235a) and perennial grass (CPI-
148055) did not initiate reproductive growth and thus were not presented (Table1).
5.2.3.3 Destructive sampling
At physiological maturity, above-ground biomass was separated for the leaf, leaf
sheath and stem, and spike. Below-ground biomass was separated for the roots and
crowns and dried at 70 °C in dehydrator for 72 hours and dry weight was measured.
For root extent, roots were collected, washed and dried at 70 °C in a dehydrator, and
their dry weights were measured. All plant samples were dried in a dehydrator at 70
°C for 72 hours. Soil columns were opened by cutting the PVC tube horizontally half
and opened the soil core. For soil moisture measurements at harvest, the soil columns
were opened, the soil cores were segmented every 10 cm depth and the wet weights
of each soil segment were measured immediately. Conventional temperature for soil
drying is 105 oC for measuring soil bulk density; however, to calibrate to the required
temperature, the dry soil weight was measured at both 70 °C and 105 °C. After
drying, sample root washing commenced to separate roots from the soil samples. At
105 °C, no root samples could be collected. All roots were cooked in the high
temperature and became brittle and were unable to be separated from the soil
samples. In comparison, soil dry weight measured at 70 °C allowed measurements of
both soil and root dry weight. The preliminary study showed that the soil segments
dried at varied temperature (70 oC and 105
oC) had negligible impact on soil dry
weight (mean difference was 0.125%, N=22). Therefore, for dry weight, soil
segments were dried at 70 °C in the dehydrator for 72 hours and dry weight was
measured.
5.2.3.4 Water loss measurement
A hand winch (Manutec) fitted with a weighing cell was used for lifting and
weighing the soil columns. Water loss measurement was done by weighing soil
columns at 2–3 times per week up to harvest. The weight difference from each soil
column containing a plant was measured, and water use was calculated by the weight
difference and presented as % water loss.

- 137 -
Plants were harvested (all plants at harvest were at their physiological maturity
depending on genotypes or in a condition where 80 % of the plant parts were dried)
and the patterns of soil water extraction for all genotypes were measured for a
particular soil depth as volumetric water content (VWC). After harvest, water loss
through the soil profile was measured and expressed as volumetric water content
(VWC) for every soil depth. At harvest, wet soil weight and dry soil weight were
measured. The gravimetric water content (GWC) (%) was calculated according to
(Brady 1990) using the formula:
Bulk density (BD) was calculated according to (Brady 1990)using the formula:
The volumetric water content was calculated by:
Gravimetric water content × bulk density (as the volumetric density of water is 1).
5.2.3.5 Relative water content (RWC)
Relative water content (RWC) measured the water status of the plant and was
calculated according to (Barrs and Weatherley 1962).Similar aged leaves(the second
fully expanded leaf) from all entries were sampled weekly in the morning at 9.30 am
after withholding the watering treatment until the leaves had dried or died. A
comparative sampling was done at the same time on the well-watered control plants.
The plant samples were carried in a controlled temperature bag, and weighed
immediately. The leaf samples were then floated on water for 4 hours to assess their
turgid weight. Then leaf samples were gently dried with filter paper to remove excess

- 138 -
moisture and then weighed. The samples were oven dried at 70 °C for 48 hours and
then their dry weights were measured. Then RWC was estimated using the formula:
5.2.3.6 Stomatal conductance
A leaf porometer (Decagon SC-1) was used on the top of the most fully
expanded leaf to measure stomatal conductance. The measurement was done in the
water deficit treatment at 11 am in the morning on both upper and lower leaves of the
plants at weekly intervals after withholding watering until each leaf was showing
signs of curling.
5.2.3.7 Field validation
For validation purposes, Experiment 2 comprised soil core sampling, which
involved using a soil drilling rig from four field experiments. In March 2014, soil
cores were taken from perennial wheat evaluation sites (G x E) in Wagga Wagga and
Cowra, and in March 2014 and March 2015, soil cores were taken from pure stand
plots in a perennial wheat mixtures experiment (Mix) at Cowra. Further details of the
experiments from which these samples were taken are provided by Newell et al.
(2015). Samples were taken at the end of the dry season, prior to the commencement
of the autumn planting rains for wheat, when soil profiles were expected to be at
their driest. To confirm results obtained under controlled conditions during
prolonged drought, soil cores were taken from plots of annual wheat, the best
performing perennial wheat derivative CPI-147235a, and the perennial grass CPI-
148055, with three replicate cores obtained for each genotype at each of the four
sites. Cores were taken to 150 cm depth, and divided into 30 cm depth increments.

- 139 -
Estimates of volumetric water content were obtained as described above, then roots
were washed from each sample, dried and weighed.
5.2.4 Statistical analysis
Available plant growth data were subjected to an analysis of variance
(ANOVA) at well-watered and water deficit levels. Water loss was analysed over
time against six genotypes using a completely randomised design. Volumetric water
content, root dry weight and relative water content were analysed against soil depth
for the six genotypes in a completely randomised design. Relative water content and
stomatal conductance were analysed against days after water was withheld in the six
genotypes as factorial analysis. The field validation experiment was conducted using
a randomised complete block design. Root dry weight (RDW) data was analysed
against four locations at different sampling times. The RDW data has been presented
as square root transformed values (SQRT+0.5). The least significant difference (P =
0.5) was calculated to test the level of significance among treatments. Statistical
analysis was done using GenStat 16th
edition (GenStat® for Windows10.0, VSN Int.
Ltd, UK, 2013). The figures were produced using Sigmaplot 10 software.
5.3 Results
Water use patterns of all genotypes were evaluated by measuring water loss %
and leaf RWC, and soil volumetric water content (VWC) at harvest. Stomatal
conductance, root dry weight, phenology, and total dry matter at harvest were
measured to explain the plant physiology supporting survival in extended drying
down conditions.
5.3.1 Water loss (%)
A gradual decline in water loss (%) was exhibited in all genotypes up until
about day 21, after which water loss declined much more slowly as water availability

- 140 -
became increasingly restricted (Fig.). Although the declining pattern in water loss
(%) was consistent through time for all genotypes, there was a distinct variation in
their ability in this regard. Three perennial wheat derivatives (CPI-147235a, CPI-
147280b and OK7211542) were able to use more water and their values did not
significantly differ (P=0.05) from those for perennial wheat grass CPI–148055.
However, the annual wheat (Wedgetail) and one of perennial wheat derivatives
(11955) extracted less soil water at 71 days of withheld irrigation. The cumulative
water loss differed (P=0.05) significantly. In perennial wheat derivatives CPI-
147235a, the amount of water loss was highest (10.34%) and statistically similar to
that forOK7211542 (9.96%), CPI-147280b (9.08%) and the perennial wheat grass,
CPI-148055 (9.20%). The lowest amount of water lost was found in the perennial
wheat derivative, 11955 (7.22%), which did not differ from the loss of water in the
annual wheat, Wedgetail (7.26%).
5.3.2 Volumetric water content (VWC)
For a particular soil depth, VWC is determined by the availability of soil water
and use by plants. The upper limit of plant-available water (field capacity) for the
drained soil profile, based on values below 120 cm depth from which some
genotypes did not draw water, was considered to be 14% volumetric water content
(Fig. 3). The deepest layer was ignored in this estimate, as some water can pond at
the base of the column before drainage. The lower limit of plant-available water was
considered to be 4 % volumetric water content (Fig. 3), based on the consistent lower
limit of extraction down the soil profile. Values below 4 % in the top 30 cm of soil
were attributed to soil evaporation losses. Volumetric soil water content generally
increased with soil depth at harvest. Soil volumetric water content was around 4 % in
the upper 60 cm of the soil profile, but ranged from 4 to 8 % from 60 to 100 cm
depth, and from 4 to 19 % below 100 cm. Genotypes differed significantly (P=0.05)
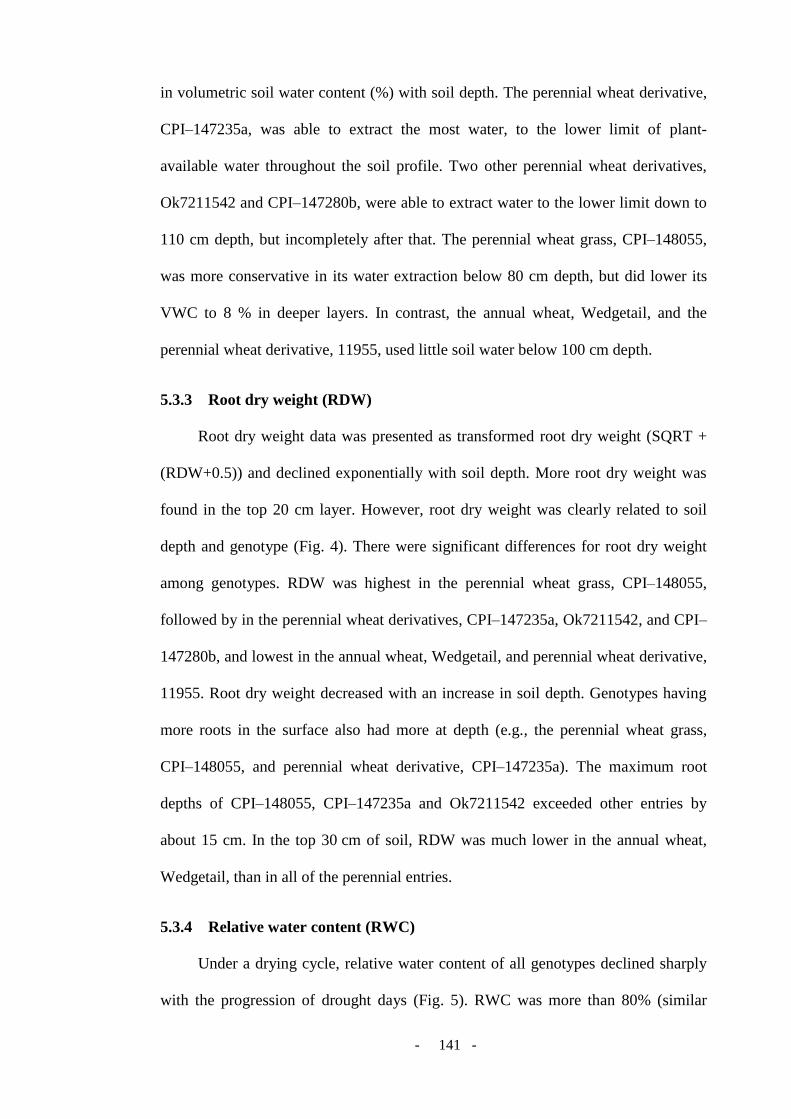
- 141 -
in volumetric soil water content (%) with soil depth. The perennial wheat derivative,
CPI–147235a, was able to extract the most water, to the lower limit of plant-
available water throughout the soil profile. Two other perennial wheat derivatives,
Ok7211542 and CPI–147280b, were able to extract water to the lower limit down to
110 cm depth, but incompletely after that. The perennial wheat grass, CPI–148055,
was more conservative in its water extraction below 80 cm depth, but did lower its
VWC to 8 % in deeper layers. In contrast, the annual wheat, Wedgetail, and the
perennial wheat derivative, 11955, used little soil water below 100 cm depth.
5.3.3 Root dry weight (RDW)
Root dry weight data was presented as transformed root dry weight (SQRT +
(RDW+0.5)) and declined exponentially with soil depth. More root dry weight was
found in the top 20 cm layer. However, root dry weight was clearly related to soil
depth and genotype (Fig. 4). There were significant differences for root dry weight
among genotypes. RDW was highest in the perennial wheat grass, CPI–148055,
followed by in the perennial wheat derivatives, CPI–147235a, Ok7211542, and CPI–
147280b, and lowest in the annual wheat, Wedgetail, and perennial wheat derivative,
11955. Root dry weight decreased with an increase in soil depth. Genotypes having
more roots in the surface also had more at depth (e.g., the perennial wheat grass,
CPI–148055, and perennial wheat derivative, CPI–147235a). The maximum root
depths of CPI–148055, CPI–147235a and Ok7211542 exceeded other entries by
about 15 cm. In the top 30 cm of soil, RDW was much lower in the annual wheat,
Wedgetail, than in all of the perennial entries.
5.3.4 Relative water content (RWC)
Under a drying cycle, relative water content of all genotypes declined sharply
with the progression of drought days (Fig. 5). RWC was more than 80% (similar

- 142 -
RWC at well-watered conditions) at four days after watering was withheld; RWC
then declined by differing amounts across the test genotypes. At 17 days, after
irrigation was withheld, the perennial grass, CPI–148055, along with the perennial
wheat derivatives, CPI–147235a and Ok7211542, maintained higher relative water
content over the other test genotypes. Under drought stress, the perennial grass, CPI–
148055, along with the perennial wheat derivatives, CPI–147235a and Ok7211542,
maintained higher (88–95 %) RWC at the beginning of drought stress, but declined
to a greater extent later in water deficit (43–45%). Interestingly, these three perennial
wheat derivatives showed the lowest relative water content at 48 days after irrigation
was withheld.
5.3.5 Stomatal conductance
Stomatal conductance declined with the advancement of drought days both in
upper and lower leaf surfaces for all genotypes (Fig. 6). Stomatal conductance in the
lower leaf was more than in the upper leaf at 19 days after irrigation was withheld in
the perennial wheat derivatives, Ok7211542, CPI–147235a and in the perennial
grass, CPI–148055. In the perennial wheat derivatives, CPI-147280b and 11955, the
stomatal conductance in the lower leaf was less than that in the upper leaf, and in the
annual wheat, Wedgetail, the value was almost equal in the upper and lower leaves.
5.3.6 Phenology
The annual wheat, Wedgetail, had a moderate plant height, and the lowest
number of tillers and the second highest number of spikes. The perennial grass, CPI–
148055, had the lowest plant height, and the highest number of tillers, but did not
produce a spike (Table 1). Among the perennial wheat derivatives, there was
substantial variation in these parameters. The perennial wheat derivatives, CPI-
147280b and 11955, had higher plant height, a medium number of tillers and higher
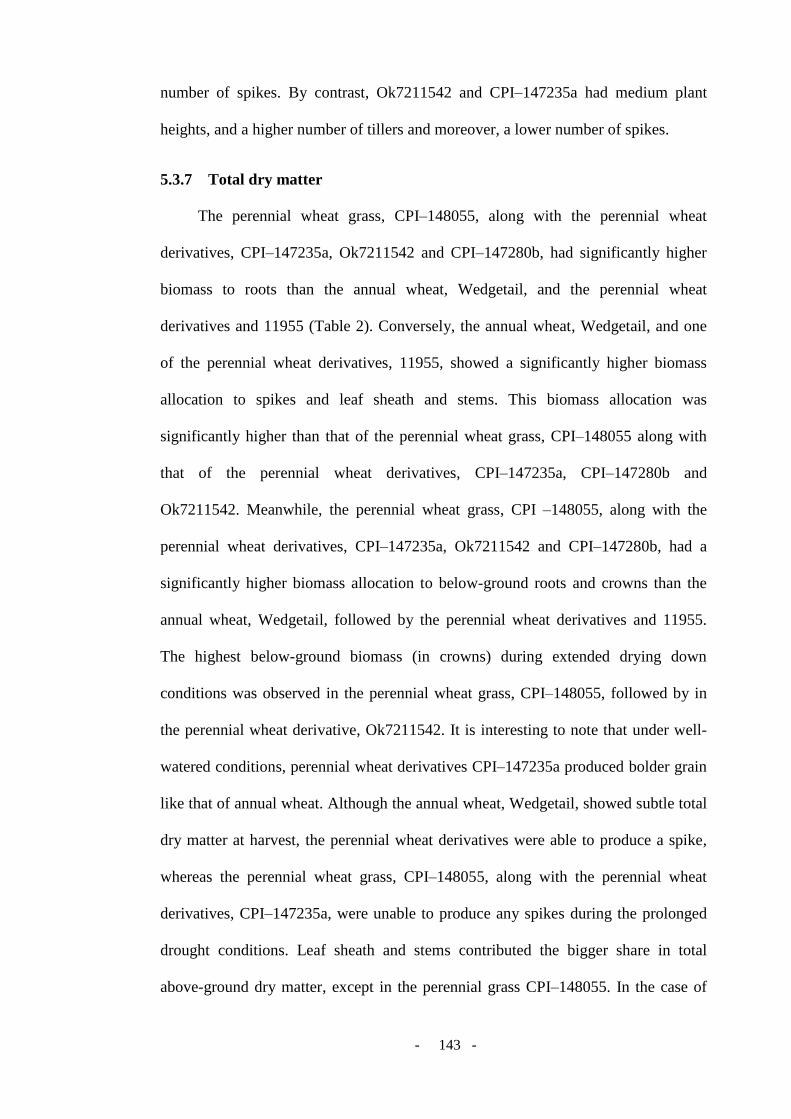
- 143 -
number of spikes. By contrast, Ok7211542 and CPI–147235a had medium plant
heights, and a higher number of tillers and moreover, a lower number of spikes.
5.3.7 Total dry matter
The perennial wheat grass, CPI–148055, along with the perennial wheat
derivatives, CPI–147235a, Ok7211542 and CPI–147280b, had significantly higher
biomass to roots than the annual wheat, Wedgetail, and the perennial wheat
derivatives and 11955 (Table 2). Conversely, the annual wheat, Wedgetail, and one
of the perennial wheat derivatives, 11955, showed a significantly higher biomass
allocation to spikes and leaf sheath and stems. This biomass allocation was
significantly higher than that of the perennial wheat grass, CPI–148055 along with
that of the perennial wheat derivatives, CPI–147235a, CPI–147280b and
Ok7211542. Meanwhile, the perennial wheat grass, CPI –148055, along with the
perennial wheat derivatives, CPI–147235a, Ok7211542 and CPI–147280b, had a
significantly higher biomass allocation to below-ground roots and crowns than the
annual wheat, Wedgetail, followed by the perennial wheat derivatives and 11955.
The highest below-ground biomass (in crowns) during extended drying down
conditions was observed in the perennial wheat grass, CPI–148055, followed by in
the perennial wheat derivative, Ok7211542. It is interesting to note that under well-
watered conditions, perennial wheat derivatives CPI–147235a produced bolder grain
like that of annual wheat. Although the annual wheat, Wedgetail, showed subtle total
dry matter at harvest, the perennial wheat derivatives were able to produce a spike,
whereas the perennial wheat grass, CPI–148055, along with the perennial wheat
derivatives, CPI–147235a, were unable to produce any spikes during the prolonged
drought conditions. Leaf sheath and stems contributed the bigger share in total
above-ground dry matter, except in the perennial grass CPI–148055. In the case of

- 144 -
the perennial grass, CPI–148055, the largest portion in below-ground dry matter was
in the crown.
5.3.8 Field validation
5.3.8.1 Root dry weight
Root biomass (g) and transformed (SQRT + (RDW+0.05)) in the field at
different locations with one perennial wheat derivative, CPI-147235a, perennial grass
CPI-148055 and annual wheat in four locations at different times were shown (Fig.
8).
Perennial grass CPI-148055 produced the highest root dry weight (.24~1.83 g)
in all locations. Highest (1.83 g) root dry weights for perennial grass were found in
Wagga G × E 2014 and lowest (.24) root dry weights for perennial grass were found
in Cowra Mix 2014. Most roots were allocated by depth increments in 30 cm soil
depths for all the genotypes in all locations. The highest root dry weights in 0–30 cm
soil depths were found in the perennial grass, CPI-148055 (73% of total root dry
weight of this plant) in Wagga G × E 2014 and the lowest were found in annual
wheat (0.017 g, which was 90% of total root dry weight of this plant) in Cowra G ×
E 2014.
In deeper soil layers, to be very small proportion of the root dry weight was
found in all the genotypes in all locations. However, the perennial wheat derivative,
CPI-147235a (0.3%–5.4% of total root of this plant) and perennial grass, CPI-
148055 (0.2%–0.4% of total root of this plant), were found to able produce roots to
depths of 90–120 cm, while no roots were found in these layers for annual wheat.
5.3.8.2 Volumetric water content
Volumetric water content was found to be low in upper soil layers (3% to 16%)
and high in lower soil layers (8% to 22%) (Fig. 7).The perennial grass, CPI-148055,

- 145 -
was found to have lower volumetric water content (4% to 12%) in deeper soil layers
in all locations. However, annual wheat were found to have volumetric water
contents of 4% to 18% in deeper soil layers. All genotypes were found to have
almost similar volumetric water contents in all location, except Cowra G × E 2014.
At soil depths of 60–90 cm, perennial grass and perennial wheat had lower
volumetric water contents (6%–15%).
5.4 Discussion
5.4.1 Water extraction by perennial wheat derivatives
This comprehensive study comparing perennial wheat derivatives to a
perennial grass and annual wheat is the first report of their water extraction, root
distribution and drought resistance characteristics in extended drying down
conditions. This study allowed testing of the guiding hypotheses that perennial wheat
derivatives and perennial grass, at the third year of their life, would be able to extract
more water from deeper soil layers. Third-year stands had the advantage of extensive
root systems associated with the advantage of the perenniality trait, and thus would
be able to extract water and provide additional resource allocation for both survival
and perennation, and potentially growth and yield. Thus, greater capacity for
resource capture from depth could potentially compensate in part for any yield trade-
off with perenniality.
Third-year stands of perennial grass and perennial wheat derivatives produced
consistently higher root dry weights and were able to extract more water than the
one-year-old annual wheat in extended drying down conditions. Root dry weight
increments were consistent with the first hypothesis where higher water extraction
from deeper soil depth was expected in perennial grass and perennial wheat
derivatives than in annual wheat during an extended drought period. Perennial grass

- 146 -
and perennial wheat derivatives, at the third year of their life, were able to produce
3–10 times more root dry weight than annual wheat. Extensive root systems down to
the soil profile played a significant role in water extraction for perennial wheat
derivatives in this study. As the root systems were already established (plants were
planted in May, 2011), they had the advantage of being able to withdraw water as
they needed to in response to the onset of drought. On the other hand, annual wheat
might be unable to extract water as they had weaker root systems down to the soil
profile along with one of the perennial wheat derivatives, 11955. At the onset of
drought, they have to allocate their resources to both root growth and survival. As an
annual, the annual wheat allocated its resources to spike and grain development. On
the other hand, the perennial wheat derivatives and perennial grass were found to
allocate resources for survival, and differed in their resource allocation to that of
annual wheat. The perennial wheat derivatives (CPI-147235a and Ok7211542) and
perennial grass (CPI-148055), with more extensive root systems in deeper layers,
were more efficient in terms of biomass production and water extraction than one of
the perennial wheat derivatives, 11955, and the annual wheat, Wedgetail, which had
less extensive root systems.
Larkin et al. (2014) reported that perennial wheat derivatives were able to
produce extensive roots in the second year of stand establishment. In this study, the
perennial grass, CPI-148055, produced 2–4 % more root dry weight than other
perennial wheat derivatives at a soil depth of10 cm, and most of the dry weight was
observed to be in the rhizome when samples were examined. Higher rhizome
production may provide more drought resistance in the perennial grass, CPI-148055,
but comparable to previous results for the other perennial grass. A comparable study
with perennial grass (Zhou et al. 2014) reported that high rhizome production could
supply roots with more carbohydrates, nutrients or water to keep higher root turgor

- 147 -
and activity, and provide superior drought resistance traits for a perennial grass
(Bermuda grass genotypes, Cynodon spp.).
The extensive root systems reflected at higher dry weights in perennial wheat
derivatives showed deeper soil water extraction. Perennial grass and perennial wheat
derivatives were able to extract 3.5–10.5% of plant-available water. Among the
perennial wheat derivatives, CPI-147235a was able to extract water to the lower limit
of plant-available water throughout the soil profile. Although the perennial grass,
CPI-148055, had deeper root systems down to the soil profile, it did not extract water
at the lower limit of plant-available water below 45 cm depth. Rhizomes in the
surface layer of the soil profile might be playing a role in drought resistance rather
than relying on greater roots in deeper soil layers. Similar findings have been shown
in a previous study with perennial grass, where the researchers found that greater soil
water extraction by drought–resistant perennial grasses was associated with a larger
network of rhizomes (underground stolons) rather than a greater root length density
or maximum rooting depth (Zhou et al. 2014).
The drought resistant perennial wheat derivatives (CPI-147235a and
Ok7211542) and perennial grass (CPI-148055) used a dehydration avoidance
strategy in the present study. They captured more water from every layer of the soil
profile from 10–150 cm. The genotypic variation of water use from the shallow
profile was not associated with drought resistance. In the upper 30 cm of the soil
profile, VWC was below the 4 % lower limit, due to soil evaporation losses (Fig. 3).
For the perennial wheat derivatives, the genotypic variation in water extraction at
depths of 100–150 cm was correlated with drought resistance. The critical depth of
extraction associated with greater drought resistance for perennial Bermuda grass
genotypes (Cynodon spp.) was 50–110cm (Zhou et al. 2014) and for annual crops,

- 148 -
the critical depth (Oryza sativa L) was 50–90 cm for upland rice (Lilley and Fukai
1994), and 30–90 cm for wheat (Triticum aestivum L.) (Gutierrez et al. 2010).
Perennial wheat derivatives and perennial grass showed the ability to extract
more water from the soil at the lower limit of available soil moisture than the annual
wheat (Wedgetail) in this study. The ability to maintain high water status by
extracting more water from deeper soil layers is one strategy of dehydration
avoidance (Chaves et al. 2003). This mechanism was followed to provide constant
water supply during water deficit conditions in perennial species (Volaire et al.
2009). There were varied differences among the perennial wheat derivatives in this
regard (Fig.4).The continued ability of perennial wheat derivatives to withdraw more
water than annual wheat may have been due to their extended root growth in deeper
soil layers (Fig.4). The maximum root depth of annual wheat and the perennial wheat
derivative, 11955, was 125 cm, whereas other perennial wheat derivatives continued
down to 145 cm soil depth. As drought progressed, water was only available in the
deeper soil layers, so the plants were only able to use this water if they had roots in
those deeper layers. The genotypes having longer and extensive roots in the deeper
soil profile showed better water extraction and more prolonged survival in extended
drying down conditions.
At the beginning of the study, water was more readily accessible, and
consequently a sharp decline in water loss % was observed early in water deficit
(WD) to 21 days. However, the experiment was continued until day 88, indicating a
high level of drought resistance in perennial wheat derivatives (Table. 1). As WD
progressed, water extraction slowed to perennial wheat derivatives and annual wheat,
as water became increasingly limited. At the end of the drying cycle, more water
extraction (8–10%) was evident in CPI-147235a, CPI-148055, Ok7211542, CPI-
147280b, whereas in annual wheat and in 11955, water loss was 6.2%. This

- 149 -
behaviour in response to the progression of drought may be explained by the plants
having to adjust for the drying of root hairs. Cox et al.(2006) reported that plants
may have to adjust for the drying of root hairs; only 25-40% of perennial wheatgrass
roots die off each winter in comparison to 100% of annual wheat roots. In addition,
perennials may have larger and deeper root systems, and their root systems can be
expected to be longer-lived, since they must support the plant’s survival through each
winter, or in Australia, over the hot dry summer.
5.4.2 Resource allocation, survival, regrowth in relation to soil moisture deficit
In this study, the perennial wheat derivatives, CPI-147235a, Ok7211542, CPI-
147280b, and the perennial grass, CPI-148055, allocated more resources to root
growth, and maintained higher water uptake rates, than the annual wheat and one of
perennial wheat derivatives, 11955. Stomatal conductance in upper and lower leaves
declined as drought progressed, with perennial wheat derivatives showing 35–44%
stomatal opening in the lower leaf compared to that for annual wheat (Fig. 6).
Maintaining a greater degree of stomatal opening could allow them to continue to
photosynthesise under dry conditions, while maintaining a lower canopy
temperature. The reduced stomatal limitation in perennials compared to in annuals
was consistent with the differences observed in water extraction during prolonged
water deficit conditions.
The leaf relative water content directly reflected the water status of plants.
Plant growth was responsive to progressive drought stress, and the reactions
depended on the adaptation to the rapidity, severity, and duration of the drought
event. In this study, leaf relative water content (RWC) of well-watered plants
averaged 90% throughout the treatment period, with no significant differences
among cultivars (Fig.. 5). Under drought stress, significant declines in RWC were
observed by 17 days to 48 days, dropping to below 80% to 60% in all cultivars.

- 150 -
Relative water content at 48 days of the drought period suggested CPI–148055, along
with perennial wheat derivatives CPI–147235a and Ok7211542, followed a drought
avoidance strategy relying on further water extraction, relative to the annual wheat,
Wedgetail, and the perennial wheat derivatives, 11955 and CPI-147280b. In this
study, genotypes CPI–147235a and CPI–148055 were unable to produce any spikes
in drought conditions and showed higher water extraction and longer survival in such
conditions. Cox et al.(2006) reported that perennial plants may shift allocation from
seed production in a single season to rhizome production in response to stress, to
increase their chance of survival. Indeed, there is evidence that fitness in perennial
plants tends to depend more heavily upon the survivorship than on fecundity
(DeHaan et al. 2005). Seeds are highly nitrogen-demanding tissues. By reducing
allocation to seeds in drought conditions, they could maintain the allocation of
nitrogen to key photosynthetic proteins in leaves. The plants may continue to
photosynthesise, which could allow them to remain alive during a prolonged drought.
In support of this claim, the perennial Lesquerella mendocinais known to have higher
leaf nitrogen content than its annual relative L. fendlei (Ploschuk et al. 2005).
Drought resistant varieties were found to be able to delay tissue dehydration
through root development, and water uptake in the case of a perennial grass cocks
foot (Volaire et al. 1998). Longer survival and drought tolerance were found to be
associated with the capacity of producing roots in deeper soil layers. Data obtained
from field experiments using contrasting cultivars were found difficult for
overriding impact of rooting depth in relation to water status (Volaire et al. 1998). In
this study, better performing perennial wheat derivatives and perennial grass were
compared to annual wheat in a field evaluation. Therefore, it would validate result
obtained from controlled environment in large soil columns showing their full
potentials. The perennial wheat derivative, CPI-147235a, and perennial grass, CPI-

- 151 -
148055, were found to be able to produce deeper root growth than annual wheat in
similar environmental conditions, and their results were found to be consistent with
the results obtained in control conditions. These findings were consistent across
control conditions and in field conditions, and indicated that perennial wheat
derivatives and perennial grass have drought resistance.
5.5 Conclusions
This paper has shown that three-year-old perennial wheat derivatives utilised
several mechanisms for drought resistance. The best genotypes were able to extract
water from deeper soil layers than the annual wheat during extended drying down
conditions, using extensive root systems. Under extended drying down conditions,
third-year stands of perennial wheat derivatives and perennial grass allocated more
dry matter to roots than annual wheat, indicating the potential for these genotypes to
enhance their water extraction and survival in drought conditions. Maintaining higher
relative water content in leaves at the onset of drought and lower relative water
content at the advancement of drought showed the avoidance mechanisms involved
in providing drought resistance to these genotypes. This result may have implications
for the selection of drought–tolerant perennial wheat genotypes of agricultural
significance, where selection for water use and water extraction during drought may
be important selection criteria. The results were exciting for the perennial wheat
derivatives assessed, as these derivatives were derived from overseas germplasms
and were not intended for Australian conditions. Thus, perennial wheat breeding
could be a promising new field in Australia. However, the drought resistance and
water extraction patterns of perennial wheat derivatives and perennial grass observed
in this study showed that there is capacity to select desired agronomic attributes for
drought resistance. This might contribute to the systems approach for perennial

- 152 -
wheat for Australia by 2030, and would provide flexibility and stability in
sustainable farming systems in Australia for the future.
5.6 Acknowledgements
We would like to thank the Charles Sturt University (CSU) and the Future
Farm Industries Cooperative Research Centre (FFI–CRC) for the financial
contribution to this research. We acknowledged Mr. Kerry Schirmer for technical
assistance and Richard C. Hayes and Matthew T. Newell for providing seeds for this
study. We acknowledge gratefully Washington State University, The Land Institute,
CIMMYT and the Centre for Molecular Biotechnology, and Russian State Agrarian
University for allowing us to use their germplasms.

- 153 -
5.7 References
Angus J, Kirkegaard J, Peoples M (2001) Rotation, sequence and phase: research on
crop and pasture systems. In 'Proceedings of the 10th Australian Society of
Agronomy Conference, Hobart'
Barrs H, Weatherley P (1962) A Re-Examination of the Relative Turgidity
Technique for Estimating Water Deficits in Leaves. Australian Journal of
Biological Sciences 15, 413-428.
Bell L, Byrne F, Ewing MA, Wade LJ (2008) A preliminary whole-farm economic
analysis of perennial wheat in an Australian dryland farming system.
Agricultural Systems 96, 166-174.
Bell L, Wade LJ, Ewing MA (2010) Perennial wheat: a review of environmental and
agronomic prospects for development in Australia. Crop and Pasture Science
61, 679-690.
Blum A (2010) 'Plant Breeding for Water-Limited Environments.' (Springer).
Brady NC (1990) The Nature And Properties Of Soils. 10* Edition. In. (Macmillan
Publishing Company. p).
Chaves MM, Maroco JP, Pereira JS (2003) Understanding plant responses to
drought—from genes to the whole plant. Functional Plant Biology 30, 239-
264.
Crews T (2005) Perennial crops and endogenous nutrient supplies. Renewable
Agriculture and Food Systems 20, 25-37.
Dai A (2013) Increasing drought under global warming in observations and models.
Nature Climate Change 3, 52-58.
DeHaan L, Van Tassel D, Cox T (2005) Perennial grain crops: a synthesis of ecology
and plant breeding. Renewable Agriculture and Food Systems 20, 5-14.
Glover J, Reganold J, Bell L, Borevitz J, Brummer E, Buckler E, Cox C, Cox T,
Crews T, Culman S (2010) Increased food and ecosystem security via
perennial grains. Science(Washington) 328, 1638-1639.
Gutierrez M, Reynolds MP, Klatt AR (2010) Association of water spectral indices
with plant and soil water relations in contrasting wheat genotypes. Journal of
Experimental Botany 61, 3291-3303.
Hayes RC, Newell MT, DeHaan LR, Murphy KM, Crane S, Norton MR, Wade LJ,
Newberry M, Fahim M, Jones SS, Cox TS, Larkin PJ (2012) Perennial cereal
crops: An initial evaluation of wheat derivatives. Field Crops Research 133,
68-89.
Kirkegaard J, Lilley J, Howe G, Graham J (2007) Impact of subsoil water use on
wheat yield. Crop and Pasture Science 58, 303-315.

- 154 -
Larkin PJ, Newell MT, Hayes RC, Aktar J, Norton MR, Moroni SJ, Wade LJ (2014)
Progress in developing perennial wheats for grain and grazing. Crop and
Pasture Science 65 1147-1164.
Lilley J, Fukai S (1994) Effect of timing and severity of water deficit on four diverse
rice cultivars I. Rooting pattern and soil water extraction. Field Crops
Research37, 205-213.
Murphy K, Hoagland LA, Reeves PG, Baik BK, Jones SS (2009) Nutritional and
quality characteristics expressed in 31 perennial wheat breeding lines.
Renewable Agriculture and Food Systems 24, 285.
Murphy K, Lyon SR, Balow KA, Jones SS (2010) Post-sexual cycle regrowth and
grain yield in Thinopyrum elongatum × Triticum aestivum amphiploids.
Plant Breeding 129, 480-483.
Ploschuk E, Slafer G, Ravetta D (2005) Reproductive allocation of biomass and
nitrogen in annual and perennial Lesquerella crops. Annals of Botany 96, 127-
135.
Ridley A, White R, Helyar K, Morrison G, Heng L, Fisher R (2001) Nitrate leaching
loss under annual and perennial pastures with and without lime on a duplex
(texture contrast) soil in humid southeastern Australia. European Journal of
Soil Science 52, 237-252.
Volaire F, Thomas H, Lelievre F (1998) Survival and recovery of perennial forage
grasses under prolonged Mediterranean drought: I. Growth, death, water
relations and solute content in herbage and stubble. New Phytologist 140,
439-449.
Volaire F, Norton M, Lelièvre F (2009) Summer drought survival strategies and
sustainability of perennial temperate forage grasses in Mediterranean areas.
Crop Science 49, 2386-2392.
Wagoner P (1990) Perennial grain development: past efforts and potential for the
future. Critical Reviews in Plant Sciences 9, 381-408.
Zhou Y, Lambrides CJ, Fukai S (2014) Drought resistance and soil water extraction
of a perennial C4 grass: contributions of root and rhizome traits. Functional
Plant Biology 41, 505-519.

- 155 -
5.8 Figures and tables
Fig.1. The range of maximum and minimum temperatures throughout the
experimental period is shown in panel (a). The variation in maximum and minimum
temperatures inside (30 min difference) and outside (in each day) of rain shelter
along with relative humidity (yellow bar) are presented in panel (b).
Experimental periods (2013)
May Jun Jul Aug Sep Oct Nov Dec
Tem
per
ature
(oC
)
-10
0
10
20
30
40
Maximum
Minimum
2D Graph 22D Graph 2
Maximum Tepmerature
MinimumTepmerature
0
5
10
15
20
25
30
35
23-Aug 24-Aug 25-Aug 26-Aug 27-Aug 28-Aug 29-Aug 30-Aug 31-Aug 1-Sep 2-Sep
Tem
pera
ture
(oC
)
0
10
20
30
40
50
60
70
80
90
100
Rela
tive H
um
idity (
%)
0
5
10
15
20
25
30
35
Temperature (inside the rain shelter)
2013
(a)
(b)
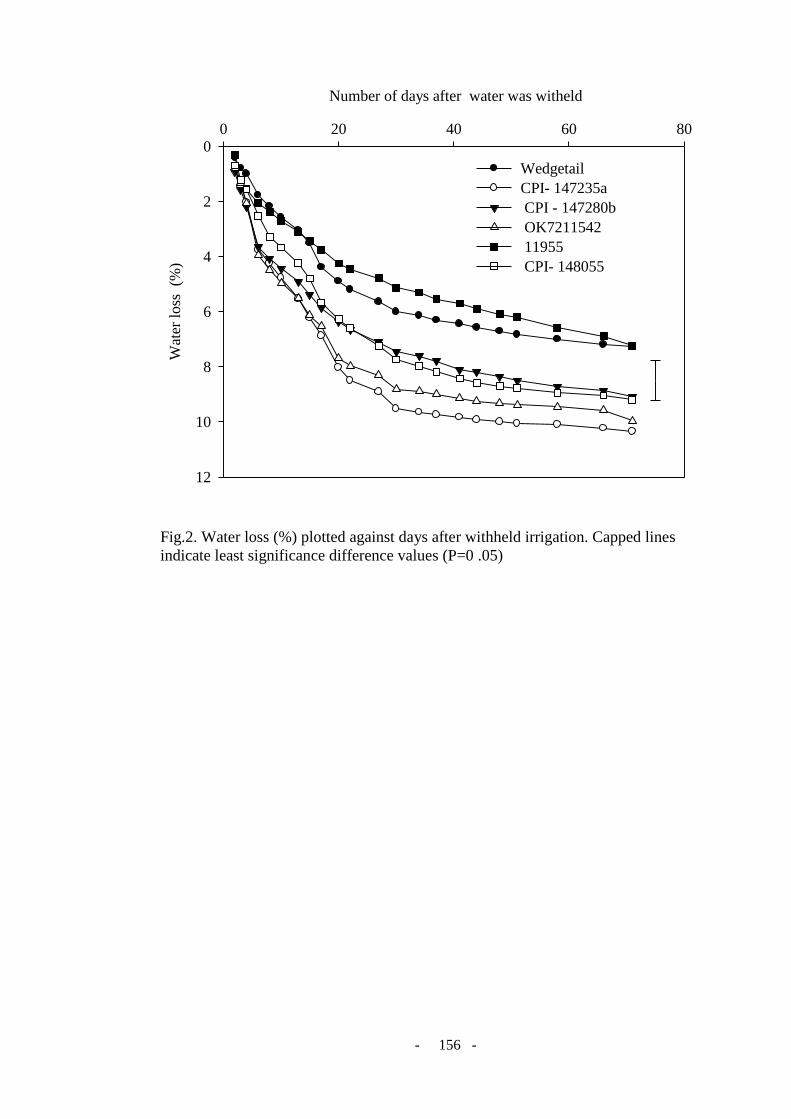
- 156 -
Fig.2. Water loss (%) plotted against days after withheld irrigation. Capped lines
indicate least significance difference values (P=0 .05)
Number of days after water was witheld
0 20 40 60 80
Wat
er l
oss
(%
)
0
2
4
6
8
10
12
Wedgetail
CPI- 147235a
CPI - 147280b
OK7211542
11955
CPI- 148055

- 157 -
Fig.3. Volumetric water content plotted against soil depth. Capped lines indicate
least significance difference values (P=0.05).
Fig.4. Root dry weight (RDW) presented as the square root of (RDW + 0.5) plotted
against soil depth for six genotypes and LSD 0.05 values 0.5141.
Volumetric water content (%)
0 2 4 6 8 10 12 14 16 18 20
Soil
dep
th (
cm)
0
20
40
60
80
100
120
140
160
Wedgetail
CPI- 147235a
CPI - 147280b
OK7211542
11955
CPI- 148055
SQRT (RDW+0.5)0 1 2 3 4
Soil
dep
th (
cm)
0
20
40
60
80
100
120
140
160
Wedgetail
CPI-147235a
CPI-147280b
OK7211542
11955
CPI-148055
RDW 0 0.5 1.75 3.5 8.5 15.5
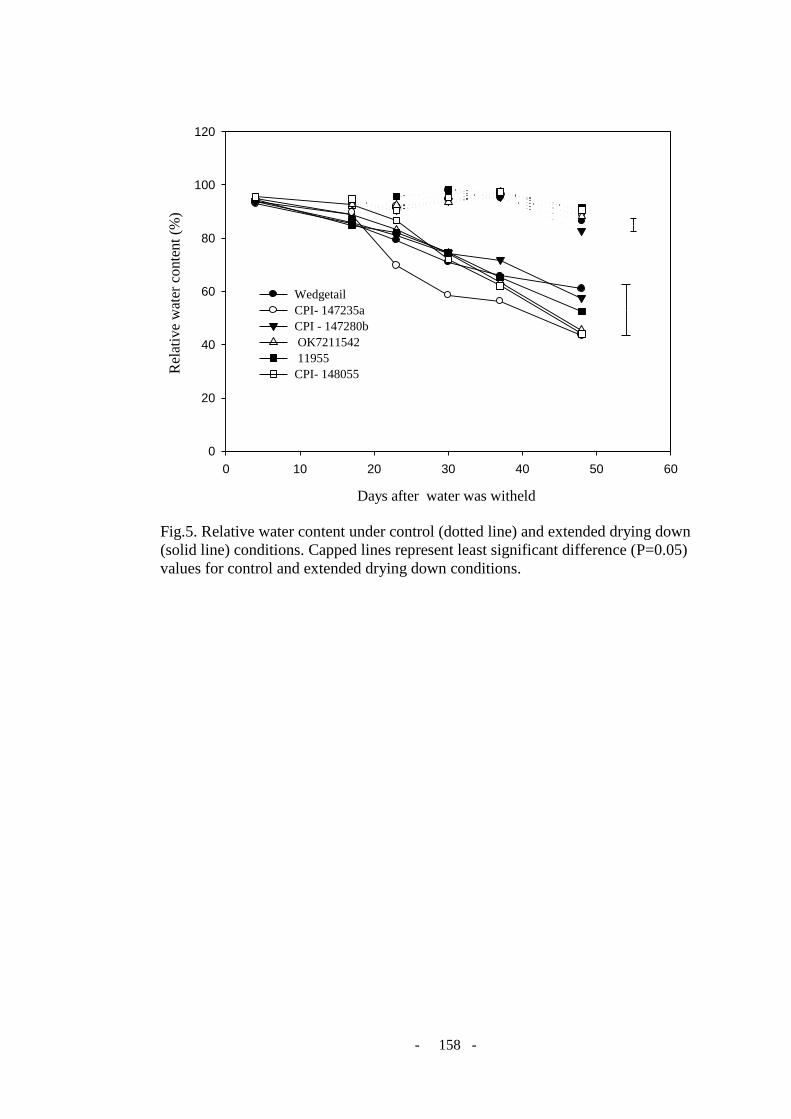
- 158 -
Fig.5. Relative water content under control (dotted line) and extended drying down
(solid line) conditions. Capped lines represent least significant difference (P=0.05)
values for control and extended drying down conditions.
Days after water was witheld
0 10 20 30 40 50 60
Rel
ativ
e w
ater
conte
nt
(%)
0
20
40
60
80
100
120
Wedgetail
CPI- 147235a
CPI - 147280b
OK7211542
11955
CPI- 148055

- 159 -
Number of days after water was witheld
0 5 10 15 20
Sto
mat
al c
on
du
ctan
ce (
mm
olm
-2s-1
)
0
20
40
60
80
100
120
140
160
180
Wedgetail
CPI- 147235a
CPI - 147280b
OK7211542
11955
CPI- 148055
(a) Upper leaf surface
Fig. 6. Stomatal conductance in upper and lower leaves plotted against days (9, 14 and 18
days) after withheld irrigation for one annual wheat, four perennial wheat derivatives and one
annual grass under extended drying down conditions. Capped lines indicate least significant
difference values (P=0.05).
Number of days after water was withheld
0 5 10 15 20 0
20
40
60
80
100
120
140
160
180
Wedgetail CPI- 147235a CPI - 147280b OK7211542 11955 CPI- 148055
(b) Lower leaf surface
Sto
mat
al c
ond
uct
ance
(m
mo
l m
-2s-1
)

- 160 -
Fig.7.Volumetric water content in four locations in the field validation for the perennial
wheat, CPI-147235a, perennial grass, CPI-148055, and annual wheat under different field
conditions in New South Wales, Australia.
Volumetric Water Content (%)
5 10 15 20 25
So
il D
epth
(cm
)
30
60
90
120
150
Cowra G x E
5 10 15 20 25
So
il D
epth
(cm
)
30
60
90
120
150CPI-147235A
CPI-148055
Wheat
5 10 15 20 25
So
il D
epth
(cm
)
30
60
90
120
150
Wagga G x E
Cowra Mix 2014
Volumetric Water Content (%)
5 10 15 20 25
So
il D
epth
(cm
)
Wagga GxE
Cowra Mix 2015

- 161 -
Fig. 8. Root dry weight for the perennial wheat CPI-147235a, perennial grass CPI-148055 and
annual wheat under field conditions: a) Cowra mix 2014; b) Cowra G x E; c) Cowra mix
2015; and d)Wagga G x E in New South Wales Australia.
0.0 0.5 1.0 1.5 2.0 2.5 3.0 3.5 4.0
Soil
dep
th (
cm)
15
45
75
105
135
165
0.0 0.5 1.0 1.5 2.0 2.5 3.0 3.5 4.0
Soil
dep
th (
cm)
15
45
75
105
135
165
Wheat
CPI-147235a
CPI-148055
SQRT(RDW+0.5) 0 0.5 1.75 3.5 8.5 15.5RDW
SQRT(RDW+0.5) 0 0.5 1.75 3.5 8.5 15.5
Soil
dep
th (
cm)
15
45
75
105
135
165
Soil
dep
th (
cm)
15
45
75
105
135
165
a) b)
c) d)
ns
ns
ns
*
*
*
*
ns
*
ns
*
*
*
*
*
ns
*
*
*
*
RDW

- 162 -
Table 1. Phenology for one annual wheat, four perennial wheat derivatives and one annual
grass under extended drying down conditions.
Genotypes Stomatal
conductance (mmol
m-2s-1)
Plant
height
(cm)
Tiller
number
(per
plant)
Ear
number
(per
plant)
Flowering
(days after
water was
withheld)
Harvest (days after
water was
withheld)
Wedgetail 72.3 8.7 4.3 45.0 71.0
CPI-147235a 76.7 26.0 * * 79.3
CPI-147280b 74.0 25.5 5.5 30.5 82.0
OK7211542 62.3 32.7 1.0 34.0 79.7
11955 79.7 19.0 2.3 36.5 88.0
CPI-148055 30.7 103.3 * * 79.0
* =no flower produced on ear.

- 163 -
Table 2. Total dry matter at harvest for one annual wheat, four perennial wheat
derivatives and one annual grass under extended drying down conditions.
Genotype
name
Leaf dry
weight
(g)
Leaf
sheath &
stem dry
weight
(g)
Spike
dry
weight
(g)
Crown
dry
weight
(g)
Root dry
weight
(g)
Shoot
dry
weight
(g)
Total
dry
weight
(g)
Wedgetail 3.63 5.86 1.00 1.09 2.72 11.58 14.30
CPI- 147235a 11.79 33.34
1.77 16.99 46.90 63.89
CPI - 147280b 7.31 16.23 2.03 3.37 11.24 19.29 26.79
OK7211542 12.66 24.25 0.02 8.20 15.63 45.12 60.75
11955 4.77 13.59 0.86 2.53 11.10 21.75 32.85
CPI- 148055 11.42 8.19
35.20 28.71 54.81 83.52

- 164 -
6 Chapter 6:
General discussion, conclusion and future work direction
6.1 General discussion
Perennial grain cropping may provide increased flexibility in mixed farming
systems, with the opportunity to contribute grain and forage while enhancing system
sustainability. Consequently, this research was conducted in Australia comparing
perennial wheat derivatives with the dual purpose annual wheat, Wedgetail, and the
perennial grass, Thinopyrum intermedium CPI-148055.
The patterns of the life cycle were studied over generations under well-
watered conditions, especially dry matter production and partitioning (Chapter 3).
Subsequent experiments examined how these patterns changed under limitations to
source and sink capacity (Chapter 4) and extended drying down tolerance (Chapter
5). These patterns of dry matter partitioning under annual versus perennial growth
habits, and how these may change under source–sink manipulation and with water
deficit provided a basis for understanding the potential of perennial wheat derivatives
under different environmental conditions. This will assist in identifying desirable
traits for perennial wheat derivatives with improved adaptation to southern
Australian conditions. In this study, three aspects of resource allocation were studied
in four perennial wheat derivatives and a perennial grass, and these were compared
to those of an annual wheat for three continuous years in different environments. The
results indicated that:
In well-watered conditions, perennial grass and perennial wheat derivatives
were able to produce more root growth along with more above-ground
biomass in older plants compared to annual wheat.

- 165 -
In source-sink balance manipulations in two separate studies with two-year-
old and three-year-old perennial grass and perennial wheat derivatives, source
–sink balance manipulations were found to show consistent patterns in
resource allocation. More root growth and more biomass production (new
tiller production) were observed in source–sink balance manipulations in the
case of the perennial grass and perennial wheat, showing that greater priority
was given to resource allocation for survival and perennation. This resource
allocation priority was different to that for annual wheat in the same source-
sink balance manipulation treatment.
In terms of extended drying down tolerance, three-year-old perennial grass
and perennial wheat derivatives were found to allocate more resources to root
growth and were able to extract soil water from deeper soil layers compared
to annual wheat under the same conditions.
However, the response was varied among perennial grass and perennial wheat
derivatives compared to that for annual wheat. Resource allocation patterns in
relation to plant age, source-sink balance manipulation and extended drying down
tolerance observed in this study were explored, and revealed new findings about
there being more above- and below-ground biomass production, longer survival and
water extraction, and hydrological benefits in perennial grass and in perennial wheat
derivatives over annual wheat.
6.1.1 Regrowth, dry matter production and partitioning patterns in perennial
wheat over generations and in seasonal comparisons
It is acknowledged that survival and grain yield in the following years of
regrowth with currently available germplasms were a problem in current perennial
wheat germplasms. In Chapter 3, selected perennial wheat derivatives, which were
better performers in previous field evaluations, were found to be able to survive up to

- 166 -
three years and were able to produce 2–3 fold more biomass and 3–12 fold more root
growth than annual wheat.
A benchmark for grain yield for perennial wheat derivatives is to produce 40%
of annual wheat yield along with additional forage, or 65% of annual wheat yield as
a grain crop only, in order to be financially viable (Bell et al. 2008). Currently
available perennial wheat derivatives were able to provide additional biomass or
forage, especially in the second and third year, as was also observed for the perennial
grass. The substantial challenge, however, was consistency in providing grain yield
in the following years of survival, in order for the perennial grain crop to be
successful (Murphy et al. 2010; Larkin et al. 2014). Greater forage production in late
summer regrowth (January to April) under southern Australian conditions was
considered a very important contribution to the economic sustainability of the farm
(as a provider of additional animal feed for livestock included as a component of
farming systems). Thus, perennial wheat was able to provide most of the ecosystem
services at this point by providing surplus forage. However, grain yield was lower
than that in annual wheat, especially in successive years, and thus increased grain
yield under regrowth needs more attention with respect to breeding.
Perennial wheat derivatives were able to regrow in the following season for up
to three years, and were reported here for the first planting in May 2011, in Chapter 3
(Fig. 5). With dry season water deficit, however, reduced vigor in the summer
regrowth, failure to regrow, and plant death were evident following the 2011 planting
(Chapter 3, Fig. 9). The ability to regrow varied depending on dry season regrowth,
with a second cycle of dry season water deficit being found to produce much lower
biomass regrowth and much higher plant mortality.
In different seasons, older plants were found to produce more above- and
below-ground dry matter than new plantings. However, seasonal conditions

- 167 -
influenced stand establishment and regrowth. Poor stand establishment followed the
2012 planting, which failed to regrow in the second year in this experimental site,
even though plants established in 2011 were successfully regrown for the third year
(Chapter 3, Fig. 10). Unreliable regrowth by similar perennial derivatives in different
plantings was also reported for the same location in previous studies with perennial
wheat derivatives (Hayes et al. 2012; Jaikumar et al. 2012).
Root growth was expected to increase over time as a benefit of the perennial
habit of plant growth. However, perennial wheat grass was observed to die back in
the following season and regrow again in the next season (Cox et al. 2006). In
Chapter 3, perennial wheat was found to produce more extensive and longer-lived
root growth in the following seasons of regrowth. This was consistent with earlier
work with currently available perennial wheat derivatives in Australia, which had
greater root growth after the first season of regrowth (Larkin et al. 2014). In this
research, perennial wheat was able to grow more roots in the following season
(Chapter 3, Fig. 6).
Grain yield was expected to be low in perennial habit of plant growth. As
perennial habit was more dependent on root and rhizome DM for long-term survival,
compared with seed dispersal in annuals, more perennial dry matter was used for
survival in hot or dry summer conditions, or in cold and freezing winter conditions.
In the first season of perennial growth, more dry matter was apportioned to stand
establishment and root growth. Consequently, yield in the first season was low.
However, in the following year of stand establishment, the early season capture of
rainwater and greater early growth enhanced the ability to produce more in the
second season of regrowth. In this study, I found similar yield trends in the regrown
perennial genotypes in the second- and third-year stands.

- 168 -
6.1.2 Summer regrowth in dry season (DS)
The perennial wheat derivative, CPI-147235a, and perennial grass, CPI-
148055, had more reliable performance in regrowth yield, biomass production, and
root growth than other perennial wheat derivatives used in this study. Higher
mortality in weaker regrown plants in some perennial genotypes (CPI-147280b,
Ok7211542 and 11955) was observed in this study (data not shown).Vigor of dry
season summer regrowth after the previous stubble cut differed among regrown
plants. Plants showing weaker regrowth produced 2–3 tillers, but failed to continue
to grow and establish, and senesced and died after about one month of regrowth. On
the other hand, some strong vigorous regrowth plants started with 2–3 tillers, but
were able to continue to produce new shoots and tillers for greater biomass
production and establishment. Extreme dry weather was associated with weaker
regrowth at the end of the 2012dry season, which was hotter and drier than the other
dry seasons (Chapter 3, Fig. 1).
6.1.3 Resource allocation pattern in perennial and annual growth habit and
their changes with source and sink manipulation
In Chapter 4 (Tables 2 and 3) of this thesis, dry matter partitioning under
altered source-sink balance during grain filling was shown to strongly affect seed
size and spikelet number in perennial wheat derivatives. Previous research with
perennial wheat derivatives compared to annual wheat in the USA found evidence of
change in grain size and sink limitation for grain filling in relation to source-sink
balance in perennial wheat (Jaikumar et al. 2014). Greater dry matter partitioning to
root growth and new tiller production were reported to reduce grain yield in
perennial wheat derivatives and in perennial grass. Thus, there was a resource cost
for both perennation and survival in source-sink balance, so not all spikelets set at
anthesis could be filled (Cruz-Aguado et al. 1999). Increasing dry matter partitioning

- 169 -
towards grain yield might potentially increase grain yield in perennial wheat.
Resource capture in perennial wheat derivatives was explored in comparison to that
for annual wheat with respect to source-sink manipulation (Chapter 4, Fig. 9), and
greater resource capture could potentially compensate for yield trade-off in
perennials. Intensive breeding efforts focused on increased sink strength to pull
available dry matter towards reproductive allocation should be worthwhile, i.e. filled
grains, increased seed size, and finally, increased grain yield.
6.1.4 Water extraction and root growth in extended drying down tolerance in
perennial and annual wheat
In this thesis (Chapter 3, Fig. 6), there was evidence of greater root growth by
perennial wheat derivatives and perennial grass during later stages of regrowth (the
third year of growth). Perennial wheat and perennial grass were able to extract more
water by roots from deeper soil layers (Chapter 5, Fig.’s 2 and 4) and to survive
longer compared to annual wheat under extended drying down conditions. The
development of a deeper and more extensive root system (especially under extended
drying down conditions) allowed the perennials to extract water from deeper soil
depths, where annual wheat could not (Chapter 5, Fig. 2). This is the first report of
new findings for the water extraction ability of perennial wheat derivatives to
achieve hydrological benefits in the perennial grain crop literature.
Perennial wheat derivatives need greater water extraction to adapt to dry
conditions in Australia. Longer survival under the extended drying down conditions
was associated with more soil water extraction (Chapter 5, Fig. 5), and the retention
of less cell water (Chapter 5, Fig. 6) was evidenced in this study.
Field validation from a different location (Chapter 5, Fig. 7) confirmed the
ability of the perennial wheat derivatives, CPI147235a, and CPI-148055, to extract
water from greater depths of the soil profile than annual wheat. Water extraction

- 170 -
from deeper soil layers by perennial wheat derivatives under extended drying down
conditions evidenced in this study add new findings to the literature about water
extraction ability and drought resistance in perennials. In perennial rice breeding in
Asia, drought resistance sources were provided from the wild species (Sacks 2014).
Thus, specific traits of drought resistance could be added by breeding in the case of
perennial wheat for adaptation to drier environmental conditions in Australia.
6.1.5 Ecosystem services and disservices provided by perennial grain crops
This research has contributed to the following understandings of the benefits and
challenges for perennial wheat (as presented in Chapter 2 of this thesis) and has
considered specific ecosystem services provided by perennial grain crops. The
potential benefits of a perennial wheat for the environment were integrated from the
findings of this study. The results obtained in this study containing new information
about perennial wheat, in the context of previous research findings, were as follows:
More biomass production ability associated with grain yield up to three years
without the need for reseeding (Chapter 3, Fig. 10). Both biomass and grain
might be used as forage (animal feed) in mixed farming systems where
livestock is included in the farming system and thus provides services to
ecosystems, as farmers and animals would benefit greatly and are considered
to be part of ecosystems.
Longer-lived and deeper-root systems could reduce nutrient leaching losses,
and efficient nutrient use by perennial grain crops could serve agro-ecological
services by translocating nutrients.
In this research, the ability of perennial wheat derivatives to lower nutrient
leaching compared to annual wheat was not examined directly. (Culman et al.
2013) examined the perennial grain, Kernza wheat grass, at the W.K. Kellogg
- 171 -
Biological Station in Hickory Corners in Michigan. They found evidence of
low soil moisture at lower soil depths and an 86% reduction in total nitrate
leaching in the second year of growth for the perennial grain, Kernza wheat
grass, in comparison to that for annual wheat. They also found evidence of a
13% increase in carbon mineralisation by the second year of growth of
perennial wheatgrass, in comparison to that for annual wheat. Longer lived
extensive root systems might be able to take up nutrients at higher rates and
thus might be able to manage nutrient leaching. Thus, extensive and larger
root systems might be able to lower concentrations of nitrogen in
groundwater.
Carbon sequestration biomass in perennial wheat was addressed in Chapter 3
as one of the major ecosystem service providers. Measurements of total dry
matter partitioning and root growth were taken at different times during three
years of growing seasons, and perennial wheat and perennial grass were
found to produce more above- and below-ground biomass, and thus were able
to sequestrate more carbon compared to annual wheat during the same
growing seasons.
Perennial grain crops provided better ground coverage and reduced soil
erosion throughout the year, thus serving agro-ecological services through
soil protection.
Improved hydrological balance and water use by water uptake in deeper soil
layers, with longer and more extensive root systems in deeper soil layers and
early season growth in perennial wheat offering the potential to capture rain.
More above-ground biomass produced in perennial grain crop systems could
add more soil organic carbon and thus improve soil quality. Soils rich in
organic matter could improve soil water and nutrient retention, and in turn,

- 172 -
improve soil bulk density, soil microbial populations and soil structure to
improve soil quality and be an important part of sustainable agriculture.
Resistance against insect pest attacks through ecologically-based approaches
like biological control. That is, the provision of long-term habitat and/or
habitat overwinter or continuous groundcover to predators and parasites
(natural enemy populations) could support and promote healthy agricultural
systems - thus, perennial grain crops could ensure higher ecosystem services
in sustainable agriculture.
On the other hand, perennial grain systems might contribute to certain
ecosystem disservices like the hosting of pests and the provision of a reservoir of
diseases. The long-term persistence and regrowth of perennial grains in fall,
especially when annual grains were unable to grow, might act as a reservoir of
pathogens and could thus spread diseases. By providing a presence of all year round,
perennial grains might contribute to increases in pest and disease populations, and
could be a threat to ecosystem services. This research did not directly address the
possibility of perennial wheat acting as a reservoir for pests and/or a disease host.
However, prior research reported by (Hayes et al. 2012) showed that using
Thinopyrum intermedium, Thinopyrum ponticum and Thinopyrum elongatum
derivatives as disease resistance parents provided good disease resistance for WSMV
for the derivatives from these parents. A wide variety of examples of pathogen
resistance has been reported in previous literature, which includes barley yellow
dwarf virus; however, pathogen resistance was beyond the scope of this current
study. Nonetheless, it could be assumed that a break-up in the disease cycle could be
supported by perennial wheat cropping in contrast to that from an annual
monoculture of wheat.

- 173 -
These studies on perennial wheat did not investigate diseases and insect pressure
directly. However, different research with 150 genotypes including the genotypes
used in this experiment reported that perennial wheat showed advanced disease
resistance over rust (leaf, stem and stripe) and wheat streak mosaic virus, and
confirmed the environmental safety against disease threats by perennial wheat
incidence in Australian conditions (Hayes et al. 2012). In separate research in the
USA using different germplasms of perennial wheat, (Jaikumar 2013) found strong
resistance against Fusarium graminerum and very low susceptibility with very few
disease symptoms. In a review article, Cox et al. (2005) argued that there were
longer living root systems in perennial wheat and the existence of crowns as a barrier
against soil borne pathogens.
6.2 Conclusion
In conclusion, these studies were able to confirm the potential for the use of
current germplasms of perennial wheat and perennial grass. Both were able to
survive for three years and regrow, and were able to achieve the benchmark in grain
yield (40% of annual wheat yield with added forage (Bell et al. 2008)). Source-sink
balance manipulation treatments showed dry matter allocation being prioritised
towards roots, suggesting perennation and survival priorities in perennial wheat and
in perennial grass in contrast to that for annual wheat. Greater spike production and
bolder seed production abilities in perennials in the source-sink manipulation study
suggests further breeding efforts could be attempted for higher grain yield in
perennial wheat. Perennials were found to have longer lived and more extensive root
systems as they became older. The deeper and longer lived extensive root systems in
perennials were able to extract more water from deeper soil depths and to support
longer survival compared to annual wheat under extended drying down conditions.

- 174 -
6.3 Directions for future studies
The number one priority should be to repeat these experiments in the field, to
translate the results to a per unit area basis, in a situation in which roots are not
constrained by the soil column, but only by field soil characteristics. Proper field
validation is essential, in order to translate the principles revealed here into actual
quantitative performance and survival relationships.
i. The specific reasons for the failure of perennial wheat derivatives to regrow
for longer time along with different seasonal planting could be investigated.
Variable regrowth was observed in some perennial genotypes and also
confirmed by other researchers for the same genotypes at the same sites in
different years of planting. This was particularly evident for the reported
perennial genotypes — those that were showing successful regrowth in one
season of planting, but that had failed to regrow in different planting years at
the same site.
ii. Using newer technology and experimental set-ups like the Rhizo-lysimeter
and neutron probe for assessing the moisture content of the deeper soil layers
would allow comprehensive information about root and soil water in deeper
soil layers without destructive sampling. This could provide more insight into
perennial wheat growth for longer durations (3–4 years) and reduce the need
for labour intensive and time-consuming destructive sampling of roots.
iii. Evaluation of source-sink manipulations and their impact on resource re-
allocation in the field would provide more understanding on dry matter
partitioning in perennial wheat.
iv. Crop performance evaluations in multi-location trials using suitable current
germplasms with the adaptability to target specific environments in field
trials would provide evidence of perennial wheat ecosystem services.

- 175 -
v. Perennial wheat breeding could be done for target environments in Australia.
vi. Detailed studies about survival and regrowth would be able to provide more
insight about the physiological attributes controlling regrowth mechanisms in
perennial wheat.

- 176 -
7 References
Addiscott TM (1996) Fertilizers and nitrate leaching. Issues in Environmental
Science and Technology (United Kingdom)
Amiard V, Morvan-Bertrand A, Billard J-P, Huault C, Keller F, Prud'homme M-P
(2003) Fructans, but not the sucrosyl-galactosides, raffinose and loliose, are
affected by drought stress in perennial ryegrass. Plant physiology 132, 2218-
2229.
Anamthawat-Jonsson K (1996) Wide-hybrids between wheat and lymegrass:
breeding and agricultural potential. Buvusindi 10, 101-113.
Angus J, Moncur M (1977) Water stress and phenology in wheat. Crop and Pasture
Science 28, 177-181.
Angus J, Kirkegaard J, Peoples M (2001) Rotation, sequence and phase: research on
crop and pasture systems. In 'Proceedings of the 10th Australian Society of
Agronomy Conference, Hobart'
Aragón CF, Méndez M, Escudero A (2009) Survival costs of reproduction in a short-
lived perennial plant: live hard, die young. American Journal of Botany 96,
904-911.
Bakker J (1995) 'Greenhouse climate control: an integrated approach.' (Wageningen
Academic Pub).
Barker D, Sullivan C, Moser LE (1993) Water deficit effects on osmotic potential,
cell wall elasticity, and proline in five forage grasses. Agronomy journal 85,
270-275.
Barlow E, Munns R, Brady C, Turner N, Kramer P (1980) Drought responses of
apical meristems. Adaptation of plants to water and high temperature stress.,
191-205.
Baum M, Appels R (1991) Review: the cytogenetic and molecular architecture of
chromosome 1R—one of the most widely utilized sources of alien chromatin
in wheat varieties. Chromosoma 101, 1-10.
Bazzaz FA, Ackerly DD, Reekie EG (2000) Reproductive allocation in plants. Seeds:
the ecology of regeneration in plant communities, 1-29.
Bell L, Wade LJ, Ewing MA (2006) 'A Review of the prospects of perennial wheat
in Australian farming systems: potential benefits, constraints and risks. .'
Perth, Australia,.
Bell L, Byrne F, Ewing MA, Wade LJ (2008) A preliminary whole-farm economic
analysis of perennial wheat in an Australian dryland farming system.
Agricultural Systems 96, 166-174.
Bell L, Wade LJ, Ewing MA (2010) Perennial wheat: a review of environmental and
agronomic prospects for development in Australia. Crop and Pasture Science
61, 679-690.
Bidinger F, Musgrave R, Fischer R (1977) Contribution of stored pre-anthesis
assimilate to grain yield in wheat and barley.
Bingham J (1972) Physiological objectives in breeding for grain yield in wheat. In
'Proceedings of the 6th Eucarpia Congress, Cambridge' pp. 15-29
Blum A, Sinmena B, Mayer J, Golan G, Shpiler L (1994) Stem reserve mobilisation
supports wheat-grain filling under heat stress. Functional Plant Biology 21,
771-781.
Blum A (1998) Improving wheat grain filling under stress by stem reserve
mobilisation. Euphytica 100, 77-83.

- 177 -
Blum A (2005) Drought resistance, water-use efficiency, and yield potential—are
they compatible, dissonant, or mutually exclusive? Crop and Pasture Science
56, 1159-1168.
Blum A (2010) 'Plant Breeding for Water-Limited Environments.' (Springer).
Bockus W, Shroyer J (1998) The impact of reduced tillage on soilborne plant
pathogens. Annual Review of Phytopathology 36, 485-500.
Borlaug N (2007) Feeding a hungry world. Science 318, 359-359.
Brocklehurst P (1977) Factors controlling grain weight in wheat. Nature 266, 348 -
349.
Brooking I, Kirby E (1981) Interrelationships between stem and ear development in
winter wheat: the effects of a Norin 10 dwarfing gene, Gai/Rht2. The Journal
of Agricultural Science 97, 373-381.
Buckler ES, Thornsberry JM, Kresovich S (2001) Molecular diversity, structure and
domestication of grasses. Genetical research 77, 213-218.
Cassman KG, Dobermann A, Walters DT, Yang H (2003) Meeting cereal demand
while protecting natural resources and improving environmental quality.
Annual Review of Environment and Resources 28, 315-358.
Chen Q, Ahmad F, Collin J, Comeau A, Fedak G, St‐Pierre C (1998) Genomic
constitution of a partial amphiploid OK7211542 used as a source of immunity
to barley yellow dwarf virus for bread wheat. Plant breeding 117, 1-6.
Cox C, Garrett K, Bockus W (2005a) Meeting the challenge of disease management
in perennial grain cropping systems. Renewable Agriculture and Food
Systems 20, 15-24.
Cox C, Garrett K, Bockus W (2005b) Meeting the challenge of disease management
in perennial grain cropping systems. Renewable Agriculture and Food
Systems 20, 15-24.
Cox T, Bender M, Picone C, Van Tassel D, Holland J, Brummer E, Zoeller B,
Paterson A, Jackson W (2002) Breeding perennial grain crops. Critical
Reviews in Plant Sciences 21, 59-91.
Cox T, Glover JD, Van Tassel DL, Cox CM, DeHAAN LEER (2006) Prospects for
developing perennial grain crops. BioScience 56, 649-659.
Cox T, Van Tassel D, Cox C, DeHaan L (2010) Progress in breeding perennial
grains. Crop and Pasture Science 61, 513-521.
Cransberg L, McFarlane D (1994) Can perennial pastures provide the basis for a
sustainable farming system in southern Australia? New Zealand Journal of
Agricultural Research 37, 287-294.
Crews T (2005) Perennial crops and endogenous nutrient supplies. Renewable
Agriculture and Food Systems 20, 25-37.
Crews TE, Blesh J, Culman SW, Hayes RC, Jensen ES, Mack MC, Peoples MB,
Schipanski ME (2016) Going where no grains have gone before: From early
to mid-succession. Agriculture, Ecosystems & Environment 223, 223-238.
Cruz-Aguado JA, Reyes F, Rodes R, Perez I, Dorado M (1999) Effect of Source-to-
sink Ratio on Partitioning of Dry Matter and14C-photoassimilates in Wheat
during Grain Filling. Annals of Botany 83, 655-665.
Culman SW, Snapp SS, Ollenburger M, Basso B, DeHaan LR (2013) Soil and Water
Quality Rapidly Responds to the Perennial Grain Kernza Wheatgrass. Agron.
J. 105, 735-744.
DeHaan L, Van Tassel D, Cox T (2005) Perennial grain crops: a synthesis of ecology
and plant breeding. Renewable Agriculture and Food Systems 20, 5-14.

- 178 -
Demel R, Dorrepaal E, Ebskamp M, Smeekens J, De Kruijff B (1998) Fructans
interact strongly with model membranes. Biochimica et Biophysica Acta
(BBA)-Biomembranes 1375, 36-42.
Dinnes DL, Karlen DL, Jaynes DB, Kaspar TC, Hatfield JL, Colvin TS, Cambardella
CA (2002) Nitrogen management strategies to reduce nitrate leaching in tile-
drained Midwestern soils. Agronomy Journal 94, 153-171.
Dunin F, Williams J, Verburg K, Keating B (1999) Can agricultural management
emulate natural ecosystems in recharge control in south eastern Australia?
Agroforestry Systems 45, 343-364.
Evans L, Rawson H (1970) Photosynthesis and Respiration by the Flag Leaf and
Components of the Ear During Grain Development In Wheat. Australian
Journal of Biological Sciences 23, 245-254.
Evans LT (1998) 'Feeding the ten billion: plants and population growth.' (Cambridge
University Press).
Fedak G, Han F (2004) Characterization of derivatives from wheat-Thinopyrum wide
crosses. Cytogenetic and genome research 109, 360-367.
Fischer K, Wilson G (1975a) Studies of grain production in Sorghum bicolor (L.
Moench). IV.* Some effects of increasing and decreasing photosynthesis at
different stages of the plant's development on the storage capacity of the
inflorescence. Australian Journal of Agricultural Research 26, 25-30.
Fischer K, Wilson G (1975b) Studies of grain production in Sorghum bicolor (L.
Moench). III.* The relative importance of assimilate supply, grain growth
capacity and transport system. Australian Journal of Agricultural Research
26, 11-23.
Fischer K, Wilson G (1975c) Studies of grain production in Sorghum bicolor (L.
Moench). V.* Effect of planting density on growth and yield. Australian
Journal of Agricultural Research 26, 31-41.
Fischer R, HilleRisLambers D (1978a) Effect of environment and cultivar on source
limitation to grain weight in wheat. Crop and Pasture Science 29, 443-458.
Fischer RA, HilleRisLambers D (1978b) Effect of environment and cultivar on
source limitation to grain weight in wheat. Crop and Pasture Science 29,
443-458.
Fishcer R (1983) 'Wheat.' IRRI, Los Banos.
Gantzer C, Anderson S, Thompson A, Brown J (1990) Estimating soil erosion after
100 years of cropping on Sanborn Field. Journal of Soil and Water
Conservation 45, 641-644.
Glover J, Reganold J, Bell L, Borevitz J, Brummer E, Buckler E, Cox C, Cox T,
Crews T, Culman S (2010a) Increased food and ecosystem security via
perennial grains. Science(Washington) 328, 1638-1639.
Glover J, Reganold J, Bell L, Borevitz J, Buckler E, Cox C, Cox S, Crews T, Culman
S, DeHaan L (2010b) Increasing Food and Ecosystem Security through
Perennial Grain Breeding. Journal Title 2010, 06-24.
Glover JD (2005) The necessity and possibility of perennial grain production
systems. Renewable Agriculture and Food Systems 20, 1-4.
Hatton T, Nulsen R (1999) Towards achieving functional ecosystem mimicry with
respect to water cycling in southern Australian agriculture. Agroforestry
Systems 45, 203-214.
Hayes RC, Newell MT, DeHaan LR, Murphy KM, Crane S, Norton MR, Wade LJ,
Newberry M, Fahim M, Jones SS, Cox TS, Larkin PJ (2012) Perennial cereal
crops: An initial evaluation of wheat derivatives. Field Crops Research 133,
68-89.
- 179 -
Haynes R, Francis G (1993) Changes in microbial biomass C, soil carbohydrate
composition and aggregate stability induced by growth of selected crop and
forage species under field conditions. Journal of Soil Science 44, 665-675.
Hoen K (1968) Summer dormancy in Phalaris tuberosa. Crop and Pasture Science
19, 227-239.
Huggins DR, Randall GW, Russelle MP (2001) Subsurface drain losses of water and
nitrate following conversion of perennials to row crops. Agronomy
Journal93, 477-486.
Jackson W (2002) Natural systems agriculture: a truly radical alternative.
Agriculture, Ecosystems & Environment 88, 111-117.
Jaikumar NS, Snapp SS, Murphy K, Jones SS (2012) Agronomic Assessment of
Perennial Wheat and Perennial Rye as Cereal Crops. Agronomy Journal 104,
1716-1726.
Jaikumar NS (2013) Perennial cereal crops for the cold temperate zone: Agronomy,
physiology, sink regulation and disease resistance. MICHIGAN STATE
UNIVERSITY.
Jaikumar NS, Snapp SS, Flore JA, Loescher W (2014) Photosynthetic Responses in
Annual Rye, Perennial Wheat, and Perennial Rye Subjected to Modest
Source:Sink Ratio Changes. Crop Sci. 54, 274-283.
Jakubziner M (1958) New wheat species. In 'Proc. 1st Int. Wheat Genet. Symp' pp.
207-217
Jauhar PP, Peterson TS (1996) Thinopyrum and Lophopyrum as sources of genes for
wheat improvement. Cereal Research Communications, 15-21.
Jones SS, Murray TD, Allan RE (1995) The development of disease resistance in
wheat. Annual review of phytopathology 33, 429-443.
Kamoshita A, Rodriguez R, Yamauchi A, Wade L (2004) Genotypic variation in
response of rainfed lowland rice to prolonged drought and rewatering. Plant
Production Science7, 406-420.
Kemp D, Culvenor R (1994) Improving the grazing and drought tolerance of
temperate perennial grasses. New Zealand journal of agricultural research
37, 365-378.
Kim T, Ourry A, Boucaud J, Lemaire G (1991) Changes in source-sink relationship
for nitrogen during regrowth of lucerne (Medicago sativa L.) following
removal of shoots. Functional Plant Biology 18, 593-602.
Kirkegaard J, Lilley J (2007) Root penetration rate–a benchmark to identify soil and
plant limitations to rooting depth in wheat. Animal Production Science 47,
590-602.
Kirkegaard J, Lilley J, Howe G, Graham J (2007) Impact of subsoil water use on
wheat yield. Crop and Pasture Science 58, 303-315.
Koch K (1996) Carbohydrate-modulated gene expression in plants. Annual review of
plant biology 47, 509-540.
Kumar R, Sarawgi A, Ramos C, Amarante S, Ismail A, Wade L (2006) Partitioning
of dry matter during drought stress in rainfed lowland rice. Field crops
research 96, 455-465.
Larbi A, Mekliche A (2004) Relative water content (RWC) and leaf senescence as
screening tools for drought tolerance in wheat. Options Méditerranéennes.
Série A, Séminaires Méditerranéens 60, 193-196.
Larkin PJ, Newell MT, Hayes RC, Aktar J, Norton MR, Moroni SJ, Wade LJ (2014)
Progress in developing perennial wheats for grain and grazing. Crop and
Pasture Science 65 1147-1164.

- 180 -
Ledent J-F, Volkmar S, RAMET D, AIRAKSINEN H, PATKAI T (1985) Responses
to reductions in kernel number or to defoliation in collections of winter
wheats. Agronomie 5, 499-504.
Lefroy E, Stirzaker R (1999) Agroforestry for water management in the cropping
zone of southern Australia. Agroforestry Systems 45, 277-302.
Levitt J (1980) Response of plants to environmental stresses. Water, radiation, salt
and other stresses 2
Liu F, Jensen CR, Andersen MN (2005) A review of drought adaptation in crop
plants: changes in vegetative and reproductive physiology induced by ABA-
based chemical signals. Crop and Pasture Science 56, 1245-1252.
Ludlow M, Ng T (1974) Water stress suspends leaf ageing. Plant science letters3,
235-240.
Ludlow M, Muchow R (1990) A critical evaluation of traits for improving crop
yields in water-limited environments. Advances in agronomy 43, 107-153.
Ma Y-Z, MacKown C, Van Sanford D (1990) Sink manipulation in wheat:
Compensatory changes in kernel size. Crop Science 30, 1099-1105.
Milne R, Haynes R (2004) Soil organic matter, microbial properties, and aggregate
stability under annual and perennial pastures. Biology and Fertility of Soils
39, 172-178.
Morgan JM (1984) Osmoregulation and water stress in higher plants. Annual Review
of Plant Physiology 35, 299-319.
Murphy K, Hoagland LA, Reeves PG, Baik BK, Jones SS (2009) Nutritional and
quality characteristics expressed in 31 perennial wheat breeding lines.
Renewable Agriculture and Food Systems 24, 285.
Murphy K, Lyon SR, Balow KA, Jones SS (2010) Post-sexual cycle regrowth and
grain yield in Thinopyrum elongatum × Triticum aestivum amphiploids.
Plant Breeding 129, 480-483.
Newell M, Larkin P, Hayes R, Norton M (2010) Evaluation of perennial wheat
germplasm in an Australian environment. In 'Australian Agronomy
Conference'. (Ed. HDaRA Culvenor). (Lincoln, New Zealand.).
Norton M, Volaire F, Lelievre F (2006) Summer dormancy in Festuca arundinacea
Schreb.; the influence of season of sowing and a simulated mid-summer
storm on two contrasting cultivars. Crop and Pasture Science 57, 1267-1277.
Norton MR, Volaire F, Lelièvre F, Fukai S (2009) Identification and measurement of
summer dormancy in temperate perennial grasses. Crop Science 49, 2347-
2352.
Ouk M, Basnayake J, Tsubo M, Fukai S, Fischer K, Cooper M, Nesbitt H (2006) Use
of drought response index for identification of drought tolerant genotypes in
rainfed lowland rice. Field Crops Research 99, 48-58.
Ovenden B (2015) Genetic Architecture of Water-Soluble Carbohydrates in Wheat
Ben Ovenden. Charles Sturt University
Palta JA, Chen X, Milroy SP, Rebetzke GJ, Dreccer MF, Watt M (2011) Large root
systems: are they useful in adapting wheat to dry environments? Functional
Plant Biology 38, 347-354.
Pannell DJ, Ewing MA (2006) Managing secondary dryland salinity: Options and
challenges. Agricultural Water Management 80, 41-56.
Patrick J (1972) Distribution of assimilate during stem elongation in wheat.
Australian Journal of Biological Sciences 25, 455-468.
Patrick J (1988) Assimilate partitioning in relation to crop productivity. HortScience
(USA)

- 181 -
Pimentel D, Cerasale D, Stanley RC, Perlman R, Newman EM, Brent LC, Mullan A,
Chang DT-I (2012) Annual vs. perennial grain production. Agriculture,
Ecosystems & Environment 161, 1-9.
Piper JK, Kulakow PA (1994) Seed yield and biomass allocation in Sorghum bicolor
and F1 and backcross generations of S. bicolor× S. halepense hybrids.
Canadian Journal of Botany 72, 468-474.
Ploetz R (2007) Diseases of tropical perennial crops: challenging problems in diverse
environments. Plant Disease 91, 644-663.
Randall G, Huggins D, Russelle M, Fuchs D, Nelson W, Anderson J (1997) Nitrate
losses through subsurface tile drainage in conservation reserve program,
alfalfa, and row crop systems. Journal of Environmental Quality 26, 1240-
1247.
Rawson H, Gifford R, Bremner P (1976) Carbon dioxide exchange in relation to sink
demand in wheat. Planta 132, 19-23.
Reed K (1996) Improving the adaptation of perennial ryegrass, tall fescue, phalaris,
and cocksfoot for Australia. New Zealand journal of agricultural research
39, 457-464.
Reekie E, Bazzaz F (1987) Reproductive effort in plants. 2. Does carbon reflect the
allocation of other resources? American Naturalist, 897-906.
Reynolds M, Rajaram S, McNab A (1996) 'Increasing yield potential in wheat:
breaking the barriers: proceedings of a workshop held in Ciudad Obregón,
Sonora, Mexico.' (CIMMYT).
Richards R (1996) Increasing the yield potential of wheat: manipulating sources and
sinks. Increasing yield potential in wheat: breaking the barriers, 134-149.
Ridley A, White R, Helyar K, Morrison G, Heng L, Fisher R (2001) Nitrate leaching
loss under annual and perennial pastures with and without lime on a duplex
(texture contrast) soil in humid southeastern Australia. European Journal of
Soil Science 52, 237-252.
Ridley AM, Pannell DJ (2006) The role of plants and plant-based research and
development in managing dryland salinity in Australia. Animal Production
Science 45, 1341-1355.
Robertson GP, Paul EA, Harwood RR (2000) Greenhouse gases in intensive
agriculture: contributions of individual gases to the radiative forcing of the
atmosphere. Science 289, 1922-1925.
Sacks EJ, Roxas JP, Cruz MTS (2003) Developing Perennial Upland Rice I. Crop
Science 43, 120-128.
Sacks EJ (2014) Perennial rice: challenges and oppurtunities. In 'Perennial Crops for
Food Security'. Rome Italy. (Eds C Batello, L Wade, S Cox, N Pogna, A
Bozzini and J Choptiany) pp. 16-26. (food and agriculture organization of the
united nations).
Salazs A, Ievinsh G (2004) The impact of the Latvian plant physiologist Auseklis
Ve© is (1903-1973) in modern natural sciences. Acta Universitatis Latviensis
676, 7-15.
Scheinost PL, Lammer DL, Cai X, Murray TD, Jones SS (2001) Perennial wheat: the
development of a sustainable cropping system for the US Pacific Northwest.
American Journal of Alternative Agriculture 16, 147-151.
Schnyder H (1993) The role of carbohydrate storage and redistribution in the
source‐sink relations of wheat and barley during grain filling—a review. New
Phytologist 123, 233-245.
Schonfeld MA, Johnson RC, Carver BF, Mornhinweg DW (1988) Water relations in
winter wheat as drought resistance indicators. Crop Science 28, 526-531.

- 182 -
Seidel P (1996) Tolerance responses of plants to stress. The unused reserve in plant
protection. Plant Research and Development 44, 81-99.
Siddique K, Kirby E, Perry M (1989) Ear: stem ratio in old and modern wheat
varieties; relationship with improvement in number of grains per ear and
yield. Field Crops Research 21, 59-78.
Silsbury J (1964) Tiller dynamics, growth, and persistency of Lolium perenne L. and
of Lolium rigidum Gaud. Crop and Pasture Science 15, 9-20.
Sinclair TR, Muchow R, Ludlow M, Leach G, Lawn R, Foale M (1987) Field and
model analysis of the effect of water deficits on carbon and nitrogen
accumulation by soybean, cowpea and black gram. Field Crops Research 17,
121-140.
Singh DP, Singh A (2005) 'Disease and insect resistance in plants.' (Science
Publishers, Inc.).
Singh M, Srivastava J, Kumar A (1990) Effect of water stress on water potential
components in wheat genotypes. Indian Journal of Plant Physiology 33, 312-
317.
Slatyer R (1969) Physiological significance of internal water relations to crop yield.
Agronomy--Faculty Publications, 186.
Strand (2010) Going with the Grain. Salina Journalhttp://www.salina.com/wes-
wheat (11.08.11).
Suneson C, Pope W (1946) Progress with Triticum× Agropyron crosses in
California. Agronomy Journal 38, 956-963.
Suneson C (1959) Perennial wheat offered. Ann. Wheat Newsl 6, 34-35.
Tilman D, Fargione J, Wolff B, D'Antonio C, Dobson A, Howarth R, Schindler D,
Schlesinger WH, Simberloff D, Swackhamer D (2001) Forecasting
agriculturally driven global environmental change. Science 292, 281-284.
Tsitsin N, Lubimova V (1959) New species and forms of cereals derived from
hybridization between wheat and couch grass. American Naturalist, 181-191.
Turner NC (1986) Adaptation to water deficits: a changing perspective. Functional
Plant Biology 13, 175-190.
Van Tassel DL, DeHaan LR, Cox TS (2010) Missing domesticated plant forms: can
artificial selection fill the gap? Evolutionary Applications 3, 434-452.
Vinall HN, Hein MA (1937) Breeding miscellaneous grasses. Yearbook of the United
States Department of Agriculture, 1032-102.
Vogel J (2013) Brachypodium sylvaticum, a Model for Perennial Grasses:
Transformation and Inbred Line Development. In 'Plant and Animal Genome
XXI Conference'. (Plant and Animal Genome).
https://pag.confex.com/pag/xxi/webprogram/Paper6788.html.
Volaire F, Thomas H, Lelievre F (1998) Survival and recovery of perennial forage
grasses under prolonged Mediterranean drought: I. Growth, death, water
relations and solute content in herbage and stubble. New Phytologist 140,
439-449.
Volaire F, Norton M (2006) Summer dormancy in perennial temperate grasses.
Annals of botany 98, 927-933.
Wade LJ (2014) Perennial crops: needs, perceptions, essentials. In 'Perennial Crops
for Food Security'. Rome Italy. (Eds C Batello, L Wade, S Cox, N Pogna, A
Bozzini and J Choptiany) p. 6. (food and agriculture organization of the
united nations).
Wagoner P (1990) Perennial grain development: past efforts and potential for the
future. Critical Reviews in Plant Sciences 9, 381-408.

- 183 -
Wagoner P, Schauer A, Janick J, Simon J (1990) Intermediate wheatgrass as a
perennial grain crop. In 'Advances in new crops. Proceedings of the first
national symposium'New crops: research, development, economics',
Indianapolis, Indiana, USA, 23-26 October 1988.' pp. 143-145. (Timber
Press).
Walpole P, Morgan D (1970) A quantitative study of grain filling in Triticum
aestivum L., cultivar Maris Widgeon. Annals of Botany 34, 309-318.
Wardlaw IF (1968) The control and pattern of movement of carbohydrates in plants.
The Botanical Review 34, 79-105.
Wardlaw IF (1994) The effect of high temperature on kernel development in wheat:
variability related to pre-heading and post-anthesis conditions. Functional
Plant Biology 21, 731-739.
Wardlaw IF, Willenbrink J (1994) Carbohydrate storage and mobilisation by the
culm of wheat between heading and grain maturity: the relation to sucrose
synthase and sucrose-phosphate synthase. Functional Plant Biology 21, 255-
271.
Watt D (1989) Economic feasibility of a perennial grain: intermediate wheatgrass.
North Dakota research report-North Dakota Agricultural Experiment Station
West C, Oosterhuis D, Wullschleger S (1990) Osmotic adjustment in tissues of tall
fescue in response to water deficit. Environmental and experimental botany
30, 149-156.
Wheelwright NT, Logan BA (2004) Previous-year reproduction reduces
photosynthetic capacity and slows lifetime growth in females of a neotropical
tree. Proceedings of the National Academy of Sciences of the United States of
America 101, 8051-8055.
White R, Engelke M, Morton SJ, Ruemmele B (1992) Competitive turgor
maintenance in tall fescue. Crop science 32, 251-256.
Xu S, Jin Y, Klindworth D, Wang R-C, Cai X (2009) Evaluation and characterization
of seedling resistances to stem rust Ug99 races in wheat–alien species
derivatives. Crop science 49, 2167-2175.
Zamski E, Schaffer AA (1996) 'Photoassimilate distribution in plants and crops:
source-sink relationships.' (Marcel Dekker Inc.).
Zhou Y, Lambrides CJ, Fukai S (2014) Drought resistance and soil water extraction
of a perennial C4 grass: contributions of root and rhizome traits. Functional
Plant Biology 41, 505-519.
Zotz G, Richter A (2006) Changes in carbohydrate and nutrient contents throughout
a reproductive cycle indicate that phosphorus is a limiting nutrient in the
epiphytic bromeliad, Werauhia sanguinolenta. Annals of botany 97, 745-754.

- 184 -
Appendix
Appendix 1. Timeline of activities during the experiment.
Year Month Activity done
2011 May-Jun Sowing
Jul-Aug Sep-Oct Nov-Dec Harvest at flowering and harvest at maturity
2012 Jan-Feb Mar-Apr Dry season harvest- DS1 May-Jun Re-sowing of annual wheat and replanting
Jul-Aug
Sep-Oct
Nov-Dec Harvest at WS2 at maturity
2013 Jan-Feb
Mar-Apr Dry season harvest- DS2
May-Jun Re-sowing of annual wheat and replanting
Jul-Aug
Sep-Oct
Nov-Dec Harvest at WS3 at maturity