dry autothermal reforming of fuels - csir …ncl.csircentral.net/1605/1/thesis.pdfdeclaration by the...
TRANSCRIPT
A Doctoral Thesis on
DRY AUTOTHERMAL REFORMING
OF FUELS
SUBMITTED TO THE
University of Pune
FOR THE DEGREE OF
DOCTOR OF PHILOSOPHY
(In Chemical Engineering)
BY
GANESH R. KALE
National Chemical Laboratory, Pune
(Registered with University of Pune)
This research work was carried out with place of research
Chemical Engineering & Process Development Division
National Chemical Laboratory, Pune – 411008, INDIA.
June 2014

Dedicated to my Parents, family and
NCL
CERTIFICATE OF THE GUIDE
CERTIFIED that the work incorporated in the thesis DRY AUTOTHERMAL
REFORMING OF FUELS submitted by Mr. Ganesh R. Kale was carried out by the
candidate under my supervision/ guidance. Such material as has been obtained from
other sources has been duly acknowledged in the thesis.
Dr. B. D. Kulkarni
(Supervisor/ Research Guide)

DECLARATION BY THE CANDIDATE
I declare that the thesis entitled DRY AUTOTHERMAL REFORMING OF
FUELS submitted by me for the degree of Doctor of Philosophy is the record of
work carried out by me during the period from July 2005 to February 2014 under the
guidance of Dr. B.D. Kulkarni and has not formed the basis for the award of any
degree, diploma, associateship, fellowship, titles in this or any other University or
other institution of Higher learning.
I further declare that the material obtained from other sources has been duly
acknowledged in the thesis.
(Ganesh R. Kale) Date: 6 June 2014

Acknowledgement
A doctorial degree is a vital component of a researcher’s life. I started this research
work with great enthusiasm a few years ago and now I feel very happy to complete
this research thesis. I am highly indebted to my research guide Dr. B D Kulkarni for
guiding me in this research work, correcting my ideas and constantly encouraging me
to think in positive direction, without which I would not have succeeded this far. I
have taken a lot of his time during the past few years to learn invaluable research
themes and ideas, patience to pursue them till completion and importance of
updating research skills. I also wish to thank members of the research committee,
Dr. Tambe and Dr. Inamdar for their continuous help and suggestions for completing
this research thesis.
I am also indebted to my parents, my wife and my children who have
wholeheartedly supported me to reach this most important milestone in my life and
missed me at home on many important occasions.
My special thanks to Mr. Ajit Joshi, Mr Prakash Bhujang, Mr. Prashant Kulkarni and
Mr. Ganpat Mane who have helped me in all aspects of life in these years. I cannot
forget the kind help and advice of Mr V G Kulkarni, Mr. G M Chaphekar and Dr. S N
Shintre, who have interacted with me many times to ensure that I stay on path to
complete this degree.
I also wish to thank Dr. V V Ranade, Dr. P V Rao, Dr. M S Qureshi, Dr. Imran Rehman,
Dr. Gurunath and Dr. Sunil Bhongale for their kind support and advice. I also thank
my students for helping me in various aspects of research activities and calculations
through which I gained better understanding on many research themes. I sincerely
thank my colleagues Prof. Ratnadip Joshi, Dr. Harshavardhan Pol and Dr.
Deenadayalan for their help me in this Ph.D venture.
Lastly, I also thank those whom I may have missed mentioning unknowingly.
Ganesh R. Kale

Abstract
CO2 is a greenhouse gas that is emitted worldwide by various chemical processes and
is responsible for problems like global warming and climate change. The serious
need to cut CO2 emissions from the chemical processes is already under
implementation. Simultaneously the development of CO2 utilization processes to
convert CO2 to value added chemicals is also a crucial requirement for chemical
industries.
This research work is focused on the CO2 utilization by dry autothermal reforming
(DATR) which is similar to steam reforming, autothermal reforming and dry
reforming. A basic thermodynamic basis, similar to these processes, is adopted and
is further expanded in depth. The main assumption of thermodynamic chemical
equilibrium (which defines the maximum possible conversion in chemical processes)
is applied to the DATR process. Application of DATR to some well known areas in
chemical industry is also studied in this research. Traditional fuels such as coal, LPG,
gasoline and bio fuels like ethanol and glycerol are used in this study.
The research work starts with a general product distribution study in a DATR process
at different operating parameters. This establishes the thermodynamic feasibility of
DATR. It expands further to study the distribution of thermoneutral points for DATR
process operation and the product yield trends at the thermoneutral points.
Thermoneutral temperatures are very important process operational points in
autothermal processes. The application of DATR in fuel processor development to
generate syngas to fuel the Solid Oxide fuel cells, and its comparison to the
traditional autothermal reforming is studied. Further, the application of DATR in coal
gasification and its comparison with steam coal gasification in mixtures and the
generation of value added products is also studied. The coupling of DATR to chemical
looping combustion (CLC) to sequester the generated CO2 for value added product
generation is further studied in this research work. The conclusions of the thesis with
a few recommendations as possible directions for future research are discussed in
the last chapter.

Dry Autothermal reforming of fuels
Ganesh R. Kale
June 6, 2014

2
Contents
1 Introduction 9
1.1 Introduction 10
1.2 Methodology 12
1.3 Summarized details of each chapter 15
1.4 References 18
2 Thermodynamic analysis of dry autothermal reforming of
Glycerol 19
2.1 Glycerol as fuel 21
2.2 Thermodynamic analysis 25
2.3 Results and Discussion 26
2.3.1 Hydrogen yield 26
2.3.2 CO yield 28
2.3.3 Variation of Syngas ratio of product gas 29
2.3.4 Total hydrogen potential 30
2.3.5 Methane formation 32
2.3.6 CO2 obtained in product gas 33
2.3.7 Water formation 34
2.3.8 Carbon formation 35
2.3.9 Process Enthalpy and Thermoneutral points 36
2.4 Conclusions 38
2.5 References 38
3 Thermoneutral point analysis of ethanol dry autothermal
reforming 44
3.1 Ethanol as fuel 46
3.2 Methodology 50
3.3 Results and Discussion 51
3.3.1 Thermoneutral points for DATR of ethanol 52

3
3.3.2 Hydrogen yield at TNP 53
3.3.3 CO yield at TNP 54
3.3.4 Syngas amount at TNP 56
3.3.5 Syngas ratio at TNP 57
3.3.6 Methane formation at TNP 59
3.3.7 Water formation at TNP 60
3.3.8 Carbon formation at TNP 62
3.3.9 CO2 conversion (%) at TNP 63
3.4 Conclusions 64
3.5 References 67
4 Application of DATR in gasoline fuel processors 72
4.1 Fuel processors and Gasoline 74
4.2 Methodology 77
4.3 Results and Discussion 78
4.3.1 Process enthalpy 79
4.3.2 Thermo neutral points 80
4.3.3 Total hydrogen 83
4.3.4 CO yield 85
4.3.5 Water formation 86
4.3.6 Carbon formation 88
4.3.7 Process energy calculations 89
4.4 Conclusion 92
4.5 References 93
5 Dry autothermal gasification of lignite coal 97
5.1 Coal as fuel 99
5.2 Methodology 105
5.3 Results and discussion 108

4
5.3.1 Effect of pressure 108
5.3.2 Syngas yield 110
5.3.3 Methane Formation 112
5.3.4 Carbon (in coal) conversion (%) 114
5.3.5 Net CO2 Emission / CO2 utilization 117
5.3.6 Gasification enthalpy and thermoneutral points 119
5.3.7 Syngas ratio 122
5.3.8 Applications 123
5.4 Conclusion 131
5.5 References 132
6 DATR in Chemical looping combustion systems 140
6.1 Introduction 142
6.1.1 Chemical looping combustion 144
6.1.2 Dry autothermal reformer 151
6.2 Conceptual Process Design and Methodology 145
6.3 Results and Discussion 149
6.3.1 Gibbs Free Energy of CLC reactions 149
6.3.2 Reaction Enthalpy of DATR reactor 150
6.3.3 Hydrogen yield 152
6.3.4 Carbon Monoxide yield 164
6.3.5 CO2 Conversion 155
6.3.6 Methane formation 157
6.3.7 Syngas yield 158
6.3.8 Syngas ratio 160
6.3.9 Carbon formation 161
6.3.10 H2O conversion 163
6.4 Conclusion 164
6.5 References 165

5
7 Concluding remarks 170
7.1 Conclusions 171
7.2 Recommendations 171
7.3 Publications 172

6
List of Figures
1.1 Conceptual process design of DATR 12
2.1 Yield of hydrogen in DR and DATR of Glycerol 28
2.2 Yield of CO in DR and DATR of Glycerol 29
2.3 Syngas ratio (H2/CO) in DR and DATR of Glycerol 30
2.4 Moles of total hydrogen produced in DR and DATR of Glycerol 31
2.5 Moles of methane produced in DR and DATR of Glycerol 32
2.6 Moles of CO2 produced in DR and DATR of Glycerol 33
2.7 Moles of water produced in DR and DATR of Glycerol 34
2.8 Moles of carbon produced in DR and DATR of Glycerol 35
2.9 Process enthalpy for DATR of Glycerol 36
3.1 Thermoneutral temperatures in DATR of Ethanol 52
3.2 Hydrogen yield at thermoneutral temperatures 54
3.3 Carbon monoxide yield at thermoneutral temperatures 55
3.4 Syngas yield at thermoneutral temperatures 56
3.5 Syngas ratio at thermoneutral temperatures 58
3.6 Methane yield at thermoneutral temperatures 60
3.7 Water yield at thermoneutral temperatures 61
3.8 Carbon yield at thermoneutral temperatures 63
3.9 Carbon dioxide conversion at thermoneutral temperatures 64
4.1a Process enthalpy for ATR of Iso-octane 78
4.1b Process enthalpy for DATR of Iso-octane 79
4.2 Thermoneutral temperatures for ATR and DATR of isooctane 81
4.3 Total Hydrogen for ATR and DATR of isooctane 84
4.4 CO formation for ATR and DATR of isooctane 86
4.5 Water formation for ATR and DATR of isooctane 87
4.6 Carbon formation for ATR and DATR of isooctane 89

7
4.7 Energy comparison per mole syngas 91
5.1 Carbon conversion at different pressures 109
5.2 Syngas yield at 600°C for the different feed conditions 110
5.3 Syngas yield in combined coal gasification 111
5.4 CH4 formation in combined coal gasification 114
5.5 Net CO2 emission in combined coal gasification 118
5.6 Thermoneutral temperatures in combined coal gasifier 120
5.7 Syngas ratio of product gas 124
5.8 Total heat of combustion of gasifier product gas 131
6.1 Process Diagram of CLC coupled CR 147
6.2 Thermodynamic Feasibility of CLC Reactions 150
6.3 Enthalpy of combined Reforming 152
6.4 Hydrogen yield in combined reforming of propane 153
6.5 Carbon monoxide yield in combined reforming 155
6.6 CO2 conversion in combined reforming of propane 156
6.7 Methane yield in combined reforming of propane 158
6.8 Syngas yield in combined reforming of propane 159
6.9 Syngas ratio in combined reforming of propane 161
6.10 Carbon formation in combined reforming of propane 162
6.11 H2O conversion in combined reforming of propane 164

8
List of Tables
2.1 Hydrogen yield in DATR of Glycerol at different pressures 27
2.2 Product gas composition in DATR of Glycerol at thermoneutral
temperatures (K) & 1 bar pressure 37
3.1 Thermoneutral points for DATR of ethanol 66
4.1 Thermoneutral points for ATR and DATR 79
5.1 Gasification conditions 107
5.2 100% carbon conversion temperatures for Lignite coal 116
5.3 100% carbon conversion in pure carbon gasification 117
5.4 Equilibrium gasifier gas composition at thermoneutral temperatures 121
5.5 Comparison between thermoneutral temperature (°C) and 100 % carbon conversion temperature (°C) for Lignite coal 122
5.6 Temperature range (in °C) for syngas ratio 1-3 126
5.7 Syngas concentration (%) of syngas ratio (1-3) gasifier gas 128
5.8 Temperature range (°C) and syngas concentration (%) for H2O/CO
Ratio of gasifier product gas 129

CHAPTER 1: Introduction
Chapter 1
Introduction

CHAPTER 1: Introduction
10
1.1 Introduction
Carbon based fossil fuels like coal, oil and gas are widely combusted to
generate thermal energy (based on their heat of combustion), which is then
converted to other forms of energy. The flue gas emitted from the combustion
process mainly consists of N2, CO2, along with nitrogen oxides, sulfur oxides,
CO, H2, excess oxygen and some particulate matter and is released to the
atmosphere increasing CO2 emissions that lead to global warming and
climate change issues that have emerged as a major problem for rich
industrialized nations as well as developing countries. Reducing CO2
emissions to atmosphere is a solution to slow the impacts of climate change,
however it has many limitations. Carbon sequestration through plants was a
well established culture, but nowadays the rate at which these CO2 emissions
occur cannot be helped by biological systems like trees as they are regularly
deforested. Pure CO2 generation using clean energy techniques like chemical
looping combustion is also researched but the CO2 utilization is not much
researched area. There is a need of an innovative way to sequester carbon
dioxide. CO2 utilization by chemical reactions / processes is a crucial
necessity today as these reactions are fast and can be scaled up to larger
capacities easily.
CO2 utilization has been a hot topic for research in many countries. There are
several chemical reactions / processes that are being researched to convert
CO2 to value added chemicals. One of the most important products of CO2
utilization is syngas (H2 + CO). Syngas is a useful value added product for
many applications. Syngas has been used as raw material to produce
hydrocarbons, as fuel in IC engines, for synthesis of LPG, gasoline, alcohols,
DME, as fuel in gas turbines, for use in coal liquefaction, for use in co-firing
and reburning in a coal fired boiler, for synthesis of methanethiol, as fuel in
fuel cells and is also used to synthesize biofuels by syngas fermentation. Dry
reforming is one of the most popular catalytic process to convert CO2 to
syngas. Many research studies about dry reforming are reported in literature.
CHAPTER 1: Introduction
11
Jankhah et al. (2008) have studied the thermodynamic equilibrium analysis
and experimentation of thermal and catalytic ethanol cracking and dry
reforming using a carbon steel catalyst precursor and reported that highest
hydrogen and carbon (carbon nanofilaments) yields were obtained at 550ºC.
Wang et al. (2009) have studied the thermodynamics of ethanol reforming
with carbon dioxide for hydrogen production and have reported the optimum
conditions which gave over 94% yield of syngas with complete conversion of
ethanol without carbon deposition. De Oliveira-Vigier et al. (2005) have
experimentally studied the dry reforming of ethanol using a recyclable and
long lasting SS 316 catalyst and have obtained hydrogen yield that is 98% of
the theoretical value. Blanchard et al. (2008) have experimentally studied the
ethanol dry reforming using a carbon steel catalyst to produce syngas and
also nanocarbons. Bellido et al. (2009) have experimentally studied the dry
reforming of ethanol using Ni/Y2O3-ZrO2 catalysts and achieved a maximum
CO2 conversion of 61% on 5NiYZ catalyst at 800°C. However dry reforming is
a highly endothermic process that suffers a great drawback of carbon
formation and catalyst deactivation and hence has many limitations. Hence
the process has failed to commercialise.
Steam reforming of fuels has been practiced for a long time in chemical
industry primarily for hydrogen generation. It is a catalytic endothermic
process. It also had some limitations due to carbon formation and highly
endothermic reaction. But further research in this area developed an
advanced version in this category - autothermal steam reforming that uses
oxygen (air) insitu to generate heat by partial oxidation to supply energy to the
endothermic steam reforming. A similar strategy was devised to overcome the
problems of dry reforming. The advanced version is named as dry
autothermal reforming (DATR) and is studied in detail in this thesis. This
thesis is aimed to study the feasibility of dry autothermal reforming of fuels
and its applications in different industrial sectors. Secondly, since steam
reforming, autothermal reforming and dry reforming do not have any specific
fuel limitations, it was also crucial to ascertain the wide applicability of DATR

CHAPTER 1: Introduction
12
using different fuels. Hence a number of fuels (biofuels – (glycerol and
ethanol), Lignite coal, hydrocarbons – (LPG (propane) and gasoline
(isooctane) have been used in this research study. Figure 1.1 shows the
conceptual design of DATR process.
Figure 1.1: Conceptual process design of DATR
1.2 Methodology
Development of new chemical reactions / processes is a very costly matter.
The studies start with basic theoretical calculations which further grow to
experimental studies, catalyst development programs, bench scale studies,
reactor and process design, pilot plant studies and commercialization.
Further, it is very important to device a process that may have applications in
various industrial sectors. This thesis aims at studying the CO2 utilization by
DATR for some important fuels and evaluate the applications in some high
value processes.

CHAPTER 1: Introduction
13
Thermodynamics is the backbone for chemical industry. Thermodynamics
studies the feasibility of chemical reactions at different temperatures. Many
processes have been designed using the thermodynamic studies.
Thermodynamics provides the domain for process operation and also defines
the maximum and minimum yields and conversions of desired / byproducts.
Thermodynamic equilibrium studies for process development have earlier
been reported using Gibbs free energy minimization algorithm or
simultaneous solution of non-linear reaction equations coded to Matlab
programs, equilibrium reactor module of Design II, HYSYS, Aspen Plus, fluent
or HSC Chemistry software. Sometimes simultaneous solution of non-linear
reaction equations based on equilibrium constants might become complex
and tedious.
Another procedure taking account of chemical species and suitable for general
computer solution is based on minimization of the total Gibbs energy Gt (Perry
1997) is shown by the expression:
(dGt)T, P = 0
It shows that all irreversible processes occurring at constant T (temperature)
and P (pressure) proceed in a direction where the total Gibbs energy of the
system decreases and the equilibrium state has the minimum total Gibbs
energy attainable at the given T and P. Although the choice of a set of species
is equivalent to the choice of a set of independent reactions among the
species, different assumptions might produce different results.
HSC Chemistry version 5.1 (2002) has been used for this thermodynamic
study. This software is very user friendly (Smith, 1996). Equilibrium
calculations in the Gibbs routine are made using the Gibbs energy
minimization method. The Gibbs program finds the most stable species
combination and seeks the phase compositions where the Gibbs energy of

CHAPTER 1: Introduction
14
the system reaches its minimum at a fixed mass balance (a constraint
minimization problem), constant pressure and temperature. Hence, no
specific chemical reaction equations are needed in the input.
The optimum process operating conditions can be generated using these
models including feasibility studies at different conditions of temperature,
pressure, input feed ratios, fuels etc. The product compositions are analyzed
and the optimum process conditions for maximizing desired products and
minimizing undesired products at minimized energy requirements and
negligible pollution for traditional fuels such as coal, LPG, gasoline or bio fuels
like ethanol and glycerol were found in this study.
HSC Chemistry software is low cost effective software used for this research
work. The software is recognized software at international level and has a
very good thermodynamic database of many compounds. Several
researchers have used this software for their research studies. The chemical
equilibrium module of the software is effective in calculating equilibrium
compositions in a complex reforming systems such as steam reforming, dry
reforming, dry autothermal reforming, etc without the need of specific reaction
equations. This is a major advantage of the software as the exact number and
nature of chemical reactions in any process are very difficult to determine.
The objectives of the present research work were as follows:
i) To study the thermodynamic feasibility of DATR process using a
fuel (e.g. glycerol),
ii) To study the thermoneutral point analysis in DATR using a fuel (e.g.
ethanol),
iii) To study the application of DATR in fuel processor development,
iv) To study the application of DATR in Chemical looping combustion
system,
v) To study the application of DATR in coal gasification process,

CHAPTER 1: Introduction
15
1.3 Summarized details of each chapter
The thermodynamic feasibility of dry autothermal reforming is studied in
Chapter 2 using glycerol as a fuel. Glycerol is a byproduct of biodiesel
production process. Biofuels like ethanol and biodiesel are gaining
significance due to the consistent decline in fossil fuels like oil and natural gas
reserves worldwide. Glycerol is projected to be extensively available
byproduct after the commercialization of biodiesel production processes. This
has prompted researchers to find ways for utilization of glycerol.
Thermodynamic equilibrium data for dry autothermal reforming of glycerol was
generated for temperature range 600–1000 K, 1 bar pressure, OCGR [feed
O2/C(C of glycerol only) ratio] 0.1 to 0.5 and CGR [feed CO2/glycerol ratio] 1
to 5 and analyzed. The objective of this chapter was to identify the
thermodynamic domain of the process operation, study the variation of
product distribution pattern and describe the optimum conditions to maximize
yield of the desired product and minimize the undesired product formation.
The concept of thermoneutral point was introduced at the end of this chapter.
Thermoneutral point is the condition where the endothermic reactions balance
the exothermic reactions to make the net enthalpy of chemical reaction zero.
Autothermal processes are generally operated at thermoneutral conditions to
maximize energy efficiency. However, very little literature is available
regarding thermoneutral points and product trends at those points. The
concept of the thermoneutral point in dry autothermal reforming was studied in
detail in the Chapter 3 using ethanol as a fuel. The main goal of this work was
to analyze the thermoneutral conditions for DATR of ethanol process to
produce a variety of value added products like hydrogen, syngas and CNF’s
whose yield can be maximized at different operating conditions and input
ratios. This study intended to study the variation of components in the product
stream at thermoneutral conditions, presenting product yields and product

CHAPTER 1: Introduction
16
distribution trends at various pressures to find the best operating
thermoneutral point for the desired product.
Chapter 4 deals with the application of DATR in fuel processor systems.
Hydrogen energy and fuel cells are considered to be the future energy
sources. Syngas (H2 + CO) production using hydrocarbon reforming has been
a popular research area for more than three decades. Various hydrocarbon
fuels have been evaluated for their capacity to fulfil the requirements of fuel
processor system. Liquid fuels like gasoline have high energy density and are
the most favourable choice for fuel processors as reported in literature. This
chapter aimed to explore the thermodynamics of an alternate syngas
generation process i.e. DATR and its comparison to popular autothermal
reforming process of isooctane for use in gasoline fuel processors to power
the Solid Oxide Fuel Cell (SOFC). A thermodynamic analysis of isooctane as
feed hydrocarbon for autothermal reforming and dry autothermal reforming
processes for feed OCIR (oxygen to carbon in isooctane ratio) from 0.5 to 0.7
at 1 bar pressure under analogous thermoneutral operating conditions was
done using Gibbs free energy minimization algorithm in HSC Chemistry. The
trends in thermoneutral points (TNP), important product gas compositions at
TNPs and fuel processor energy requirements were compared and analyzed.
Coal is a valuable energy resource widely available in India. Coal gasification
is an industrially commercialized technology that uses coal, steam and air to
produce syngas from coal. The thermodynamics of CO2 utilization in dry
autothermal reforming (gasification) of coal and its comparison with steam
gasification as well as the combined gasification (use of steam and CO2
simultaneously) was done in Chapter 5 using lignite coal. This study was
done within the gasifier operating temperature range of 450 – 950ºC at 1 bar
pressure. This thermodynamic study was done in the OCR (oxygen to carbon
(in coal) ratio) range from 0.5 – 0.7, SCR (steam to carbon (in coal) ratio)
range from 1 – 3 and CCR (CO2 to carbon (in coal) ratio) range from 1 – 3 to
compare the gasification processes under analogous conditions. The product
CHAPTER 1: Introduction
17
composition and energy aspects of autothermal gasification processes were
evaluated. The OCR and SCR for steam gasification and OCR and CCR for
dry autothermal gasification are chosen as controlling parameters for the
gasifier for temperature and product composition variation.
The thermodynamics of another important application of dry autothermal
reforming (DATR) for CO2 utilization in the chemical looping combustion
(CLC) process was studied in Chapter 6. CLC is an emerging area for energy
generation that has several advantages like no direct mixing of fuel and air.
The process operates continuously and many oxygen carriers have been
evaluated for long term durability of oxidation–reduction cycles. The fuel
reactor product stream mainly consisting of steam and CO2 is usually cooled
to condense out water and the pure CO2 stream is compressed, liquefied and
injected deep underground into porous rock for sequestration without any
separation expense. The thermodynamic feasibility of CLC using propane as
fuel and CaSO4 as oxygen carrier was investigated by a short cut technique
and the thermodynamic feasibility of a new process scheme combining
chemical looping combustion (CLC) and DATR (with steam) of propane was
also studied in this chapter. The CO2 (and steam) generated in the CLC was
used for dry autothermal reforming of propane in an autothermal way within
the temperature range (400–1000 ºC) at 1 bar pressure to generate syngas of
desired ratio < 3.0 which is extremely desirable for petrochemical
manufacture. The novel process scheme generated (a) huge thermal energy
in CLC that can be used for various applications, (b) pure N2 and syngas rich
streams can be used for petrochemical manufacture and (c) CO2 utilization in
DATR.
Chapter 7 discusses the major conclusions and recommendations for future
work and lists the publications from the work done in this thesis.

CHAPTER 1: Introduction
18
1.4 References
Bellido J. D. A., Tanabe E. Y., and Assaf E. M., 2009, Carbon dioxide
reforming of ethanol over Ni/Y2O3-ZrO2 catalysts, Applied Catalysis B, 90(3-
4), 485–488.
Blanchard J., Oudghiri-Hassani H., Abatzoglou N., Jankhah S., Gitzhofer F.,
2008, Synthesis of nano carbons via ethanol dry reforming over a carbon
steel catalyst, Chem. Eng. J., 143(1), 186–194.
De Oliveira-Vigier K., Abatzoglou N., 2005, Dry-reforming of ethanol in the
presence of a 316 stainless steel catalyst, Can. J. Chem. Eng., 83(6), 978–
984.
HSC Chemistry [Software] 2002, version 5.1 Pori: Outokumpu research Oy.
Jankhah S., Abatzoglou N., 2008, Thermal and catalytic dry reforming and
cracking of ethanol for hydrogen and carbon nanofilaments production, Int. J.
Hydrogen Energy, 33(18), 4769–4779.
Perry R.H., Green D.W., 1997, Chemical engineers' handbook, 7th edition,
McGraw-Hill, USA.
Smith, W.R., 1996, Computer software reviews, HSC chemistry for windows,
2.0, J. Chem. Inf. Comput. Sci., 36 (1), 151–152.
Wang W.J., Wang Y.Q., 2009, Dry reforming of ethanol for hydrogen
production: thermodynamic investigation, Int. J. Hydrogen Energy, 34(13),
5382–5389.

Chapter 2
Thermodynamic analysis of dry
autothermal reforming of Glycerol
CHAPTER 2: Thermodynamic analysis of dry autothermal reforming of Glycerol
20
Abstract
Dry autothermal reforming of glycerol uses a combination of dry (CO2)
reforming and partial oxidation reactions to produce syngas rich product
stream. The objective of the chapter is to evaluate the thermodynamic
feasibility of dry autothermal reforming of glycerol by identifying the
thermodynamic domain of the DATR process operation, study the variation of
product distribution pattern and describe the optimum conditions to maximize
yield of the desired product and minimize the undesired product formation.
Glycerol is used as fuel in this study. The thermodynamic equilibrium data for
dry autothermal reforming of glycerol was generated for temperature range
600–1000 K, 1 bar pressure, OCGR [feed O2/C (C of glycerol only) ratio] 0.1 to
0.5 and CGR [feed CO2/glycerol ratio] 1 to 5 and analyzed. Higher OCGR and
higher CGR yielded a syngas ratio, with lower carbon and methane formation,
while lower CGR and lower OCGR yielded good hydrogen and total hydrogen,
with low water and CO2 in the product gas. The best thermoneutral condition
for DATR of glycerol operation was seen at a temperature of 926.31 K at 1 bar
pressure, OCGR=0.3 and CGR=1 that gave 2.67 mol of hydrogen, 4.8 mol of
total hydrogen with negligible methane and carbon formation.

CHAPTER 2: Thermodynamic analysis of dry autothermal reforming of Glycerol
21
2.1 Glycerol as fuel
Glycerol is a byproduct of biodiesel production process. Biofuels like ethanol
and biodiesel are gaining significance due to the consistent decline in fossil
fuels like oil and natural gas reserves worldwide. Glycerol will be extensively
available as byproduct after the commercialization of biodiesel production
processes. This has prompted researchers to find ways for utilization of
glycerol to valuable products. Researchers working in the field of hydrogen
and syngas production have now started focusing on the use of glycerol for
hydrogen and syngas production by various techniques.
Some of the important glycerol utilization techniques reported in literature are
as follows:
2.1.1 Catalytic & Experimental studies
Dauenhauer et al. (2006) have studied the autothermal reforming of glycerol
and its solutions in water over platinum and rhodium based catalysts
supported on alumina foams at a contact time of ~10 ms. Simonetti et al.
(2007) have studied the rate of glycerol conversion to syngas mixtures under
kinetically controlled reaction conditions over carbon-supported platinum and
platinum-rhenium catalysts. Zhang et al. (2007) have studied the hydrogen
production from steam reforming reactions of ethanol and glycerol using ceria-
supported Ir, Co and Ni catalysts. Valliyappan et al. (2008a) have studied the
pyrolysis of glycerol for H2 and syngas production in various flow rates of N2
(30-70 ml/min), temperatures (650-800 ºC) and types and sizes of packing
material in a tubular reactor at atmospheric pressure. Slinn et al. (2008) have
reported that steam reforming of impure glycerol was a viable alternative for
use of glycerol. Lehnert et al. (2008) have studied the catalytic conversion of
glycerol to hydrogen by aqueous-phase reforming (APR) on several platinum
based catalysts. Byrd et al. (2008) have studied the hydrogen production by
supercritical water reforming of glycerol over a Ru/Al2O3 catalyst with low

CHAPTER 2: Thermodynamic analysis of dry autothermal reforming of Glycerol
22
methane and carbon monoxide formation. Wen et al. (2008) have studied the
activities and stabilities of Pt, Ni, Co, and Cu catalysts and the effect of
support on activity and stability for H2 production by aqueous-phase reforming
of glycerol using a fixed-bed flow reactor. Luo et al. (2008) have studied the
effect of metal loadings and operating conditions for hydrogen production from
glycerol solution by aqueous phase reforming process over Pt supported
catalysts. Cui et al. (2009) have studied the steam reforming of glycerol (1, 2,
3 - propantriol) with non-substituted and partially Ce substituted La(1-x)CexNiO3
mixed oxides and compared the activities with Pt metal catalysts and
thermodynamic equilibrium. Fernandez et al. (2009) have investigated the
pyrolysis of glycerol over carbonaceous catalysts to produce synthesis gas in
a fixed-bed reactor. Iriondo et al. (2009) have studied the performance of
monometallic (Ni and Pt) and bimetallic (Pt-Ni) catalysts and also the effect of
lanthana-modified alumina support in the glycerol steam reforming process.
Luciene et al. (2009) have studied the catalytic activity of Ni/CeO2-Al2O3
catalysts modified with noble metals (Pt, Ir, Pd and Ru) for steam reforming of
glycerol. Kunkes et al. (2009) have reported a gas phase catalytic process for
glycerol reforming based on the use of two catalyst beds that can be tuned to
yield hydrogen and CO2 or synthesis gas at 573 K and 1 atm pressure. Buffoni
et al. (2009) have studied the effect of nickel catalysts supported on
commercial alpha-Al2O3 and alpha-Al2O3 modified by addition of ZrO2 and
CeO2 to obtain hydrogen by steam reforming of glycerol. Xu et al. (2009) have
studied the catalytic gasification of glycerol with supercritical water in a
continuous tubular-flow reactor operated at 380-500 °C and 25 MPa pressure
with or without Na2CO3 catalyst. Dou et al. (2009) have experimentally studied
the catalytic steam reforming of glycerol in a continuous flow fixed-bed reactor
at atmospheric pressure within a temperature range of 400-700 °C using a
commercial Ni-based catalyst and a dolomite sorbent for in-situ CO2 removal.
Swami et al. (2006) have successfully studied steam and autothermal
reforming of glucose, glycerol and industrial waste water using Ni/Pd/Cu
catalyst at atm pressure within 500–800 °C temperature range. Soares et al.
(2006) have reported the catalytic conversion of glycerol to syngas at lower

CHAPTER 2: Thermodynamic analysis of dry autothermal reforming of Glycerol
23
temperatures. Valliyappan et al. (2008b) have studied catalytic steam
gasification in presence of commercial Ni/Al2O3 catalyst and reported 15 mol
% increased hydrogen yield in steam gasification process than pyrolysis
process. Huber et al. (2003) have studied aqueous-phase reforming of
glycerol over a tin-promoted Raney-nickel catalyst for hydrogen production.
Douette et al. (2007) have experimentally investigated glycerin reforming and
formulated a model defining the effect of oxygen to carbon ratio, steam to
carbon ratio, and temperature on the process to improve hydrogen yield.
Adhikari et al. have experimentally studied glycerin steam reforming using
nickel catalysts with MgO, CeO2 and TiO2 supports (2008) and also by using
Ni/Al2O3 and Rh/CeO2/Al2O3 based catalysts (2007a). Hirai et al. (2005) have
studied hydrogen production by steam reforming of glycerin on ruthenium
catalyst. Iriondo et al. (2008) have used different catalyst functionalities to
carry out aqueous-phase and vapor phase steam reforming of glycerol and
found that the addition of Ce, La and Zr to Ni/ Al2O3 improved the initial
glycerol conversions in aqueous phase reforming of glycerol while the same
catalysts improved hydrogen selectivity in steam reforming of glycerol. Kunkes
et al. (2008) have experimentally studied aqueous solutions of glycerol over
carbon-supported Pt and Pt-Re catalysts at 483 - 523 K and found that the
turnover frequencies for production of H2, CO, CO2, and light alkanes
(primarily methane) increase with addition of Re to Pt/C as it modifies the
interaction of CO with surface sites.
2.1.2 Thermodynamic studies
Adhikari et al. (2007b) have performed thermodynamic equilibrium analysis of
glycerol steam reforming process and described that temperature >900 K,
atmospheric pressure and a molar ratio of water/glycerin at 9:1 are the best
operating conditions for hydrogen production with minimizing methane and
carbon formation. X. Wang et al. (2009) have performed a thermodynamic
analysis of glycerol dry reforming by the Gibbs free energy minimization
method as a function of CO2 to glycerol ratio, temperature, and pressure. Luo

CHAPTER 2: Thermodynamic analysis of dry autothermal reforming of Glycerol
24
et al. (2007) have studied the thermodynamic analysis of autothermal
reforming (a combination of water aqueous reforming and oxidation), aqueous
hydrogen peroxide reforming and water aqueous reforming process and found
that water aqueous reforming of glycerol gave the highest hydrogen yield in
the absence of methanation. H. Wang et al. (2009) have performed
thermodynamic analysis of glycerol autothermal reforming using Gibbs free
energy minimization over a temperature range (700–1000 K), steam to
glycerol ratio (1–12) and oxygen to glycerol ratio (0.0–3.0) and reported
product yields at thermoneutral conditions. X. Wang et al. (2008) have studied
the thermodynamic analysis of glycerin steam reforming as a function of
water/glycerin molar ratios (1:1−12:1) within temperature range (550−1200 K)
and pressure range (1−50 atm) and reported optimum conditions for hydrogen
production, syngas production with minimum carbon formation. Chen et al.
(2009) have performed thermodynamic analysis of adsorption-enhanced
steam reforming of glycerol and shown that the maximum number of moles of
hydrogen produced per mole of glycerol can be increased due to the CO2
adsorption.
2.1.3 Other studies
Marshall and Haverkamp (2008) have reported a 66 % reduction in electrical
energy consumption using electrochemical reforming of glycerol solution in a
proton exchange membrane (PEM) electrolysis cell compared to water
electrolysis in the same cell. Xuan et al. (2009) have discussed the research
challenges and future development of biomass fuel processor along with a
review of the biomass-derived fuel processing technologies from various
perspectives including the feedstock, reforming mechanisms, catalysts and
processor configurations. Selembo et al. (2009) have studied the use of
glycerol for hydrogen gas production was examined via electrohydrogenesis
using microbial electrolysis cells (MECs) which gave hydrogen yield of 3.9
mol-H2/mol using glycerol and was observed to be higher than that possible by
fermentation. Zhu et al. (2009) have reported plasma reforming of glycerol at
CHAPTER 2: Thermodynamic analysis of dry autothermal reforming of Glycerol
25
low temperature & atm pressure without external heating. Ito et al. (2005) have
studied the hydrogen and ethanol production using Enterobacter aerogenes
HU-101 from glycerol-containing wastes discharged from biodiesel
manufacturing process. Some review articles (S. Adhikari, 2009; Vaidya and
Rodrigues, 2009) for hydrogen production using glycerol are also published.
2.2 Thermodynamic analysis
A thermodynamic analysis of glycerol steam reforming (Adhikari, 2007; X.
Wang, 2008), glycerol autothermal reforming (H. Wang, 2009) and glycerol dry
reforming (X. Wang, 2009) have already been reported. On the similar lines, a
thermodynamic study of pure glycerol dry autothermal reforming process was
undertaken to evaluate the feasibility of the process. The role of CO2 in DR
has already been discussed in detail by X. Wang et al. (2009) and the same is
applicable to this system, oxygen reacts with glycerol to produce energy that is
in-situ transferred to dry reforming process. Dry autothermal reforming (DATR)
is a better process than dry reforming (DR) for many reasons. DR requires
external energy and more carbon is formed in the reactor while DATR does
not require external energy and minimum carbon is formed at optimized
conditions. The species such as glycerol (g) [1, 2, 3 Propanetriol], glycerol (l),
O2 (g), N2 (g), CO2 (g), H2 (g), CO (g), H2O (g), CH4 (g), H2O (l) and C(s) are
considered in this study. The input species are glycerol, oxygen, nitrogen and
CO2 (all in gaseous phase) at particular temperature-pressure conditions
reacting to give the products. Any other product – byproduct formation is not
considered in this study.
The dry autothermal reforming of glycerol process operation is based on four
main thermodynamic parameters like temperature, pressure, OCGR [feed
O2/C (C of glycerol only) ratio] and CGR [feed CO2 to glycerol ratio]. The
process engineer has to choose the best reactor operating conditions. A
detailed study of product distribution trends of glycerol DATR process with
CHAPTER 2: Thermodynamic analysis of dry autothermal reforming of Glycerol
26
respect to change in temperature, OCGR and CGR is essential. This chapter
intends to study these things to locate the thermodynamic domain for reactor
operation. The material and energy balance calculations were preformed using
the inbuilt databases in HSC Chemistry software package. The reaction
products are assumed to be in thermodynamic equilibrium at the exit of the
reactor. 1 mole of glycerol (gaseous phase) was taken in each case, so the
product moles obtained were for 1 mole glycerol input. The operating
temperature range for this exercise was 600 to 1000 K, with CGR 1, 3 & 5 and
OCGR zero, 0.1, 0.3 and 0.5. Complete (100 %) conversion of glycerol and
positive product yields with accurate material balances was observed in all the
considered cases, indicating the feasibility of the DATR process. The case of
zero OCGR represents the dry reforming of glycerol and these results have
already been reported (X. Wang, 2009). The accuracy of the data presented is
within reasonable error limit.
2.3 Results and Discussion:
2.3.1. Hydrogen yield
Hydrogen is always a desired product of reforming processes for its end use in
fuel cells or syngas manufacture. Steam reforming of natural gas is a popular
process for hydrogen production. With availability of cheaper fuel options like
glycerol, the hydrogen production processes might shift to use the available
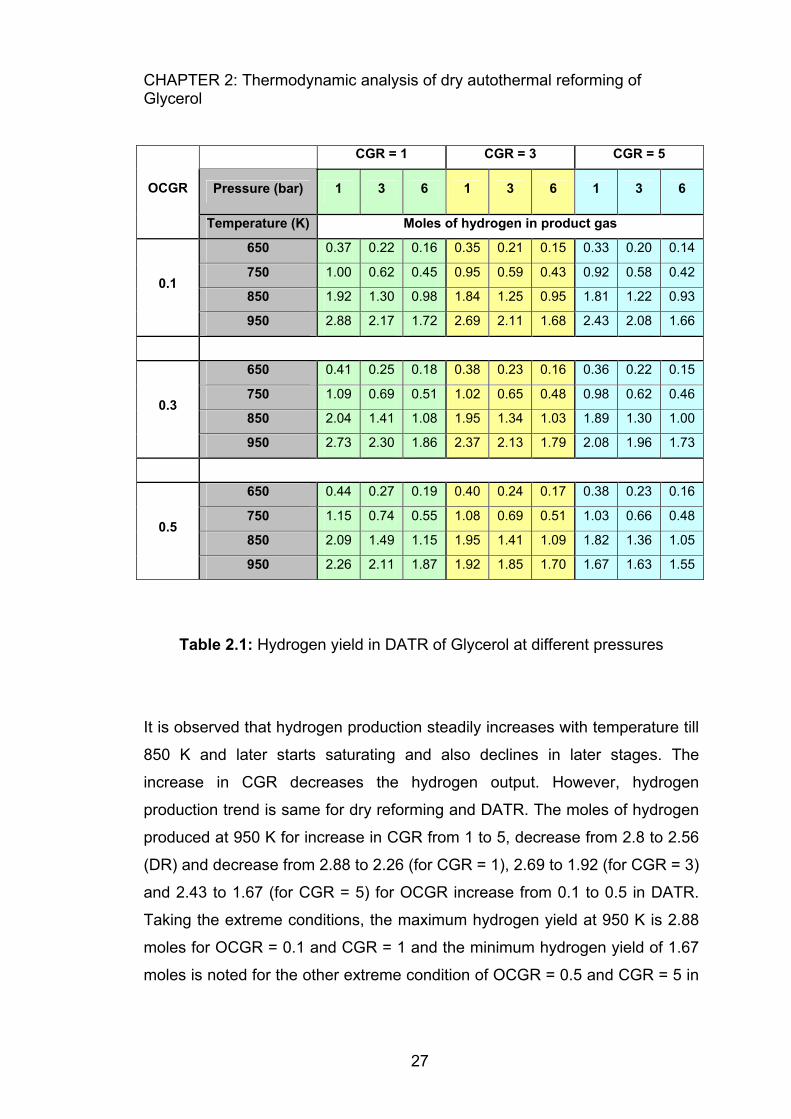
feedstock. Table 2.1 shows the hydrogen yield in DATR of glycerol process at
various pressures. It was found that the hydrogen yield decreased at higher
pressures, making low pressure (1 bar) operation a favorable process
parameter. The further thermodynamic studies for DATR of glycerol were done
at 1 bar process pressure only. Figure 2.1 shows the effect of oxygen addition
on hydrogen production by glycerol dry autothermal reforming at various
conditions of process temperature, CGR and OCGR at 1 bar pressure.
CHAPTER 2: Thermodynamic analysis of dry autothermal reforming of Glycerol
27
CGR = 1 CGR = 3 CGR = 5
Pressure (bar) 1 3 6 1 3 6 1 3 6 OCGR
Temperature (K) Moles of hydrogen in product gas
650 0.37 0.22 0.16 0.35 0.21 0.15 0.33 0.20 0.14
750 1.00 0.62 0.45 0.95 0.59 0.43 0.92 0.58 0.42
850 1.92 1.30 0.98 1.84 1.25 0.95 1.81 1.22 0.93 0.1
950 2.88 2.17 1.72 2.69 2.11 1.68 2.43 2.08 1.66
650 0.41 0.25 0.18 0.38 0.23 0.16 0.36 0.22 0.15
750 1.09 0.69 0.51 1.02 0.65 0.48 0.98 0.62 0.46
850 2.04 1.41 1.08 1.95 1.34 1.03 1.89 1.30 1.00 0.3
950 2.73 2.30 1.86 2.37 2.13 1.79 2.08 1.96 1.73
650 0.44 0.27 0.19 0.40 0.24 0.17 0.38 0.23 0.16
750 1.15 0.74 0.55 1.08 0.69 0.51 1.03 0.66 0.48
850 2.09 1.49 1.15 1.95 1.41 1.09 1.82 1.36 1.05 0.5
950 2.26 2.11 1.87 1.92 1.85 1.70 1.67 1.63 1.55
Table 2.1: Hydrogen yield in DATR of Glycerol at different pressures
It is observed that hydrogen production steadily increases with temperature till
850 K and later starts saturating and also declines in later stages. The
increase in CGR decreases the hydrogen output. However, hydrogen
production trend is same for dry reforming and DATR. The moles of hydrogen
produced at 950 K for increase in CGR from 1 to 5, decrease from 2.8 to 2.56
(DR) and decrease from 2.88 to 2.26 (for CGR = 1), 2.69 to 1.92 (for CGR = 3)
and 2.43 to 1.67 (for CGR = 5) for OCGR increase from 0.1 to 0.5 in DATR.
Taking the extreme conditions, the maximum hydrogen yield at 950 K is 2.88
moles for OCGR = 0.1 and CGR = 1 and the minimum hydrogen yield of 1.67
moles is noted for the other extreme condition of OCGR = 0.5 and CGR = 5 in

CHAPTER 2: Thermodynamic analysis of dry autothermal reforming of Glycerol
28
DATR process. Hence it can be observed that higher OCGR and higher CGR
actually decrease the hydrogen yield in this process.
Figure 2.1: Hydrogen yield in DR and DATR of Glycerol
2.3.2 CO yield
Carbon monoxide is an undesired product and poison for applications that
require pure hydrogen. However it is very much desired for syngas feeding
applications. CO can be converted to hydrogen using a series of WGS
reactors, while the very low CO levels can be preferentially oxidized to CO2 or
converted to methane using a methanation catalyst. Figure 2.2 shows the
moles of CO produced in the DR and DATR of glycerol process as a function
of temperature, CGR and OCGR at 1 bar pressure. It is observed that the CO
yield increases with increase in process temperature in all cases. With
increase in OCGR at constant CGR, the CO yield decreases. Similarly, at
constant OCGR, the CO yield increases with increase in CGR. The moles of
CO produced at 950 K for increase in CGR from 1 to 5, increase from 2.09 to

CHAPTER 2: Thermodynamic analysis of dry autothermal reforming of Glycerol
29
4.18 (DR), decrease from 2.46 to 1.7 (for CGR = 1), 3.39 to 2.07 (for CGR = 3)
and 3.83 to 2.32 (for CGR = 5) for OCGR increase from 0.1 to 0.5 in DATR.
The maximum CO yield at 950 K was found to be ~3.83 moles for OCGR = 0.1
and CGR = 5 and the minimum CO yield of 1.7 was observed at OCGR = 0.5
and CGR = 1 for DATR process.
Figure 2.2: CO yield in DR and DATR of Glycerol
2.3.3 Variation of Syngas ratio (H2/CO) of product gas
Syngas is the basic building block for petrochemicals. Dry reforming gives
more CO than steam reforming processes. Hence syngas can be preferably
manufactured by glycerol DATR process. Moreover the syngas ratio in the
range of 1–3 (desirable for use in petrochemical manufacture) is easily
obtained in this process. Figure 2.3 shows the variation of syngas ratio as a
function of temperature, CGR and OCGR for DR-DATR of glycerol. The
syngas ratio of the product gas shows a regular decline with increase in DR-
DATR process temperature. Increase in OCGR at constant CGR and increase

CHAPTER 2: Thermodynamic analysis of dry autothermal reforming of Glycerol
30
in CGR at constant OCGR also show a decrease in product syngas ratio in the
same trend. The product syngas ratio obtained at 950 K for increase in CGR
from 1 to 5, decreases from 1.34 to 0.61 (DR) and increases from 1.17 to 1.33
(CGR = 1), 0.79 to 0.93 (CGR = 3) and 0.63 to 0.72 (CGR = 5) for OCGR
increase from 0.1 to 0.5 in DATR. The maximum syngas ratio at 950 K is 1.33
obtained at OCGR = 0.5 and CGR = 1 while the minimum syngas ratio of 0.63
is seen at OCGR = 0.1 and CGR = 5 for DATR process. The syngas ratio
around 1 (0.63–1.33) is obtained at 950 K for CGR variation from 1–5, making
this process favorable for syngas manufacture.
Figure 2.3: Syngas ratio (H2/CO) in DR and DATR of Glycerol
2.3.4 Total hydrogen (H2+CO) potential
Total hydrogen potential of a process is the sum of moles of hydrogen and
carbon monoxide obtainable in the process. This terminology is useful in
identifying and ranking fuels for hydrogen production processes. It is assumed
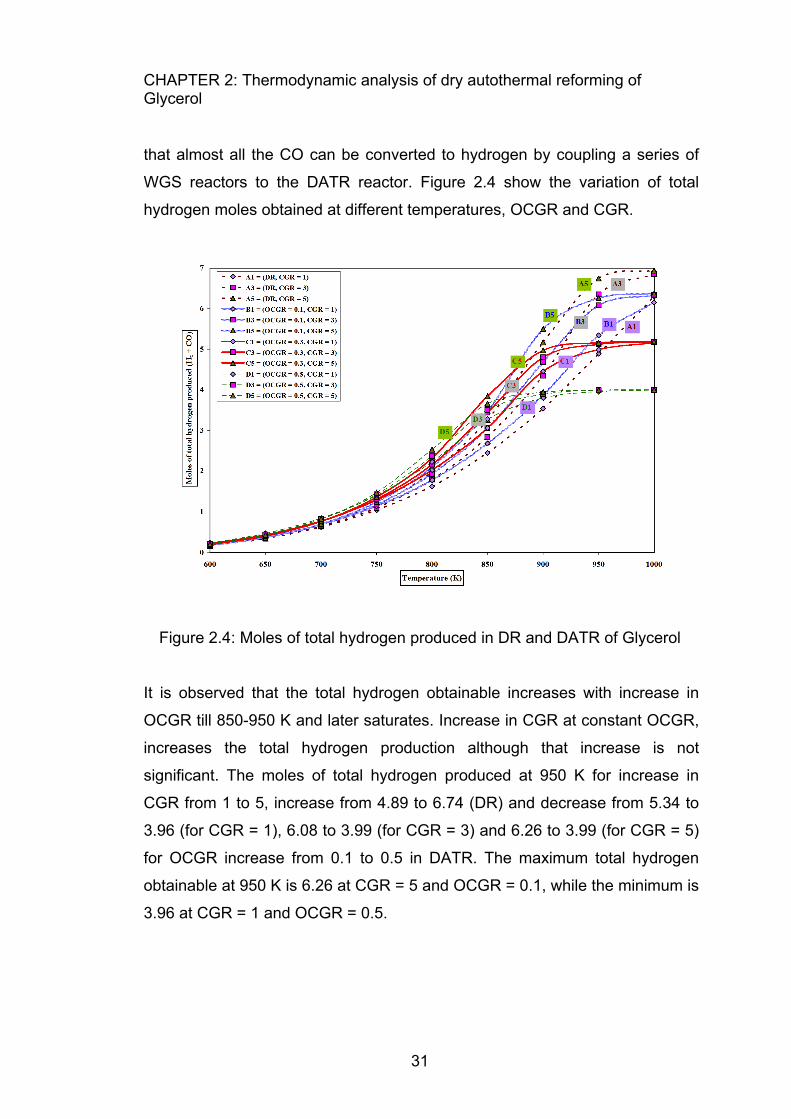
CHAPTER 2: Thermodynamic analysis of dry autothermal reforming of Glycerol
31
that almost all the CO can be converted to hydrogen by coupling a series of
WGS reactors to the DATR reactor. Figure 2.4 show the variation of total
hydrogen moles obtained at different temperatures, OCGR and CGR.
Figure 2.4: Moles of total hydrogen produced in DR and DATR of Glycerol
It is observed that the total hydrogen obtainable increases with increase in
OCGR till 850-950 K and later saturates. Increase in CGR at constant OCGR,
increases the total hydrogen production although that increase is not
significant. The moles of total hydrogen produced at 950 K for increase in
CGR from 1 to 5, increase from 4.89 to 6.74 (DR) and decrease from 5.34 to
3.96 (for CGR = 1), 6.08 to 3.99 (for CGR = 3) and 6.26 to 3.99 (for CGR = 5)
for OCGR increase from 0.1 to 0.5 in DATR. The maximum total hydrogen
obtainable at 950 K is 6.26 at CGR = 5 and OCGR = 0.1, while the minimum is
3.96 at CGR = 1 and OCGR = 0.5.

CHAPTER 2: Thermodynamic analysis of dry autothermal reforming of Glycerol
32
2.3.5 Methane formation
Methane formation is undesirable due to the loss of hydrogen and carbon
moles. Figure 2.5 shows the moles of methane produced at different
temperatures, OCGR and CGR. Methane formation seems negligible and
decreases with temperature in all the considered cases. The methane
formation is lowest at high OCGR and high CGR. The moles of CH4 produced
at 950 K for increase in CGR from 1 to 5, decrease from 0.20 to 0.06 (DR) and
decrease from 0.17 to 0.01 (for CGR = 1), 0.08 to 0.00 (for CGR = 3) and 0.04
to 0.00 (for CGR = 5) for OCGR increase from 0.1 to 0.5 in DATR. The
maximum CH4 moles formed at 950 K in DATR is 0.17 at CGR = 1 and OCGR
= 0.1, while the minimum is 0.00 at CGR = 3 & 5 and OCGR = 0.5.
Figure 2.5: Moles of methane produced in DR and DATR of Glycerol
2.3.6 CO2 obtained in product gas
One of the important aims of dry autothermal reforming is utilization of CO2 to
produce value added products like syngas and hydrogen without the use of

CHAPTER 2: Thermodynamic analysis of dry autothermal reforming of Glycerol
33
external energy. But the CO2 production results obtained from thermodynamic
study indicate that the regions for positive CO2 utilization are very narrow.
However, even if CO2 is evolved from the process, the net CO2 evolved (i.e.
the product CO2 – feed CO2 moles) from the DATR process is very less. This
makes the process more attractive. Figure 2.6 shows the CO2 obtained in DR-
DATR process at different temperatures, OCGR and CGR.
Figure 2.6: Moles of CO2 obtained in DR and DATR of Glycerol
The CO2 obtained in the product gas slightly increases till ~750 K and later
decreases at higher temperatures. The CO2 production increases with
increase in CGR and also with increase in OCGR. The moles of CO2 produced
at 950 K for increase in CGR from 1 to 5, increase from 1.05 to 3.75 (DR) and
increase from 1.18 to 2.29 (for CGR = 1), 2.53 to 3.93 (for CGR = 3) and 4.14
to 5.68 (for CGR = 5) for OCGR increase from 0.1 to 0.5 in DATR. The
maximum CO2 moles emitted at 950 K in DATR is 5.68 at CGR = 5 and OCGR
= 0.5, while the minimum is 1.18 at CGR = 1 and OCGR = 0.1.

CHAPTER 2: Thermodynamic analysis of dry autothermal reforming of Glycerol
34
2.3.7 Water formation
Water formation is sometimes desired to increase humidity of the product gas
as the humidified gas has better thermal transport properties. However, water
formation takes place at the expense of hydrogen in the system. Figure 2.7
shows the moles of water formed at different temperature, CGR and OCGR in
the DR-DATR of glycerol process.
Figure 2.7: Moles of water produced in DR and DATR of Glycerol
The water formation decreases with increase in temperature till 850-950 K and
then increases in majority of the cases. Higher CGR and higher OCGR seems
to promote more water formation in the process. The moles of water produced
at 950 K for increase in CGR from 1 to 5, increase from 0.8 to 1.31 (DR) and
increase from 0.78 to 1.72 (for CGR = 1), 1.15 to 2.08 (for CGR = 3) and 1.50
to 2.33 (for CGR = 5) for OCGR increase from 0.1 to 0.5 in DATR. The
maximum H2O moles formed at 950 K in DATR is 2.33 at CGR = 5 and OCGR
= 0.5, while the minimum is 0.78 at CGR = 1 and OCGR = 0.1.

CHAPTER 2: Thermodynamic analysis of dry autothermal reforming of Glycerol
35
2.3.8 Carbon formation
Carbon is also an undesired component of reforming processes as it
deactivates the catalyst and increases pressure drop in reactors. Dry
reforming process has always had this as major problem. DATR uses in-situ
partial oxidation to reduce this problem. The carbon formation at different
temperatures, OCGR and CGR is shown in figure 2.8. As seen from the figure,
the carbon formation is more in DR than DATR and it increases with increase
in CGR, but decreases with increase in OCGR and increase in temperature. At
950 K the carbon formation decreases from 0.66 to 0.00 as CGR increases
from 1–5 in DR of glycerol. Similarly at 950 K, the maximum carbon formation
of 0.19 moles is observed only in the case of CGR = 1 and OCGR = 0.1, and it
decreases to zero for higher OCGR and higher CGR.
Figure 2.8: Moles of carbon produced in DR and DATR of Glycerol

CHAPTER 2: Thermodynamic analysis of dry autothermal reforming of Glycerol
36
2.3.9 Process Enthalpy and Thermoneutral points
Reaction enthalpy is always a crucial parameter in reforming processes.
Thermoneutral operation of DATR of glycerol requires no external energy for
cooling or heating, which makes it valuable from energy consumption point of
view. Figure 2.9 shows the variation of enthalpy of DATR of glycerol process
with change in OCGR and CGR along the thermoneutral line (zero enthalpy
line).
Figure 2.9: Process enthalpy for DATR of Glycerol
The intersection of reaction enthalpy curves with temperature axis shows the
thermoneutral temperatures. It is observed that the process exothermicity
increases with increase in OCGR at constant CGR. Table 2.2 shows the
product gas yields at thermoneutral conditions. It is observed that the reaction
endothermicity increases with increase in CGR from 1 to 5, at constant
OCGR, and also show a decrease in thermoneutral temperatures. Similarly,
the thermoneutral temperatures show an increase with the increase in OCGR

CHAPTER 2: Thermodynamic analysis of dry autothermal reforming of Glycerol
37
at constant CGR which indicate an increase in exothermicity of the reaction.
Lower OCGR and higher CGR gave lower thermoneutral point (temperatures)
and vice versa. The thermoneutral temperatures range from 771.48 K (OCGR
= 0.1, CGR = 5) to 1346.85 K (OCGR = 0.5, CGR = 1).
Equilibrium product gas composition (moles)
OCG
R
CG
R
Thermone
utral
Temperatu
re (K)
H2(g) CO(g)
Total
hydrog
en
(H2 +
CO)
Synga
s ratio
(H2/C
O)
CO2(g) CH4(g) H2O(g) C
1 847.15 1.89 0.73 2.62 2.60 1.71 0.33 1.45 1.23
3 805.56 1.42 0.62 2.04 2.31 3.49 0.29 2.01 1.61
0.1
5 771.48 1.09 0.47 1.56 2.30 5.35 0.25 2.42 1.93
1 926.31 2.67 2.13 4.80 1.25 1.77 0.10 1.13 0.00
3 873.18 2.18 2.04 4.22 1.07 3.64 0.17 1.48 0.15
0.3
5 845.03 1.84 1.81 3.65 1.02 5.58 0.16 1.84 0.45
1 1346.8 1.660 2.340 4.00 0.71 1.66 0.000 2.340 0.00
3 1170.2 1.450 2.550 4.00 0.57 3.45 0.000 2.550 0.00
0.5
5 1051.3 1.420 2.580 4.00 0.55 5.42 0.000 2.580 0.00
Table 2.2: Product gas composition in DATR of Glycerol at thermoneutral
temperatures (K) & 1 bar pressure
CHAPTER 2: Thermodynamic analysis of dry autothermal reforming of Glycerol
38
2.4 Conclusions
A thermodynamic analysis of glycerol dry autothermal reforming process has
been done to map the effect of OCGR and CGR on product distribution pattern
at 1 bar pressure and 600–1000 K temperature range. The study shows the
thermodynamic feasibility of the process in the parameter range considered.
This process seems favorable for syngas production as it gives a syngas ratio
in the desirable range (~1). Hydrogen production can also be achieved. The
results show good CO2 utilization potential. Experimentation will be helpful for
comparing the theoretical results obtained here. Higher OCGR and higher
CGR are good for syngas production (ratio ~1), lower carbon and methane
formation, while lower CGR and lower OCGR give good hydrogen and total
hydrogen yields, low water and CO2 production. The process temperature
around 850 K is good for minimizing methane, water and carbon formation.
Thermoneutral temperature of 926.31 K at 1 bar pressure, OCGR = 0.3 and
CGR = 1 gave 2.67 moles of hydrogen, 4.8 moles of total hydrogen with
negligible methane and carbon formation, and was identified as the best
thermoneutral condition for DATR operation.
2.5 References
Adhikari S., Fernando S., Haryanto A., 2007, A comparative thermodynamic
and experimental analysis on hydrogen production by steam reforming of
glycerin, Energy Fuels, 21, 2306-2310.
Adhikari S., Fernando S., Haryanto A., 2007, Production of hydrogen by steam
reforming of glycerin over alumina-supported metal catalysts, Catal. Today,
129, 355-364.
Adhikari S., Fernando S.D., To S.D.F., Brick R.M., Steele P.H., Haryanto A.,
2008, Conversion of glycerol to hydrogen via a steam reforming process over
nickel catalysts, Energy Fuels, 22(2), 1220-1226.

CHAPTER 2: Thermodynamic analysis of dry autothermal reforming of Glycerol
39
Adhikari S., Fernando S. D., Haryanto A., 2009, Hydrogen production from
glycerol: An update, Energy Convers. Manage., 50(10), 2600-2604.
Byrd A. J., Pant K.K., Gupta R. B., 2008, Hydrogen production from glycerol
by reforming in supercritical water over Ru/Al2O3 catalyst, Fuel, 87(13-14),
2956-2960.
Buffoni I. N., Pompeo F., Santori G. F., Nichio N. N., 2009, Nickel catalysts
applied in steam reforming of glycerol for hydrogen production, Catal.
Commun., 10(13), 1656-1660.
Cui Y., Galvita V., Rihko-Struckmann L., Lorenz H., Sundmacher K., 2009,
Steam reforming of glycerol: The experimental activity of La1-xCexNiO3 catalyst
in comparison to the thermodynamic reaction equilibrium, Appl. Catal. B, 90(1-
2), 29-37.
Chen H., Zhang T., Dou B., Dupont V., Williams P., Ghadiri M., Ding Y., 2009,
Thermodynamic analyses of adsorption-enhanced steam reforming of glycerol
for hydrogen production, Int. J. Hydrogen Energy, 34, 7208.
Dauenhauer P.J., Salge J.R., Schmidt L.D., 2006, Renewable hydrogen by
autothermal steam reforming of volatile carbohydrates, J. Catal., 244(2), 238-
247.
Dou B., Dupont V., Rickett G., Blakeman N., Williams P.T., Chen H., Ding Y.,
Ghadiri M., 2009, Hydrogen production by sorption-enhanced steam reforming
of glycerol, Bioresour. Technol., 100(14), 3540-3547.
Douette A.M.D., Turn S.Q., Wang W.Y., Keffer V.I., 2007, Experimental
investigation of hydrogen production from glycerin reforming, Energy Fuels,
21, 3499-3504.

CHAPTER 2: Thermodynamic analysis of dry autothermal reforming of Glycerol
40
Fernandez Y., Arenillas A., Diez M.A., Pis J.J., Menendez J.A., 2009,
Pyrolysis of glycerol over activated carbons for syngas production, J. Anal.
Appl. Pyrolysis, 84(2), 145-150.
Hirai T., Ikenaga N.O., Mayake T., Suzuki T., 2005, Production of hydrogen by
steam reforming of glycerin on ruthenium catalyst, Energy Fuels, 19,
1761−1762.
HSC Chemistry [software], 2002, Version 5.1 Pori: Outokumpu Research Oy.
Huber G.W., Shabaker J.W., Dumesic J.A., 2003, Raney Ni-Sn catalyst for H2
Production from Biomass-Derived Hydrocarbons, Science, 300, 2075-2077.
Iriondo A., Barrio V.L., Cambra J.F., Arias P.L., Güemez M.B., Navarro R.M.,
Sánchez-Sánchez M.C., Fierro J.L.G., 2008, Hydrogen production from
glycerol over nickel catalysts supported on Al2O3 modified by Mg, Zr, Ce or la,
Top. Catal., 49(1-2), 46-58.
Iriondo A., Barrio V.L., Cambra J.F., Arias P.L., Guemez M.B., Navarro R.M.,
Sanchez-Sanchez M.C., Fierro J.L.G., 2009, Influence of La2O3 modified
support and Ni and Pt active phases on glycerol steam reforming to produce
hydrogen, Catal. Commun., 10(8), 1275-1278.
Ito T., Nakashimada Y., Senba K., Matsui T., Nishio N., 2005, Hydrogen and
ethanol production from glycerol-containing wastes discharged after biodiesel
manufacturing process, J. Biosci. Bioeng., 100(3), 260-265.
Kunkes E.L., Simonetti D.A., Dumesic J.A., Pyrz W.D., Murillo L.E., Chen J.G.,
Buttrey D.J., 2008, The role of rhenium in the conversion of glycerol to
synthesis gas over carbon supported platinum-rhenium catalysts, J. Catal.,
260(1), 164-177.

CHAPTER 2: Thermodynamic analysis of dry autothermal reforming of Glycerol
41
Kunkes E.L., Soares R.R., Simonetti D.A., Dumesic J.A., 2009, An Integrated
Catalytic Approach for Production of Hydrogen by Glycerol Reforming coupled
with Water-Gas-Shift, Appl. Catal. B, 90(3-4), 693-698.
Lehnert K., Claus P., 2008, Influence of Pt particle size and support type on
the aqueous-phase reforming of glycerol, Catal. Commun., 9(15), 2543-2546.
Luciene P.R.P., Ticianelli E.A., Elisabete M., 2009, Production of hydrogen via
steam reforming of biofuels on Ni/CeO2-Al2O3 catalysts promoted by noble
metals, Int. J. Hydrogen Energy, 34(12), 5049-5060.
Luo N.J., Zhao X., Cao F.H., Xiao T.C., Fang D.Y., 2007, Thermodynamic
study on hydrogen generation from different glycerol reforming processes,
Energy Fuels, 21, 3505–3512.
Luo N., Fu X., Cao F., Xiao T., Edwards P., 2008, Glycerol aqueous phase
reforming for hydrogen generation over Pt catalyst - Effect of catalyst
composition and reaction conditions, Fuel, 87(17-18), 3483-3489.
Marshall A.T., Haverkamp R.G., 2008, Production of hydrogen by the
electrochemical reforming of glycerol-water solutions in a PEM electrolysis
cell, Int. J. Hydrogen Energy, 33(17), 4649-4654.
Perry R.H., Green D.W., 1997, Chemical engineers’ handbook 7th Edition,
McGraw Hill.
Selembo P.A., Perez J.M., Lloyd W.A., Logan B.E., 2009, High hydrogen
production from glycerol or glucose by electrohydrogenesis using microbial
electrolysis cells, Int. J. Hydrogen Energy, 34(13), 5373-5381.

CHAPTER 2: Thermodynamic analysis of dry autothermal reforming of Glycerol
42
Simonetti D.A., Kunkes E.L., Dumesic J.A., 2007, Gas-phase conversion of
glycerol to synthesis gas over carbon-supported platinum and platinum-
rhenium catalysts, J. Catal., 247(2), 298-306.
Slinn M., Kendall K., Mallon C., Andrews J., 2008, Steam reforming of
biodiesel by-product to make renewable hydrogen, Bioresour. Technol.,
99(13), 5851-5858.
Smith W.R., 1996, Computer Software Reviews, HSC Chemistry for Windows,
2.0, J. Chem. Inf. Comput. Sci., 36(1), 151-152.
Soares R.R., Simonetti D.A., Dumesic J.A., 2006, Glycerol as a source for
fuels and chemicals by low-temperature catalytic processing, Angew. Chem.
Int. Ed., 45, 3982-3985.
Swami S.M., Abraham M.A., 2006, Integrated catalytic process for conversion
of biomass to hydrogen, Energy Fuels, 20, 2616−2622.
Vaidya P.D., Rodrigues A.E., 2009, Glycerol reforming for hydrogen
production: A review, Chem. Eng. Technol., 32(10), 1463-1469.
Valliyappan T., Bakhshi N.N., Dalai A.K., 2008, Pyrolysis of glycerol for the
production of hydrogen or syngas, Bioresour. Technol., 99(10), 4476-4483.
Valliyappan T., Ferdous D., Bakhshi N.N., Dalai A.K., 2008, Production of
hydrogen and syngas via steam gasification of glycerol in a fixed-bed reactor,
Top. Catal., 49, 59-67.
Wang H., Wang X., Li M., Li S., Wang S., Ma X., 2009, Thermodynamic
analysis of hydrogen production from glycerol autothermal reforming, Int. J.
Hydrogen Energy, 34, 5683.
CHAPTER 2: Thermodynamic analysis of dry autothermal reforming of Glycerol
43
Wang X., Li S., Wang H., Liu B., Ma X., 2008, Thermodynamic Analysis of
Glycerin Steam Reforming, Energy Fuels, 22, 4285–4291.
Wang X., Li M., Wang M., Wang H., Li S., Wang S., Ma X., 2009,
Thermodynamic analysis of glycerol dry reforming for hydrogen and synthesis
gas production, Fuel, 88(11), 2148-2153.
Wen G., Xu Y., Ma H., Xu Z., Tian Z., 2008, Production of hydrogen by
aqueous-phase reforming of glycerol, Int. J. Hydrogen Energy, 33(22), 6657-
6666.
Xu D., Wang S., Hu X., Chen C., Zhang Q., Gong Y., 2009, Catalytic
gasification of glycine and glycerol in supercritical water, Int. J. Hydrogen
Energy, 34(13), 5357-5364.
Xuan J., Leung M.K.H., Leung D.Y.C., Ni M., 2009, A review of biomass-
derived fuel processors for fuel cell systems, Renewable Sustainable Energy
Rev.,13(6-7), 1301-1313.
Zhang B., Tang X., Li Y., Xu Y., Shen W., 2007, Hydrogen production from
steam reforming of ethanol and glycerol over ceria-supported metal catalysts,
Int. J. Hydrogen Energy, 32(13), 2367-2373.
Zhu X., Hoang T., Lobban L.L., Mallinson R.G., 2009, Plasma reforming of
glycerol for synthesis gas production, Chemical Communications, 20, 2908-
2910.

Chapter 3
Thermoneutral point analysis of ethanol dry
autothermal reforming

CHAPTER 3: Thermoneutral point analysis of ethanol dry autothermal reforming
45
Abstract
Thermoneutral points are vital operational temperatures in autothermal
processes. A thermodynamic analysis of dry autothermal reforming of ethanol
has been carried out to locate the thermoneutral temperatures and product
composition at those points at 1, 3, 6 and 9 bar reaction pressures. The
variations of thermoneutral temperatures and individual product yields at
those temperatures have been discussed to find the optimum operating
parameters for desired product output from the process. The process
operated at thermoneutral conditions can give useful products like hydrogen,
syngas (of low ratio) and carbon (possibly CNFs) and also provide a way for
CO2 sequestration using renewable ethanol fuel. A maximum of 2.58 moles of
syngas of ratio 2.01 obtained at 1 bar, CER=1 and OER=0.5 along with 0.82
moles of carbon, with 0.20 moles of CH4 and 0.89 moles of water for the
thermoneutral temperature of 603.55 °C was found to be the best operating
thermoneutral point for value added product generation from this process.

CHAPTER 3: Thermoneutral point analysis of ethanol dry autothermal reforming
46
3.1 Ethanol as fuel
The spurt of renewable energy has brought biofuels like ethanol, glycerol and
biodiesel into limelight. Biofuels are considered as reliable energy sources for
the future. Bioethanol, glycerol, etc. can be produced in abundant quantities
all around the world once the biofuel revolution commercializes. Ethanol is
easy to produce, safe to handle, transport and store. Ethanol does not contain
heteroatoms (N, S, etc) or metals, and using it in process will not emit NOx or
SOx. Although commercial biodiesel manufacture is being done recently,
ethanol manufacture from molasses has been well known in industry. Ethanol
is a reliable and preferred feedstock and can be used to generate hydrogen
and syngas instead of traditional feeds like coal, oil or gas as their reserves
have been depleting over the time. Ethanol to syngas by partial oxidation,
steam reforming, autothermal reforming and dry reforming has been studied
by many researchers. Some important ethanol to syngas work reported in
literature is summarized below:
3.1.1 Thermodynamic studies on steam reforming of ethanol
Vasudeva et al. (1996) have investigated the thermodynamic feasibility of
ethanol steam reforming under conditions conducive to carbon formation and
have reported that 5.5 moles of hydrogen can be obtained as against the
stoichiometric value of 6.0 per mole ethanol feed. Garcia et al. (1991) have
conducted thermodynamic analysis of steam reforming of ethanol to produce
hydrogen between 1-9 atm, 400-800 K and 0:1-10:1 water to ethanol feed
ratio and found that atmospheric pressure and water in excess in the feed
gave the best condition for hydrogen production at T > 650 K minimizing
methane production preventing carbon formation. Fishtik et al. (2008) have
studied the thermodynamics of ethanol steam reforming using an algorithm for
deriving a unique set of response reactions (RERs) that can be used to
rationalize the effect of process variables on steam reforming of ethanol to
produce hydrogen and have reported that at or above 700-800 K, and using
CHAPTER 3: Thermoneutral point analysis of ethanol dry autothermal reforming
47
high water/ethanol ratios, the desired reaction of ethanol steam reforming can
be made predominant minimizing the effect of undesirable side reactions.
Comas et al. (2004) have studied the thermodynamic analysis of ethanol
steam reforming using CaO as a CO2 sorbent and reported that atmospheric
pressure, 700 ºC and water/ethanol molar ratio of 4 were the best conditions
for hydrogen production in the presence of CaO. De Souza et al. (2006) have
studied the physical-chemical, thermodynamic and exergetic analysis of a
steam reformer of ethanol to produce hydrogen and reported that the best
thermodynamic conditions for steam reforming of ethanol are the same
conditions suggested in the physical-chemical analysis. Da Silva et al. (2009)
have presented a thermodynamic analysis of ethanol steam reforming to
identify conditions for carbon formation and also stated that the work could
provide explanations for deviations between thermodynamic analysis and
experimental results regarding carbon deposition. Ni et al. (2007) have
presented a review on reforming bio-ethanol for hydrogen production.
Haryanto et al. (2005) have presented a review of hydrogen production
techniques by steam reforming of ethanol.
3.1.2 Kinetics and Process engineering aspect studies
Vaidya et al. (2006a) have discussed the process engineering aspects of
ethanol steam reforming along with catalysts, optimum conditions and ways to
prevent problems like coking and byproduct formation. Sahoo et al. (2007)
have experimentally investigated the kinetics of ethanol steam reforming
using Co/Al2O3 catalysts in a fixed bed tubular reactor and proposed a kinetic
model to describe the steam reforming of ethanol process adequately for a
wide range of experimental data. Vaidya et al. (2006b) studied the catalytic
steam reforming of ethanol over a Ru/Al2O3 catalyst in 873-973 K temperature
range. Mathure et al. (2007) have experimentally studied the kinetics of
ethanol steam reforming over a commercial nickel-magnesia-alumina
(Ni/MgO/Al2O3) catalyst in a fixed-bed reactor.
CHAPTER 3: Thermoneutral point analysis of ethanol dry autothermal reforming
48
3.1.3 Oxidative Steam reforming / autothermal reforming
a. Thermodynamic studies
Liu et al. (2008) have conducted thermodynamic analysis of hydrogen
production in oxidative steam reforming of ethanol to calculate the
thermoneutral product gas equilibrium moles at 700, 900 and 1100 K and
reported that maximum hydrogen with minimum coke and methane were
formed at 900 K.
b. Experimental studies
Biswas et al. (2007) have experimentally compared steam reforming and
autothermal reforming of ethanol over Ni-CeO2-ZrO2 catalyst and reported
that the hydrogen yield was higher in ATR at 500 ºC but at higher
temperatures higher hydrogen yields were obtained in absence of oxygen.
Chen et al. (2009) have experimentally studied the autothermal reforming of
ethanol using noble metal (Ir, Ru, Rh, and Pd) catalysts supported on various
oxides like gamma-Al2O3, CeO2, ZrO2 and La2O3 and found that La2O3 was
the best support for the ATR reaction and Ir/La2O3 gave excellent hydrogen
selectivity with good stability on stream and high conversion approaching
thermodynamic limit. Cai et al. (2008) have studied the ethanol autothermal
reforming over an Rh/CeO2 catalyst and reported that the catalysts exhibited
stable activity and selectivity for long term operation without deactivation or
sintering. Deluga et al. (2004) have also studied ethanol autothermal
reforming on rhodium-ceria catalysts and reported that the process has great
potential for low-cost H2 generation applications. Markova et al. (2009) have
experimentally studied bio-ethanol autothermal reforming to generate data for
regression models to provide optimum values of the process factors to
maximize hydrogen. Youn et al. (2006) have investigated the effect of addition
of second metal (Ce, Co, Cu, Mg and Zn) to Ni/gamma-Al2O3 catalysts for
autothermal reforming of ethanol and found that Cu was the most efficient

CHAPTER 3: Thermoneutral point analysis of ethanol dry autothermal reforming
49
promoter for hydrogen production. De Lima et al. (2008) have tested the
catalytic performance of a Pt/CeZrO2 catalyst for ethanol decomposition,
steam reforming, partial oxidation, and oxidative steam reforming and
proposed a reaction mechanism based on results obtained under reaction
conditions. Cai et al. (2007) have experimentally tested the oxidative steam
reforming of ethanol over an Ir/CeO2 catalyst and reported complete
conversion of ethanol at 773K with hydrogen, carbon oxides and methane as
only products and stable performance of Ir/CeO2 without deactivation or
coking.
3.1.4 Dry reforming of ethanol
Jankhah et al. (2008) have studied the thermodynamic equilibrium analysis
and experimentation of thermal and catalytic ethanol cracking and dry
reforming using a carbon steel catalyst precursor and reported that highest
hydrogen and carbon (carbon nanofilaments) yields were obtained at 550 ºC.
Wang et al. (2009) have studied the thermodynamics of ethanol reforming
with carbon dioxide for hydrogen production and have reported that optimum
conditions gave over 94% yield of syngas with complete conversion of ethanol
without carbon deposition. De Oliveira-Vigier et al. (2005) have experimentally
studied the dry reforming of ethanol using a recyclable and long lasting SS
316 catalyst and have obtained hydrogen yield 98% of the theoretical value.
Blanchard et al. (2008) have experimentally studied the ethanol dry reforming
using a carbon steel catalyst to produce syngas and also nanocarbons.
No study of ethanol dry reforming with oxygen addition (dry autothermal
reforming (DATR) of ethanol) has been reported yet although a similar study
for glycerol has been reported in the earlier chapter which has stated the
advantages of DATR over the DR process and role of CO2 in the process.
Thermoneutral point is the condition where the endothermic reactions balance
the exothermic reactions to make the net enthalpy of reaction zero.

CHAPTER 3: Thermoneutral point analysis of ethanol dry autothermal reforming
50
Autothermal processes are generally operated at thermoneutral conditions to
maximize energy efficiency. However, very little literature is available
regarding thermoneutral points and product trends at those points. S. Ahmed
et al. (2001) have theoretically explained the advantages of thermoneutral
points of reforming reactions. The main goal of the work is to analyze the
thermoneutral conditions for DATR of ethanol process to produce a variety of
value added products like hydrogen, syngas and CNF’s whose yield can be
maximized at different operating conditions and input ratios. This paper
intends to study the variation of components in the product stream at
thermoneutral conditions, presenting product yields and product distribution
trends at various pressures to find the best operating thermoneutral point for
desired product.
3.2 Methodology
HSC Chemistry software package (version 5.1) has been used to generate
the equilibrium data for this study. The input species fed to the software were
ethanol (both gaseous and liquid state), air (g) and CO2 (g). The output
species fed to the software are H2, CO, CO2, CH4 (all in gaseous state), H2O
(both gas and liquid state) and C (solid), which are common reaction products
of reforming reactions. The software gives the individual product moles, along
with overall reaction enthalpy at the T and P condition. Temperature,
pressure, CER (feed CO2 to ethanol ratio) and OER (feed O2 to ethanol ratio)
are the key parameters for the process design. The OER is the equivalent of
the equivalence ratio, which is defined by the fuel to oxygen ratio compared to
the stoichiometric value by some researchers. It has been decided to operate
the process at thermoneutral temperatures only, so the data generation is
limited to product compositions at thermoneutral conditions for change in
CER, OER and pressure. Thermoneutral point temperatures can be obtained
from the temperature Vs reaction enthalpy graph as it is the temperature at
which the enthalpy curve touches the temperature axis where the enthalpy is
zero. 1 mole of ethanol has been used at all conditions for this study. The

CHAPTER 3: Thermoneutral point analysis of ethanol dry autothermal reforming
51
thermodynamic analysis of ethanol dry autothermal reforming has been
carried out in the temperature range (450 – 950ºC) at 1, 3, 6 and 9 bar
reaction pressures with CER (feed CO2 to ethanol ratio) 1, 2, 3 and OER (feed
O2 to ethanol ratio) 0.1, 0.3, 0.5. These conditions represent a realistic view
for process operation and are carefully chosen to limit the thermoneutral point
temperature to < 700ºC which is practical for ethanol feed and also to produce
significant carbon (possible CNFs) as they have been reported as useful
products by some researchers. The data for variation in yields of products like
H2, CO, CH4, H2O and C and also CO2 conversion at zero enthalpy
(thermoneutral) temperatures at different pressures have been generated,
analyzed and discussed in the proceeding section. Complete conversion of
ethanol and oxygen was found in all cases.
3.3 Results and Discussion
3.3.1 Thermoneutral points for DATR of ethanol
Thermoneutral point (TNP) is the temperature at which zero net enthalpy is
obtained in the autothermal process. It is considered as the best point for
autothermal process operation. Lower TNPs are generally preferred to reduce
heat losses. Figure 3.1 depicts the variation of TNP in DATR of ethanol with
change in pressure, CER and OER.

CHAPTER 3: Thermoneutral point analysis of ethanol dry autothermal reforming
52
Figure 3.1: Thermoneutral temperatures in DATR of Ethanol
As seen from figure 3.1, the TNP increases with increase in pressure at
constant CER and OER and also increases with increase in OER at constant
pressure and constant CER. However, the TNP decreases with increase in
CER at constant pressure and constant OER. At constant pressure, the TNP
shows an increase with a simultaneous increase in CER and OER, but it
decreases with increase in CER and decrease in OER at constant pressure.
Simultaneous increase in pressure, CER and OER generally increases the
TNP except for one (P=6 bar, CER=1, OER=0.3 and P=9 bar, CER=3,
OER=0.5) point. The TNP range obtained for increase in pressure from 1 bar
to 9 bar, was from 436.05°C to 603.55°C (P=1 bar), from 457.38°C to
646.66°C (P=3 bar), from 469.74°C to 675.61°C (P=6 bar) and from 476.47°C
to 693.15°C (P=9 bar) at different CERs and OERs. The TNP range obtained
for increase in CER from 1 to 3, was from 498.61°C to 693.15°C (CER=1),
from 466.08°C to 654.36°C (CER=2) and from 436.05°C to 623.00°C
(CER=3) for the considered pressure and OER range. The TNP range
obtained for increase in OER from 0.1 to 0.5, was from 436.05°C to 568.32°C
(OER=0.1), from 509.37°C to 647.37°C (OER=0.3) and from 551.51°C to
CHAPTER 3: Thermoneutral point analysis of ethanol dry autothermal reforming
53
693.15°C (OER=0.5) for the considered pressure and CER range. The
minimum TNP for every pressure were obtained at CER=3 & OER= 0.1 while
the maximum TNPs were obtained at CER=1 & OER=0.5. Considering all the
data points, the minimum TNP of 436.05 °C was obtained at 1 bar pressure,
CER = 3 & OER = 0.1 and the maximum TNP of 693.15 °C was found at 9 bar
pressure, CER = 1 & OER = 0.5.
3.3.2 Hydrogen yield at TNP
Hydrogen generation is one of the most desired applications of reforming
processes. Thermoneutral operation of the process to give higher hydrogen
yield is highly desired. Figure 3.2 shows the variation of hydrogen yield in
DATR of ethanol at thermoneutral points at various pressures, CER and OER.
The hydrogen yield decreases with increase in pressure at constant CER and
OER, and also decreases with increase in CER at constant OER and
pressure. But the hydrogen yield increases with increase in OER at constant
CER and pressure. Similarly, with simultaneous increase in CER and OER,
the hydrogen yield increases at constant pressure. But it decreases when
CER is increased and OER is decreased at constant pressure. Simultaneous
increase in pressure, CER and OER shows a mixed trend (the hydrogen yield
increases at some points and decreases at other points). The hydrogen yield
obtained for increase in pressure from 1 bar to 9 bar, was from 0.48 to 1.72
moles (P=1 bar), from 0.36 to 1.51 moles (P=3 bar), from 0.29 to 1.37 moles
(P=6 bar) and from 0.26 to 1.29 moles (P=9 bar) at different CERs and OERs.
The hydrogen yield obtained for increase in CER from 1 to 3, was from 0.56 to
1.72 moles (CER=1), from 0.38 to 1.45 moles (CER=2) and from 0.26 to 1.24
moles (CER=3) for the considered pressure and OER range. The hydrogen
yield obtained for increase in OER from 0.1 to 0.5, was from 0.26 to 0.87
moles (OER=0.1), from 0.58 to 1.38 moles (OER=0.3) and from 0.84 to 1.72
moles (OER=0.5) for the considered pressure and CER range.

CHAPTER 3: Thermoneutral point analysis of ethanol dry autothermal reforming
54
Figure 3.2: Hydrogen yield at thermoneutral temperatures
The minimum hydrogen yield for every pressure was obtained at CER=3 &
OER=0.1 and the maximum hydrogen yield was obtained at CER=1 &
OER=0.5. Considering all the data points, the maximum hydrogen yield of
1.72 moles was observed at 1 bar pressure, CER= 1 and OER= 0.5, while the
minimum hydrogen yield of 0.26 moles was observed at 9 bar pressure, CER
= 3 and OER = 0.1.
3.3.3 CO yield at TNP
Carbon monoxide is an undesired gas for PEM fuel cell applications but a
desired component of syngas for GTL (Gas-to-Liquids) manufacture. Figure
3.3 shows the variation of CO yield in DATR of ethanol at thermoneutral
points with variation in pressure, CER and OER. The CO yield decreases with
increase in pressure at constant CER and OER, (but it was constant at
CER=1, OER=0.1) and also decreases with increase in CER at constant
pressure and constant OER, but the CO yield increases with increase in OER
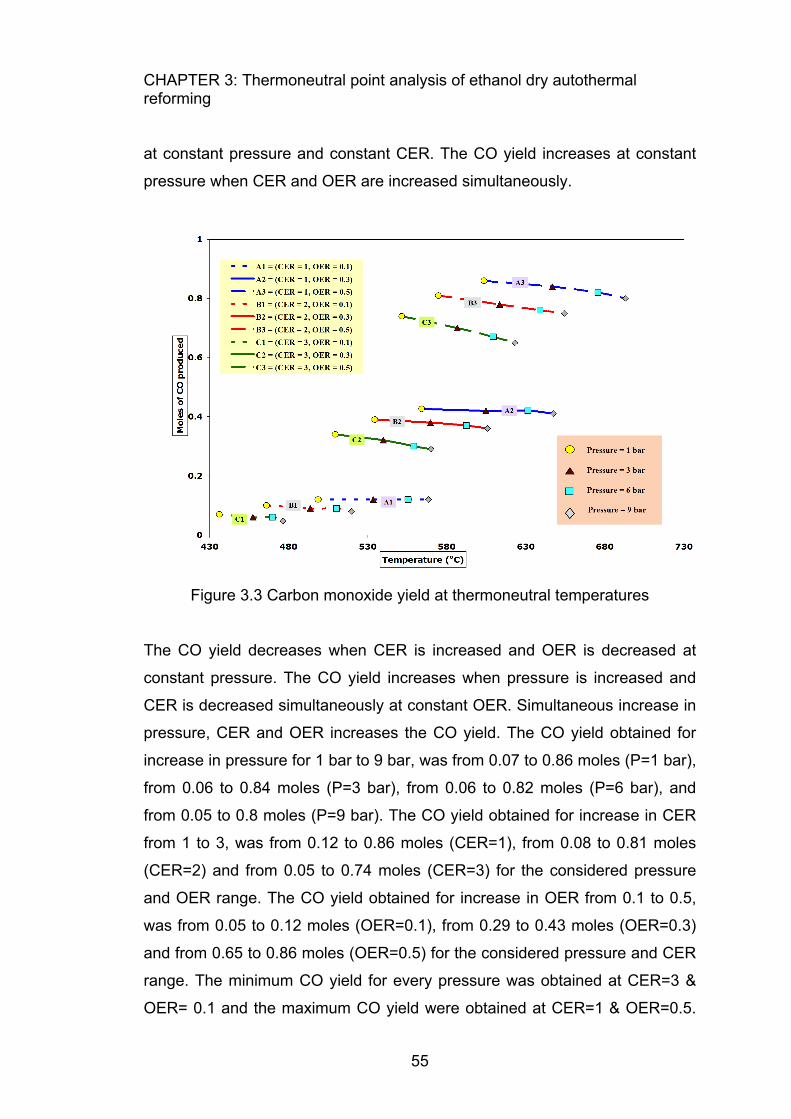
CHAPTER 3: Thermoneutral point analysis of ethanol dry autothermal reforming
55
at constant pressure and constant CER. The CO yield increases at constant
pressure when CER and OER are increased simultaneously.
Figure 3.3 Carbon monoxide yield at thermoneutral temperatures
The CO yield decreases when CER is increased and OER is decreased at
constant pressure. The CO yield increases when pressure is increased and
CER is decreased simultaneously at constant OER. Simultaneous increase in
pressure, CER and OER increases the CO yield. The CO yield obtained for
increase in pressure for 1 bar to 9 bar, was from 0.07 to 0.86 moles (P=1 bar),
from 0.06 to 0.84 moles (P=3 bar), from 0.06 to 0.82 moles (P=6 bar), and
from 0.05 to 0.8 moles (P=9 bar). The CO yield obtained for increase in CER
from 1 to 3, was from 0.12 to 0.86 moles (CER=1), from 0.08 to 0.81 moles
(CER=2) and from 0.05 to 0.74 moles (CER=3) for the considered pressure
and OER range. The CO yield obtained for increase in OER from 0.1 to 0.5,
was from 0.05 to 0.12 moles (OER=0.1), from 0.29 to 0.43 moles (OER=0.3)
and from 0.65 to 0.86 moles (OER=0.5) for the considered pressure and CER
range. The minimum CO yield for every pressure was obtained at CER=3 &
OER= 0.1 and the maximum CO yield were obtained at CER=1 & OER=0.5.

CHAPTER 3: Thermoneutral point analysis of ethanol dry autothermal reforming
56
Considering all the data points, it was observed that a minimum of 0.05 moles
of CO were produced at 9 bar pressure, CER = 3 & OER = 0.1, while a
maximum of 0.86 moles were produced at 1 bar pressure, CER = 1 & OER =
0.5.
3.3.4 Syngas (H2 + CO) amount at TNP
Syngas (H2 + CO) is an important gas for petrochemical manufacture. The
conditions for maximizing syngas yield are desired. The variation in the
amount of syngas moles obtained in DATR of ethanol at thermoneutral points
with variation in pressure, CER and OER is shown in figure 3.4.
Figure 3.4: Syngas yield at thermoneutral temperatures
As seen from the figure, the moles of syngas decrease with increase in
pressure at constant CER and OER, and also decrease with increase in CER
at constant pressure and constant OER. But the syngas yield increases with
increase in OER at constant pressure and constant CER. The moles of
syngas produced increase when CER and OER are increased simultaneously
CHAPTER 3: Thermoneutral point analysis of ethanol dry autothermal reforming
57
at constant pressure. On the other hand, the moles of syngas produced
decrease when CER is increased and OER is decreased at constant
pressure. Simultaneous increase in pressure, CER and OER generally
increases the syngas moles except for some points. The amount of syngas
moles obtained for increase in pressure from 1 bar to 9 bar, was from 0.55 to
2.58 moles (P=1 bar), from 0.42 to 2.35 moles (P=3 bar), from 0.35 to 2.19
moles (P=6 bar) and from 0.31 to 2.10 moles (P=9 bar). The amount of
syngas moles obtained for increase in CER from 1 to 3, was from 0.68 to 2.38
moles (CER=1), from 0.47 to 2.26 moles (CER=2) and from 0.31 to 1.98
moles (CER=3) for the considered pressure and OER range. The amount of
syngas obtained for increase in OER from 0.1 to 0.5, was from 0.31 to 0.98
moles (OER=0.1), from 0.86 to 1.81 moles (OER=0.3) and from 1.49 to 2.58
moles (OER=0.5) for the considered pressure and CER range. The minimum
syngas moles for all pressures were obtained at CER=3 & OER= 0.1 and the
maximum syngas moles were obtained at CER=1 & OER=0.5. Considering all
the data points, the minimum amount of syngas obtained was 0.31 moles at 9
bar pressure, CER = 3 & OER = 0.1, while a maximum 2.58 moles of total
hydrogen were obtained at 1 bar pressure, CER = 1 & OER = 0.5.
3.3.5 Syngas ratio (H2/CO) at TNP
Lower syngas (H2/CO) ratio between 0 – 5 is desired for converting syngas to
chemicals by FT synthesis. Figure 3.5 shows the variation of syngas ratio in
DATR of ethanol at thermoneutral points with variation in pressure, CER and
OER. It was seen that the syngas ratio decreased with increase in pressure at
constant CER and OER, the decrease was much more for lower OERs. With
increase in OER at constant pressure and constant CER, the syngas ratio
decreased considerably. Also with increase in CER at constant pressure and
constant OER, the syngas ratio decreased (except at OER = 0.1). It was
observed that when CER and OER were increased simultaneously, the
syngas ratio decreased at constant pressure. But at constant pressure, when
CER was increased and OER was decreased, the syngas ratio increased.

CHAPTER 3: Thermoneutral point analysis of ethanol dry autothermal reforming
58
Simultaneous increase in pressure, CER and OER decreases the syngas
ratio. The range of syngas ratio obtained for increase in pressure from 1 to 9
bar, was from 1.69 to 7.34 (P=1 bar), from 1.49 to 5.93 (P=3 bar), from 1.37 to
5.23 (P=6 bar) and from 1.30 to 4.82 (P=9 bar).
Figure 3.5: Syngas ratio at thermoneutral temperatures
The range of syngas ratio obtained for increase in CER from 1 to 3, was from
1.59 to 7.34 (CER=1), from 1.38 to 6.42 (CER=2) and from 1.3 to 6.46 moles
(CER=3) for the considered pressure and OER range. The range of syngas
ratio obtained for increase in OER from 0.1 to 0.5, was from 4.53 to 7.34
(OER=0.1), from 2.03 to 3.21 (OER=0.3) and from 1.30 to 2.01 (OER=0.5) for
the considered pressure and CER range. It was observed that the range of
syngas ratio decreases at higher pressures. The minimum syngas ratio was
obtained at CER=3 & OER= 0.5 and the maximum syngas ratio was obtained
at CER=1 & OER=0.1 (except at 9 bar) for all pressures considered.
Considering all the data points, the minimum syngas ratio obtained was 1.30
at 9 bar pressure, CER = 3 & OER = 0.5, and maximum syngas ratio of 7.34
was observed at 1 bar pressure, CER = 1 & OER = 0.1.
CHAPTER 3: Thermoneutral point analysis of ethanol dry autothermal reforming
59
3.3.6 Methane formation at TNP
Methane formation is inevitable in reforming processes. Figure 3.6 depicts the
variation of CH4 formation in DATR of ethanol at thermoneutral points with
change in pressure, CER and OER. It was seen that, the CH4 formation
increases with increase in pressure at constant CER and OER. It was
observed that with increase in OER at constant pressure and constant CER,
the CH4 formation decreased. Also at constant pressure and constant OER,
the CH4 formation decreased with increase in CER. Similarly at constant
pressure when CER and OER were increased, the CH4 formation decreased
gradually. When CER was increased and OER was decreased, the methane
formation increased at constant pressure except for P=9 bar. Simultaneous
increase in pressure, CER and OER generally decreases the CH4 formation
except for some points. The moles of CH4 obtained for increase in pressure
from 1 to 9 bar was from 0.17 to 0.42 (P=1 bar), from 0.22 to 0.49 (P=3 bar),
from 0.25 to 0.52 (P=6 bar) and from 0.27 to 0.55 (P=9 bar). The moles of
methane obtained for increase in CER from 1 to 3, was from 0.20 to 0.55
(CER=1), from 0.19 to 0.43 (CER=2) and from 0.17 to 0.35 (CER=3) for the
considered pressure and OER range. The moles of methane formed for
increase in OER from 0.1 to 0.5, was from 0.28 to 0.55 (OER=0.1), from 0.22
to 0.42 (OER=0.3) and from 0.17 to 0.33 (OER=0.5) for the considered
pressure and CER range. The minimum CH4 yield for all pressure conditions
was obtained at CER=3 & OER= 0.5, while the maximum CH4 was obtained
at CER=1 & OER=0.1. Considering all the data points, minimum of 0.17
moles of CH4 were obtained at 1 bar pressure, CER = 3 & OER = 0.5 and a
maximum of 0.55 moles of CH4 were obtained at 9 bar pressure, CER = 1 &
OER = 0.1.

CHAPTER 3: Thermoneutral point analysis of ethanol dry autothermal reforming
60
Figure 3.6: Methane yield at thermoneutral temperatures
3.3.7 Water formation at TNP
Water formation is undesirable in reforming processes as it decreases the
hydrogen yield. But water formation cannot be avoided. Figure 3.7 depicts the
variation in H2O yield in DATR of ethanol at thermoneutral points at specified
pressures, CER and OER. From figure 3.7, it was seen that the moles of H2O
produced increased with increase in pressure at constant CER and OER but
the moles of H2O produced decreased with increase in OER at constant
pressure and constant CER. When CER was increased at constant pressure
and constant OER, the moles of H2O produced increased. Similarly, at
constant pressure when CER and OER were increased simultaneously, the
moles of H2O produced increased at some points and decreased at other
points.

CHAPTER 3: Thermoneutral point analysis of ethanol dry autothermal reforming
61
Figure 3.7: Water yield at thermoneutral temperatures
It was observed that at constant pressure when CER was increased and OER
was decreased, the moles of H2O produced gradually increased.
Simultaneous increase in pressure, CER and OER generally increases the
H2O except for some points. The moles of H2O produced for increase in
pressure from 1 to 9 bar ranged from 0.89 to 1.96 (P=1 bar), from 0.97 to 2.0
(P=3 bar), from 1.02 to 2.03 (P=6 bar) and from 1.04 to 2.04 (P=9 bar). The
moles of water obtained for increase in CER from 1 to 3, was from 0.89 to
1.34 (CER=1), from 1.18 to 1.75 (CER=2) and from 1.41 to 2.04 (CER=3) for
the considered pressure and OER range. The moles of water formed for
increase in OER from 0.1 to 0.5, was from 1.29 to 2.04 (OER=0.1), from 1.06
to 1.80 (OER=0.3) and from 0.89 to 1.62 (OER=0.5) for the considered
pressure and CER range. The minimum moles of H2O for every pressure
were obtained at CER=1 & OER= 0.5 and the maximum H2O was obtained at
CER=3 & OER=0.1. Considering all the data points, the minimum moles of
H2O produced were 0.89 at 1 bar pressure and CER = 1 & OER = 0.5, and a
maximum of 2.04 moles of H2O were obtained at 9 bar pressure and CER = 3
& OER = 0.1.

CHAPTER 3: Thermoneutral point analysis of ethanol dry autothermal reforming
62
3.3.8 Carbon formation at TNP
Carbon formation is not desirable in any process as coking may deactivate
the catalyst. However, carbon (in the form of CNFs) is a valuable product for
some applications. Figure 3.8 shows the variation of the carbon formation in
DATR of ethanol at thermoneutral points at different pressures, CER and
OER. From figure 3.8, it was observed that, the carbon formation decreases
with increase in pressure at constant CER and OER (except for some points).
Also, it was observed that at constant pressure and constant CER, the moles
of carbon formed decreased with increase in OER. However, as CER was
increased at constant pressure and constant OER, the moles of carbon
produced increased. It was also observed that at constant pressure when
CER and OER were increased simultaneously, the moles of carbon formed
decreased. When CER was increased and OER was decreased, the moles of
carbon formed at constant pressure increased.
Simultaneous increase in pressure, CER and OER generally decreases the
carbon formation except at some points. The moles of carbon formed for
increase in pressure from 1 to 9 bar ranged from 0.82 to 2.06 (P=1 bar), from
0.80 to 2.05 (P=3 bar), from 0.79 to 2.05 (P=6 bar) and from 0.78 to 2.04
(P=9 bar). The moles of carbon obtained for increase in CER from 1 to 3, was
from 0.78 to 1.56 (CER=1), from 1.00 to 1.85 (CER=2) and from 1.16 to 2.06
(CER=3) for the considered pressure and OER range. The moles of carbon
formed for increase in OER from 0.1 to 0.5, was from 1.47 to 2.06 (OER=0.1),
from 1.16 to 1.65 (OER=0.3) and from 0.78 to 1.22 (OER=0.5) for the
considered pressure and CER range. The minimum carbon formation for all
pressures was observed at CER=1 & OER= 0.5, while the maximum carbon
formation was observed at CER=3 & OER=0.1. Considering all the data
points, the minimum carbon formation was 0.78 moles at 9 bar pressure, CER
= 1 & OER = 0.5, while a maximum carbon of 2.06 moles were obtained at 1
bar pressure, CER = 3 & OER = 0.1.

CHAPTER 3: Thermoneutral point analysis of ethanol dry autothermal reforming
63
Figure 3.8: Carbon yield at thermoneutral temperatures
3.3.9 CO2 conversion (%) at TNP
CO2 conversion in DATR of ethanol is important for CO2 sequestration. Figure
3.9 represents the variation of CO2 conversion (%) in DATR of ethanol at
thermoneutral point at different pressures, CER and OER. From the figure
3.9, it is seen that, the CO2 conversion increases with increase in pressure at
constant CER and OER It was observed that with increase in OER at constant
pressure and constant CER, the CO2 conversion decreases. Also at constant
pressure and constant OER, the CO2 conversion increases (except for OER =
0.1) with increase in CER of the process. Also at constant pressure when
CER is increased and OER is decreased, the CO2 conversion increases.
Simultaneous increase in pressure, CER and OER generally decreases the
CO2 conversion except for some points. The CO2 conversion (%) obtained for
increase in pressure from 1 to 9 bar ranged from -13.0 to 14.5 (P=1 bar), from
-10.0 to 15.5 (P=3 bar), from -8.0 to 15.5 (P=6 bar) and from -7.0 to 16.0 (P=9
bar).

CHAPTER 3: Thermoneutral point analysis of ethanol dry autothermal reforming
64
Figure 3.9: Carbon dioxide conversion at thermoneutral temperatures
The CO2 conversion (%) obtained for increase in CER from 1 to 3, was from -
13.00 to +13.00 (CER=1), from 0.00 to 16.00 (CER=2) and from 2.33 to 15.00
(CER=3) for the considered pressure and OER range. The CO2 conversion
(%) obtained for increase in OER from 0.1 to 0.5, was from 10.00 to 16.00
(OER=0.1), from -6.00 to 8.00 (OER=0.3) and from -13.00 to 4.33 (OER=0.5)
for the considered pressure and CER range. The minimum CO2 conversions
were obtained at CER=1 & OER= 0.5 and the maximum CO2 conversions
were obtained at CER=2 & OER=0.1 for all the pressures. The CO2
conversion varied from a minimum of -13 % at 1 bar pressure, CER = 1 &
OER = 0.5 to a maximum of 16 % at 9 bar pressure, CER = 2 & OER = 0.1,
for all the data points considered.
3.4 Conclusions
The product composition at thermoneutral points for DATR of ethanol at
various pressures showed some interesting results. Maximum carbon

CHAPTER 3: Thermoneutral point analysis of ethanol dry autothermal reforming
65
formation was observed at OER=0.1 and CER=3 and it decreased with
increase in pressure; hence thermo-neutral low pressure operation can be
used to produce carbon (possibly CNFs). The syngas ratio ranged between
7.34 to 1.30 and the syngas ratio decreased with increase in pressure, and as
lower syngas ratios are desirable for petrochemical manufacture by FT
synthesis, thermo-neutral higher pressure operation can be used for this
purpose. The maximum syngas (total H2) was formed at CER=1 and
OER=0.5, and it reduced with increase in pressure, so lower pressure TNP
operation can be used for hydrogen/syngas manufacture for fuel cells. Higher
CO2 conversion was observed for CER=2 and OER=0.1 and higher pressures
making this process effective for CO2 conversion (CO2 sequestration).
Thermoneutral points ranged from 436.05 to 693.15 °C which are practically
achievable temperatures in ethanol chemical processes. Depending upon the
desired product requirements, the system pressure and thermoneutral points
can be chosen for process operation. Syngas (of a particular ratio), carbon (in
the form of CNFs), syngas moles (total H2) are the usual desired products. A
maximum of 2.58 moles of total hydrogen obtained at 1 bar, CER=1 and
OER=0.5 producing 0.82 moles of carbon, of syngas ratio 2.01 with 0.20
moles of CH4 and 0.89 moles of water for the TNP=603.55 °C was found to be
the best operating thermoneutral point for value added product generation.
Lower pressure TNP operation is favored for higher hydrogen production,
lower methane and water formation. Higher pressure TNP operation is
favored for lower syngas ratio with higher CO2 conversion and sometimes
lower carbon formation.
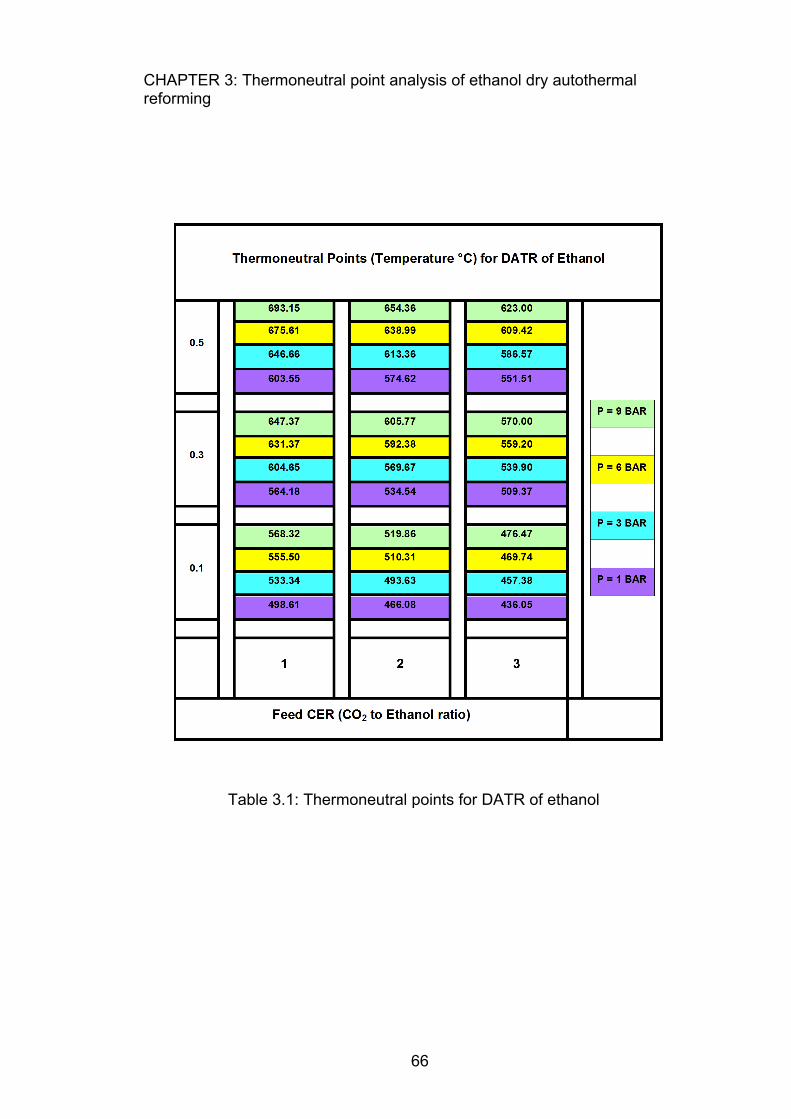
CHAPTER 3: Thermoneutral point analysis of ethanol dry autothermal reforming
66
Table 3.1: Thermoneutral points for DATR of ethanol

CHAPTER 3: Thermoneutral point analysis of ethanol dry autothermal reforming
67
3.5 References
Ahmed S., Krumpelt M., 2001, Hydrogen from hydrocarbon fuels for fuel cells,
Int. J. Hydrogen Energy, 26, 291–301.
Biswas P., Kunzru D., 2007, Oxidative steam reforming of ethanol over
Ni/CeO2-ZrO2 catalyst, Chem. Eng. J., 136(1), 41–49.
Blanchard J., Oudghiri-Hassani H., Abatzoglou N., Jankhah S., Gitzhofer F.,
2008, Synthesis of nano carbons via ethanol dry reforming over a carbon
steel catalyst, Chem. Eng. J., 143(1), 186–194.
Cai W., Zhang B., Li Y., Xu Y., Shen W., 2007, Hydrogen production by
oxidative steam reforming of ethanol over Ir/CeO2 catalyst, Catal. Commun.,
8(11), 1588–1594.
Cai W.J., Wang F.G., VanVeen A.C., Provendier H., Mirodatos C., Shen W.J.,
2008, Auto thermal reforming of ethanol for hydrogen production over an
Rh/CeO2 catalyst, Catal. Today, 138(3), 152–156.
Chaffee A.L., Knowles G.P., Liang Z., Zhang J., Xiao P., Webley P.A., 2007,
CO2 capture by adsorption: materials and process development, Int. J.
Greenhouse. Gas Control, 1-1, 8th International Conference on Greenhouse
Gas Control Technologies – GHGT-8, 11-18.
Chen H.Q., Yu H., Tang Y., Pan M.Q., Yang G.X., Peng F., Wang H.J., Yang
J., 2009, Hydrogen production via auto thermal reforming of ethanol over
noble metal catalysts supported on oxides, J. Nat. Gas Chem., 18(2), 191–
198.
Comas J., Laborde M., Amadeo N., 2004, Thermodynamic analysis of
hydrogen production from ethanol using CaO as a CO2 sorbent, J. Power
Sources, 138(1), 61–67.
DaSilva A.L., De C., Malfatti F., Muller I.L., 2009, Thermodynamic analysis of
ethanol steam reforming using gibbs energy minimization method: a detailed

CHAPTER 3: Thermoneutral point analysis of ethanol dry autothermal reforming
68
study of the conditions of carbon deposition, Int. J. Hydrogen Energy, 34(10),
4321–4330.
De Oliveira-Vigier K., Abatzoglou N., 2005, Dry-reforming of ethanol in the
presence of a 316 stainless steel catalyst, Can. J. Chem. Eng., 83(6), 978–
984.
DeLima S.M., DaCruz I.O., Jacobs G., Davis B.H., Mattos L.V., Noronha F.B.,
2008, Steam reforming, partial oxidation and oxidative steam reforming of
ethanol over Pt/CeZrO2 catalyst, J. Catal., 257(2), 356–368.
Deluga G.A., Salge J.R., Schmidt L.D., Verykios X.E., 2004, Renewable
hydrogen from ethanol by autothermal reforming, Science, 303(5660), 993–
997.
DeSouza A.C.C., Luz-Silveira J., Sosa M.I., 2006, Physical–chemical and
thermodynamic analyses of ethanol steam reforming for hydrogen production,
J. Fuel Cell Sci. Technol., 3(3), 346–350.
Figueroa J.D., Fout T., Plasynski S., McIlvried H., Srivastava R.D., 2008,
Advances in CO2 capture technology—the U.S. Department of Energy’s
Carbon Sequestration Program, Int. J. Greenhouse Gas Control, 2(1), 9–20.
Fishtik I., Alexander A., Datta R., Geana D., 2000, A thermodynamic analysis
of hydrogen production by steam reforming of ethanol via response reactions,
Int. J. Hydrogen Energy, 25(1), 31–45.
Garcia E.Y., Laborde M.A., 1991, Hydrogen production by the steam
reforming of ethanol thermodynamic analysis, Int. J.Hydrogen Energy, 16(5),
307–312.
Goransson K., Soderlind U., He J., Zhang W., 2010, Review of syngas
production via biomass DFBGs, Renewable Sustainable Energy Rev.,
Accepted Article in press, doi:10.1016/j.rser.2010.09.032.
CHAPTER 3: Thermoneutral point analysis of ethanol dry autothermal reforming
69
Haryanto A., Fernando S., Murali N., Adhikari S., 2005, Current status of
hydrogen production techniques by steam reforming of ethanol: a review,
Energy Fuels, 19(5), 2098–2106.
HSC Chemistry [software], Version 5.1, 2002, Pori: Outokumpu Research
Oy,.
Jankhah S., Abatzoglou N., 2008, Thermal and catalytic dry reforming and
cracking of ethanol for hydrogen and carbon nanofilaments production, Int. J.
Hydrogen Energy, 33(18), 4769–4779.
Kale G.R., Kulkarni B.D., 2010, Thermodynamic analysis of dry autothermal
reforming of glycerol, Fuel Process. Technol., 91, 520–530.
Kale G.R., Kulkarni B.D., Joshi A.R., 2010, Thermodynamic study of
combining chemical looping combustion and combined reforming of propane,
Fuel, 89, 3141–3146.
Liu S., Zhang K., Fang L., Li Y., 2008, Thermodynamic analysis of hydrogen
production from oxidative steam reforming of ethanol, Energy Fuels, 22(2),
1365–1370.
Markova D., Bazbauers G., Valters K., Arias R.A., Weuffen C., Rochlitz, L.,
2009, Optimization of bio-ethanol autothermal reforming and carbon
monoxide removal processes, J. Power Sources, 193(1) (Special Issue)), 9–
16.
Mathure P.V., Ganguly S., Patwardhan A.V., Saha R.K., 2007, Steam
reforming of ethanol using a commercial nickel-based catalyst, Ind. Eng.
Chem. Res., 46, 8471–8479.
Ni M., Leung D.Y.C., Leung M.K.H., 2007, A reviews on reforming bio-ethanol
for hydrogen production, Int. J. Hydrogen Energy, 32(15), 3238–3247.

CHAPTER 3: Thermoneutral point analysis of ethanol dry autothermal reforming
70
Sahoo D.R., Vajpai S., Patel S., Pant K.K., 2007, Kinetic modeling of steam
reforming of ethanol for the production of hydrogen over Co/Al2O3 catalyst,
Chem. Eng. J., 125(3), 139–147.
Sasaki K., Fujii T., Niibori Y., Ito T., Hashida T., 2008, Numerical simulation of
supercritical CO2 injection into sub surface rock masses, Energy Convers.
Manag., 49(1), 54–61.
Smith C.H., Leahey D.M., Miller L.E., Ellzey J.L., 2010, Conversion of wet
ethanol to syngas via filtration combustion: an experimental and
computational investigation, Proc. Combust. Inst., Accepted Article in press,
doi:10.1016/j.proci.2010.06.006.
Vaidya P.D., Rodrigues A.E., 2006, Insight in to steam reforming of ethanol to
produce hydrogen for fuel cells, Chem. Eng. J., 117(1), 39–49.
Vaidya P.D., Rodrigues A.E., 2006, Kinetics of steam reforming of ethanol
over a Ru/Al2O3 catalyst, Ind. Eng. Chem. Res., 45(19), 6614–6618.
Vasudeva K., Mitra N., Umasankar P., Dhingra S.C., 1996, Steam reforming
of ethanol for hydrogen production: thermodynamic analysis, Int. J. Hydrogen
Energy, 21(1), 13–18.
Wang W.J., Wang Y.Q., 2009, Dry reforming of ethanol for hydrogen
production: thermodynamic investigation, Int. J. Hydrogen Energy, 34(13),
5382–5389.
Wilhelm D.J., Simbeck D.R., Karp A.D., Dickenson R.L., 2001, Syngas
production for gas-to-liquids applications: technologies, issues and outlook,
Fuel Process Technol., 71(1), 139–148.
Xie X., Economides M.J., 2009, The impact of carbon geological
sequestration, J. Nat. Gas. Sci. Eng., 1(3), 103–111.
Youn M.H., Seo J.G., Kim P., Kim J.J., Lee H.I., Song I.K., 2006, Hydrogen
production by auto-thermal reforming of ethanol over Ni/-gamma-Al2O3
CHAPTER 3: Thermoneutral point analysis of ethanol dry autothermal reforming
71
catalysts: effect of second metal addition, J. Power Sources, 162(2), 1270–
1274.
Zhang W., 2010, Automotive fuels from biomass via gasification, Gasification:
Fundamentals and application, Fuel Process. Technol., 91(8), 866–876.
Chapter 4
Application of DATR in gasoline fuel processors
CHAPTER 4: Application of DATR in gasoline fuel processors
73
Abstract
The chapter explores the thermodynamics of an alternate syngas generation
process – dry autothermal reforming and its comparison to autothermal
reforming process of isooctane for use in gasoline fuel processors for SOFC.
A thermodynamic analysis of iso-octane as feed hydrocarbon for dry
autothermal reforming and autothermal reforming processes for feed OCIR
(oxygen to carbon in isooctane ratio) from 0.5 – 0.7 at 1 bar pressure under
analogous thermoneutral operating conditions was done using Gibbs free
energy minimization algorithm in HSC Chemistry. The trends in thermoneutral
points (TNP), important product gas compositions at TNPs and fuel processor
energy requirements were compared and analyzed. Dry autothermal
reforming was identified as a less energy consuming alternative to
autothermal reforming as the syngas can be produced with lower energy
requirements at thermoneutral temperatures, making it a promising candidate
for use in gasoline fuel processors to power the solid oxide fuel cells.

CHAPTER 4: Application of DATR in gasoline fuel processors
74
4.1 Fuel processors and Gasoline
Hydrogen energy and fuel cells are considered to be the future energy
sources. Syngas production using hydrocarbon reforming has been a popular
research area for more than three decades. Various hydrocarbon fuels have
been evaluated for their capacity to fulfill the requirements of fuel processor
system. Natural gas, LPG and gasoline are commercially available fuels that
have an established infrastructure for production and distribution worldwide.
Liquid fuels like gasoline have high energy density and are the most favorable
choice for fuel processors (FP) as reported in literature. Brian et. al. (2007)
have reported the development of compact sized powerful onboard fuel
processor operating on fuels like gasoline and having hydrogen efficiencies
above 77% for vehicular use. Studies related to start up strategies and
performance of gasoline fuel processors have also been published
(Semelsberger and Borup, 2005; Ahmed et. al., 2006). Minutillo et. al. (2005)
have formulated a numerical model of a partial oxidation based reforming
system and tested it with the experimental data of a plasma-assisted reformer
for different fuels including gasoline for onboard hydrogen production.
Sobacchi et. al. (2002) have reported the experimentation studies of a
combined reforming system of gasoline-like fuels that includes both auto-
thermal catalytic and non-equilibrium plasma units. Thomas et al. (2000) have
discussed the economic option amongst hydrogen storage and onboard
gasoline reforming for fuel cell vehicles. Boehme et al. (2008) have discussed
a one-dimensional, single channel monolith model of a 4kW gasoline
autothermal reformer that can successfully predict the dynamics of the fuel
processor. Otsuka et al. (2002) have reported catalytic thermal decomposition
of gasoline ranged alkanes to pure hydrogen and carbon for use in SOFC.
Bobrova et al. (2007) have presented the study of hydrogen generation by
selective catalytic oxidation of gasoline mixture containing 191 hydrocarbon
species in a nearly adiabatic reactor using monolith catalysts. Research has

CHAPTER 4: Application of DATR in gasoline fuel processors
75
also been done with relation to activity of catalyst and their performance (Kaila
and Krause, 2006; Kaila et. al, 2008; Qi et. al., 2007). The USDOE’s 2006 no-
go decision for onboard fuel processing programs has not stalled research
interests in this area and scientists are constantly researching newer
techniques. Rollier et. al. (2008a, 2008b) have reported work on cold plasma
gasoline reforming as a better option than conventional catalytic gasoline
reforming in an on-board fuel processor. Some researchers (Rabe et al.,
2009) have reported the problems related to catalyst deactivation and
subsequent coking due to sulfur presence in gasoline. These pose hindrance
for gasoline use in research studies. Hence, iso-octane (2, 2, 4-trimethyl
pentane), pure compound resembling gasoline, is used in research studies
instead of gasoline. The potential of gasoline/iso-octane for hydrogen
production using established process technologies like partial oxidation,
steam reforming and autothermal reforming have been studied in detail by
researchers.
A typical gasoline based power system consists of an ATR fuel processor and
PEMFC fuel cell. These (PEMFC type) fuel cells require very low CO in feed
gas, which makes WGS (Water Gas Shift) reactors compulsory in fuel
processors. WGS reaction is reversible and slow, making the WGS reactor
size huge and bulky. Electrochemically both H2 and CO are fuels for SOFC of
the same caliber. There are some problems for CO electrochemical oxidation
due to its slower rate than H2 oxidation in SOFC. However research in this
area is in progress and that may solve it in near future. Some publications
have indicated that the CO is converted to H2 by in situ WGS reaction.
External WGS reactor require a huge amount of steam (for higher Steam/CO
ratio ~4) to convert CO to hydrogen. In situ WGS in the SOFC will require only
stoichiometric amount of steam (S/CO =1) as the in situ generated hydrogen
is quickly utilized by the SOFC that acts similar to hydrogen separation
membrane reactor shifting the WGS equilibrium to completely convert to H2.
CHAPTER 4: Application of DATR in gasoline fuel processors
76
The SOFC type fuel cells were earlier considered ideal for stationary
applications only, but present research to make them smaller in size (micro-
SOFCs) has given PEMFC tough competition. They are also undergoing
miniaturization and venturing in automobile applications. SOFC has the
potential to replace PEMFC in small scale applications too. Although earlier
studies have used only H2 as fuel in SOFC, some recent studies have
reported that CO can also be used as fuel for SOFC. Burnette et al. (2008)
have suggested that SOFC can operate successfully using hydrogen depleted
syngas as feed. Homel et al. (2010) have explored the possibility of using CO
as a primary fuel in SOFC of both tubular and planar geometries and reported
that CO is a viable primary fuel for SOFCs. Ye et al. (2010) have reported that
optimized anode composition of SOFC could make it run successfully on
syngas for 1050hrs. Lawrence et al. (2006) have successfully operated the
SOFC using the syngas generated by a dry catalytic partial oxidation diesel
reformer. Cheekatamarla et al. (2008) have reported the successful operation
of an anode catalytic modified SOFC using the syngas without coking and
yielding stable power output. Colpan et al. (2007) have reported the
thermodynamic modeling of direct internal reforming solid oxide fuel cells
operating with syngas produced by gasification and model validation using
literature data. Eduardo et al. (2005) have reported the development of an
integrated model (electrochemical-thermal) to analyze the performance of
SOFC with respect to different syngas feed compositions.
In such conditions, the possibility of SOFC using CO and H2 both as
equivalent fuels in near future cannot be ruled out and the fuel processor may
be limited to only ATR for syngas generation. The WGS section may not be
required. This can reduce the WGS requirements in ATR gasoline fuel
processors. However, steam is still required for gasoline FP, which is energy
intensive. In these circumstances, energy inputs of ATR will play a vital role
for defining efficiency of the fuel processor system. Syngas can also be
CHAPTER 4: Application of DATR in gasoline fuel processors
77
generated by dry autothermal reforming (DATR) process and operating the
DATR/ATR at thermoneutral points, the energy required for heating the feed
CO2 is much less than required for producing feed steam for the fuel
processor. The important product gas distribution at thermoneutral points
(TNP) in DATR and ATR processes as well as energy requirements of the
processes for use in gasoline fuel processor system have been compared in
this chapter.
Dry autothermal reforming (DATR) is a combination of dry reforming and
partial oxidation and it uses CO2 instead of steam in feed to produce syngas
from hydrocarbons. However, till date DATR is not considered for fuel
processor application and hence is studied in this chapter. The CO2
availability as dry ice is very well known. New technologies like chemical
looping combustion (CLC) produce pure CO2 stream that can be compressed
and used in this application.
4.2 Methodology
A thermodynamic study of ATR and DATR of iso-octane was done using
Gibbs free energy minimization algorithm in HSC Chemistry 5.1 software
package using 1 mole of iso-octane as feed for OCIR (feed oxygen to carbon
in iso-octane ratio) of 0.5, 0.6 and 0.7 at 1 bar pressure. For ATR, the SCIR
(feed steam to carbon in iso-octane ratio) was varied from 1 to 3 and for
DATR the CCIR (feed CO2 to carbon in iso-octane ratio) was varied from 1 to
3. Only realistic process conditions were chosen for this study. The process
enthalpy, thermoneutral points and important product gas distribution at TNP
for both processes including syngas, CO, water and carbon obtained at TNPs
are analyzed and discussed. HSC Chemistry software requires quantities of
input species (iso-octane, H2O or CO2, O2, N2 (all in gaseous phase)), desired
output species, temperature and pressure conditions. The desired output

CHAPTER 4: Application of DATR in gasoline fuel processors
78
species fed to the program were H2, CO, CO2, CH4 (all in gaseous phase),
H2O (gas & liquid phase), iso-octane (gaseous phase) and C (solid phase).
Complete conversion of iso-octane and oxygen was observed in all cases. No
other product species or inerts have been considered in this study. The
energy balance calculations for feed gases have been performed manually
using standard data.
4.3 Results and Discussion
4.3.1 Process enthalpy
Reaction enthalpy is always a deciding factor in chemical processes. Figure.
4.1a and 4.1b show the variation of enthalpy of ATR and DATR of isooctane
processes with a change in OCIR, SCIR and CCIR along the process
temperature. It was observed that the process exothermicity increased with
increase in OCIR at constant SCIR (for ATR) and also at constant CCIR (for
DATR).
Figure 4.1a: Process enthalpy for ATR of Iso-octane

CHAPTER 4: Application of DATR in gasoline fuel processors
79
Thermoneutral temperature for ATR and DATR of iso-octane (°C)
ATR SCIR=1 SCIR=2 SCIR=3
OCIR=0.5 673.66 614.82 565.92
OCIR=0.6 849.52 748.00 669.70
OCIR=0.7 1024.45 896.13 799.70
DATR CCIR=1 CCIR=2 CCIR=3
OCIR=0.5 637.51 592.01 559.63
OCIR=0.6 716.74 609.35 578.35
OCIR=0.7 900.43 735.68 632.22
Table 4.1: Thermo neutral points for ATR and DATR
Figure 4.1b: Process enthalpy for DATR of Iso-octane
It was also observed that the reaction endothermicity increased with increase
in SCIR (for ATR) from 1 to 3, at constant OCIR, and also showed a decrease
in thermo neutral temperatures. A similar trend was observed in case of
DATR of isooctane for analogous increase in CCIR from 1 to 3 at constant
CHAPTER 4: Application of DATR in gasoline fuel processors
80
OCIR. The ATR reaction enthalpy per mole of isooctane fed at 700°C for an
increase in SCIR from 1 to 3, increased from 62.8 to 400 kJ (for OCIR=0.5),
increased from -263 to 74.5 kJ (for OCIR=0.6) and increased from -594 to -
251 kJ (for OCIR=0.7). The ATR reaction enthalpy per mole isooctane fed at
700°C for an increase in OCIR from 0.5 to 0.7, decreased for constant SCIR
as shown in figure 1a, The DATR reaction enthalpy per mole of isooctane fed
at 700 ºC for an increase in CCIR from 1 to 3, increased from 314 to 915 kJ
(for OCIR=0.5), increased from -33 to 556 kJ (for OCIR=0.6) and increases
from -383 to 197 kJ (for OCIR=0.7). The DATR reaction enthalpy per mole of
isooctane fed at 700°C for an increase in OCIR from 0.5 to 0.7, decreased for
constant CCIR as shown in figure 1b. Similar trend in reaction enthalpy of
ATR and DATR was noted for all the temperatures considered.
4.3.2 Thermo neutral points
Thermo neutral operation of ATR and DATR of isooctane requires no external
energy for cooling or heating, which makes it valuable from energy
consumption point of view. The intersection of reaction enthalpy curves with
temperature axis shows the thermo neutral temperatures (figures 4.1a and
4.1b). The thermo neutral temperatures for the study conditions are shown in
table 4.1. Figure 4.2 shows the variation of thermo neutral points along OCIR
for various SCIR (for ATR) and CCIR (for DATR). It was observed that the
thermo neutral temperatures increased with increase in OCIR at constant
SCIR (for ATR) and at constant CCIR (for DATR). The ATR thermo neutral
temperature for an increase in OCIR from 0.5 to 0.7 increased for constant
SCIR as shown in figure 2. The DATR thermo neutral temperature for an
increase in OCIR from 0.5 to 0.7 increased for constant CCIR as shown in
figure 4.2. But the thermoneutral temperatures decreased with increase in
SCIR (for ATR) and also decreased with increase in CCIR (for DATR) for
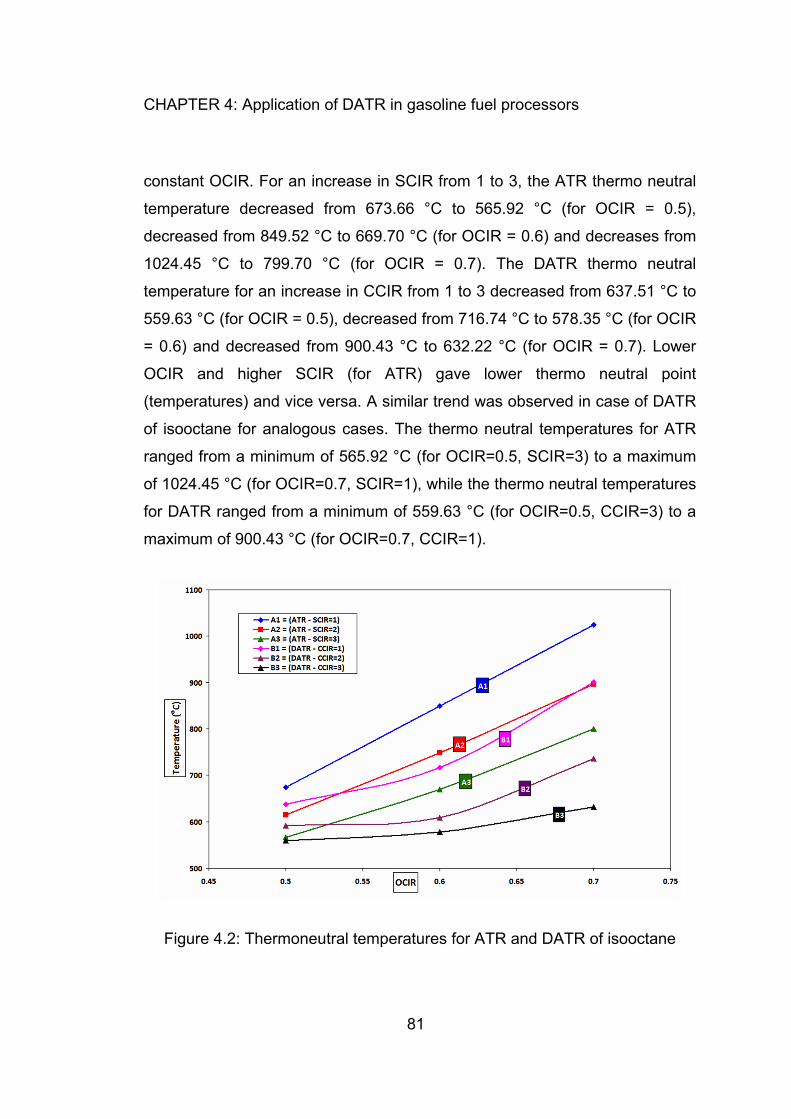
CHAPTER 4: Application of DATR in gasoline fuel processors
81
constant OCIR. For an increase in SCIR from 1 to 3, the ATR thermo neutral
temperature decreased from 673.66 °C to 565.92 °C (for OCIR = 0.5),
decreased from 849.52 °C to 669.70 °C (for OCIR = 0.6) and decreases from
1024.45 °C to 799.70 °C (for OCIR = 0.7). The DATR thermo neutral
temperature for an increase in CCIR from 1 to 3 decreased from 637.51 °C to
559.63 °C (for OCIR = 0.5), decreased from 716.74 °C to 578.35 °C (for OCIR
= 0.6) and decreased from 900.43 °C to 632.22 °C (for OCIR = 0.7). Lower
OCIR and higher SCIR (for ATR) gave lower thermo neutral point
(temperatures) and vice versa. A similar trend was observed in case of DATR
of isooctane for analogous cases. The thermo neutral temperatures for ATR
ranged from a minimum of 565.92 °C (for OCIR=0.5, SCIR=3) to a maximum
of 1024.45 °C (for OCIR=0.7, SCIR=1), while the thermo neutral temperatures
for DATR ranged from a minimum of 559.63 °C (for OCIR=0.5, CCIR=3) to a
maximum of 900.43 °C (for OCIR=0.7, CCIR=1).
Figure 4.2: Thermoneutral temperatures for ATR and DATR of isooctane

CHAPTER 4: Application of DATR in gasoline fuel processors
82
The DATR TNPs were lower than the corresponding ATR TNPs at similar
OCIR. The temperature difference between consecutive TNPs for ATR of
isooctane for an increase in OCIR from 0.5 to 0.7 decreased gradually as
SCIR increased from 1 to 3. The temperature difference between TNPs (for
OCIR=0.5 & 0.6) for ATR of isooctane for an increase in SCIR from 1 to 3
decreased from 175.86 °C (for SCIR=1) to 133.18 °C (for SCIR=2) to 103.78
°C (for SCIR=3) and (for OCIR=0.6 & 0.7) it decreased from 174.93 °C (for
SCIR=1) to 148.13 °C (for SCIR=2) to 130 °C (for SCIR=3). The temperature
difference between TNPs for DATR of isooctane for an increase in OCIR from
0.5 to 0.7 at constant CCIR decreased gradually as CCIR increased from 1 to
2, but slightly increased for CCIR increase from 2 to 3 (for OCIR 0.5 & 0.6
only). The temperature difference between TNPs (for OCIR=0.5 & 0.6) for
DATR of isooctane for an increase in CCIR from 1 to 3 decreased from 79.23
°C (for CCIR=1) to 17.33 °C (for CCIR=2) but increased slightly to 18.67°C
(for CCIR=3) and (for OCIR=0.6 & 0.7) it decreased from 183.7 °C (for
CCIR=1) to 126.33°C (for CCIR=2) to 53.87°C (for CCIR=3). The temperature
difference between TNPs for ATR of iso-octane for an increase in SCIR from
1 to 3 increased gradually as OCIR increased from 0.5 to 0.7. The
temperature difference between TNPs (for SCIR=1 & 2) for ATR of isooctane
for an increase in OCIR from 0.5 to 0.7 increased from 58.84 °C (for
OCIR=0.5) to 101.52°C (for OCIR=0.6) to 128.32°C (for OCIR=0.7) and (for
SCIR=2 & 3) it increased from 48.9 °C (for OCIR=0.5) to 78.3 °C (for
OCIR=0.6) to 96.43 °C (for OCIR=0.7). The temperature difference between
TNPs for DATR of iso-octane for an increase in CCIR from 1 to 3 increased
gradually as OCIR was increased from 0.5 to 0.7 except for the case of
temperature difference between TNP of CCIR=2 and CCIR=3 at OCIR=0.5
and OCIR=0.6 when temperature difference was almost same. The
temperature difference between TNPs (for CCIR=1 & 2) for DATR of
isooctane for an increase in OCIR from 0.5 to 0.7 increased from 45.5 °C (for
OCIR=0.5) to 107.39 °C (for OCIR=0.6) to 164.76°C (for OCIR=0.7) and (for

CHAPTER 4: Application of DATR in gasoline fuel processors
83
CCIR=2 & 3) it decreased slightly from 32.38 °C (for OCIR=0.5) to 31°C (for
OCIR=0.6) but again increased to 103.46 °C (for OCIR=0.7). It was noted that
the temperature difference between TNPs for SCIR=1 & 2 was more than the
temperature difference between TNPs for SCIR=2 & 3 for all cases of OCIR
for ATR of isooctane. A similar trend was observed in case of DATR of
isooctane too.
4.3.3 Total hydrogen
Total hydrogen is the moles of syngas obtained from a particular fuel. Total
hydrogen potential is a good parameter to evaluate the quality of fuels for fuel
processor applications. The amount of total hydrogen obtained for ATR and
DATR of isooctane at thermo neutral points (TNP) at various SCIR and CCIR
for OCIR increase from 0.5 to 0.7 is plotted in figure 4.3. It was found that the
total hydrogen yield decreased for SCIR increase at constant OCIR (for ATR)
and also decreased for CCIR increase at constant OCIR (for DATR). Also, it is
observed that the total hydrogen production decreased with increase in OCIR
for ATR but increased first and then decreased for DATR (for CCIR 1 and 2).
The total hydrogen yield for ATR of isooctane at TNP was same as that
obtained in DATR process for some cases. The moles of total hydrogen
produced at TNP, for ATR, for SCIR increase from 1 to 3, decreased from
16.31 to 15.13 (7.23%, for OCIR = 0.5), negligibly decreased from 15.37 to
15.35 (0.13%, for OCIR = 0.6) and negligibly increased from 13.80 to 13.81
(0.0724%, for OCIR = 0.7), while for DATR, the moles of total hydrogen
produced at TNP, for CCIR increase from 1 to 3, decreased from 13.88 to
9.71 (30.04%, for OCIR = 0.5), 15.32 to 12.35 (19.38%, for OCIR = 0.6) and
13.80 to 13.69 (0.797%, for OCIR = 0.7). The moles of total hydrogen
produced at TNP, for ATR, for OCIR increase from 0.5 to 0.7 decreased at
constant SCIR as shown in figure 4.3, while for DATR, for OCIR increase from

CHAPTER 4: Application of DATR in gasoline fuel processors
84
0.5 to 0.7, the moles of total hydrogen produced at TNP, initially increased
and then decreased for CCIR = 1, 2 and increased continuously for CCIR = 3.
The maximum total hydrogen yield for ATR of isooctane at TNP was found to
be 16.31 moles (for SCIR = 1, OCIR = 0.5) while the maximum total hydrogen
yield for DATR at TNP was 15.32 moles (CCIR = 1, OCIR = 0.6). The
minimum total hydrogen yield for ATR at TNP was 13.80 moles (SCIR = 1,
OCIR = 0.7) and 9.71 moles (CCIR = 3, OCIR = 0.5) for DATR. The minimum
total hydrogen yield at TNP of isooctane was 15.39% less than the maximum
for ATR and 36.61% less for DATR. Lower OCIR and lower SCIR increased
the total hydrogen yield in ATR while medium OCIR and lower CCIR
increased the total hydrogen yield in DATR.
Figure 4.3: Total Hydrogen for ATR and DATR of isooctane

CHAPTER 4: Application of DATR in gasoline fuel processors
85
4.3.4 CO yield
Carbon monoxide is a poison for PEMFC. However, it is a fuel for the SOFC
and hence is very much desired. The number of moles of carbon monoxide
produced at TNP for ATR and DATR of isooctane, for OCIR of 0.5, 0.6 and
0.7 were calculated for SCIR and CCIR of 1, 2 and 3 respectively. These
observations are plotted in figure 4.4. With increase in OCIR at constant CCIR
(for DATR), the CO yield generally increased, except for CCIR =1, where it
increased and then decreased slightly. For DATR, at constant OCIR, the CO
yield generally decreased with increase in CCIR. The same trend was
observed in ATR, for the corresponding SCIR increase but without any
exceptions. The moles of CO produced at TNP for ATR for SCIR increase
from 1 to 3 decreased from 4.51 to 1.43 (68.3%, for OCIR = 0.5), 5.07 to 2.15
(57.6%, for OCIR 0.6) and 5.19 to 2.61 (49.71%, for OCIR = 0.7) while for
DATR, the moles of CO produced at TNP, decreased from 7.86 to 5.8 (26.2%,
for OCIR = 0.5), 9.30 to 7.97 (14.3%, for OCIR = 0.6) but then increased from
9.21 to 9.54 (3.5%, for OCIR = 0.7), then decreased to 9.42 (1.25% , for
OCIR = 0.7) for CCIR increase from 1 to 3. The moles of CO produced at
TNP, for ATR, for OCIR increase from 0.5 to 0.7, increased for constant SCIR
as shown in figure 4.4, while for DATR, for OCIR increase from 0.5 to 0.7, the
moles of CO produced at TNP, initially increased and then decreased for
CCIR = 1 whereas for CCIR = 2, 3 it increased as shown in figure 4.4. The
maximum CO yield for ATR of isooctane at TNP was found to be 5.19 moles
(for SCIR = 1, OCIR = 0.7) while the maximum CO yield for DATR of
isooctane at TNP was 9.54 moles (CCIR = 2, OCIR = 0.7). The minimum CO
yield for ATR at TNP was 1.43 moles (SCIR = 3, OCIR = 0.5) and 5.80 moles
(CCIR = 3, OCIR = 0.5) for DATR. The minimum CO yield at TNP of
isooctane was 72.44% less than the maximum for ATR and 39.2% less for
DATR.

CHAPTER 4: Application of DATR in gasoline fuel processors
86
Figure 4.4: CO formation for ATR and DATR of isooctane
4.3.5 Water formation
Water formation is the loss of hydrogen moles but is sometimes required for
internal WGS in the SOFC; hence monitoring the water formation in reforming
process is an important issue. The H2O moles in the product gas of ATR and
DATR was calculated at TNPs at various SCIR and CCIR conditions for OCIR
increase from 0.5 to 0.7 and was plotted in figure 4.5. It was observed that the
water in the product stream increased with SCIR (for ATR) and CCIR (for
DATR) increase from 1 to 3 for constant OCIR. Also, it is observed that water
formation increased with increase in OCIR from 0.5 to 0.7 at constant SCIR
(for ATR) and first decreased negligibly for increase in OCIR from 0.5 to 0.6
but again increased with OCIR increase from 0.6 to 0.7 at constant CCIR (for
DATR). The moles of water formed at TNP for ATR, for SCIR increase from 1
to 3, increased from 4.86 to 18.3 moles (for OCIR = 0.5), from 6.67 to 19.80

CHAPTER 4: Application of DATR in gasoline fuel processors
87
moles (for OCIR = 0.6) and 8.39 to 21.8 (for OCIR = 0.7), while for DATR, for
CCIR increase from 1 to 3, the moles of water generated increased from 2.45
to 4.61 moles (88.2% for OCIR = 0.5), from 2.94 to 4.20 moles (42.8% for
OCIR = 0.6) and from 4.41 to 4.67 moles (5.89% for OCIR = 0.7) . The water
generated at TNP for ATR, for OCIR increase from 0.5 to 0.7, increased for
constant SCIR as shown in figure 5. For DATR, the amount of water formed,
for an OCIR increase from 0.5 to 0.7, increased continuously for CCIR = 1,
but increased initially and later decreased for CCIR = 2 and 3 as shown in
figure 4.5.
Figure 4.5: Water formation for ATR and DATR of isooctane
The maximum water in the product stream of ATR at TNP was found to be
21.8 moles (for SCIR = 3, OCIR = 0.7) and 4.75 moles (for CCIR = 2, OCIR =
0.7) for DATR. The minimum water observed in the product stream of ATR of
isooctane at TNP was 4.86 moles (SCIR = 1, OCIR = 0.5) while the minimum

CHAPTER 4: Application of DATR in gasoline fuel processors
88
of 2.45 moles (for CCIR = 1, OCIR = 0.5) of water was formed for DATR. The
minimum water formation at TNP of isooctane was 77.70% less than the
maximum for ATR and 48.42% less than the maximum for DATR. Since water
is a feed component of ATR, higher OCIR and higher SCIR increased the
water in the product stream of ATR, while lower OCIR and lower CCIR
decreased the water formation in DATR.
4.3.6 Carbon formation
Carbon formation or coking is undesired in fuel processors as it deactivates
the catalyst and increases pressure drop of reactors. Figure 4.6 shows the
carbon deposition in ATR and DATR of isooctane at thermo neutral point
temperatures for OCIR of 0.5, 0.6 and 0.7 at SCIR and CCIR of 1, 2 and 3.
The moles of carbon formed were higher in DATR process as compared to
ATR of isooctane at TNP. No carbon formation was seen in ATR of isooctane
at TNP while a small amount of carbon formation was observed in the product
stream of DATR of isooctane at some thermo neutral points. The moles of
carbon produced at TNP for ATR remained zero for SCIR increase from 1 to 3
(for OCIR = 0.5, 0.6 and 0.7), while for DATR, the moles of carbon produced
at TNP, for CCIR increase from 1 to 3, increased from 1.03 to 3.16 (for OCIR
= 0.5), 0 to 1.11 (for OCIR = 0.6) and remained zero (for OCIR = 0.7). The
moles of carbon produced at TNP, for ATR, for OCIR increase from 0.5 to 0.7,
remained zero (for SCIR= 1, 2 and 3) while for DATR, for OCIR increase from
0.5 to 0.7, the moles of carbon produced at TNP, decreased to 0 for constant
CCIR as shown in fig 4.6. The maximum carbon yield for DATR of isooctane
at TNP was 3.16 moles (for CCIR = 3, OCIR = 0.5), while the minimum
carbon yield for DATR at TNP was zero (for CCIR = 3, OCIR = 0.7; CCIR=1,
OCIR=0.6 and 0.7; and CCIR=2, OCIR=0.7). The carbon yield for ATR of
isooctane at TNP was found to be zero (for all SCIR and OCIR values).

CHAPTER 4: Application of DATR in gasoline fuel processors
89
Higher OCIR and lower CCIR conditions decreased the carbon formation in
DATR.
Figure 4.6: Carbon formation for ATR and DATR of isooctane
4.3.7 Process energy calculations
Thermo neutral operation of ATR and DATR of isooctane requires no external
energy. But energy is required for heating the feed to the reaction
temperature. Since the SOFC operates at high temperatures, the hot gases
from the fuel processor can be directly fed to the SOFC. Energy calculations
were done to compare the energy requirements of the gasoline fuel processor
using ATR and DATR processes. The common feed components like iso-
octane (1 mol) and air or oxygen (for OCIR cases) for ATR and DATR were
the same; hence they were not considered in the comparison. The energy
required for heating the feed components like CO2 (for DATR) and H2O (for

CHAPTER 4: Application of DATR in gasoline fuel processors
90
ATR) to thermoneutral temperatures were calculated, for producing 1 mole
syngas. The following cases were considered:
a) Heating feed CO2 in DATR (for CCIR 1, 2 and 3) to thermoneutral
temperature.
b) Heating feed H2O in ATR (for SCIR 1, 2 and 3) to thermoneutral
temperature.
c) Case a) plus Heat required for extra steam to make S/CO=1.1 of
DATR product gas.
Some publications have reported that the CO in feed of SOFC undergoes
internal WGS to produce hydrogen that actually contributes to energy
generation. ATR product gas has water to make S/CO=1, so there is no need
to add more steam, but the S/CO ratio of DATR product gas is less than 1, so
additional steam is required to makeup the steam requirement. Energy
requirements for producing 1 mole syngas for the three scenarios were
plotted in figure 4.7. It was observed that the total energy increased with
increase in OCIR at constant SCIR (for ATR) and also at constant CCIR (for
DATR). It was also noted that the total process energy increases with
increase in SCIR (for ATR) from 1 to 3, at constant OCIR. A similar trend was
observed for DATR of isooctane for analogous increase in CCIR from 1 to 3 at
constant OCIR.
The total energy required for ATR per mole of total hydrogen produced, for an
increase in SCIR from 1 to 3, increased from 33.15 to 100.38 kJ (for
OCIR=0.5), increased from 38.99 to 105.41 kJ (for OCIR=0.6) and increased
from 47.88 to 126.51 kJ (for OCIR=0.7). The total energy required per mole of
total hydrogen produced for ATR, for an increase in OCIR from 0.5 to 0.7,
increased for constant SCIR as shown in figure 4.7. For DATR, the total
energy required per mol of total hydrogen, for an increase in CCIR from 1 to

CHAPTER 4: Application of DATR in gasoline fuel processors
91
3, increased from 16.48 to 60.56 kJ (for OCIR=0.5), increased from 17.15 to
49.51 kJ (for OCIR=0.6) and increased from 24.92 to 49.64 kJ (for OCIR=0.7).
Also, the total energy required per mole of total hydrogen, for an increase in
OCIR from 0.5 to 0.7, increased for CCIR = 1, decreased and then increased
for CCIR = 2, and decreased for CCIR = 3 as shown in figure in 4.7.
Figure 4.7: Energy comparison per mole syngas
Addition of steam (heated to respective thermoneutral temperature) to the
DATR product stream to increase the product stream S/CO ratio to 1.1 (the
0.1 more than required 1.0 is for design calculations), showed increased
energy requirement than the DATR process. However it was observed that
the total energy required per mol of total hydrogen for DATR at S/CO=1.1 was
still less as compared to that in ATR process for the ATR cases of SCIR 2 and
3 (ATR of isooctane is usually operated at higher S/C ratios) consumed more

CHAPTER 4: Application of DATR in gasoline fuel processors
92
energy than others. For DATR process with additional steam, the total energy
required per mol of total hydrogen, for an increase in CCIR from 1 to 3,
increased from 46.00 to 72.05 kJ (for OCIR=0.5), increased from 50.15 to
73.11 kJ (for OCIR=0.6) and increased from 56.88 to 77.04 kJ (for OCIR=0.7).
Also, the total energy required per mole of total hydrogen, for an increase in
OCIR from 0.5 to 0.7, increased for constant CCIR as shown in figure 4.7. It
was observed that the energy requirements for DATR process were the
lowest in all cases.
4.4 Conclusion
Auto thermal reforming of isooctane and dry autothermal reforming of
isooctane process comparison was done at thermo neutral temperatures to
analyze the total hydrogen production and energy requirements for selecting
the best process. The process comparison was based on parameters like
syngas obtained, carbon formation and total energy required for heating the
process feed (neglecting the common feed components). Although the
isooctane conversion was same for ATR as well as DATR, the amount of
syngas produced varied a lot for different SCIR (for ATR) and CCIR (for
DATR). At SCIR and CCIR 1 (for OCIR = 0.6 and 0.7), at SCIR and CCIR 2
(for OCIR = 0.7) and at SCIR and CCIR 3 (for OCIR = 0.7) the moles of total
hydrogen produced were almost same at thermoneutral points. Carbon
formation in DATR was almost zero at CCIR 1 (OCIR =0.6 & 0.7), CCIR 2 & 3
(OCIR =0.7). Hence these points can be chosen as suitable operating
conditions. A quick comparison for the energy requirements of the processes
showed that the process energy required per mol of total hydrogen was
considerably less for DATR as compared to the ATR process and large
amount of extra heat was needed for ATR of isooctane to produce same
moles of total hydrogen. Hence DATR process can be used at thermoneutral
points for syngas generation as feed to the SOFC to give considerable energy

CHAPTER 4: Application of DATR in gasoline fuel processors
93
savings. Experimentation is required to compare the results obtained in this
study. Further study of using DATR of isooctane to generate syngas at
thermoneutral temperatures and spraying water in the product stream to cool
it to room temperature in stagewise WGS reactors to make the process
suitable for PEMFC can also be explored.
4.5 References
Ahmed S., Ahluwalia R., Lee S.H.D., Lottes S., 2006, A gasoline fuel
processor designed to study quick-start performance, Journal of Power
Sources, 154(1), 214-222.
Ashcroft A.T., Cheetham A.K., Green M.L.H., Vernon P.D.F., 1991, Partial
oxidation of methane to synthesis gas using carbon dioxide, Nature (London,
UK), 352(6332), 225-226.
Bowers B.J., Zhao J.L., Ruffo M., Khan R., Dattatraya D., Dushman N., 2007,
Onboard fuel processor for PEM fuel cell vehicles, International Journal of
Hydrogen Energy, 32(10-11), 1437-1442.
Bobrova L., Zolotarsky I., Sadykov V., Sobyanin V., 2007, Hydrogen rich gas
production from gasoline in a short contact time catalytic reactor, International
Journal of Hydrogen Energy, 32(16), 3698-3704.
Boehme T.R., Onder C.H., Guzzella L., 2008, Dynamic model of an auto-
thermal gasoline fuel processor, International Journal of Hydrogen Energy,
33(21), 6150-6164.
Burnette D.D., Kremer G.G., Bayless D.J., 2008, The use of hydrogen
depleted coal syngas in solid oxide fuel cells, Journal of Power Sources,
182(1), 329-333.

CHAPTER 4: Application of DATR in gasoline fuel processors
94
Cheekatamarla P.K., Finnerty C.M., Cai J., 2008, Internal reforming of
hydrocarbon fuels in tubular solid oxide fuel cells, International Journal of
Hydrogen Energy, 33(7), 1853-1858.
Colpan C.O., Dincer I., Hamdullahpur F., 2007, Thermodynamic modeling of
direct internal reforming solid oxide fuel cells operating with syngas,
International Journal of Hydrogen Energy, 32(7), 787-795.
Horng R., Huang H., Lai M., Wen C., Chiu W., 2008, Characteristics of
hydrogen production by a plasma-catalyst hybrid converter with energy saving
schemes under atmospheric pressure, International Journal of Hydrogen
Energy, 33(14), 3719-3727.
Homel M., Gur T.M., Koh J.H., Virkar A.V., 2010, Carbon monoxide fueled
solid oxide fuel cell, Journal of Power Sources, 195(19), 6367-6372.
HSC Chemistry [software], version 5.1., 2002, Pori: Outokumpu Research
Oy,.
Kaila R.K., Krause A.O.I., 2006, Autothermal reforming of simulated gasoline
and diesel fuels, International Journal of Hydrogen Energy, 31(13), 1934-
1941.
Kaila R.K., Gutiérrez A., Slioor R., Kemell M., Leskela M., Krause A.O.I.,
2008, Zirconia-supported bimetallic RhPt catalysts: characterization and
testing in autothermal reforming of simulated gasoline, Applied Catalysis B,
84(1-2), 223-232.
Kale G.R., Kulkarni B.D., 2010, Thermodynamic analysis of dry autothermal
reforming of glycerol, Fuel Processing Technology, 91, 520-530.
Lawrence J., Boltze M., 2006, Auxiliary power unit based on a solid oxide fuel
cell and fuelled with diesel, Journal of Power Sources, 154(2), 479-488.
CHAPTER 4: Application of DATR in gasoline fuel processors
95
Minutillo M., 2005, On-board fuel processor modeling for hydrogen-enriched
gasoline fuelled engine, International Journal of Hydrogen Energy, 30(13-14),
1483-1490.
Otsuka K., Shigeta Y., Takenaka S., 2002, Production of hydrogen from
gasoline range alkanes with reduced CO2 emission, International Journal of
Hydrogen Energy, 27(1), 11-18.
Pacheco E.H., Mann M.D., Hutton P.N., Singh D., Martin K.E., 2005, A cell
level model for a solid oxide fuel cell operated with syngas from a gasification
process, International Journal of Hydrogen Energy, 30(11), 1221-1233.
Puolakka K.J., Krause A.O.I., 2004, CO2 reforming of n-heptane on a Ni/Al2O3
catalyst, Studies in Surface Science and Catalysis, 153, 329-332.
Puolakka K.J., Juutilainen S., Krause A.O.I., 2006, Combined CO2 reforming
and partial oxidation of n-heptane on noble metal zirconia catalysts, Catalysis
Today, 115(1-4), 217-221.
Perry R.H., Green D.W., 1997, Chemical engineers’ handbook, 7th ed. USA:
McGraw-Hill.
Qi A., Wang S., Ni C., Wu D., 2007, Autothermal reforming of gasoline on Rh-
based monolithic catalysts, International Journal of Hydrogen Energy, 32(8),
981-991.
Rollier J.D., Petitpas G., Gonzalez-Aguilar J., Darmon A., Fulcheri L.,
Metkemeijer R., 2008a, Thermodynamics and kinetics analysis of gasoline
reforming assisted by arc discharge, Energy and Fuels, 22(3), 1888-1893.
Rollier J.D., Gonzalez-Aguilar J., Petitpas G., Darmon A., Fulcheri L.,
Metkemeijer R., (2008b), Experimental study on gasoline reforming assisted
by nonthermal arc discharge, Energy and Fuels, 22(1), 556-560.

CHAPTER 4: Application of DATR in gasoline fuel processors
96
Rabe S., Vogel F., Truong T.B., Shimazu T., Wakasugi T., Aoki H., 2009,
Catalytic reforming of gasoline to hydrogen: kinetic investigation of
deactivation processes, International Journal of Hydrogen Energy, 34(19),
8023-8033.
Semelsberger T.A., Borup R.L., 2005, Fuel effects on start-up energy and
efficiency for automotive PEM fuel cell systems, International Journal of
Hydrogen Energy, 30(4), 425-435.
Smith W.R., 1996, Computer software reviews, HSC Chemistry for Windows,
2.0, Journal of Chemical Information and Computer Sciences, 36(1), 151-152.
Sobacchi M.G., Saveliev A.V., Fridman A.A., Kennedy L.A., Ahmed S.,
Krause T., 2002, Experimental assessment of a combined plasma/catalytic
system for hydrogen production via partial oxidation of hydrocarbon fuels,
International Journal of Hydrogen Energy, 27(6), 635-642.
Thomas C.E., James B.D., Lomax Jr F.D., Kuhn Jr, I.F., 2000, Fuel options
for the fuel cell vehicle: hydrogen, methanol or gasoline, International Journal
of Hydrogen Energy, 25(6), 551-567.
Turpeinen E., Raudaskoski R., Pongracz E., Keiski R.L., 2008,
Thermodynamic analysis of conversion of alternative hydrocarbon-based feed
stocks to hydrogen, International Journal of Hydrogen Energy, 33(22), 6635-
6643.
Ye X.F., Wang S.R., Zhou J., Zeng F.R., Nie H.W., Wen T.L., 2010,
Assessment of the performance of Ni-yttria-stabilized zirconia anodes in
anode-supported solid oxide fuel cells operating on H2/CO syngas fuels,
Journal of Power Sources, 195(21), 7264-7267.

Chapter 5
Dry autothermal gasification of lignite coal

CHAPTER 5: Dry autothermal gasification of lignite coal
98
Abstract
Dry autothermal gasification is an important process for research in coal
gasification to reduce the steam generation energy in the gasification system.
A comparison study of dry autothermal gasification with steam gasification &
mixture of CO2 and steam gasification system is done in this chapter. A
thermodynamic study involving the effect of temperature, pressure and feed
CO2 & steam ratios in gasification of lignite coal was studied. The product
generation trends of syngas and methane with carbon (in coal) conversion
was studied in detail. The carbon (in lignite coal) was converted completely at
a lower temperature than pure carbon in the combined gasification. Some
applications of the gasifier product gas were also studied. Dry autothermal
gasification with steam (combined gasification) offers great advantages to
produce syngas of exact ratio in one step for use in petrochemical
manufacture and fuel cell systems. The complete carbon (in coal) conversion
occurred beyond the thermoneutral gasification temperature in the study. The
combined gasification process was a useful way for CO2 utilization reducing
the net CO2 emission to the atmosphere.

CHAPTER 5: Dry autothermal gasification of lignite coal
99
5.1 Coal as fuel
Coal is a natural resource available in many countries worldwide. It is a
carbon source used mainly for energy generation. Some other coal based
value added products include syngas (H2 + CO). Syngas can be utilized in
many ways - for electric power generation in gas engine or gas turbine, for
Fischer–Tropsch (FT) synthesis of liquid fuels, for production of gaseous
products such as synthetic natural gas and also as fuel in fuel cells. Coal
(steam) gasification is a popular technology to produce syngas from coal.
Some researchers are also working on underground coal gasification (UCG)
which is a potential clean coal technology to convert coal gas in situ into
syngas using dry air (Prabhu et al., 2012).
Traditionally coal gasification is done using steam and air in coal gasifiers.
Neogi et al. (1986) have experimentally studied coal gasification in a fluidized
bed reactor using steam as the fluidizing medium and simulated the dynamic
behavior and steady state performance of the gasifier to a mathematical
model. Bayarsaikhan et al. (2006) have experimentally studied the steam
gasification of a Victorian brown coal in an atmospheric bubbling fluidized-bed
reactor with continuous feeding of the coal. Sekine et al. (2006) have studied
the reactivity and structural change of coal char during steam gasification.
Peng et al. (1995) have studied the reactivities of in-situ and ex-situ coal
chars of bituminous coal, subbituminous coal and lignite in steam gasification

CHAPTER 5: Dry autothermal gasification of lignite coal
100
and found that the reactivities of the resulting insitu chars were up to six times
higher than that of the corresponding exsitu chars. Foong et al. (1980) have
studied the coal gasification in a spouted bed reactor to produce syngas using
mixtures of steam and air and compared the results to commercial moving
and fluidized bed systems. Chatterjee et al. (1995) have studied the
gasification of high ash India coal in a laboratory scale, atmospheric fluidized
bed gasifier using steam and air as fluidizing media and compared the
predicted and experimental data to show similar trends.
Coal gasification can also be done using CO2. Muhammad et al. (2011) have
reported a detailed review of coal gasification in CO2 atmosphere and its
kinetics since 1948. Hecth et al. (2011) have studied the effect of CO2
gasification reaction on oxy-combustion of pulverized coal char and reported
new calculations that give new insight into the complexity of the effects from
the CO2 gasification reaction. Wei-Biao and Qing-Hua (2011) have found a
general relationship between the kinetic parameters for the gasification of coal
chars with CO2 and coal type. Marcourt et al. (1983) have experimentally
studied the coal gasification at pressure by mixtures of carbon dioxide and
oxygen and reported that experimental results could be satisfactorily
explained by means of a model based on thermodynamic equilibria. Coal is
also gasified with biomass (Kumabe et al., 2007) and wood (Aigner et al.,
2011).

CHAPTER 5: Dry autothermal gasification of lignite coal
101
Oxygen is already present in the coal matrix. Use of air in coal gasification
results in nitrogen dilution of the gasifier product gas which reduces the value
of the syngas produced. Hence gasification without external air/oxygen input
is beneficial to applications that use syngas. Thermodynamic studies are also
popular in coal gasification area. Eftekhari et al. (2012) have used a chemical
equilibrium model to analyze the effect of process parameters on product
composition and use it for an exergy analysis of underground coal
gasification. Dufaux et al. (1990) have investigated the gasifier involving
underground coal gasification using mathematical models based on the
simultaneous resolution of the different thermodynamic equilibria of the
gasification reactions. Yi and Wojciech (2012) have done thermodynamic
analyses for solar thermal steam and dry gasification of anthracite,
bituminous, lignite and peat coals. Giuffrida et al. (2011) have analyzed the
thermodynamic performance of IGCC power plants based on an air-blown
gasifier. Prins et al. (2007) have studied the effect of fuel composition on the
thermodynamic efficiency of gasifiers and gasification systems using a
chemical equilibrium model to describe the gasifier. Wang et al. (2006) have
conducted a thermodynamic equilibrium analysis of hydrogen production by
coal based on Coal/CaO/H2O gasification system.
Most of the gasification thermodynamic studies have reported the use of
Gibbs free energy minimization algorithm (Liu et al., 2006; Letellier et al.,
2010; Haryanto et al., 2009) or Gibbs free energy routine of aspen plus for

CHAPTER 5: Dry autothermal gasification of lignite coal
102
biomass gasification (Cohce et al., 2010). HSC Chemistry software has also
been used by some researchers in thermodynamic studies related to coal
gasification (Diaz-Somoano et al., 2003), biomass gasification (Konttinen et
al., 2012; Detournay et al., 2011). Shabbar and Janajreh (2012) have
performed the thermodynamics analysis of gasification process using the
Gibbs energy minimization approach through Lagrange multiplier method to
study the three different methods of gasification using air, air-steam and solar-
steam to convert bituminous (RTC) coal into syngas.
Use of excess steam and excess CO2 in gasification processes is common to
enhance the chemical reactivity in gasification (Bell et al., 2011). Steam
generation is a very energy consuming task as water has high latent heat of
vaporization. CO2 does not require phase change but the CO2 molecule is
very inert and its chemical reactivity in gasification is low. Combined
gasification offers an advantageous middle path to reduce the disadvantages
of pure steam or CO2 gasification. The syngas produced by steam gasification
has very high hydrogen content while that produced by CO2 gasification has
significant amount of CO. The high hydrogen containing syngas cannot be
generally used in FT synthesis. The syngas required for syngas based
applications e.g. FT synthesis requires adjustment of syngas ratio (preferably
between 1-3). This adjustment is usually done by coupling water gas shift
(WGS) reactor (sometimes reactors in stages) to the gasifier. The following
reaction occurs in the WGS reactor:
CHAPTER 5: Dry autothermal gasification of lignite coal
103
CO + H2O = CO2 + H2 -----------------(A.1)
These water gas shift reactors operate at low temperatures than the gasifier
e.g. High temperature shift reactor operates around 400-500ºC. These are
catalytic reactors requiring selective WGS catalyst for operation. The WGS
reaction using commercial Fe based catalyst requires high steam input to
make the ratio of feed H2O/CO = 4.5). This additional steam requirement is a
huge energy consuming process. F. Kiso and M Matsuo (2011) have studied
the factors to improve the thermal efficiency of fuel production and electricity
generation by dry coal feed gasification and have suggested that the primary
cause of thermal efficiency loss is the use of steam in the water-gas shift
reactor. Moreover the sulphur compounds in coal can poison the WGS
catalyst. The WGS reaction is also very slow and requires huge reactors.
Combined gasification of coal using steam and CO2 in appropriate ratio can
produce syngas of the desired syngas ratio in one step. Although several
such studies on coal gasification have been published in literature, coal
gasification using both steam and CO2 simultaneously has not yet been
studied extensively although such study for biomass is recently reported
(Renganathan et al., 2012). This study aims to study the feasibility aspects of
coal gasification using steam and CO2 simultaneously and understand the
trends in product generation and their utility to some specific applications.
CHAPTER 5: Dry autothermal gasification of lignite coal
104
Different coal types have been used in various research studies. Lignite coal
gasification studies have also been reported in literature (Adanez et al., 1985;
Ashman et al., 2005; Smolinski et al., 2011; Bhattacharya, 2006). Tremel et
al. (2012) have studied the pyrolysis and gasification behavior at operation
conditions relevant to industrial scale entrained flow gasifiers and have
reported high level of conversion of Rhenish lignite coal at atmospheric
pressure. Karimipour et al. (2012) have experimentally studied the effect of
coal feed rate, coal particle size, and steam/O2 ratio, and their interactions on
the quality of syngas produced from fluidized bed gasification of lignite coal.
Lignite coal is reported for its high activity in gasification (Liu et al., 2009;
Burger, 2010; Crnomarkovic et al., 2007) and hence was selected for this
study.
Coal gasification is affected by the inorganic matter content of the coal char
(Kopsel et al., 1990; Squires et al., 1986; Fernandez-Morales et al., 1985; Yu
et al., 2006). Coal gasification is also slightly affected the particle size of coal
(Hanson et al., 2002; Ye et al., 1998). Thus, barring the extreme mass
transfer and kinetic limitations, thermodynamic study of gasification can be of
universal use to predict the conversions and product distributions.
Coal gasification involves many chemical reactions. The gasification reactions
mentioned in earlier literature are given below:

CHAPTER 5: Dry autothermal gasification of lignite coal
105
C + CO2 = 2CO --------------------------------(A.2)
C + H2O = H2 + CO --------------------------------(A.3)
C + 2H2 = CH4 --------------------------------(A.4)
2C + 2H2O = CH4 + CO2 --------------------------------(A.5)
C + 2H2O = 2H2 + CO2 --------------------------------(A.6)
CH4 + H2O = CO + 3H2 --------------------------------(A.7)
2CO = CO2 + C --------------------------------(A.8)
CO + H2O = H2 + CO2 --------------------------------(A.1)
The coal gasification products reported in literature are H2, CO, CO2, CH4,
C2H6, C3H6, C3H8, H2O, and C. The coal gasification reactions and their
products have been discussed in literature earlier (Brar et al., 2012; Belghit et
al., 2009; Molina et al., 1998; Everson et al., 2006; Carrazza et al., 1985; Li et
al., 2012).
5.2 Methodology
It is assumed that the exit products of the coal gasifier are in thermodynamic
equilibrium. HSC Chemistry software has been used in gasification studies.
Although coal composition varies a lot, its main constituents are carbon (C),
hydrogen and oxygen with negligible amount of sulfur and nitrogen. The dry
ash free base compositions of lignite coal taken were 73.73 % C, 4.04 % H,
20.21 % O, 1.01 % S, and 1.01 % N by weight which were nearly same as

CHAPTER 5: Dry autothermal gasification of lignite coal
106
(Dennis et. al., 2010 & Nandi et. al., 2006). For 1 mole of carbon, 0.3288
moles of hydrogen, 0.1027 moles of oxygen, 0.0059 moles nitrogen and
0.00514 moles sulfur (present in lignite coal) have been used as basis for all
calculations in the temperature range of 500 – 1200 ºC for the entire process
study.
Coal gasification involves species such as C(s), CO2 (g), H2 (g), CO (g), H2O
(g), CH4 (g), H2S (g), SO2 (g), N2 (g) and H2O (l) which are usually found in the
gasification are considered in this study. Generally it is assumed that no
hydrocarbons other than methane are present in any appreciable quantity in
the outlet of gasifier at high gasifier temperature as seen earlier (Liu et al.,
2009). Hence no other hydrocarbon gases such as C2H6, C2H4 and C2H2 &
also no other by-products were considered in the calculations similar to the
report by some researchers (Fushimi et. al., 2003). The input species to the
gasifier were carbon (solid), oxygen, hydrogen, sulfur, nitrogen, water and
CO2 (in gaseous phase) reacting to give the products. The material balances
are done by Equilibrium Composition module of HSC Chemistry and these
results were used to calculate reaction enthalpy by Reaction Equation module
of HSC Chemistry software. The results may be slightly different using
different software due to the difference of thermodynamic databases. Steam
and CO2 are used as gasifying agents in this study. The gasifying agent to
carbon ratio (GaCR) ranging from 1 to 3 was selected as boundary for this
study. Combined gasification of coal using CO2 and H2O is considered in this

CHAPTER 5: Dry autothermal gasification of lignite coal
107
study and hence the intermediate steps for increase in CO2 with simultaneous
decrease in steam for each ratio was also considered in the calculations.
These feed conditions for CO2 and steam input per mole coal input are shown
in table 5.1. The equilibrium compositions of the coal gasifier were used to
calculate the reaction enthalpy required in the process. The effect of variation
of these feed compositions and temperature on the products and gasifier
enthalpy are discussed in detail in the next section.
Table 5.1: Gasification conditions
CHAPTER 5: Dry autothermal gasification of lignite coal
108
5.3 Results and discussion
5.3.1 Effect of pressure
Pressure is an important process parameter. The effect of pressure on
combined gasification of coal was studied for 1, 10 and 20 bar. Initially the
effect of pressure on carbon conversion and syngas yield in the gasifier was
studied at 600°C only. Figure 5.1 shows the carbon (in lignite coal) conversion
for the 15 feed input conditions (A1 to C5) at 600°C. It was observed that the
carbon conversion decreased with increase in pressure for all cases. It was
also observed that at constant pressure, the carbon conversion decreased
with increase in feed CO2 moles (and simultaneous decrease in feed H2O
moles) at constant GaCR for all pressures. It was also seen that the carbon
conversion increased as the feed steam to carbon ratio increased from 1 to 3
for all pressures in combined gasification with steam & CO2 for cases (A2, B2
and C2). Similar observation was also noted for cases (A3, B3 and C3) and
cases (A4, B4 and C4). Figure 5.2 shows the syngas yield at 600°C for the
different feed conditions. It was observed that the syngas yield decreased with
increase in pressure for all cases. It was also observed that at constant
pressure, the syngas yield decreased with increase in feed CO2 moles (and
simultaneous decrease in feed H2O moles) at constant GaCR for all
pressures. It was also seen that the syngas yield increased as the respective
feed GaCR increased from 1 to 3 for all pressures in combined gasification
with steam & CO2 for cases (A2, B2 and C2), cases (A3, B3 and C3) and
cases (A4, B4 and C4). It is reported that increase in gasification pressure
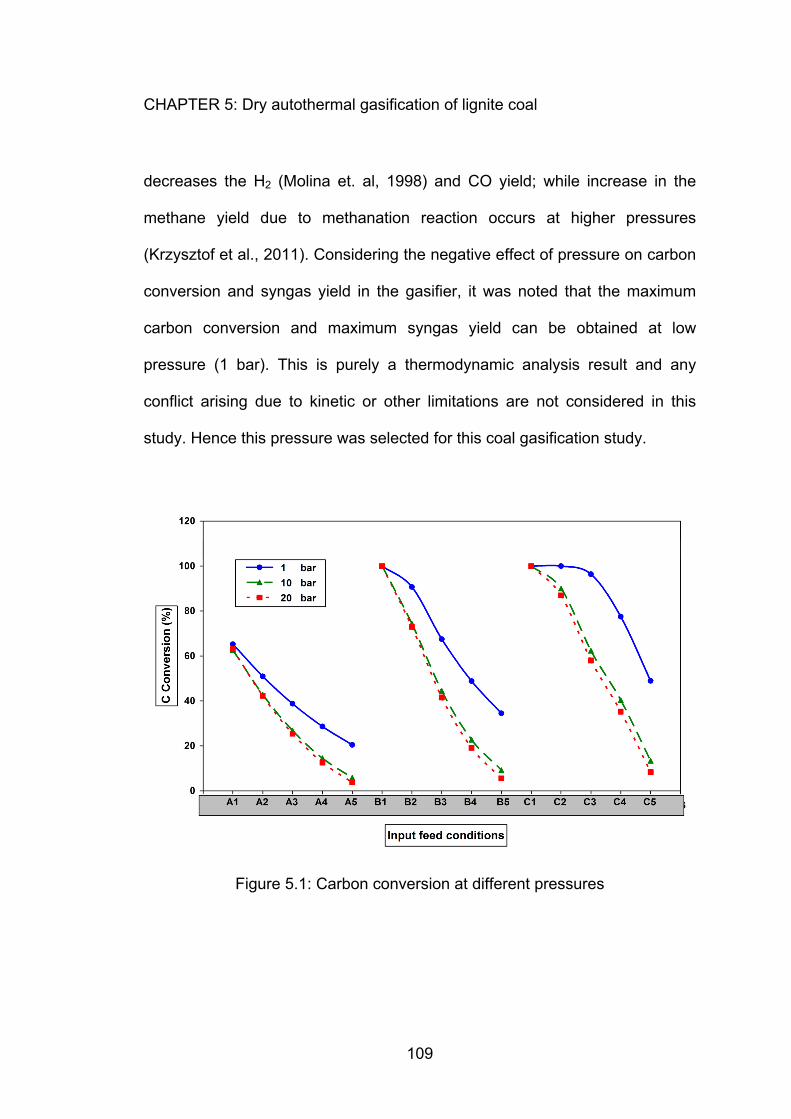
CHAPTER 5: Dry autothermal gasification of lignite coal
109
decreases the H2 (Molina et. al, 1998) and CO yield; while increase in the
methane yield due to methanation reaction occurs at higher pressures
(Krzysztof et al., 2011). Considering the negative effect of pressure on carbon
conversion and syngas yield in the gasifier, it was noted that the maximum
carbon conversion and maximum syngas yield can be obtained at low
pressure (1 bar). This is purely a thermodynamic analysis result and any
conflict arising due to kinetic or other limitations are not considered in this
study. Hence this pressure was selected for this coal gasification study.
Figure 5.1: Carbon conversion at different pressures

CHAPTER 5: Dry autothermal gasification of lignite coal
110
5.3.2 Syngas yield
Syngas potential of a process is calculated by the sum of moles of hydrogen
and carbon monoxide obtainable in the process. Syngas is the most desired
product of the coal gasifier. As seen in figure 5.3, the syngas moles generally
Figure 5.2: Syngas yield at 600°C for the different feed conditions
increased for all cases of A, B and C then became nearly constant at higher
temperature ~800°C in combined gasification with steam & CO2 with increase
in temperature from 500 to 1200°C and at constant GaCR, e.g. the syngas
yield increased from 0.218 to 2.118 moles for case A4, the syngas moles

CHAPTER 5: Dry autothermal gasification of lignite coal
111
increased from 0.597 to 2.118 moles for case B2 and increased from 0.522 to
2.118 moles for case C4. The syngas moles generally decreased with
increase in feed CO2 moles (with simultaneous decrease in feed H2O moles)
at constant GaCR and constant temperature then became nearly constant at
higher temperature. For e.g. it decreased from 0.539 to 0.366 moles for case
A (i.e. A2 to A4); from 0.928 to 0.588 moles for case B (i.e. B2 to B4) and
from 1.230 to 0.892 moles for case C (i.e. C2 to C4) at 550°C.
Figure 5.3: Syngas yield in combined coal gasification
It was also observed that the syngas moles in the combined gasification
cases (A2, B2 and C2) increased with increase in steam to carbon ratio at
constant temperature then became almost constant at higher temperature
(above 850°C), i.e. it increased from 0.539 to 1.230 moles at 550°C. Similar

CHAPTER 5: Dry autothermal gasification of lignite coal
112
observation was noted for combined gasification cases (A4, B4 and C4), i.e.
the syngas yield increased from 0.9307 to 2.0288 moles at 650°C. The
syngas yield also increased for equimolar input moles of H2O and CO2 with
increase in GaCR from 1 to 3 (cases A3, B3 and C3) at constant temperature
i.e. it increased from 0.451 to 1.058 moles at 550°C. The maximum of for all
combined 2.118 moles of syngas were obtained in gasification with steam &
CO2 conditions (above ~1000°C for all cases A, B and C), while minimum
moles of syngas obtained were 0.157 moles at 500°C for case A5 in
combined gasification of lignite coal.
5.3.3 Methane Formation
Methane is an imminent product of combined gasification of coal. Methane
formation is undesirable due to the loss of hydrogen and carbon moles. As
seen from figure 5.4, methane formation generally decreased with increase in
temperature from 500-1200°C at constant GaCR for all cases A, B and C in
combined gasification. Almost zero moles of methane were obtained for all
GaCR conditions in combined gasification of lignite coal at higher
temperatures. e.g. methane formation decreased from 0.143 to 0.00 moles for
case C3 with increase in gasification temperature. The methane yield
generally decreased with increase in feed CO2 moles (with simultaneous
decrease in feed H2O moles) at constant GaCR condition and constant
temperature. For e.g. CH4 yield decreased from 0.133 to 0.036 moles for case

CHAPTER 5: Dry autothermal gasification of lignite coal
113
A (i.e. A2 to A4); from 0.213 to 0.041 moles for case B (i.e. B2 to B4) and
decreased from 0.237 to 0.074 for case C (i.e. C2 to C4) at 500°C. In
combined gasification cases, with increase in GaCR from 1 to 3, the methane
yield increased upto certain temperature i.e. 700°C but it decreased at higher
temperatures, e.g. at 500°C, the methane yield increased from 0.133 (A2) to
0.237 (C2) moles, but it decreased from 0.042 to 0.007 moles (A2, B2 and
C2) at 700°C. Similar trend was obtained case (A4, B4 and C4), for example
the methane yield increased from 0.036 to 0.074 moles at 500°C but at
700°C, it decreased from 0.012 to 0.004 moles with increase in GaCR from 1
to 3. The methane yield for equimolar input moles of H2O and CO2 (cases A3,
B3 and C3) at constant temperature increased at lower temperatures up to
600°C but it decreased at high temperatures, i.e. at 500°C, the methane yield
increased from 0.076 to 0.143 moles (from A3 to C3) while at 700°C, it
decreased from 0.025 to 0.006 moles. The maximum methane yield was
found to be 0.345 moles for case B1 at 500°C, while the minimum methane
yield was observed to be 0.00 at all cases above ~950°C. Generally methane
formation increases at higher pressures (Krzysztof et. al., 2011) and hence
methane formation was found insignificant in this study at 1 bar pressure.

CHAPTER 5: Dry autothermal gasification of lignite coal
114
Figure 5.4: CH4 formation in combined coal gasification
5.3.4 Carbon (in coal) conversion (%)
Coal conversion is directly linked to the carbon conversion in the combined
gasification process. Table 5.2 shows the carbon conversion in gasifier within
the temperature range 500-1200°C for all GaCR cases (A, B and C) at 1 bar
pressure. It was observed that the carbon (in coal) conversion increased with
increase in process temperature. For example, the carbon conversion
increased by ~40% for pure steam case A1 with increase in temperature from
550ºC to 1000ºC similar to earlier reported data (Liu et al., 2004). As seen
CHAPTER 5: Dry autothermal gasification of lignite coal
115
from table 5.2, the carbon conversion generally increased to its maximum with
increase in temperature from 500-1200°C at constant GaCR for all cases of A,
B and C in combined gasification e.g. it increased from 12 to 100 % for case
A4. It was also observed that the carbon conversion generally decreased with
increase in feed CO2 moles (with simultaneous decrease in feed H2O moles)
for constant GaCR case and constant temperature, for e.g. it decreased from
43 % to 18 % (A2 to A4); from 75% to 30 % (B2 to B4) and from 95% to 51 %
(C2 to C4) at 550°C. From the table, it was also seen that the 100% carbon
conversion temperature decreased with increase in GaCR from 1 to 3. The
carbon conversion for the combined gasification cases (A2, B2 and C2)
increased with increase in feed steam to carbon ratio at constant temperature
before reaching its maximum (100%), e.g. it increased from 43% (A2) to 95%
(C2) at 550°C, while the carbon conversion in combined gasification cases
(A4, B4 and C4) increased with increase in feed CO2 to carbon ratio at
constant temperature, for example, it increased from 18% (A4) to 51 % (C4)
at 550°C. The carbon conversion also increased for equimolar input moles of
H2O and CO2 with increase in GaCR from 1 to 3 (cases A3, B3 and C3) at
constant temperature, i.e. it increased from 29 to 71% (from A3 to C3) at
550°C.
This observation was compared to the carbon conversion in combined
gasification using pure carbon (Kale et al., 2013). Table 5.3 shows the carbon
conversion (%) within the temperature range 500-1200°C for all input feed

CHAPTER 5: Dry autothermal gasification of lignite coal
116
conditions of GaCR at 1 bar pressure for pure carbon. As seen from table 5.2
and 5.3, the 100% carbon conversion were observed at lower temperatures in
almost all cases of lignite coal than pure carbon as feed to the gasifier. This
comparison on the basis of thermodynamic analysis shows the higher
reactivity of lignite coal than pure carbon in gasification which may be due to
the presence of hydrogen and oxygen in the coal structure.
Table 5.2: 100% carbon conversion temperatures for Lignite coal
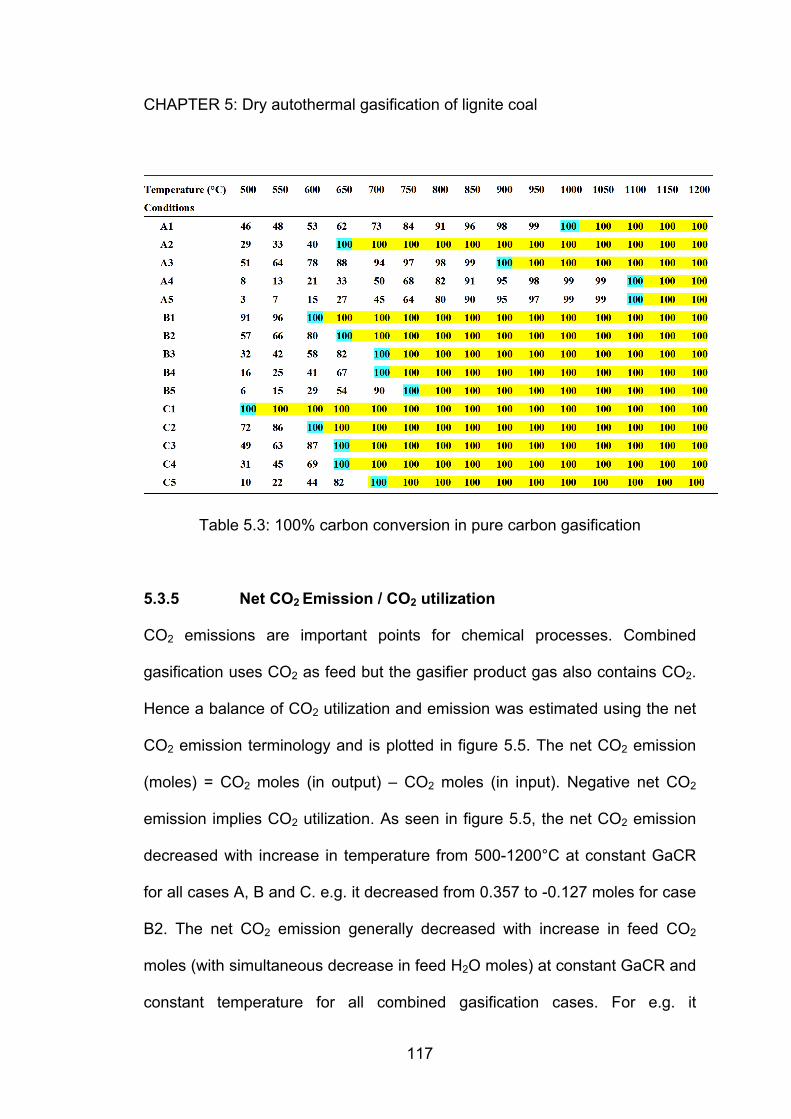
CHAPTER 5: Dry autothermal gasification of lignite coal
117
Table 5.3: 100% carbon conversion in pure carbon gasification
5.3.5 Net CO2 Emission / CO2 utilization
CO2 emissions are important points for chemical processes. Combined
gasification uses CO2 as feed but the gasifier product gas also contains CO2.
Hence a balance of CO2 utilization and emission was estimated using the net
CO2 emission terminology and is plotted in figure 5.5. The net CO2 emission
(moles) = CO2 moles (in output) – CO2 moles (in input). Negative net CO2
emission implies CO2 utilization. As seen in figure 5.5, the net CO2 emission
decreased with increase in temperature from 500-1200°C at constant GaCR
for all cases A, B and C. e.g. it decreased from 0.357 to -0.127 moles for case
B2. The net CO2 emission generally decreased with increase in feed CO2
moles (with simultaneous decrease in feed H2O moles) at constant GaCR and
constant temperature for all combined gasification cases. For e.g. it

CHAPTER 5: Dry autothermal gasification of lignite coal
118
decreased from -0.086 to -0.468 moles for case A (A2 to A4); from 0.094 to -
0.557 moles for case B (B2 to B4) and from 0.087 to -0.412 moles for case C
(C2 to C4) at 750°C. The net CO2 emission for the combined gasification
cases (A2, B2 and C2) increased with increase in feed steam to carbon ratio
at lower temperature upto 700°C after which a mixed trend was observed in
these cases, e.g. the net CO2 emission increased from 0.016 to 0.146 moles
cases (A2 to C2) at 700°C. The net CO2 emission also showed a mixed trend
for combined gasification cases (A4, B4 and C4) and equimolar input moles of
H2O and CO2 i.e. case (A3, B3 and C3) with increase in GaCR from 1 to 3.
The maximum net CO2 emission was found to be 0.686 moles for case 1 at
550°C, while the minimum observed was -1.026 moles for case C5 at 1200°C.
Figure 5.5: Net CO2 emission in combined coal gasification

CHAPTER 5: Dry autothermal gasification of lignite coal
119
5.3.6 Gasification enthalpy and thermoneutral points
Process enthalpy is always a crucial parameter in gasification processes.
Gasification without oxygen input is an endothermic process. However the
lignite coal contains insitu oxygen in its chemical matrix. This oxygen helps to
generate exothermicity in the absence of external oxygen or air. The effect of
gasification temperature on gasification process enthalpy was studied at all
feed conditions. The intersection of gasification enthalpy curves with
temperature axis shows the thermoneutral temperatures (TNP).
Thermoneutral operation requires no external energy for cooling or heating,
which makes it valuable from energy consumption point of view. TNPs were
observed for all GaCR cases (1-3) except case C1. Figure 5.6 shows the
variation of gasification enthalpy for coal gasification at constant GaCR with
the thermoneutral line (zero enthalpy line). As seen from the figure 5.6, the
reaction endothermicity first increased and then became almost constant with
increase in temperature from 500-1200°C at constant GaCR for all cases A, B
and C. e.g. it increased from -35.885 to 88.932 kJ for case A2. It was also
observed that the gasification enthalpy generally decreased upto certain
temperature but increased at higher temperature with increase in CO2 moles
(with simultaneous decrease in feed H2O moles) at constant GaCR case and
constant temperature. For e.g. the enthalpy decreased from -35.885 to -
42.952 kJ at 500°C, while it increased from 89.114 to 104.322 kJ at 900 °C for
case A (A2 to A4). The gasification enthalpy for equimolar input moles of H2O
and CO2 showed a mixed trend with increase in GaCR from 1 to 3 (cases A3,
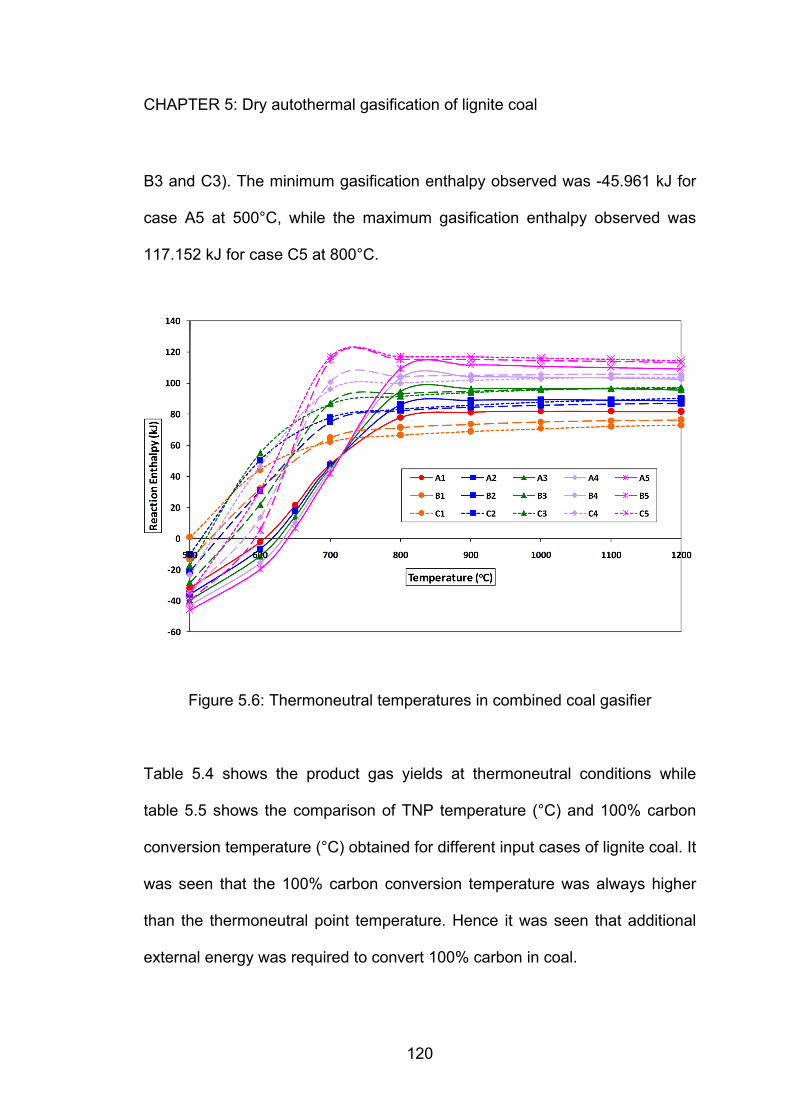
CHAPTER 5: Dry autothermal gasification of lignite coal
120
B3 and C3). The minimum gasification enthalpy observed was -45.961 kJ for
case A5 at 500°C, while the maximum gasification enthalpy observed was
117.152 kJ for case C5 at 800°C.
Figure 5.6: Thermoneutral temperatures in combined coal gasifier
Table 5.4 shows the product gas yields at thermoneutral conditions while
table 5.5 shows the comparison of TNP temperature (°C) and 100% carbon
conversion temperature (°C) obtained for different input cases of lignite coal. It
was seen that the 100% carbon conversion temperature was always higher
than the thermoneutral point temperature. Hence it was seen that additional
external energy was required to convert 100% carbon in coal.
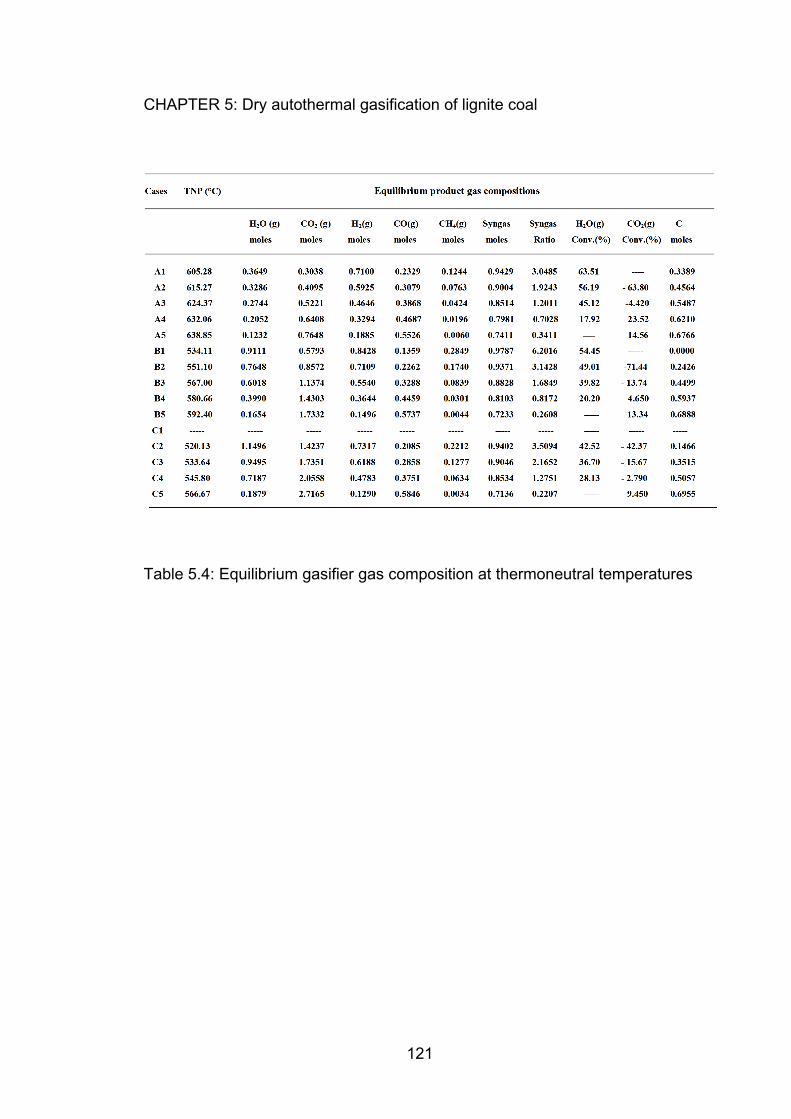
CHAPTER 5: Dry autothermal gasification of lignite coal
121
Table 5.4: Equilibrium gasifier gas composition at thermoneutral temperatures
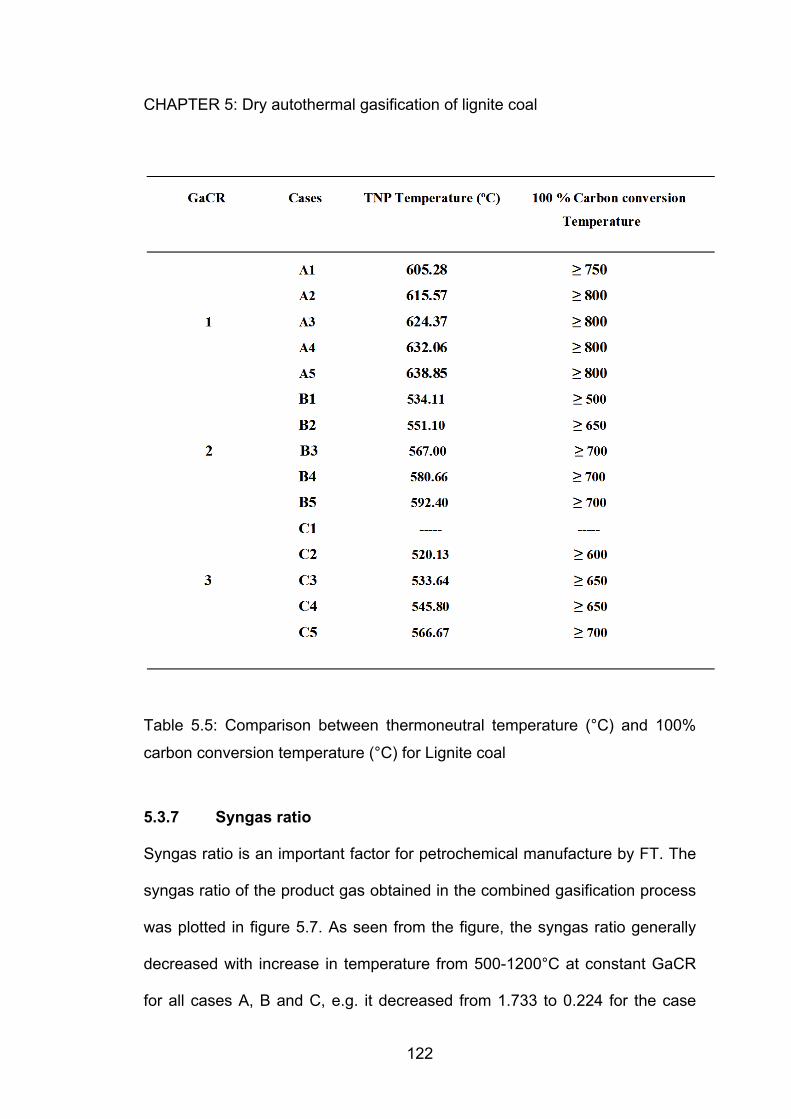
CHAPTER 5: Dry autothermal gasification of lignite coal
122
Table 5.5: Comparison between thermoneutral temperature (°C) and 100%
carbon conversion temperature (°C) for Lignite coal
5.3.7 Syngas ratio
Syngas ratio is an important factor for petrochemical manufacture by FT. The
syngas ratio of the product gas obtained in the combined gasification process
was plotted in figure 5.7. As seen from the figure, the syngas ratio generally
decreased with increase in temperature from 500-1200°C at constant GaCR
for all cases A, B and C, e.g. it decreased from 1.733 to 0.224 for the case

CHAPTER 5: Dry autothermal gasification of lignite coal
123
B4. It was also observed that the syngas ratio generally decreased with
increase in feed CO2 moles (with simultaneous decrease in feed H2O moles)
at constant GaCR and constant temperature for all cases. For e.g. At 600°C,
the syngas ratio decreased from 2.192 to 0.907 for case A (A2 to A4); from
2.014 to 0.694 for case B (B2 to B4) and from 1.957 to 0.791 for case C (C2
to C4). It was seen that the syngas ratio obtained in combined coal
gasification process had a lower value in the range (1-5) which is useful for
petrochemical manufacture by FT synthesis. Thus combined gasification can
generate syngas of lower ratio in one step without the need of external water
gas shift reactors.
5.3.8 Applications
a. Syngas for petrochemical manufacture
The syngas ratio in the range of 1–3 (desirable for use in petrochemical
manufacture) is easily obtained in this process in one step. Fischer–Tropsch
processes to synthesize hydrocarbon fuels usually require syngas with a
H2/CO ratio close to 2 (Caldwell, 1980; Dry, 2002). This coal gasification
product gas can be processed through gas-solid separators to remove any
coke/solids and can be compressed to a suitable pressure for use in
petrochemical manufacture by FT synthesis (Dry, 1989 ;Van Dyk et al., 2006;
Demirdas et al., 2007).

CHAPTER 5: Dry autothermal gasification of lignite coal
124
Figure 5.7: Syngas ratio of product gas
Table 5.6 shows the temperature range in which syngas ratio 1-3 is obtained
in the combined gasification process at different feed conditions. It was seen
that the syngas ratio 1 was obtained at relatively higher temperatures than
syngas ratio 2 and syngas ratio 3 for the same feed condition. The desirable
syngas ratio (1-3) was definitely obtained in the A2, A3, B2, B3 and C2, C3
feed conditions. It was also observed that the temperatures for obtaining a
particular syngas ratio decreased as the input feed CO2 increased in the
combined gasification. The combined gasification considered in this study
does not use oxygen (air) in the input. Hence the syngas generated is free of
nitrogen dilution. Table 5.7 shows the syngas concentration in the product gas
CHAPTER 5: Dry autothermal gasification of lignite coal
125
at different syngas ratios (1-3). It was seen that some gasification conditions
yield a very high syngas concentration for the desirable syngas ratio (e.g.
80.60% for syngas ratio 1 at A2). Some of the conditions [case, syngas conc.,
syngas ratio] for obtaining high syngas concentration in the gasifier product
gas for desirable syngas ratio were as follows: [A2, 80.60 %, 1], [A1, 72.05%,
2], [B1, 63.52%, 2], [B1, 60.17%, 3] and [B2, 63.52%, 1]. Most of the high
syngas concentration was obtained for GaCR 1 and 2. It was also seen that
for a particular feed condition, the syngas conc. in the product gas decreased
as the desirable syngas ratio of 1 increased to 2 and 3. It was also seen that
the syngas conc. in the product gas decreased as the feed CO2 increased for
the desired syngas ratio at constant GaCR.
b. Production of Synthetic natural gas (SNG)
The syngas ratio above 3 is also obtained in the gasifier. This product gas can
be used for the manufacture of synthetic natural gas as the production of SNG
via thermo-chemical process uses the stoichiometric ratio of the reactants
H2/CO of at least three or more (Kopyscinski et al., 2010).

CHAPTER 5: Dry autothermal gasification of lignite coal
126
Table 5.6: Temperature range (in °C) for syngas ratio 1-3
c. Syngas for Fuel cells - SOFC & PEMFC
The syngas produced in the gasification of lignite coal can be used as fuel in
fuel cells. Solid oxide fuel cells (SOFC) can easily operate with CO
contaminated hydrogen gas. The hot product gas from the combined coal
gasifier can be passed through suitable gas-solid separators and directly fed
to the SOFC type fuel cells. It is assumed by some researchers that the CO

CHAPTER 5: Dry autothermal gasification of lignite coal
127
undergoes insitu water gas shift reaction (reaction A.1) with water present in
the product gas to produce hydrogen, which is used in the SOFC.
CO + H2O = CO2 + H2 ------------------- (A.1)
As seen from reaction (A.1), the product gas containing equimolar or higher
H2O/CO ratio can be easily used as feed to the SOFC. However, Polymer
Electrolyte membrane fuel cells (PEMFC) generally cannot tolerate CO more
than 1% in the product gas. Hence the syngas needs to be processed through
water gas shift reactors to reduce the CO content by converting it to hydrogen
(reaction A.1) and further CO reduction is achieved by preferential oxidation
reactors. But WGS catalysts require H2O/CO ratio > 4.5 to convert the CO to
hydrogen. Table 5.8 shows the temperatures of the combined gasifier to
produce syngas that can be used in SOFC and PEMFC. As seen from the
table, the syngas having H2O/CO ratio above 1.1 (& less than 4.5) can be
used in SOFC, while the syngas having H2O/CO ratio > 4.5 can be used for
both SOFC and PEMFC (after external WGS reaction). From this table, it was
observed that the syngas having H2O/CO greater than 4.5 is obtained at lower
temperatures as compare to syngas of H2O/CO ratio 1.1 ≤ (H2O/CO) ≤ 4.5. It
was also observed that cases B1, C1 and C2 have a very large temperature
range of syngas of H2O/CO ratio between 1.1 and 4.5, while the syngas of
H2O/CO > 4.5 was obtained within the temperature range of ~500-600°C for
all GaCR feed conditions. Table 5.8 also shows the concentration of syngas in
the gasifier product gas having H2O/CO ratio 1.1 ≤ (H2O/CO) ≤ 4.5 & greater

CHAPTER 5: Dry autothermal gasification of lignite coal
128
than 4.5. It was observed the syngas concentration range was wide for
syngas having H2/CO in 1.1 - 4.5 value. It was also observed that the syngas
concentration in the gasifier product gas decreased with increase in feed CO2
for desired H2O/CO ratio in both the cases i.e., 1.1≤ (H2O/CO) ≤ 4.5 &
H2O/CO > 4.5 at constant GaCR.
Table 5.7: Syngas concentration (%) of syngas ratio (1-3) gasifier gas
In dry gasification case 5, the syngas concentration was much less as
compared to the steam gasification case 1 in all GaCR cases. e.g. for case A1
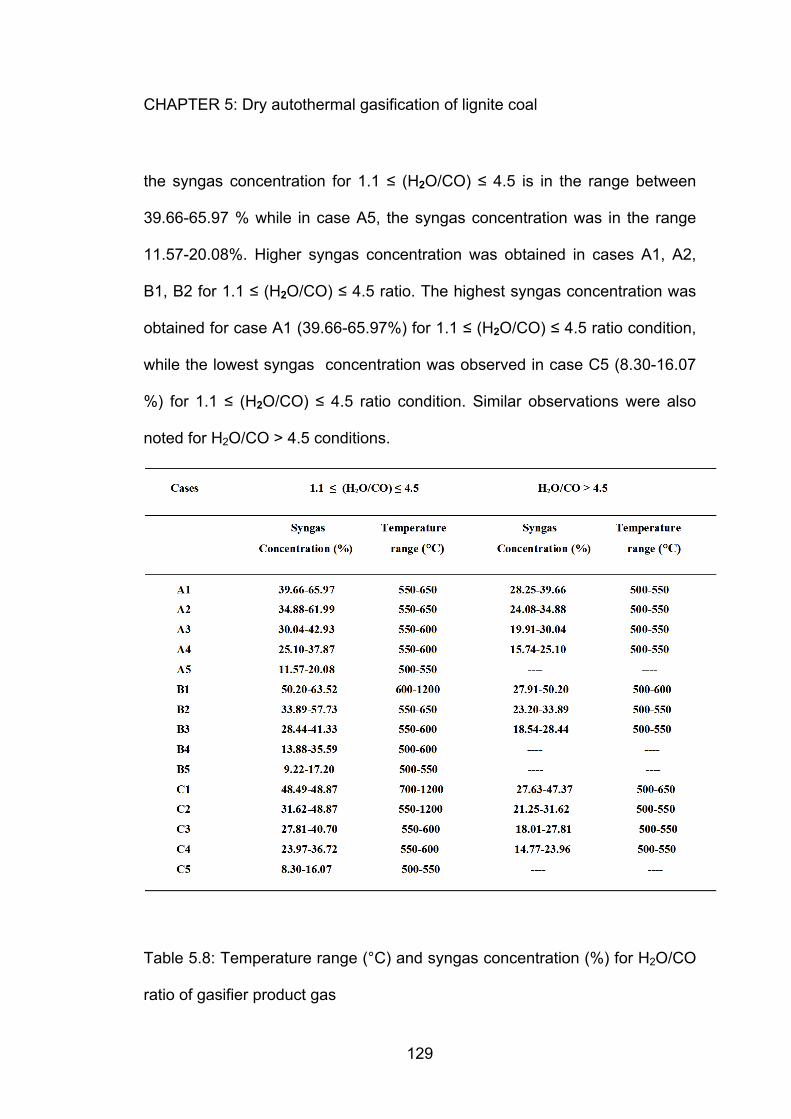
CHAPTER 5: Dry autothermal gasification of lignite coal
129
the syngas concentration for 1.1 ≤ (H2O/CO) ≤ 4.5 is in the range between
39.66-65.97 % while in case A5, the syngas concentration was in the range
11.57-20.08%. Higher syngas concentration was obtained in cases A1, A2,
B1, B2 for 1.1 ≤ (H2O/CO) ≤ 4.5 ratio. The highest syngas concentration was
obtained for case A1 (39.66-65.97%) for 1.1 ≤ (H2O/CO) ≤ 4.5 ratio condition,
while the lowest syngas concentration was observed in case C5 (8.30-16.07
%) for 1.1 ≤ (H2O/CO) ≤ 4.5 ratio condition. Similar observations were also
noted for H2O/CO > 4.5 conditions.
Table 5.8: Temperature range (°C) and syngas concentration (%) for H2O/CO
ratio of gasifier product gas

CHAPTER 5: Dry autothermal gasification of lignite coal
130
d. Power generation
Syngas is used for power generation in turbines. The syngas is combusted in
hot air and these hot product gases expand through the turbine, doing work,
and exit at nearly atmospheric pressure at a temperature of 500-640 °C. The
work extracted during the expansion is used to turn the turbine which drives
the generator that produces electricity (Fan et al., 2008). The hot exit gas from
the turbine still has significant amounts of energy which is used to raise steam
to drive a steam-turbine and another generator. This combination of gas and
steam cycle is termed as ‘combined cycle gas turbine’ (CCGT) plant. The
combined energy for combustion of H2, CO and CH4 of the gasifier product
gas obtained (for 1 mole of carbon in coal basis) is calculated in the figure 5.8.
The combustion energy is huge as seen from the figure at various gasification
conditions. As seen in figure 5.8, the total heat of combustion increased with
increase in temperature from 500-1200°C at constant GaCR for all the cases
A, B and C, e.g. it increased from -133.380 to -600.324 kJ/mole for the case
B4. The total heat of combustion showed a mixed trend with increase in feed
CO2 moles (with simultaneous decrease in feed H2O moles) but at higher
temperature it was almost constant at constant GaCR and constant
temperature for all the cases. For equimolar input moles of H2O and CO2 with
increase in GaCR from 1 to 3 (cases A3, B3 and C3) at constant temperature,
the total heat of combustion increased upto 900°C and then become almost
constant. The minimum total heat of combustion of gasifier product gas was

CHAPTER 5: Dry autothermal gasification of lignite coal
131
observed to be -54.56 kJ/mol (case A5) at 500°C, while the maximum total
heat of combustion was noted to be -604.173 kJ/mol (case C1) at 800°C.
Figure 5.8: Total heat of combustion of gasifier product gas
5.4 Conclusion
A thermodynamic study of dry autothermal gasification of lignite coal
gasification using both CO2 and steam simultaneously was conducted to
understand the effect of temperature, pressure and feed CO2 and steam ratio
on the product composition, carbon (in coal) conversion), syngas ratio of the
product gas and process enthalpy in the gasifier. The combined gasification
process was a useful way for CO2 utilization reducing the net CO2 emission to
the atmosphere. The concentration of syngas in the gasifier product gas was
CHAPTER 5: Dry autothermal gasification of lignite coal
132
very high due to the absence of air use in the process. Combined gasification
can help to reduce the energy consumption of steam generation in the pure
steam gasification process while it can also help to accelerate the slow CO2
gasification reaction by using steam. The applications of the gasifier product
gas were also studied. The syngas ratio of the gasifier product gas had a low
ratio (1-3) which can be used in FT processes for the manufacture of value
added products and also SNG. The syngas was also suitable as feed to the
fuel cells - SOFC and PEMFC and the absence of nitrogen dilution can help to
increase the efficiency of the fuel cells. Although thermoneutral operation of
the combined gasifier is possible, this temperature is low and insufficient for
complete carbon (in coal) conversion but can produce syngas free of nitrogen.
External energy is required to operate the combined gasifier to achieve
maximum carbon (in coal) conversion.
5.5 References
Adanez J., Miranda J., Gavilan J., 1985, Kinetics of a lignite-char gasification
by CO2, Fuel, 64, 801–804.
Aigner I., Pfeifer C., Hofbauer H., 2011, Co-gasification of coal and wood in a
dual fluidized bed gasifier, Fuel, 90, 2404–2412.
Ashman P.J., Mullinger P.J., 2005, Research issues in combustion and
gasification of lignite, Fuel, 84, 1195–1205.
Bayarsaikhan B., Sonoyama N., Hosokai S., Shimada T., Hayashi J., Li C.Z.,
2006, Inhibition of steam gasification of char by volatiles in a fluidized bed
under continuous feeding of a brown coal, Fuel, 85, 340–349.

CHAPTER 5: Dry autothermal gasification of lignite coal
133
Belghit A., Gordillo E.D., Issami S.E., 2009, Coal steam-gasification model in
chemical regime to produce hydrogen in a gas–solid moving bed reactor
using nuclear heat, Int. J. Hydrogen Energy, 34, 6114–6119.
Bell D.A., Towler B.F., Fan M., 2011, Coal gasification and its applications,
Boston: William Andrew Publishing; http://dx.doi.org/10.1016/B978-0-8155-
2049-8.10003-8.
Bhattacharya S.P., 2006, Gasification performance of Australian lignites in a
pressurized fluidized bed gasifier process development unit under air and
oxygen-enriched air blown conditions, Process Safe. Environ. Protect., 84,
453–460.
Brar J.S., Singh K., Wang J., Kumar S., 2012, Cogasification of coal and
biomass: a review, Int. J. Forest Res., Article ID 363058, 10 pages.
Burger S., 2010, Lignite gasification increases cost of coal to liquids.
http://www.miningweekly.com/article/lignite-gasification-increases-costs-of-
coal-to-liquids-2010-10-22.
Caldwell L., 1980, Selectivity in Fischer–Tropsch synthesis: review and
recommendations for further work, http://www.fischertropsch.org/DOE/
DOEreports/81223596/pb81223596.pdf [accessed 07.07.10].
Carrazza J., Tysoe W.T., Heinemann H., Somorjai G.A., 1985, Gasification of
graphite with steam below 900 K catalyzed by a mixture of potassium
hydroxide and transition metal oxide, J. Catal., 96, 234–241.
Chatterjee P.K., Datta A.B., Kundu K.M., 1995, Fluidized bed gasification of
coal, Can. J. Chem. Eng., 73, 204–210.
Cohce M.K., Dincer I., Rosen M.A., 2010, Thermodynamic analysis of
hydrogen production from biomass gasification, Int. J. Hydrogen Energy, 35,
4970–4980.

CHAPTER 5: Dry autothermal gasification of lignite coal
134
Crnomarkovic N., Repic B., Mladenovic R., Neskovic O., Veljkovic M., 2007,
Experimental investigation of role of steam in entrained flow coal gasification,
Fuel, 86, 194–202.
Demirbas A., Science S., Turkey T., 2007, Converting biomass derived
synthetic gas to fuels via Fisher–Tropsch synthesis, Energy Sources Part A,
29, 1507–1512.
Dennis J.S., Scott S.A., 2010, In situ gasification of a lignite coal and CO2
separation using chemical looping with a Cu-based oxygen carrier, Fuel, 89,
1623–1640.
Detournay M., Hemati M., Andreux R., 2011, Biomass steam gasification in
fluidized bed of inert or catalytic particles: comparison between experimental
results and thermodynamic equilibrium predictions, Powder Technol., 208,
558–567.
Díaz-Somoano M., Martínez-Tarazona M.R., 2003, Trace element
evaporation during coal gasification based on a thermodynamic equilibrium
calculation approach, Fuel, 82, 137–145.
Dry M., 1989, Commercial conversion of carbon monoxide to fuels and
chemicals, J. Organomet. Chem., 372, 117–127.
Dry M., 2002, The Fischer–Tropsch process: 1950–2000, Catal. Today, 71,
227–241.
Dufaux A., Gaveau B., Letolle R., Mostade M., Noël M., Pirard J.P., 1990,
Modelling of the underground coal gasification process at Thulin on the basis
of thermodynamic equilibria and isotopic measurements, Fuel, 69, 624–632.
Eftekhari A.A., Van Der Kooi H., Bruining H., 2012, Exergy analysis of
underground coal gasification with simultaneous storage of carbon dioxide,
Energy, 45, 729–745.
CHAPTER 5: Dry autothermal gasification of lignite coal
135
Everson R.C., Neomagus H.W., Kasaini H., Njapha D., 2006, Reaction
kinetics of pulverized coal-chars derived from inertinite-rich coal discards:
gasification with carbon dioxide and steam, Fuel, 85, 1076–1082.
Fan L., Li F., Ramkumar S., 2008, Utilization of chemical looping strategy in
coal gasification processes, Particuology, 8, 131–142.
Fernández-Morales I., López-Garzon F.J., López-Peinado A., Moreno-Castilla
C., Rivera-Utrilla J., 1985, Study of heat-treated Spanish lignites:
characteristics and behaviour in CO2 and O2 gasification reactions, Fuel, 64,
666–673.
Foong S.K., Lim C.J., Watkinson A.P., 1980, Coal gasification in a spouted
bed, Can. J. Chem. Eng., 58, 84–91.
Fushimi C., Goto M., Tsutsumi A., Hayashi J., Chiba T., 2003, Steam
gasification characteristics of coal with rapid heating, J. Anal. Appl. Pyrol., 70,
185–197.
Giuffrida A., Romano M.C., Lozza G., 2011, Thermodynamic analysis of air-
blown gasification for IGCC applications, Appl. Energy, 88, 3949–3958.
Hanson S., Patrick J.W., Walker A., 2002, The effect of coal particle size on
pyrolysis and steam gasification, Fuel, 81, 531–537.
Haryanto A., Fernando S.D., Pordesimo L.O., Adhikari S., 2009, Upgrading of
syngas derived from biomass gasification: a thermodynamic analysis,
Biomass Bioenergy, 33, 882–889.
Hecht E.S., Shaddix C.R., Molina A., Haynes B.S., 2011, Effect of CO2
gasification reaction on oxy-combustion of pulverized coal char, Proc.
Combust. Inst., 33, 1699–1706.
Kale G., Borkhade S., Shriwas P., 2013, Gasification coupled Chemical
looping combustion of coal: a thermodynamic process design study, ISRN

CHAPTER 5: Dry autothermal gasification of lignite coal
136
Chemical Engineering, http://dx.doi.org/10.1155/2013/565471 [Article ID
565471, 11 p.].
Karimipour S., Gerspacher R., Gupta R., Spiteri R.J., 2013, Study of factors
affecting syngas quality and their interactions in fluidized bed gasification of
lignite coal, Fuel, 103, 308-320.
Kiso F., Matsuo M., 2011, A simulation study on the enhancement of the shift
reaction by water injection into a gasifier, Energy, 36, 4032–4040.
Konttinen J., Backman R., Hupa M., Moilanen A., Kurkela E., 2013, Trace
element behavior in the fluidized bed gasification of solid recovered fuels—a
thermodynamic study, Fuel, 106, 621-631.
Kopsel R., Zabawski H., 1990, Catalytic effects of ash components in low rank
coal gasification: 1. Gasification with carbon dioxide, Fuel, 69, 275–281.
Kopyscinski J., Schildhauer T.J., Biollaz S.M.A., 2010, Production of synthetic
natural gas (SNG) from coal and dry biomass—a technology review from
1950 to 2009, Fuel, 89, 1763–1783.
Krzysztof K., Krzysztof S.C., 2011, Pollution of water during underground coal
gasification of hard coal and lignite, Fuel, 90, 1927–1934.
Kumabe K., Hanaoka T., Fujimoto S., Minowa T., Sakanishi K., 2007, Co-
gasification of woody biomass and coal with air and steam, Fuel, 86, 684–
689.
Letellier S., Marias F., Cezac P., Serin J.P., 2010, Gasification of aqueous
biomass in supercritical water: an equilibrium analysis, J. Supercrit. Fluids, 51,
353–361.
Li Z., Zhang X., Sugai Y., Wang J., Sasaki K., 2012, Properties and
developments of combustion and gasification of coal and char in a CO2-rich
CHAPTER 5: Dry autothermal gasification of lignite coal
137
and recycled flue gases atmosphere by rapid heating, Journal of Combustion,
Vol.2012, Article ID 241587, 1-11.
Liu G.S., Niksa S., 2004, Coal conversion submodels for design applications
at elevated pressures. Part II. Char gasification, Prog. Energy Combust., 30,
679–717.
Liu K., Song C., Subramani V., 2009, Hydrogen and syngas production and
purification technologies, Wiley. http://onlinelibrary.wiley.com/book/10.1002/
9780470561256.
Liu S., Wang Y., Yu L., Oakey J., 2006, Thermodynamic equilibrium study of
trace element transformation during underground coal gasification, Fuel
Process Technol., 87, 209–215.
Liu S.Q., Wang Y.Y., Zhao K., Yang N., 2009, Enhanced-hydrogen gas
production through underground gasification of lignite, Min. Sci. Technol.
(China), 19, 389–394.
Marcourt M., Paquay V., Piel, A., Jean-Paul, P., 1983, Coal gasification at
pressure by mixtures of carbon dioxide and oxygen, Fuel, 62, 823–828.
Molina A., Mondragon F., 1998, Reactivity of coal gasification with steam and
CO2, Fuel, 77, 1831–1839.
Muhammad F.I., Muhammad R.U., Kusakabe K., 2011, Coal gasification in
CO2 atmosphere and its kinetics since 1948: a brief review, Energy, 36, 12–
40.
Nandi S.P., Johnson J.L., 2006, Catalytic gasification of lignite chars. Institute
of Gas Technology, http://web.anl.gov/PCS/acsfuel/preprint%20archive/Files/
24_3_ WASHINGTON_0979_0017.pdf.
Neogi D., Chang C.C., Walawender W.P., Fan L.T., 1986, Study of coal
gasification in an experimental fluidized bed reactor, AIChE, 32, 17–28.
CHAPTER 5: Dry autothermal gasification of lignite coal
138
Peng F.F., Lee I.C., Yang R.Y.K., 1995, Reactivities of in-situ and ex-situ coal
chars during gasification in steam at 1000–1400°C, Fuel Process Technol.,
41, 233–251.
Prabhu V., Jayanti S., 2012, Underground coal-air gasification based solid
oxide fuel cell system, Appl. Energy, 94, 406–414.
Prins M.J., Ptasinski K.J., Frans T., Janssen J.J.G., 2007, From coal to
biomass gasification: comparison of thermodynamic efficiency, Energy, 32,
1248–1259.
Renganathan T., Yadav M.V., Pushpavanam S., Voolapalli R.K., Cho Y.S.,
2012, CO2 utilization for gasification of carbonaceous feedstocks: a
thermodynamic analysis, Chem. Eng. Sci., 83, 159–170.
Sekine Y., Ishikawa K., Kikuchi E., Matsukata M., Akimoto A., 2006, Reactivity
and structural change of coal char during steam gasification, Fuel, 85, 122–
126.
Shabbar S., Janajreh I., 2013, Thermodynamic equilibrium analysis of coal
gasification using Gibbs energy minimization method, Energy Convers.
Manage., 65, 755-763.
Smolinski A., Howaniec N., Stanczyk K., 2011, A comparative experimental
study of biomass, lignite and hard coal steam gasification, Renew Energy, 36,
1836–1842.
Squires R.G., Laurendeau N.M., Koenig P.C., 1986, Effect of potassium
carbonate on char gasification by carbon dioxide, J. Catal., 100, 228–239.
Tremel A., Haselsteiner T., Kunze C., Spliethoff H., 2012, Experimental
investigation of high temperature and high pressure coal gasification, Appl.
Energy, 92, 279–285.
CHAPTER 5: Dry autothermal gasification of lignite coal
139
Van Dyk J.C., Keyser M.J., Coertzen M., 2006, Syngas production from South
African coal sources using Sasol–Lurgi gasifiers, Int. J. Coal Geol., 65, 243–
253.
Wang Z., Zhou J., Wang Q., Fan J., Cen K., 2006, Thermodynamic
equilibrium analysis of hydrogen production by coal based on Coal/CaO/H2O
gasification system, Int. J. Hydrogen Energy, 31, 945–952.
Fu W.B., Wang Q.H., 2001, General relationship between the kinetic
parameters for the gasification of coal chars with CO2 and coal type, Fuel
Process Technol., 72, 63–77.
Ye D.P., Agnew J.B., Zhang D.K., 1998, Gasification of a South Australian
low-rank coal with carbon dioxide and steam: kinetics and reactivity studies,
Fuel, 77, 1209–1219.
Yi C.N., Wojciech L., 2012, Thermodynamic analyses of solar thermal
gasification of coal for hybrid solar-fossil power and fuel production, Energy,
44, 720–731.
Yu J.L., Tian F.J., Chow M.C., McKenzie L.J., Li C.Z., 2006, Effect of iron on
the gasification of Victorian brown coal with steam: enhancement of hydrogen
production, Fuel, 85, 127–133.
Chapter 6
DATR in Chemical looping combustion
systems
CHAPTER 6: DATR in Chemical looping combustion systems
141
Abstract
Dry autothermal reforming requires CO2 as feed. Chemical looping
combustion generates a CO2 rich stream. The thermodynamic feasibility of a
new process scheme combining chemical looping combustion (CLC) and dry
autothermal reforming of propane (LPG) is studied in this chapter. The study
of CLC of propane with CaSO4 as oxygen carrier shows thermodynamic
feasibility in temperature range (400 – 792.95ºC) at 1 bar pressure. The CO2
rich stream generated in the CLC can be used for reforming of additional
propane in an autothermal way within the temperature range (400 – 1000ºC)
at 1 bar pressure to generate syngas (ratio < 3.0 above 600ºC) which is
extremely desirable for petrochemical manufacture. The process scheme
generates a) huge thermal energy in CLC that can be used for various
processes, b) pure N2 and syngas rich streams can be used for petrochemical
manufacture and c) takes care of the expensive CO2 separation from flue gas
stream and also CO2 sequestration.

CHAPTER 6: DATR in Chemical looping combustion systems
142
6.1 Introduction
Dry autothermal reforming requires CO2 as a primary reactant. Chemical
looping combustion (CLC) is a new technology that generates CO2 rich
product stream which can be cooled to separate water and generate an
almost pure CO2 stream which can be sequestrated. Combining the CLC
process with DATR can help utilize the CO2 produced in the CLC process.
The thermodynamic feasibility of a new process scheme combining chemical
looping combustion (CLC) coupled DATR with steam [also referred as
combined reforming (CR)] is studied in this chapter, to facilitate energy
production using the existing fossil fuels and reduce carbon footprint thus
reducing the impacts of global warming.
6.1.1 Chemical looping combustion
CLC is an emerging area for energy generation that has several advantages
like no direct mixing of fuel and air. The CLC system consists of 2 reactors,
the fuel is oxidized by the oxygen carrier in fuel reactor (FR) and the reduced
oxygen carrier is oxidized (regenerated) by air in the air reactor (AR). The
process operates continuously and many oxygen carriers have been
evaluated for long term durability of oxidation-reduction cycles. The fuel
reactor product stream mainly consisting of steam and CO2 is usually cooled
to condense out water and the pure CO2 stream is compressed, liquefied and
injected deep underground into porous rock for sequestration without
separation expense.
Many research groups have published CLC related studies. Lyngfelt et al.
(2001) have studied the feasibility of a boiler with two interconnected fluidized
bed CLC system. Johansson et al. (2006) have discussed the successful
operation of natural gas based CLC system. Abad et al. (2006) reported the
operation of a 300 W CLC system using Mn oxygen carrier. Cho et al. (2004)

CHAPTER 6: DATR in Chemical looping combustion systems
143
have reported that Ni, Cu and Fe oxygen carriers showed good reactivity for
CLC. Adánez et al. (2004) have studied Cu-based oxygen carriers on SiO2 or
TiO2 and Fe-based oxygen carriers on Al2O3 and ZrO2. Jin et al. (1999) have
reported the development of a better oxygen carrier NiO/NiAl2O4. Mattisson et
al. (2001) have experimentally studied the Fe2O3 oxygen carrrier in a fixed
bed quartz reactor. Ishida et al. (1996) have studied the effects of reaction
temperature, particle size and gas composition on NiO mixed with YSZ
particles. Mattisson et al. (2003) have experimentally investigated Cu, Co, Mn,
and Ni oxides supported on γ-Al2O3. Jin et al. (1998) have reported that
synthesized CoO-NiO/YSZ has high reactivity, prevents carbon deposition
and shows good repeatability. Mattisson et al. (2004) have studied the Fe2O3
particles supported on Al2O3, ZrO2, TiO2, or MgAl2O4 supports for CLC. Villa
et al. (2003) have studied the preparation, characterization and redox
properties of Ni-Al-O and Ni-Mg-Al-O mixed oxides for CH4 CLC system.
Ishida et al. (1998) have identified the conditions for completely preventing
carbon formation in CLC systems. Mattisson et al. (2006) have studied the
reactivity of NiO with NiAl2O4, MgAl2O4, TiO2 and ZrO2 in a small fluidized bed
simulated CLC system. De Diego et al. (2004) have concluded that Cu based
oxygen carriers prepared by mechanical mixing or by coprecipitation showed
excellent chemical properties but poor mechanical properties. Cho et al.
(2005) have recommended high fuel conversion conditions to avoid carbon
formation.
The CLC product stream contains CO2 and water in a particular ratio
depending on the CLC fuel. For e.g. if methane, propane or isooctane are
used as CLC fuels, the CLC fuel reactor reactions are:
CH4 + 3MeO = CO2 + 2H2O + 3Me CO2:H2O=1:2 (0.5)
C3H8 + 10MeO = 3CO2 + 4H2O + 10Me CO2:H2O=3:4 (0.75)

CHAPTER 6: DATR in Chemical looping combustion systems
144
C8H18 + 25MeO = 8CO2 + 9H2O + 25Me CO2:H2O=8:9 (0.89)
Although CLC can generate a CO2 rich stream, the processing of CO2 i.e. to
compress, liquefy and inject the CO2 to deep underground into porous rock for
sequestration is an expensive and serious issue for safety. Scientists are
concerned about carbon dioxide injections triggering seismic activity or
leaking out of the reservoirs and no safe explanation has emerged out yet.
Secondly, the product stream of fuel reactor is hot and cooling it to separate
water and CO2 is also not very appealing.
Such CLC product streams can be reformed autothermally by using additional
fuel and oxygen for conversion of CO2 to CO, which is a useful syngas
component. The quantity of the additional fuel, oxygen and the reactor
operating temperature can play a major role in the CO2 conversion to CO and
hence are of prime importance.
This chapter proposes the development of a new process scheme to address
these issues by thermodynamically analyzing the favorable conditions for
direct feeding the hot CLC product stream to a dry autothermal reformer to
produce a syngas rich stream. Pure steam reforming and dry reforming
studies have been published, but dry autothermal reforming studies directly
applicable to CLC product gas processing have not been published in
literature yet. Such an analysis is useful to determine the operational
conditions of reformer to maximize the yields of desired products and
minimize the undesired product formation. Propane is the major constituent of
LPG (easily available commercial fuel) and is hence chosen for this study.
6.1.2 Dry autothermal reformer
In this DATR case, the steam mixed CO2 stream, fuel and oxygen (air) is used
as feed in the DATR reactor. This DATR with steam reforming [also referred

CHAPTER 6: DATR in Chemical looping combustion systems
145
as combined (CO2 + H2O) reforming] is a catalytic process that combines
steam reforming (SR), dry reforming (DR) and partial oxidation (PO) reactions
at thermoneutral conditions (preferably) to produce syngas rich stream. Such
combined reforming has also been studied by many researchers. Michael et
al. (2009) have experimentally studied the PO, SR and DR of methane on
Rh/Al2O3 catalysts in one step process. Maestri et al. (2008) have reported
microkinetic models for SR and DR of methane on Rh catalysts. Li et al.
(2008) have reported optimum reformer conditions for coke elimination in
autothermal steam and CO2 reforming. York et al. (2007) have discussed the
carbon deposition and deactivation in combined reforming (oxyforming).
Choudhary and Mondal (2006) reported reduced NdCoO3 perovskite-type
mixed-oxide catalyst as highly promising material. Song et al. (2004) have
studied the thermodynamic analysis and experimental testing of combined
reforming of methane in a fixed-bed flow reactor. Le et al. (2004) have studied
the low temperature plasma combination of SR and DR. Naqvi and Johnson
(2004) have strongly emphasized the idea of producing syngas from CO2 and
steam. Tomishige et al. (2004) have experimentally studied the effect of
oxygen addition to steam and dry reforming of methane. Panczyk et al. (2001)
have reported the improved coking resistance of commercial catalysts
modified by small additions of promoters (K, Ba, Ce, W and Mo). Qin and
Lapszewicz (1994) have experimentally studied the MgO-supported noble
metal catalysts for combined reforming.
6.2 Conceptual Process Design and Methodology
Figure 6.1 shows the conceptual process design for CLC coupled DATR.
Huge thermal energy is generated in the CLC system that can be used for
various applications. Generally, oxygen carrier is used in excess to facilitate
the complete conversion of fuel to CO2 and H2O. It is assumed that the CLC
reactors are operated such that the gas leaving the air reactor consists only of
nitrogen, while the gas from the fuel reactor consists only of water and carbon

CHAPTER 6: DATR in Chemical looping combustion systems
146
dioxide which can be used as feed for DATR to produce syngas using an
additional propane and oxygen (air) to make it autothermal. In (partial /
complete) absence of oxygen, the energy required for reformer can also be
obtained from the CLC. Such a CLC coupled reforming process can produce
energy and syngas (basic building block of petrochemical industry) taking
care of CO2 emissions and expensive CO2 storage/sequestration problem.
HSC Chemistry software version 5.1 (2002) has been used to generate the
data for the study. In the CLC fuel reactor, species such as C3H8 (g), CO2 (g),
H2(g), CO(g), H2O(g), CH4(g), O2(g), N2(g) H2O(l) and C(s) are considered.
Ethane (C2H6) and other C2, C3 species were considered for the study in
preliminary cases. Since negligible formation of these hydrocarbons was
observed, it was decided to neglect them in further study. The input species
are propane, water, air and CO2 (all in gaseous phase) reacting to give the
products. The material and energy balances are done by HSC Chemistry
database and the results may be slightly different using different software.
The results presented are within reasonable error limit. Any other inerts in
feed, product–byproduct formation is not considered in this study. The steam
reforming and dry reforming chemistry for hydrocarbon fuels is well
established in chemical literature and hence no such details are presented in
this chapter.
The products of the CLC fuel reactor will be different for different systems and
operating parameters. These are mixed with the additional fuel and fed to the
DATR reactor. The chemical reaction occurring inside a typical CLC fuel
reactor (assumed for this study) using propane as fuel and CaSO4 as oxygen
carrier is represented as:
R1: C3H8(g) + 2.5CaSO4 = 2.5CaS(g) + 4H2O(g) + 3CO2(g)
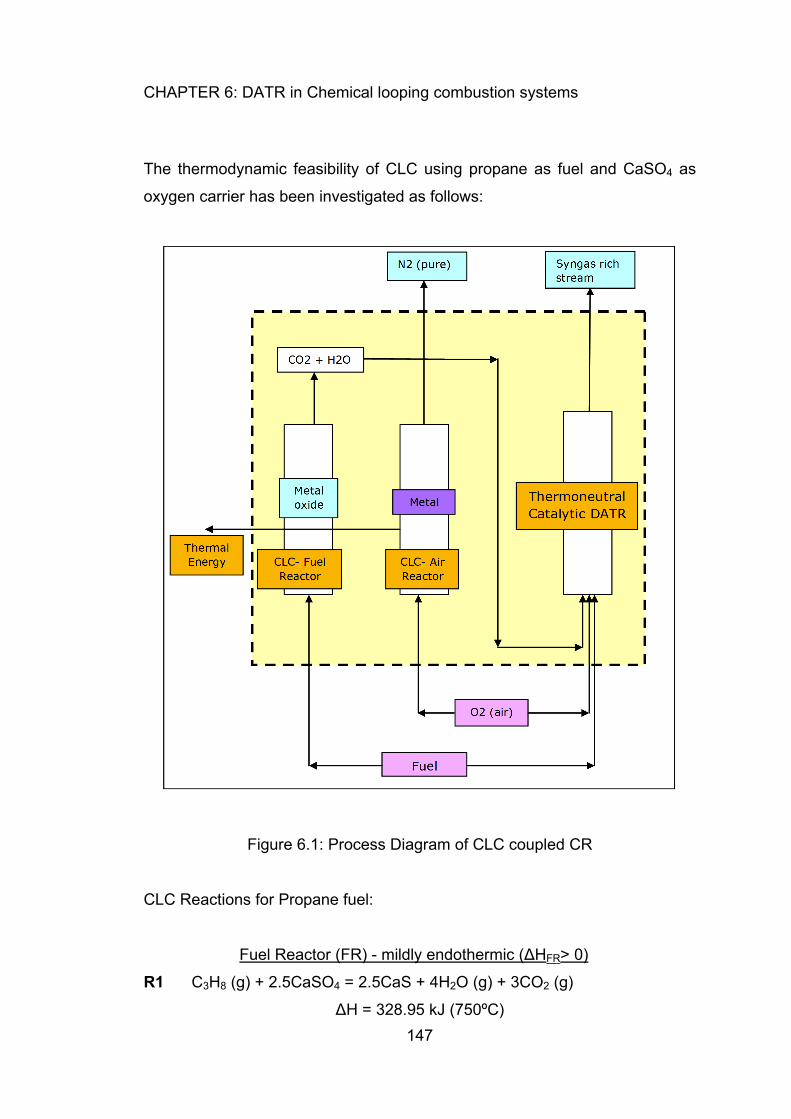
CHAPTER 6: DATR in Chemical looping combustion systems
147
The thermodynamic feasibility of CLC using propane as fuel and CaSO4 as
oxygen carrier has been investigated as follows:
Figure 6.1: Process Diagram of CLC coupled CR
CLC Reactions for Propane fuel:
Fuel Reactor (FR) - mildly endothermic (∆HFR> 0)
R1 C3H8 (g) + 2.5CaSO4 = 2.5CaS + 4H2O (g) + 3CO2 (g)
∆H = 328.95 kJ (750ºC)
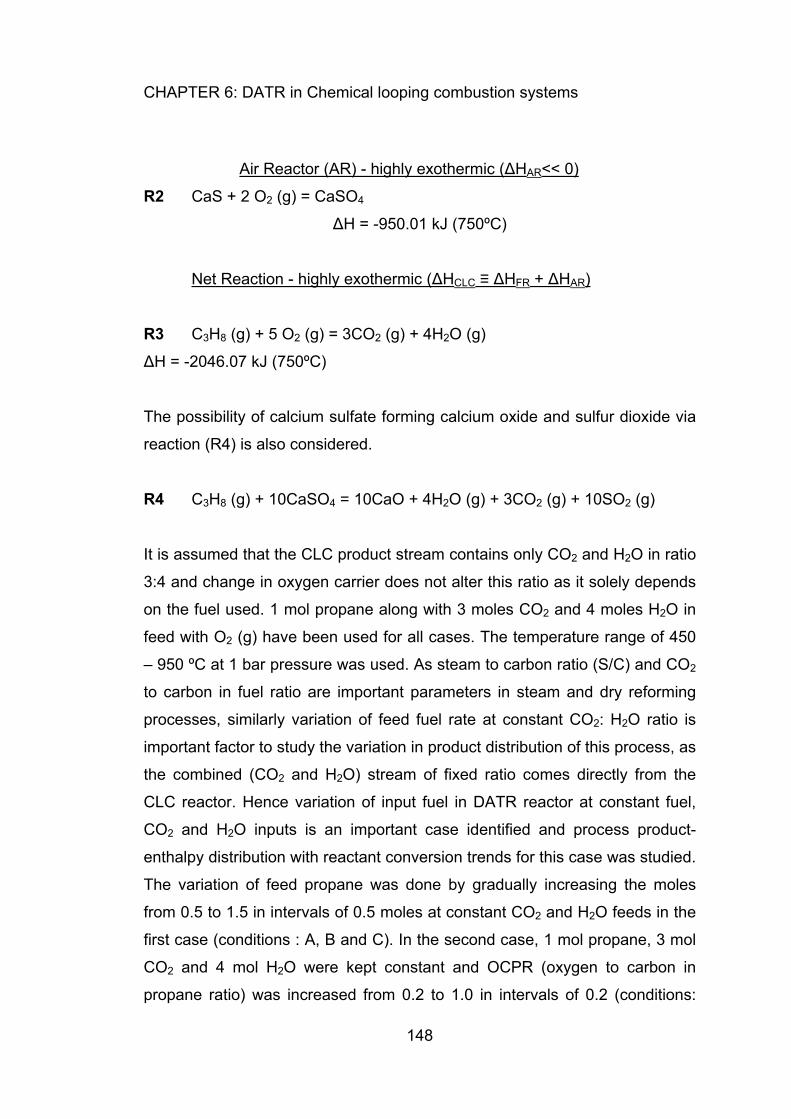
CHAPTER 6: DATR in Chemical looping combustion systems
148
Air Reactor (AR) - highly exothermic (∆HAR<< 0)
R2 CaS + 2 O2 (g) = CaSO4
∆H = -950.01 kJ (750ºC)
Net Reaction - highly exothermic (∆HCLC ≡ ∆HFR + ∆HAR)
R3 C3H8 (g) + 5 O2 (g) = 3CO2 (g) + 4H2O (g)
∆H = -2046.07 kJ (750ºC)
The possibility of calcium sulfate forming calcium oxide and sulfur dioxide via
reaction (R4) is also considered.
R4 C3H8 (g) + 10CaSO4 = 10CaO + 4H2O (g) + 3CO2 (g) + 10SO2 (g)
It is assumed that the CLC product stream contains only CO2 and H2O in ratio
3:4 and change in oxygen carrier does not alter this ratio as it solely depends
on the fuel used. 1 mol propane along with 3 moles CO2 and 4 moles H2O in
feed with O2 (g) have been used for all cases. The temperature range of 450
– 950 ºC at 1 bar pressure was used. As steam to carbon ratio (S/C) and CO2
to carbon in fuel ratio are important parameters in steam and dry reforming
processes, similarly variation of feed fuel rate at constant CO2: H2O ratio is
important factor to study the variation in product distribution of this process, as
the combined (CO2 and H2O) stream of fixed ratio comes directly from the
CLC reactor. Hence variation of input fuel in DATR reactor at constant fuel,
CO2 and H2O inputs is an important case identified and process product-
enthalpy distribution with reactant conversion trends for this case was studied.
The variation of feed propane was done by gradually increasing the moles
from 0.5 to 1.5 in intervals of 0.5 moles at constant CO2 and H2O feeds in the
first case (conditions : A, B and C). In the second case, 1 mol propane, 3 mol
CO2 and 4 mol H2O were kept constant and OCPR (oxygen to carbon in
propane ratio) was increased from 0.2 to 1.0 in intervals of 0.2 (conditions:

CHAPTER 6: DATR in Chemical looping combustion systems
149
B2, B4, B6, B8 and B10). The effect on product gas yields, reactant
conversions and process enthalpy at different temperatures was analyzed and
discussed.
6.3 Results and Discussion
The simple shortcut technique to assess the feasibility of CLC fuel reactor
was studied and presented. The effect of temperature and feed variation in
combined reforming of propane on the equilibrium product compositions is
analyzed and also discussed in this section. The trend with regard to the
variation of products for change in reactant propane moles was studied. A
detailed analysis along with a graphical representation of the data has been
provided in the preceding section.
6.3.1 Gibbs Free Energy of CLC reactions
Figure 6.2 shows the Gibbs free energy change (∆G) for chemical reactions
(R1, R2, R3 and R4) as a function of reaction temperature. The negative
value of ∆G implies the feasibility of the reactions (in forward direction).
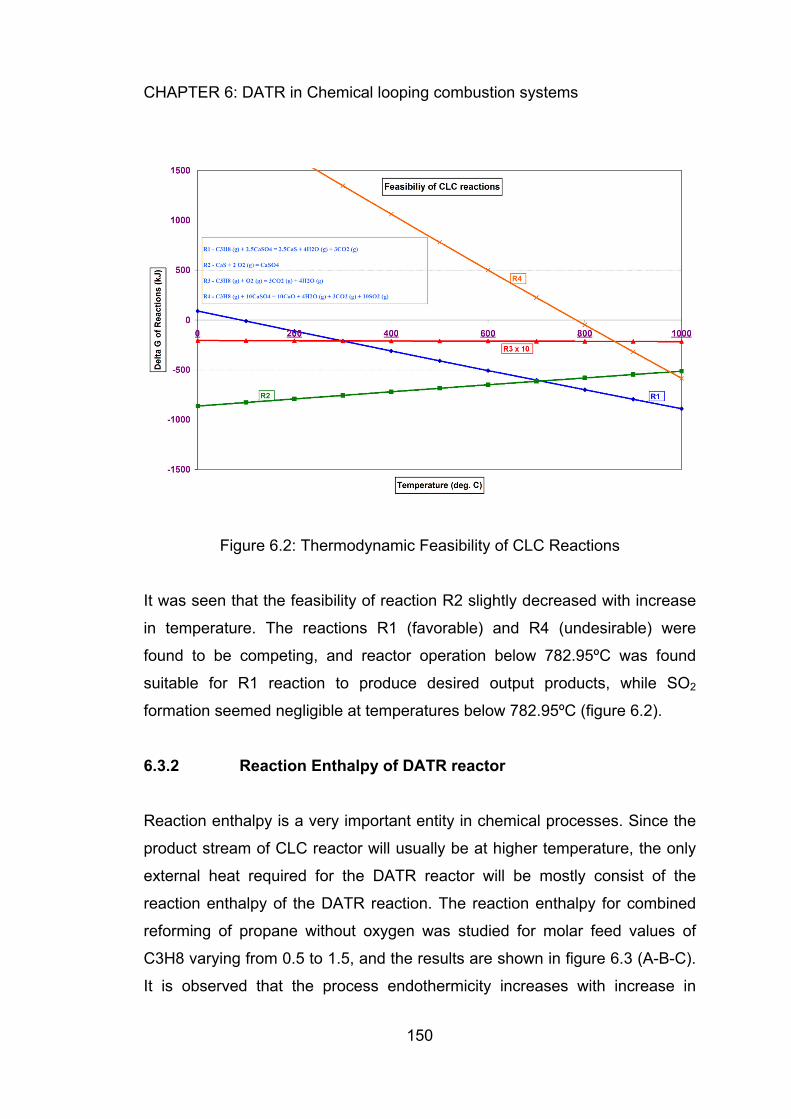
CHAPTER 6: DATR in Chemical looping combustion systems
150
Figure 6.2: Thermodynamic Feasibility of CLC Reactions
It was seen that the feasibility of reaction R2 slightly decreased with increase
in temperature. The reactions R1 (favorable) and R4 (undesirable) were
found to be competing, and reactor operation below 782.95ºC was found
suitable for R1 reaction to produce desired output products, while SO2
formation seemed negligible at temperatures below 782.95ºC (figure 6.2).
6.3.2 Reaction Enthalpy of DATR reactor
Reaction enthalpy is a very important entity in chemical processes. Since the
product stream of CLC reactor will usually be at higher temperature, the only
external heat required for the DATR reactor will be mostly consist of the
reaction enthalpy of the DATR reaction. The reaction enthalpy for combined
reforming of propane without oxygen was studied for molar feed values of
C3H8 varying from 0.5 to 1.5, and the results are shown in figure 6.3 (A-B-C).
It is observed that the process endothermicity increases with increase in

CHAPTER 6: DATR in Chemical looping combustion systems
151
temperature and also with increase in C3H8 feed rate. The reaction enthalpy
for the CR process in the temperature range 450 to 950 ºC increases from
178 to 645 kJ, from 191 to 1000 kJ and from 205 to 1360 kJ for propane feed
values of 0.5, 1.0 and 1.5 moles respectively. The reaction enthalpy in
combined reforming of propane with oxygen addition was studied for OCPR
values varying from 0.2 to 1.0 and the results are plotted in figure 6.3 (B2-
B10). The point at which the enthalpy curve touches the temperature axis is
the thermoneutral point. It is observed that the process endothermicity
increases with increase in temperature at constant OCPR and the process
endothermicity decreases with increase in OCPR at constant temperature.
The reaction enthalpy values range from -1.58 kJ to 771.00 kJ (OCPR=0.2),
from -196 kJ to 540 kJ (OCPR=0.4), from -390 kJ to 308 kJ (OCPR=0.6), from
-587 kJ to 75.20 kJ (OCPR=0.8) and from -792 to -158 kJ (OCPR=1.0) within
the temperature range 450 – 950 ºC for the process. The thermo-neutral
temperatures (within 450 – 950 ºC range considered in this study) were
observed for OCPR values of 0.4, 0.6 and 0.8 and located at 537.55ºC,
626.73ºC and 873.13ºC respectively.

CHAPTER 6: DATR in Chemical looping combustion systems
152
Figure 6.3: Enthalpy of combined reforming
6.3.3 Hydrogen yield
Hydrogen is a valuable product of reforming processes as it has many
applications including use in fuel cells and syngas production. The H2 yield for
combined reforming of propane without oxygen input was studied and the
results obtained are shown in figure 6.4 (A-B-C). It was observed that the H2
yield generally increases, reaches a maximum value and then decreases with
increase in CR temperature and the H2 yield is directly proportional to the
moles of C3H8 in feed. The maximum hydrogen yield for increase in C3H8 feed
from 0.5 to 1.5 moles was found to be 3.14, 5.79 and 8.48 moles at
temperatures 667.5°C, 748°C and 827°C respectively. However, it was also
found that the hydrogen yield per mole propane feed declined from 6.28 (0.5

CHAPTER 6: DATR in Chemical looping combustion systems
153
mol propane) to 5.79 (1 mol propane) and 5.65 (1.5 mol propane). The H2
yield for combined reforming of propane (constant 1 mol) with gradual
increase in oxygen feed is also shown in figure 6.4 (B2-B10). In this case too,
it was observed that the H2 yield initially increased, reached a maximum value
and then decreased with increase in DATR temperature and the lower OCPR
feed gave higher hydrogen yield (T > 600ºC). The maximum hydrogen yields
for increase in OCPR from 0.2 to 1.0 were found to be 5.25, 4.71, 4.16, 3.56
and 2.9 moles at temperatures of 706.5°C, 670.5°C, 636.5°C, 606.5 and
576°C respectively. The hydrogen yields at thermo-neutral temperatures for
OCPR values of 0.4, 0.6 and 0.8 were 3.19, 4.15 and 2.82 moles respectively.
It is observed that as the OCPR increases, the thermo-neutral temperatures
increase, but the H2 yield first increases and then decreases.
Figure 6.4: Hydrogen yield in combined reforming of propane

CHAPTER 6: DATR in Chemical looping combustion systems
154
6.3.4 Carbon Monoxide yield
The CO yield for combined reforming of propane without oxygen feed for
variation in feed of C3H8 moles from 0.5 to 1.5 is shown in figure 6.5 (A-B-C).
It was observed that the CO yield generally increases with increase in DATR
process temperature and it is directly proportional to the feed moles of C3H8 at
higher temperatures. It was seen that the CO yield was similar for all C3H8
molar feed values at lower temperature (<550ºC), but later increased with
higher C3H8 molar feed values and then increased very slowly at higher
temperatures. The maximum CO yields for increase in C3H8 feed moles from
0.5 to 1.0 and 1.5 were found to be 2.40 moles, 4.56 moles, 6.63 moles
respectively at 950°C, while the corresponding minimum CO yields were
found to be 0.133 moles, 0.134 moles, 0.135 moles respectively at 450°C.
The CO yield for combined reforming of propane with oxygen is shown in
figure 6.5 (B2-B10). It was observed that the CO yield increased with increase
in CR temperature, but it decreased with increase in OCPR at constant
temperature. Higher CO yield was favored by lower OCPR and higher
temperatures.
The maximum CO yields for increase in OCPR were found to be 4.09 moles
(for OCPR = 0.2), 3.85 moles (for OCPR = 0.4), 3.08 moles (for OCPR = 0.6),
2.55 moles (for OCPR = 0.8) and 2.00 moles (for OCPR = 1.0) at 950°C,
while the minimum CO yields were found to be 0.167 (for OCPR 0.2), 0.183
(for OCPR = 0.4), 0.231 (for OCPR = 0.6), 0.256 (for OCPR = 0.8) and 0.24
(for OCPR = 1.0) at 450°C. The CO yields at thermo-neutral temperatures for
OCPR values of 0.4, 0.6 and 0.8 were found to be 0.98, 1.97 and 2.38 moles.
Thus as the OCPR increased, the thermo-neutral temperature and the CO
yield both increased.
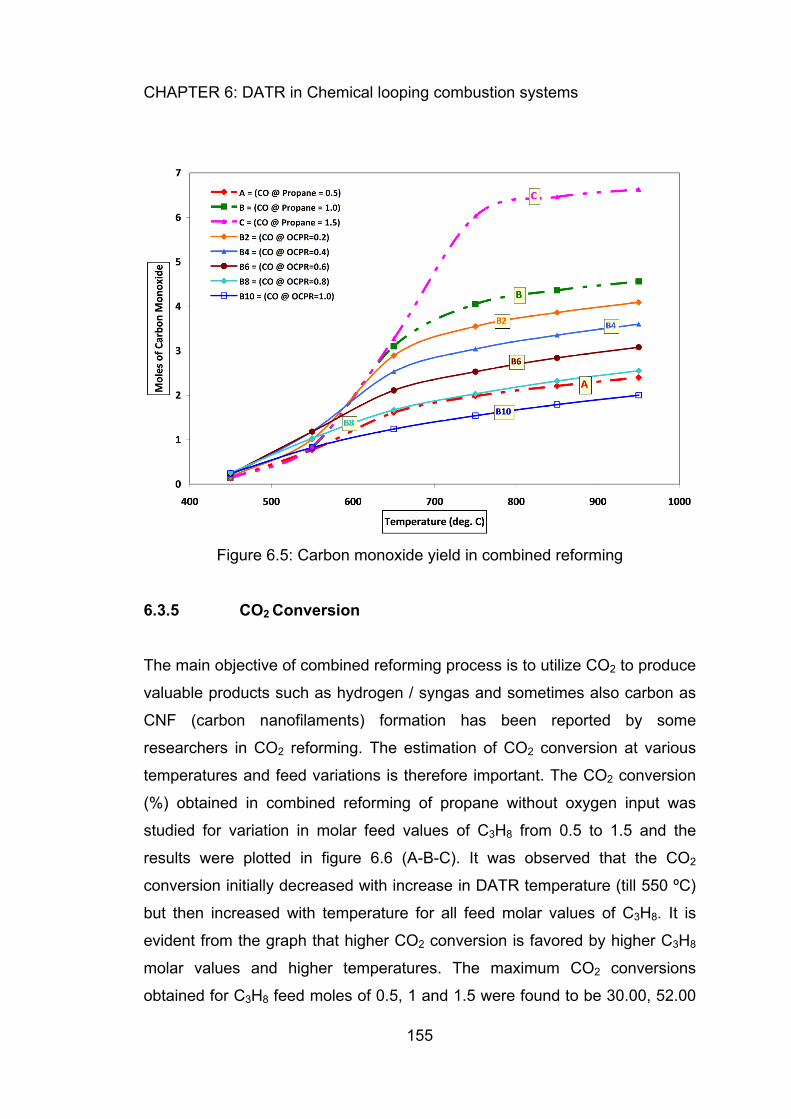
CHAPTER 6: DATR in Chemical looping combustion systems
155
Figure 6.5: Carbon monoxide yield in combined reforming
6.3.5 CO2 Conversion
The main objective of combined reforming process is to utilize CO2 to produce
valuable products such as hydrogen / syngas and sometimes also carbon as
CNF (carbon nanofilaments) formation has been reported by some
researchers in CO2 reforming. The estimation of CO2 conversion at various
temperatures and feed variations is therefore important. The CO2 conversion
(%) obtained in combined reforming of propane without oxygen input was
studied for variation in molar feed values of C3H8 from 0.5 to 1.5 and the
results were plotted in figure 6.6 (A-B-C). It was observed that the CO2
conversion initially decreased with increase in DATR temperature (till 550 ºC)
but then increased with temperature for all feed molar values of C3H8. It is
evident from the graph that higher CO2 conversion is favored by higher C3H8
molar values and higher temperatures. The maximum CO2 conversions
obtained for C3H8 feed moles of 0.5, 1 and 1.5 were found to be 30.00, 52.00

CHAPTER 6: DATR in Chemical looping combustion systems
156
and 71.07 respectively at 950°C. The CO2 conversion for combined reforming
of propane with oxygen addition was studied for OCPR increase from 0.2 to
1.0 and the results obtained were plotted in figure 6.6 (B2-B10). The CO2
conversion initially decreased for OCPR 0.2 and 0.4 but later increased for
OCPR 0.6, 0.8 and 1.0, with increase in DATR temperature. It is seen from
the graph that higher CO2 conversions are favored by higher temperatures
and lower OCPR. The negative value of CO2 conversion depicts more CO2
emission from the process.
Figure 6.6: CO2 conversion in combined reforming of propane
The minimum CO2 conversion for oxygen addition to the CR process was
found to be -75.67% at OCPR 1.0 and 450°C, while the maximum CO2
conversion was found to be 36.33 at 0.2 OCPR and 950°C. The CO2
conversion at thermo-neutral temperatures for OCPR values of 0.4, 0.6 and
0.8 were found to be -33.82%, -32.21% and -20.81% suggesting that
thermoneutral operation of the process at these points may not contribute to

CHAPTER 6: DATR in Chemical looping combustion systems
157
CO2 sequestration. It was observed that as the OCPR increased the thermo-
neutral temperature and the CO2 conversion both increased.
6.3.6 CH4 formation
Methane formation is assumed in all reforming process calculations as it is a
very stable hydrocarbon and is mostly present in products of reforming
processes. The CH4 yield in combined reforming of propane without oxygen
with varying the propane moles in feed (from 0.5 to 1.5 moles) was studied
and the results obtained were plotted in figure 6.7 (A-B-C). It was observed
that the CH4 yield generally decreased with increase in CR temperature and
finally became zero for all cases. It was also seen that the lower CH4 yield
was favored by lower propane feeds and higher temperatures. The methane
yield decreased from 1.72 moles (450ºC) to zero moles (950ºC); from 1.20
moles (450ºC) to zero moles (850ºC) and from 0.74 moles to zero moles
(750ºC) for the propane feed moles of 1.5, 1.0 and 0.5 moles respectively.
The CH4 yield for variation in OCPR at constant propane, CO2 and water
inputs to the CR reactor was studied and the results are shown in figure 6.7
(B2-B10). It was observed that the methane formation was favored at lower
temperatures and lower OCPR. The methane yields for all OCPR values
finally decreased to zero value at higher temperatures. The maximum CH4
yields were found to be 1.07 (OCPR = 0.2), 0.98 (OCPR = 0.4), 0.90 (OCPR =
0.6), 0.79 (OCPR = 0.8), 0.49 (OCPR = 1.0) at 450ºC. It was also observed
that as the OCPR increased, the temperatures for getting zero methane yields
decreased. The CH4 yields at thermo-neutral temperatures for OCPR values
of 0.4, 0.6 and 0.8 were found to be 0.71, 0.07 and 0.00 moles. Thus it was
observed that as the OCPR increased, the thermo-neutral temperature
increased and the CH4 yield decreased.
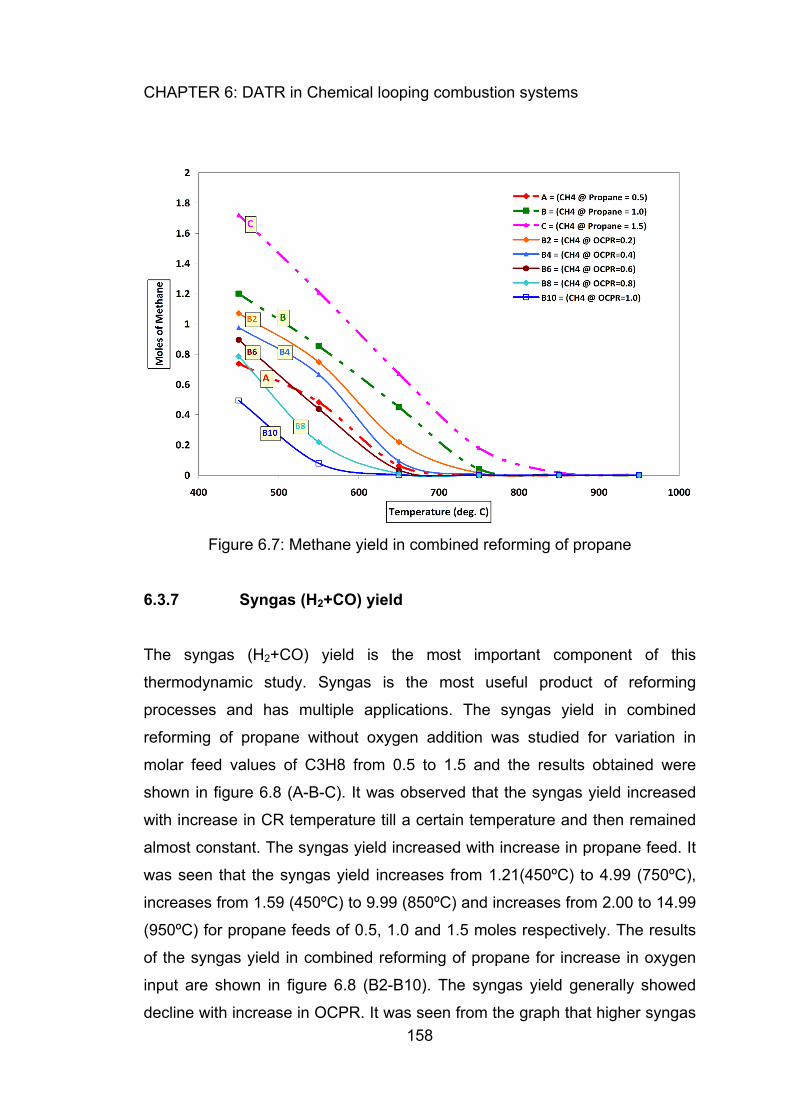
CHAPTER 6: DATR in Chemical looping combustion systems
158
Figure 6.7: Methane yield in combined reforming of propane
6.3.7 Syngas (H2+CO) yield
The syngas (H2+CO) yield is the most important component of this
thermodynamic study. Syngas is the most useful product of reforming
processes and has multiple applications. The syngas yield in combined
reforming of propane without oxygen addition was studied for variation in
molar feed values of C3H8 from 0.5 to 1.5 and the results obtained were
shown in figure 6.8 (A-B-C). It was observed that the syngas yield increased
with increase in CR temperature till a certain temperature and then remained
almost constant. The syngas yield increased with increase in propane feed. It
was seen that the syngas yield increases from 1.21(450ºC) to 4.99 (750ºC),
increases from 1.59 (450ºC) to 9.99 (850ºC) and increases from 2.00 to 14.99
(950ºC) for propane feeds of 0.5, 1.0 and 1.5 moles respectively. The results
of the syngas yield in combined reforming of propane for increase in oxygen
input are shown in figure 6.8 (B2-B10). The syngas yield generally showed
decline with increase in OCPR. It was seen from the graph that higher syngas

CHAPTER 6: DATR in Chemical looping combustion systems
159
yield was favoured by higher temperatures and lower OCPR. The maximum
syngas yields were found to be 8.80 (OCPR = 0.2, T > 850ºC), 7.60 (OCPR
=0.4, T > 750ºC), 6.40 (OCPR = 0.6, T > 750ºC), 5.20 (OCPR = 0.8, T >
750ºC) and 4.00 (OCPR = 1.0, T > 650ºC). The syngas moles obtained in the
temperature range of 450 – 950 ºC ranged from 1.75 to 8.80, 1.87 to 7.60,
1.97 to 6.40, 2.06 to 5.20 and 2.02 to 4.00 for OCPR increase from 0.2 to 1.0
showing a decrease in range with increase in temperature and OCPR. The
syngas yields at thermo-neutral temperatures for OCPR values of 0.4, 0.6 and
0.8 were found to be 4.17, 6.11 and 5.20 moles respectively. It was seen that
as the OCPR increased, the thermo-neutral temperature increased and the
syngas yield first increased and then decreased.
Figure 6.8: Syngas yield in combined reforming of propane

CHAPTER 6: DATR in Chemical looping combustion systems
160
6.3.8 Syngas ratio (H2/CO)
Syngas ratio is an important factor for petrochemical manufacture by FT
synthesis and the desirable syngas ratio range is 1 to 3. The variation of
product syngas ratio in combined reforming of propane for increase in molar
feed of C3H8 from 0.5 to 1.5 without oxygen input was studied and the results
obtained were plotted in figure 6.9 (A-B-C). It was observed that the syngas
ratio decreased with increase in CR temperature for all cases. The initial
decrease in the syngas ratio was very steep between 450 – 550ºC, i.e. 8.12 to
2.99, 10.90 to 3.75 and 13.78 to 1.26 but later the decrease was slow to final
values of 1.08, 1.19 and 1.26 at 950ºC for propane feeds of 0.5, 1.0 and 1.5
moles respectively. It was also seen that higher propane in feed showed
higher syngas ratio values. Thus lower syngas ratio was favored by lower
C3H8 feed and at high temperatures. The variation of product syngas ratio in
combined reforming of propane with increase in oxygen to feed was studied
and the results were plotted in figure 6.9 (B2-B10). It is observed that the
syngas ratio decreased rapidly at lower temperatures (450 – 550ºC) and then
slowly decreased at higher temperatures. Thus a lower syngas ratio was
favoured by higher temperatures and higher OCPR. The syngas ratios in the
range of 4.00 to 1.00 are obtained in the temperature range 550 – 950ºC. The
maximum syngas ratio values observed at 450ºC showed a decrease with
increase in OCPR, i.e. 9.46 (OCPR=0.2), 8.39 (OCPR=0.4), 7.53 (OCPR=0.6)
till 7.03 (OCPR=0.8) before increasing to 7.45 (OCPR=1.0). The syngas ratio
values obtained at thermo-neutral temperatures for OCPR values of 0.4, 0.6
and 0.8 were found to be 3.25, 2.11 and 1.19 respectively. It was observed
that as the OCPR increased, the thermo-neutral temperature increased and
the syngas ratio decreased.

CHAPTER 6: DATR in Chemical looping combustion systems
161
Figure 6.9: Syngas ratio in combined reforming of propane
6.3.9 Carbon formation
Usually carbon is also an undesired product of reforming processes; however
carbon formation in the form of CNF (carbon nanofilament) has been proved
valuable in some dry reforming studies. Hence estimation of carbon yield for
variations in feed and temperature was also studied. The results obtained for
variation of carbon yield at different propane feeds in DATR is shown in figure
6.10 (A-B-C). It was observed that higher propane feed resulted in higher
carbon formation and the carbon formation decreased to zero at higher
temperatures. The carbon yield decreased from 0.42 (450ºC) to zero (550 –
950ºC), 1.81 (450ºC) to zero (650 – 950ºC) and 3.07 (450ºC) to zero (750ºC –
950ºC) for propane feed values of 0.5, 1.0 and 1.5 moles respectively. The
carbon yield in combined reforming of propane with increase in oxygen
addition was studied and the results were plotted in figure 6.10 (B2-B10). It
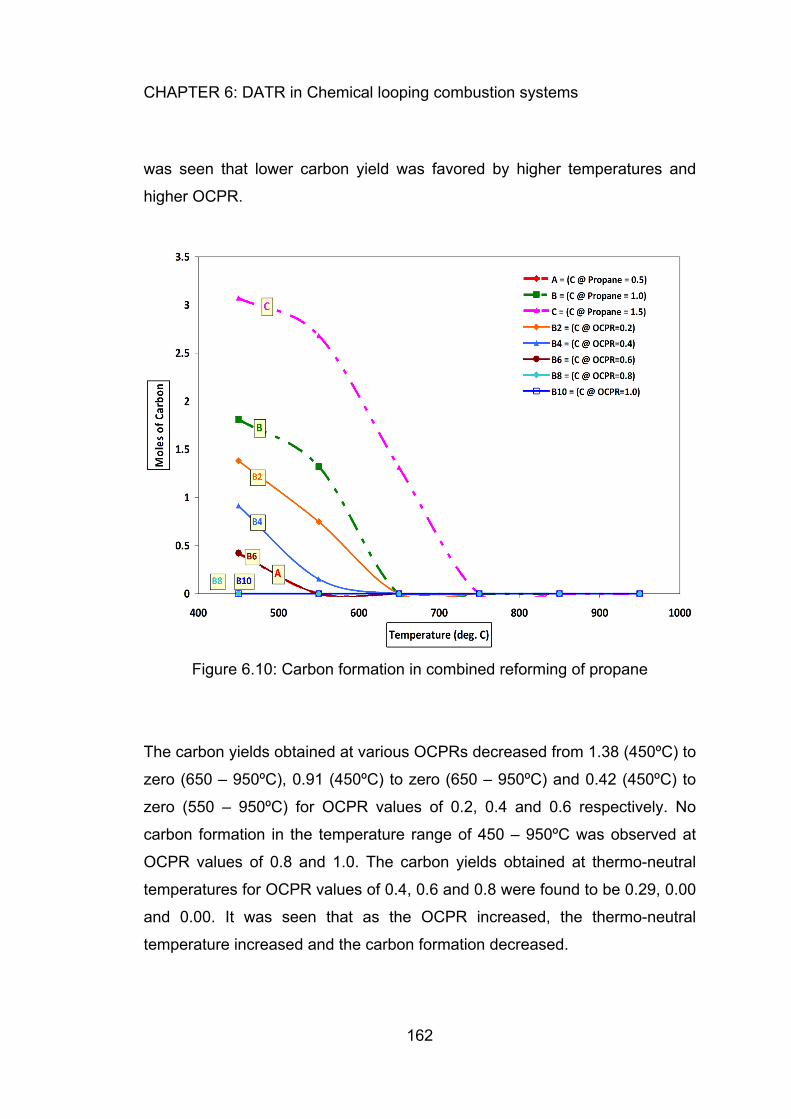
CHAPTER 6: DATR in Chemical looping combustion systems
162
was seen that lower carbon yield was favored by higher temperatures and
higher OCPR.
Figure 6.10: Carbon formation in combined reforming of propane
The carbon yields obtained at various OCPRs decreased from 1.38 (450ºC) to
zero (650 – 950ºC), 0.91 (450ºC) to zero (650 – 950ºC) and 0.42 (450ºC) to
zero (550 – 950ºC) for OCPR values of 0.2, 0.4 and 0.6 respectively. No
carbon formation in the temperature range of 450 – 950ºC was observed at
OCPR values of 0.8 and 1.0. The carbon yields obtained at thermo-neutral
temperatures for OCPR values of 0.4, 0.6 and 0.8 were found to be 0.29, 0.00
and 0.00. It was seen that as the OCPR increased, the thermo-neutral
temperature increased and the carbon formation decreased.

CHAPTER 6: DATR in Chemical looping combustion systems
163
6.3.10 H2O conversion
Water is one of the feed components to the DATR reactor. In the DATR,
maximizing CO2 conversion is essential, but water conversion can also lead to
maximize syngas yield. Water formation is also imminent in reforming
processes. Hence process conditions for maximizing water conversion and
minimizing water formation in such processes are also important study points.
The H2O conversion in DATR of propane was studied for molar feed values of
C3H8 varying from 0.5 to 1.5, without oxygen and the results were plotted in
figure 6.11 (A-B-C). It was observed that the water conversion initially
increased, reached a maximum value and then decreased with increase in
CR temperature and higher propane feed required higher CR temperatures
yielding higher water conversion at those temperatures. Some negative water
conversion data points are also observed at lower CR temperature indicating
more water formation in the CR process at those points, however positive
water conversion is observed above 525ºC for all cases. The H2O conversion
for combined reforming of propane with oxygen addition at various OCPR
values was plotted in figure 6.11 (B2-B10). The H2O conversion plot showed
the similar variation as seen in case without oxygen addition but with much
lower conversion values for all OCPR cases. It was seen from the graph that
higher H2O conversions are favored at middle temperatures (500 – 700ºC)
and lower OCPR conditions. The water conversion values obtained at thermo-
neutral temperatures for OCPR values of 0.4, 0.6 and 0.8 were found to be
15.28, 7.25 and -29.39. Hence it was observed that as the OCPR increased,
the thermo-neutral temperature increased but the water conversion
decreased.
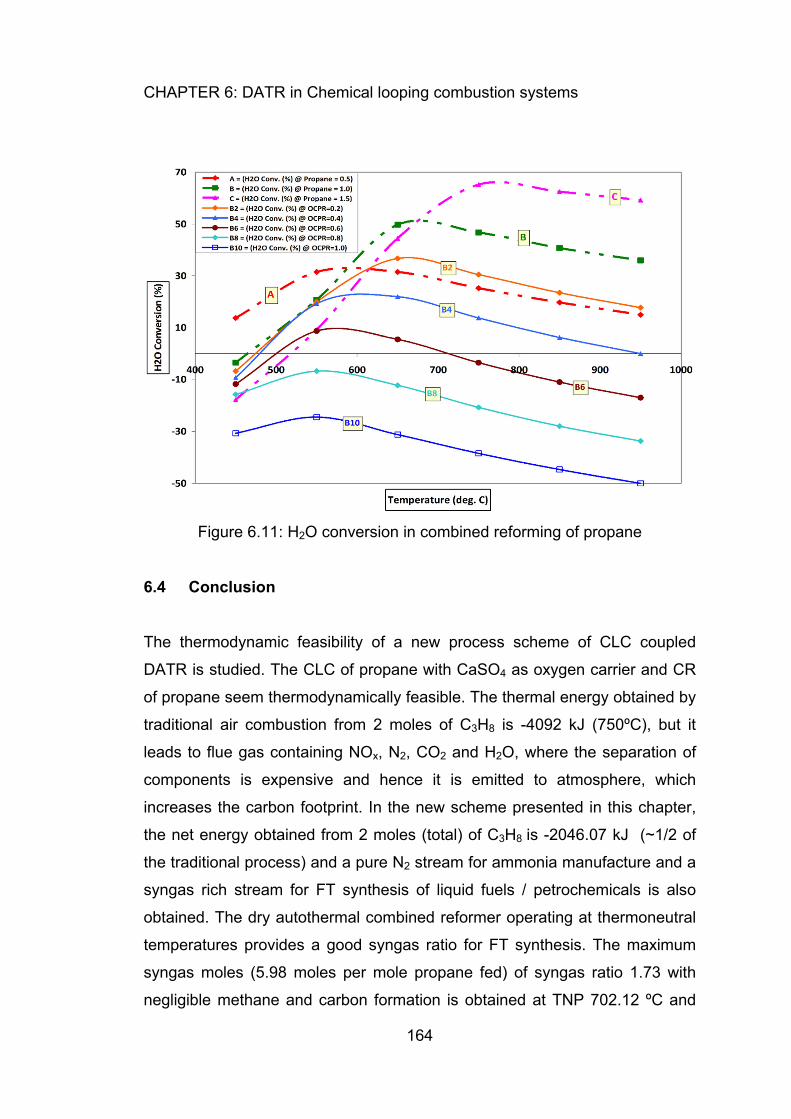
CHAPTER 6: DATR in Chemical looping combustion systems
164
Figure 6.11: H2O conversion in combined reforming of propane
6.4 Conclusion
The thermodynamic feasibility of a new process scheme of CLC coupled
DATR is studied. The CLC of propane with CaSO4 as oxygen carrier and CR
of propane seem thermodynamically feasible. The thermal energy obtained by
traditional air combustion from 2 moles of C3H8 is -4092 kJ (750ºC), but it
leads to flue gas containing NOx, N2, CO2 and H2O, where the separation of
components is expensive and hence it is emitted to atmosphere, which
increases the carbon footprint. In the new scheme presented in this chapter,
the net energy obtained from 2 moles (total) of C3H8 is -2046.07 kJ (~1/2 of
the traditional process) and a pure N2 stream for ammonia manufacture and a
syngas rich stream for FT synthesis of liquid fuels / petrochemicals is also
obtained. The dry autothermal combined reformer operating at thermoneutral
temperatures provides a good syngas ratio for FT synthesis. The maximum
syngas moles (5.98 moles per mole propane fed) of syngas ratio 1.73 with
negligible methane and carbon formation is obtained at TNP 702.12 ºC and

CHAPTER 6: DATR in Chemical looping combustion systems
165
this was identified as the best condition for the CR reactor operation. In DATR
combined reformer, the CO2 conversion is very important and it decreased
with increase in OCPR. Hence, lower OCPR and higher temperature seemed
optimum for CO2 conversion from the CLC stream. Lower OCPR would need
additional heat from CLC process. This might be permissible as the net heat
from CLC process is huge. Positive CO2 conversion is observed at C (all
cases), B (above 550ºC), A (above 650ºC), B2 (above 650ºC), B4 (above
750ºC), B6 (above 925ºC), while the enthalpy requirements for the process
operating above 650ºC are low in the order B6 > B4 > A > B2 > B > C. The
moles of syngas generated above 650ºC followed the pattern A < B6 < B4 <
B2 < B < C. It was concluded that higher CO2 conversion to syngas would
require higher energy from the CLC reactor. Operation of the DATR reactor
with OCPR 0.2 above 650ºC was found to be the best operating point from
view of balanced CO2 conversion – enthalpy requirements – syngas
generation with zero carbon and low methane formation. The process scheme
takes care of the hot CO2 and steam obtained in CLC to generate syngas,
thus solving the expensive CO2 sequestration issue. This process scheme
can be used for a variety of fossil fuels.
6.5 References
Abad A., Mattisson T., Lyngfelt A., Rydén M., 2006, Chemical-looping
combustion in a 300W continuously operating reactor system using a
manganese-based oxygen carrier, Fuel, 85(9), 1174–1185.
Adanez J., De Diego L.F., Garcia-Labiano F., Gayán P., Abad A., Palacios
J.M., 2004, Selection of oxygen carriers for chemical-looping combustion,
Energy Fuel, 18(2), 371–377.
CHAPTER 6: DATR in Chemical looping combustion systems
166
Blanchard J., Oudghiri-Hassani H., Abatzoglou N., Jankhah S., Gitzhofer F.,
2008, Synthesis of nanocarbons via ethanol dry reforming over a carbon steel
catalyst, Chem. Eng. J., 143(1), 186-194.
Cho P., Mattisson T., Lyngfelt A., 2004, Comparison of iron-, nickel-, copper-
and manganese-based oxygen carriers for chemical-looping combustion,
Fuel, 83(9), 1215–1225.
Cho P., Mattisson T., Lyngfelt A., 2005, Carbon formation on nickel and iron
oxide containing oxygen carriers for chemical-looping combustion, Indus. Eng.
Chem. Res., 44(4), 668–676.
Choudhary V.R., Mondal K.C., 2006, CO2 reforming of methane combined
with steam reforming or partial oxidation of methane to syngas over NdCoO3
perovskite-type mixed metal-oxide catalyst, Appl. Energy, 83(9), 1024–1032.
De Diego L.F., García-Labiano F., Adánez J., Gayán P., Abad A., Corbella
B.M., 2004, Development of Cu-based oxygen carriers for chemical-looping
combustion, Fuel, 83(13), 1749–1757.
HSC Chemistry [software], version 5.1, 2002, Pori: Outokumpu Research, Oy.
Ishida M., Jin H., Okamoto T., 1996, A fundamental study of a new kind of
medium material for chemical-looping combustion, Energy Fuel, 10(4), 958–
963.
Ishida M., Jin H., Okamoto T., 1998, Kinetic behavior of solid particle in
chemical looping combustion: suppressing carbon deposition in reduction,
Energy Fuel, 12(2), 223–229.

CHAPTER 6: DATR in Chemical looping combustion systems
167
Jankhah S., Abatzoglou N., Gitzhofer F., 2008, Thermal and catalytic dry
reforming and cracking of ethanol for hydrogen and carbon nanofilaments'
production, Int. J. Hydrogen Energy, 33(18), 4769-4779.
Jin H., Okamoto T., Ishida M., 1998, Development of a novel chemical-looping
combustion: synthesis of a looping material with a double metal oxide of
CoO–NiO, Energy Fuel, 12(6), 1272–1277.
Jin H., Okamoto T., Ishida M., 1999, Development of a novel chemical-looping
combustion: synthesis of a solid looping material of NiO/NiAl2O4, Indus. Eng.
Chem. Res., 38(1), 126–132.
Johansson E., Mattisson T., Lyngfelt A., Thunman H., 2006, A 300W
laboratory reactor system for chemical-looping combustion with particle
circulation, Fuel, 85(10–11), 1428–1438.
Le H., Hoang T., Mallinson R., Lobban L., 2004, Combined steam reforming
and dry reforming of methane using AC discharge, Stud. Surf. Sci. Catal.,
147, 175–180.
Li Y., Wang Y., Zhang X., Mi Z., 2008, Thermodynamic analysis of
autothermal steam and CO2 reforming of methane, Int. J. Hydrogen Energy,
33(10), 2507–2514.
Lyngfelt A., Leckner B., Mattisson T., 2001, A fluidized-bed combustion
process with inherent CO2 separation; application of chemical-looping
combustion, Chem. Eng. Sci., 56(10), 3101–3113.
Maestri M., Vlachos D.G., Beretta A., Groppi G., Tronconi E., 2008, Steam
and dry reforming of methane on Rh: microkinetic analysis and hierarchy of
kinetic models, J. Catal., 259(2), 211–222.

CHAPTER 6: DATR in Chemical looping combustion systems
168
Mattisson T., Lyngfelt A., Cho P., 2001, The use of iron oxide as an oxygen
carrier in chemical-looping combustion of methane with inherent separation of
CO2, Fuel, 80(13), 1953–1962.
Mattisson T., Järdnäs A., Lyngfelt A., 2003, Reactivity of some metal oxides
supported on alumina with alternating methane and oxygen – application for
chemical looping combustion, Energ Fuel, 17(3), 643–651.
Mattisson T., Johansson M., Lyngfelt A., 2004, Multicycle reduction and
oxidation of different types of iron oxide particles-application to chemical-
looping combustion, Energy Fuel, 18(3), 628–637.
Mattisson T., Johansson M., Lyngfelt A., 2006, The use of NiO as an oxygen
carrier in chemical-looping combustion, Fuel, 85(5–6), 736–747.
Michael B.C., Donazzi A., Schmidt L.D., 2009, Effects of H2O and CO2
addition in catalytic partial oxidation of methane on Rh., J. Catal., 265(1),
117–129.
Naqvi S., Johnson E., 2004, Reforming: syngas solution?, EuroChem News,
81, (2116):21.
Panczyk M., Giecko G., Gac W., Pasieczna S., Stasinska B., Borowiecki T.,
2001, Nickel promoted catalysts in the reforming of n-butane with CO2 or H2O,
Adsorpt. Sci. Technol., 19(6), 455–464.
Qin D., Lapszewicz J., 1994, Study of mixed steam and CO2 reforming of CH4
to syngas on MgO-supported metals, Catal. Today, 21(2–3), 551–560.
Smith W.R., 1996, Computer software reviews, HSC chemistry for windows,
2.0, J. Chem. Inf. Comput. Sci., 36(1), 151–152.
CHAPTER 6: DATR in Chemical looping combustion systems
169
Song C., Pan W., Srimat S.T., Zheng J., Li Y., Wang Y.H., 2004, Tri-reforming
of methane over Ni catalysts for CO2 conversion to Syngas with desired
H2/CO ratios using flue gas of power plants without CO2 separation, Stud.
Surf. Sci. Catal., 153, 315–322.
Tomishige K., Nurunnabi M., Maruyama K., Kunimori K., 2004, Effect of
oxygen addition to steam and dry reforming of methane on bed temperature
profile over Pt and Ni catalysts. Fuel Process. Technol., 85(8–10) 1103–1120.
Villa R., Cristiani C., Groppi G., Lietti L., Forzatti P., Cornaro U., 2003, Ni
based mixed oxide materials for CH4 oxidation under redox cycle conditions,
J. Mol. Catal. A: Chem., 204/205, 637–646.
York A.P.E., Xiao T.C., Green M.L.H., Claridge J.B., 2007, Methane
oxyforming for synthesis gas production, Catal. Rev. Sci. Eng., 49(4), 511–
560.

Chapter 7
Concluding remarks
CHAPTER 7: Concluding remarks
171
7.1 Conclusions
In this doctorial thesis, we were successful in establishing the thermodynamic
feasibility of dry autothermal reforming in many industrial sectors with
important applications. This thermodynamic analysis vital step was successful
in establishing process feasibility to mark the domain of process operation,
evaluate the trends of product compositions and also find the optimum
operating conditions. The DATR process theme can be used for CO2
utilization to produce syngas that has many uses. The thermodynamics of the
DATR process was successfully studied using a variety of fuels and the
results obtained can pitch for the process and catalyst development programs
to make the DATR process commercial similar to the steam and autothermal
reforming processes. Steam addition to DATR also produced positive results
in specific cases. This research work also focused on the important aspects of
thermoneutral conditions in autothermal processes taking the example of
DATR. The available literature on “thermoneutral conditions in autothermal
processes” is very limited and hence the research work related to the
thermoneutral conditions in DATR, presented in this work, can be used as
guideline for different autothermal processes. The results obtained in this
work are highly encouraging to start further R & D in this area.
7.2 Recommendations
Although thermodynamics is a basic step for process feasibility analysis, the
later steps of catalyst and process development can be started provided the
results of the thermodynamic analysis are encouraging for process
development. Since thermodynamics defines the maximum possible
conversions and product yield for the specific feed conditions, the data
presented in the thesis can be used as benchmark for catalyst development
programs. These steps can vary from fuel to fuel and system to system can
themselves form the basis for future research thesis programs. For e.g. the

CHAPTER 7: Concluding remarks
172
dry autothermal reforming of glycerol can further researched branching into
catalyst development, reactor development and bench scale process
development and can form a future thesis work. Similarly the other chapters
can be extended to further thesis works.
7.3 Publications from the work done in this thesis
Kale G.R., Kulkarni B.D., 2010, Thermodynamic analysis of dry autothermal
reforming of glycerol, Fuel Processing Technology, 91, 520-530.
Kale G.R., Kulkarni B.D., 2010, Thermoneutral point analysis of ethanol dry
autothermal reforming, Chemical Engineering Journal, 165, 864-873.
Kale G.R., Kulkarni B.D., 2011, An alternative process for gasoline fuel
processors, International Journal of Hydrogen Energy, 36, 2118-2127.
Kale G.R., Kulkarni B.D., Chavan R.N., 2014, Combined gasification of lignite
coal: A thermodynamic study, Journal of the Taiwan Institute of Chemical
Engineers (Elsevier), 45, 163-173.
Kale G.R., Kulkarni B.D., Joshi A.R, 2010, Thermodynamic study of
combining chemical looping combustion and combined reforming of propane,
Fuel, 89, 3141–3146.
Kale G.R., Sonar S.S., 2011, Combined reforming of chemical looping
combustion products: A thermodynamic analysis, Chemical Technology: An
Indian Journal, 6(2), 98-106.