drug management in crrt - crrtonline management in crrt jeffrey lipman, fjficm, md department of...
TRANSCRIPT
Drug Management in CRRT
Jeffrey Lipman, FJFICM, MD Department of Intensive Care Medicine
Royal Brisbane Hospital University of Queensland
Bruce A. Mueller, PharmD, FCCP, FASN Clinical, Social & Administrative Pharmacy Dept.
College of Pharmacy
University of Michigan
Overview
Pharmacokinetics
Extracorporeal drug removal
Pharmacodynamics
Practical guidelines
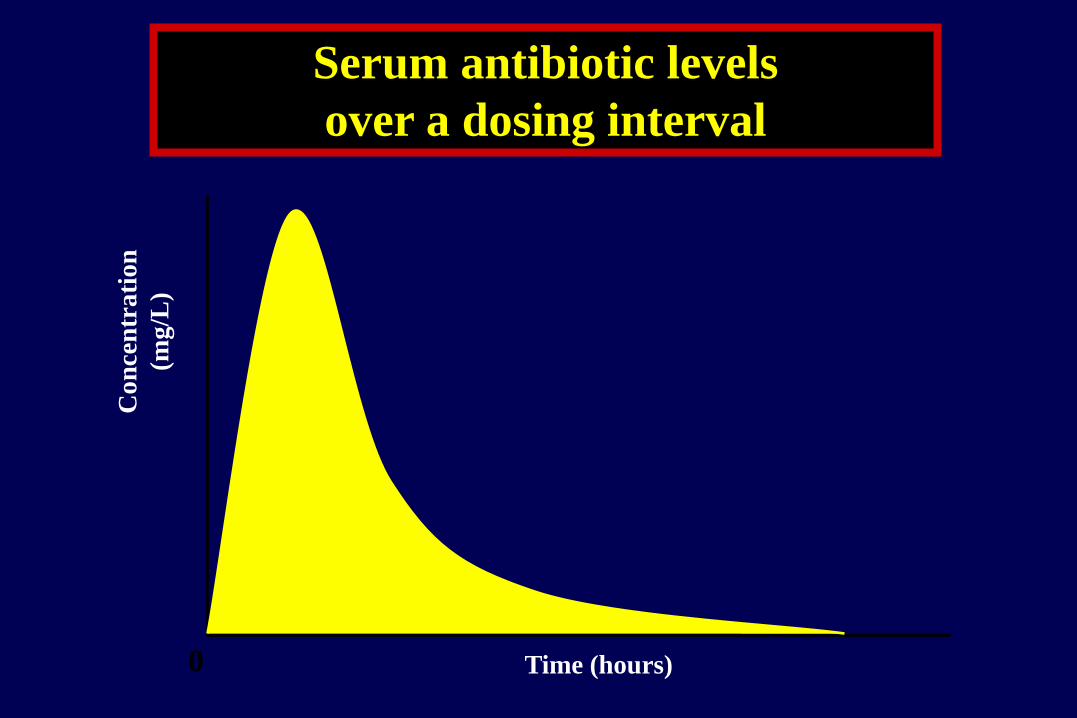
Serum antibiotic levels
over a dosing interval C
on
cen
tra
tion
(mg
/L)
Time (hours) 0

Pharmacokinetics = what the body does to the drug.
It describes the fundamental processes of ADME
Absorption
Distribution
Metabolism
Elimination

Pharmacokinetic Terms
Volume of distribution (Vd)
Protein binding (PB)
Clearance (Cl)
Half-life (t1/2)
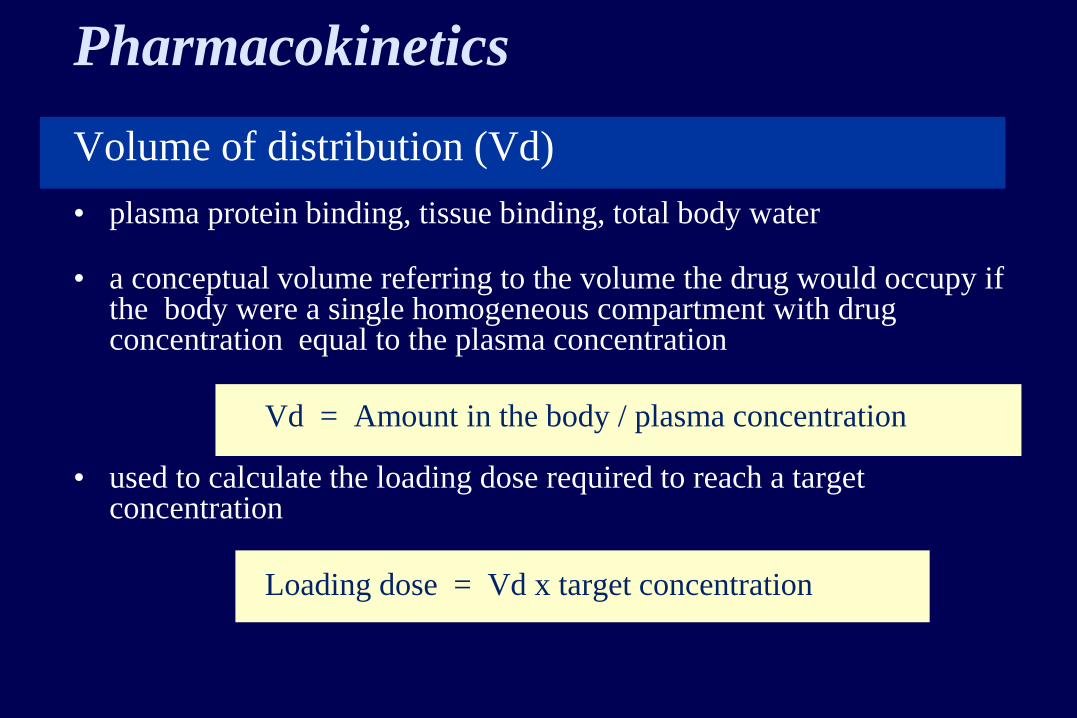
Pharmacokinetics
Volume of distribution (Vd)
• plasma protein binding, tissue binding, total body water • a conceptual volume referring to the volume the drug would occupy if
the body were a single homogeneous compartment with drug concentration equal to the plasma concentration
Vd = Amount in the body / plasma concentration • used to calculate the loading dose required to reach a target
concentration
Loading dose = Vd x target concentration
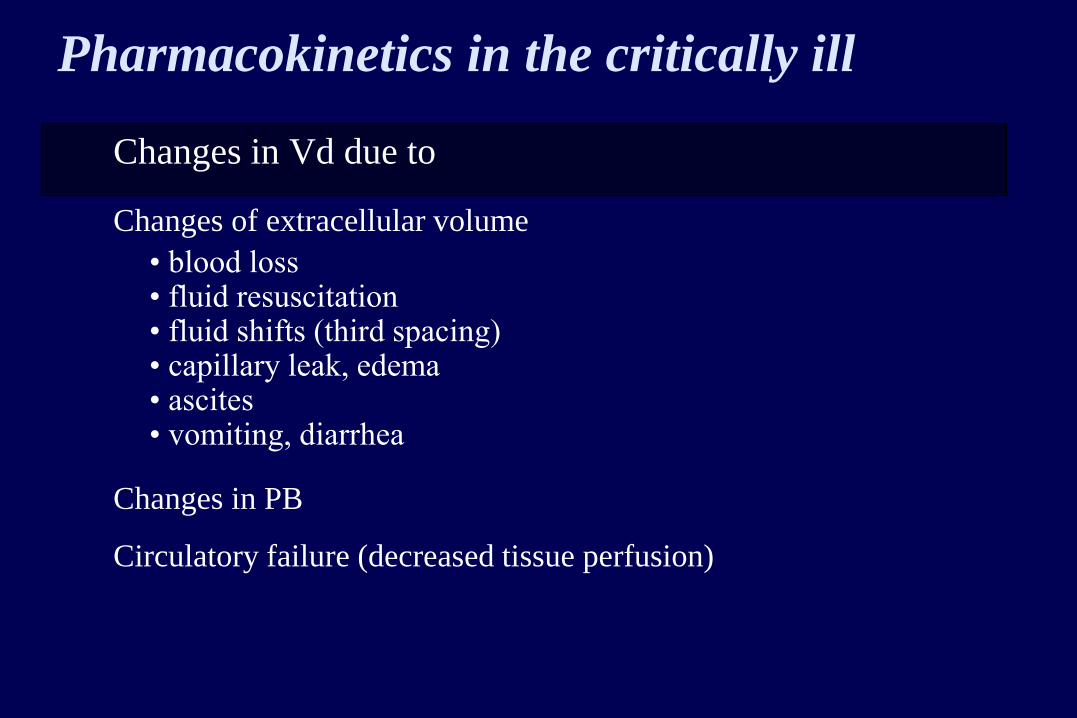
Pharmacokinetics in the critically ill
Changes in Vd due to Changes of extracellular volume
• blood loss • fluid resuscitation • fluid shifts (third spacing) • capillary leak, edema • ascites • vomiting, diarrhea Changes in PB Circulatory failure (decreased tissue perfusion)
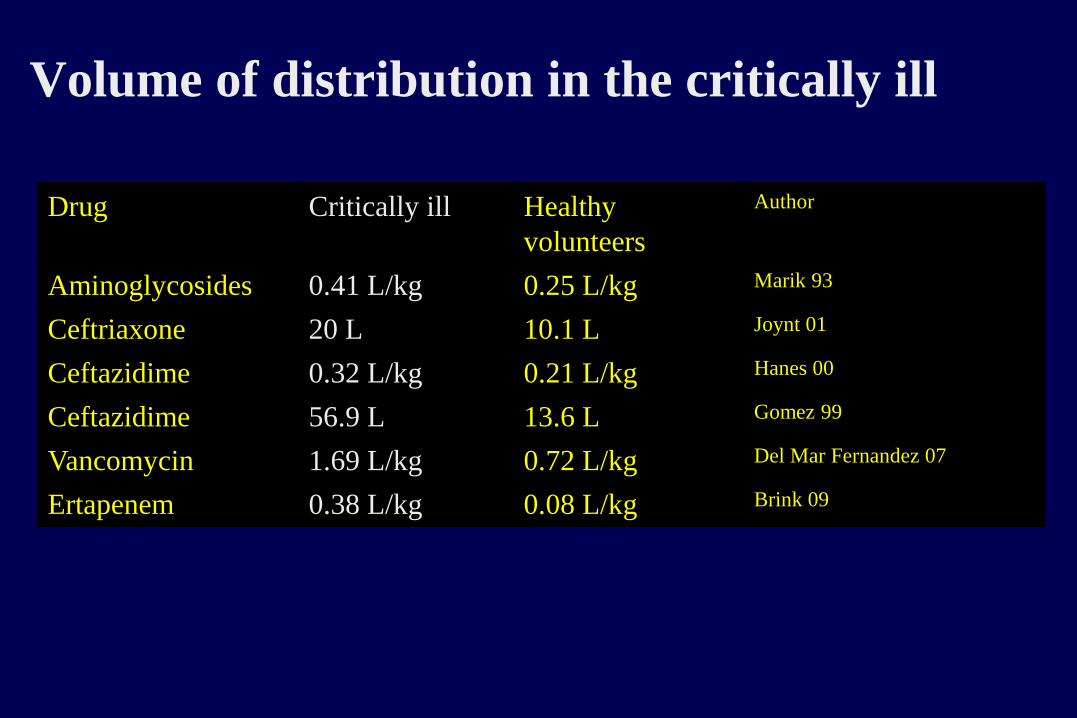
Volume of distribution in the critically ill
Drug Critically ill Healthy
volunteers
Author
Aminoglycosides 0.41 L/kg 0.25 L/kg Marik 93
Ceftriaxone 20 L 10.1 L Joynt 01
Ceftazidime 0.32 L/kg 0.21 L/kg Hanes 00
Ceftazidime 56.9 L 13.6 L Gomez 99
Vancomycin 1.69 L/kg 0.72 L/kg Del Mar Fernandez 07
Ertapenem 0.38 L/kg 0.08 L/kg Brink 09
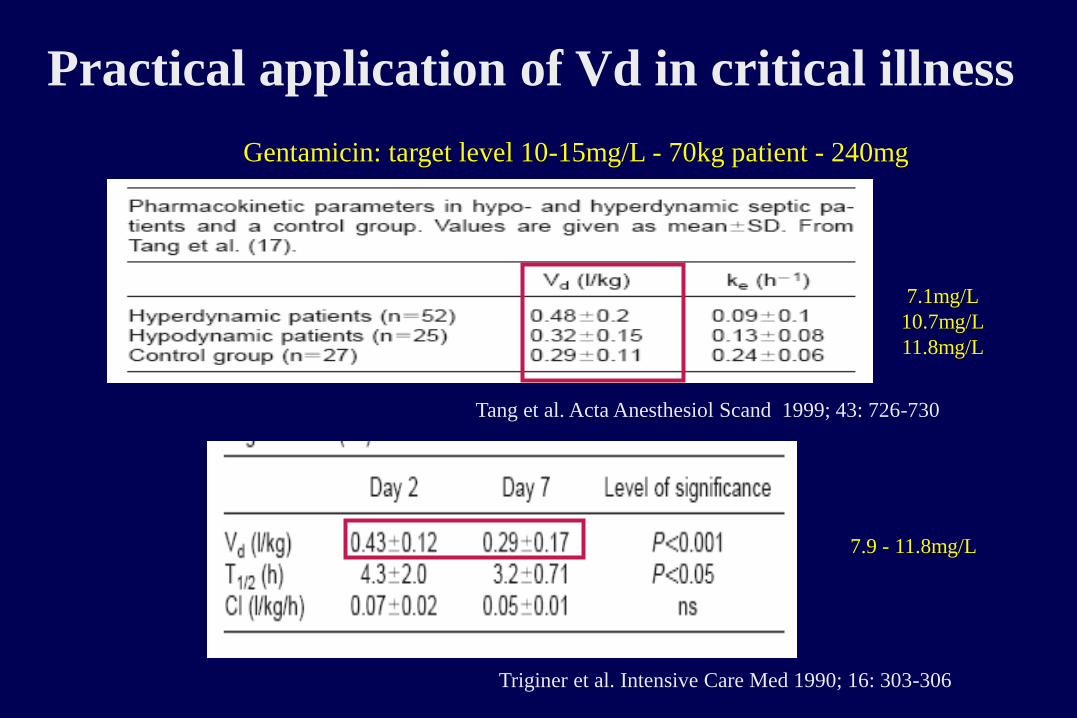
Triginer et al. Intensive Care Med 1990; 16: 303-306
Tang et al. Acta Anesthesiol Scand 1999; 43: 726-730
Practical application of Vd in critical illness
Gentamicin: target level 10-15mg/L - 70kg patient - 240mg
7.1mg/L
10.7mg/L
11.8mg/L
7.9 - 11.8mg/L

Volume Overload • Must increase loading dose for selected drugs
• As volume overload is corrected, doses must change again
10
CRRT is best RRT
choice for fluid overload
as volume is removed
continually
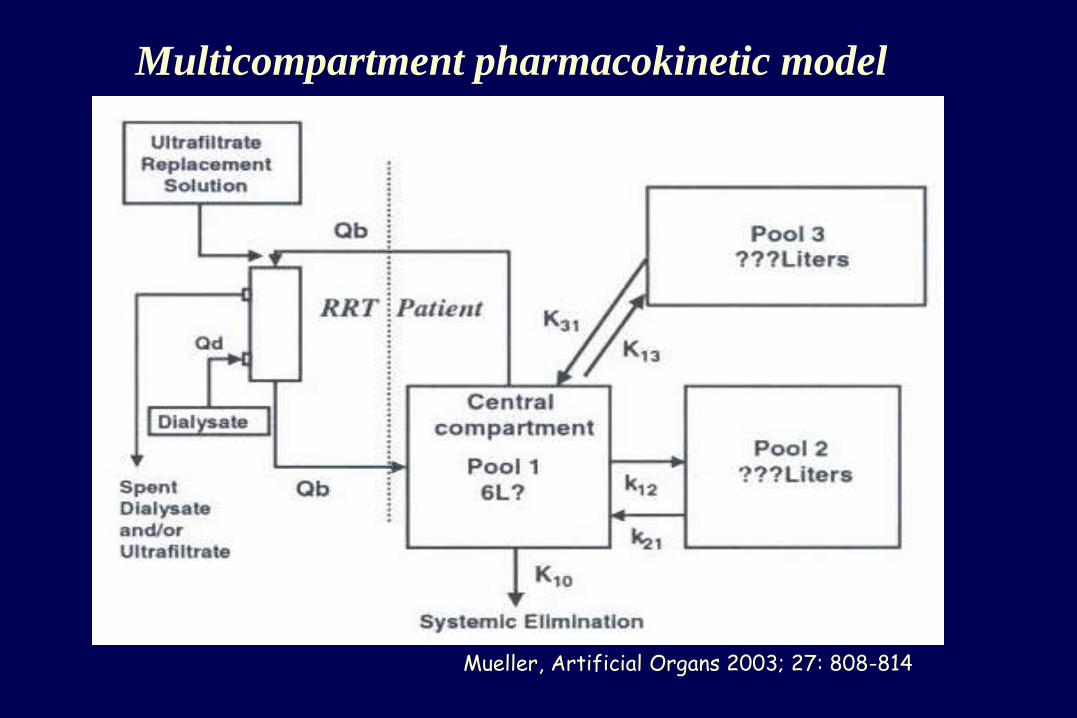
Multicompartment pharmacokinetic model
Mueller, Artificial Organs 2003; 27: 808-814

Pharmacokinetics
Protein binding (PB)
• determines the free fraction of a drug and hence the amount that is distributed, pharmacologically active at the tissue receptor sites, metabolised and excreted
• acidic drugs bind to albumin
• basic drugs bind to a1-acid glycoprotein

Pharmacokinetics in the critically ill
Changes in PB due to
• acidosis
• elevated FFA
• hypoalbuminemia = negative acute phase reactant
• increased a1-acid glycoprotein = acute phase reactant
• fever
• displacing substances (uremia with increased organic acids, bilirubin, other drugs)
Misinterpretation of drug monitoring results
Changes only important for drugs with high PB

Pharmacokinetics
Clearance (Cl)
• measures the intrinsic ability of the body to eliminate the drug from the blood or plasma
• only applies to drugs with first order kinetics (most drugs)
• defined as the volume completely cleared of the drug in unit time
• important for the calculation of the maintenance dose at steady state
Maintenance dose = Cl x Cp x t
Cp = desired plasma concentration
t = dosing interval
Pharmacokinetics
Clearance (Cl)
• total body Cl = sum of regional clearances (renal, metabolic and biliary)
• renal excretion = glomerular filtration + tubular secretion +
tubular reabsorption
• hepatic clearance depends on hepatic blood flow, protein
binding and enzymatic activity (intrinsic clearance)

Pharmacokinetics in the critically ill
Changes in extrarenal Cl
• decreased hepatic blood flow
• altered hepatic enzyme activity (hypoxemia, inflammatory mediators, hepatocellular damage, other drugs, hormones, stress, fever, age)
• renal failure alters metabolic transformation in both liver and kidney
Changes in metabolic clearance cannot be quantified by a single parameter such as creatinine clearance

Pharmacokinetics in the critically ill
Summary
often increased Vd
changes in PB
organ dysfunction resulting in decreased clearance
clearance may be increased in early hyperdynamic sepsis

Pharmacokinetics in the critically ill
Considerable intersubject variation already in healthy subjects
Important and dynamic changes in critical illness resulting in
still greater inter- and intrapatient variability

Extracorporeal
drug removal

Extracorporeal drug removal
1. Drug-membrane interactions
Gibbs-Donnan effect depending on drug charge drug binding to the membrane
eg. binding of aminoglycosides to AN69 (Kronfol 87)
saturation after 30-60 min effect of membrane surface area
effect of timing of drug administration relative to filter change?

Extracorporeal drug removal
Transfer through the membrane
Adsorption
Depends on drug and membrane characteristics (charge) e.g. AN69
has high adsorptive capacity and aminoglycosides are readily
adsorbed
Clinical significance?
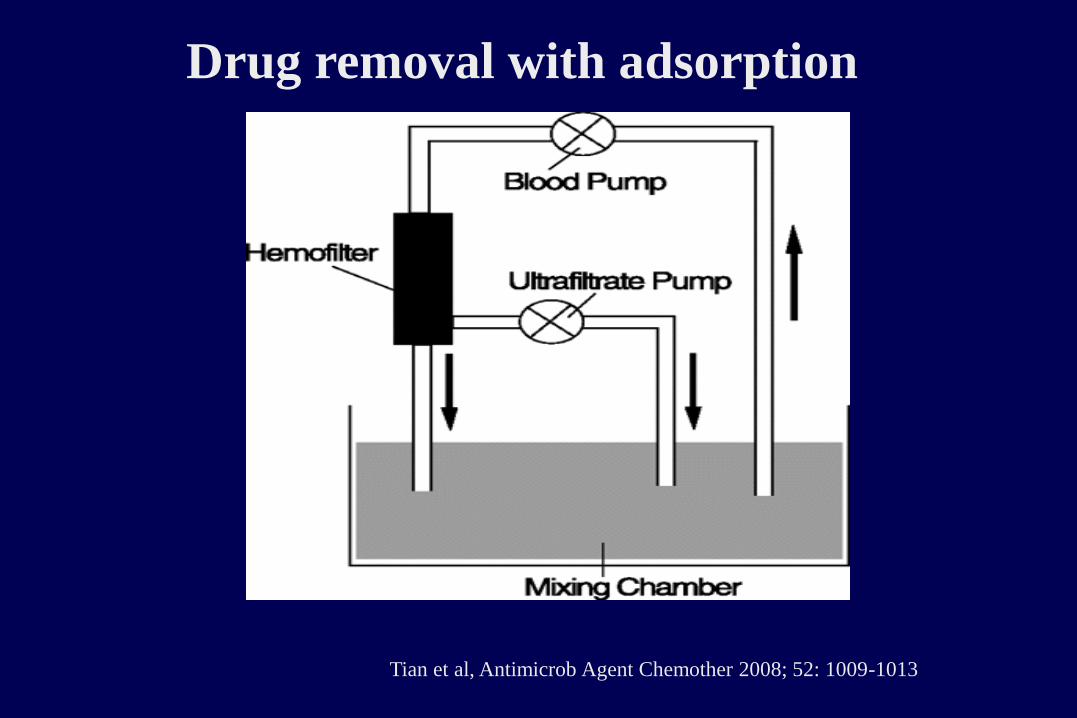
Drug removal with adsorption
Tian et al, Antimicrob Agent Chemother 2008; 52: 1009-1013
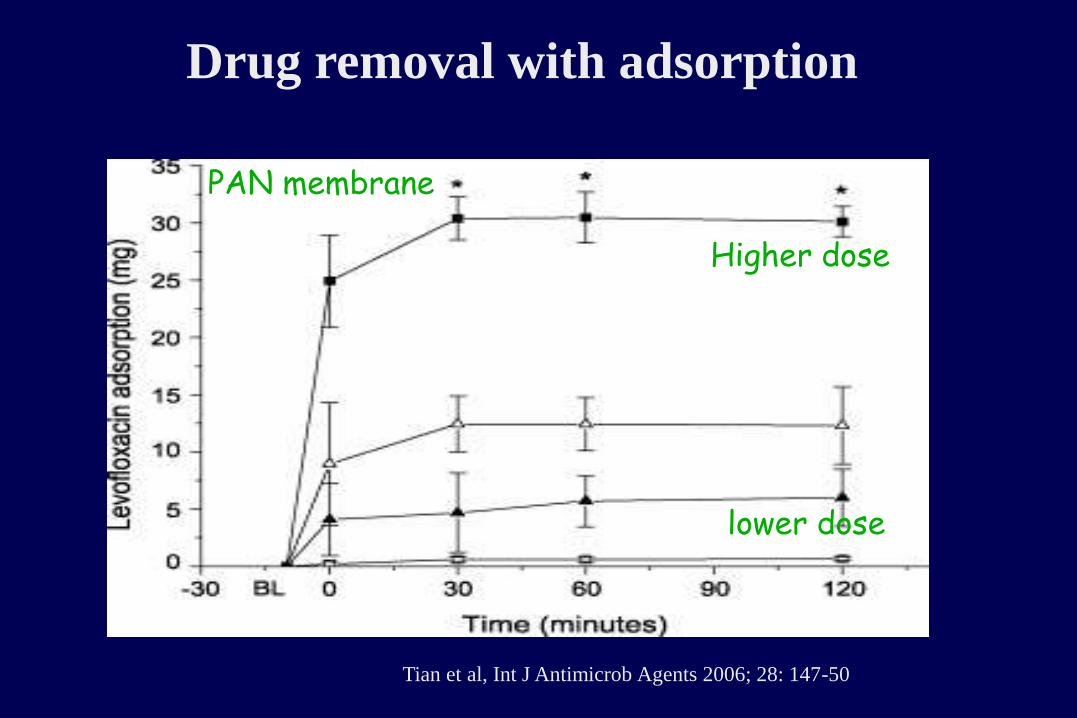
Drug removal with adsorption
Tian et al, Int J Antimicrob Agents 2006; 28: 147-50
Higher dose
PAN membrane
lower dose

Drug removal with adsorption
Tian et al, Artificial Organs 2008; 32: 81-84
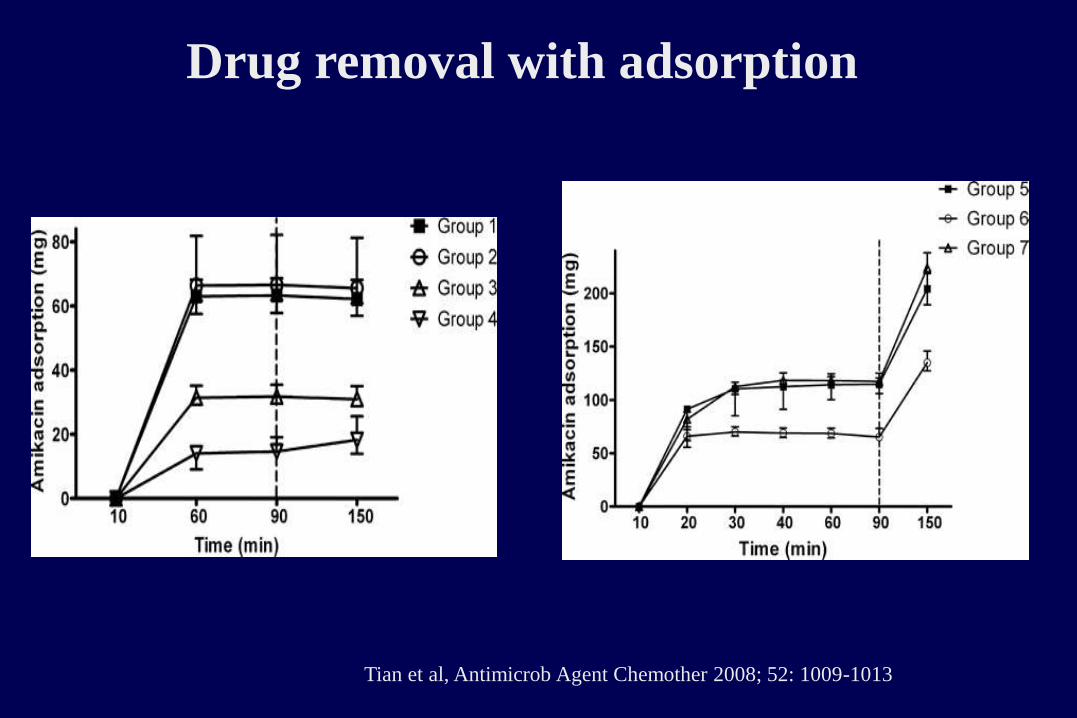
Drug removal with adsorption
Tian et al, Antimicrob Agent Chemother 2008; 52: 1009-1013

Mueller, Artificial Organs 2003; 27: 808-814
Extracorporeal drug removal
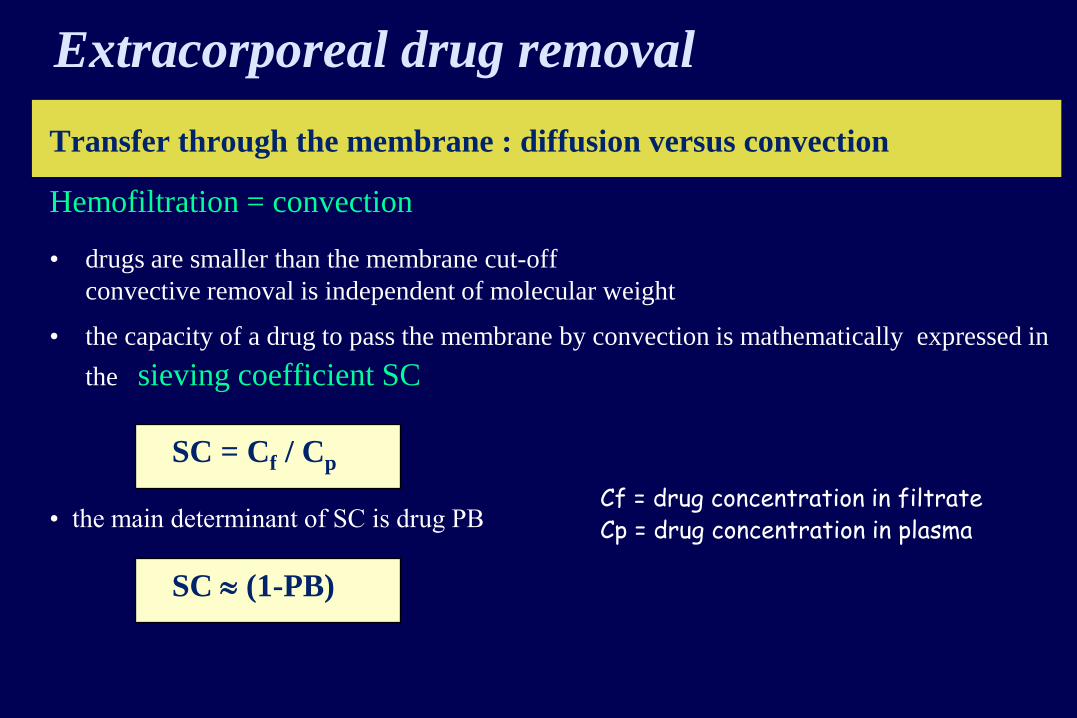
Transfer through the membrane : diffusion versus convection
Hemofiltration = convection
• drugs are smaller than the membrane cut-off
convective removal is independent of molecular weight
• the capacity of a drug to pass the membrane by convection is mathematically expressed in
the sieving coefficient SC
SC = Cf / Cp
• the main determinant of SC is drug PB
SC (1-PB)
Cf = drug concentration in filtrate Cp = drug concentration in plasma

Observed versus expected SC: antimicrobials Observed SC Expected SC Observed SC Expected SC
amikacin 0,88-0,95 0,95 ganciclovir 0.84 0.98
amphotericin B 0,3-0,4 0,10 gentamicin 0,81-0,85 0,95
anpho (liposom) 0.1 0.1 imipenem 0,78-1,16 0,8
ampicillin 0,69 0,80 meropenem 0.6-1.0 0.98
cefepime 0.72 0.82 metronidazole 0,80-0,86 0,80
cefoperazone 0.27 0.1 mezlocillin 0.71 0.98
cefotaxime 0,51-1,06 0,62 nafcillin 0.55 0.2
ceftazidime 0,75-0,93 0,83 netilmicin 0.93 0.95
ceftriaxone 0,2-0,82 0,15 oxacillin 0,02 0,05
cefuroxime 0,57-0,87 0,66 pefloxacin 0,42-0,80 0,80
cilastatin 0,75 0,56 penicillin 0,68-0,70 0,50
ciprofloxacin 0,5-1,02 0,6 piperacillin 0,82 0,80
clavulanic acid 1.69 0.7 sulfametoxazole 0,3-0,9 0,60
clindamycin 0,49 0,40 teicoplanin 0,05 0,1
doxycycline 0.4 0.2 ticarcillin 0.83 0.55
erythromycin 0,37-0,40 0,30 tobramycin 0.9 0.95
fluconazole 1,0 0,88 vancomycin 0,42-0,89 0,90
flucytosine 0,81 0,9
Adapted from Golper, Contrib Nephrol 2001;132:349-353
Extracorporeal drug removal
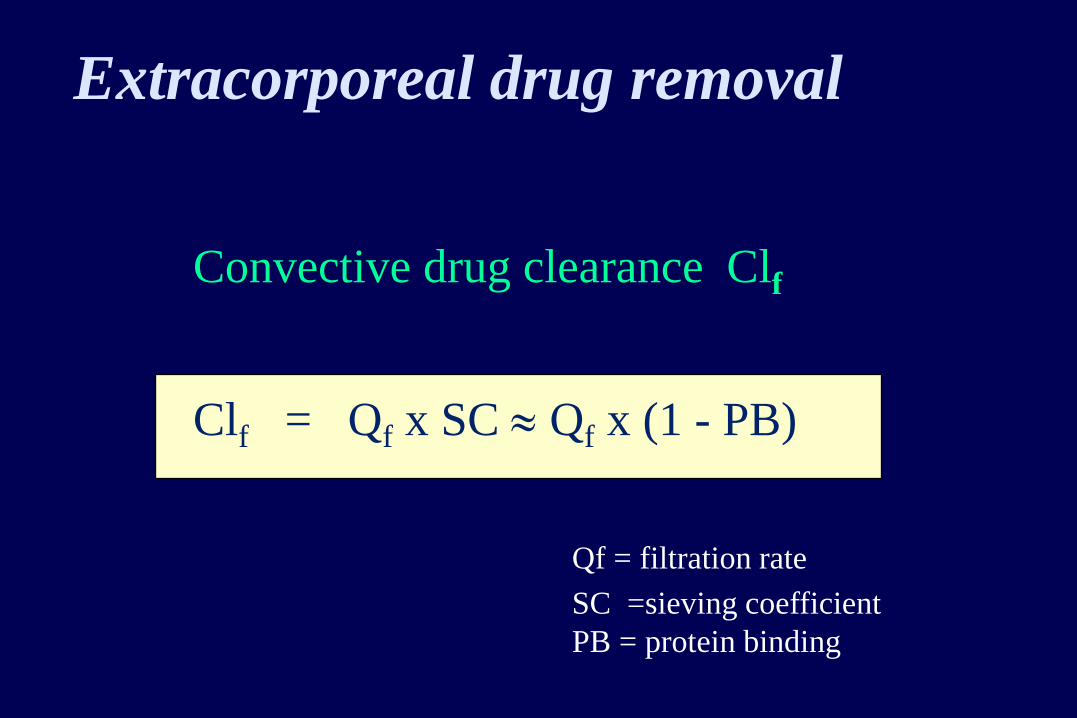
Convective drug clearance Clf
Clf = Qf x SC Qf x (1 - PB)
Qf = filtration rate
SC =sieving coefficient
PB = protein binding

Extracorporeal drug removal
predilution hemofiltration
Clf = Qf x (1 - PB) x
Qb = blood flow
Qs = prefilter substitution rate
Qb
Qb+Qs
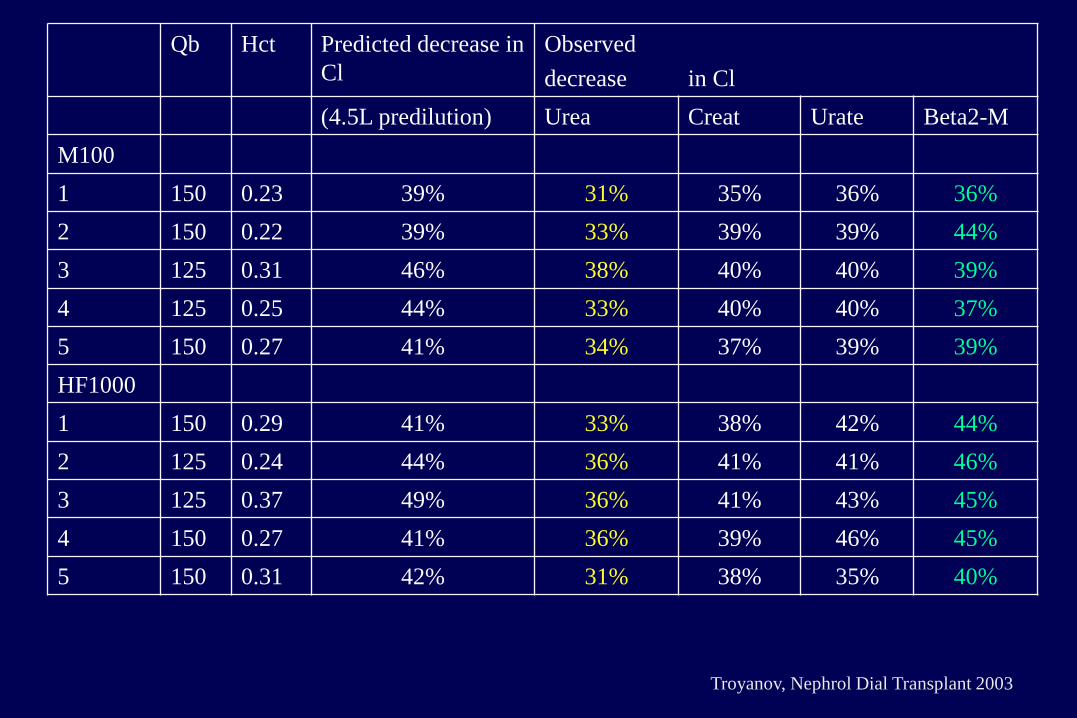
Qb Hct Predicted decrease in
Cl
Observed
decrease
in Cl
(4.5L predilution) Urea Creat Urate Beta2-M
M100
1 150 0.23 39% 31% 35% 36% 36%
2 150 0.22 39% 33% 39% 39% 44%
3 125 0.31 46% 38% 40% 40% 39%
4 125 0.25 44% 33% 40% 40% 37%
5 150 0.27 41% 34% 37% 39% 39%
HF1000
1 150 0.29 41% 33% 38% 42% 44%
2 125 0.24 44% 36% 41% 41% 46%
3 125 0.37 49% 36% 41% 43% 45%
4 150 0.27 41% 36% 39% 46% 45%
5 150 0.31 42% 31% 38% 35% 40%
Troyanov, Nephrol Dial Transplant 2003

Extracorporeal drug removal
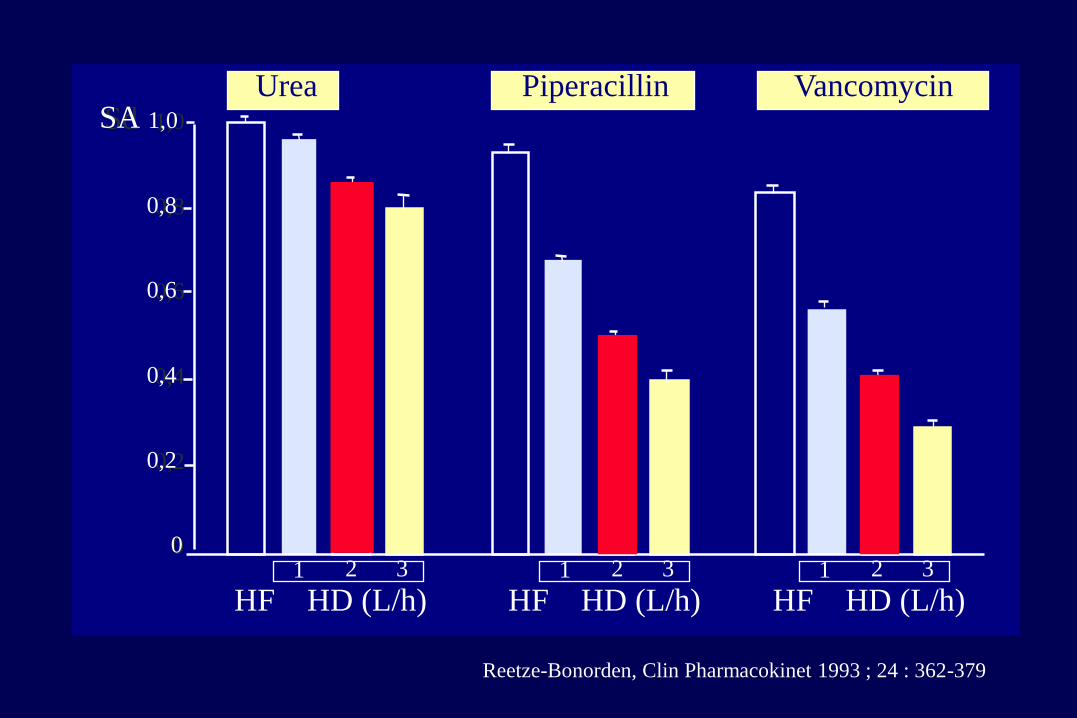
3. Transfer through the membrane : diffusion versus convection
Hemodialysis = diffusion
• diffusion is a molecular weight - dependent process
• the capacity of a drug to pass the membrane by diffusion is mathematically
expressed in the dialysate saturation Sa
Sa = Cd / Cp Cd = drug concentration in dialysate
Cp = drug concentration in plasma

Extracorporeal drug removal
3. Transfer through the membrane : diffusion versus convection Hemodialysis = diffusion • SA is determined by PB drug-membrane interactions drug molecular weight
membrane pore-size , thickness (flux) membrane surface area
dialysate flow (Qd) / blood flow (Qb) • in continuous hemodialysis : Qd <<< Qb complete equilibration of small drugs or SA (1-PB)
1,0
0,8
0,6
0,4
0,2
0
1,0
0,8
0,6
0,4
0,2
0 1 2 3
HF HD (L/h) HF HD (L/h) HF HD (L/h)
Urea Piperacillin Vancomycin
Reetze-Bonorden, Clin Pharmacokinet 1993 ; 24 : 362-379
Sd SA
1 2 3 1 2 3

Extracorporeal drug removal
3. Transfer through the membrane : diffusion versus convection
Hemodialysis = diffusion
Kd rel = Kd / Kdcreat = (MW/113) - 0.42
Kd = drug diffusive mass transfer coefficient
Kdcreat = creatinine diffusive mass transfer coefficient
MW = drug molecular weight
113 = molecular weight of creatinine
Vincent and Vos, 1993

Extracorporeal drug removal
CVVHD - Diffusive small drug clearance Cld
Cld = Qd x Sd Qd x (1 - PB)

3. transfer through the membrane : diffusion versus convection
hemodiafiltration = diffusion + convection clearance in continuous hemodiafiltration = Cldf
Cldf = Qf x S + Qd x Sd
(Qf + Qd) x (1-PB)
interaction between diffusion and convection resulting in overestimation of the combined clearance
Extracorporeal drug removal

Extracorporeal drug clearance
Summary
CVVH Cl = Qf x S Qf x (1-PB)
CVVHD Cl = Qd x Sd Qd x (1-PB)
CVVHDF Cl = Qf x S + Qd x Sd (Qf + Qd) x (1-PB)
Assumptions :
- protein binding is normal
- no drug-membrane interactions
- dialysate saturation independent of molecular weight
- dialysate saturation independent of dialysate flow
- no interaction between diffusion and convection

Calculated (Clc) versus measured (Clm) clearance
Qd 1l/h Qd 2l/h
Clmeas Clcalc Clmeas Clcalc
urea 22,02 23,30 33,46 40
cefuroxime 13,97 15,37 16,22 26,4
ceftazidime 13,11 19,30 15,24 33,2
ciprofloxacin 16,31 16,31 19,93 28
vancomycin 11,70 16,31 14,85 28
tobramycin 11,10 22,10 14,85 38
gentamicin 20,51 22,10 25,94 38
Clm from Davies, Contrib Nephrol 1991; 93 : 117-119
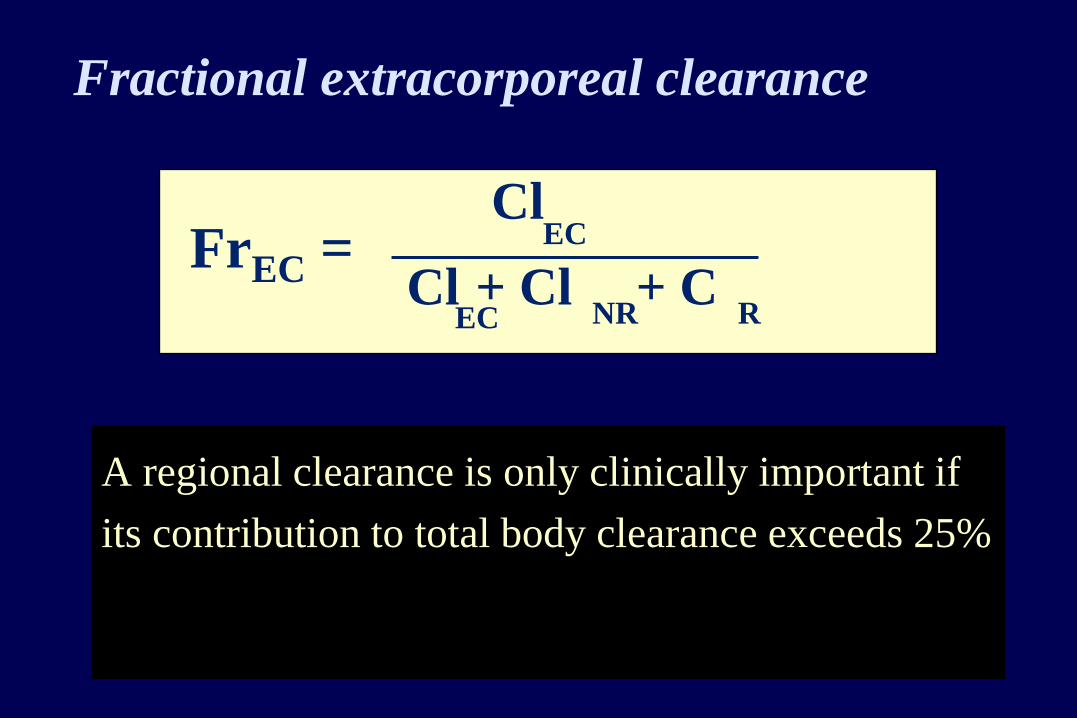
Fractional extracorporeal clearance
A regional clearance is only clinically important if
its contribution to total body clearance exceeds 25%
Cl EC
Cl + Cl NR
+ C R
EC
FrEC =

Extracorporeal drug elimination should
not be taken into account if
low extracorporeal clearance because of
• high protein binding
• low Qf or Qd
high non-extracorporeal clearance because of
• high extrarenal clearance
• high residual renal clearance
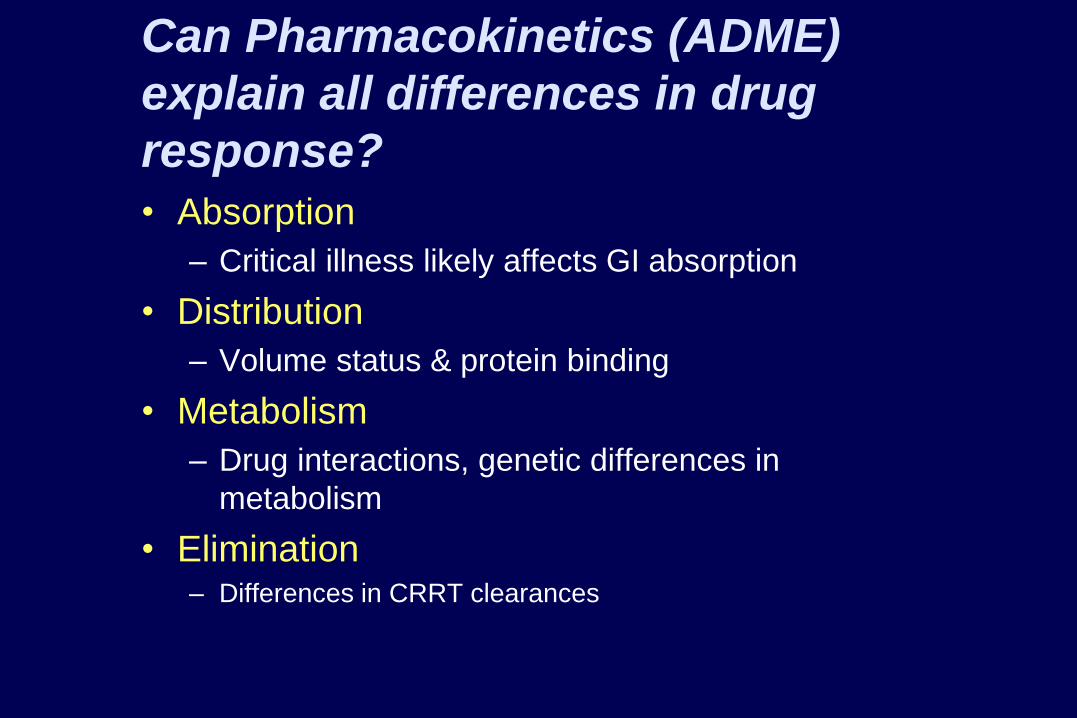
Can Pharmacokinetics (ADME)
explain all differences in drug
response?
• Absorption
– Critical illness likely affects GI absorption
• Distribution
– Volume status & protein binding
• Metabolism
– Drug interactions, genetic differences in
metabolism
• Elimination – Differences in CRRT clearances

Pharmacokinetics vs.
Pharmacodynamics • Pharmacokinetics
• “How the body processes a drug" resulting in a drug concentration in the body.
• ADME
• Removal by RRT = Pharmacokinetics
Figure from MJ Rybak.
CID 2006;42:S35-S39

Have You Observed
Pharmacodynamic Alterations in
Patients with AKI? • Tolerance documented for selected agents: dobutamine, loop diuretics;
fentanyl, alfentanil in burn patients, barbiturates in TBI patients.
– Wagner BKJ, O’Hara DA. Clin Pharmacokinet 1997;33:426-
63
• Seemingly poor response to “appropriately” dosed antibiotics
• Higher doses of EPO used in AKI vs. CKD

Why might pharmacodynamic response
differ between typical CRRT patients?
• Pharmacokinetics!
– Does 100 mg given to patient A yield the same serum
concentration as 100 mg given to patient B?
– More importantly, does it achieve the same concentration at
the “effect site”?
• Differences in ADME
– Absorption
– Distribution
– Metabolism
– Elimination

Co
nce
ntr
ati
on
(mg
/L)
Time (hours) 0
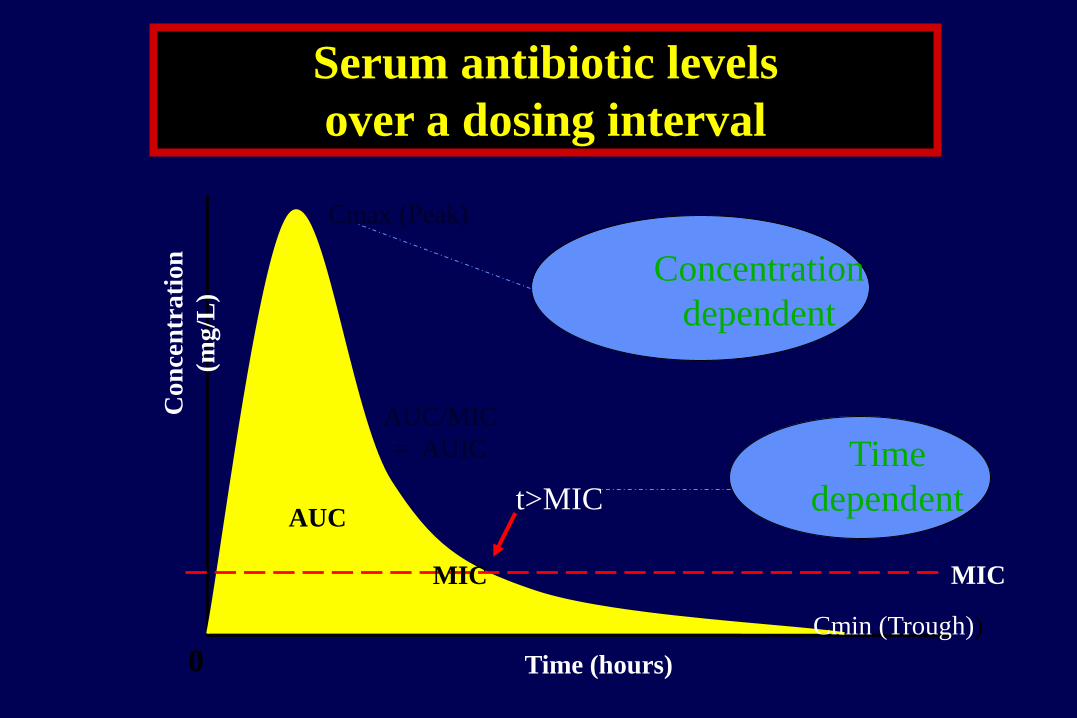
Cmin (Trough))
Cmax (Peak)
AUC
Serum antibiotic levels
over a dosing interval
Not shown here
t½
Vd
Cl
Protein binding

PD
(Pharmacodynamics)
• Pharmacodynamics correlates the
• concentration
• of the antibiotic with its
• ability to kill
• or inhibit the target pathogen
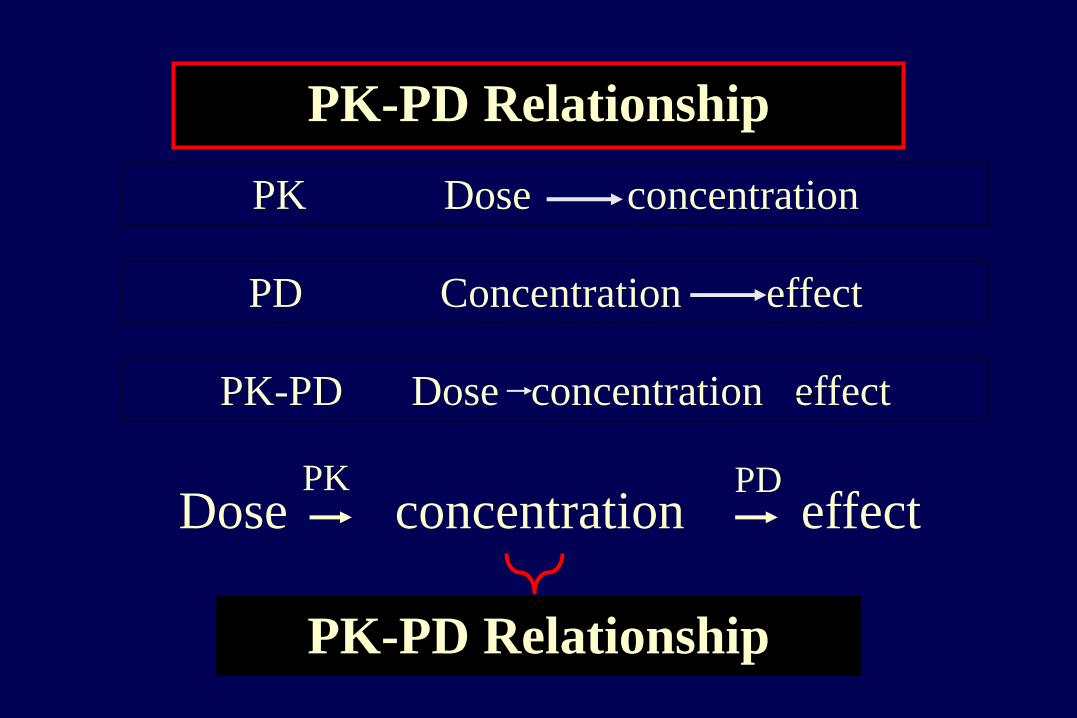
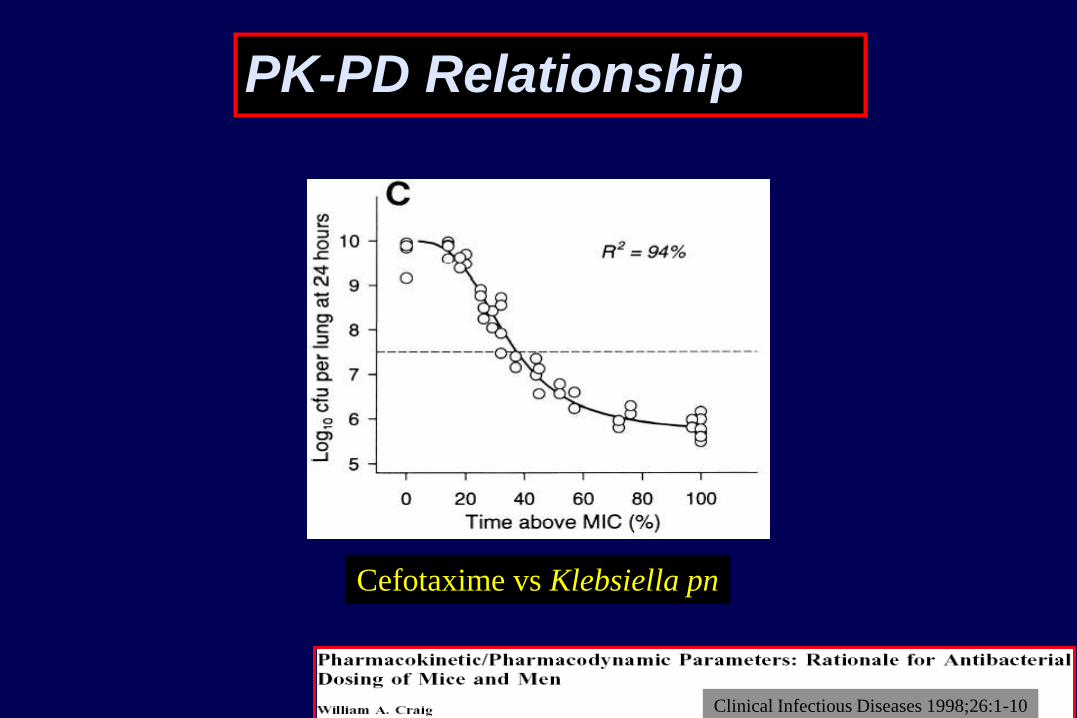
PK-PD Relationship
Dose PK PD
PK-PD Relationship
PK-PD Dose concentration effect
PD Concentration effect
PK Dose concentration
concentration effect
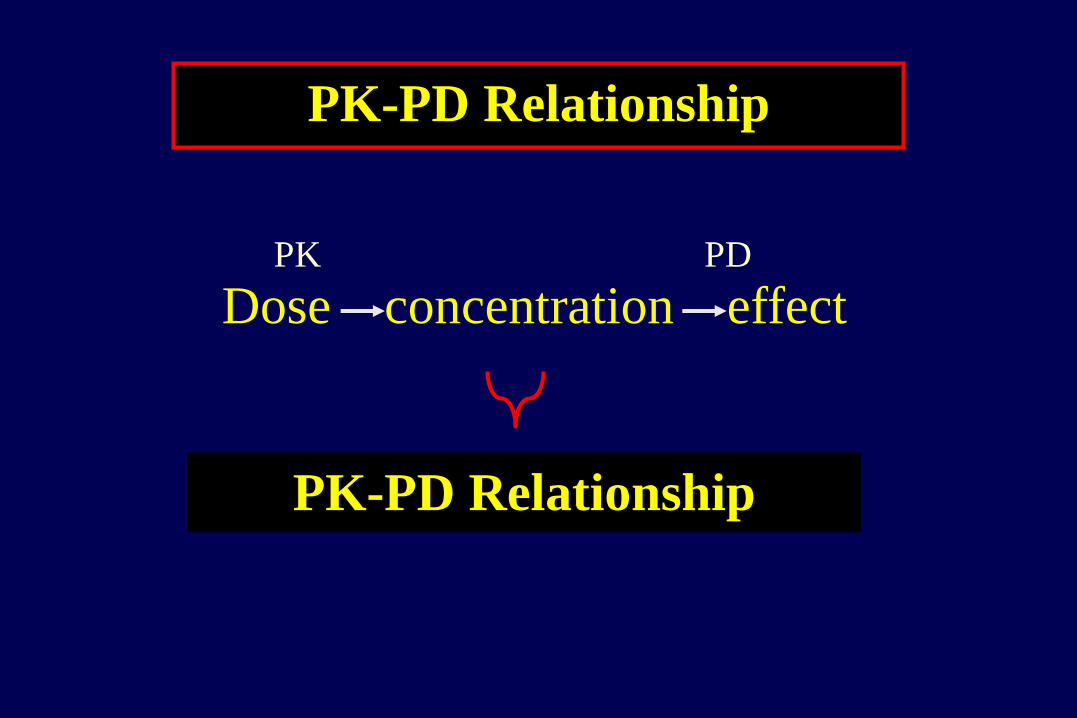
PK-PD Relationship
Dose concentration effect PK PD
PK-PD Relationship

PK-PD Relationship
Clinical Infectious Diseases 1998;26:1-10

PK-PD Relationship
Clinical Infectious Diseases 1998;26:1-10

PK-PD Relationship
Clinical Infectious Diseases 1998;26:1-10
PK-PD Relationship
Clinical Infectious Diseases 1998;26:1-10
Cefotaxime vs Klebsiella pn
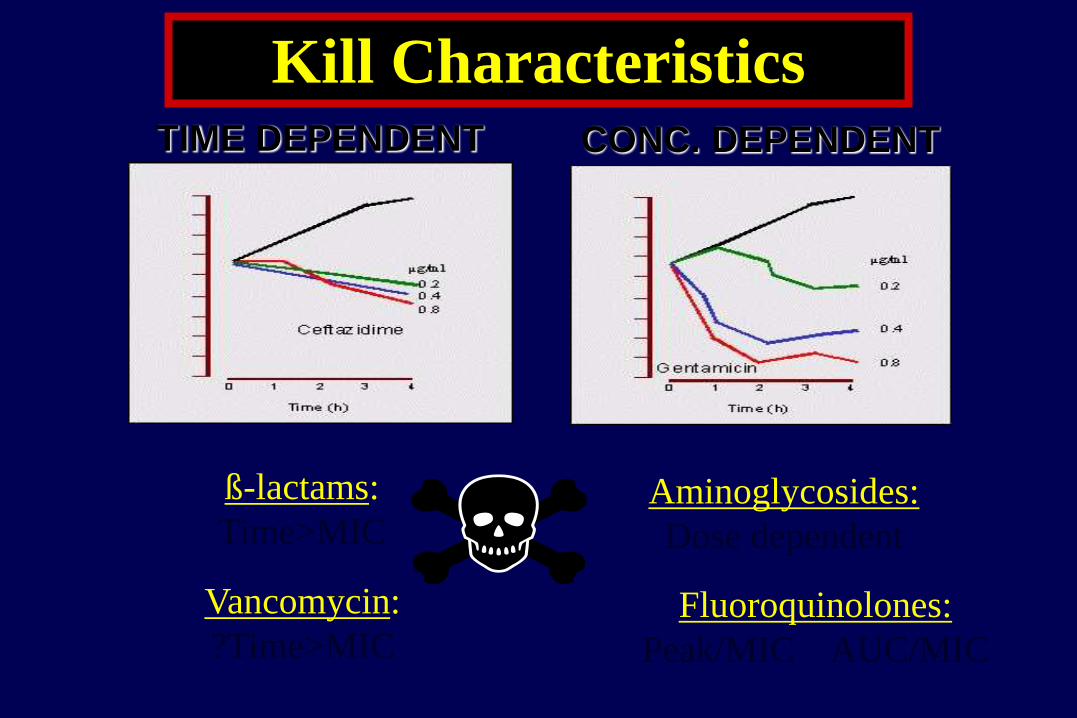
Kill Characteristics
ß-lactams:
Time>MIC Aminoglycosides:
Dose dependent
Vancomycin:
?Time>MIC Fluoroquinolones:
Peak/MIC AUC/MIC
TIME DEPENDENT CONC. DEPENDENT

Co
nce
ntr
ati
on
(mg
/L)
Time (hours) 0
Cmin (Trough))
Cmax (Peak)
MIC
AUC
MIC
t>MIC
AUC/MIC
= AUIC
Serum antibiotic levels
over a dosing interval
Co
nce
ntr
ati
on
(mg
/L)
Time (hours) 0
Cmin (Trough))
Cmax (Peak)
MIC
AUC
MIC
t>MIC
Time
dependent
Concentration
dependent
AUC/MIC
= AUIC
Serum antibiotic levels
over a dosing interval

Lode et al CID 1998;27:33-9
CIPROFLOXACIN
Forrest et al AAC 1993;37:1073-81

CIPROFLOXACIN
Forrest et al AAC 1993;37:1073-81
WHAT THIS SHOWS
IS THE HIGHER THE
AUIC THE BETTER
THE BACTERIAL KILL
NEED AUIC AT LEAST 125
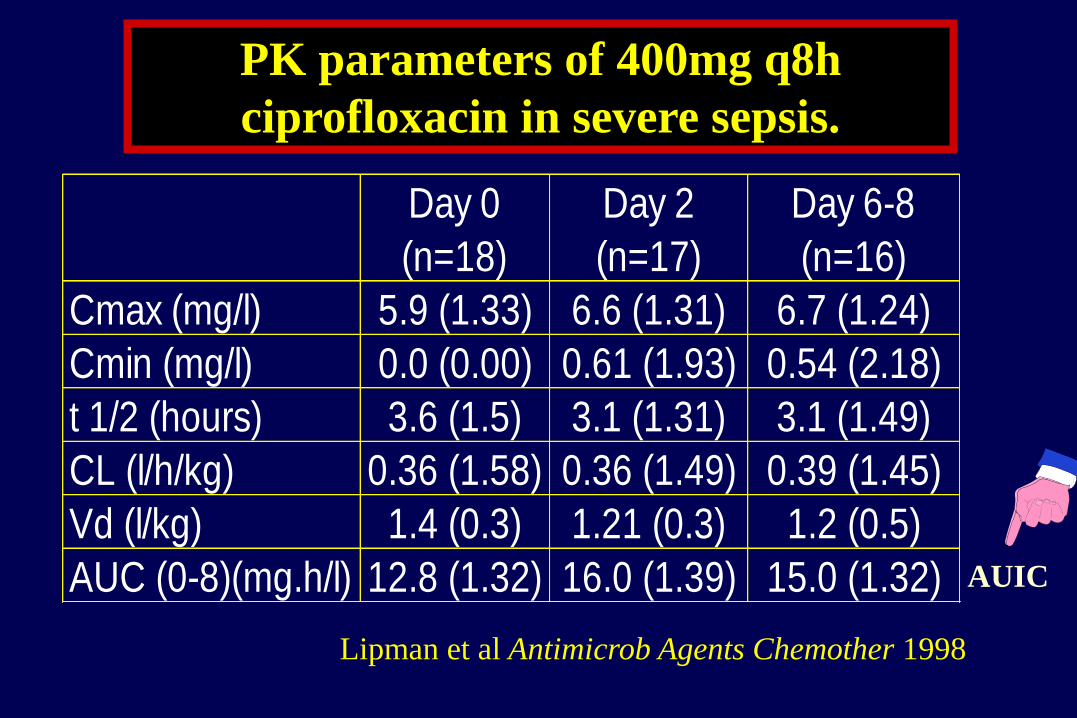
Day 0
(n=18)
Day 2
(n=17)
Day 6-8
(n=16)
Cmax (mg/l) 5.9 (1.33) 6.6 (1.31) 6.7 (1.24)
Cmin (mg/l) 0.0 (0.00) 0.61 (1.93) 0.54 (2.18)
t 1/2 (hours) 3.6 (1.5) 3.1 (1.31) 3.1 (1.49)
CL (l/h/kg) 0.36 (1.58) 0.36 (1.49) 0.39 (1.45)
Vd (l/kg) 1.4 (0.3) 1.21 (0.3) 1.2 (0.5)
AUC (0-8)(mg.h/l) 12.8 (1.32) 16.0 (1.39) 15.0 (1.32)
PK parameters of 400mg q8h
ciprofloxacin in severe sepsis.
Lipman et al Antimicrob Agents Chemother 1998
AUIC

LOW EXPOSURE
TO ANTIBIOTICS ENABLES
DEVELOPMENT OF RESISTANCE
Critical Care Medicine 2008;36:2433-40

ß-lactams have no Post Antibiotic Effect and no dose dependent kill
characteristics
ß-lactam bactericidal activity
• Correlates with the time above MIC
• Optimal time above MIC unknown
• ?100% of the dosing interval ?4-5 times MIC
• Serum conc < MIC for 61% of the dosing interval resistance
• No resistance when serum conc > MIC for longer than 61% of dosing interval
ß-LACTAMS Penicillins, cephalosporins
and carbapenems to some extent

Lipman et al Antimicrobial Agents Chemother 1999

Thigh Lung
0
2
1
0
-1
-2
-3 20 40 60 80 0 20 40 60 80
Time above MIC (% of 24 h)
Ch
an
ge
in l
og
10 C
FU
/th
igh
over
24 h
Drusano
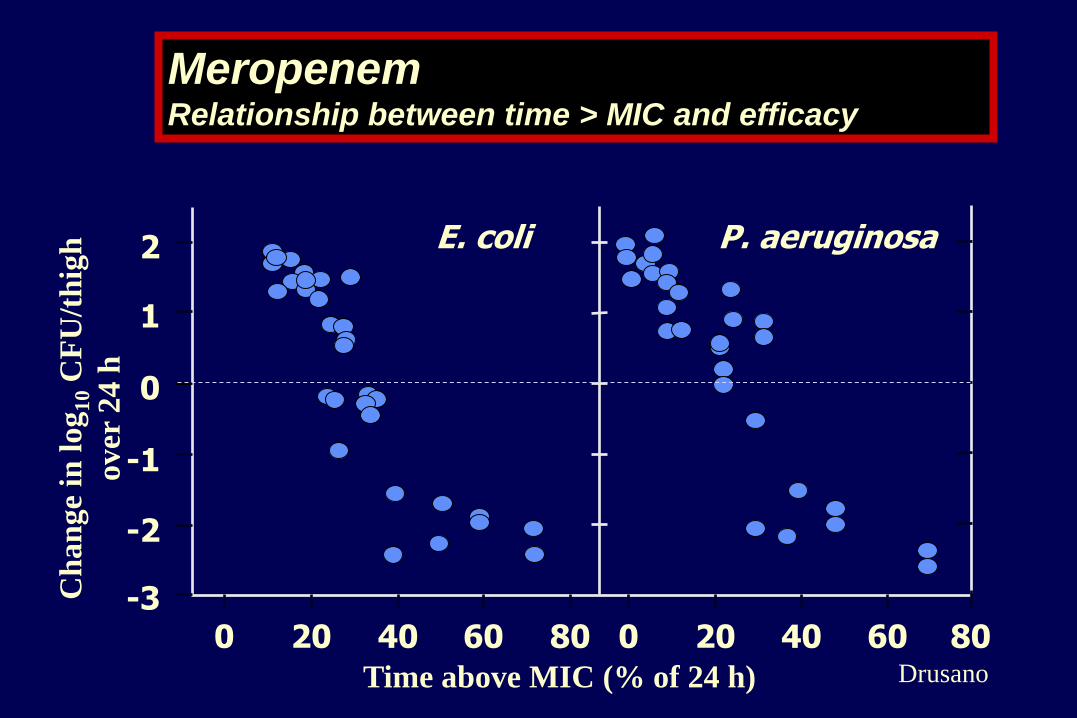
Meropenem Relationship between time > MIC and efficacy
Ch
an
ge
in l
og
10 C
FU
/th
igh
over
24 h
Time above MIC (% of 24 h)
E. coli P. aeruginosa
0
2
1
0
-1
-2
-3 20 40 60 80 0 20 40 60 80
Meropenem Relationship between time > MIC and efficacy
Drusano
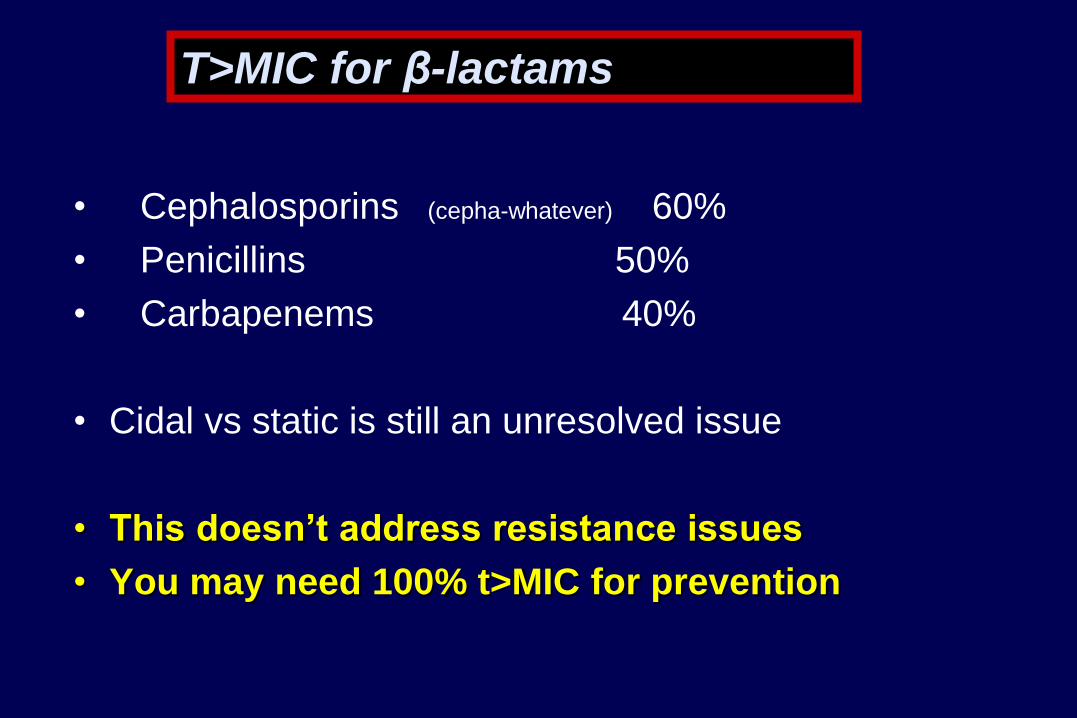
T>MIC for β-lactams
• Cephalosporins (cepha-whatever) 60%
• Penicillins 50%
• Carbapenems 40%
• Cidal vs static is still an unresolved issue
• This doesn’t address resistance issues
• You may need 100% t>MIC for prevention
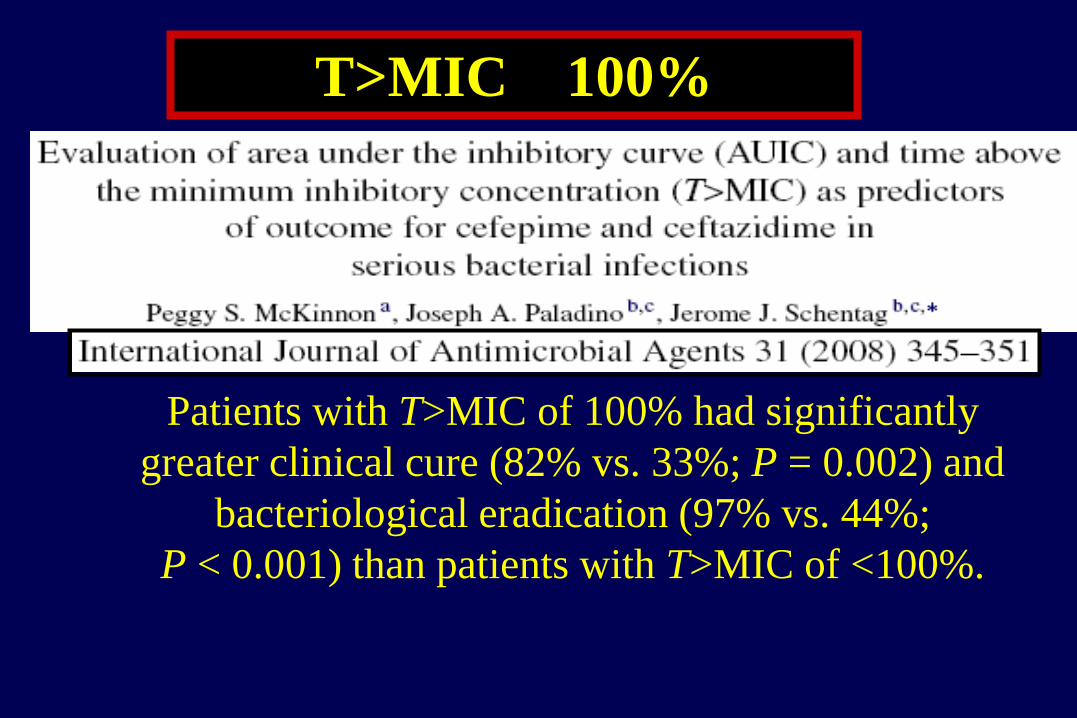
Patients with T>MIC of 100% had significantly
greater clinical cure (82% vs. 33%; P = 0.002) and
bacteriological eradication (97% vs. 44%;
P < 0.001) than patients with T>MIC of <100%.
T>MIC 100%
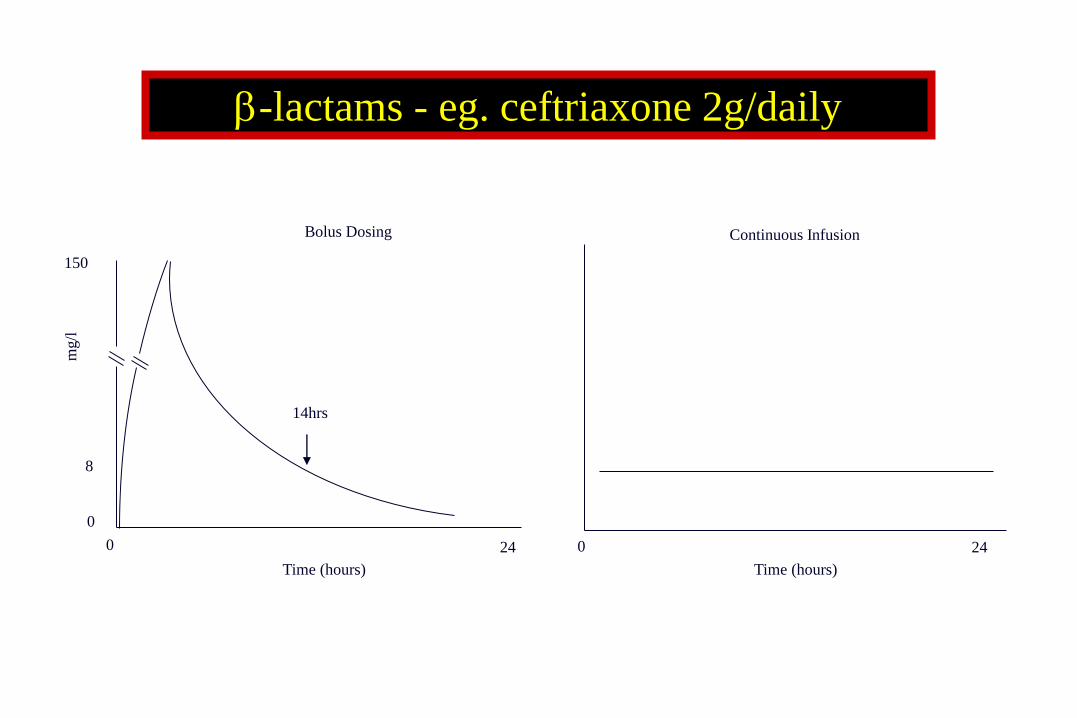
-lactams - eg. ceftriaxone 2g/daily
150
0
0 24
Time (hours)
mg/l
0 24
Time (hours)
8
14hrs
Bolus Dosing Continuous Infusion

Kill Characteristics
ß-lactams:
Time>MIC Aminoglycosides:
Dose dependent
Vancomycin:
?Time>MIC Fluoroquinolones:
Peak/MIC AUC/MIC
TIME DEPENDENT CONC. DEPENDENT

Ideal antibiotic dosing
Pinder et al Anaesth Intens Care 2002
Extended
interval
Dosing
High
Troughs
Large
AUIC

SEPSIS
Increased Cardiac
Output
Leaky Capillaries &/or altered
protein binding
End Organ
Dysfunction (e.g. renal
or hepatic)
Increased CL Increased Vd Decreased CL
Low Plasma
Concentrations
High Plasma
Concentrations
Normal Organ
Function
Normal Plasma
Concentrations
Unchanged Vd
Critical Care Medicine March 2009
Sepsis pathophysiology and antibiotic
pharmacology

LOW EXPOSURE
TO ANTIBIOTICS ENABLES
DEVELOPMENT OF RESISTANCE
Critical Care Medicine 2008;36:2433-40

AUGMENTED RENAL
CLEARANCE
See Wednesday’s lecture
Udy A, et al

Roberts and Lipman Critical Care Medicine March 2009
PK-PD Relationship

PK-PD Relationship
Clinical Infectious Diseases 1998;26:1-10

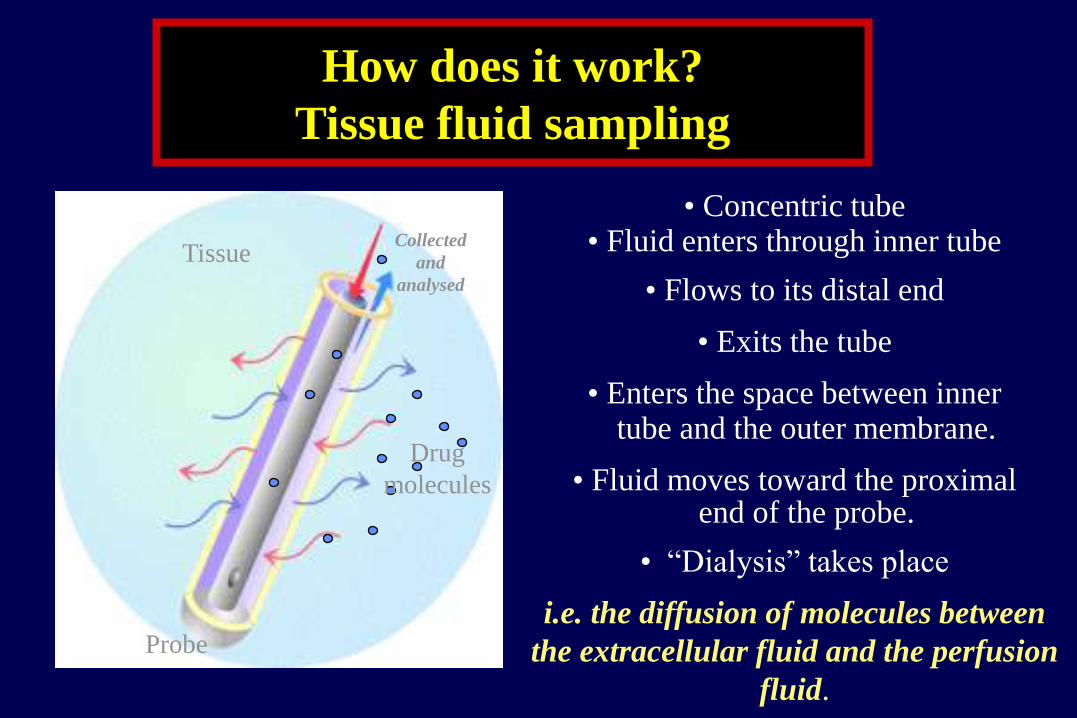
• Concentric tube • Fluid enters through inner tube
• Flows to its distal end
• Exits the tube
• Enters the space between inner tube and the outer membrane.
• Fluid moves toward the proximal
end of the probe.
• “Dialysis” takes place
i.e. the diffusion of molecules between
the extracellular fluid and the perfusion
fluid.
How does it work?
Tissue fluid sampling
Probe
Tissue
Drug
molecules
Collected
and
analysed

Punch biopsy
Normal skin
Burnt skin
Discarded skin
Serum level That’s where
previous data
comes from
That’s where
Infection
would occur
Pharmacokinetic cascade of antibiotics
through (burnt) skin

MICRODIALYSIS

MICRODIALYSIS
Healthy
volunteers
Burnt patients
Burnt and
non-burnt skin
Time>MIC in minutes
Antimicrobial Agents and Chemotherapy in press
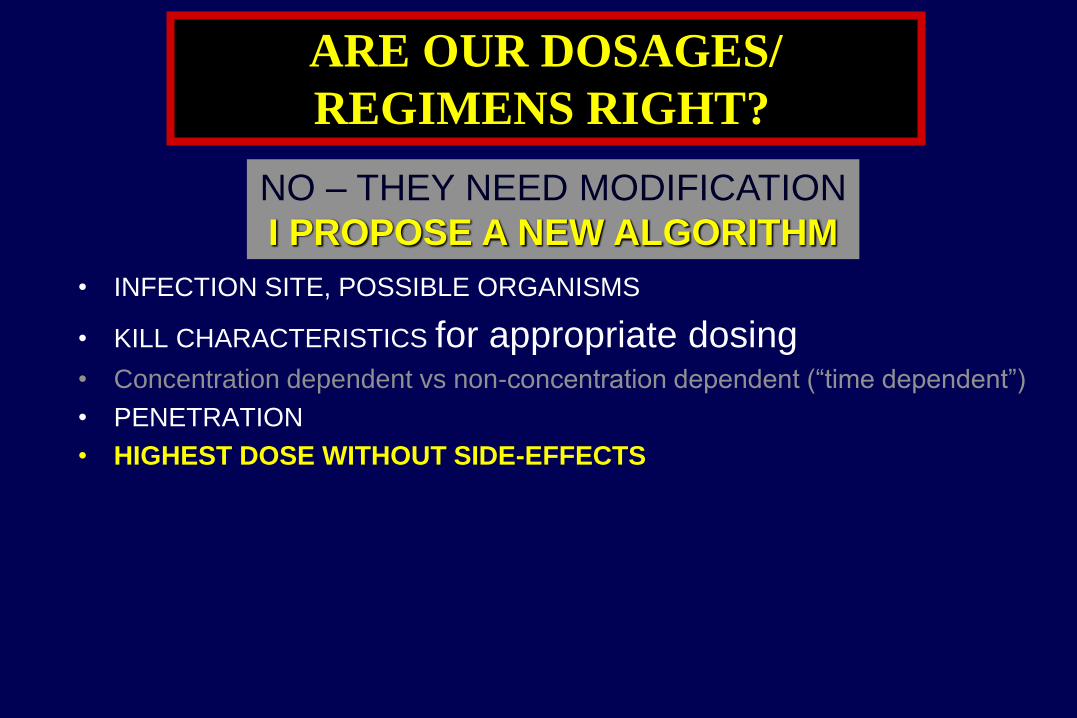
• INFECTION SITE, POSSIBLE ORGANISMS
• KILL CHARACTERISTICS for appropriate dosing • Concentration dependent vs non-concentration dependent (“time dependent”)
• PENETRATION
• HIGHEST DOSE WITHOUT SIDE-EFFECTS
ARE OUR DOSAGES/
REGIMENS RIGHT?
NO – THEY NEED MODIFICATION
I PROPOSE A NEW ALGORITHM

• HIGHEST DOSE WITHOUT SIDE-EFFECTS
UNTIL ONE CAN USE PK/PD WITH TDM
(Therapeutic Drug Monitoring)
Watch this space
ARE OUR DOSAGES/
REGIMENS RIGHT?
NO – THEY NEED MODIFICATION
I PROPOSE A NEW ALGORITHM

Practical guidelines

Drug dosing during CRRT
loading dose
= as usual... Or more?

Drug dosage adaptation during CRRT
maintenance dose adapted for renal failure =
cfr literature
Dependent on effluent rate

Drug Dosing Recommendations
Based on Sieving Coefficient (SC)
• Drug clearance a function of
– Rate of effluent flow
– Ability of drug to cross membrane (sieving coefficient)
• For drugs <1500 Daltons:
– Sieving Coefficient ≈ % Free Fraction
– Protein binding important determinant of CRRT clearance
85

86
CRRT Drug Removal
• CRRT Clearance = SC X Effluent Rate
• Mg lost/time =
• (Serum Concentration)(SC)(effluent rate)
• Vancomycin example:
– SC = 0.8,
– CRRT Effluent rate= 2L/hr
– Vancomycin Serum Concentration = 20mg/L
– Amt lost= 20 mg/L (0.8) (2L/hr) = 32 mg/hr

CRRT PK Challenges
• Changing hepatic & renal function
• Drug therapy alters tissue blood flow
• Drug protein binding likely altered
• CRRT often interrupted
– Clotted filter
– Patient goes for a procedure
– Infection Control mandates CRRT System change
• Patients often massively fluid overloaded
87