drug abuse warning network (dawn), 1994: [united states...
TRANSCRIPT

Drug Abuse Warning Network(DAWN), 1994: [United States]
United States Department of Health andHuman Services. Substance Abuse andMental Health Services Administration.Office of Applied Studies
Codebook


Terms of UseThe terms of use for this study can be found at:
http://datafiles.samhsa.gov/terms-use-nid3422


TABLE OF CONTENTS
I. INTRODUCTION . . . . . . . . . . . . . . . . . . . . . . . . . . . . . . . . . . . . . . . . . . . . . . . . . . . .. 1
II . DESCRIPTION OF DAWN . . . . . . . . . . . . . . . . . . . . . . . . . . . . . . . . . . . . . . . . . . . .. 1
III. DATA COLLECTION METHODOLOGY . . . . . . . . . . . . . . . . . . . . . . . . . . . . . . . . .. 2
IV. SAMPLE DESIGN . . . . . . . . . . . . . . . . . . . . . . . . . . . . . . . . . . . . . . . . . . . . . . . . . . .. 5
V. WEIGHTS AND PRECISION OF ESTIMATES . . . . . . . . . . . . . . . . . . . . . . . . . . . .. 6
VI. STANDARD ERROR CALCULATIONS AND DESIGN EFFECTS . . . . . . . . . . . . .. 6
VII. SUGGESTIONS FOR CALCULATING STATISTICAL TESTS USING THE DAWNDATA . . . . . . . . . . . . . . . . . . . . . . . . . . . . . . . . . . . . . . . . . . . . . . . . . . . . . . . . . . . . .. 7
VIII. NONSAMPLING ERROR . . . . . . . . . . . . . . . . . . . . . . . . . . . . . . . . . . . . . . . . . . . .. 11
IX. PROTECTION OF HOSPITALS AND PATIENTS AGAINST DISCLOSURE IN THEPUF . . . . . . . . . . . . . . . . . . . . . . . . . . . . . . . . . . . . . . . . . . . . . . . . . . . . . . . . . . . . . .. 11
X. USER RESPONSIBILITY . . . . . . . . . . . . . . . . . . . . . . . . . . . . . . . . . . . . . . . . . . . .. 14
XI. DAWN PUBLIC USE FILE LIST OF VARIABLES . . . . . . . . . . . . . . . . . . . . . . . . .. 14
XII . REFERENCES . . . . . . . . . . . . . . . . . . . . . . . . . . . . . . . . . . . . . . . . . . . . . . . . . . . . .. 16
XIII. OTHER DAWN PUBLICATIONS . . . . . . . . . . . . . . . . . . . . . . . . . . . . . . . . . . . . . .. 16
XIV. JOURNAL ARTICLES BASED ON DAWN DATA . . . . . . . . . . . . . . . . . . . . . . . . .. 17
APPENDIX 1 DAWN 1994 PUBLIC USE FILE RECORD LAYOUT . . . . . . . . . . . . . . . . .. 18
APPENDIX 2 DAWN 1994 PUBLIC USE FILE CODEBOOK . . . . . . . . . . . . . . . . . . . . . .. 22

1994 Drug Abuse Warning Network (DAWN)
Public Use File User Documentation
Rashna GhadialyJavier Porras
Hee-Choon ShinEllen Kaplowitz
Kenneth A. Rasinski
NORC, at the University of Chicago
June 16, 1999Revised: August 24, 1999


ACKNOWLEDGMENTS
The 1994 DAWN Public Use File and User Documentation were prepared by NORCunder contract to the SAMHSA, Office of Applied Studies. We are grateful for help and advicefrom Judith Ball, Joseph Gfroerer, Charlene Lewis, and Douglas Wright of SAMHSA, and fromour Disclosure Analysis Panel members: Robert Burton of NCES, Art Hughes of NIDA, AlZarate of NCHS, and Laura Zayatz of the Census Bureau. We also thank Dean Gerstein and SamSchildhaus of NORC for their general support on this project.


1Material for this codebook was drawn from SAMHSA reports related to DAWN, including: SAMHSAStatistical Series, Annual Emergency Department Data 1994. Data from the Drug Abuse Warning Network(DAWN).” Series I, Number 14-A. (October 1996).
1
I. INTRODUCTION
The Drug Abuse Warning Network (DAWN) is the primary source of statisticalinformation on the use of the emergency departments in the United States for the treatment ofdrug-related health problems. DAWN is an ongoing national probability survey conductedannually by the Substance Abuse and Mental Health Services Administration (SAMHSA) whichproduces estimates of drug-related emergency department visits for various substances.
The DAWN 1994 data file contains information collected from hospital emergencydepartments (ED’s) across the country to monitor emergency medical problems associated withillicit, prescription, or over-the-counter drug use. The data are collected quarterly, andsemiannual and annual reports are produced by the Office of Applied Statistics (OAS), a branchof the Substance Abuse and Mental Health Services Administration (SAMHSA) which is adivision of the Department of Health and Human Services (DHSS). One of the uses of the data isto identify and track trends in emergency room visits due to use of illegal substances as they enterand spread through the United States.1
II. DESCRIPTION OF DAWN
The DAWN includes an annual national probability survey of drug-related problemstreated in hospital emergency departments (EDs) and drug-related death data collected from anonrandom sample of medical examiners and coroners' offices (ME/Cs). Since 1972, DAWN hasbeen a source of data on drug-induced or drug-related emergency department visits and medicalexaminer or coroner deaths. This surveillance system is managed by the Office of Applied Studies,a component of the Substance Abuse and Mental Health Services Administration (SAMHSA) andthe U.S. Department of Health and Human Services. More than 500 EDs provide data forDAWN. They are part of a scientifically selected sample of general hospitals in the country. TheDAWN sample is constructed to produce estimates of substance abuse visits to emergencydepartments across the Nation and to 21 metropolitan areas. The sample design of DAWN doesnot permit state-level estimates.
Information on drug-related and drug-induced deaths, involving both legal and illegaldrugs, is collected from ME/Cs representing 175 jurisdictions. ED and ME/C data are collectedand reported from the following metropolitan areas: Atlanta, GA; Boston, MA; Buffalo, NY;Chicago, IL; Dallas, TX; Denver, CO; Detroit, MI; Los Angeles, CA; Miami, FL; Minneapolis,MN; New Orleans, LA: New York, NY; Newark, NJ; Philadelphia, PA; Phoenix, AZ; San Diego,CA; San Francisco, CA; Seattle, WA; and Washington, D.C. ED data also are reported fromhospitals in Baltimore, MD and ME/C data are reported by ME/Cs in Kansas City, KS/MO.

2
DAWN reports include detailed data summaries for each metropolitan area and show thedistribution of drug abuse episodes by demographic characteristics, number of episodes, and druggroup and the distribution of drug mentions by reason for emergency department contact,classified by drug group. DAWN also reports the number of mentions per 100,000 population forcertain drugs on a semiannual basis by metropolitan area, so it is possible to see if the rates ofmentions are going up or down and to compare the metropolitan area rates with the nationalrates.
Data from DAWN can be used to identify substances associated with drug abuse episodesreported by DAWN-affiliated facilities; to monitor drug abuse patterns and trends and detect newabuse entities and new combinations; to assess health hazards associated with drug abuse; and toprovide data for national, state, and local drug abuse policy and program planning.
DAWN has several advantages in that it is ongoing and, thus, continually provides currentand consistent information; it identifies specific drugs being used and it provides data for selectedmetropolitan areas as well as a composite national picture.
DAWN collects information on drug abuse-related medical examiner cases and on allpatients treated in an ED because of problems caused by or related to drug abuse. In general, drugabuse-related cases must meet three criteria to be reported to DAWN: (1) the use of prescriptiondrugs in a manner inconsistent with accepted medical practice; (2) the use of over-the-counter(OTC) drugs contrary to approved labeling; (3) the use of any other substance (heroin, marijuana,peyote, glue, aerosols, etc.) for psychic effect, dependence, or suicide; the use of alcohol alone isnot reported.
III. DATA COLLECTION METHODOLOGY
Since the early 1970's, DAWN has collected information on patients seeking hospitalemergency department treatment related to their use of an illegal drug or the non-medical use of alegal drug. The survey provides data that describe the impact of drug use on hospital emergencydepartments in the United States. Data are collected by trained reporters (nurses and otherhospital personnel) who review medical charts for indications--noted by hospital staff who treatedthe patients--that drug use was the reason for the emergency department visit. Thus, the accuracyof these reports depends on the careful recording of this information by hospital staff.

3
To be included in DAWN, the person presenting to the emergency department (i.e., thepatient) must be aged 6 years and older and meet all four of the following criteria:
1. the patient was treated in the hospital's emergency department;
2. the patient's presenting problem(s) was induced by or related to drug use, regardless ofwhen the drug ingestion occurred;
3. the case involved the nonmedical use of a legal drug or any use of an illegal drug;
4. the patient's reason for taking the substance(s) included one of the following: (1)dependence, (2) suicide attempt or gesture, or (3) psychic effects.
DAWN excludes cases involving alcohol as the sole substance of abuse. Information ispresented on the characteristics of decedents by gender, race/ethnicity, age, and manner of death,along with this information by type of drugs mentioned.
Hospitals eligible for the DAWN study are non-Federal, short-stay general hospitals thathave a 24-hour emergency department. Since 1988, the DAWN emergency department data havebeen collected from a representative sample of these hospitals located throughout the coterminousUnited States, including 21 oversampled metropolitan areas. The data from this sample are usedto generate estimates of the total number of emergency department drug episodes and drugmentions in all such hospitals. A methodology was developed for generating comparableestimates for the years 1978 through 1987, taking advantage of historical data available on thecharacteristics of the universe of eligible hospitals and the extensive data files of drug-relatedepisodes compiled over the years by DAWN. These estimates are useful in providing a contextfor the analysis of recent trends in drug-related emergency department episodes.
Approximately 13,000 drug abuse episodes are processed monthly through DAWN. Dataaccuracy is ensured through a combination of quality assurance activities. For example, adherenceto DAWN reporting guidelines is monitored through periodic record reviews and reabstractingstudies. Particular emphasis is placed on training and on continuing support and followupprovided by the field liaisons and central office data monitors.

4
Within each facility participating in DAWN, a designated reporter, usually a member ofthe emergency department or medical records staff, is responsible for identifying drug-relatedepisodes and recording and submitting data on each case. An episode report is submitted for eachpatient visiting a DAWN emergency department whose presenting problem(s) was related to theirown drug use. In each facility (hospital ED or medical examiner's office) that participates inDAWN, the reporter is assigned to data collection activities. Ideally, an ED nurse (or othermedical personnel) reviews all ED records daily and completes a one-page DAWN form on eachdrug abuse-related case. This report records basic patient demographic data and detailedsubstance abuse information. When ED staff are not available, other service departments (such associal services, medical records, pharmacy, poison control, volunteer departments) may berecruited to participate in the reporting process. In some cases, the hospital may designate anindependent reporter (i.e., not a hospital staff person) to report DAWN data. The DAWN staffare bound by Federal laws protecting patient confidentiality. The data collection form does notinclude any patient identifying information.
DAWN reporters submit completed forms, along with weekly log sheets listing case totals,to SAMHSA's DAWN operations contractor. Each participating facility or its designee (e.g., thereporter, nurses' fund) receives a small honorarium for submitting data. The DAWN operationscontractor assumes responsibility for the other costs incurred in reporting, such as mailing reports,training facility personnel, telephone communication between facility reporters, and the contractorstaff who review DAWN reports. Contractor staff review, verify, and compile DAWN data. Theyare supported by regional field liaison staff who travel to facilities to provide training, evaluation,and problem-solving as needed.
Each report of a drug-related emergency department episode includes demographicinformation about the patient and the circumstances surrounding the episode. Up to four differentsubstances, in addition to alcohol-in-combination, can be specified for each episode. Alcohol andlegal drugs are included only when they are reported as used in combination with illegal drugs. The data are then weighted to produce national and metropolitan area estimates of emergencydepartment drug-related episodes.
A drug episode is defined as an emergency department visit that was directly related to theuse of an illegal drug or the non-medical use of a legal drug for persons aged 6 years and older.The number of emergency department episodes reported in DAWN is not synonymous with thenumber of individuals involved. One person may make repeated visits to an emergencydepartment or to several emergency departments, thus producing a number of episodes. As nopatient identifiers are collected, it is impossible to determine the number of individuals involved inthe reported episodes.

5
A drug mention refers to a substance that was mentioned during a drug-related emergencydepartment episode. In addition to alcohol-in-combination, up to four substances may bereported for each drug-related episode; thus, the total number of mentions exceeds the number oftotal episodes. Much of the time there is only one drug mentioned one during an episode In these cases “episode” and “mention” are synonymous. It should be noted that a particular drug mentionmay or may not be the confirmed "cause" of the episode when multiple drugs have beenmentioned. Even when only one substance is reported for an episode, allowance should still bemade for reportable drugs not mentioned or for other contributory factors. To reduce the size ofthe data file and to make the data more accessible to users, the DAWN Public Use File (PUF)presents data at the episode level. Total and unique numbers of mentions are included for eachepisode.
IV. SAMPLE DESIGN
When DAWN was begun in the early 1970's, a random sample of hospital emergencydepartments was chosen for inclusion. Over the ensuing years, a number of facilities were lostfrom the original sample due to closure, merger, or voluntary termination and the sample was notupdated in such a way as to maintain randomness. Therefore, attrition and nonrandomreplacement led to a sample that was no longer representative of all hospital emergencydepartments in the coterminous United States.
In the 1980's, the DAWN sample was redesigned and a new sample was drawn. TheAmerican Hospital Association (AHA) 1984 and 1985 Annual Surveys of Hospitals were used toobtain a sampling frame. Non-Federal, short-stay hospitals with a 24-hour emergency departmentwere eligible for DAWN. Hospitals in the frame were stratified according to size, with hospitalsreporting 80,000 or more annual emergency department visits assigned to a single stratum andselected with certainty. Additional strata were defined according to whether the hospital had anorganized outpatient department or a chemical/alcohol inpatient unit. Twenty-one MetropolitanStatistical Areas (MSAs) were designated for oversampling. In five of the metropolitan areas alleligible hospitals were assigned to a National Panel and sampled. In addition to the other strata,hospitals in the metropolitan areas were classified as to whether they were inside or outside acentral city.
Sample implementation began in 1986 and by 1988 hospital recruitment progressed to thepoint where national and metropolitan area [the 21 MSAs/Primary Metropolitan Statistical Areas(PMSAs)] estimates could be made with reasonable precision. The estimation procedure for thenew probability sample was modified in 1989 and included the use of an estimator withadjustments for two types of nonresponse and a ratio adjustment (or benchmark adjustment)based on ancillary data from the AHA. A sample maintenance procedure was developed torandomly select “newly eligible” hospitals from the AHA each year using the same selectionprobabilities as the new sample. This procedure will allow the sample to be kept up-to-date andrepresentative of over 5,000 DAWN-eligible hospitals in the coterminous U.S.

6
V. WEIGHTS AND PRECISION OF ESTIMATES
DAWN weights are generated each quarter for each hospital in the sample and are theproduct of a four component model that considers (1) the base sampling weight calculated as thereciprocal of the sampling probability; (2) an adjustment for atypical reporting, applicable tocertain hospitals that merge, split, or respond in an unusual way; (3) an adjustment fornonresponse based either on complete nonparticipation or failure to provide data on all thereporting days in a given time period; and (4) a benchmark factor, applied within metropolitanareas, that adjusts the total number of emergency department visits among participating samplehospitals to the total for the population of hospitals as determined from the sampling frame.
Each estimate from the DAWN emergency department sample data is subject to samplingvariability, which is the variation of the estimate that would be observed if different samples weredrawn from the same population using the same procedures. The sampling variability of anestimate is measured by its standard error (SE) and relative standard error (RSE), which isdefined as the standard error expressed as a percentage of the value of the estimate. The precisionof an estimate is inversely related to the degree of sampling variability as measured by the RSE;the greater the RSE value, the lower the precision.
VI. STANDARD ERROR CALCULATIONS AND DESIGN EFFECTS
The DAWN sample design is complex in a way that effects the calculation of standarderrors of estimates. For reports published by SAMHSA custom software was written to produceexact sample-design standard errors that are published in the various DAWN reports. Thissection reports on deviations from the exact standard errors that may result from the constructionof the PUF and the disclosure modifications. The DAWN sample design includes stratificationand clustering. Two stratification variables (STRATA and DAWNAREA) have been included onthe PUF for use in estimation and standard error calculation. The DAWN sample design alsoincludes hospital (HOSPID) as a clustering component. An additional component of variance isthe covariancd of estimates across quarters.
The Design Effect (DEFF; see Kish, 1965) statistic is the ratio of the standard errorcalculated from a reduced design, such as the simple random sample assumption made by SASand SPSS or any other design that does not fully capture all of the sources of error variation dueto the design, to the exact standard error, which takes into account all of the design-relatedvariance components. Tables 1, 2 and 3 show the DEFF’s for a number of published DAWNtotals assuming a simple random sample.

7
The DEFFs for the simple random sample weighted totals were calculated as follows: (1)the number of episodes and mentions for each hospital were counted; each hospital for eachquarter was counted as a separate entity. Hospitals that were split or merged for disclosurepurposes were counted in their split or merged condition, that is, one split or merged unit wascounted as one hospital. (2) the weight variable was normalized to the number of hospitals ineach MSA. The normalization was conducted by dividing each case weight by the mean weight ineach MSA. When this is done, the sum of the weights is equal to the unweigted sample size. Standard errors of the sample means were calculated after the weights were normalized. Thesestandard errors were multiplied by the number of total hospitals in the population (estimated bythe sum of the non-normalized weights in each MSA) to obtain the standard errors for the totals.
VII. SUGGESTIONS FOR CALCULATING STATISTICAL TESTS USING THEDAWN DATA
It is advised that any analysis of the DAWN PUF use weights and take into account designeffects. Perhaps the simplest way to analyze the DAWN data is to use statistical software such asSAS or SPSS or another package that assumes a simple random sample in its statisticalcalculations to calculate weighted estimates and standard errors. When using this method designeffects can be easily taken into account through the following procedure: (1) create a new weightby dividing the case weight by the average weight for the analytic group of interests (e.g., theentire sample, MSAs, or subgroups) times the most appropriate design effect from Tables 1 and 2. The significance levels for the statistics that result from this procedure will approximate the exactsignificance levels to take into consideration nonindependence (or clustering) of cases. In caseswhere the drug or drug by MSA design effect is not appropriate, an average design effect can beused. Alternatively, the square root of DEFF (called DEFT by Kish, 1965) can be used as amultiplier of the standard error from the reduced design to give an approximation of what thestandard error would be if the full sample design were taken into account.

8
Table 1Examples of estimates and standard errors for total episodes, total mentions,
and mentions of selected drug groups: 1994Total episodes, total mentions, and drug group Estimated
episodesStandard errors PUF94 estimates SRS Standard
errors DEFF
Episodes 518,521 28,000 518,521 25587 1.19750
Mentions 900,317 48,617 900,140 44918 1.17151
Acetaminophen 38,674 2,359 38,666 2381 0.98133
Alcohol-in-combination 160,744 10,127 160,730 8455 1.43449
Alprazolam 17,183 1,839 17,183 1420 1.67776
Amitriptyline 11,297 1,209 11,293 1104 1.20001
Amitriptyline combinations 616 188 616 172 1.19162
Amphetamine 9,664 2,271 9,651 1364 2.77301
Aspririn 19,358 1,549 19,349 1430 1.17276
Chloral hydrate 480 154 480 160 0.92838
Chlordiazepoxide 2,695 582 2,693 437 1.76972
Chlorpromazine 2,614 387 2,615 353 1.20467
Chlorazepate 718 189 717 182 1.07781
Cocaine 142,878 14,431 142,809 9524 2.29611
Codeine 2,147 333 2,147 337 0.97538
Codeine combinations 7,378 907 7,376 752 1.45616
d-Propoxyphene 7,478 703 7,473 706 0.99126
Desipramine 1,246 260 1,246 232 1.25086
Diazepam 13,568 1,398 13,570 1167 1.43609
Diphenhydramine 9,537 896 9,536 845 1.12449
Doxepin 4,268 632 4,267 572 1.22139
Ethchlorvynol 89 12 89 15 0.64183
Flurazepam 1,495 281 1,493 241 1.36112
Glutethimide 11 6 11 7 0.80980
Haloperidol 3,072 424 3,073 377 1.26430
Heroin/Morphine 64,013 5,761 64,133 4158 1.91965
Hydromorphone 896 332 894 254 1.70685
Imipramine 2,764 401 2,766 380 1.11079
Inhalants/Solvents/Aerosols 1,637 308 1,637 264 1.36439
Lorazepam 12,248 1,862 12,250 1381 1.81793
LSD 5,150 994 5,153 857 1.34491
Marijuana/Hashish 40,183 3,657 40,142 2677 1.86592
Meperidine HCL 736 163 735 152 1.14421
Meprobamate 437 142 437 150 0.89942
Methadone 3,234 401 3,234 346 1.33960
Methamphetamine/Speed 17,665 4,946 17,674 2965 2.78227
Methaqualone 610 205 610 179 1.31751
Methylphenidate 1,191 217 1,190 220 0.97335
O.T.C. diet aids 1,905 324 1,905 316 1.04831
O.T.C. sleep aids 6,890 861 6,892 706 1.48913
Oxycodone 4,084 662 4,084 504 1.72345
PCP/PCP combinations 6,019 626 6,010 533 1.38130
Pentazocine 294 111 293 115 0.92783
Pentobarbital 170 88 170 90 0.95434
Phenobarbital 2,471 356 2,473 345 1.06277
Secobarbital 212 89 212 91 0.96332
Secobarbital/Amobarbital 10 2 10 4 0.28526
Thioridazine 3,190 501 3,192 454 1.21719
Trifluoperazine 1,395 292 1,396 269 1.17855

9
Table 2Standard errors and design effects for total drug abuse episodes, total drug mentions, and mentions of cocaine
according to metropolitan area 1994, and assuming a simple random sample and weighted estimates
Total Episodes Total Mentions Cocaine Mentions
Metropolitan Area SRS SRS SRS SRS SRS SRSEstimate SE SE DEFF Estimate SE SE DEFF Estimate SE SE DEFF
Total coterminous U.S. 518,521 28,000 25587 1.20 900,317 48,617 44,918 1.17 142,878 14,431 9,524 2.30
Atlanta 10,828 1,570 810 3.76 21,362 3,204 1,511 4.50 6,165 851 392 4.72
Baltimore 15,862 1,126 1728 0.42 26,897 2,044 3,188 0.41 8,882 826 1,309 0.40
Boston 15,225 2,055 1507 1.86 28,231 4,178 3,043 1.89 4,715 646 509 1.61
Buffalo 2,926 138 792 0.03 5,069 243 1,463 0.03 1,207 86 323 0.07
Chicago 21,511 1,549 1488 1.08 37,273 2,646 2,468 1.15 10,797 1,080 1,028 1.10
Dallas 5,160 361 423 0.73 9,360 655 779 0.71 1,246 140 135 1.06
Denver 5,034 795 830 0.92 8,417 1,229 1,272 0.93 1,299 257 260 0.98
Detroit 17,162 3,209 3477 0.85 31,748 6,381 6,662 0.92 7,964 2,254 2,332 0.93
Los Angeles-Long Beach 19,256 2,041 1217 2.81 33,221 5,149 2,932 3.08 5,070 730 446 2.69
Miami-Hialeah 5,849 351 156 5.07 9,383 563 254 4.90 2,742 222 116 3.68
Minneapolis-St.Paul 4,611 618 601 1.06 9,030 1,490 1,257 1.40 578 62 92 0.46
New Orleans 4,739 242 248 0.95 9,459 473 511 0.86 1,884 143 123 1.36
New York 43,127 6,771 4884 1.92 64,199 9,630 7,270 1.75 20,214 3,962 2,848 1.94
Newark 9,395 1,954 1628 1.44 16,529 3,736 3,001 1.55 4,288 1,136 899 1.60
Philadelphia 17,711 1,948 1635 1.42 31,717 3,489 2,960 1.39 8,446 1,343 1,017 1.74
Phoenix 6,879 248 728 0.12 11,563 370 1,185 0.10 1,064 71 129 0.30
San Diego 5,051 525 620 0.72 8,701 818 1,015 0.65 668 162 147 1.22
San Francisco 11,766 435 943 0.21 17,576 685 1,417 0.23 3,123 147 291 0.25
Seattle 10,049 2,040 2825 0.52 17,173 3,538 4,880 0.53 2,896 788 1,058 0.55
St. Louis 6,039 1,310 1013 1.67 11,021 2,700 1,985 1.85 2,329 689 520 1.76
Washington, D.C. 14,152 2,038 2048 0.99 25,222 4,363 4,233 1.06 4,849 824 860 0.92
National Panel 266,189 26,353 20245 1.69 468,167 46,349 35,607 1.69 42,330 13,334 7,988 2.79

10
Table 3Standard errors and design effects for mentions of cocaine, heroine/morphine, and
marijuana/hashish, according to metropolitan area 1994, and assuming a simple random sample and weighted estimates
Heroin/Morphine Mentions Marijuana/Hashish mentions
Metropolitan Area SRS SRS SRS SRSEstimate SE SE DEFF Estimate SE SE DEFF
Total coterminous U.S. 64,013 5,761 4158 1.92 40,183 3,657 2,677 1.87
Atlanta 456 70 40 3.01 1,527 224 103 4.78
Baltimore 7,510 661 1015 0.42 770 22 131 0.03
Boston 2,527 334 270 1.53 1,870 393 356 1.22
Buffalo 355 21 99 0.04 230 11 55 0.04
Chicago 4,787 641 557 1.33 2,219 226 226 1.00
Dallas 237 45 33 1.87 477 126 61 4.24
Denver 495 129 132 0.95 406 42 70 0.37
Detroit 2,106 537 532 1.02 2,849 832 723 1.32
Los Angeles-Long Beach 2,949 301 202 2.22 1,658 424 215 3.88
Miami-Hialeah 264 9 21 0.19 711 47 41 1.33
Minneapolis-St.Paul 78 6 18 0.10 482 208 107 3.79
New Orleans 197 31 21 2.16 885 39 66 0.35
New York 11,185 2,628 2041 1.66 2,589 373 301 1.54
Newark 4,498 1,525 1019 2.24 628 196 161 1.48
Philadelphia 2,440 349 336 1.08 2,085 323 279 1.34
Phoenix 483 21 59 0.12 453 144 95 2.28
San Diego 695 167 155 1.17 513 116 91 1.64
San Francisco 3,555 174 321 0.30 479 35 67 0.28
Seattle 2,092 542 710 0.58 870 197 274 0.52
St. Louis 408 91 95 0.92 901 423 288 2.16
Washington, D.C. 1,261 158 173 0.83 2,712 906 741 1.49
National Panel 15,437 4,708 2808 2.81 14,868 3,345 2,220 2.27

11
VIII. NONSAMPLING ERROR
When producing estimates from any sample survey, two types of errors arepossible--sampling and nonsampling errors. The sampling error of an estimate is the error causedby the selection of a sample instead of a census of hospitals. Sampling error is reduced byselecting a large sample or by using efficient sample design and estimation strategies such asstratification, optimal allocation, and ratio estimation. Nonsampling errors occur fromnonresponse, difficulties in the interpretation of the collection form, coding errors, computerprocessing errors, errors in the sampling frame, reporting errors, and other errors. Manyprocedures are in place to minimize nonsampling errors such as data editing and periodicretraining of data collectors. Further, nonrespondents are identified for additional recruitment. Late reporters are assigned for priority data collection and respondents with changes in reportingare designated for followup.
Because data are abstracted from medical records completed by hospital staff who treatedthe patients, the accuracy of these reports depends on their careful recording of these conditions. In the DAWN technical report it is noted that methods for identifying patient drug abuse candiffer from hospital to hospital. The DAWN has recently received criticism for underrepresentingdrug abuse episodes that are associated with major trauma, such as motor vehicle accidents andviolent assault (Brookoff, Campbell, and Shaw, 1993). Such underrepresentation may be becausetrauma patients may not be in a position to give a history of drug abuse while being treated in theemergency department. (See Swisher, 1984, for an extensive critique of the original DAWNdesign and data).
It is also important to recognize that DAWN does not provide a complete picture ofproblems associated with drug use, but rather focuses on the impact that these problems have onhospital emergency departments in the United States . If a person is admitted to another part ofthe hospital for treatment, treated in a physician's office or at a drug treatment center, the episodewould not be included in DAWN.
IX.. PROTECTION OF HOSPITALS AND PATIENTS AGAINST DISCLOSURE INTHE PUF
It is the intention of SAMHSA to make the DAWN data available to the public throughthis DAWN 1994 public release file. However, in doing so it is important to maintain theconfidentiality of individuals represented in the substance-related emergency records, and of theidentities of the hospital. This is especially important because the data are of a very sensitivenature, containing information about illicit drug use and motivation for such use. It is alsoimportant because participating hospitals were given assurance of the confidentiality of theinformation provided. Therefore a disclosure analysis of the DAWN data was conductedresulting in protective modifications to the PUF data.
Certain procedures were applied to the DAWN data to guard against direct or indirectdisclosure of event or emergency department identity. These procedures include eliminatingobvious identifiers, such as names and publicly available identification numbers. The reason forthese eliminations are obvious, and conform to most social science data sets publicly available,whether they are produced by the government or by other research institutions.

12
In addition, the procedures included masking tasks applied to both hospitals and events. The general point of the masking procedure is to disguise the identity of hospitals or events. Onetype of masking procedure involved dividing some large hospitals into smaller pieces and mixingthe pieces with other hospitals comparable in size to the pieces. In another masking procedure,small hospitals were joined with larger ones. At the event-level, key identifying variables wereselected and crosstabulated to find any cells with two or fewer events. Data in these cells weremodified to eliminate the small cells and make inferential disclosure of any hospital or eventpractically impossible. Data have been masked to exceed a confusability criterion based on amultivariable assessment of demographic characteristics associated with events. All ofthese procedures make it extremely difficult to attempt the identify specific hospitals orevents.
The disclosure analyses work and creation of the public use data file was done by theNational Opinion Research Center (NORC) at the University of Chicago under contract toSAMHSA. The PUF contains the 1994 DAWN data. Twenty-one Metropolitan Statistical Areasand a National Panel are represented in the data. The Metropolitan Statistical Areas are Atlanta,Baltimore, Boston, Buffalo, Chicago, Dallas, Denver, Detroit, LA-Long Beach, Miami-Hialeah,Minneapolis-St. Paul, New Orleans, New York, Newark, Philadelphia, Phoenix, St. Louis, SanDiego, San Francisco, Seattle, and Washington, DC. The National Panel is a national probabilitysample of hospitals without PMSA designations. Because no geographic indicators (i.e., PMSAs)are attached to the hospitals in the National Panel, disclosure analysis was not necessary.
In order to create a PUF from the original (restricted use) file, several steps were taken toensure that individual client records could not be identified. First, the variable that could clearlyidentify treatment units was deleted (e.g. AHA ID ). Second, variables determined to be ofsignificant disclosure risk (“key” variables) were collapsed and/or recoded (e.g., AGE, RACE,and SEX). Some larger hospitals were split into pseudo-hospitals and mixed in with smallerhospitals. (Please note that HOSPID is the cluster variable that is needed when calculatingstandard errors using special software, such as SUDAAN, that takes into account the complexsample design. See Section VI for more detail). Analysis of the unique records in the file wasdone. Unique records were considered to be those in which the patterns of responses to the “key”variables were shared by fewer than three records. For these records, the key variables wereranked in order of importance and data were suppressed until there were no remaining uniquerecords. As Table 4 indicates, about 0.54 percent of the records in the full file were identified asunique. Of these unique records, an average of 1.36 data values per record were suppressed.
There are two statistical considerations resulting from the disclosure analysis that must beaddressed. The first concerns bias in the estimates. Data suppression will cause a downward biasin estimates of drug mentions. The bias is very small for the overall sample and slightly larger forestimates based on key variable subgroups. Thus, estimates of drug mentions from the PUF willbe slightly lower than published estimates. NORC designed procedures to spread the bias acrossgroups represented in the key variables. Because of the hospital joining/splitting, weights werealtered for some hospitals. The goal of the joining/splitting procedure was to maintain totalepisode estimates. Again, the bias was minimal, as quarterly estimates by DAWNAREA werepreserved in this procedure.

13
The second consideration concerns standard errors of estimates. These will be slightlydifferent than reported results due to the joining or splitting of hospitals. NORC’s procedureswere designed to minimize the effect on standard error. Analysis indicates that the reweightingsand suppression will have very little effect on the file’s analytic utility.
TABLE 4: Results of the Disclosure Procedures
Number of Records 165,646
% Unique Records 0.54%
Mean number of data valuessuppressed among small cells
1.36
Percent data suppressed with respectto entire dataset
0.19%
Range of difference scores for percentdistributions before and after datasuppression
0.0% - 0.1%
All frequencies in the PUF Codebook (Appendix 2) are unweighted.
The procedures to protect against disclosure come with some cost. First, it will not bepossible to conduct hospital-level analyses, either within or across the four quarters of the 1994data, using the DAWN public release data. Only aggregate analysis within or across PrimaryMetropolitan Statistical Areas (PMSAs) are permitted. Second, estimates derived from the PUFwill not always match those published in SAMHSA reports, because the drug estimates for thedemographic cells are slightly biased due to event-level data suppression and weight adjustments. Although the bias can be in either direction, if present, it is likely to be slightly downward becausethe suppression of a sparse number of age, race and sex data removed cases from demographiccells by setting their value on one or more demographic variables to missing.
Nonetheless, the DAWN PUF is rich in the type of research opportunities it provides. Thefile will allow researchers to learn about abuse of any of the 52 categories of drugs, alone or incombination, for the entire country and by metropolitan area (using the DAWNAREA variable). With the DAWN PUF a researcher would be able to tell which drugs are most and least likely tobe used in combination, and whether this varies by region, demographic group, region by group,and motive for drug use. In addition, it is possible to examine drug type and route ofadministration by various status variables, such as age category, gender, race/ethnicity category,both across the nation and within metropolitan areas. The information in DAWN can be used toexamine which drugs and routes most associated with recreational use, addiction, or psychoactiveeffects, overall, by metropolitan area, and within demographic subgroups result in an emergencydepartment visit.

14
The DAWN PUF can answer other important questions. For example, what drugs,combinations of drugs, or routes of administration are most associated with death? What are thecharacteristics of individuals, both in terms of drug use, route of administration, anddemographics who are admitted to the hospital. What factors are associated with those whorefuse treatment. Which drugs or drug combinations are most associated with treatment seeking,overdosing, or having unpredictable reactions? Do these vary by area and demographicsubgroup? These issues and more can be addressed using the DAWN PUF.
Extensive efforts were made to assure that the bias in estimates introduced by disclosure-required suppression was distributed equally among subgroups in which suppression occurred. Inthe few cases where the bias for a demographic cell estimate is greater than 50 episodes, theaverage relative bias, is only around 1% because of the large number of episodes. This PUF isdesigned for use with data analysis programs that calculate standard errors of complex sampledesigns. The masking, hospital splitting, and joining have only a small effect on the standarderrors.
X. USER RESPONSIBILITY
Users are reminded that the data are to be used solely for statistical analysis and reportingof aggregated information and not for investigation of specific individuals or organizations.
XI. DAWN PUBLIC USE FILE LIST OF VARIABLES
The DAWN PUF contains the following variables:
AGE: Specifies the age group of the patient at the time of the emergency departmentvisit.
DAWNAREA: Indicates the Primary Metropolitan Statistical Area (PMSA) code. According to the U.S. Bureau of the Census, if an area that qualifies as a MetropolitanArea (MA) has more than one million persons, PMSAs may be defined within it. PMSAsconsist of a large urbanized county or cluster of counties that demonstrates very stronginternal economic social links, in addition to close ties to other portions of the larger area. When PMSAs are established, the larger area of which they are component parts isdesignated a consolidated metropolitan statistical area (CMSA).
DAWNQTR: Indicates the quarter of the year of the ED visit.
DAY: Specifies the day of the week of the ED visit.
DISPOSTN: Indicates the patient disposition, i.e., whether the patient was released fromthe hospital, admitted, left against advice, or died.

15
DRUG01 through DRUG52: Indicates each drug or drug category mentioned. Theseconsist of the 50 drug categories most frequently mentioned, plus “All other drugs” and“Drug unknown” and are the same that are listed in Table 3.01 (Number of emergencydepartment drug mentions by selected drug category according to age, race/ethnicity, andgender: 1994), in the report “SAMHSA Statistical Series, Annual Emergency DepartmentData 1994. Data from the Drug Abuse Warning Network (DAWN).” Series I, Number14-A. (October 1996), page 55.
FORM01 through FORM52: Indicates the form of each drug or drug categorymentioned.
FWEIGHT: Indicates the weight of the episode after disclosure.
HOSPID: This is the pseudo identification number assigned to each hospital.
MOTIVE: Specifies the patient’s motive for taking the drug, e.g., dependence,recreational use, suicide, etc.
RACE: Identifies the patient’s race/ethnicity.
REASON: Indicates the reason for the emergency department visit, for example,unexpected drug reaction, overdose, withdrawal, etc.
ROUTE01 through ROUTE52: Identifies the route of drug administration (Oral,injected, sniff/snorted, missing, no response, multiple response) for each drug or drugcategory mentioned.
SEX: Indicates whether the patient is male or female.
STRATUM: Specifies the first stage sampling unit.
TOTMENS: The total number of drugs mentioned in the episode (with duplicates)
UNIQMENS: The unique number of drugs mentioned in the episode (without duplicates)
CASEID: Specifies the case identification number assigned to the ED visit
YEAR: Indicates the year in which the episode occurred, always 1994.
For four drug categories: DRUG15 (codeine combinations), DRUG30(inhalant/solvent/aerosol), DRUG51 (other drugs), and DRUG52 (drugs unknown), when thedrug category was mentioned more than once and different forms and/or routes were givencorresponding to each mention, form and/or route is coded "multiple response". If the same formand/or route was given for each of the multiple mentions, that form and/or route is coded.

16
XII. REFERENCES
Brookoff, D; Campbell, E. A; Shaw, L. M. (1993). The underreporting of cocaine-relatedtrauma: Drug abuse warning network reports vs hospital toxicology tests. American Journal ofPublic Health. Vol 83(3), 369-371.
Drug Abuse Warning Network Sample Design and Estimation Procedures: Technical Report.DHHS Publication No. (SMA)98-3178; Printed November 1997. (BKD249)
Kish, L. (1965). Survey sampling. New York: John Wiley and Sons.
XIII. OTHER DAWN PUBLICATIONS
SAMHSA Statistical Series, Annual Emergency Department Data 1994. Data from the DrugAbuse Warning Network (DAWN).” Series I, Number 14-A. (October 1996).
Historical Estimates from the Drug Abuse Warning Network - Advance Report #16: 1978-1994Estimates of Drug-Related Emergency Department Episodes. DHHS Publication No. (SMA)96-3105; SAMHSA; Printed August 1996. Also available on the Internet World Wide Web. (AR016)
Annual Medical Examiner Data 1993 - Data from the Drug Abuse Warning Network. Series 1,Number 13-B; DHHS Publication No. (SMA) 95-3019; SAMHSA; Printed 1995. (BKD160)
Preliminary Estimates from the Drug Abuse Warning Network - Advance Report #8: 1993Preliminary Estimates of Drug-Related Emergency Department Episodes. SAMHSA; PrintedDecember 1994. Also available on the Internet World Wide Web. (AR008)
Preliminary Estimates from the Drug Abuse Warning Network - Advance Report #6: 1993Preliminary Estimates of Drug-Related Emergency Room Episodes (January - June 1993).SAMHSA, Printed March 1994. (1988 through 1993 data). (AR006)
Annual Emergency Room Data 1992 - Data from the Drug Abuse Warning Network. Series 1,Number 12-A, DHHS Publication No. (SMA)94-2080; SAMHSA; Printed 1994. (BKD141)
Annual Medical Examiner Data 1992 - Data from the Drug Abuse Warning Network. Series 1,Number 12-B; DHHS Publication No. (SMA)94-2081; SAMHSA; Printed 1994. (BKD20)
Estimates from the Drug Abuse Warning Network - Advance Report #4: 1992 Estimates ofDrug-Related Emergency Room Episodes. SAMHSA; Printed September 1993. (AR004)
Annual Emergency Room Data 1991 - Data from the Drug Abuse Warning Network. Series 1,Number 11-A; DHHS Publication No. (ADM)92-1955; ADAMHA; Printed 1992 (BKD90).
Annual Medical Examiner Data 1991 - Data from the Drug Abuse Warning Network. Series 1,Number 11-B; DHHS Publication No. (ADM)92-1955; ADAMHA; Printed 1992. (BKD91)

17
XIIV. JOURNAL ARTICLES BASED ON DAWN DATA
Adams, E. H. (1991). Prevalence of prescription drug abuse: Data from the National Institute onDrug Abuse. New York State Journal of Medicine. Vol 91(11, Suppl), 32-36.
Albeck, J. H. (1987). Withdrawal and detoxification from benzodiazepine dependence: Apotential role for clonazepam. Journal of Clinical Psychiatry. Vol 48 (Suppl), 44-48.
Colliver, J. (1991). Characteristics and Implications of the New DAWN Emergency RoomSample. CEWG, 403-423 (in RP0909)
Davis, H.; Baum, C.; Graham, D. J. (1991). Indices of drug misuse for prescription drugs. International Journal of the Addictions. Vol 26(7), 777-795.
Domingo-Salvany, A.; Perez, K.; Hartnoll, R. L, Orti, R. M. (1994). The underreporting ofdrug-related episodes in a Barcelona emergency room. American Journal of Public Health. Vol84(8), 1340.
Goode, E. (1990). The American drug panic of the 1980s: Social construction or objective threat?The International Journal of the Addictions, Vol 25, (9), 1083-1098.
Jaffe, J. H. (1977) Some reflections on the evolution of current American approaches to problemsof drug abuse and to the treatment of drug abusers. Journal of Drug Issues. Vol 7(1), 1-12.
Kopstein, A. (1992). Drug Abuse Related Emergency Room Episodes in the United States.British Journal of Addictions, 87; 1071-1075, (1989/1990 data).
Pottieger, A. E; Tressell, P. A; Inciardi, J. A; Rosales, T. A. (1992) Cocaine use patterns andoverdose. Journal of Psychoactive Drugs. Vol 24(4), 399-410.
Ryser, P. E. (1983). Sex differences in substance abuse: 1976-1979. International Journal of theAddictions. Vol 18(1), 71-87.
Swisher, J. D; Hu, T. (1984). A review of the reliability and validity of the Drug Abuse WarningNetwork. International Journal of the Addictions. Vol 19(1), 57-77.
Wolf, R. C; Case, P; Pagano, M. (1998). Estimation of the prevalence of injection drug use ingreater Boston in 1993. Journal of Psychoactive Drugs. Vol 30(1), 21-24.
Woodward, J. A.; Retka, R. L; Ng, L. (1984). Construct validity of heroin abuse estimators.International Journal of the Addictions. Vol 19(1), 93-117.

18
APPENDIX 1DAWN 1994 PUBLIC USE FILE RECORD LAYOUT
Order Variable Type Length Position Format Label
13 AGE Num 4 59 AGE. AGE OF PATIENT1 CASEID Num 8 0 Unique identifier for each episode
12 DAWNAREA Num 4 55 DAWNAREA. NEW SAMPLE PMSA CODE7 DAWNQTR Num 4 28 DAWNQTR. ABSOLUTE QUARTER NUMBER IN DAWN
172 DAY Num 3 539 DAYS. Day of the week5 DISPOSTN Num 4 20 DISPOSTN. PATIENT DISPOSITION
16 DRUG01 Num 3 71 DRUG1A. ACETAMINOPHEN17 DRUG02 Num 3 74 DRUG2A. ALCOHOL-IN-COMBO18 DRUG03 Num 3 77 DRUG3A. ALPRAZOLAM19 DRUG04 Num 3 80 DRUG4A. AMITRIPTYLINE20 DRUG05 Num 3 83 DRUG5A. AMITRIPTYLN COMB21 DRUG06 Num 3 86 DRUG6A. AMPHETAMINE22 DRUG07 Num 3 89 DRUG7A. ASPIRIN23 DRUG08 Num 3 92 DRUG8A. BUTALBITAL COMBO24 DRUG09 Num 3 95 DRUG9A. CHLORAL HYDRATE25 DRUG10 Num 3 98 DRUG10A. CHLORDIAZEPOXIDE26 DRUG11 Num 3 101 DRUG11A. CHLORPROMAZINE27 DRUG12 Num 3 104 DRUG12A. CLORAZEPATE28 DRUG13 Num 3 107 DRUG13A. COCAINE29 DRUG14 Num 3 110 DRUG14A. CODEINE30 DRUG15 Num 3 113 DRUG15A. CODEINE COMBO31 DRUG16 Num 3 116 DRUG16A. d-PROPOXYPHENE32 DRUG17 Num 3 119 DRUG17A. DESIPRAMINE33 DRUG18 Num 3 122 DRUG18A. DIAZEPAM34 DRUG19 Num 3 125 DRUG19A. DIPHENHYDRAMINE35 DRUG20 Num 3 128 DRUG20A. DIPHENYLHYDANTOIN SODIUM36 DRUG21 Num 3 131 DRUG21A. DOXEPIN37 DRUG22 Num 3 134 DRUG22A. ETHCHLORVYNOL38 DRUG23 Num 3 137 DRUG23A. FLUOXETINE39 DRUG24 Num 3 140 DRUG24A. FLURAZEPAM40 DRUG25 Num 3 143 DRUG25A. GLUTETHIMIDE41 DRUG26 Num 3 146 DRUG26A. HALOPERIDOL42 DRUG27 Num 3 149 DRUG27A. HEROIN/MORPHINE43 DRUG28 Num 3 152 DRUG28A. HYDROMORPHONE44 DRUG29 Num 3 155 DRUG29A. IMIPRAMINE45 DRUG30 Num 3 158 DRUG30A. INHLNT/SOL/AER46 DRUG31 Num 3 161 DRUG31A. LORAZEPAM47 DRUG32 Num 3 164 DRUG32A. LSD48 DRUG33 Num 3 167 DRUG33A. MARIJUANA/HASHISH49 DRUG34 Num 3 170 DRUG34A. MEPERIDINE HCL50 DRUG35 Num 3 173 DRUG35A. MEPROBAMATE51 DRUG36 Num 3 176 DRUG36A. METHADONE52 DRUG37 Num 3 179 DRUG37A. METHAMPHETAMINE53 DRUG38 Num 3 182 DRUG38A. METHAQUALONE54 DRUG39 Num 3 185 DRUG39A. METHYLPHENIDATE55 DRUG40 Num 3 188 DRUG40A. OTC DIET AIDS56 DRUG41 Num 3 191 DRUG41A. OTC SLEEP AIDS

19
Order Variable Type Length Position Format Label
57 DRUG42 Num 3 194 DRUG42A. OXYCODONE58 DRUG43 Num 3 197 DRUG43A. PCP/PCP COMBO59 DRUG44 Num 3 200 DRUG44A. PENTAZOCINE60 DRUG45 Num 3 203 DRUG45A. PENTOBARBITAL61 DRUG46 Num 3 206 DRUG46A. PHENOBARBITAL62 DRUG47 Num 3 209 DRUG47A. SECOBARBITAL63 DRUG48 Num 3 212 DRUG48A. SECOBARBTL/AMOBARBITAL64 DRUG49 Num 3 215 DRUG49A. THIORIDAZINE65 DRUG50 Num 3 218 DRUG50A. TRIFLUOPERAZINE66 DRUG51 Num 3 221 DRUG51A. DRUGS, OTH CAT67 DRUG52 Num 3 224 DRUG52A. DRUGS, UNKNOWN68 FORM01 Num 3 227 FORM. Form of ACETAMINOPHEN69 FORM02 Num 3 230 FORM. Form of ALCOHOL-IN-COMBO70 FORM03 Num 3 233 FORM. Form of ALPRAZOLAM71 FORM04 Num 3 236 FORM. Form of AMITRIPTYLINE72 FORM05 Num 3 239 FORM. Form of AMITRIPTYLN COMB73 FORM06 Num 3 242 FORM. Form of AMPHETAMINE74 FORM07 Num 3 245 FORM. Form of ASPIRIN75 FORM08 Num 3 248 FORM. Form of BUTALBITAL COMBO76 FORM09 Num 3 251 FORM. Form of CHLORAL HYDRATE77 FORM10 Num 3 254 FORM. Form of CHLORDIAZEPOXIDE78 FORM11 Num 3 257 FORM. Form of CHLORPROMAZINE79 FORM12 Num 3 260 FORM. Form of CLORAZEPATE80 FORM13 Num 3 263 FORM. Form of COCAINE81 FORM14 Num 3 266 FORM. Form of CODEINE82 FORM15 Num 3 269 FORM. Form of CODEINE COMBO83 FORM16 Num 3 272 FORM. Form of d-PROPOXYPHENE84 FORM17 Num 3 275 FORM. Form of DESIPRAMINE85 FORM18 Num 3 278 FORM. Form of DIAZEPAM86 FORM19 Num 3 281 FORM. Form of DIPHENHYDRAMINE87 FORM20 Num 3 284 FORM. Form of DIPHENYLHYDANTOIN SODIUM88 FORM21 Num 3 287 FORM. Form of DOXEPIN89 FORM22 Num 3 290 FORM. Form of ETHCHLORVYNOL90 FORM23 Num 3 293 FORM. Form of FLUOXETINE91 FORM24 Num 3 296 FORM. Form of FLURAZEPAM92 FORM25 Num 3 299 FORM. Form of GLUTETHIMIDE93 FORM26 Num 3 302 FORM. Form of HALOPERIDOL94 FORM27 Num 3 305 FORM. Form of HEROIN/MORPHINE95 FORM28 Num 3 308 FORM. Form of HYDROMORPHONE96 FORM29 Num 3 311 FORM. Form of IMIPRAMINE97 FORM30 Num 3 314 FORM. Form of INHLNT/SOL/AER98 FORM31 Num 3 317 FORM. Form of LORAZEPAM99 FORM32 Num 3 320 FORM. Form of LSD
100 FORM33 Num 3 323 FORM. Form of MARIJUANA/HASHISH101 FORM34 Num 3 326 FORM. Form of MEPERIDINE HCL102 FORM35 Num 3 329 FORM. Form of MEPROBAMATE103 FORM36 Num 3 332 FORM. Form of METHADONE104 FORM37 Num 3 335 FORM. Form of METHAMPHETAMINE

20
Order Variable Type Length Position Format Label
105 FORM38 Num 3 338 FORM. Form of METHAQUALONE106 FORM39 Num 3 341 FORM. Form of METHYLPHENIDATE107 FORM40 Num 3 344 FORM. Form of OTC DIET AIDS108 FORM41 Num 3 347 FORM. Form of OTC SLEEP AIDS109 FORM42 Num 3 350 FORM. Form of OXYCODONE110 FORM43 Num 3 353 FORM. Form of PCP/PCP COMBO111 FORM44 Num 3 356 FORM. Form of PENTAZOCINE112 FORM45 Num 3 359 FORM. Form of PENTOBARBITAL113 FORM46 Num 3 362 FORM. Form of PHENOBARBITAL114 FORM47 Num 3 365 FORM. Form of SECOBARBITAL115 FORM48 Num 3 368 FORM. Form of SECOBARBTL/AMOBARBITAL116 FORM49 Num 3 371 FORM. Form of THIORIDAZINE117 FORM50 Num 3 374 FORM. Form of TRIFLUOPERAZINE118 FORM51 Num 3 377 FORM. Form of DRUGS in OTH CAT119 FORM52 Num 3 380 FORM. Form of DRUGS, UNKNOWN11 FWEIGHT Num 8 47 Episode weight10 HOSPID Num 8 39 Unique identifier for each hospital3 MOTIVE Num 4 12 MOTIVE. DRUG USE MOTIVE
14 RACE Num 4 63 RACE. PATIENT RACE/ETHNICITY4 REASON Num 4 16 REASON. REASON FOR ER VISIT
120 ROUTE01 Num 3 383 ROUTE. Route for ACETAMINOPHEN121 ROUTE02 Num 3 386 ROUTE. Route for ALCOHOL-IN-COMBO122 ROUTE03 Num 3 389 ROUTE. Route for ALPRAZOLAM123 ROUTE04 Num 3 392 ROUTE. Route for AMITRIPTYLINE124 ROUTE05 Num 3 395 ROUTE. Route for AMITRIPTYLN COMB125 ROUTE06 Num 3 398 ROUTE. Route for AMPHETAMINE126 ROUTE07 Num 3 401 ROUTE. Route for ASPIRIN127 ROUTE08 Num 3 404 ROUTE. Route for BUTALBITAL COMBO128 ROUTE09 Num 3 407 ROUTE. Route for CHLORAL HYDRATE129 ROUTE10 Num 3 410 ROUTE. Route for CHLORDIAZEPOXIDE130 ROUTE11 Num 3 413 ROUTE. Route for CHLORPROMAZINE131 ROUTE12 Num 3 416 ROUTE. Route for CLORAZEPATE132 ROUTE13 Num 3 419 ROUTE. Route for COCAINE133 ROUTE14 Num 3 422 ROUTE. Route for CODEINE134 ROUTE15 Num 3 425 ROUTE. Route for CODEINE COMBO135 ROUTE16 Num 3 428 ROUTE. Route for d-PROPOXYPHENE136 ROUTE17 Num 3 431 ROUTE. Route for DESIPRAMINE137 ROUTE18 Num 3 434 ROUTE. Route for DIAZEPAM138 ROUTE19 Num 3 437 ROUTE. Route for DIPHENHYDRAMINE139 ROUTE20 Num 3 440 ROUTE. Route for DIPHENYLHYDANTOIN SODIUM140 ROUTE21 Num 3 443 ROUTE. Route for DOXEPIN141 ROUTE22 Num 3 446 ROUTE. Route for ETHCHLORVYNOL142 ROUTE23 Num 3 449 ROUTE. Route for FLUOXETINE143 ROUTE24 Num 3 452 ROUTE. Route for FLURAZEPAM144 ROUTE25 Num 3 455 ROUTE. Route for GLUTETHIMIDE145 ROUTE26 Num 3 458 ROUTE. Route for HALOPERIDOL146 ROUTE27 Num 3 461 ROUTE. Route for HEROIN/MORPHINE147 ROUTE28 Num 3 464 ROUTE. Route for HYDROMORPHONE

21
Order Variable Type Length Position Format Label
148 ROUTE29 Num 3 467 ROUTE. Route for IMIPRAMINE149 ROUTE30 Num 3 470 ROUTE. Route for INHLNT/SOL/AER150 ROUTE31 Num 3 473 ROUTE. Route for LORAZEPAM151 ROUTE32 Num 3 476 ROUTE. Route for LSD152 ROUTE33 Num 3 479 ROUTE. Route for MARIJUANA/HASHISH153 ROUTE34 Num 3 482 ROUTE. Route for MEPERIDINE HCL154 ROUTE35 Num 3 485 ROUTE. Route for MEPROBAMATE155 ROUTE36 Num 3 488 ROUTE. Route for METHADONE156 ROUTE37 Num 3 491 ROUTE. Route for METHAMPHETAMINE157 ROUTE38 Num 3 494 ROUTE. Route for METHAQUALONE158 ROUTE39 Num 3 497 ROUTE. Route for METHYLPHENIDATE159 ROUTE40 Num 3 500 ROUTE. Route for OTC DIET AIDS160 ROUTE41 Num 3 503 ROUTE. Route for OTC SLEEP AIDS161 ROUTE42 Num 3 506 ROUTE. Route for OXYCODONE162 ROUTE43 Num 3 509 ROUTE. Route for PCP/PCP COMBO163 ROUTE44 Num 3 512 ROUTE. Route for PENTAZOCINE164 ROUTE45 Num 3 515 ROUTE. Route for PENTOBARBITAL165 ROUTE46 Num 3 518 ROUTE. Route for PHENOBARBITAL166 ROUTE47 Num 3 521 ROUTE. Route for SECOBARBITAL167 ROUTE48 Num 3 524 ROUTE. Route for SECOBARBTL/AMOBARBITAL168 ROUTE49 Num 3 527 ROUTE. Route for THIORIDAZINE169 ROUTE50 Num 3 530 ROUTE. Route for TRIFLUOPERAZINE170 ROUTE51 Num 3 533 ROUTE. Route for DRUGS in OTH CAT171 ROUTE52 Num 3 536 ROUTE. Route for DRUGS, UNKNOWN15 SEX Num 4 67 SEX. SEX OF PATIENT9 STRATUM Num 3 36 Modified stratum6 TOTMENS Num 4 24 TOTAL MENTIONS IN EPISODE (W/ DUPS)8 UNIQMENS Num 4 32 UNIQUE MENTIONS IN EPISODE (S/ DUPS)2 YEAR Num 4 8 YEAR EPISODE OCCURRED

22
APPENDIX 2DAWN 1994 PUBLIC USE FILE CODEBOOK
AGE OF PATIENT Cumulative Cumulative
AGE Frequency Percent Frequency Percent
-1=MISSING 646 0.4 646 0.41= 6 <=AGE<= 11 185 0.1 831 0.52=12 <=AGE<= 17 10327 6.2 11158 6.73=18 <=AGE<= 20 9351 5.6 20509 12.44=21 <=AGE<= 25 20287 12.2 40796 24.65=26 <=AGE<= 29 21825 13.2 62621 37.86=30 <=AGE<= 34 33001 19.9 95622 57.77=35 <=AGE<= 44 51177 30.9 146799 88.68=45 <=AGE<= 54 14695 8.9 161494 97.59=55 AND OVER 4152 2.5 165646 100.0
NEW SAMPLE PMSA CODECumulative Cumulative
DAWNAREA Frequency Percent Frequency Percent
1=ATLANTA 7464 4.5 7464 4.52=BALTIMORE 14349 8.7 21813 13.23=BOSTON 7064 4.3 28877 17.44=BUFFALO 2311 1.4 31188 18.85=CHICAGO 11587 7.0 42775 25.86=DALLAS 3314 2.0 46089 27.87=DENVER 3838 2.3 49927 30.18=DETROIT 10378 6.3 60305 36.49=LA-LONG BEACH 10107 6.1 70412 42.510=MIAMI-HIALEAH 5464 3.3 75876 45.811=MINNEAPOLIS-ST PAUL 3448 2.1 79324 47.912=NEW ORLEANS 3692 2.2 83016 50.113=NEW YORK 22847 13.8 105863 63.914=NEWARK 5867 3.5 111730 67.515=PHILADELPHIA 10803 6.5 122533 74.016=PHOENIX 5311 3.2 127844 77.217=ST. LOUIS 4033 2.4 131877 79.618=SAN DIEGO 3785 2.3 135662 81.919=SAN FRANCISCO 8016 4.8 143678 86.720=SEATTLE 5118 3.1 148796 89.821=WASHINGTON, DC 8640 5.2 157436 95.022=NATIONAL PANEL 8210 5.0 165646 100.0
23
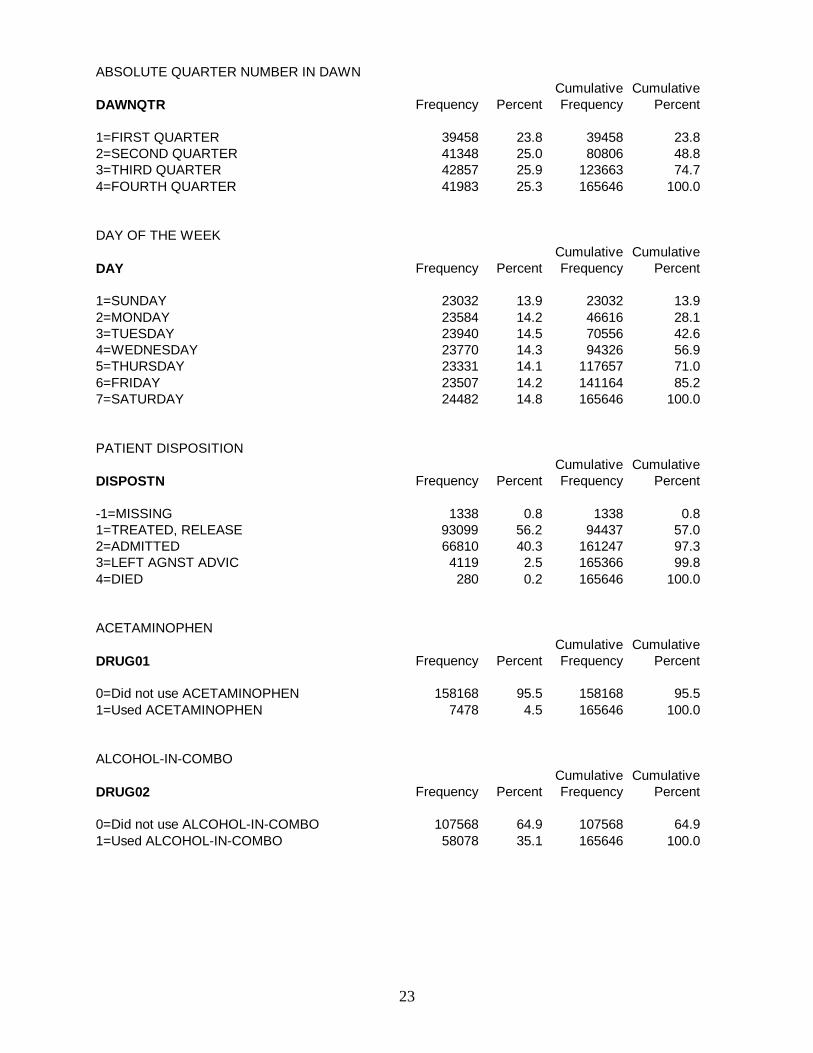
ABSOLUTE QUARTER NUMBER IN DAWNCumulative Cumulative
DAWNQTR Frequency Percent Frequency Percent
1=FIRST QUARTER 39458 23.8 39458 23.82=SECOND QUARTER 41348 25.0 80806 48.83=THIRD QUARTER 42857 25.9 123663 74.74=FOURTH QUARTER 41983 25.3 165646 100.0
DAY OF THE WEEKCumulative Cumulative
DAY Frequency Percent Frequency Percent
1=SUNDAY 23032 13.9 23032 13.92=MONDAY 23584 14.2 46616 28.13=TUESDAY 23940 14.5 70556 42.64=WEDNESDAY 23770 14.3 94326 56.95=THURSDAY 23331 14.1 117657 71.06=FRIDAY 23507 14.2 141164 85.27=SATURDAY 24482 14.8 165646 100.0
PATIENT DISPOSITIONCumulative Cumulative
DISPOSTN Frequency Percent Frequency Percent
-1=MISSING 1338 0.8 1338 0.81=TREATED, RELEASE 93099 56.2 94437 57.02=ADMITTED 66810 40.3 161247 97.33=LEFT AGNST ADVIC 4119 2.5 165366 99.84=DIED 280 0.2 165646 100.0
ACETAMINOPHENCumulative Cumulative
DRUG01 Frequency Percent Frequency Percent
0=Did not use ACETAMINOPHEN 158168 95.5 158168 95.51=Used ACETAMINOPHEN 7478 4.5 165646 100.0
ALCOHOL-IN-COMBOCumulative Cumulative
DRUG02 Frequency Percent Frequency Percent
0=Did not use ALCOHOL-IN-COMBO 107568 64.9 107568 64.91=Used ALCOHOL-IN-COMBO 58078 35.1 165646 100.0

24
ALPRAZOLAMCumulative Cumulative
DRUG03 Frequency Percent Frequency Percent
0=Did not use ALPRAZOLAM 162602 98.2 162602 98.21=Used ALPRAZOLAM 3044 1.8 165646 100.0
AMITRIPTYLINECumulative Cumulative
DRUG04 Frequency Percent Frequency Percent
0=Did not use AMITRIPTYLINE 164012 99.0 164012 99.01=Used AMITRIPTYLINE 1634 1.0 165646 100.0
AMITRIPTYLN COMBCumulative Cumulative
DRUG05 Frequency Percent Frequency Percent
0=Did not use AMITRIPTYLN COMB 165550 99.9 165550 99.91=Used AMITRIPTYLN COMB 96 0.1 165646 100.0
AMPHETAMINECumulative Cumulative
DRUG06 Frequency Percent Frequency Percent
0=Did not use AMPHETAMINE 163354 98.6 163354 98.61=Used AMPHETAMINE 2292 1.4 165646 100.0
ASPIRINCumulative Cumulative
DRUG07 Frequency Percent Frequency Percent
0=Did not use ASPIRIN 161957 97.8 161957 97.81=Used ASPIRIN 3689 2.2 165646 100.0
BUTALBITAL COMBOCumulative Cumulative
DRUG08 Frequency Percent Frequency Percent
0=Did not use BUTALBITAL COMBO 165314 99.8 165314 99.81=Used BUTALBITAL COMBO 332 0.2 165646 100.0

25
CHLORAL HYDRATECumulative Cumulative
DRUG09 Frequency Percent Frequency Percent
0=Did not use CHLORAL HYDRATE 165546 99.9 165546 99.91=Used CHLORAL HYDRATE 100 0.1 165646 100.0
CHLORDIAZEPOXIDECumulative Cumulative
DRUG10 Frequency Percent Frequency Percent
0=Did not use CHLORDIAZEPOXIDE 165188 99.7 165188 99.71=Used CHLORDIAZEPOXIDE 458 0.3 165646 100.0
CHLORPROMAZINECumulative Cumulative
DRUG11 Frequency Percent Frequency Percent
0=Did not use CHLORPROMAZINE 165155 99.7 165155 99.71=Used CHLORPROMAZINE 491 0.3 165646 100.0
CLORAZEPATECumulative Cumulative
DRUG12 Frequency Percent Frequency Percent
0=Did not use CLORAZEPATE 165480 99.9 165480 99.91=Used CLORAZEPATE 166 0.1 165646 100.0
COCAINECumulative Cumulative
DRUG13 Frequency Percent Frequency Percent
0=Did not use COCAINE 96760 58.4 96760 58.41=Used COCAINE 68886 41.6 165646 100.0
CODEINECumulative Cumulative
DRUG14 Frequency Percent Frequency Percent
0=Did not use CODEINE 165192 99.7 165192 99.71=Used CODEINE 454 0.3 165646 100.0

26
CODEINE COMBOCumulative Cumulative
DRUG15 Frequency Percent Frequency Percent
0=Did not use CODEINE COMBO 164213 99.1 164213 99.11=Used 1 CODEINE COMBO 1430 0.9 165643 100.02=Used 2 CODEINE COMBO 3 0.0 165646 100.0
d-PROPOXYPHENECumulative Cumulative
DRUG16 Frequency Percent Frequency Percent
0=Did not use d-PROPOXYPHENE 164564 99.3 164564 99.31=Used d-PROPOXYPHENE 1082 0.7 165646 100.0
DESIPRAMINECumulative Cumulative
DRUG17 Frequency Percent Frequency Percent
0=Did not use DESIPRAMINE 165424 99.9 165424 99.91=Used DESIPRAMINE 222 0.1 165646 100.0
DIAZEPAMCumulative Cumulative
DRUG18 Frequency Percent Frequency Percent
0=Did not use DIAZEPAM 162538 98.1 162538 98.11=Used DIAZEPAM 3108 1.9 165646 100.0
DIPHENHYDRAMINECumulative Cumulative
DRUG19 Frequency Percent Frequency Percent
0=Did not use DIPHENHYDRAMINE 163642 98.8 163642 98.81=Used DIPHENHYDRAMINE 2004 1.2 165646 100.0
DIPHENYLHYDANTOIN SODIUMCumulative Cumulative
DRUG20 Frequency Percent Frequency Percent
0=Did not use DIPHENYLHYDANTOIN SODIUM 164708 99.4 164708 99.41=Used DIPHENYLHYDANTOIN SODIUM 938 0.6 165646 100.0

27
DOXEPINCumulative Cumulative
DRUG21 Frequency Percent Frequency Percent
0=Did not use DOXEPIN 165025 99.6 165025 99.61=Used DOXEPIN 621 0.4 165646 100.0
ETHCHLORVYNOLCumulative Cumulative
DRUG22 Frequency Percent Frequency Percent
0=Did not use ETHCHLORVYNOL 165591 100.0 165591 100.01=Used ETHCHLORVYNOL 55 0.0 165646 100.0
FLUOXETINECumulative Cumulative
DRUG23 Frequency Percent Frequency Percent
0=Did not use FLUOXETINE 163863 98.9 163863 98.91=Used FLUOXETINE 1783 1.1 165646 100.0
FLURAZEPAMCumulative Cumulative
DRUG24 Frequency Percent Frequency Percent
0=Did not use FLURAZEPAM 165334 99.8 165334 99.81=Used FLURAZEPAM 312 0.2 165646 100.0
GLUTETHIMIDECumulative Cumulative
DRUG25 Frequency Percent Frequency Percent
0=Did not use GLUTETHIMIDE 165643 100.0 165643 100.01=Used GLUTETHIMIDE 3 0.0 165646 100.0
HALOPERIDOLCumulative Cumulative
DRUG26 Frequency Percent Frequency Percent
0=Did not use HALOPERIDOL 164722 99.4 164722 99.41=Used HALOPERIDOL 924 0.6 165646 100.0

28
HEROIN/MORPHINECumulative Cumulative
DRUG27 Frequency Percent Frequency Percent
0=Did not use HEROIN/MORPHINE 132742 80.1 132742 80.11=Used HEROIN/MORPHINE 32904 19.9 165646 100.0
HYDROMORPHONECumulative Cumulative
DRUG28 Frequency Percent Frequency Percent
0=Did not use HYDROMORPHONE 165525 99.9 165525 99.91=Used HYDROMORPHONE 121 0.1 165646 100.0
IMIPRAMINECumulative Cumulative
DRUG29 Frequency Percent Frequency Percent
0=Did not use IMIPRAMINE 165229 99.7 165229 99.71=Used IMIPRAMINE 417 0.3 165646 100.0
INHALENT/SOLVENT/AEROSOLCumulative Cumulative
DRUG30 Frequency Percent Frequency Percent
0=Did not use INHLNT/SOLV/AERO 165298 99.8 165298 99.81=Used 1 INHLNT/SOLV/AERO 343 0.2 165641 100.02=Used 2 INHLNT/SOLV/AERO 5 0.0 165646 100.0
LORAZEPAMCumulative Cumulative
DRUG31 Frequency Percent Frequency Percent
0=Did not use LORAZEPAM 163939 99.0 163939 99.01=Used LORAZEPAM 1707 1.0 165646 100.0
LSDCumulative Cumulative
DRUG32 Frequency Percent Frequency Percent
0=Did not use LSD 164185 99.1 164185 99.11=Used LSD 1461 0.9 165646 100.0

29
MARIJUANA/HASHISHCumulative Cumulative
DRUG33 Frequency Percent Frequency Percent
0=Did not use MARIJUANA/HASHISH 149301 90.1 149301 90.11=Used MARIJUANA/HASHISH 16345 9.9 165646 100.0
MEPERIDINE HCLCumulative Cumulative
DRUG34 Frequency Percent Frequency Percent
0=Did not use MEPERIDINE HCL 165451 99.9 165451 99.91=Used MEPERIDINE HCL 195 0.1 165646 100.0
MEPROBAMATECumulative Cumulative
DRUG35 Frequency Percent Frequency Percent
0=Did not use MEPROBAMATE 165544 99.9 165544 99.91=Used MEPROBAMATE 102 0.1 165646 100.0
METHADONECumulative Cumulative
DRUG36 Frequency Percent Frequency Percent
0=Did not use METHADONE 164066 99.0 164066 99.01=Used METHADONE 1580 1.0 165646 100.0
METHAMPHETAMINECumulative Cumulative
DRUG37 Frequency Percent Frequency Percent
0=Did not use METHAMPHETAMINE 161787 97.7 161787 97.71=Used METHAMPHETAMINE 3859 2.3 165646 100.0
METHAQUALONECumulative Cumulative
DRUG38 Frequency Percent Frequency Percent
0=Did not use METHAQUALONE 165530 99.9 165530 99.91=Used METHAQUALONE 116 0.1 165646 100.0

30
METHYLPHENIDATECumulative Cumulative
DRUG39 Frequency Percent Frequency Percent
0=Did not use METHYLPHENIDATE 165438 99.9 165438 99.91=Used METHYLPHENIDATE 208 0.1 165646 100.0
OVER THE COUNTER DIET AIDSCumulative Cumulative
DRUG40 Frequency Percent Frequency Percent
0=Did not use OTC DIET AIDS 165373 99.8 165373 99.81=Used OTC DIET AIDS 273 0.2 165646 100.0
OVER THE COUNTER SLEEP AIDSCumulative Cumulative
DRUG41 Frequency Percent Frequency Percent
0=Did not use OTC SLEEP AIDS 164506 99.3 164506 99.31=Used OTC SLEEP AIDS 1140 0.7 165646 100.0
OXYCODONECumulative Cumulative
DRUG42 Frequency Percent Frequency Percent
0=Did not use OXYCODONE 164760 99.5 164760 99.51=Used OXYCODONE 886 0.5 165646 100.0
PCP/PCP COMBOCumulative Cumulative
DRUG43 Frequency Percent Frequency Percent
0=Did not use PCP/PCP COMBO 162119 97.9 162119 97.91=Used PCP/PCP COMBO 3527 2.1 165646 100.0
PENTAZOCINECumulative Cumulative
DRUG44 Frequency Percent Frequency Percent
0=Did not use PENTAZOCINE 165595 100.0 165595 100.01=Used PENTAZOCINE 51 0.0 165646 100.0

31
PENTOBARBITALCumulative Cumulative
DRUG45 Frequency Percent Frequency Percent
0=Did not use PENTOBARBITAL 165623 100.0 165623 100.01=Used PENTOBARBITAL 23 0.0 165646 100.0
PHENOBARBITALCumulative Cumulative
DRUG46 Frequency Percent Frequency Percent
0=Did not use PHENOBARBITAL 165016 99.6 165016 99.61=Used PHENOBARBITAL 630 0.4 165646 100.0
SECOBARBITALCumulative Cumulative
DRUG47 Frequency Percent Frequency Percent
0=Did not use SECOBARBITAL 165597 100.0 165597 100.01=Used SECOBARBITAL 49 0.0 165646 100.0
SECOBARBTL/AMOBARBITALCumulative Cumulative
DRUG48 Frequency Percent Frequency Percent
0=Did not use SECOBARBTL/AMOBARBITAL 165638 100.0 165638 100.01=Used SECOBARBTL/AMOBARBITAL 8 0.0 165646 100.0
THIORIDAZINECumulative Cumulative
DRUG49 Frequency Percent Frequency Percent
0=Did not use THIORIDAZINE 165114 99.7 165114 99.71=Used THIORIDAZINE 532 0.3 165646 100.0
TRIFLUOPERAZINECumulative Cumulative
DRUG50 Frequency Percent Frequency Percent
0=Did not use TRIFLUOPERAZINE 165451 99.9 165451 99.91=Used TRIFLUOPERAZINE 195 0.1 165646 100.0

32
DRUGS, OTHER CATEGORYCumulative Cumulative
DRUG51 Frequency Percent Frequency Percent
0=Did not use DRUG,OTHER CAT 131420 79.3 131420 79.31=Used 1 DRUG,OTHER CAT 26954 16.3 158374 95.62=Used 2 DRUGS, OTHER CAT 5809 3.5 164183 99.13=Used 3 DRUGS, OTHER CAT 1253 0.8 165436 99.94=Used 4 DRUGS, OTHER CAT 210 0.1 165646 100.0
DRUGS, UNKNOWNCumulative Cumulative
DRUG52 Frequency Percent Frequency Percent
0=Did not use DRUG, UNKNOWN 150566 90.9 150566 90.91=Used 1 DRUG, UNKNOWN 15077 9.1 165643 100.02=Used 2 DRUGS, UNKNOWN 3 0.0 165646 100.0
Form of ACETAMINOPHENCumulative Cumulative
FORM01 Frequency Percent Frequency Percent
-3=MULT RESPONSE 4 0.0 4 0.0-2=NO RESPONSE 55 0.0 59 0.0-1=MISSING 273 0.2 332 0.20=Did not use drug 158168 95.5 158500 95.71=TABL/CAP/PILL 7114 4.3 165614 100.02=AEROSOL 8 0.0 165622 100.03=LIQUID/ORAL 18 0.0 165640 100.04=POWDER 1 0.0 165641 100.06=LIQUID/INJECT 1 0.0 165642 100.08=PLANT MATERIAL 2 0.0 165644 100.011=PIECES/CHUNKS 2 0.0 165646 100.0
Form of ALCOHOL-IN-COMBOCumulative Cumulative
FORM02 Frequency Percent Frequency Percent
0=Did not use drug 107568 64.9 107568 64.93=LIQUID/ORAL 58078 35.1 165646 100.0

33
Form of ALPRAZOLAMCumulative Cumulative
FORM03 Frequency Percent Frequency Percent
-2=NO RESPONSE 17 0.0 17 0.0-1=MISSING 162 0.1 179 0.10=Did not use drug 162602 98.2 162781 98.31=TABL/CAP/PILL 2856 1.7 165637 100.02=AEROSOL 5 0.0 165642 100.03=LIQUID/ORAL 2 0.0 165644 100.04=POWDER 1 0.0 165645 100.011=PIECES/CHUNKS 1 0.0 165646 100.0
Form of AMITRIPTYLINECumulative Cumulative
FORM04 Frequency Percent Frequency Percent
-3=MULT RESPONSE 1 0.0 1 0.0-2=NO RESPONSE 13 0.0 14 0.0-1=MISSING 64 0.0 78 0.00=Did not use drug 164012 99.0 164090 99.11=TABL/CAP/PILL 1551 0.9 165641 100.02=AEROSOL 3 0.0 165644 100.04=POWDER 1 0.0 165645 100.08=PLANT MATERIAL 1 0.0 165646 100.0
Form of AMITRIPTYLN COMBCumulative Cumulative
FORM05 Frequency Percent Frequency Percent
-2=NO RESPONSE 3 0.0 3 0.0-1=MISSING 6 0.0 9 0.00=Did not use drug 165550 99.9 165559 99.91=TABL/CAP/PILL 87 0.1 165646 100.0

34
Form of AMPHETAMINECumulative Cumulative
FORM06 Frequency Percent Frequency Percent
-3=MULT RESPONSE 1 0.0 1 0.0-2=NO RESPONSE 30 0.0 31 0.0-1=MISSING 1278 0.8 1309 0.80=Did not use drug 163354 98.6 164663 99.41=TABL/CAP/PILL 580 0.4 165243 99.82=AEROSOL 1 0.0 165244 99.83=LIQUID/ORAL 3 0.0 165247 99.84=POWDER 301 0.2 165548 99.96=LIQUID/INJECT 69 0.0 165617 100.07=CIGARETTE 6 0.0 165623 100.08=PLANT MATERIAL 1 0.0 165624 100.010=OTHER 2 0.0 165626 100.011=PIECES/CHUNKS 20 0.0 165646 100.0
Form of ASPIRINCumulative Cumulative
FORM07 Frequency Percent Frequency Percent
-3=MULT RESPONSE 3 0.0 3 0.0-2=NO RESPONSE 23 0.0 26 0.0-1=MISSING 130 0.1 156 0.10=Did not use drug 161957 97.8 162113 97.91=TABL/CAP/PILL 3521 2.1 165634 100.02=AEROSOL 3 0.0 165637 100.03=LIQUID/ORAL 4 0.0 165641 100.04=POWDER 1 0.0 165642 100.05=PAPER 1 0.0 165643 100.010=OTHER 3 0.0 165646 100.0
Form of BUTALBITAL COMBOCumulative Cumulative
FORM08 Frequency Percent Frequency Percent
-3=MULT RESPONSE 1 0.0 1 0.0-2=NO RESPONSE 5 0.0 6 0.0-1=MISSING 11 0.0 17 0.00=Did not use drug 165314 99.8 165331 99.81=TABL/CAP/PILL 313 0.2 165644 100.03=LIQUID/ORAL 2 0.0 165646 100.0
35
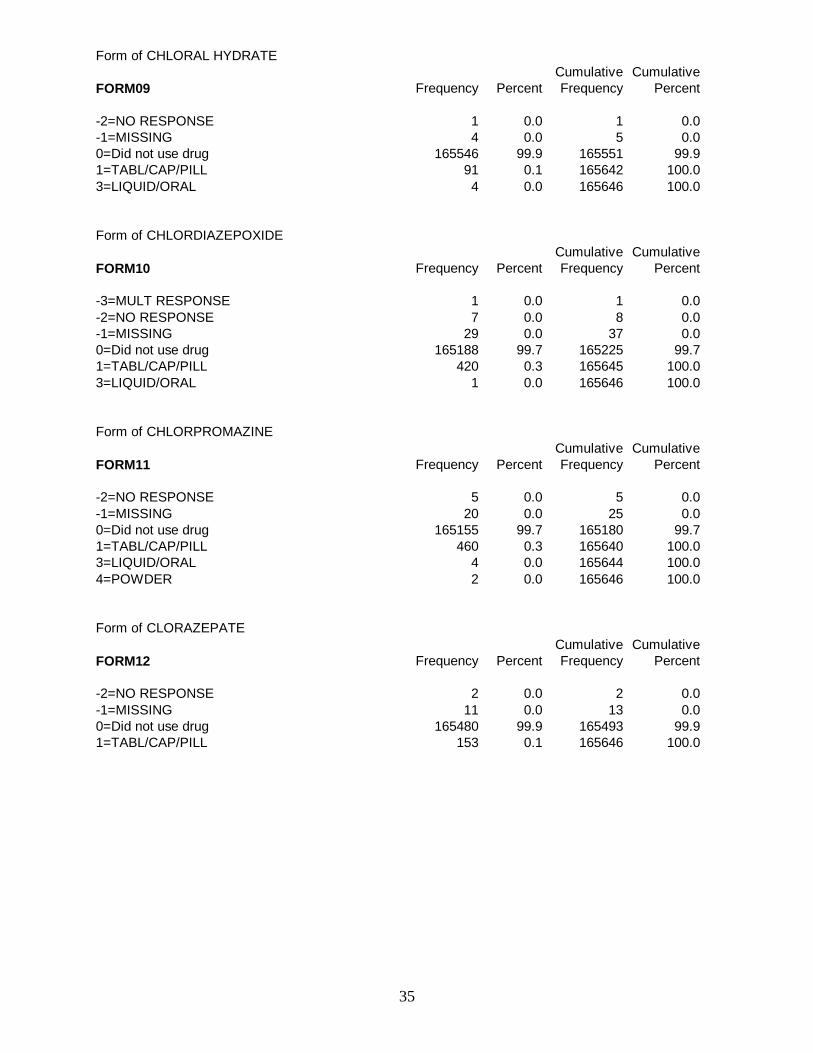
Form of CHLORAL HYDRATECumulative Cumulative
FORM09 Frequency Percent Frequency Percent
-2=NO RESPONSE 1 0.0 1 0.0-1=MISSING 4 0.0 5 0.00=Did not use drug 165546 99.9 165551 99.91=TABL/CAP/PILL 91 0.1 165642 100.03=LIQUID/ORAL 4 0.0 165646 100.0
Form of CHLORDIAZEPOXIDECumulative Cumulative
FORM10 Frequency Percent Frequency Percent
-3=MULT RESPONSE 1 0.0 1 0.0-2=NO RESPONSE 7 0.0 8 0.0-1=MISSING 29 0.0 37 0.00=Did not use drug 165188 99.7 165225 99.71=TABL/CAP/PILL 420 0.3 165645 100.03=LIQUID/ORAL 1 0.0 165646 100.0
Form of CHLORPROMAZINECumulative Cumulative
FORM11 Frequency Percent Frequency Percent
-2=NO RESPONSE 5 0.0 5 0.0-1=MISSING 20 0.0 25 0.00=Did not use drug 165155 99.7 165180 99.71=TABL/CAP/PILL 460 0.3 165640 100.03=LIQUID/ORAL 4 0.0 165644 100.04=POWDER 2 0.0 165646 100.0
Form of CLORAZEPATECumulative Cumulative
FORM12 Frequency Percent Frequency Percent
-2=NO RESPONSE 2 0.0 2 0.0-1=MISSING 11 0.0 13 0.00=Did not use drug 165480 99.9 165493 99.91=TABL/CAP/PILL 153 0.1 165646 100.0

36
Form of COCAINECumulative Cumulative
FORM13 Frequency Percent Frequency Percent
-3=MULT RESPONSE 1157 0.7 1157 0.7-2=NO RESPONSE 286 0.2 1443 0.9-1=MISSING 33422 20.2 34865 21.00=Did not use drug 96760 58.4 131625 79.51=TABL/CAP/PILL 74 0.0 131699 79.52=AEROSOL 8 0.0 131707 79.53=LIQUID/ORAL 38 0.0 131745 79.54=POWDER 14122 8.5 145867 88.15=PAPER 59 0.0 145926 88.16=LIQUID/INJECT 1845 1.1 147771 89.27=CIGARETTE 616 0.4 148387 89.68=PLANT MATERIAL 66 0.0 148453 89.610=OTHER 21 0.0 148474 89.611=PIECES/CHUNKS 17172 10.4 165646 100.0
Form of CODEINECumulative Cumulative
FORM14 Frequency Percent Frequency Percent
-2=NO RESPONSE 9 0.0 9 0.0-1=MISSING 97 0.1 106 0.10=Did not use drug 165192 99.7 165298 99.81=TABL/CAP/PILL 330 0.2 165628 100.02=AEROSOL 1 0.0 165629 100.03=LIQUID/ORAL 11 0.0 165640 100.04=POWDER 2 0.0 165642 100.06=LIQUID/INJECT 1 0.0 165643 100.011=PIECES/CHUNKS 3 0.0 165646 100.0
Form of CODEINE COMBOCumulative Cumulative
FORM15 Frequency Percent Frequency Percent
-3=MULT RESPONSE 1 0.0 1 0.0-2=NO RESPONSE 13 0.0 14 0.0-1=MISSING 33 0.0 47 0.00=Did not use drug 164213 99.1 164260 99.21=TABL/CAP/PILL 1361 0.8 165621 100.03=LIQUID/ORAL 25 0.0 165646 100.0

37
Form of d-PROPOXYPHENECumulative Cumulative
FORM16 Frequency Percent Frequency Percent
-3=MULT RESPONSE 1 0.0 1 0.0-2=NO RESPONSE 8 0.0 9 0.0-1=MISSING 66 0.0 75 0.00=Did not use drug 164564 99.3 164639 99.41=TABL/CAP/PILL 1007 0.6 165646 100.0
Form of DESIPRAMINECumulative Cumulative
FORM17 Frequency Percent Frequency Percent
-3=MULT RESPONSE 1 0.0 1 0.0-2=NO RESPONSE 7 0.0 8 0.0-1=MISSING 8 0.0 16 0.00=Did not use drug 165424 99.9 165440 99.91=TABL/CAP/PILL 204 0.1 165644 100.08=PLANT MATERIAL 1 0.0 165645 100.010=OTHER 1 0.0 165646 100.0
Form of DIAZEPAMCumulative Cumulative
FORM18 Frequency Percent Frequency Percent
-3=MULT RESPONSE 1 0.0 1 0.0-2=NO RESPONSE 27 0.0 28 0.0-1=MISSING 208 0.1 236 0.10=Did not use drug 162538 98.1 162774 98.31=TABL/CAP/PILL 2855 1.7 165629 100.02=AEROSOL 2 0.0 165631 100.03=LIQUID/ORAL 5 0.0 165636 100.04=POWDER 2 0.0 165638 100.06=LIQUID/INJECT 7 0.0 165645 100.07=CIGARETTE 1 0.0 165646 100.0

38
Form of DIPHENHYDRAMINECumulative Cumulative
FORM19 Frequency Percent Frequency Percent
-3=MULT RESPONSE 1 0.0 1 0.0-2=NO RESPONSE 26 0.0 27 0.0-1=MISSING 176 0.1 203 0.10=Did not use drug 163642 98.8 163845 98.91=TABL/CAP/PILL 1767 1.1 165612 100.03=LIQUID/ORAL 32 0.0 165644 100.06=LIQUID/INJECT 1 0.0 165645 100.010=OTHER 1 0.0 165646 100.0
Form of DIPHENYLHYDANTOIN SODIUMCumulative Cumulative
FORM20 Frequency Percent Frequency Percent
-2=NO RESPONSE 4 0.0 4 0.0-1=MISSING 30 0.0 34 0.00=Did not use drug 164708 99.4 164742 99.51=TABL/CAP/PILL 901 0.5 165643 100.02=AEROSOL 1 0.0 165644 100.03=LIQUID/ORAL 2 0.0 165646 100.0
Form of DOXEPINCumulative Cumulative
FORM21 Frequency Percent Frequency Percent
-2=NO RESPONSE 2 0.0 2 0.0-1=MISSING 26 0.0 28 0.00=Did not use drug 165025 99.6 165053 99.61=TABL/CAP/PILL 593 0.4 165646 100.0
Form of ETHCHLORVYNOLCumulative Cumulative
FORM22 Frequency Percent Frequency Percent
-2=NO RESPONSE 2 0.0 2 0.0-1=MISSING 2 0.0 4 0.00=Did not use drug 165591 100 165595 100.01=TABL/CAP/PILL 50 0.0 165645 100.04=POWDER 1 0.0 165646 100.0

39
Form of FLUOXETINECumulative Cumulative
FORM23 Frequency Percent Frequency Percent
-3=MULT RESPONSE 1 0.0 1 0.0-2=NO RESPONSE 21 0.0 22 0.0-1=MISSING 36 0.0 58 0.00=Did not use drug 163863 98.9 163921 99.01=TABL/CAP/PILL 1725 1.0 165646 100.0
Form of FLURAZEPAMCumulative Cumulative
FORM24 Frequency Percent Frequency Percent
-2=NO RESPONSE 2 0.0 2 0.0-1=MISSING 17 0.0 19 0.00=Did not use drug 165334 99.8 165353 99.81=TABL/CAP/PILL 293 0.2 165646 100.0
Form of GLUTETHIMIDECumulative Cumulative
FORM25 Frequency Percent Frequency Percent
0=Did not use drug 165643 100.0 165643 100.01=TABL/CAP/PILL 3 0.0 165646 100.0
Form of HALOPERIDOLCumulative Cumulative
FORM26 Frequency Percent Frequency Percent
-2=NO RESPONSE 11 0.0 11 0.0-1=MISSING 36 0.0 47 0.00=Did not use drug 164722 99.4 164769 99.51=TABL/CAP/PILL 873 0.5 165642 100.02=AEROSOL 1 0.0 165643 100.03=LIQUID/ORAL 3 0.0 165646 100.0

40
Form of HEROIN/MORPHINECumulative Cumulative
FORM27 Frequency Percent Frequency Percent
-3=MULT RESPONSE 52 0.0 52 0.0-2=NO RESPONSE 130 0.1 182 0.1-1=MISSING 14889 9.0 15071 9.10=Did not use drug 132742 80.1 147813 89.21=TABL/CAP/PILL 124 0.1 147937 89.32=AEROSOL 2 0.0 147939 89.33=LIQUID/ORAL 80 0.0 148019 89.44=POWDER 12240 7.4 160259 96.75=PAPER 22 0.0 160281 96.86=LIQUID/INJECT 4706 2.8 164987 99.67=CIGARETTE 40 0.0 165027 99.68=PLANT MATERIAL 37 0.0 165064 99.610=OTHER 29 0.0 165093 99.711=PIECES/CHUNKS 553 0.3 165646 100.0
Form of HYDROMORPHONECumulative Cumulative
FORM28 Frequency Percent Frequency Percent
-1=MISSING 39 0.0 39 0.00=Did not use drug 165525 99.9 165564 100.01=TABL/CAP/PILL 66 0.0 165630 100.06=LIQUID/INJECT 16 0.0 165646 100.0
Form of IMIPRAMINECumulative Cumulative
FORM29 Frequency Percent Frequency Percent
-2=NO RESPONSE 1 0.0 1 0.0-1=MISSING 30 0.0 31 0.00=Did not use drug 165229 99.7 165260 99.81=TABL/CAP/PILL 386 0.2 165646 100.0

41
Form of INHALENT/SOLVENT/AEROSOLCumulative Cumulative
FORM30 Frequency Percent Frequency Percent
-3=MULT RESPONSE 4 0.0 4 0.0-2=NO RESPONSE 3 0.0 7 0.0-1=MISSING 84 0.1 91 0.10=Did not use drug 165298 99.8 165389 99.81=TABL/CAP/PILL 7 0.0 165396 99.82=AEROSOL 142 0.1 165538 99.93=LIQUID/ORAL 61 0.0 165599 100.04=POWDER 1 0.0 165600 100.06=LIQUID/INJECT 4 0.0 165604 100.08=PLANT MATERIAL 1 0.0 165605 100.010=OTHER 41 0.0 165646 100.0
Form of LORAZEPAMCumulative Cumulative
FORM31 Frequency Percent Frequency Percent
-3=MULT RESPONSE 2 0.0 2 0.0-2=NO RESPONSE 11 0.0 13 0.0-1=MISSING 57 0.0 70 0.00=Did not use drug 163939 99.0 164009 99.01=TABL/CAP/PILL 1634 1.0 165643 100.02=AEROSOL 2 0.0 165645 100.04=POWDER 1 0.0 165646 100.0
Form of LSDCumulative Cumulative
FORM32 Frequency Percent Frequency Percent
-2=NO RESPONSE 18 0.0 18 0.0-1=MISSING 775 0.5 793 0.50=Did not use drug 164185 99.1 164978 99.61=TABL/CAP/PILL 92 0.1 165070 99.72=AEROSOL 1 0.0 165071 99.73=LIQUID/ORAL 20 0.0 165091 99.74=POWDER 20 0.0 165111 99.75=PAPER 496 0.3 165607 100.06=LIQUID/INJECT 5 0.0 165612 100.07=CIGARETTE 9 0.0 165621 100.08=PLANT MATERIAL 10 0.0 165631 100.010=OTHER 9 0.0 165640 100.011=PIECES/CHUNKS 6 0.0 165646 100.0

42
Form of MARIJUANA/HASHISHCumulative Cumulative
FORM33 Frequency Percent Frequency Percent
-3=MULT RESPONSE 9 0.0 9 0.0-2=NO RESPONSE 162 0.1 171 0.1-1=MISSING 7014 4.2 7185 4.30=Did not use drug 149301 90.1 156486 94.51=TABL/CAP/PILL 50 0.0 156536 94.52=AEROSOL 1 0.0 156537 94.53=LIQUID/ORAL 3 0.0 156540 94.54=POWDER 47 0.0 156587 94.55=PAPER 11 0.0 156598 94.56=LIQUID/INJECT 26 0.0 156624 94.67=CIGARETTE 3972 2.4 160596 97.08=PLANT MATERIAL 4930 3.0 165526 99.910=OTHER 10 0.0 165536 99.911=PIECES/CHUNKS 110 0.1 165646 100.0
Form of MEPERIDINE HCLCumulative Cumulative
FORM34 Frequency Percent Frequency Percent
-1=MISSING 31 0.0 31 0.00=Did not use drug 165451 99.9 165482 99.91=TABL/CAP/PILL 118 0.1 165600 100.02=AEROSOL 1 0.0 165601 100.03=LIQUID/ORAL 1 0.0 165602 100.06=LIQUID/INJECT 44 0.0 165646 100.0
Form of MEPROBAMATECumulative Cumulative
FORM35 Frequency Percent Frequency Percent
-1=MISSING 19 0.0 19 0.00=Did not use drug 165544 99.9 165563 99.91=TABL/CAP/PILL 83 0.1 165646 100.0

43
Form of METHADONECumulative Cumulative
FORM36 Frequency Percent Frequency Percent
-2=NO RESPONSE 30 0.0 30 0.0-1=MISSING 565 0.3 595 0.40=Did not use drug 164066 99.0 164661 99.41=TABL/CAP/PILL 344 0.2 165005 99.62=AEROSOL 6 0.0 165011 99.63=LIQUID/ORAL 574 0.3 165585 100.04=POWDER 37 0.0 165622 100.05=PAPER 1 0.0 165623 100.06=LIQUID/INJECT 16 0.0 165639 100.08=PLANT MATERIAL 3 0.0 165642 100.010=OTHER 3 0.0 165645 100.011=PIECES/CHUNKS 1 0.0 165646 100.0
Form of METHAMPHETAMINECumulative Cumulative
FORM37 Frequency Percent Frequency Percent
-3=MULT RESPONSE 20 0.0 20 0.0-2=NO RESPONSE 15 0.0 35 0.0-1=MISSING 1752 1.1 1787 1.10=Did not use drug 161787 97.7 163574 98.71=TABL/CAP/PILL 151 0.1 163725 98.83=LIQUID/ORAL 8 0.0 163733 98.84=POWDER 1532 0.9 165265 99.85=PAPER 6 0.0 165271 99.86=LIQUID/INJECT 207 0.1 165478 99.97=CIGARETTE 23 0.0 165501 99.98=PLANT MATERIAL 9 0.0 165510 99.910=OTHER 4 0.0 165514 99.911=PIECES/CHUNKS 132 0.1 165646 100.0
Form of METHAQUALONECumulative Cumulative
FORM38 Frequency Percent Frequency Percent
-1=MISSING 11 0.0 11 0.00=Did not use drug 165530 99.9 165541 99.91=TABL/CAP/PILL 105 0.1 165646 100.0

44
Form of METHYLPHENIDATECumulative Cumulative
FORM39 Frequency Percent Frequency Percent
-2=NO RESPONSE 1 0.0 1 0.0-1=MISSING 7 0.0 8 0.00=Did not use drug 165438 99.9 165446 99.91=TABL/CAP/PILL 195 0.1 165641 100.06=LIQUID/INJECT 5 0.0 165646 100.0
Form of OVER THE COUNTER DIET AIDSCumulative Cumulative
FORM40 Frequency Percent Frequency Percent
-3=MULT RESPONSE 1 0.0 1 0.0-1=MISSING 8 0.0 9 0.00=Did not use drug 165373 99.8 165382 99.81=TABL/CAP/PILL 264 0.2 165646 100.0
Form of OVER THE COUNTER SLEEP AIDSCumulative Cumulative
FORM41 Frequency Percent Frequency Percent
-3=MULT RESPONSE 2 0.0 2 0.0-2=NO RESPONSE 6 0.0 8 0.0-1=MISSING 37 0.0 45 0.00=Did not use drug 164506 99.3 164551 99.31=TABL/CAP/PILL 1075 0.6 165626 100.03=LIQUID/ORAL 20 0.0 165646 100.0
Form of OXYCODONECumulative Cumulative
FORM42 Frequency Percent Frequency Percent
-3=MULT RESPONSE 1 0.0 1 0.0-2=NO RESPONSE 7 0.0 8 0.0-1=MISSING 47 0.0 55 0.00=Did not use drug 164760 99.5 164815 99.51=TABL/CAP/PILL 831 0.5 165646 100.0

45
Form of PCP/PCP COMBOCumulative Cumulative
FORM43 Frequency Percent Frequency Percent
-3=MULT RESPONSE 2 0.0 2 0.0-2=NO RESPONSE 35 0.0 37 0.0-1=MISSING 2105 1.3 2142 1.30=Did not use drug 162119 97.9 164261 99.21=TABL/CAP/PILL 83 0.1 164344 99.23=LIQUID/ORAL 12 0.0 164356 99.24=POWDER 385 0.2 164741 99.55=PAPER 20 0.0 164761 99.56=LIQUID/INJECT 17 0.0 164778 99.57=CIGARETTE 687 0.4 165465 99.98=PLANT MATERIAL 130 0.1 165595 100.010=OTHER 11 0.0 165606 100.011=PIECES/CHUNKS 40 0.0 165646 100.0
Form of PENTAZOCINECumulative Cumulative
FORM44 Frequency Percent Frequency Percent
-2=NO RESPONSE 2 0.0 2 0.0-1=MISSING 4 0.0 6 0.00=Did not use drug 165595 100.0 165601 100.01=TABL/CAP/PILL 45 0.0 165646 100.0
Form of PENTOBARBITALCumulative Cumulative
FORM45 Frequency Percent Frequency Percent
-1=MISSING 1 0.0 1 0.00=Did not use drug 165623 100.0 165624 100.01=TABL/CAP/PILL 20 0.0 165644 100.06=LIQUID/INJECT 1 0.0 165645 100.010=OTHER 1 0.0 165646 100.0

46
Form of PHENOBARBITALCumulative Cumulative
FORM46 Frequency Percent Frequency Percent
-2=NO RESPONSE 5 0.0 5 0.0-1=MISSING 31 0.0 36 0.00=Did not use drug 165016 99.6 165052 99.61=TABL/CAP/PILL 590 0.4 165642 100.02=AEROSOL 2 0.0 165644 100.03=LIQUID/ORAL 1 0.0 165645 100.06=LIQUID/INJECT 1 0.0 165646 100.0
Form of SECOBARBITALCumulative Cumulative
FORM47 Frequency Percent Frequency Percent
-3=MULT RESPONSE 1 0.0 1 0.0-1=MISSING 3 0.0 4 0.00=Did not use drug 165597 100 165601 100.01=TABL/CAP/PILL 45 0.0 165646 100.0
Form of SECOBARBTL/AMOBARBITALCumulative Cumulative
FORM48 Frequency Percent Frequency Percent
-1=MISSING 3 0.0 3 0.00=Did not use drug 165638 100.0 165641 100.01=TABL/CAP/PILL 5 0.0 165646 100.0
Form of THIORIDAZINECumulative Cumulative
FORM49 Frequency Percent Frequency Percent
-3=MULT RESPONSE 1 0.0 1 0.0-2=NO RESPONSE 6 0.0 7 0.0-1=MISSING 22 0.0 29 0.00=Did not use drug 165114 99.7 165143 99.71=TABL/CAP/PILL 498 0.3 165641 100.02=AEROSOL 3 0.0 165644 100.03=LIQUID/ORAL 1 0.0 165645 100.06=LIQUID/INJECT 1 0.0 165646 100.0

47
Form of TRIFLUOPERAZINECumulative Cumulative
FORM50 Frequency Percent Frequency Percent
-2=NO RESPONSE 1 0.0 1 0.0-1=MISSING 4 0.0 5 0.00=Did not use drug 165451 99.9 165456 99.91=TABL/CAP/PILL 190 0.1 165646 100.0
Form of DRUGS in OTHER CATEGORYCumulative Cumulative
FORM51 Frequency Percent Frequency Percent
-3=MULT RESPONSE 966 0.6 966 0.6-2=NO RESPONSE 241 0.1 1207 0.7-1=MISSING 6137 3.7 7344 4.40=Did not use drug 131420 79.3 138764 83.81=TABL/CAP/PILL 25709 15.5 164473 99.32=AEROSOL 39 0.0 164512 99.33=LIQUID/ORAL 392 0.2 164904 99.64=POWDER 150 0.1 165054 99.65=PAPER 3 0.0 165057 99.66=LIQUID/INJECT 334 0.2 165391 99.87=CIGARETTE 23 0.0 165414 99.98=PLANT MATERIAL 196 0.1 165610 100.010=OTHER 21 0.0 165631 100.011=PIECES/CHUNKS 15 0.0 165646 100.0
Form of DRUGS, UNKNOWNCumulative Cumulative
FORM52 Frequency Percent Frequency Percent
-3=MULT RESPONSE 51 0.0 51 0.0-2=NO RESPONSE 33 0.0 84 0.1-1=MISSING 11155 6.7 11239 6.80=Did not use drug 150566 90.9 161805 97.71=TABL/CAP/PILL 1773 1.1 163578 98.82=AEROSOL 8 0.0 163586 98.83=LIQUID/ORAL 35 0.0 163621 98.84=POWDER 237 0.1 163858 98.95=PAPER 3 0.0 163861 98.96=LIQUID/INJECT 1700 1.0 165561 99.97=CIGARETTE 25 0.0 165586 100.08=PLANT MATERIAL 26 0.0 165612 100.010=OTHER 12 0.0 165624 100.011=PIECES/CHUNKS 22 0.0 165646 100.0

48
DRUG USE MOTIVECumulative Cumulative
MOTIVE Frequency Percent Frequency Percent
-1=MISSING 22297 13.5 22297 13.52=DEPENDENCE 78436 47.4 100733 60.83=SUICIDE 39866 24.1 140599 84.95=OTHER 958 0.6 141557 85.56=RECREATIONAL USE 14411 8.7 155968 94.27=PSYCHO EFFECTS 9678 5.8 165646 100.0
PATIENT RACE/ETHNICITYCumulative Cumulative
RACE Frequency Percent Frequency Percent
-1=MISSING 13906 8.4 13906 8.41=WHITE 56616 34.2 70522 42.62=BLACK 75014 45.3 145536 87.93=HISPANIC 18254 11.0 163790 98.94=AMER IND/ALASKN 257 0.2 164047 99.05=OTHER 1599 1.0 165646 100.0
REASON FOR ER VISITCumulative Cumulative
REASON Frequency Percent Frequency Percent
-2=NO RESPONSE 2687 1.6 2687 1.6-1=MISSING 5103 3.1 7790 4.71=UNEXPECTD REACTN 29935 18.1 37725 22.82=OVERDOSE 55252 33.4 92977 56.13=WITHDRAWL 4885 2.9 97862 59.14=CHRONIC EFFECTS 33045 19.9 130907 79.06=OTHER 8070 4.9 138977 83.97=SEEKING DETOXFTN 17922 10.8 156899 94.78=ACCIDENT/INJURY 8747 5.3 165646 100.0

49
Route for ACETAMINOPHENCumulative Cumulative
ROUTE01 Frequency Percent Frequency Percent
-3=MULT RESPONSE 3 0.0 3 0.0-2=NO RESPONSE 55 0.0 58 0.0-1=MISSING 267 0.2 325 0.20=Did not use drug 158168 95.5 158493 95.71=ORAL 7137 4.3 165630 100.02=INJECTED 10 0.0 165640 100.04=SMOKE 4 0.0 165644 100.05=SNIFF/SNORT 1 0.0 165645 100.07=OTHER 1 0.0 165646 100.0
Route for ALCOHOL-IN-COMBOCumulative Cumulative
ROUTE02 Frequency Percent Frequency Percent
0=Did not use drug 107568 64.9 107568 64.91=ORAL 58078 35.1 165646 100.0
Route for ALPRAZOLAMCumulative Cumulative
ROUTE03 Frequency Percent Frequency Percent
-2=NO RESPONSE 19 0.0 19 0.0-1=MISSING 152 0.1 171 0.10=Did not use drug 162602 98.2 162773 98.31=ORAL 2861 1.7 165634 100.02=INJECTED 11 0.0 165645 100.04=SMOKE 1 0.0 165646 100.0
Route for AMITRIPTYLINECumulative Cumulative
ROUTE04 Frequency Percent Frequency Percent
-3=MULT RESPONSE 1 0.0 1 0.0-2=NO RESPONSE 14 0.0 15 0.0-1=MISSING 57 0.0 72 0.00=Did not use drug 164012 99.0 164084 99.11=ORAL 1560 0.9 165644 100.02=INJECTED 1 0.0 165645 100.05=SNIFF/SNORT 1 0.0 165646 100.0

50
Route for AMITRIPTYLN COMBCumulative Cumulative
ROUTE05 Frequency Percent Frequency Percent
-2=NO RESPONSE 3 0.0 3 0.0-1=MISSING 6 0.0 9 0.00=Did not use drug 165550 99.9 165559 99.91=ORAL 87 0.1 165646 100.0
Route for AMPHETAMINECumulative Cumulative
ROUTE06 Frequency Percent Frequency Percent
-3=MULT RESPONSE 5 0.0 5 0.0-2=NO RESPONSE 28 0.0 33 0.0-1=MISSING 1183 0.7 1216 0.70=Did not use drug 163354 98.6 164570 99.41=ORAL 601 0.4 165171 99.72=INJECTED 258 0.2 165429 99.93=INHALE 7 0.0 165436 99.94=SMOKE 46 0.0 165482 99.95=SNIFF/SNORT 163 0.1 165645 100.07=OTHER 1 0.0 165646 100.0
Route for ASPIRINCumulative Cumulative
ROUTE07 Frequency Percent Frequency Percent
-3=MULT RESPONSE 2 0.0 2 0.0-2=NO RESPONSE 25 0.0 27 0.0-1=MISSING 130 0.1 157 0.10=Did not use drug 161957 97.8 162114 97.91=ORAL 3522 2.1 165636 100.02=INJECTED 5 0.0 165641 100.03=INHALE 1 0.0 165642 100.04=SMOKE 2 0.0 165644 100.07=OTHER 2 0.0 165646 100.0
Route for BUTALBITAL COMBOCumulative Cumulative
ROUTE08 Frequency Percent Frequency Percent
-3=MULT RESPONSE 1 0.0 1 0.0-2=NO RESPONSE 4 0.0 5 0.0-1=MISSING 11 0.0 16 0.00=Did not use drug 165314 99.8 165330 99.81=ORAL 316 0.2 165646 100.0

51
Route for CHLORAL HYDRATECumulative Cumulative
ROUTE09 Frequency Percent Frequency Percent
-2=NO RESPONSE 1 0.0 1 0.0-1=MISSING 2 0.0 3 0.00=Did not use drug 165546 99.9 165549 99.91=ORAL 95 0.1 165644 100.02=INJECTED 2 0.0 165646 100.0
Route for CHLORDIAZEPOXIDECumulative Cumulative
ROUTE10 Frequency Percent Frequency Percent
-3=MULT RESPONSE 1 0.0 1 0.0-2=NO RESPONSE 7 0.0 8 0.0-1=MISSING 28 0.0 36 0.00=Did not use drug 165188 99.7 165224 99.71=ORAL 422 0.3 165646 100.0
Route for CHLORPROMAZINECumulative Cumulative
ROUTE11 Frequency Percent Frequency Percent
-2=NO RESPONSE 5 0.0 5 0.0-1=MISSING 19 0.0 24 0.00=Did not use drug 165155 99.7 165179 99.71=ORAL 465 0.3 165644 100.05=SNIFF/SNORT 2 0.0 165646 100.0
Route for CLORAZEPATECumulative Cumulative
ROUTE12 Frequency Percent Frequency Percent
-2=NO RESPONSE 2 0.0 2 0.0-1=MISSING 11 0.0 13 0.00=Did not use drug 165480 99.9 165493 99.91=ORAL 152 0.1 165645 100.02=INJECTED 1 0.0 165646 100.0

52
Route for COCAINECumulative Cumulative
ROUTE13 Frequency Percent Frequency Percent
-3=MULT RESPONSE 1349 0.8 1349 0.8-2=NO RESPONSE 304 0.2 1653 1.0-1=MISSING 25247 15.2 26900 16.20=Did not use drug 96760 58.4 123660 74.71=ORAL 330 0.2 123990 74.92=INJECTED 10923 6.6 134913 81.43=INHALE 410 0.2 135323 81.74=SMOKE 23804 14.4 159127 96.15=SNIFF/SNORT 6482 3.9 165609 100.07=OTHER 37 0.0 165646 100.0
Route for CODEINECumulative Cumulative
ROUTE14 Frequency Percent Frequency Percent
-2=NO RESPONSE 11 0.0 11 0.0-1=MISSING 86 0.1 97 0.10=Did not use drug 165192 99.7 165289 99.81=ORAL 349 0.2 165638 100.02=INJECTED 3 0.0 165641 100.04=SMOKE 3 0.0 165644 100.05=SNIFF/SNORT 2 0.0 165646 100.0
Route for CODEINE COMBOCumulative Cumulative
ROUTE15 Frequency Percent Frequency Percent
-3=MULT RESPONSE 1 0.0 1 0.0-2=NO RESPONSE 14 0.0 15 0.0-1=MISSING 31 0.0 46 0.00=Did not use drug 164213 99.1 164259 99.21=ORAL 1386 0.8 165645 100.02=INJECTED 1 0.0 165646 100.0

53
Route for d-PROPOXYPHENECumulative Cumulative
ROUTE16 Frequency Percent Frequency Percent
-3=MULT RESPONSE 1 0.0 1 0.0-2=NO RESPONSE 7 0.0 8 0.0-1=MISSING 65 0.0 73 0.00=Did not use drug 164564 99.3 164637 99.41=ORAL 1007 0.6 165644 100.02=INJECTED 1 0.0 165645 100.04=SMOKE 1 0.0 165646 100.0
Route for DESIPRAMINECumulative Cumulative
ROUTE17 Frequency Percent Frequency Percent
-2=NO RESPONSE 8 0.0 8 0.0-1=MISSING 10 0.0 18 0.00=Did not use drug 165424 99.9 165442 99.91=ORAL 203 0.1 165645 100.07=OTHER 1 0.0 165646 100.0
Route for DIAZEPAMCumulative Cumulative
ROUTE18 Frequency Percent Frequency Percent
-3=MULT RESPONSE 1 0.0 1 0.0-2=NO RESPONSE 28 0.0 29 0.0-1=MISSING 199 0.1 228 0.10=Did not use drug 162538 98.1 162766 98.31=ORAL 2863 1.7 165629 100.02=INJECTED 14 0.0 165643 100.04=SMOKE 1 0.0 165644 100.05=SNIFF/SNORT 2 0.0 165646 100.0
Route for DIPHENHYDRAMINECumulative Cumulative
ROUTE19 Frequency Percent Frequency Percent
-3=MULT RESPONSE 1 0.0 1 0.0-2=NO RESPONSE 24 0.0 25 0.0-1=MISSING 151 0.1 176 0.10=Did not use drug 163642 98.8 163818 98.91=ORAL 1823 1.1 165641 100.02=INJECTED 4 0.0 165645 100.03=INHALE 1 0.0 165646 100.0

54
Route for DIPHENYLHYDANTOIN SODIUMCumulative Cumulative
ROUTE20 Frequency Percent Frequency Percent
-2=NO RESPONSE 4 0.0 4 0.0-1=MISSING 27 0.0 31 0.00=Did not use drug 164708 99.4 164739 99.51=ORAL 904 0.5 165643 100.02=INJECTED 2 0.0 165645 100.07=OTHER 1 0.0 165646 100.0
Route for DOXEPINCumulative Cumulative
ROUTE21 Frequency Percent Frequency Percent
-2=NO RESPONSE 3 0.0 3 0.0-1=MISSING 23 0.0 26 0.00=Did not use drug 165025 99.6 165051 99.61=ORAL 595 0.4 165646 100.0
Route for ETHCHLORVYNOLCumulative Cumulative
ROUTE22 Frequency Percent Frequency Percent
-2=NO RESPONSE 2 0.0 2 0.0-1=MISSING 1 0.0 3 0.00=Did not use drug 165591 100.0 165594 100.01=ORAL 51 0.0 165645 100.02=INJECTED 1 0.0 165646 100.0
Route for FLUOXETINECumulative Cumulative
ROUTE23 Frequency Percent Frequency Percent
-3=MULT RESPONSE 1 0.0 1 0.0-2=NO RESPONSE 22 0.0 23 0.0-1=MISSING 33 0.0 56 0.00=Did not use drug 163863 98.9 163919 99.01=ORAL 1723 1.0 165642 100.02=INJECTED 2 0.0 165644 100.05=SNIFF/SNORT 2 0.0 165646 100.0

55
Route for FLURAZEPAMCumulative Cumulative
ROUTE24 Frequency Percent Frequency Percent
-2=NO RESPONSE 2 0.0 2 0.0-1=MISSING 15 0.0 17 0.00=Did not use drug 165334 99.8 165351 99.81=ORAL 295 0.2 165646 100.0
Route for GLUTETHIMIDECumulative Cumulative
ROUTE25 Frequency Percent Frequency Percent
0=Did not use drug 165643 100.0 165643 100.01=ORAL 3 0.0 165646 100.0
Route for HALOPERIDOLCumulative Cumulative
ROUTE26 Frequency Percent Frequency Percent
-2=NO RESPONSE 10 0.0 10 0.0-1=MISSING 32 0.0 42 0.00=Did not use drug 164722 99.4 164764 99.51=ORAL 879 0.5 165643 100.02=INJECTED 2 0.0 165645 100.05=SNIFF/SNORT 1 0.0 165646 100.0
Route for HEROIN/MORPHINECumulative Cumulative
ROUTE27 Frequency Percent Frequency Percent
-3=MULT RESPONSE 153 0.1 153 0.1-2=NO RESPONSE 142 0.1 295 0.2-1=MISSING 7950 4.8 8245 5.00=Did not use drug 132742 80.1 140987 85.11=ORAL 179 0.1 141166 85.22=INJECTED 20235 12.2 161401 97.43=INHALE 102 0.1 161503 97.54=SMOKE 533 0.3 162036 97.85=SNIFF/SNORT 3589 2.2 165625 100.07=OTHER 21 0.0 165646 100.0

56
Route for HYDROMORPHONECumulative Cumulative
ROUTE28 Frequency Percent Frequency Percent
-1=MISSING 28 0.0 28 0.00=Did not use drug 165525 99.9 165553 99.91=ORAL 59 0.0 165612 100.02=INJECTED 34 0.0 165646 100.0
Route for IMIPRAMINECumulative Cumulative
ROUTE29 Frequency Percent Frequency Percent
-2=NO RESPONSE 1 0.0 1 0.0-1=MISSING 30 0.0 31 0.00=Did not use drug 165229 99.7 165260 99.81=ORAL 386 0.2 165646 100.0
Route for INHALENT/SOLVENT/AEROSOLCumulative Cumulative
ROUTE30 Frequency Percent Frequency Percent
-3=MULT RESPONSE 4 0.0 4 0.0-2=NO RESPONSE 3 0.0 7 0.0-1=MISSING 16 0.0 23 0.00=Did not use drug 165298 99.8 165321 99.81=ORAL 47 0.0 165368 99.82=INJECTED 6 0.0 165374 99.83=INHALE 185 0.1 165559 99.94=SMOKE 2 0.0 165561 99.95=SNIFF/SNORT 84 0.1 165645 100.07=OTHER 1 0.0 165646 100.0
Route for LORAZEPAMCumulative Cumulative
ROUTE31 Frequency Percent Frequency Percent
-3=MULT RESPONSE 2 0.0 2 0.0-2=NO RESPONSE 12 0.0 14 0.0-1=MISSING 55 0.0 69 0.00=Did not use drug 163939 99.0 164008 99.01=ORAL 1633 1.0 165641 100.02=INJECTED 5 0.0 165646 100.0

57
Route for LSDCumulative Cumulative
ROUTE32 Frequency Percent Frequency Percent
-2=NO RESPONSE 16 0.0 16 0.0-1=MISSING 738 0.4 754 0.50=Did not use drug 164185 99.1 164939 99.61=ORAL 634 0.4 165573 100.02=INJECTED 19 0.0 165592 100.03=INHALE 2 0.0 165594 100.04=SMOKE 35 0.0 165629 100.05=SNIFF/SNORT 6 0.0 165635 100.07=OTHER 11 0.0 165646 100.0
Route for MARIJUANA/HASHISHCumulative Cumulative
ROUTE33 Frequency Percent Frequency Percent
-3=MULT RESPONSE 12 0.0 12 0.0-2=NO RESPONSE 157 0.1 169 0.1-1=MISSING 4524 2.7 4693 2.80=Did not use drug 149301 90.1 153994 93.01=ORAL 85 0.1 154079 93.02=INJECTED 45 0.0 154124 93.03=INHALE 157 0.1 154281 93.14=SMOKE 11288 6.8 165569 100.05=SNIFF/SNORT 73 0.0 165642 100.07=OTHER 4 0.0 165646 100.0
Route for MEPERIDINE HCLCumulative Cumulative
ROUTE34 Frequency Percent Frequency Percent
-1=MISSING 26 0.0 26 0.00=Did not use drug 165451 99.9 165477 99.91=ORAL 119 0.1 165596 100.02=INJECTED 50 0.0 165646 100.0
Route for MEPROBAMATECumulative Cumulative
ROUTE35 Frequency Percent Frequency Percent
-1=MISSING 19 0.0 19 0.00=Did not use drug 165544 99.9 165563 99.91=ORAL 83 0.1 165646 100.0

58
Route for METHADONECumulative Cumulative
ROUTE36 Frequency Percent Frequency Percent
-2=NO RESPONSE 30 0.0 30 0.0-1=MISSING 434 0.3 464 0.30=Did not use drug 164066 99.0 164530 99.31=ORAL 1049 0.6 165579 100.02=INJECTED 54 0.0 165633 100.03=INHALE 1 0.0 165634 100.04=SMOKE 2 0.0 165636 100.05=SNIFF/SNORT 7 0.0 165643 100.07=OTHER 3 0.0 165646 100.0
Route for METHAMPHETAMINECumulative Cumulative
ROUTE37 Frequency Percent Frequency Percent
-3=MULT RESPONSE 50 0.0 50 0.0-2=NO RESPONSE 17 0.0 67 0.0-1=MISSING 1479 0.9 1546 0.90=Did not use drug 161787 97.7 163333 98.61=ORAL 219 0.1 163552 98.72=INJECTED 1046 0.6 164598 99.43=INHALE 34 0.0 164632 99.44=SMOKE 280 0.2 164912 99.65=SNIFF/SNORT 722 0.4 165634 100.07=OTHER 12 0.0 165646 100.0
Route for METHAQUALONECumulative Cumulative
ROUTE38 Frequency Percent Frequency Percent
-1=MISSING 9 0.0 9 0.00=Did not use drug 165530 99.9 165539 99.91=ORAL 107 0.1 165646 100.0
Route for METHYLPHENIDATECumulative Cumulative
ROUTE39 Frequency Percent Frequency Percent
-2=NO RESPONSE 1 0.0 1 0.0-1=MISSING 6 0.0 7 0.00=Did not use drug 165438 99.9 165445 99.91=ORAL 193 0.1 165638 100.02=INJECTED 7 0.0 165645 100.05=SNIFF/SNORT 1 0.0 165646 100.0

59
Route for OVER THE COUNTER DIET AIDSCumulative Cumulative
ROUTE40 Frequency Percent Frequency Percent
-3=MULT RESPONSE 1 0.0 1 0.0-1=MISSING 8 0.0 9 0.00=Did not use drug 165373 99.8 165382 99.81=ORAL 264 0.2 165646 100.0
Route for OVER THE COUNTER SLEEP AIDSCumulative Cumulative
ROUTE41 Frequency Percent Frequency Percent
-3=MULT RESPONSE 1 0.0 1 0.0-2=NO RESPONSE 5 0.0 6 0.0-1=MISSING 31 0.0 37 0.00=Did not use drug 164506 99.3 164543 99.31=ORAL 1102 0.7 165645 100.02=INJECTED 1 0.0 165646 100.0
Route for OXYCODONECumulative Cumulative
ROUTE42 Frequency Percent Frequency Percent
-3=MULT RESPONSE 1 0.0 1 0.0-2=NO RESPONSE 7 0.0 8 0.0-1=MISSING 46 0.0 54 0.00=Did not use drug 164760 99.5 164814 99.51=ORAL 830 0.5 165644 100.02=INJECTED 1 0.0 165645 100.05=SNIFF/SNORT 1 0.0 165646 100.0

60
Route for PCP/PCP COMBOCumulative Cumulative
ROUTE43 Frequency Percent Frequency Percent
-3=MULT RESPONSE 3 0.0 3 0.0-2=NO RESPONSE 34 0.0 37 0.0-1=MISSING 1484 0.9 1521 0.90=Did not use drug 162119 97.9 163640 98.81=ORAL 117 0.1 163757 98.92=INJECTED 27 0.0 163784 98.93=INHALE 58 0.0 163842 98.94=SMOKE 1762 1.1 165604 100.05=SNIFF/SNORT 40 0.0 165644 100.07=OTHER 2 0.0 165646 100.0
Route for PENTAZOCINECumulative Cumulative
ROUTE44 Frequency Percent Frequency Percent
-2=NO RESPONSE 2 0.0 2 0.0-1=MISSING 4 0.0 6 0.00=Did not use drug 165595 100.0 165601 100.01=ORAL 45 0.0 165646 100.0
Route for PENTOBARBITALCumulative Cumulative
ROUTE45 Frequency Percent Frequency Percent
-1=MISSING 1 0.0 1 0.00=Did not use drug 165623 100.0 165624 100.01=ORAL 20 0.0 165644 100.02=INJECTED 1 0.0 165645 100.07=OTHER 1 0.0 165646 100.0
Route for PHENOBARBITALCumulative Cumulative
ROUTE46 Frequency Percent Frequency Percent
-2=NO RESPONSE 4 0.0 4 0.0-1=MISSING 32 0.0 36 0.00=Did not use drug 165016 99.6 165052 99.61=ORAL 592 0.4 165644 100.02=INJECTED 2 0.0 165646 100.0

61
Route for SECOBARBITALCumulative Cumulative
ROUTE47 Frequency Percent Frequency Percent
-3=MULT RESPONSE 1 0.0 1 0.0-1=MISSING 3 0.0 4 0.00=Did not use drug 165597 100 165601 100.01=ORAL 45 0.0 165646 100.0
Route for SECOBARBTL/AMOBARBITALCumulative Cumulative
ROUTE48 Frequency Percent Frequency Percent
-1=MISSING 1 0.0 1 0.00=Did not use drug 165638 100.0 165639 100.01=ORAL 7 0.0 165646 100.0
Route for THIORIDAZINECumulative Cumulative
ROUTE49 Frequency Percent Frequency Percent
-3=MULT RESPONSE 1 0.0 1 0.0-2=NO RESPONSE 6 0.0 7 0.0-1=MISSING 14 0.0 21 0.00=Did not use drug 165114 99.7 165135 99.71=ORAL 509 0.3 165644 100.02=INJECTED 1 0.0 165645 100.03=INHALE 1 0.0 165646 100.0
Route for TRIFLUOPERAZINECumulative Cumulative
ROUTE50 Frequency Percent Frequency Percent
-2=NO RESPONSE 1 0.0 1 0.0-1=MISSING 3 0.0 4 0.00=Did not use drug 165451 99.9 165455 99.91=ORAL 191 0.1 165646 100.0

62
Route for DRUGS in OTHER CATEGORYCumulative Cumulative
ROUTE51 Frequency Percent Frequency Percent
-3=MULT RESPONSE 777 0.5 777 0.5-2=NO RESPONSE 239 0.1 1016 0.6-1=MISSING 5522 3.3 6538 3.90=Did not use drug 131420 79.3 137958 83.31=ORAL 26621 16.1 164579 99.42=INJECTED 814 0.5 165393 99.83=INHALE 22 0.0 165415 99.94=SMOKE 78 0.0 165493 99.95=SNIFF/SNORT 128 0.1 165621 100.07=OTHER 25 0.0 165646 100.0
Route for DRUGS, UNKNOWNCumulative Cumulative
ROUTE52 Frequency Percent Frequency Percent
-3=MULT RESPONSE 47 0.0 47 0.0-2=NO RESPONSE 32 0.0 79 0.0-1=MISSING 3870 2.3 3949 2.40=Did not use drug 150566 90.9 154515 93.31=ORAL 1844 1.1 156359 94.42=INJECTED 9118 5.5 165477 99.93=INHALE 19 0.0 165496 99.94=SMOKE 105 0.1 165601 100.05=SNIFF/SNORT 38 0.0 165639 100.07=OTHER 7 0.0 165646 100.0
SEX OF PATIENTCumulative Cumulative
SEX Frequency Percent Frequency Percent
-1=MISSING 1759 1.1 1759 1.11=MALE 97549 58.9 99308 60.02=FEMALE 66338 40.0 165646 100.0

63
MODIFIED STRATUMCumulative Cumulative
STRATUM Frequency Percent Frequency Percent
0 51709 31.2 51709 31.21 76060 45.9 127769 77.12 33619 20.3 161388 97.43 504 0.3 161892 97.74 1971 1.2 163863 98.95 1783 1.1 165646 100.0
TOTAL MENTIONS IN EPISODE (W/ DUPS)Cumulative Cumulative
TOTMENS Frequency Percent Frequency Percent
1 77446 46.8 77446 46.82 62222 37.6 139668 84.33 18801 11.4 158469 95.74 5773 3.5 164242 99.25 1404 0.8 165646 100.0
UNIQUE MENTIONS IN EPISODE (S/ DUPS)Cumulative Cumulative
UNIQMENS Frequency Percent Frequency Percent
1 78705 47.5 78705 47.52 62341 37.6 141046 85.13 18336 11.1 159382 96.24 5093 3.1 164475 99.35 1171 0.7 165646 100.0
YEAR EPISODE OCCURREDCumulative Cumulative
YEAR Frequency Percent Frequency Percent
94 165646 100.0 165646 100.0