drought pricing – lessons learned a presentation to 2003 rmsawwa / rmwea joint annual conference...
TRANSCRIPT

DROUGHT PRICING – DROUGHT PRICING – LESSONS LEARNEDLESSONS LEARNED
A Presentation to 2003 A Presentation to 2003 RMSAWWA / RMWEA Joint Annual RMSAWWA / RMWEA Joint Annual
ConferenceConferencebyby
Kerry KuykendollKerry KuykendollManager of Rate AdministrationManager of Rate Administration
Denver WaterDenver Water
September 14, 2003September 14, 2003

DENVER WATER BACKGROUNDDENVER WATER BACKGROUND
• Denver Water provides water to Denver Water provides water to approximately 1 million people.approximately 1 million people.
• Customers are located both inside and Customers are located both inside and outside city boundaries.outside city boundaries.
• Customer groups include residential, Customer groups include residential, commercial, industrial, government and commercial, industrial, government and wholesale.wholesale.
• Water supply is 100% surface water.Water supply is 100% surface water.• Reservoirs fill with spring runoff.Reservoirs fill with spring runoff.• Snow pack is critical.Snow pack is critical.

N
EW
S
September 20005 0 5 10 Miles
Denver WaterPresent Service Area
Legend
DenverTotal ServiceRead and Bill
Fixed Special ContractsMaster Meter
DENVER
DENVERINTERNATIONAL
AIRPORTROCKYMOUNTAINARSENAL
SOUTH ADAMSCOUNTY
-334 MI2
-77 Distributors

Denver Board of Water Commissioners
Water Collection System
CONTINENTALDIVIDE
STREAM ORRIVER
TUNNEL, CANALOR DITCH
COLLECTION SYSTEMS
SOUTHPLATTE
MOFFATTUNNEL
ROBERTSTUNNEL
WILLIAMSFORK
WATERSHED
TREATMENTPLANT
N:\@wra\gis\dw-sys\sys6-lp.ppt
&
&
&
#
# #
Colorado Springs
Boulder
Buena Vista
FOOTHILLSMARSTON
MOFFAT
WILLIAMS FORK
RESERVOIR
WolfordMountainReservoir
GreenMountainReservoir
DILLONRESERVOIR
ANTERORESERVOIR ELEVEN MILE
RESERVOIR
CHEESMANRESERVOIR
ColoradoRiver
SouthPlatteRiver
GROSSRESERVOIR
BlueRiver
ArkansasRiver
TarryallCreek
ROBERTSTUNNEL
STRONTIASPRINGS
RESERVOIR
RALSTON RES.
ChatfieldReservoir
CherryCreek
Reservoir
MOFFAT TUNNEL
05/13/99

DROUGHT:DROUGHT: “I’LL KNOW IT WHEN I SEE “I’LL KNOW IT WHEN I SEE
IT.”IT.”• Denver Water had revised its Drought Denver Water had revised its Drought
Response Plan in July 1997.Response Plan in July 1997.• The worst 100-year drought occurred 1953-The worst 100-year drought occurred 1953-
1955. This one beats it in intensity.1955. This one beats it in intensity.• Snow pack in the winter of 2001/2002 was 63% Snow pack in the winter of 2001/2002 was 63%
of normal. Storage was average.of normal. Storage was average.• Spring runoff was 25% of normal. Precipitation Spring runoff was 25% of normal. Precipitation
was 33% of normal.was 33% of normal.• Other communities started declaring drought Other communities started declaring drought
in early spring. Denver Water did not until two in early spring. Denver Water did not until two months later.months later.

UPPER COLORADOSNOW WATER EQUIVALENT
0
2
4
6
8
10
12
14
16
18
20
11/1 11/11 11/21 12/1 12/11 12/21 12/31 1/10 1/20 1/30 2/9 2/19 3/1 3/11 3/21 3/31 4/10 4/20 4/30 5/10 5/20
Note: Average based on 23 Snotel Stations Historic based on 1971-2000.
Ave
rage
SW
E (
inch
es)
2002-2003
2001-2002
2000-2001
Historic
80 % of Average
5/27/2003
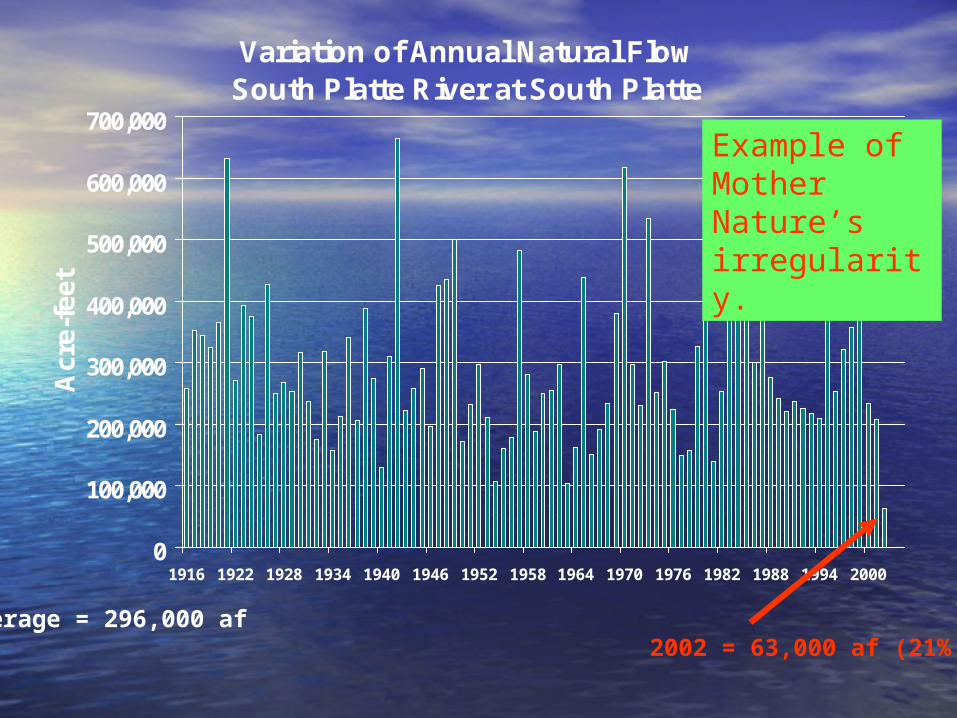
Variation of Annual Natural FlowSouth Platte River at South Platte
0
100,000
200,000
300,000
400,000
500,000
600,000
700,000
1916 1922 1928 1934 1940 1946 1952 1958 1964 1970 1976 1982 1988 1994 2000
Acr
e-fe
et
Average = 296,000 af 2002 = 63,000 af (21% of average)
Example of Mother Nature’s irregularity.

0%
10%
20%
30%
40%
50%
60%
70%
80%
90%
100%
Apr-01
Jun-01
Aug-01
Oct-01
Dec-01
Feb-02
Apr-02
Jun-02
Aug-02
Oct-02
Dec-02
Feb-03
Apr-03
Jun-03
Pe
rce
nt
Fu
ll
Actual Normal
Reservoir ContentsReservoir Contents

FINANCING RESPONSE:FINANCING RESPONSE:
In-Drought ConcernsIn-Drought Concerns
• Utility’s PerspectiveUtility’s Perspective
• Commissioners’ PerspectiveCommissioners’ Perspective
• Customers’ PerspectiveCustomers’ Perspective
Post-Drought ConcernsPost-Drought Concerns
• Financing ConcernsFinancing Concerns
SummarySummary
• Lessons LearnedLessons Learned

FINANCING RESPONSE -FINANCING RESPONSE -UTILITY’S PERSPECTIVEUTILITY’S PERSPECTIVE
• Limited to no guidance available.Limited to no guidance available.
• Managing revenue shortfalls and reserve Managing revenue shortfalls and reserve balances.balances.
• Price signals – do they work?Price signals – do they work?– Price elasticity of demand.Price elasticity of demand.– Billing frequency.Billing frequency.– How high is meaningful?How high is meaningful?– Can you develop a cost justification for drought pricing?Can you develop a cost justification for drought pricing?
• Accountability – how much, from whom, how Accountability – how much, from whom, how used?used?
• What is feasible – billing limitations. What is feasible – billing limitations.
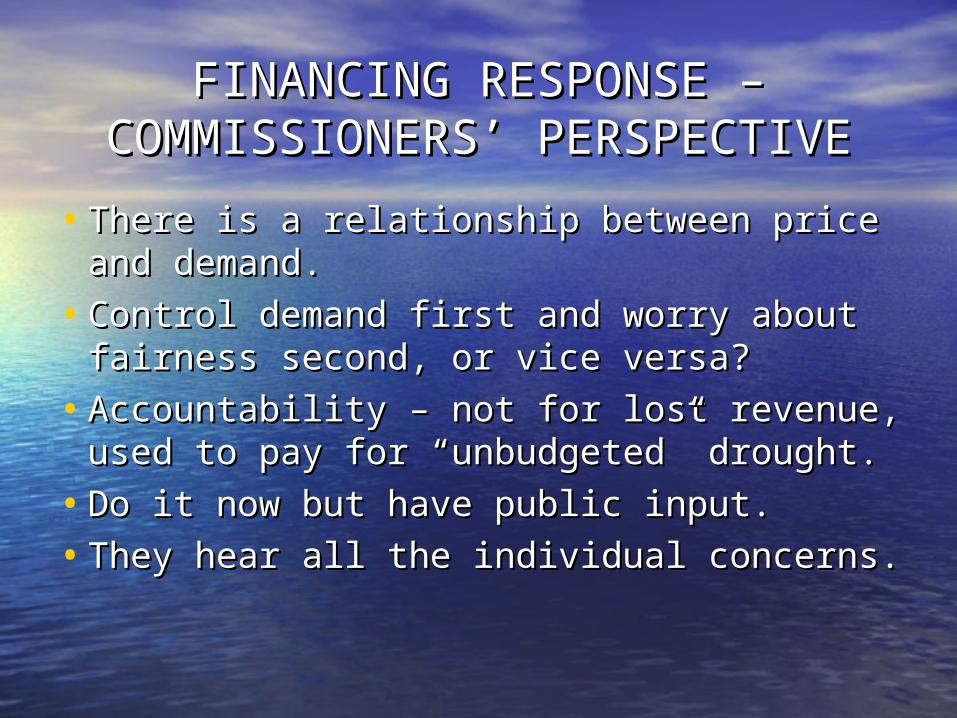
FINANCING RESPONSE – FINANCING RESPONSE – COMMISSIONERS’ PERSPECTIVECOMMISSIONERS’ PERSPECTIVE
• There is a relationship between price and There is a relationship between price and demand.demand.
• Control demand first and worry about Control demand first and worry about fairness second, or vice versa?fairness second, or vice versa?
• Accountability – not for lost revenue, Accountability – not for lost revenue, used to pay for “unbudgeted” drought.used to pay for “unbudgeted” drought.
• Do it now but have public input.Do it now but have public input.
• They hear all the individual concerns.They hear all the individual concerns.

FINANCING RESPONSE – FINANCING RESPONSE – CUSTOMERS’ PERSPECTIVECUSTOMERS’ PERSPECTIVE
• Inside Denver – Charge outside Denver – the water is ours.Inside Denver – Charge outside Denver – the water is ours.• Outside Denver – Our rates are already higher than inside.Outside Denver – Our rates are already higher than inside.• All – Indoor water, trees and shrubs should not be All – Indoor water, trees and shrubs should not be
penalized.penalized.• Some -Some -
– I have 10 kids.I have 10 kids.– I am on a fixed income and like to garden.I am on a fixed income and like to garden.– I have an acre of land.I have an acre of land.– We provide park area to the public.We provide park area to the public.– We use your water in production of our product (beer We use your water in production of our product (beer
and bottled water).and bottled water).• Bottom Line – Customers support a drought price signal but Bottom Line – Customers support a drought price signal but
none of them personally used too much and their needs none of them personally used too much and their needs were not wasteful. It was someone else who wasted.were not wasteful. It was someone else who wasted.

WHAT WE DID!WHAT WE DID!• Originally “basket” of programs, based Originally “basket” of programs, based
on restrictions, supported by surcharges on restrictions, supported by surcharges and enforced by penalties.and enforced by penalties.
• Then summer surcharges became a Then summer surcharges became a “belt and suspenders.”“belt and suspenders.”– Residential – 8 increasing blocks with range of 50% Residential – 8 increasing blocks with range of 50%
to 500% increase in rate. (Replaced “sissy” to 500% increase in rate. (Replaced “sissy” surcharge).surcharge).
– Commercial/Industrial/Government/Master Meter – Commercial/Industrial/Government/Master Meter – 70% targets relative to 2001.70% targets relative to 2001.
– Aggregated Customers – 80% targets relative to Aggregated Customers – 80% targets relative to 2001. Similar entities (e.g. Denver Parks) were 2001. Similar entities (e.g. Denver Parks) were combined to allow for management of the entire combined to allow for management of the entire system.system.
$0.00
$2.00
$4.00
$6.00
$8.00
$10.00
$12.00
$14.00
0 10 20 30 40 50 60 70 80 90 100 110 120 130 140 150
Bi-monthly Consumption (Thousands of Gallons)
$ P
er 1
,000
Gal
lons
Normal Rates Summer Surcharge
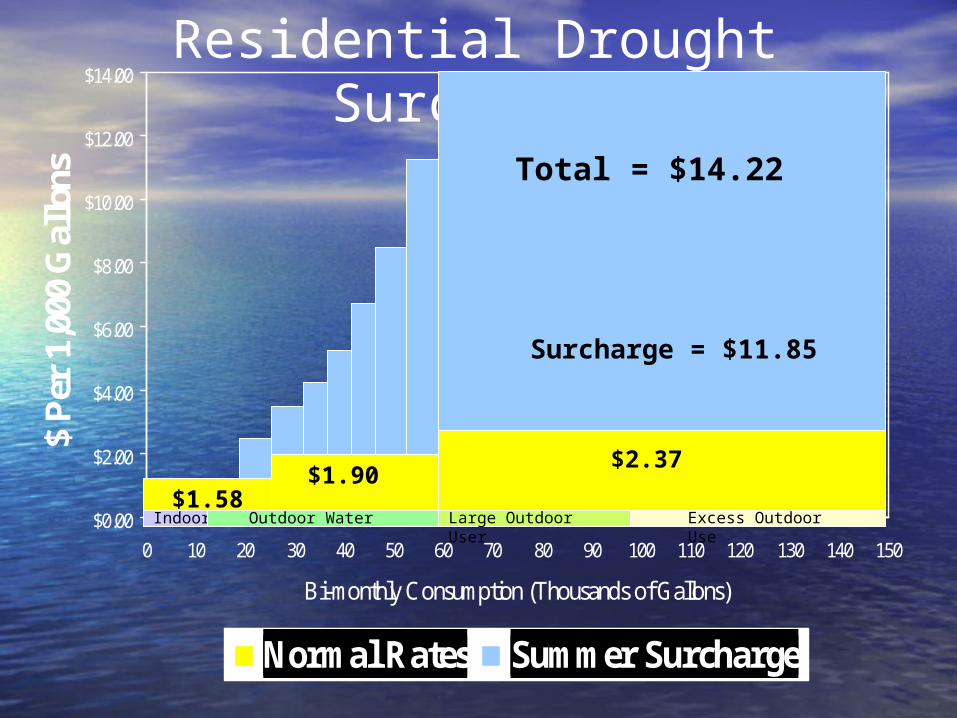
$1.58
$2.37$1.90
Indoor Outdoor Water Large Outdoor User Excess Outdoor Use
Residential Drought Surcharge
Surcharge = $11.85
Total = $14.22

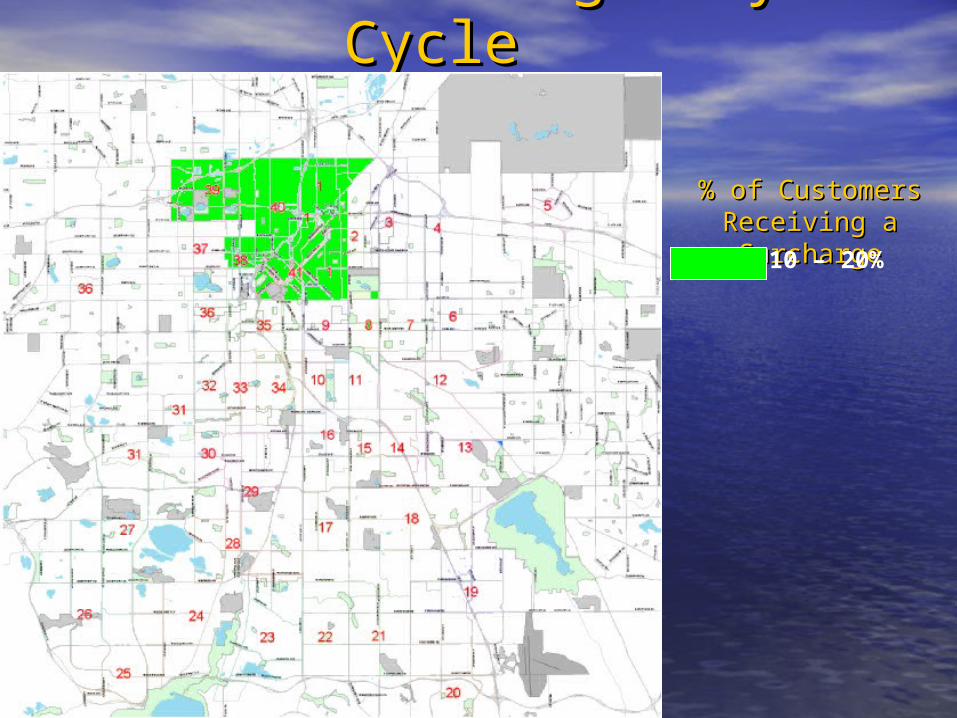
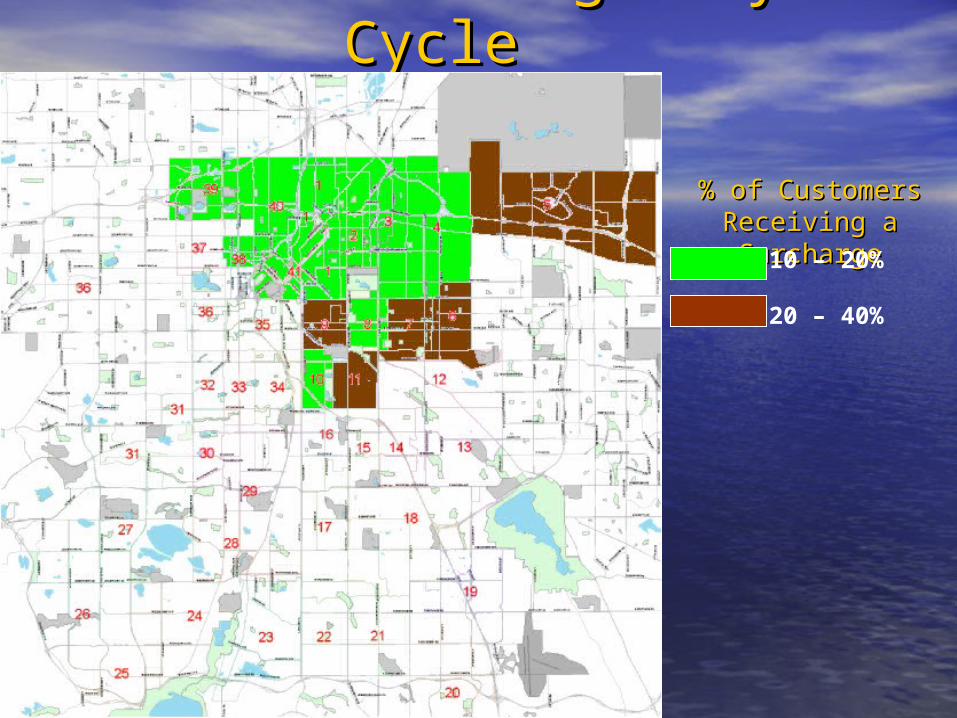
Summer Surcharges by Summer Surcharges by CycleCycle
Summer Surcharges by Summer Surcharges by CycleCycle
% of Customers % of Customers Receiving a Receiving a SurchargeSurcharge10 – 20%

Summer Surcharges by Summer Surcharges by CycleCycle
% of Customers % of Customers Receiving a Receiving a SurchargeSurcharge10 – 20%
20 – 40%
Summer Surcharges by Summer Surcharges by CycleCycle
% of Customers % of Customers Receiving a Receiving a SurchargeSurcharge10 – 20%
20 – 40%

Summer Surcharges by Summer Surcharges by CycleCycle
% of Customers % of Customers Receiving a Receiving a SurchargeSurcharge10 – 20%
20 – 40%
40 – 60%
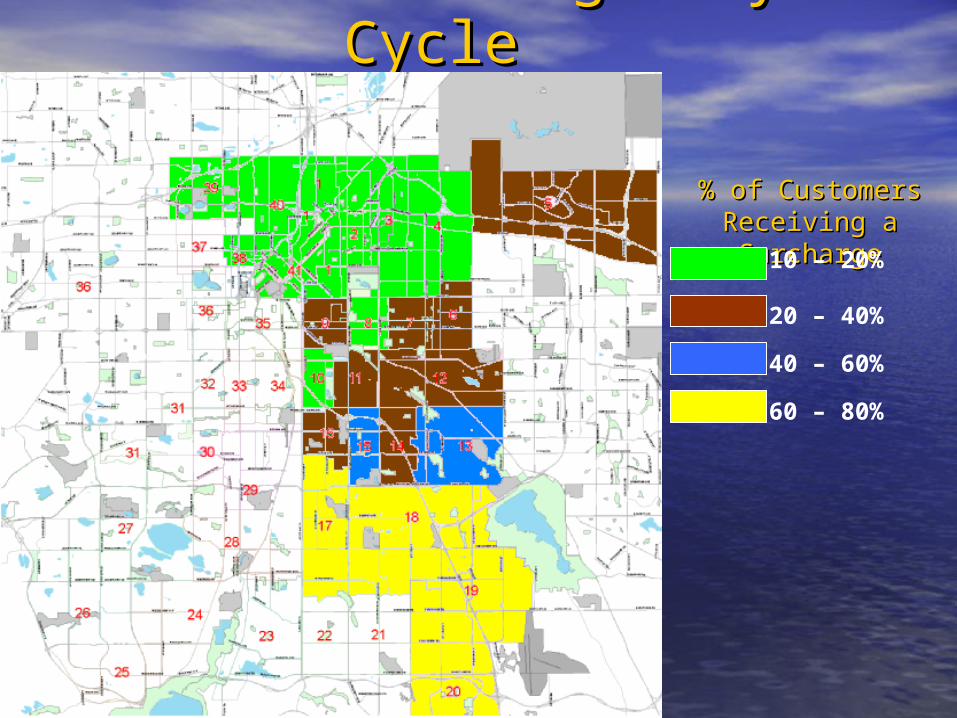
Summer Surcharges by Summer Surcharges by CycleCycle
% of Customers % of Customers Receiving a Receiving a SurchargeSurcharge10 – 20%
20 – 40%
40 – 60%
60 – 80%

Summer Surcharges by Summer Surcharges by CycleCycle
% of Customers % of Customers Receiving a Receiving a SurchargeSurcharge10 – 20%
20 – 40%
40 – 60%
60 – 80%
40%
70%

Summer Surcharges by Summer Surcharges by CycleCycle
% of Customers % of Customers Receiving a Receiving a SurchargeSurcharge10 – 20%
20 – 40%
40 – 60%
60 – 80%
79%
Highest percentage of customersReceiving a surcharge in one cycle?

Summer Surcharges by Summer Surcharges by CycleCycle
% of Customers % of Customers Receiving a Receiving a SurchargeSurcharge10 – 20%
20 – 40%
40 – 60%
60 – 80%

Summer Surcharges by Summer Surcharges by CycleCycle
% of Customers % of Customers Receiving a Receiving a SurchargeSurcharge10 – 20%
20 – 40%
40 – 60%
60 – 80%

2003 Budget Review2003 Budget ReviewItemItem FinanciaFinancia
ll
PlanPlan
BudgetBudget Est.Est.
ActualActual
SourcesSources
Water SalesWater Sales
SDCSDC
SurchargesSurcharges
Bond ProceedsBond Proceeds
OtherOther
TotalTotal
152152
2323
00
4040
1616
231231
$133$133
2424
1515
3131
2222
225225
$125$125
1717
1212
9292
2727
273273
UsesUses
O&MO&M
CapitalCapital
Debt ServiceDebt Service
TotalTotal
101101
133133
3434
268268
$108$108
112112
3434
254254
$110$110
118118
3535
263263
Use of CashUse of Cash -37-37 -29-29 1010

Post Drought: Post Drought: Financing ConcernsFinancing Concerns
• Additional costs largely offset by surcharges Additional costs largely offset by surcharges but not completelybut not completely
• A renewed awareness of water and priceA renewed awareness of water and price– General opinion that it is a high value and low General opinion that it is a high value and low
price productprice product– There are questions of whether our water is under There are questions of whether our water is under
pricedpriced– Not all uses are equally elasticNot all uses are equally elastic
• There is a desire to avoid the consequences There is a desire to avoid the consequences of lack of supply in the future. As a result the of lack of supply in the future. As a result the Board:Board:– Accelerated the completion of the Recycle ProjectAccelerated the completion of the Recycle Project– Accelerated the timing of the North End Supply Accelerated the timing of the North End Supply
ProjectProject
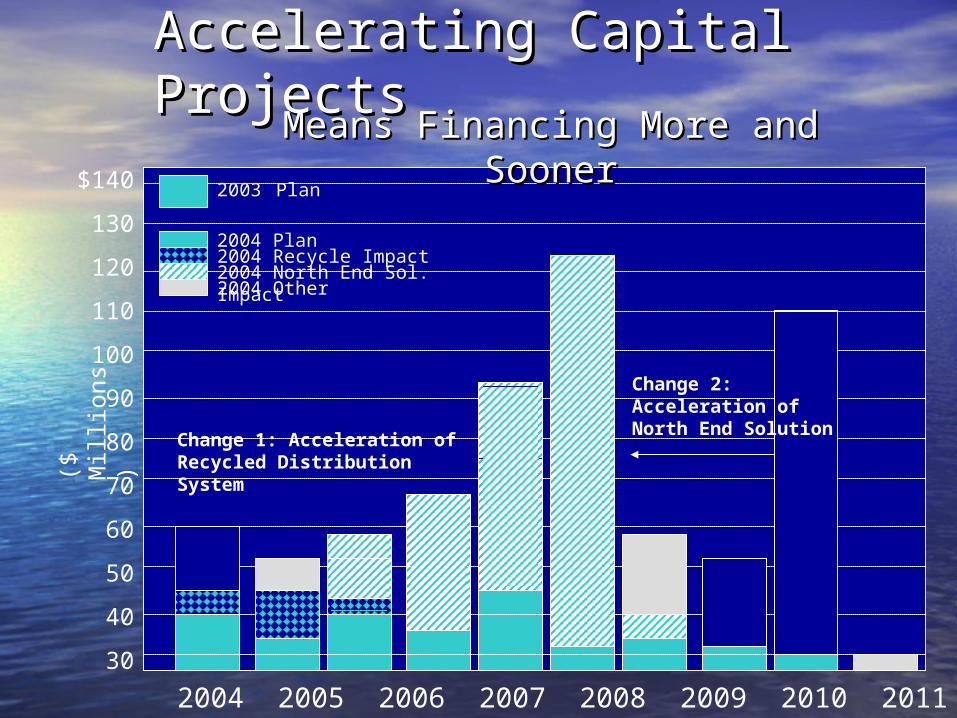
Accelerating Capital ProjectsAccelerating Capital Projects
2004 2005 2006 2007 2008 2009 2010 2011 2012 2013
($ M
illio
ns)
$140
130
120
110
100
90
80
70
60
50
40
30
2003 Plan
2004 Plan
Change 1: Acceleration of Recycled Distribution System
2004 Recycle Impact2004 North End Sol. Impact
Change 2: Acceleration of North End Solution
2004 Other
Means Financing More and SoonerMeans Financing More and Sooner

Accelerating Capital CostsAccelerating Capital Costs
2004 2005 2006 2007 2008 2009 2010 2011 2012 2013
($ M
illio
ns)
$140
130
120
110
100
90
80
70
60
50
40
30
2003 Plan
2004 Plan
$44
$52 $52
$68
$94
$123
$58
$32$29 $22
2004 – 10: Add $183 million
2011-12: Subtract $100 million
Means Financing More and SoonerMeans Financing More and Sooner

Demand Changes After A Demand Changes After A DroughtDroughtEast Bay MUD’s ExperienceEast Bay MUD’s Experience
100
150
200
250
30019
61
1963
1965
1967
1969
1971
1973
1975
1977
1979
1981
1983
1985
1987
1989
1991
1993
1995
1997
1999
2001
Con
sum
p pe
r Acc
ount
(tho
us. o
f gal
lons
)
242“Normal” 219
“Normal”
199“Normal”
-35%-18%
1961 – 1976Average = 242
1978 – 1987Average = 219
Relative to Previous Period = Down 10%
1989 - PresentAverage = 199
Relative to Previous Period = Down 9%
After each drought “EXPECTED” demand was no longer related to the past “NORMAL” demand
This is not a function of restrictions but rather a fundamental change in usage
200
250
300
350
4001
96
0
19
62
19
64
19
66
19
68
19
70
19
72
19
74
19
76
19
78
19
80
19
82
19
84
19
86
19
88
19
90
19
92
19
94
19
96
19
98
20
00
20
02
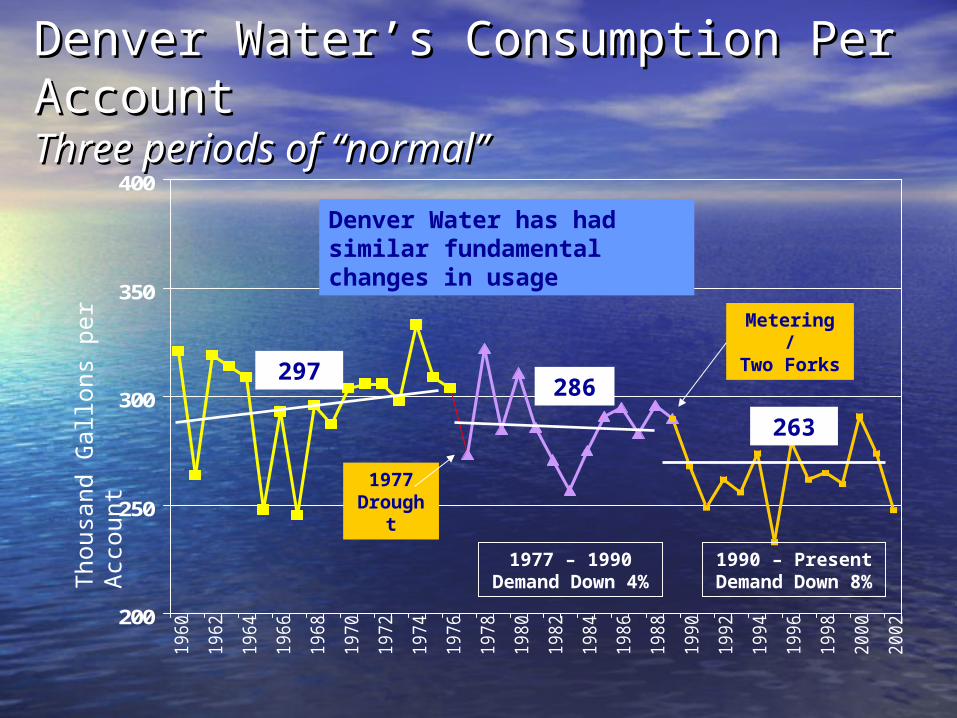
Denver Water’s Consumption Per Denver Water’s Consumption Per AccountAccountThree periods of “normal”Three periods of “normal”
297286
263
1977 Drought
Metering /Two Forks
1977 – 1990Demand Down 4%
1990 – PresentDemand Down 8%
Denver Water has had similar fundamental changes in usage
Tho
usan
d G
allo
ns p
er A
ccou
nt
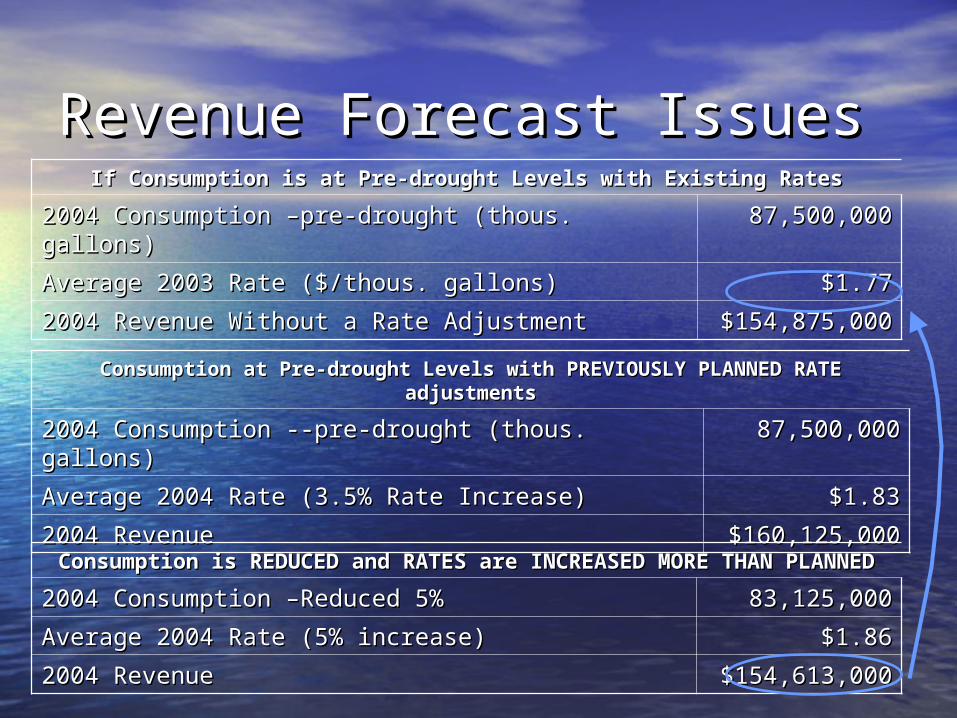
Revenue Forecast IssuesRevenue Forecast IssuesIf Consumption is at Pre-drought Levels with Existing RatesIf Consumption is at Pre-drought Levels with Existing Rates
2004 Consumption –pre-drought (thous. gallons)2004 Consumption –pre-drought (thous. gallons) 87,500,00087,500,000
Average 2003 Rate ($/thous. gallons)Average 2003 Rate ($/thous. gallons) $1.77$1.77
2004 Revenue Without a Rate Adjustment2004 Revenue Without a Rate Adjustment $154,875,000$154,875,000
Consumption at Pre-drought Levels with PREVIOUSLY PLANNED RATE Consumption at Pre-drought Levels with PREVIOUSLY PLANNED RATE adjustmentsadjustments
2004 Consumption --pre-drought (thous. gallons)2004 Consumption --pre-drought (thous. gallons) 87,500,00087,500,000
Average 2004 Rate (3.5% Rate Increase)Average 2004 Rate (3.5% Rate Increase) $1.83$1.83
2004 Revenue2004 Revenue $160,125,000$160,125,000
Consumption is REDUCED and RATES are INCREASED MORE THAN Consumption is REDUCED and RATES are INCREASED MORE THAN PLANNEDPLANNED
2004 Consumption –Reduced 5%2004 Consumption –Reduced 5% 83,125,00083,125,000
Average 2004 Rate (5% increase)Average 2004 Rate (5% increase) $1.86$1.86
2004 Revenue2004 Revenue $154,613,000$154,613,000

Focus on 2004Focus on 2004
ItemItem
Rate Rate Increases of Increases of 5.4-percent5.4-percent
Projected Revenue at Reduced Projected Revenue at Reduced Demand Demand
(demand reduction of 5%)(demand reduction of 5%) ($ million) ($ million)$155.0$155.0
Original Revenue Target ($ million)Original Revenue Target ($ million) $160.1$160.1
ShortfallShortfall $5.1$5.1
Plan Adjustments:Plan Adjustments:
2004 Inflation Reduction to 2%2004 Inflation Reduction to 2%
2004 SDC Increase of 20-percent2004 SDC Increase of 20-percent
Unidentified 2004 Budget ReductionsUnidentified 2004 Budget Reductions
Total AdjustmentsTotal Adjustments
$2.0$2.0
1.91.9
1.21.2
5.15.1
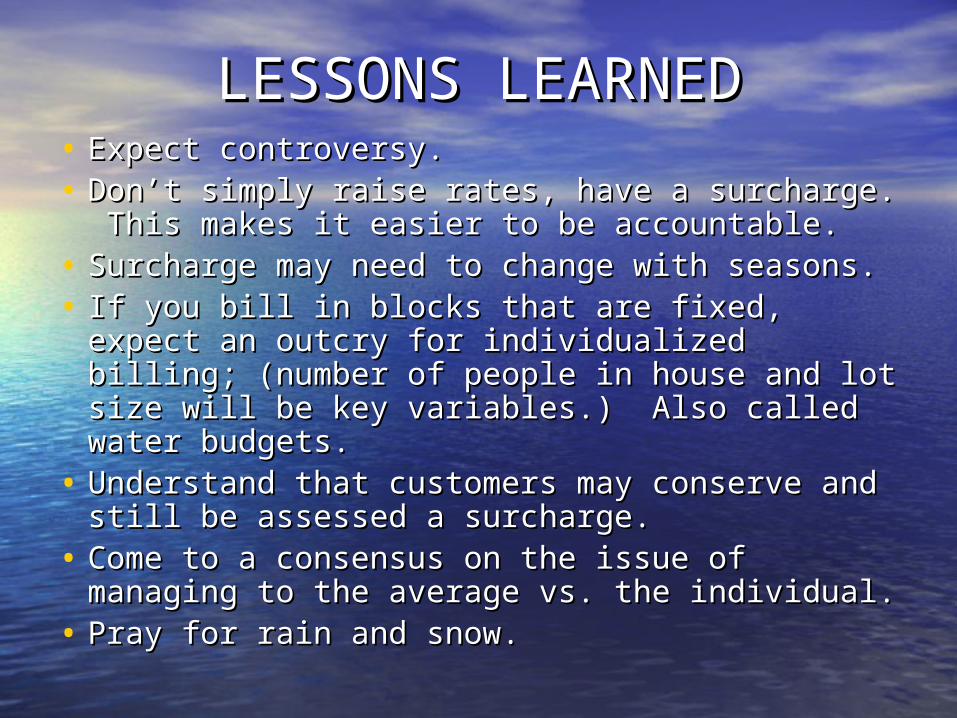
LESSONS LEARNEDLESSONS LEARNED• Expect controversy.Expect controversy.• Don’t simply raise rates, have a surcharge. Don’t simply raise rates, have a surcharge.
This makes it easier to be accountable.This makes it easier to be accountable.• Surcharge may need to change with Surcharge may need to change with
seasons.seasons.• If you bill in blocks that are fixed, expect an If you bill in blocks that are fixed, expect an
outcry for individualized billing; (number of outcry for individualized billing; (number of people in house and lot size will be key people in house and lot size will be key variables.) Also called water budgets.variables.) Also called water budgets.
• Understand that customers may conserve Understand that customers may conserve and still be assessed a surcharge.and still be assessed a surcharge.
• Come to a consensus on the issue of Come to a consensus on the issue of managing to the average vs. the individual.managing to the average vs. the individual.
• Pray for rain and snow.Pray for rain and snow.

QUESTIONS AND QUESTIONS AND ANSWERSANSWERS