dropouts in the denver public schools: early warning...
TRANSCRIPT

1
Dropouts in the
Denver Public Schools: Early Warning Signals and
Possibilities for Prevention and Recovery
Martha Abele Mac Iver Robert Balfanz
Vaughan Byrnes
The Center for Social Organization of Schools Johns Hopkins University
April 2009

2
Dropouts in the Denver Public Schools:
Early Warning Signals and Possibilities for Prevention and Recovery
Martha Abele Mac Iver Robert Balfanz
Vaughan Byrnes
The Center for Social Organization of Schools Johns Hopkins University
April 2009
We wish to thank the Denver Public Schools for their help in facilitating this study. In particular, we thank Daniel Furman, Richard Heistermann, and Joshua Ikemire for their assistance in providing data and documentation for the study and interpreting findings within the district context.
Funding for this report provided by the Donnell Kay Foundation

3
Table of Contents
1. Introduction
2. Characteristics of the 2006-07 Dropouts
3. Dropout Risk Indicators among 2006-07 Ninth Graders
4. Dropout Risk Indicators among 2006-07 Middle School Students
5. Conclusions
6. Recommendations
7. Technical Appendices
Limitations to the Study
Modeling Graduation, Non-graduation, and Dropout Outcomes References
Ninth Grade Early Warning Signals in 2006-07: School Reports
Middle Grades Early Warning Signals in 2006-07: School Reports

4
1. Introduction
The research reported here was conducted as a foundational analysis component of the Colorado Statewide Dropout Initiative. Created in January 2008 as a response to Governor Ritter’s goal of cutting the state’s dropout rate in half within the next ten years, the State Dropout Initiative is a partnership of several education advocacy organizations and other non-profit organizations. These include the Colorado Children’s Campaign, the Partnership for Families and Children (and the associated National Center for Student Engagement), and Colorado Youth for a Change, together with representatives from the Colorado Department of Education, several Colorado school districts, and the Johns Hopkins University Center for Social Organization of Schools. Funding for this research was provided by the Donnell Kay Foundation.
Understanding the dropout problem in a community is an important first step in
developing and implementing plans to reduce the number of dropouts and increase the graduation rate. This study of dropouts in Denver Public Schools is part of a larger study of factors predicting a dropout outcome from Colorado high schools. Its goal is to provide data for district decision-making as well as recommendations for targeting interventions to increase the high school graduation rate and reduce the dropout rate. The study sought to go beyond a demographic snapshot of students who dropped out of school to identify behavioral warning signals prior to a dropout outcome. Knowing these early warning signals (e.g., problems with attendance, behavior, or course failure) could help inform district planning for interventions that could address some of the reasons behind a dropout outcome.
This research was conducted using district administrative data (described more fully in
Section 7). After describing demographic and behavioral characteristics of the dropouts in 2006-07 (Section 2), we turn to an analysis of both 9th graders (Section 3) and middle school students (Section 4) in 2006-07 to examine how many students are currently displaying early warning signals of a potential dropout outcome. We conclude with a summary of findings (Section 5) and some recommendations (Section 6) for steps the district could potentially take to identify and address these early warning signals. Our recommendations include specific suggestions for possible interventions to increase attendance and reduce both problem behavior and course failure. In Section 7 we provide more technical explanations of the limitations of the study and additional statistical analyses based on outcomes for the 2003-04 cohort of 9th graders (the class of 2007).
5
2. Characteristics of 2006-07 Dropouts Denver administrative data from 2006-07 were available for a total of 34,838 of the total
of 35,126 grade 7-12 students listed in the Colorado Department of Education website files, including data for 3,657 students coded as dropouts1 (similar to the 3,649 dropouts listed in the CDE files). After summarizing the demographic and status characteristics of the 2006-07 dropouts, we describe the behavioral characteristics of these dropouts in their 9th grade years. The extent of early attendance and course failure warning signals suggests the importance of developing intervention systems to address and reverse these likely causes of later dropout outcomes. Demographic Characteristics Overall, the proportion of males (55%) was higher than females (45%) among the 2006-07 dropouts in the Denver school district. Among non-dropouts in grades 7-12, the proportion of males was 51%. Hispanics (61%) were also significantly overrepresented among dropouts as compared to non-dropouts (52%).
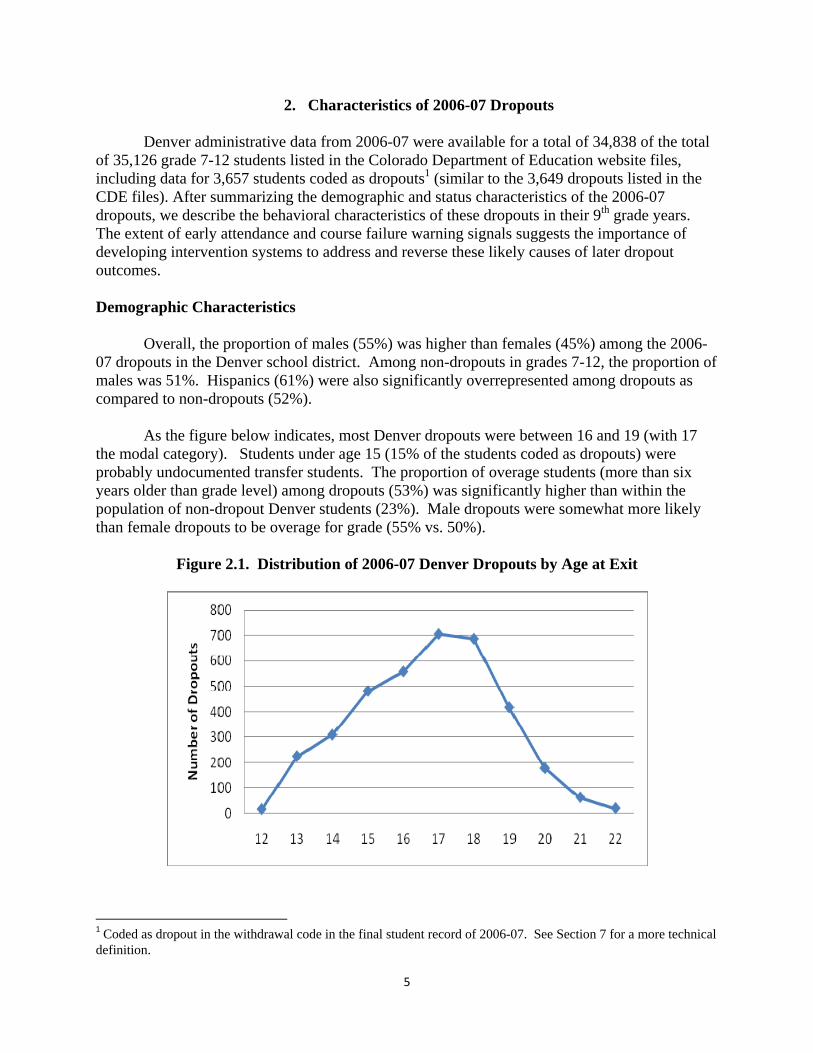
As the figure below indicates, most Denver dropouts were between 16 and 19 (with 17 the modal category). Students under age 15 (15% of the students coded as dropouts) were probably undocumented transfer students. The proportion of overage students (more than six years older than grade level) among dropouts (53%) was significantly higher than within the population of non-dropout Denver students (23%). Male dropouts were somewhat more likely than female dropouts to be overage for grade (55% vs. 50%).
Figure 2.1. Distribution of 2006-07 Denver Dropouts by Age at Exit
1 Coded as dropout in the withdrawal code in the final student record of 2006-07. See Section 7 for a more technical definition.

6
Status Characteristics
One in ten (10%) of the dropouts in 2006-07 were new to the Denver school district (no record of enrollment in previous years). Data on free/reduced lunch status or special education status were not available in data files provided by the district.
About four in ten dropouts (42%) were English as a Second Language (ESL) students.
ESL dropouts were significantly younger than non-ESL dropouts (16.5 years vs. 16.9 years on average). They were also more concentrated in grades 7-9 than are non-ESL dropouts (46% vs. 40%). Many of these younger ESL students with dropout codes may be undocumented transfer students. The largest group of dropouts were 9th graders (26%), followed by 10th graders (23%), 11th graders (18%), and 12th graders (17%). About one in six dropouts were in 7th (8%) or 8th grade (8%). Because of differences in promotion criteria, grade level may not correspond precisely to the number of credits short of graduation.
Figure 2.2 Grade Level Distribution of Dropouts
Eight in ten dropouts (83%) were more than 100 credits away from the required 220 credits needed to graduate (the equivalent of more than 10 credits away in a system with 22 required credits), and nearly half (49%) were more than 200 credits away. Few (7%) were within 50 credits (5 credits on the comparable scale) of graduation. (This analysis could not consider the issue of required courses for graduation; students could have had nearly the right number of credits, but not the necessary courses required.) Even when students in 7th and 8th grade (having no opportunity to earn high school credits) are excluded from analyses, 79% were more than 100 credits short, and 39% were more than 200 credits short of graduation. Figure 2.3 presents and “age by credits earned” summary for all the 2006-07 dropouts.

7
Figure 2.3 Distribution of 2006-07 Dropouts by Age and Number of Credits
Age 0
credits
Freshman 1 to 50 credits
Sophomore51 to 105 credits
Junior 106 to 160
credits
Senior 161 to 220+ credits
Total Percentage of Students
Educational Program to Create
Number of Students
Percentage of Students
13 and below 241 0 0 0 0 241 7%
Young enough for regular school
Return to Regular School for Diploma
792
22% 14 296 12 1 0 0 309 8%
15 330 96 52 3 0 481 13% Young enough for regular school
Catch Up Program & Return to High School for Diploma
832
23%
16 212 194 113 33 6 558 15%
17 157 208 190 115 35 705 19% Too old for traditional system, get diploma through new
schools Older Student Campus for HS
Diploma
1421
39%
18 143 152 181 120 90 686 19%
19 58 48 90 114 107 417 11% Too Old to get diploma, develop expanded GED
programs Program for Community College Readiness + GED 612 17%
20 49 12 26 36 54 177 5%
21 and higher 45 7 8 11 21 83 2%
Total 1531 729 661 432 304 3657This graphic organizer was developed by Steve Dobo, Colorado Youth for a
Change

8
When the younger dropouts (probably undocumented transfer students) are excluded from the analysis, the percentage of dropouts who can potentially be recovered within a regular school framework is much lower than when just students who have reached at least grade 9 are included in the analysis. High School Behavioral Characteristics of Dropouts
Prior research has indicated that course failure in 9th grade (often highly related to low attendance rates) is a strong predictor of dropping out (Allensworth & Easton, 2007; Finn, 1989; Lan & Lanthier, 2003; Lee & Burkham, 1992, 2003; Neild & Balfanz, 2006a, 2006b; Roderick & Camburn, 1999). Behavior problems have also been associated with dropout outcomes (Balfanz, Herzog, & Mac Iver, 2007). So in this analysis of 2006-07 Denver dropouts we investigated these ABCs (attendance, behavior, and course failure) to determine how many of the dropouts were displaying early warning signs that could be monitored with future cohorts to guide interventions designed to prevent dropout outcomes. Attendance Unfortunately, 9th grade attendance data (absences)2 were available for just 38% of the 2006-07 dropouts in the Denver school district. The available data (which could be biased in some way) indicated that dropouts missed 35 days of school on average in their 9th grade year, compared to 28 days on average for non-dropouts. Significantly more dropouts (60%) than non-dropouts (44%) missed 20 or more days of school in 9th grade. Data were missing for most graduates in 2007 (not available for 2003-04, the modal ninth grade year for this cohort).
Focusing on attendance in the year prior to the dropout outcome (2005-06) for 2006-07
dropouts (Figure 2.4),3 we found that three in five (60.7%) of students who would drop out in 2006-07 were absent more than 20 days, compared to 35.1% of graduates. At the same time, there was also a substantial minority among the dropouts who had either reasonably good attendance or missing data on attendance, and could not be identified in an early warning system strictly by attendance. There were no significant gender differences in attendance for dropouts.
2 Both excused and unexcused absences were available in the district data, but because of instability in these measures over time (probably related to variation in data entry procedures at the school level) the total absences measure was used in these analyses. Absence data was available only back to 2004-05. Students with missing data either had 9th grade prior to that year or entered the system after the 9th grade year. 3 This is a more reliable measure than attendance in the dropout year.

9
Figure 2.4 Percentage of Students with More than 20 Absences in 2005-06, by 2006-07 Outcome Group
Behavior
Suspension data were available for 2005-06 and 2006-07. A total of 10% of dropouts (compared to 6% of graduates) had at least one suspension (either in-school or out-of-school) during that two-year period. It is possible that dropouts had higher levels of suspension in earlier years (when they were attending more days of school), but data were not available to verify this. Female dropouts were significantly less likely to have a record of suspensions than were male dropouts. Test scores
We examined 8th grade CSAP scores for students who dropped out in 2006-07 as a proxy
measure of their readiness for high school coursework (as well as to provide a measure of the reading level of dropouts). Eighth grade CSAP scores were available for only 29% of the 2006-07 dropouts. For those dropouts without 8th grade scores, we selected the most recent available CSAP score for analysis.
A total of 71% of the dropouts had some reading CSAP score available. Among these
dropouts with reading scores, more than three in four (78.2%) scored below proficient or unsatisfactory (and 21.8% scored proficient or above). More than four in ten (44%) of dropouts scored unsatisfactory in reading. Male dropouts were significantly more likely to have unsatisfactory CSAP reading scores than were females (48% of males vs. 37% of females).
Because these reading scores were from several different grade levels of the CSAP, 4
precise interpretation of dropout reading levels is problematic. Our best estimate is that nearly 4 Among dropouts with available reading CSAP scores, the grade levels of the non-proficient students during the available CSAP score year were: 6th – 7%, 7th – 10%, 8th – 42%, 9th – 17%, 10th – 24%. Of the 22% of dropouts who scored proficient or better, test scores came from the following grades: 6th – 13%, 7th – 10%, 8th – 43%, 9th – 13%, 10th – 21%.

10
half of dropouts (46%, or 59% of the 78% scoring below proficient) were not proficient at the 8th grade CSAP level (including those with scores from 6th and 7th grade), and about a third (32%, or 41% of the 78%) were not proficient at the 9th or 10th grade CSAP reading level (and possibly not at the 8th grade level either). This estimate is based on excluding those with missing scores (assuming they had the same distribution as those dropouts with CSAP scores). As such, it is a conservative estimate of the number of dropouts non-proficient in reading, since prior research in other urban districts has generally shown that those with missing scores tend to have lower achievement on average than those students with scores. Course Failure Ninth grade transcript data were available for 2,176 of the 2006-07 Denver dropouts (60%) and for 17,760 of non-dropouts. Analyses indicated that dropouts failed significantly more courses than did non-dropouts during their 9th grade year. Over three-quarters of dropouts (77%) failed one or more semester courses in 9th grade compared to about half of non-dropouts5 (53%). Similarly, significantly more dropouts failed two or more semester courses than did non-dropouts (67% versus 41%), three or more (60% vs. 33%), four or more (53% vs. 27%), and five or more semester courses (46% vs. 22%). Female dropouts had a somewhat lower rate of 9th grade failure (75%) than male dropouts (79%).
Figure 2.5. Percent of 2006-07 Dropouts with Different Rates of 9th Grade Semester Failures
The pattern of 9th grade semester failure is also consistent across core subjects, where dropouts were significantly more likely to have failed a 9th grade Mathematics course (54%) than were non-dropouts (32%), an English course (48% versus 27%), a Science course (51% vs. 27%), and a Social Studies course (43% vs. 23%).
5 Some of these non-dropouts in 2006-07 might have a dropout outcome in a later year.
46%
53%
60%
67%
77%
0% 20% 40% 60% 80% 100%
5 or more
4 or more
3 or more
2 or more
1 or more

11
Though recovery from 9th grade failure is indeed possible, the majority of graduates had no 9th grade semester failures. Among the 2006-07 Denver graduates with 9th grade transcript record data available, two-thirds (65%) had no semester failures in 9th grade, three-quarters (77%) had one or fewer failures, and 84% had two failures or fewer during that first crucial year. While there were some students with several 9th grade failures who managed to recover and graduate, these numbers tended to be low.
Figure 2.6 Percent of Students with No 9th Grade Semester Failures,
by 2006-07 Outcome Group
Even excluding dropouts in grades 7 and 8, ESL dropouts were more likely to be missing data on 9th grade course failure than were non-ESL dropouts. The available data indicate that ESL dropouts were somewhat less likely to have 9th grade failures than were non-ESL dropouts (but these findings may be biased because of the missing data).
Sufficient data on predictors of 9th grade course failure (9th grade attendance, 8th grade test scores) were not available for 2006-07 dropouts. As we point out in our analysis of current 9th grade course failure (Section 3 below), 9th grade attendance is the strongest predictor of 9th grade course failure, followed by 8th grade test scores. Controlling for these measures, females also have significantly fewer course failures, but none of the other demographic characteristics remain significant. There is a crucial need for interventions that will successfully address the attendance issue that contributes to course failure and eventual dropout outcomes. Modeling Outcomes for 2003-04 Ninth Grade Cohort (Class of 2007)
For a more in-depth analysis of factors associated with a dropout outcome, and to obtain
a more accurate calculation of the probabilities of graduation for different levels of dropout risk, we conducted a separate forward-cohort analysis of the 2003-04 ninth grade class for Denver (the class of 2007). The 4,680 first-time ninth graders6 with ninth grade transcript records available had the following outcomes by 2006-07:
6 All students with prior administrative data indicating that they were repeating 9th grade were eliminated from analysis.
23%
47%
65%
0%
10%
20%
30%
40%
50%
60%
70%
2006-07 Dropouts 2006-07 Non-dropouts
2006-07 Graduates

12
Ten in twenty (47.9%) had graduated from the district Four in twenty (18.8%) had dropped out Three in twenty (16.4%) were still in school Two in twenty (10.5%) had transferred7 One in twenty (6.2%) had gotten a GED/alternative diploma or transferred to an out-of-
district program
Outcomes differed dramatically, depending on the number of ninth grade failures. Among those with zero ninth grade failures, the graduation rate was 71.1% and dropout rate was 9.1%, with most of the rest either transfers or still in school. By contrast, of the more than half of the class with one or more ninth grade failures, just 26.9% arrived at on-time graduation from the district, and 27.5% had dropped out. Though the graduation rate is somewhat higher when transfer students are excluded (54%),8 there is a similar dramatic decline in the percentages of students graduating with each additional semester failure in ninth grade (Figure 2.8). With even one failure, the percentage of students graduating from the district within four years fell by 16 percentage points. It is likely that one would see a similar decline in the percentage of students graduating on time for increasing levels of 9th grade absence, but such analyses were not possible because of missing data on attendance in 2003-04. In Section 7 of this report (Technical Appendix) we report the outcomes of multivariate statistical analyses of the factors associated with a graduation or non-graduation outcome.
Figure 2.7 Percentage of Class of 2007 Students Graduating from District
within Four Years, By Number of 9th Grade Semester Failures (Transfer students excluded)
7 This figure primarily indicates transfers outside the district, though it includes a handful of students who had a within district transfer withdrawal code. 8 Excluding transfers exaggerates the graduation rate somewhat, since transfer students had a higher than average 9th grade failure rate were unlikely to graduate at the average rate. See Technical Appendix for analyses and probability estimates controlling for other dropout risk factors.

13
3. Risk Indicators among a Recent Ninth Grade Cohort in the Denver Schools
Since the preceding analysis of Denver dropouts echoed findings from previous research regarding the importance of failure during the ninth grade year as a predictor of a dropout outcome, it is important to examine dropout risk factors in the current ninth grade (based on individual student level data from the 2006-07 academic year). While this analysis of current ninth grade students cannot (by definition) include actual graduation or dropout outcomes, it provides a current picture of the number and concentration of students who may be at risk of an eventual dropout outcome. It also provides useful data for targeting interventions to reduce dropout outcomes. Descriptive Characteristics of the 2006-07 Ninth Graders Administrative records were available for 72919 9th graders in the Denver Public Schools in 2006-07. The majority of these students were Hispanic (56%), followed by Black (20%), White (19%), and others. The percentage of males (52%) was somewhat higher than females (48%) and over one-third had ESL status (38%). All but 15% of those with a district record for 2005-06 were first time 9th graders, and 31% were overage in 9th grade. A total of 942 9th graders (13%) had a dropout outcome in 2006-07. Attendance, Behavior, and Eighth Grade Achievement The vast majority of 9th graders (88.0%) had missed one or more weeks of school (5 days or more), with four in five (79.5%) having missed two or more weeks, seven in ten having missed three or more weeks (71.1%), almost two-thirds (64.0%) having missed four or more weeks, and over half having missed five or more weeks (58.2%). Conversely, only one in eight (12.0%) had missed less than one week of school. There were no significant gender differences in 9th grade attendance. One in five 9th graders (20%) had either an in-school or out-of-school suspension in 2006-07. A total of 14% had an out-of school suspension, and 11% had an in-school suspension. Females had significantly lower rates of suspension than did males. Eighth grade CSAP test scores were available for about three-fourths of the 9th grade class in 2006-07. We interpret these as a proxy measure of academic readiness for high school. Among those with 8th grade test scores, half received unsatisfactory scores in Mathematics (53.4%) while fewer received unsatisfactory scores in Reading (28.3%). Semester Course Failures
Of the 5360 9th graders in the Denver City Schools in 2006-07 for whom course marks were available (74% of the total class), a total of 3124 (58.3%) had at least one semester failure, and one in three (32.3%) had at least 4 semester failures. More males (61.3%) than females (55.1%) had a least one failure. Failing at least one semester course also varied by ethnicity 9 An additional 728 students were excluded from analyses because they were missing attendance data.

14
(65.0% for Hispanics, 37.1% for Whites). Six in ten (61.2%) of students with ESL status had at least one semester failure (compared to 56.3% for others). As expected, the number of semester failures was positively related to number of days absent (0.7 correlation). Among those who missed 3 or more weeks of school (15 days or more), roughly two-thirds (69.8%) had at least one semester failure, and half (48.2%) had three or more failing grades. Over 90% of those with at least one failure missed 3 or more weeks of school (15 or more days), and over 80% missed 5 or more weeks of school (25 or more days).
Most (81.5%) of the 9th graders with a suspension on record in 2006-07 also had at least one semester failure, with over one half (56.4%) having four or more failing semester marks. At the same time, the majority (69.6%) of students who had at least one failing grade had no behavior problems on record.
Among students who scored unsatisfactory on 8th grade CSAP Mathematics or Reading tests, a minority (25.3% and 23.8% respectively) had no semester failures in 9th grade. But roughly three-quarters of those students with unsatisfactory scores on an 8th grade CSAP test had at least one failure. Even among those students with proficient marks or higher on their 8th grade CSAP test, a sizeable proportion received at least one failing semester grade in 9th grade (27.5% among those proficient in math and 42.0% among those proficient in reading).
Multivariate analyses indicated that attendance was by far the strongest predictor of 9th
grade failure,10 though 8th grade test score was still significant. Gender was also a significant predictor (males having higher failure rates). Ethnicity, ESL status, overage status, and suspensions were not significant when these other factors were controlled. Summary
Large percentages of students are failing at least one 9th grade semester course, which is a key indicator of a potential dropout outcome. Failure is strongly associated with low attendance. Addressing all of these early warning signals with an effective intervention is an important step in seeking to reduce eventual dropout outcomes.
School level reports summarizing risk indicators for the 2006-07 9th grade cohort are
included in the appendix to this report.
10 Separate regression analyses used total absences and unexcused absences, with virtually the same results.

15
4. Early Dropout Risk Factors Among Middle Grades Students
The following analysis provides a snapshot of dropout risk factors in the middle grades, based on individual student level data from the 2006-07 academic year in the Denver Schools system. Building on prior research, we again focused on attendance, behavior, and course failure. Although this analysis of current middle grades students cannot (by definition) include actual graduation or dropout outcomes, it provides a current picture of the number and concentration of students who may be at risk of an eventual dropout outcome. It also provides useful data for targeting interventions to reduce dropout outcomes. Attendance
As Chang and Romero (2008) have noted, relatively high rates of daily attendance can mask high rates of chronic absenteeism, because students tend to be absent on different days. Average number of days absent for middle grades Denver students in 2006-07 was 23.1 days, or over 4 weeks of school, with an increasing trend from 6th grade (18.2 days) to 7th grade (23.0 days) and 8th grade (28.1 days). While this snapshot of attendance in a single year does not represent a decline for the same students over time, our previous longitudinal cohort analyses in other districts indicate that students’ attendance does tend to decrease over the middle grades. Most of Denver’s middle grades students (86.4%) missed one or more weeks of school (5 days or more), 70.5% missed two or more weeks, one half (55.3%) missed three or more weeks, 43.1% missed four or more weeks, and one third (33.7%) missed five or more weeks of school.
Absenteeism was higher among boys (23.8 days) than girls (21.4), and varied by ethnicity
with Asian students missing only 14.6 days on average, White students 18.1, Hispanic students 24.3, African-American students 25.4, and Native-American students 30.5 days on average.
As Figure 4.1 indicates, the percentage of chronically absent students (those missing
more than 20 days) was also higher at district middle schools than district K8 schools and charter schools (which tend to have fewer students and lower percentages of F/R lunch and ESL students; see Figure 4.2).
Behavior
Analysis of Denver district data for 2006-07 indicated that 21% of students in grades 6 through 8 had at least one suspension (either in-school, out-of-school, or both). Suspension rates rose steadily through the middle grades: 16.7% for 6th grade students, 20.6% for 7th graders, and 25.8% for 8th graders.
Rates of suspension varied also by gender, with boys having substantially higher rates than girls (26.2% vs. 15.7%). Suspensions were higher among minority students (Native American, 22.6%, Black, 30.4%, Hispanic, 21.4%) than among White students (11.5%) or Asian-Americans (12.6%). Rates were also higher at middle schools than K8 schools and charter schools (Figure 4.1).

16
Course Failure in the Middle Grades
Course grades from 2006-07 were only available for 6th grade students in district schools. (Charter school transcript data were not available, and data were also unavailable for half the K8 students, concentrated in several schools.) A majority of 6th graders (63.0%) did not fail any semester courses in 2006-07, but just over one-third (37.0%) did receive at least one failing semester grade. Almost one quarter (23.3%) had two or more failing marks, 15.4% had three or more, 10% had four or more, and 6.9% had five or more.
Failure rates varied substantially by gender, with 44.2% of boys failing at least one
semester course compared to 29.2% of girls. Similarly, failure rates varied substantially by ethnicity and were higher among minority students (Native American, 52.0%, Black, 45.2%, Hispanic, 40.1%) than among White students (22.8%) or Asian-Americans (18.7%).
Failures rates among 6th grade students were highest in Mathematics and R/ELA courses
(19% and 17% respectively). Somewhat fewer students had a failing grade in Science (16%) or Social Studies (13%).
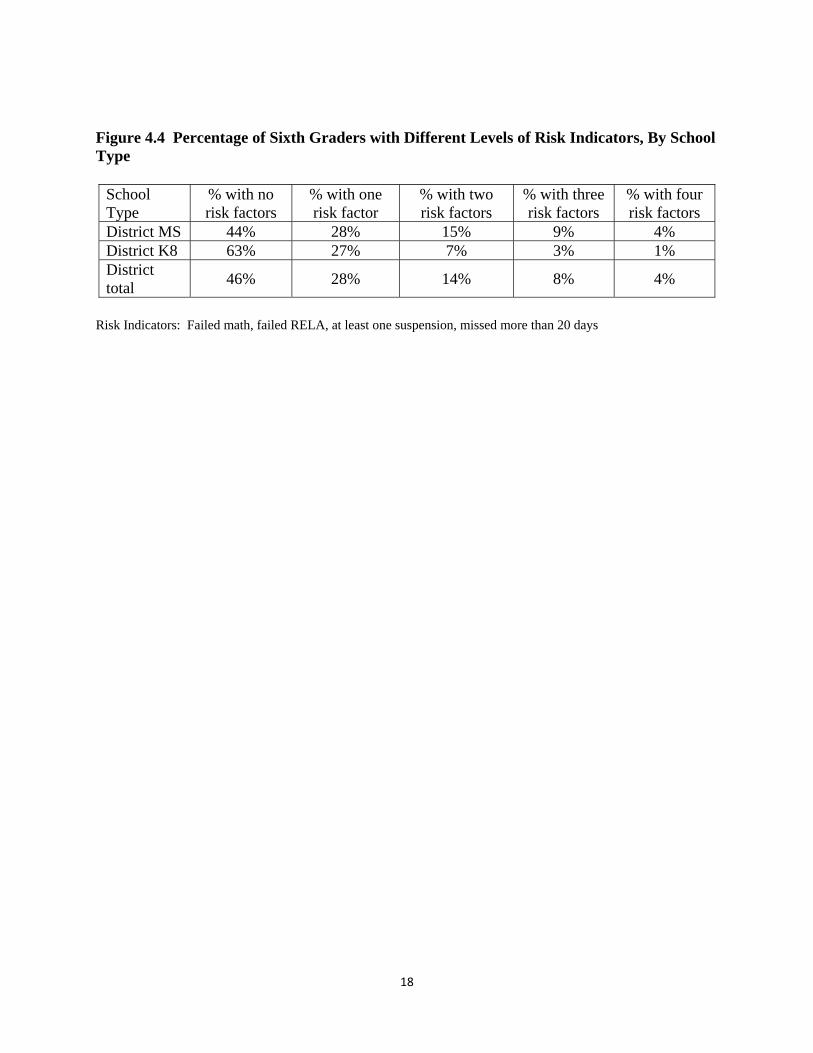
Multiple Risk Factors Figure 4.3 summarizes the extent of various risk indicators for Denver 6th graders by school type. In addition, using the four primary early indicators of a dropout outcome (failed math, failed reading/language arts, more than 20 absences, and at least one suspension) in a simple scale, we calculated the number of risk factors (0 to 4) for each 6th grade student. As Figure 4.4 indicates, half of the sixth graders enrolled in Denver’s district schools in 2006-07 demonstrated at least one risk factor. (Since grades were not available for charter school students, they could not be included in this overall analysis.) Similar to research elsewhere, only a small percentage of sixth grade students had all four behavioral risk factors (though longitudinal research in other cities indicates that these compound over time if intervention does not occur). Figure 4.4 also summarizes the distribution of the students with different levels of risk by school type. This figure needs to be interpreted with caution since course marks were available for only half the K8 students (missing from several schools). With this caveat, there was a higher percentage of students with at least one risk factor in district middle schools (which serve more than 80% of the district’s 6th to 8th graders, and tend to have higher proportions of poor and minority students) than K8 schools (53% vs. 32%). It is important to note, however, that school structure itself is not the key issue: research on middle grades risk factors in Philadelphia (Balfanz, 2005) found that new K-8 schools created in that district tended to resemble the neighborhood middle schools much more than the established K-8 schools (which served less disadvantaged populations). At the same time, the smaller numbers of students at K-8 and charter schools theoretically make it easier for timely interventions to occur to reduce the number of students manifesting behavioral risk factors.
Individual school reports are included as an appendix to this report.

17
Figure 4.1 Percentage of Middle Grades (6-8) Students with Attendance and Behavior Risk Indicators, By School Type
School Type
% with more than 20 days
absent in 2006-07
% with at least one suspension
in 2006-07
District MS (n=13,438) 50% 23%
District K8 (n=1,844) 21% 10%
Charter (n=872) 7% 11%
District total (n=16,154)
44% 21%
Figure 4.2 Demographic Profile of Middle Grades School Types (Based on Students in Grades 6-8)
School Type
% FRL % Minority (non-white)
% ESL
District MS 74% 82% 47% District K8 62% 68% 30% Charter 63% 91% 38% District total 67% 81% 45%
Figure 4.3 Percentage of Sixth Graders with Various Risk Indicators, By School Type School Type
% with at least one semester failure
% with at least 2
semester failures
% with a failure in
Math
% with a failure in
RELA
% with more than
20 absences
% with at least one
suspension in 2006-07
District MS 39% 25% 19% 18% 41% 19%
District K8 22% 10% 14% 7% 18% 9%
Charter - - - - 2% 8% District total 37% 23% 18% 17% 35% 17% RELA is Reading/Language Arts. Course marks not available for charter schools.
18
Figure 4.4 Percentage of Sixth Graders with Different Levels of Risk Indicators, By School Type
School Type
% with no risk factors
% with one risk factor
% with two risk factors
% with three risk factors
% with four risk factors
District MS 44% 28% 15% 9% 4% District K8 63% 27% 7% 3% 1% District total 46% 28% 14% 8% 4%
Risk Indicators: Failed math, failed RELA, at least one suspension, missed more than 20 days

19
5. Conclusions
This analysis has shown that the 2006-07 dropouts in the Denver Public Schools were displaying behavioral warning signals several years previous to the dropout outcome. While not perfect predictors of a dropout outcome, these indicators distinguished dropouts from graduates rather dramatically. Among the 2006-07 dropouts:
• 77% had failed one or more semester courses in 9th grade (compared to 35% of graduates with the same indicator)
• 61% had missed more than 20 days of school in 2005-06, the year prior to the dropout outcome (compared to 35% of graduates with same indicator)
• Chronic absence in the 9th grade year was significantly higher among dropouts (60%) than non-dropouts (44%)11
• 10% had been suspended at least once during the two-year period 2005-07 (compared to 6% of graduates)
Among the 2003-04 cohort of 9th graders (Class of 2007):
• The percentage of students with an on-time graduation outcome in 2007 declined steadily for each semester failure in 9th grade
• Excluding transfer students, the percentage graduating dropped from 77% with 0 failures to 61% with just one semester failure, to 30% with four failures and 11% with five or more failures
• Just 27% of those with one or more failures graduated on time
These findings, together with those of multivariate analyses reported in the Technical Appendix, suggest that intervention focused around 9th grade attendance and 9th grade course failure (and preferably, prevention of 9th grade course failure) is a way to target students most likely to experience a dropout outcome. While this type of intervention would also affect students who could potentially graduate without special measures (the 27% of 9th graders with one or more failures in 2003-04 who managed to graduate on time), such an approach would also yield beneficial effects (in improved readiness for post-secondary education) for the “false positives” thus identified.
Though it was not possible to link attendance in 9th grade and middle school to dropout outcomes with the data available, findings from a more recent 9th grade cohort suggest that course failure is closely linked to absenteeism, and that related interventions to increase student attendance are also crucial – not only in the 9th grade, but at the middle school level as well.
While this research in Denver was not able to link 9th grade failure and dropout outcomes
to course failure in the middle grades (because of lack of available data), research findings in
11 Data for 2003-04, the 9th grade year of most 2007 graduates, were not available. Figures are for missing 20 or more days of school.

20
other districts would suggest that academic interventions are also crucial at the middle grades level for those with failing marks, particularly in reading and mathematics. Current Risk Indicators in Ninth Grade and Middle School
More than half (58%) of Denver’s ninth grade students in 2006-07 manifested the primary risk indicator: failing at least one semester course in 9th grade. One in three failed at least 4 semester courses. Nearly two-thirds (64%) had missed 20 or more days of school. Attendance is a primary predictor of 9th grade failure: over 90% of those with at least one failure missed 15 or more days of school (though even those students with no failures had relatively poor attendance as well). One in five ninth grade students had at least one suspension in 2006-07.
At the middle school level, more than a third (37%) of Denver’s 6th graders in 2006-07
had received at least one failing semester grade, and one in four (23%) had received at least two. Failure rates were somewhat lower for the crucial subjects of math (19%) and reading (17%). Almost half (44%) of Denver’s students in grades 6 to 8 had missed more than 20 days of school. About one in five (21%) middle grades students had at least one suspension in 2006-07. More than half (54%) of all Denver sixth graders had at least one risk factor (failing math, failing Reading/Language Arts, absent more than 20 days, at least one suspension).
The extent to which current Denver students are displaying early warning signals of a
potential dropout outcome suggests the need for timely interventions. We turn to a detailed discussion of recommendations in the following section.

21
6. Recommendations
The findings from this study of dropouts in the Denver Public Schools and current levels of behavioral risk factors among students in grades 6 through 9 indicate clearly the need for focused efforts on dropout prevention. Less than half of Denver’s ninth grade students are graduating from high school on time (54% if out-of-district transfers are excluded). These students are giving warning signals years in advance, which provide clear guidance for implementing interventions aimed at keeping students on track to graduation. Implementation of focused and integrated dropout prevention strategies at the middle school level and 9th grade should reduce the percentage of students needing more expensive alternative settings.
In particular, we would argue that significant reductions in the dropout rate will require:
Reducing the number of students failing high school courses, thereby increasing
the percentage of students earning high school credits on time Decreasing absenteeism, which is strongly linked to course failure Addressing root causes of high absenteeism (and intervening effectively during
the middle school years to increase attendance) Providing academic interventions in middle school so that students enter 9th grade
prepared for high school course work We recommend a three-pronged response plan be implemented in district middle and high schools, with leadership from the district superintendent and school board and supportive guidance from central office administrators. This ABC response plan calls for district and school leaders to:
• Analyze existing policies/practices (including interventions for struggling students) related to attendance, behavior, and course grading at the middle and high school levels and to credit recovery opportunities for students who are behind in credits and/or have already dropped out.
• Build consensus among school leaders and faculties on goals and strategies for dropout
prevention (reducing absences, suspensions, and course failures) and dropout recovery.
• Create integrated whole school reforms and school level student support structures that will assure appropriate and timely interventions to keep all students on track to on-time graduation and provide credit recovery opportunities to maximize the number of students with H.S. diploma outcomes.
We recognize that many various dropout prevention strategies have already been attempted in the Denver Public Schools, and that components of the following recommendations are already in place. Our emphasis in these recommendations is on the need for a coherent, systematic, integrated approach that assures that all components are in place simultaneously and no student falls through the cracks.

22
Before expanding on each of these recommendation components below, we outline our views on the roles of three major actors in this process: 1) the Superintendent and School Board, 2) the district office, and 3) the individual school leaders. We view the role of the Superintendent and School Board in this process as one of:
Establishing the priority of integrated steps to dropout prevention/increased graduation rates (a key indicator of the district goal of “accelerating gains in academic achievement for all students”)
Holding central office and schools accountable for analysis of policies/practices related to
dropout risk factors (attendance, behavior, course failure) and encouraging policy/practice revisions
Taking the lead in building consensus about effective strategies (and the necessary changes in school- and teacher practices)
Catalyzing central office and school leaders to create INTEGRATED school level
structures that will assure appropriate/timely interventions to keep all students on track to on-time graduation
In our view, the primary role of the district (central) office should be providing effective technical assistance to schools in:
Analysis of policies/practices related to dropout risk factors (attendance, behavior, course failure)
Building consensus about effective strategies (and the necessary changes in
school- and teacher practices)
Logistics of creating INTEGRATED school level structures that will assure appropriate/timely interventions to keep all students on track to on-time graduation
Assuring timely provision of student level data for early warning
systems and interventions (and assistance in data-driven decision-making)
Helping schools budget time and resources for effectively
integrated structures
Assisting school instructional leaders in improving quality of classroom instruction

23
At the individual school leader level, there must be a commitment by all middle and high schools to participation in the process of:
analysis of policies/practices related to dropout risk factors (attendance, behavior, course failure)
building consensus about effective strategies (and the necessary changes in
school- and teacher practices)
Creating INTEGRATED school level structures that will assure appropriate/timely interventions to keep all students on track to on-time graduation
Analysis of Existing Policies and Practices
While the community and school district may have implemented a variety of programs and initiatives to address the challenge of students leaving high school without a diploma, it is likely that there has not yet been a systematic assessment of policies and practices related in some way to this issue. Such a systematic analysis involves the following components:12
• Dropout Prevention and Intervention Policy Audit • Classroom Experience Audit • Dropout Prevention and Intervention Program Audit • Resource Audit
Dropout Prevention and Intervention Policy Audit
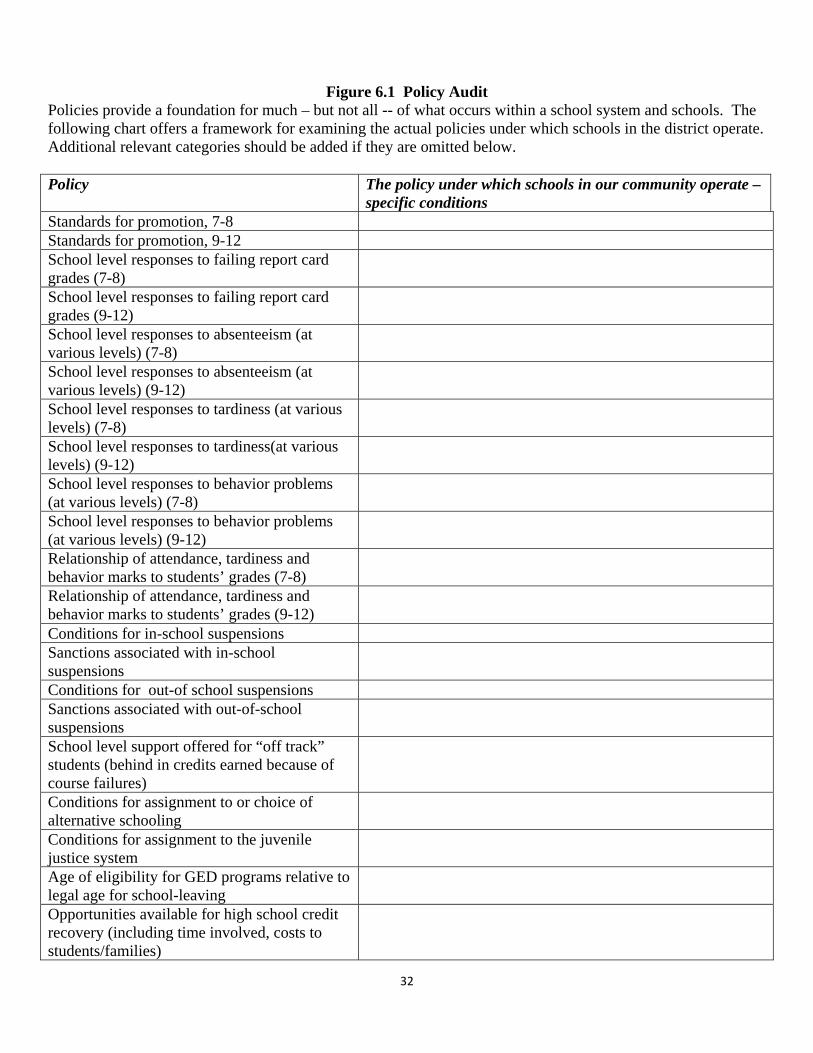
Policies provide a foundation for much – but not all -- of what occurs within a school system and schools. A first step is to summarize what policies and practices are now in place at the district and school levels. The framework provided in Figure 6.1 (at end of section) summarizes some key policy issues related to factors associated with a dropout outcome (e.g., policies on promotion, grading, response to absences and poor behavior, opportunities for credit recovery, etc.).
The next step is to ask the difficult question: Which of these policies are helping students stay on the graduation path with high expectations for learning; which are supportive of this, perhaps with minor modifications, and which need to be modified in a significant way? And which work against each other or reinforce each other? One further step involves prioritizing up to 10 policies needing change most quickly (1-10). (Framework provided in Figure 6.2 at end of section.)
12 These and many of the following recommendations are discussed in more detail in the Grad Nation guidebook (Balfanz, Fox, Bridgeland, & McNaught, 2008).

24
Attendance
We predict that policies and/or practices regarding attendance and responses to absences will require significant attention in Denver middle and high schools, given the extremely high absence rates. Key questions to be addressed include:
• Does every absence evoke a response (phone call home, expression that student
was missed, etc.) • If early interventions are not in place, what barriers are preventing this, and how
can they be addressed? • What school and classroom practices could be changed to increase student
motivation to attend school? • What recovery opportunities are available to students to make up for missing
school?
Course Failure
Since failing grades appear to be the most important predictor of failure to graduate from high school, we have also included a framework for analyzing current grading practices at the middle and high school levels (Figure 6.3). The guiding questions, to be explored first with school principals, focus first on the level at which decisions about grading policies are made (district, school, department, or individual teacher). If decisions are made at the department or individual teacher level, surveys of those individuals would be necessary to ascertain current grading policies and practices. These questions address ways in which grading policy offers opportunity for students to recover from poor performance and avoid course failure. The question of how much opportunity should be offered to prevent course failure is an example of some of the divisive, value-laden issues involved in addressing the dropout problem that we consider in the section on building consensus for changes in policy and practice.
Classroom Experience Audit
Student engagement and motivation are key factors in student persistence to high school graduation. While these are personal characteristics of students themselves, they are greatly influenced by daily experiences in the classroom. It is crucial to evaluate the degree to which students are experiencing relevant and challenging learning situations that engage them actively and elicit high-level academic performance. We recommend a systematic audit of classroom experiences in middle and high schools to determine areas of strength and weakness in addressing the crucial issue of student engagement. This would involve sampling classrooms in each school, conducting classroom observations, and interpreting data collected in such an audit. We recommend a potential framework for such classroom observations from data collection instruments developed by MDRC (Estacion et al., 2004).

25
Dropout Prevention and Intervention Program Audit An additional important step is to systematically analyze the dropout prevention and intervention programs currently in place in the district.
• Where, when and in what format does the majority of our current support for struggling students occur or not occur?
o At what grade levels? o At transitions? o In in-school-support programs or out-of-school programs? o Initiatives sponsored by the schools and by the district, by public agencies, and/or
by community based organizations? o Is our support primarily for prevention, intervention, or recovery? o Is it comprehensive, targeted or intensive? o What are its targets and target audiences?
• Is the support targeted to the needs? • Are the programs effective? • Are the programs cost-effective?
It is helpful to do both an overview analysis of all programs, and then individual profiles for each program. Figures 6.4 and 6.5 at the end of this section provide a structure for this analytical exercise. Resource Audit
What district and community resources are devoted to students at risk of dropping out?
Resources can be divided into those provided by school system personnel and those provided by other community members. Charts in Figures 6.6 provide some structured ways of assessing these resources and their distribution among district students. The goal of the analysis is to determine to what extent resources are already allocated to struggling students, how it might be possible to redistribute existing resources to meet unmet needs of struggling students, and what additional resources will be needed to address the needs of potential dropouts.
Building Consensus on Goals and Strategies
The process of establishing goals and strategies for dropout prevention and recovery will necessarily involve a period of consensus-building among school personnel and community stakeholders. While few if any would question the value of dropout prevention and recovery in general as an overarching goal for a school district, there is likely to be much division over specific strategies. Certain realities that are generally kept under the surface must be confronted head-on. Underlying values and attitudes among some school personnel and community stakeholders may cause resistance to certain strategies designed to prevent dropout outcomes.

26
For example, in a time of scarce resources there may opposition to using resources for personalized outreach to absent students or students at risk of failing a course. There may also be considerable disagreement over such ideas as allowing students to make up work missed during unexcused absences or to have an opportunity to retake tests on which they received an “F.” The process of setting specific goals and strategies around dropout prevention and recovery will therefore necessitate some “town-hall” type meetings as well as numerous discussion sessions with school personnel aimed at providing information and persuasive arguments regarding potential strategies and allowing for extended discussion that will help to address underlying concerns and objections. Such a consensus building process could be led by a district-level team, with school level teams of individuals who already have a deep concern about the issue. The chart in Figure 6.7 (end of this section) provides an example of a tool for assessing the extent of disagreement among school personnel over some potential strategies that could be used such school-level teams. Other tools would also need to be constructed. The process would probably require six to twelve months.
Creating integrated whole school reforms and student support structures
Emerging themes in education research (e.g., Balfanz, Herzog, & Mac Iver, 2007; Communities in Schools, 2008) echo the public health focus on a three stage (primary, secondary, and tertiary) pyramid prevention model. The primary base or foundation of such a prevention model involves district- and school-wide (universal) reforms aimed at providing quality instruction that promotes engaged learning and successful high school completion for every student. In addition, the primary foundation includes a whole school approach to encouraging regular attendance and other positive behaviors (similar to the Positive Behavioral Interventions and Supports or PBIS framework). These primary prevention strategies often succeed alone with a large majority (two-thirds to three-quarters) of students. At the secondary level of the prevention model are targeted efforts for smaller groups of students who need additional supports beyond the school-wide reforms to address attendance, behavior, or academic struggles. The tertiary level of such a prevention model involves intensive intervention efforts (often at the one on one level, involving specialists in social work, mental health, etc.) for the 5 to 10% of students who need more clinical types of supports. This model can be depicted graphically as:
Three-Tiered Prevention Model for Schools

27
It is important to emphasize that this three-tiered prevention model must address the ABCs of attendance, behavior, and course performance (academics). These ABCs are the “triangle on the pyramid.”
Primary Level
Comprehensive (whole school) reform efforts that combine research-based instructional
programs in the core academic subjects with extensive teacher training and support (e.g. in-classroom coaching) to enable implementation of more active and engaging pedagogies constitute the foundation of an integrated approach to keeping students engaged in school. Comprehensive school reform also involves organizational changes (e.g., small learning communities, teacher teams, and vertical looping) which increase the communal nature of schooling, creating learning environments where students and teachers come to know and care about one another. The creation of small learning communities with teacher teams who share responsibility together for a group of students is a crucial component of this reform effort. In addition, whole school efforts provide positive supports for attendance and good behavior. There is growing evidence that such reforms are associated with higher rates of attendance, higher rates of course passing, and higher rates of high school graduation (e.g., Balfanz, Herzog, & Mac Iver, 2007; Kemple & Snipes, 2000; Kemple, Herlihy, & Smith, 2003; Mac Iver et al., in press).
In summary, key components of the pyramid’s primary (whole school) level include: • Teams of teachers (and other school personnel) share responsibility for groups of
students and meet regularly to solve problems • Team meetings are foundation of school’s EARLY WARNING SYSTEM, which
identifies students in need of more intervention • Positive behaviors are modeled, taught, and rewarded daily • Students experience engaging and challenging instruction in every classroom, every
day • School is a pleasant place where everyone wants to spend time • Student success is everyone’s responsibility
The primary barriers or logjams that need to be addressed for this model to function effectively include:
1) An often individualistic teacher culture needs to be replaced with commitment to team responsibility for students.
2) TIME must be provided for teams to engage in common planning and solution building (Creative use of elective period time can accomplish this).
3) DATA on students must be provided to school leaders and teams in a timely and user-friendly way so that interventions can be carried out.
4) Teams must be supported and empowered to act to deliver high quality instruction every day and to carry out interventions.

28
Secondary and Tertiary Levels
At the same time, there are still students who need additional support than just the implementation of comprehensive school reforms. No matter how good the classroom instruction and school climate, some students will exhibit problem behaviors and low achievement. The three-tiered model assumes that schools will seek to address problems first with targeted interventions, moving to more intensive interventions only when those have not proved effective (similar to a Response to Intervention or RTI model).
The key advantages of distinguishing between targeted and intensive interventions is that
schools avoid costly intensive interventions by first attempting targeted interventions with small groups of students sharing similar problems. For academic (course performance) issues, provision of extra-help academic labs (elective replacement courses, particularly in math and literacy) for small groups of students (12 to 15) can avoid costly one-on-one interventions. Targeted intervention for attendance and behavior problems can provide solutions before these problems become intensive issues requiring more expensive interventions.
The barriers or logjams that need to be addressed at the secondary and tertiary levels are
primarily related to time for interventions to be implemented (e.g., adding extra help elective replacement courses to the school schedule) and human resources to implement them.
Implementing an Early Warning System with Tiered Interventions
How can middle and high schools be organized to provide supports across multiple
domains (attendance, behavior, and course performance) to all students who need them? Our recommendation, based on work piloted in Philadelphia and expanding to several additional districts, is a teacher-friendly early warning system (at both the middle school and 9th grade levels) that alerts teachers and administrators as soon as students begin to demonstrate behaviors which will push them off the path to graduation if left unattended. This early warning system is necessarily linked to a tiered response system that combines both prevention and intervention strategies and steadily increases the intensity of supports until the student is back on the right path. The key components of this early warning system are:
1) Provision of regularly updated warning indicator data (from routinely collected student data) on each student to teachers and administrators;
2) Regular (bi-weekly) meetings of school personnel teams to discuss students with warning indicators, plan interventions, and follow up on implemented interventions (making changes as indicated);
3) Organization of a “second team of adults” (including community service interns and volunteers as well as social services professionals) to assist in delivery of interventions for students showing warning indicators.

29
Provision of Data
Classroom teachers receive a report (generated from data collected at the school level) summarizing information for all their students (prior year attendance, student’s attendance so far this year, the number of negative behavior comments regarding the student on the prior quarter’s report card, math grades for the prior two quarters, literacy grades for the prior two quarters, as well as the most recently available information on student’s reading level and math and reading proficiency scores. This information is designed to highlight students who are already beginning to fall off the graduation path so that supports may be offered. (An example is provided in Figure 6.8 at the end of this section.) Administrators also keep abreast of the data, offering encouragement and support to teachers in interpreting and using the data. Regular Meetings
Grade Group Teams have an Early Warning Indicator (EWI)/Tiered Response Meeting every two weeks. The team members are asked to come to the meeting ready to discuss students who are showing EWIs especially those students who have become moderate or severe concerns of the team during the last two weeks. This discussion is led by the EWI facilitator(s) for the school who takes notes on each student discussed using a spreadsheet and a code directory (see examples in Figures 6.9 and 6.10 at end of section). The facilitator records any targeted or intensive interventions that the team decides are needed. At subsequent meetings the team reviews the status of these students (whether the student has improved, is the same, or worse) and determines whether the interventions chosen seem to be working, need more time to work, or whether different or additional interventions should be tried. Second Team of Adults
Fundamental to both the success of an early warning system and to making teachers’ and administrators’ jobs more manageable is the recruitment of a second team of adults and near-peer young adults that can help the school provide targeted and intensive supports to students at the needed scale. For example, the high poverty pilot school in Philadelphia has a City Year intern for each homeroom that assists teachers in providing targeted supports to the students in that homeroom throughout the school day and after school and a Communities in Schools (CIS) site coordinator for the school that works along with a school-based social worker to implement community-based integrated student supports after working together to assess the range, scale, and scope of the specialized intensive supports needed by the most needy students identified by the EWI/Intervention Tracking System. (Schools with fewer at risk students would not need as many adults on the second team.) Following the needs assessment, the site coordinator and the school’s social worker bring in and monitor the organizations and individuals required to provide the identified supports, make social service referrals, complete home visits, coordinate small group and individualized counseling sessions, develop peer support groups, and organize whole school interventions (such as health screenings, career and college fairs, and motivational events) as indicated by the tracking system.
This early warning and intervention system may sound like a tall order. But our experience with a large, high poverty middle school in Philadelphia has shown that it is not only

30
possible to implement such a system: it has also already yielded positive results of higher attendance (compared with previous year) in just a few months.
The chart on the following page summarizes promising prevention and intervention strategies at each of the three levels for attendance, behavior and course failure.
Establishment of these three-tiered systems, with strong primary foundations and
effective tiered interventions tied to an early warning system, must begin at the middle school level (if not the elementary level as well). Prior research has shown at as many as half of high school dropouts can be identified by middle school problems in attendance or behavior or failure in reading and mathematics (Balfanz, Herzog, & Mac Iver, 2007). Such an early warning and intervention system is also essential at the 9th grade level, which is where course failure throws students off-track to graduation and leads all too often to a dropout outcome. It is also crucial that such a system continue throughout the high school years to address problems faced by students after 9th grade. Summary We have argued that prevention of a dropout outcome requires a focus on the ABCs of Attendance, Behavior, and Course Failure. Our recommendations for action also follow an ABC format:
• Analyze existing policies/practices related to and to credit recovery opportunities and to attendance, behavior, and course grading at the middle and high school levels
• Build consensus among school leaders and faculties on goals and strategies for dropout prevention (reducing absences, suspensions, and course failures) and dropout recovery.
• Create integrated whole school reforms and school level student support structures that will assure appropriate and timely interventions to keep all students on track to on-time graduation and provide credit recovery opportunities to maximize the number of students with H.S. diploma outcomes.
This is a doable task, even in times of scarce resources. The dividends – in more high school graduates who are making a contribution to society – are well worth the effort required.

31
Comprehensive Plan for Keeping Students on the Graduation Path
Focus of intervention Type of Intervention
Attendance
Behavior Course Failures
School-Wide (All Students)
Every Absence Brings a Response Create Culture which says Attending Everyday Matters Positive Social Incentives for Good Attendance Data tracking at teacher team level
Teach, Model, Expect Good Behavior Positive Social Incentives and recognition for Good Behavior Advisory Data tracking at teacher team level
Research Based Instructional Programs In-Classroom implementation support to enable active and engaging pedagogies Data tracking at teacher team level
Targeted (15-20% of Students)
2 or more unexcused absences in a month brings Brief Daily Check By an Adult Attendance Team Investigates and problem solves, why isn’t student attending (teacher, counselor, administrator, parent)
2 or more office referrals brings involvement of Behavior Team Simple behavior checklist brought from class to class checked each day by an adult Mentor assigned
Elective Replacement Extra Help Courses-tightly linked to core curriculum, preview upcoming lessons, fill in knowledge gaps Targeted Reduced Class Size for students whose failure is rooted in social-emotional issues
Intensive (5-10% of Students)
Sustained one on one attention and problem solving Bring in appropriate social service or community supports
In-depth Behavioral Assessment-why is student misbehaving Behavior contracts with family involvement Bring in appropriate social service or community supports
One on One Tutoring
32
Figure 6.1 Policy Audit
Policies provide a foundation for much – but not all -- of what occurs within a school system and schools. The following chart offers a framework for examining the actual policies under which schools in the district operate. Additional relevant categories should be added if they are omitted below. Policy The policy under which schools in our community operate –
specific conditions Standards for promotion, 7-8 Standards for promotion, 9-12 School level responses to failing report card grades (7-8)
School level responses to failing report card grades (9-12)
School level responses to absenteeism (at various levels) (7-8)
School level responses to absenteeism (at various levels) (9-12)
School level responses to tardiness (at various levels) (7-8)
School level responses to tardiness(at various levels) (9-12)
School level responses to behavior problems (at various levels) (7-8)
School level responses to behavior problems (at various levels) (9-12)
Relationship of attendance, tardiness and behavior marks to students’ grades (7-8)
Relationship of attendance, tardiness and behavior marks to students’ grades (9-12)
Conditions for in-school suspensions Sanctions associated with in-school suspensions
Conditions for out-of school suspensions Sanctions associated with out-of-school suspensions
School level support offered for “off track” students (behind in credits earned because of course failures)
Conditions for assignment to or choice of alternative schooling
Conditions for assignment to the juvenile justice system
Age of eligibility for GED programs relative to legal age for school-leaving
Opportunities available for high school credit recovery (including time involved, costs to students/families)

33
Figure 6.2 Policy Evaluation Policy Help Students Stay on the Graduation Path with High
Expectations for Learning; Provide Support to This Effort Top Ten Priorities for Change
Good As Is Minor Modifications needed
Significant Modifications Needed
Standards for promotion, 7-8 Standards for promotion, 9-12 School level responses to failing report card grades (7-8)
School level responses to failing report card grades (9-12)
School level responses to absenteeism (at various levels) (7-8)
School level responses to absenteeism (at various levels) (9-12)
School level responses to tardiness (at various levels) (7-8)
School level responses to tardiness(at various levels) (9-12)
School level responses to behavior problems (at various levels) (7-8)
School level responses to behavior problems (at various levels) (9-12)
Relationship of attendance, tardiness and behavior marks to students’ grades (7-8)
Relationship of attendance, tardiness and behavior marks to students’ grades (9-12)
Conditions for in-school suspensions
Sanctions associated with in-school suspensions
Conditions for out-of school suspensions
Sanctions associated with out-of-school suspensions
School level support offered for “off track” students (behind in credits earned because of course failures)
Conditions for assignment to or choice of alternative schooling
Conditions for assignment to the juvenile justice system
Age of eligibility for GED programs relative to legal age for school-leaving
Opportunities available for high school credit recovery (including time involved, costs to students/families)

34
Figure 6.3 Grading Policy Guiding Questions
(To be completed by school principals) To what extent do these occur, and at what level are the following grading policy decisions made in the district?
District School Department Individual Teacher
Do attendance, tardiness and behavior formally influence grades (for instance, in some districts, students who miss 5 or more days of school in one semester automatically fail a course or have their grade dropped one letter unless they undertake make-up days)? Always Usually Sometimes Never
Does the grading system reward improvement over time? (For instance, what is the difference between the final grade for a student who does D and F work for the first three weeks, but then pulls him/herself up to a C/B, compared with a student who receives A/B grades for the first three weeks, and then drops to Ds and Cs for the remainder of the semester?) Always Usually Sometimes Never
Are students who fail quizzes/tests allowed to make second and third attempts until the work is of passing quality? Always Usually Sometimes Never
Are students who do not complete assignments well expected to make second and third attempts until the work is of satisfactory quality? Always Usually Sometimes Never
Do non-completed assignments or tests receive a grade of 0? Always Usually Sometimes Never
Are scores of 0 averaged in to calculate final semester grade? Always Usually Sometimes Never
Are teacher-student conferences held at first indication of patterns of failure? Always Usually Sometimes Never
Are parents notified of failing grades prior to report card? Always Usually Sometimes Never
Is extra help offered to student to achieve passing mastery of course material? Always Usually Sometimes Never
Does intervention occur to encourage students to obtain extra help? Always Usually Sometimes Never
Is it left entirely to students’ initiative to seek extra help? Always Usually Sometimes Never

35
Figure 6.4 Program Interventions Currently Used to Address the Challenges for Students at Risk of Eventually Not Graduating
Target Audiences Program Name (s) In School Support
Out of School Support
Youth: Kindergarten and younger Youth: Transition to elementary school Youth: Elementary school Youth: Transition to middle grades Youth: Middle grades Youth: Transition to high school Youth: High School Youth: High School students with potential to “fall off the graduation path”
Youth: This year’s potential dropouts Adults: Parents, Grandparents and Guardians
Adults: Other Community Adults Transitional Supports
PreK-2 ES to MS MS to HS HS to College
What are the specific needs of students making this particular transition?
What are the initiatives currently offered to assist students in navigating these transitions?
What additional organizational or structural initiatives are needed to assist students in navigating these transitions (e.g., orientations, familiarization with new environments, etc.)
What additional academic initiatives are needed to support students in navigating these transitions (e.g., skill building in reading, writing, math, etc.)?
What additional social and personal supports are needed to assist students in navigating these transitions?
What are the primary target audiences for dropout prevention programs, and are they given primarily in-school or out-of-school support? Are there important target audiences who are not served, or served only minimally?

36
Figure 6.5 Dropout Prevention/Recovery Individual Program Profile Individual Program Profile – Analyzing previous year programs (200Y-0Z) Program Name: Target Audience: (School level, transition level, etc) Type of program Write the program descriptor in this column In-school (school day) Out-of-school (after-school, Saturday, summer) Nature: Course (s), program, or other intervention Purpose: Prevention, Intervention or Recovery Thematic Area: Attendance, Behavior, Academic Skills (math); Academic Skills (literacy); Effort, motivation and engagement
Type of potential dropout: Life event, Push Out, Fade Out, Academic Failure, or Combination of Fade Out and Academic Failure
Duration: Year, semester, quarter, weeks, etc. Number of students served per time period Number of contact hours per week, per student Grade level (or student status) of students served 9 9R 9R2 9R3 10 10R 11 12 Total number of contact hours per student, by grade level or student status
Total number of student contact hours for this initiative Emphasis: Comprehensive, targeted or intensive How many years has this effort been underway? Source of funding: District education budget; federal/state education funds; federal/state/community health, welfare, justice funds; non-profit organization; other sources (identify)
Sector of adults delivering services: Education, juvenile justice, health, welfare, other (parent, community)
Number and FTE of adults delivering services • School personnel on school contracts: teachers,
counselors, social workers, etc.
• School personnel on supplementary contracts
• Community agency personnel on agency contracts
• Community volunteers (mentors, tutors, etc.) Number/FTE of adults required for program coordination
• Regular school personnel
• School personnel on supplementary contracts
• Community agency personnel (agency contracts)
• Community volunteers (mentors, tutors, etc)

37
Figure 6.6 Frameworks for Conducting Resource Audit Number of FTE devoted to offering the following, by how many teachers Grade level
In-school support and acceleration courses
Out of School support and acceleration courses
In-school Tutoring After-school tutoring
Strugglers Advanced Strugglers Advanced Strugglers Advanced Strugglers Advanced 9 10 11 12 Are the struggling students, particularly those in danger of dropping out, receiving an amount of support time from teachers appropriate to their needs? Another way to examine the question of in-school resource allocation is to ask: What is the average class size for courses which enroll struggling students, those which enroll grade-level students, and those which enroll advanced students? Percentage of classes in each category enrolling fewer than 20 students per section In-school support and acceleration courses (advanced includes AP and IB) Grade 9 Grade 9R Grade 10 Grade 10R Grade 11 Grade 12 Reading comprehension Mathematics acceleration Freshman skills Grade-level math Grade-level English Grade-level social studies Grade-level science Career Technical Advanced Placement International Baccalaureate Viewed from the average struggling students’ perspective 9th 9R 10th 11th 12th How many hours a week of extra help do such students receive, in class, in school?
How many hours a week of extra help do such students receive, out of class but in school?
How many hours a week of extra help do such students receive, out of school?
Total? How much additional quality time with skilled adults would be helpful?
How many additional hours per student are needed?

38
Number of hours devoted to offering the following, by how many community members and parents Grade level
In-school mentoring Out of School mentoring
In-school Tutoring Out of -school tutoring
Strugglers Advanced Strugglers Advanced Strugglers Advanced Strugglers Advanced 9 10 11 12 Adult Advocates Interacting with Students During and Outside of the School Day 9th graders 10th
graders 11th graders
12th graders
Total students served
Total hours provided
Mentor or tutor students during the school day, 1 hour or more per week
Mentor or tutor students during the school day, 1 hour or more, bi- monthly
Mentor or tutor students during the school day, 1 hour or more, monthly
Mentor or tutor students after school, 1 hour or more per week
Mentor or tutor students after the school day, 1 hour or more, bi- monthly
Mentor or tutor students after the school day, 1 hour or more, monthly
Present to students on career days Supervise students on internships Adult Advocates Interacting with Students During and Outside of the School Day – Who Are the Students Presently Served? A students B students C students D students F students Total
students Adults counsel, mentor or tutor students during the school day, 1 hour or more per week
Adults counsel, mentor or tutor students during the school day, 1 hour or more, bi- monthly
Adults counsel, mentor or tutor students during the school day, 1 hour or more, monthly
Adults counsel, mentor or tutor students after school, 1 hour or more per week

39
Adults counsel, mentor or tutor students after the school day, 1 hour or more, bi- monthly
Adults counsel, mentor or tutor students after the school day, 1 hour or more, monthly
Adults present to students on career days
Adults supervise students on internships
What’s the Gap Between the Need for Adult Advocates and Mentors and the Services Currently Provided? A students B students C students D students F students Total
students How many hours do students receive adult advocacy services?
How many hours of adult advocacy services are needed?
What’s the gap? What are the sources of current adult advocates and mentors? Where can additional adult advocates and mentors be located?

40
Figure 6.7 Assessing Degree of Opposition to Potential Grading Policy Changes
What level of opposition is likely from high school teachers should certain policies be implemented?
Extensive opposition (more than 75%)
ConsiderableOpposition (35% to 75%)
Some opposition (10% to 35%)
Virtually no opposition (Below 10%)
Course grades must be determined based on course performance, without being influenced formally by attendance, tardiness and behavior (which are measured and reported separately from course grades).
The grading system should reward improvement over time. (For instance, a student who does D and F work for the first several weeks, but then pulls him/herself up to a C/B, should be able to pass the course).
Students who fail quizzes/tests should be allowed to make second and third attempts until the work is of passing quality
Students who do not complete assignments well should be allowed to make second and third attempts until the work is of satisfactory quality
Failing scores should be converted to scores of 50 for the purpose of averaging scores for final grades
Teacher-student conferences should be held at first indication of patterns of failure
Parents should be notified of failing grades as soon as possible.
Regular extra help should be offered to student to achieve passing mastery of course material

41
Figure 6.8 Sample EWI Data Sheet Provided to Classroom Teachers
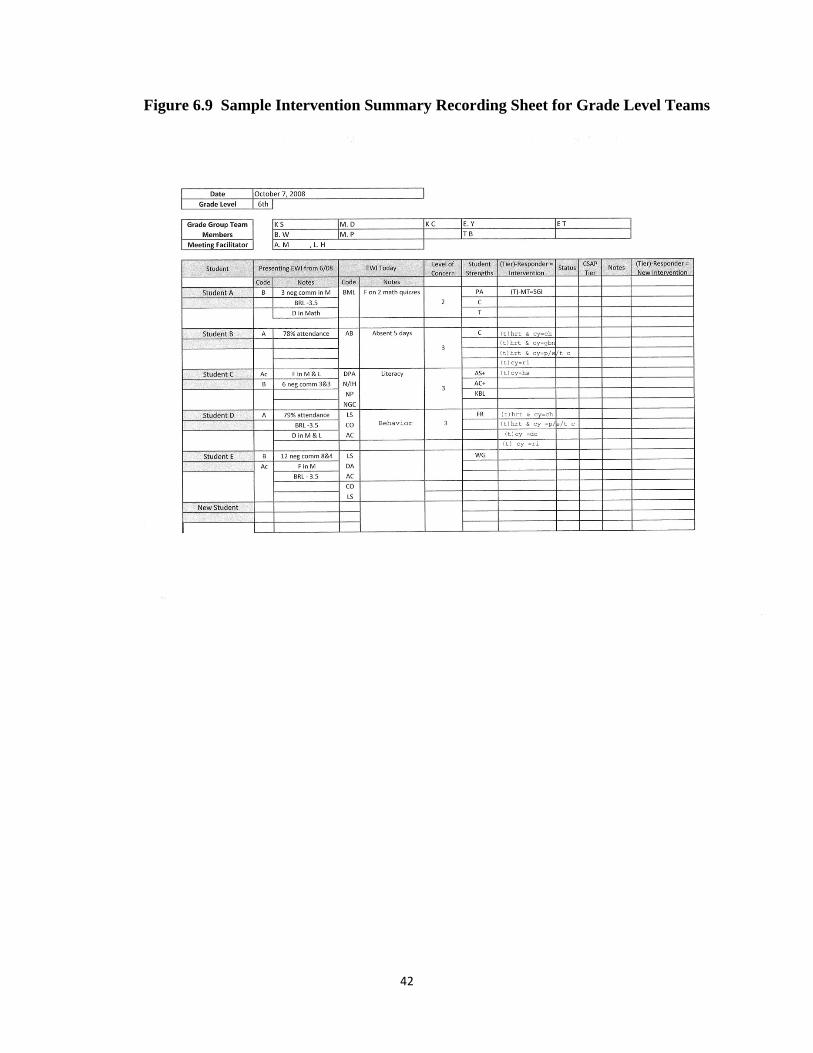
42
Figure 6.9 Sample Intervention Summary Recording Sheet for Grade Level Teams
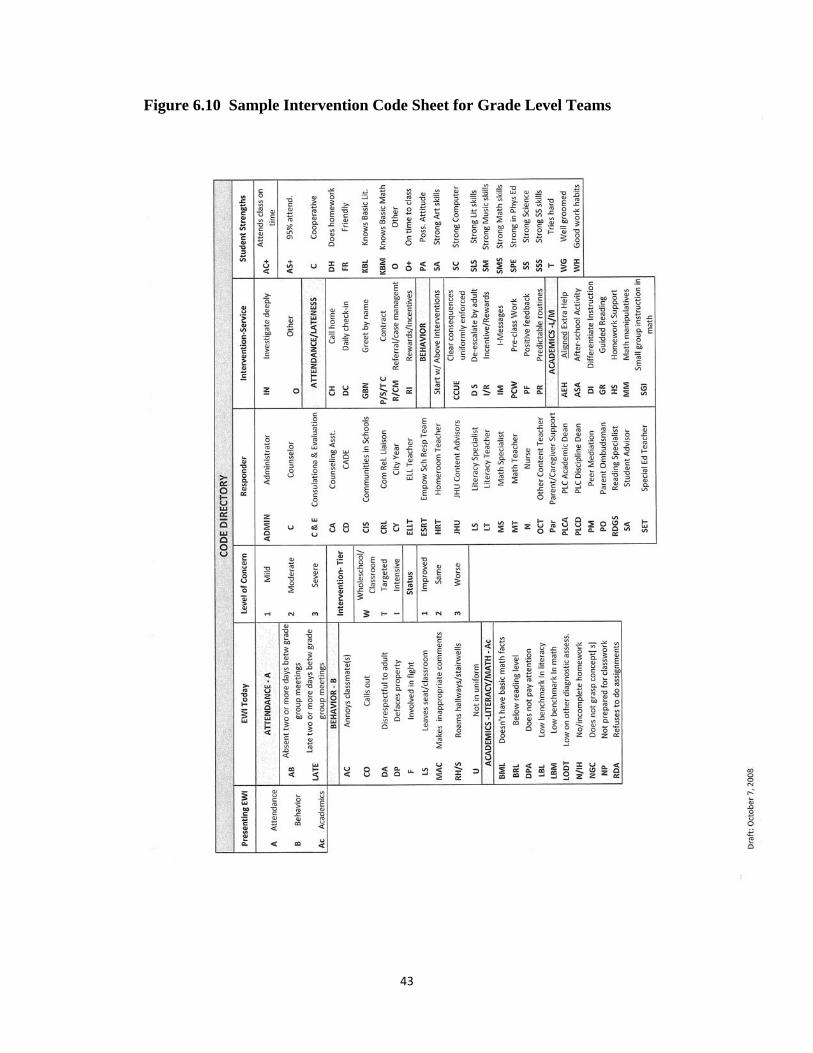
43
Figure 6.10 Sample Intervention Code Sheet for Grade Level Teams

44
7. Technical Appendices
Limitations of the Study This study was based completely on individual level administrative records available from the district, and so there are certain limitations that must be recognized. The study could not at this time be supplemented by survey or focus group data that would shed more light on reasons for a dropout outcome. It is possible that certain psychological variables identified in previous research are the main drivers of a dropout outcome, rather than the student behavioral variables this study was able to examine. At the same time, one goal of the study was to help the district identify early warning signals already available in district-collected data that could guide potential interventions aimed at dropout prevention. The study was theory-driven, building on previous research focused on student behavioral variables and their relationship to a dropout/graduation outcome. Though we sought to analyze all the student level variables identified in prior research (particularly attendance, suspensions, course grades, test scores), there may be important unmeasured behavioral variables that were omitted. Because district policymakers are often interested in the characteristics of all dropouts in a particular year, this study focused primarily on dropouts from the 2006-07 school year (as outcome data for 2007-08 were not finalized). Findings could have been unique in this year, though the correspondence of findings from this study to findings in other districts gives us considerable confidence in their reliability. The “backwards” or “retrospective” analysis approach used in this study complements the “forward cohort” approach used in previous studies (e.g., Balfanz, Herzog, & Mac Iver, 2007; Mac Iver et al., 2008; Allensworth & Easton, 2007). The forward cohort approach provides a better estimate of the impact of certain variables on student outcomes (graduation vs. dropout), and we were also able to conduct a forward cohort analysis of 2003-04 ninth graders through 2006-07 (see analysis below). On the other hand, the retrospective analysis was able to capture students new to the district, who would not be included in the forward cohort. The data from Denver Public Schools were limited due to student information system conversion and the lack of some data prior to 2005. We proceeded with analyses to the extent possible, noting in the report the issues with missing data. The following chart summarizes the data available to us for particular years.
Suspensions Days enrolled Days absent CSAP Course Marks Outcome 2001 X 2002 X 2003 X X 2004 X X X X 2005 X X X X X 2006 X X X X X X 2007 X X X X X X 2008 X X X X

45
Students were designated as dropouts if their final record had a withdrawal code of “40,” which was defined as follows: Discontinued schooling/dropped out – A student who was enrolled in school at any time during the current school year, but leaves school for any reason other than one of the following exclusionary conditions: 1) transfers (with official documentation) to another public school district, private school, home based education program or other state- or district-approved educational program; 2) temporary absence due to suspension or expulsion; or 3) serious illness or death and does not complete their education. This would also include a student who was in membership the previous school year and who does not meet the above exclusionary conditions and does not return to school prior to the end of the school year. Modeling Graduation, Non-graduation, and Dropout Outcomes for Denver Public Schools
We used binary logistic regression to model differences in the log odds of various outcomes by 2006-07 for students in the 2003-04 ninth grade cohort (the “forward cohort” analysis). The first set of analyses proceeded simply, without nesting students within schools (Stage 1). These were followed up with hierarchical models that took account of student nesting within 9th grade school (Stage 2).
In stage 1, binary logistic regression analyses were conducted with several different
versions of the dependent variable: 1) Dropouts vs. graduates; 2) Graduates vs. Dropouts (the converse); and 3) Graduates vs. Non-graduates (dropouts, expulsions, GEDs, other non-district programs, still in school, maximum age; excluding regular transfers and death). The primary independent variable was the number of 9th grade semester failures in 2003-04. Unfortunately, data on attendance and suspensions were not available for 2003-04 (9th grade year). The analysis also took account of the impact of each student’s ethnic group, gender, overage status, and ESL status on the odds of graduating on time.
Table 7.1 summarizes descriptive statistics on each of the independent variables for
graduates, dropouts, and all non-graduates. As Table 7.1 shows, non-graduates, and in particular, dropouts, had significantly higher rates of 9th grade failure than did students who graduated on time. Compared to graduates, dropouts were also disproportionately male, overage, Hispanic and ESL students.
Table 7.2 summarizes results of binary logistic models that separately predicted the log
odds of dropping out vs. graduating, graduating vs. dropping out, and graduating vs. not graduating on time. The model predicted 81.8% of dropout outcomes correctly, with a Nagelkerke R square value of .43 (loosely interpretable as explaining 43% of the variance in student outcomes). Log odds were converted to odds ratios for ease of interpretation. The odds of dropping out increased by a factor of 1.6 for each 9th grade semester failure (or by a factor of roughly 10 for the grouped variable, one or more failures). Even controlling for failures, the odds of dropping out increased by a factor of 2.6 for overage students, 1.8 for Hispanic students, and 2.0 for ESL students. The impact of gender on dropout outcome was still significant (females less likely to drop out) when controlling for the failures. Results were roughly similar for the model predicting graduation vs. non-graduation outcomes, though it had a somewhat lower correctly predicted percentage and R square value.

46
We also conducted analyses including several interaction terms in the model (number of
failures by gender, ethnicity, and overage). The interaction between gender and failures was not significant. The interaction terms for failures and ethnicity and overage were significant, but they had little impact on the model and did not change the main effects.
Figures 7.1 to 7.6 summarize these results in terms of probabilities of dropping out and on-time graduation for different ethnic groups and by number of 9th grade semester failures, controlling for the other variables. (This accounts for the difference between Figure 7.4 and Figure 2.7, which doesn’t control for impact of other variables.) Exclusion of transfer outcomes may inflate these probabilities somewhat, since transfer students were significantly more likely than average to have 9th grade failures.
In Stage 2, we included only 2003-04 9th grade students enrolled in schools with at least 30 9th graders with complete data (the same 14 high schools identified by the Denver Commission on Secondary School Reform) and used hierarchical linear modeling to take account of the fact that students were nested within schools in 9th grade. (We did not account for transfers between schools after 9th grade.) We modeled the log odds of graduation vs. non-graduation coding non-graduation as dropouts, expulsions, GED and other non-district programs, and still in school (excluding regular transfers and death). As Table 7.3 indicates, in addition to the effects of 9th grade failure and gender and ethnicity (which remained virtually the same as in the simple binary logistic regression models), there was a significant effect of school poverty rate (percent of low income students) on non-graduation outcomes. Since school poverty was highly correlated with percent minority students, the model could not include both simultaneously. Structural school variables (size and student/teacher ratio) were not significant, controlling for school poverty level. As the presentation of variance components indicates, the relationship between 9th grade failure and non-graduation outcome varied significantly between schools.13 This would suggest that school level practices could potentially have a moderating effect on the relationship between 9th grade failure and graduation outcome. The effects of gender and ethnicity did not vary among schools.
13 This effect was also significant when we truncated the “number of 9th grade failures” variable (0 to 5 or more) to address the different number of opportunities for semester failure at different schools).

47
Table 7.1 Descriptive Characteristics for Denver Class of 2007 Outcomes
Graduates Dropouts All Non‐Graduates N 2244 879 1944
% Female 54% 44% 42%% Native 1% 2% 2%% Asian 5% 3% 3%% Black 23% 19% 22%% Hispanic 40% 63% 57%% White 31% 13% 16%% ESL 10% 20% 18%% Overage 10% 23% 21%# of 9th Grade Failures 0.78 4.84 4.38
Table 7.2 Binary Logistic Model for Denver Class of 2007 Outcomes
Dropouts (1) vs.Graduates (0)
Graduates (1) vs.Dropouts (0)
Graduates (1) vs. Non‐Graduates (0)
R‐Square .432 .432 .413 Percent Correctly Predicted
81.8 81.8 75.9
Odds Ratio P‐Value Odds Ratio P‐Value Odds Ratio P‐Value Female .710 .001* 1.409 .001* 1.615 .000* Native 2.531 .013* .395 .013* .498 .024* Asian 1.280 .392 .781 .392 .898 .606 Black 1.345 .060 .744 .060 .812 .062 Hispanic 1.758 .000* .569 .000* .712 .001* ESL 1.991 .000* .502 .000* .518 .000* Overage 2.574 .000* .388 .000* .374 .000* # of 9th grade Failures
1.552 .000* .644 .000* .632 .000*
Each outcome is compared to white male students
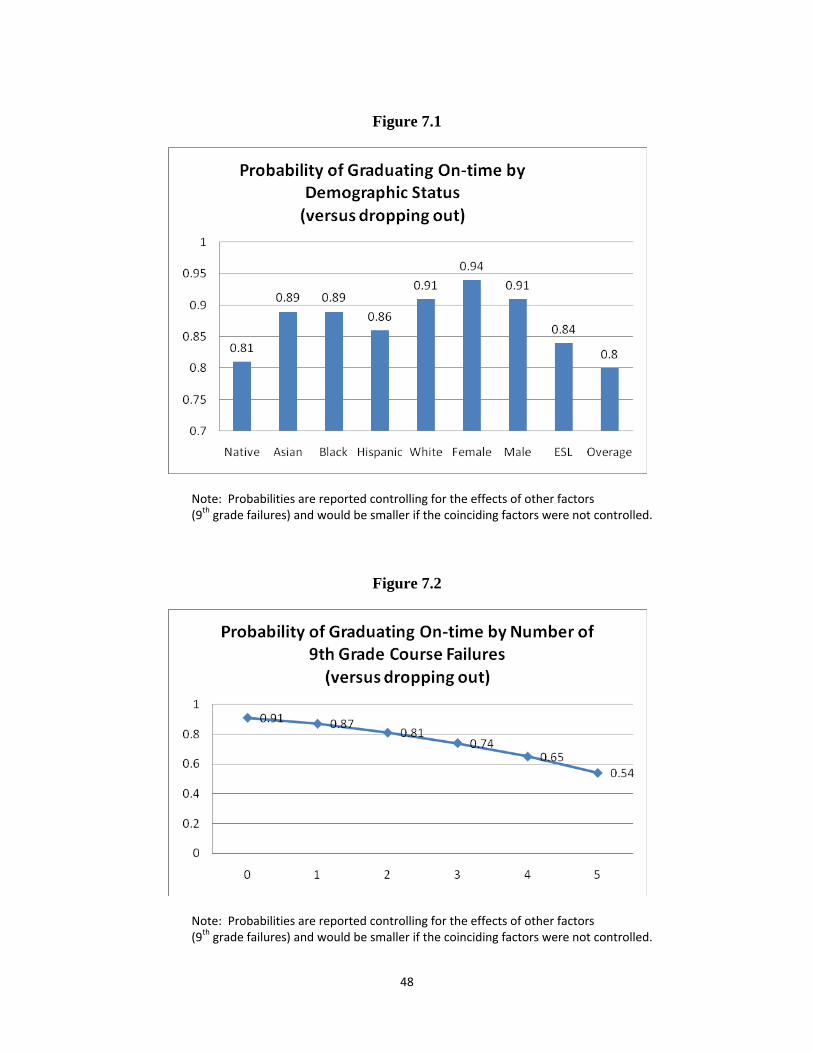
48
Figure 7.1
Note: Probabilities are reported controlling for the effects of other factors (9th grade failures) and would be smaller if the coinciding factors were not controlled.
Figure 7.2
Note: Probabilities are reported controlling for the effects of other factors (9th grade failures) and would be smaller if the coinciding factors were not controlled.
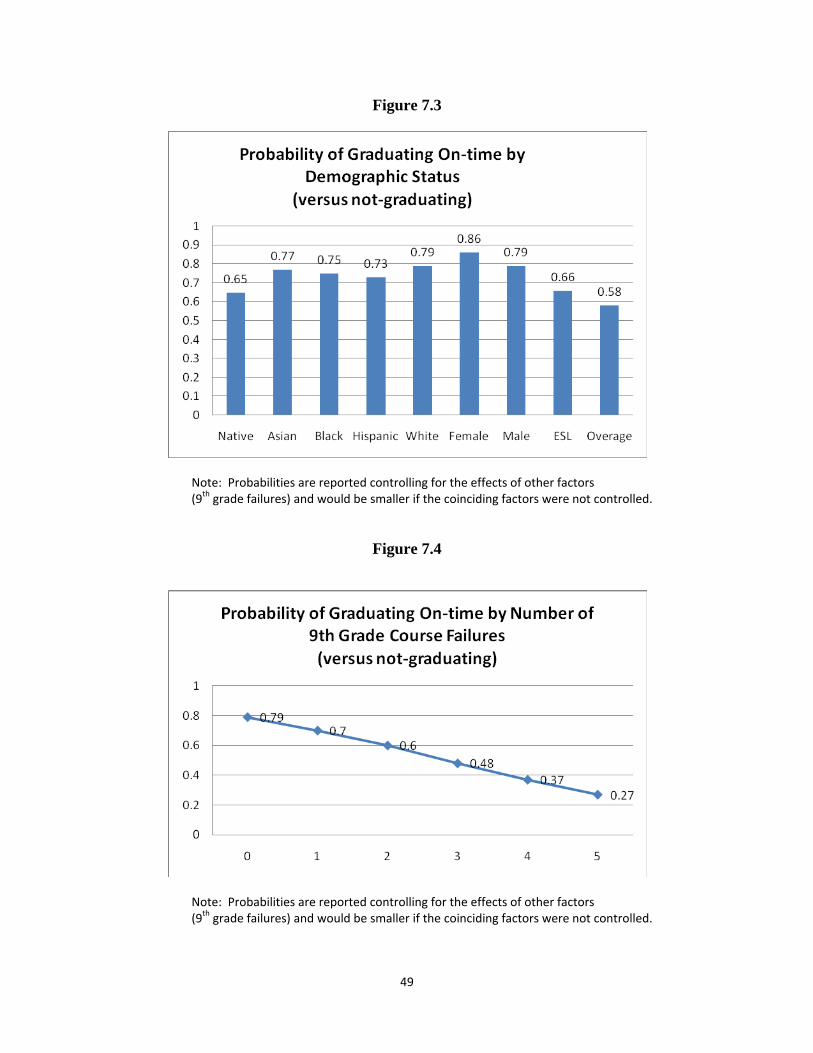
49
Figure 7.3
Note: Probabilities are reported controlling for the effects of other factors (9th grade failures) and would be smaller if the coinciding factors were not controlled.
Figure 7.4
Note: Probabilities are reported controlling for the effects of other factors (9th grade failures) and would be smaller if the coinciding factors were not controlled.

50
Figure 7.5
Note: Probabilities are reported controlling for the effects of other factors (9th grade failures) and would be larger if the coinciding factors were not controlled.
Figure 7.6
Note: Probabilities are reported controlling for the effects of other factors (9th grade failures) and would be larger if the coinciding factors were not controlled.
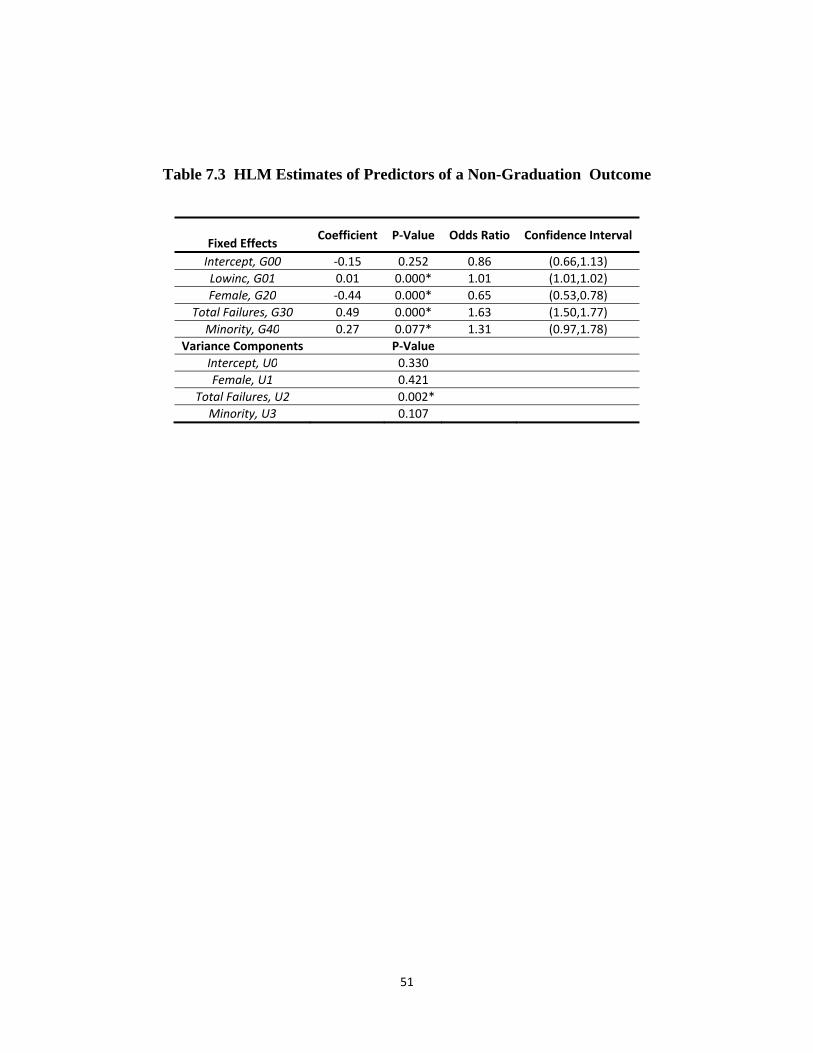
51
Table 7.3 HLM Estimates of Predictors of a Non-Graduation Outcome
Fixed Effects
Coefficient P‐Value Odds Ratio Confidence Interval
Intercept, G00 ‐0.15 0.252 0.86 (0.66,1.13) Lowinc, G01 0.01 0.000* 1.01 (1.01,1.02) Female, G20 ‐0.44 0.000* 0.65 (0.53,0.78)
Total Failures, G30 0.49 0.000* 1.63 (1.50,1.77) Minority, G40 0.27 0.077* 1.31 (0.97,1.78)
Variance Components P‐Value Intercept, U0 0.330 Female, U1 0.421
Total Failures, U2 0.002* Minority, U3 0.107

52
References
Allensworth, E., & Easton, J. (2007). What matters for staying on-track indicator and graduating in Chicago public high schools. Chicago: Consortium on Chicago School Research. Balfanz, R., Fox, J., Bridgeland, J., & McNaught, M. (2008). Grad nation: A guidebook to help communities tackle the dropout crisis. Washington, DC: America’s Promise Alliance. Retrieved December 9, 2008 from http://www.every1graduates.org/PDFs/GradNation_Guidebook_Final.pdf Balfanz, R. & Legters, N. (2004). Locating the dropout crisis. CRESPAR Report #70. Baltimore, MD and Washington, DC: Center for Research on the Education of Students Placed at Risk.
Balfanz, R. (2007). What your community can do to end its dropout crisis: Learnings from research and practice. Baltimore, MD: Center for Social Organization of Schools.
Balfanz, R., Herzog, L. & Mac Iver, D.J. (2007). Preventing student disengagement and keeping students on the graduation path in urban middle-grades schools: Early identification and effective interventions. Educational Psychologist, 42, 4, 223-235. Chang, H. N. & Romero, M. (2008). Present, engaged, and accounted for: The critical importance of addressing chronic absence in the early grades. New York: National Center for Children in Poverty. Darling-Hammond, L. (2006). No child left behind and high school reform. Harvard Educational Review, 76 642-667. Dynarski, Mark; Gleason, Philip (2002). How can we help? What we have learned from recent federal dropout prevention evaluations. Journal of Education for Students Placed at Risk, 7, 43-69. Estacion, A. et. al. (2004). Conducting Classroom Observations in First Things First Schools. MDRC Working Paper on Research Methodology. New York: MDRC. Retrieved December 5, 2008 from http://www.mdrc.org/publications/390/full.pdf Fashola, O., & Slavin, R. (1998). Effective dropout prevention and college attendance programs for students placed at risk. Journal of Education for Students Placed at Risk 3, 159-83. Finn, J.D. (1989) Withdrawing from school. Review of Educational Research, 59, 117–142.
Furstenberg, F.F., & Neumark, D. (2007). Encouraging education in an urban school district: Evidence from the Philadelphia Educational Longitudinal Study. Education Economics 15, 135-157. Gleason, P. & Dynarski, M. 2002). Do we know whom to serve? Issues in using risk factors to identify dropouts. Journal of Education for Students Placed at Risk, 7, 25-41.

53
Kemple, J. & Snipes, J. (2000). Career academies: Impacts on students’ engagement and performance in high school. New York: MDRC. Kemple, J. & Herlihy, C., & Smith, T. (2003). Making progress toward graduation: Evidence from the Talent Development High School Model. New York: MDRC.
Lan, W., & Lanthier, R. (2003). Changes in students' academic performance and perceptions of school and self before dropping out of schools. Journal of Education for Students Placed at Risk, 8(3), 309–332.
Lee, V.E., & Burkam, D.T. (2003). Dropping out of high school: The role of school organization and structure. American Journal of Education, 100, 420-453.
Mac Iver, D. J., Ruby, A., Balfanz, R., Jones, L., Sion, F., Garriott, M. D., et al. (in press). The Talent Development Middle Grades Model: A design for improving early adolescents’ developmental trajectories in high-poverty schools. In J. Meece & J. Eccles (Eds.), Handbook of research on schools, schooling, and development. Mahwah, NJ: Lawrence Erlbaum Associates. Mac Iver, M., Plank, S.B., Durham, R., Farley-Ripple, E., & Balfanz, R. (2008). The challenge of on-time arrival: The seven-year flight paths of Baltimore’s sixth graders of 1999-2000. Research Report. Baltimore, MD: Johns Hopkins University.
Martin, E., Tobin, T., & Sugai, G. (2002). Current information on dropout prevention: Ideas from the practitioners and the literature. Preventing School Failure, 47, 10-17 Neild, R. C., & Balfanz, R. (2006a). An extreme degree of difficulty: The educational demographics of urban neighborhood high schools. Journal of Education for Students Placed at Risk, 11, 131-141. Neild, R. C. & Balfanz, R. (2006b). Unfulfilled promise: The dimensions and characteristics of Philadelphia’s dropout crisis, 2000-2005. Philadelphia, PA: Philadelphia Youth Transitions Collaborative.
Newmann, F. M., Smith, B., Allensworth, E., & Bryk, A.S. (2001). Instructional program coherence: What it is and why it should guide school improvement policy. Educational Evaluation and Policy Analysis, 23(4), 297-321. Prevatt, F., & Kelly, F. D. (2003). Dropping out of school: A review of intervention programs. Journal of School Psychology 41, 377-95. Roderick, M., & Camburn, E. (1999). Risk and recovery from course failure in the early years of high school. American Educational Research Journal, 36, 303–344.