driving value: 2015 automotive m&a insights - pwc · driving value: 2015 automotive m&a...
TRANSCRIPT
www.pwc.com/auto
Driving Value:2015 Automotive M&A Insights
In this issue
1 Welcome
3 Key trends at a glance
4 2015—Year in review
9 Insights into regions
11 Analyzing industry segments
12 Who’s buying: Financial versus Trade buyers
13 The road ahead
15 Contact information
Driving value 2 2015 Automotive M&A Insights
Welcome
We are pleased to present Driving Value: 2015 Automotive M&A Insights, PwC’s review of mergers and acquisitions (M&A) activity and key trends impacting the global motor vehicle industry.
In this edition, we look at:
• The status of global deal activity amongst motor vehicle manufacturers, suppliers, financiers, and other related sectors
• Key trends that impacted the deal market
• Transaction activity by sector and region
• Our perspective on the journey to the future
This latest edition of Automotive M&A Insights is meant to serve only as a preface to the insights and observations that we can provide to drive successful transactions. M&A leaders in the automotive and financial sectors frequently turn to us for advice on potential transactions and the strategies underpinning those deals. Your feedback is important to us, and we welcome the opportunity to provide you with a deeper look into any of these trends that may be of benefit to your organization.
Jeff Zaleski
U.S. Automotive Deals Leader
+1 (313) 394 3525
Driving value 3 2015 Automotive M&A Insights
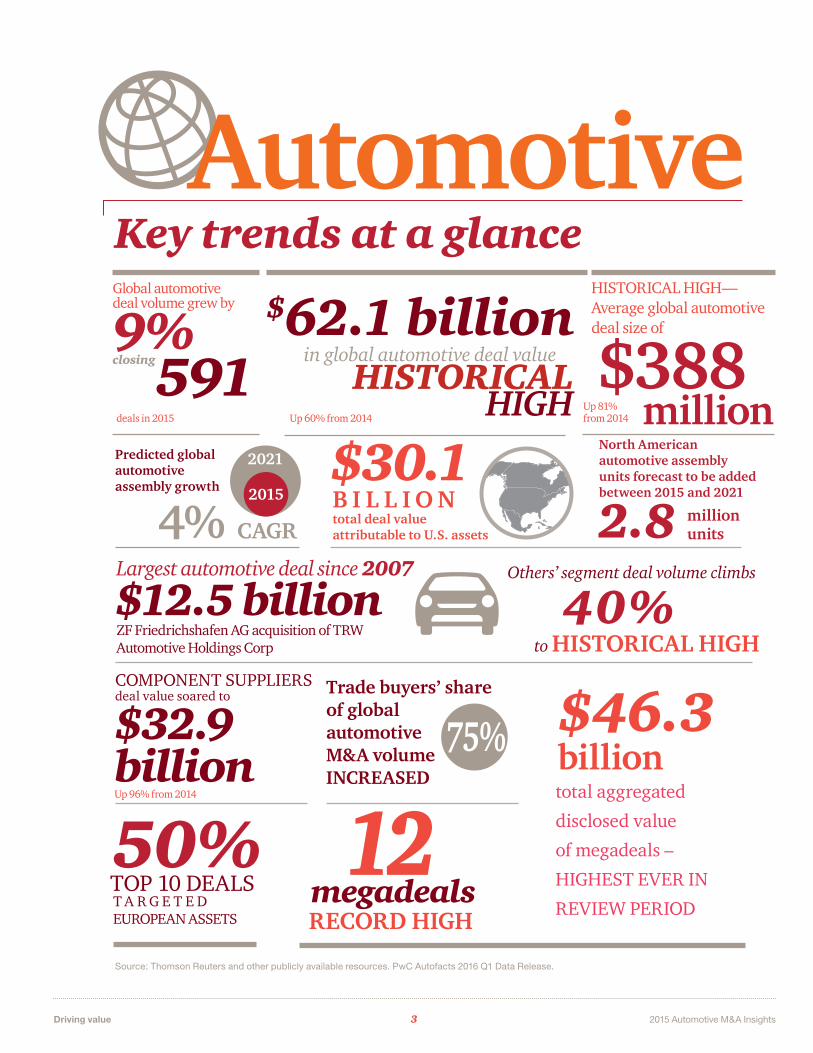
Trade buyers’ share of global automotive M&A volume INCREASED
total aggregated
disclosed value
of megadeals –
HIGHEST EVER IN
REVIEW PERIOD
$388million
Global automotive deal volume grew by
9% closing591
$62.1 billionin global automotive deal value
Key trends at a glance Automotive
HISTORICAL HIGH—Average global automotive deal size of
HISTORICAL HIGH Predicted global automotive assembly growth 2015
2021
4%
CAGRSource: PwC Analysis
North American automotive assembly units forecast to be added between 2015 and 2021
million units
billion
RECORD HIGH
to HISTORICAL HIGH
2.8
$46.3
B I L L I O N total deal value attributable to U.S. assets
$30.1
$32.9 billion
megadeals
$12.5 billion
50%TOP 10 DEALST A R G E T E D EUROPEAN ASSETS
COMPONENT SUPPLIERS deal value soared to
12Source: Thomson Reuters and other publicly available resources. PwC Autofacts 2016 Q1 Data Release.
Largest automotive deal since 2007 Others’ segment deal volume climbs
40%
75%
deals in 2015 Up 60% from 2014
Up 96% from 2014
Up 81% from 2014
ZF Friedrichshafen AG acquisition of TRW Automotive Holdings Corp
Driving value 4 2015 Automotive M&A Insights
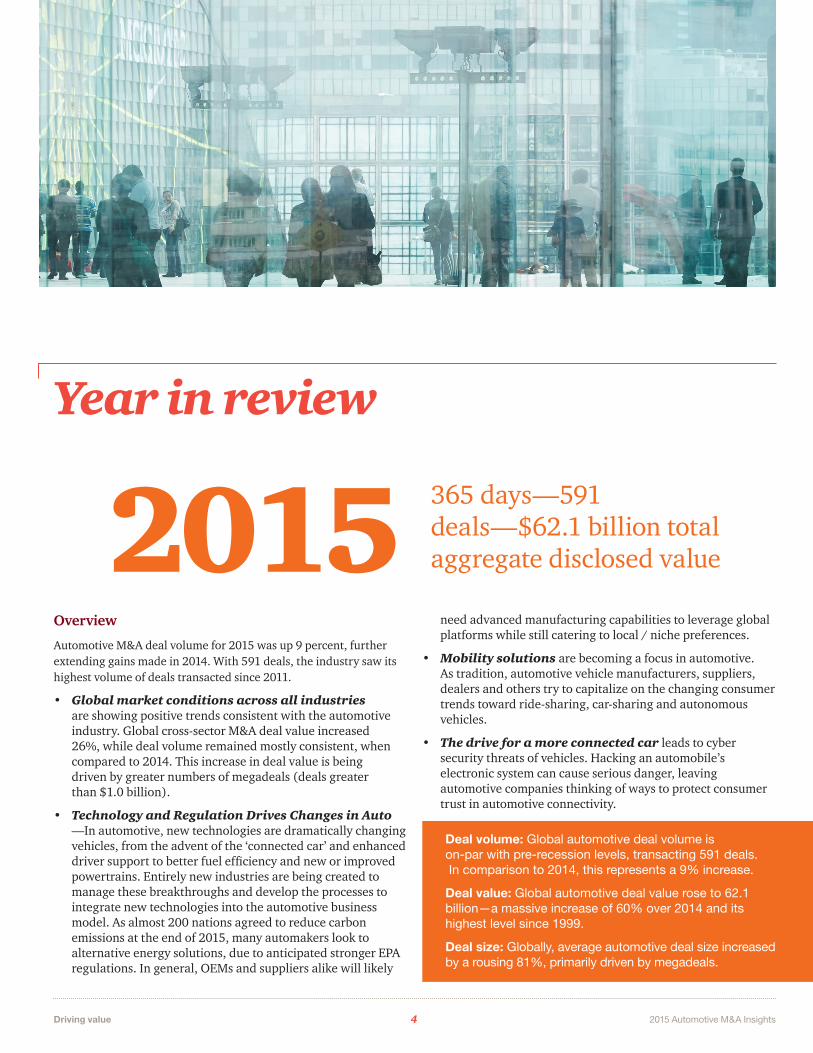
Year in review
Overview
Automotive M&A deal volume for 2015 was up 9 percent, further extending gains made in 2014. With 591 deals, the industry saw its highest volume of deals transacted since 2011.
• Global market conditions across all industries are showing positive trends consistent with the automotive industry. Global cross-sector M&A deal value increased 26%, while deal volume remained mostly consistent, when compared to 2014. This increase in deal value is being driven by greater numbers of megadeals (deals greater than $1.0 billion).
• Technology and Regulation Drives Changes in Auto —In automotive, new technologies are dramatically changing vehicles, from the advent of the ‘connected car’ and enhanced driver support to better fuel efficiency and new or improved powertrains. Entirely new industries are being created to manage these breakthroughs and develop the processes to integrate new technologies into the automotive business model. As almost 200 nations agreed to reduce carbon emissions at the end of 2015, many automakers look to alternative energy solutions, due to anticipated stronger EPA regulations. In general, OEMs and suppliers alike will likely
2015 365 days—591 deals—$62.1 billion total aggregate disclosed value
need advanced manufacturing capabilities to leverage global platforms while still catering to local / niche preferences.
• Mobility solutions are becoming a focus in automotive. As tradition, automotive vehicle manufacturers, suppliers, dealers and others try to capitalize on the changing consumer trends toward ride-sharing, car-sharing and autonomous vehicles.
• The drive for a more connected car leads to cyber security threats of vehicles. Hacking an automobile’s electronic system can cause serious danger, leaving automotive companies thinking of ways to protect consumer trust in automotive connectivity.
Deal volume: Global automotive deal volume is on-par with pre-recession levels, transacting 591 deals. In comparison to 2014, this represents a 9% increase.
Deal value: Global automotive deal value rose to 62.1 billion—a massive increase of 60% over 2014 and its highest level since 1999.
Deal size: Globally, average automotive deal size increased by a rousing 81%, primarily driven by megadeals.
Driving value 5 2015 Automotive M&A Insights
Global Auto M&A Deals by Disclosed Value 2010-2015
Global Automotive M&A Deal Volume and Value 2003–2015
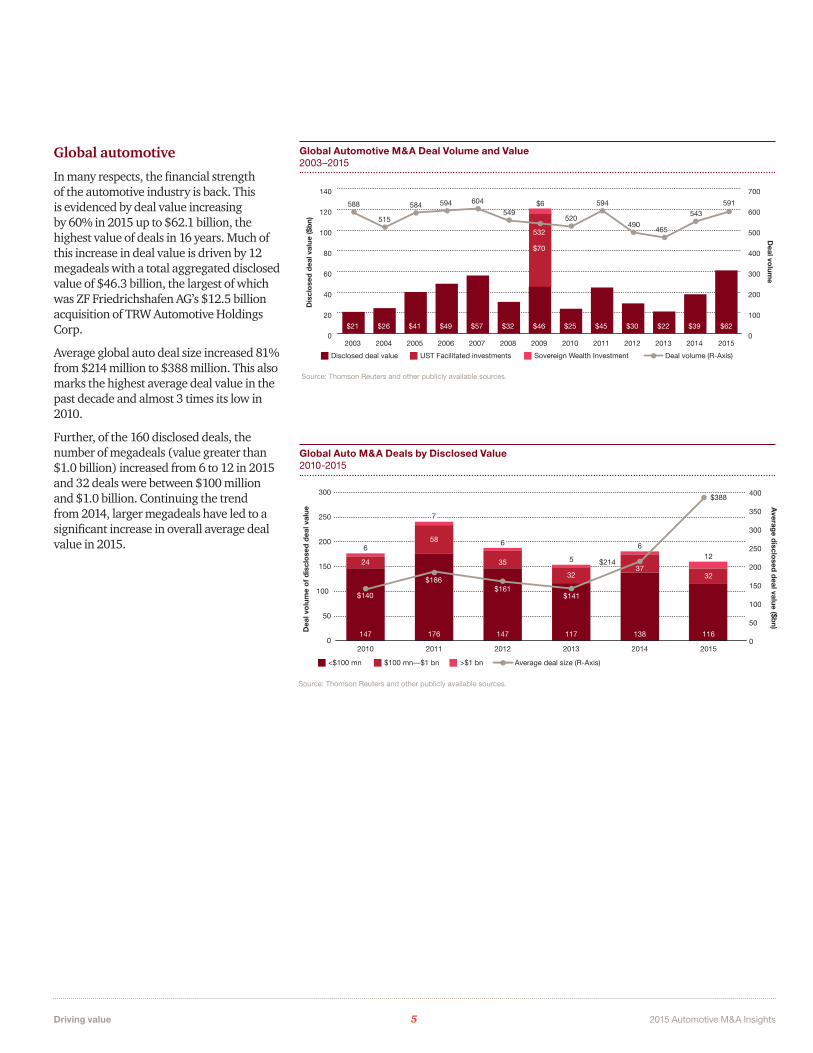
Global automotive
In many respects, the financial strength of the automotive industry is back. This is evidenced by deal value increasing by 60% in 2015 up to $62.1 billion, the highest value of deals in 16 years. Much of this increase in deal value is driven by 12 megadeals with a total aggregated disclosed value of $46.3 billion, the largest of which was ZF Friedrichshafen AG’s $12.5 billion acquisition of TRW Automotive Holdings Corp.
Average global auto deal size increased 81% from $214 million to $388 million. This also marks the highest average deal value in the past decade and almost 3 times its low in 2010.
Further, of the 160 disclosed deals, the number of megadeals (value greater than $1.0 billion) increased from 6 to 12 in 2015 and 32 deals were between $100 million and $1.0 billion. Continuing the trend from 2014, larger megadeals have led to a significant increase in overall average deal value in 2015.
0
20
40
60
80
100
120
140
0
100
200
300
400
500
600
700
2014 201520132012201120102009200820072006200520042003
Disclosed deal value UST Facilitated investments
Source: Thomson Reuters and other publicly available sources.
Deal volume (R-Axis)
Dis
clo
sed
dea
l val
ue ($
bn)
Deal vo
lume
591588
515
584 594 604
549 532520
$6 594
490
543
465
$21 $26 $41 $49 $57 $32 $46
$70
532
$25 $45 $30 $22 $39 $62
Sovereign Wealth Investment
0
50
100
150
200
250
300
2014 20152013201220112010
<$100 mn $100 mn—$1 bn >$1 bn
Source: Thomson Reuters and other publicly available sources.
31
$140
Average deal size (R-Axis)
Dea
l vo
lum
e o
f d
iscl
ose
d d
eal v
alue
Averag
e disclo
sed d
eal value ($bn)
0
50
100
150
200
250
300
350
400$388
$186
$141
$21424
58
35
$161
3237
147 176 147 117 138
32
12
116
6
5
6
7
6
Driving value 6 2015 Automotive M&A Insights
Megadeals Breakdown 2010–2015
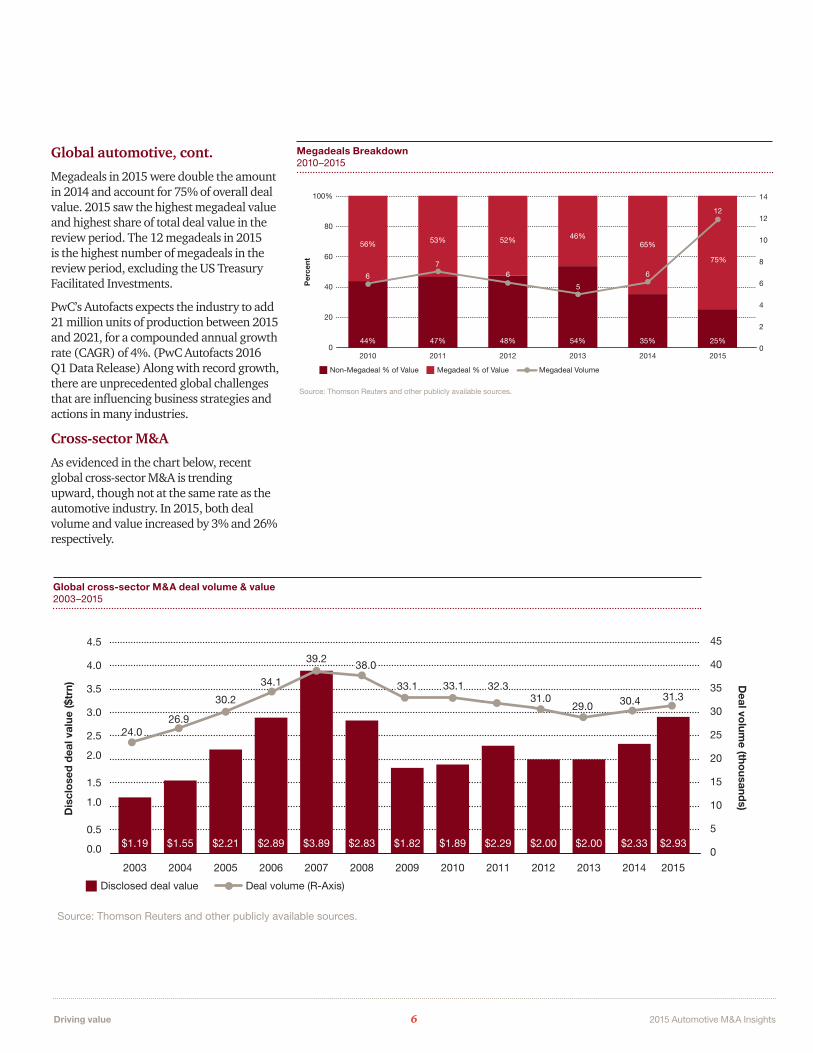
Global automotive, cont.
Megadeals in 2015 were double the amount in 2014 and account for 75% of overall deal value. 2015 saw the highest megadeal value and highest share of total deal value in the review period. The 12 megadeals in 2015 is the highest number of megadeals in the review period, excluding the US Treasury Facilitated Investments.
PwC’s Autofacts expects the industry to add 21 million units of production between 2015 and 2021, for a compounded annual growth rate (CAGR) of 4%. (PwC Autofacts 2016 Q1 Data Release) Along with record growth, there are unprecedented global challenges that are influencing business strategies and actions in many industries.
Cross-sector M&A
As evidenced in the chart below, recent global cross-sector M&A is trending upward, though not at the same rate as the automotive industry. In 2015, both deal volume and value increased by 3% and 26% respectively.
0
20
40
60
80
100%
2014 20152013201220112010
Non-Megadeal % of Value Megadeal % of Value
Source: Thomson Reuters and other publicly available sources.
6
Megadeal Volume
Per
cent
0
2
4
6
8
10
12
14
7
5
6
56% 53% 52%
6
46%65%
75%
44% 47% 48% 54% 35%
12
25%
0.0
0.5
1.0
1.5
2.0
2.5
3.0
3.5
4.0
4.5
201420132012201120102009200820072006200520042003
0
5
10
15
20
25
30
35
40
45
Disclosed deal value
Source: Thomson Reuters and other publicly available sources.
Deal volume (R-Axis)
Deal vo
lume (tho
usands)
30.2
34.1
39.2
31.029.0 30.4 31.3
Dis
clo
sed
dea
l val
ue ($
trn)
26.9
38.0
33.1 33.1 32.3
$1.19 $1.55 $2.21 $2.89 $3.89 $2.83 $1.82 $1.89 $2.29 $2.00 $2.00 $2.33
2015
$2.93
24.0
Global cross-sector M&A deal volume & value 2003–2015
Driving value 7 2015 Automotive M&A Insights
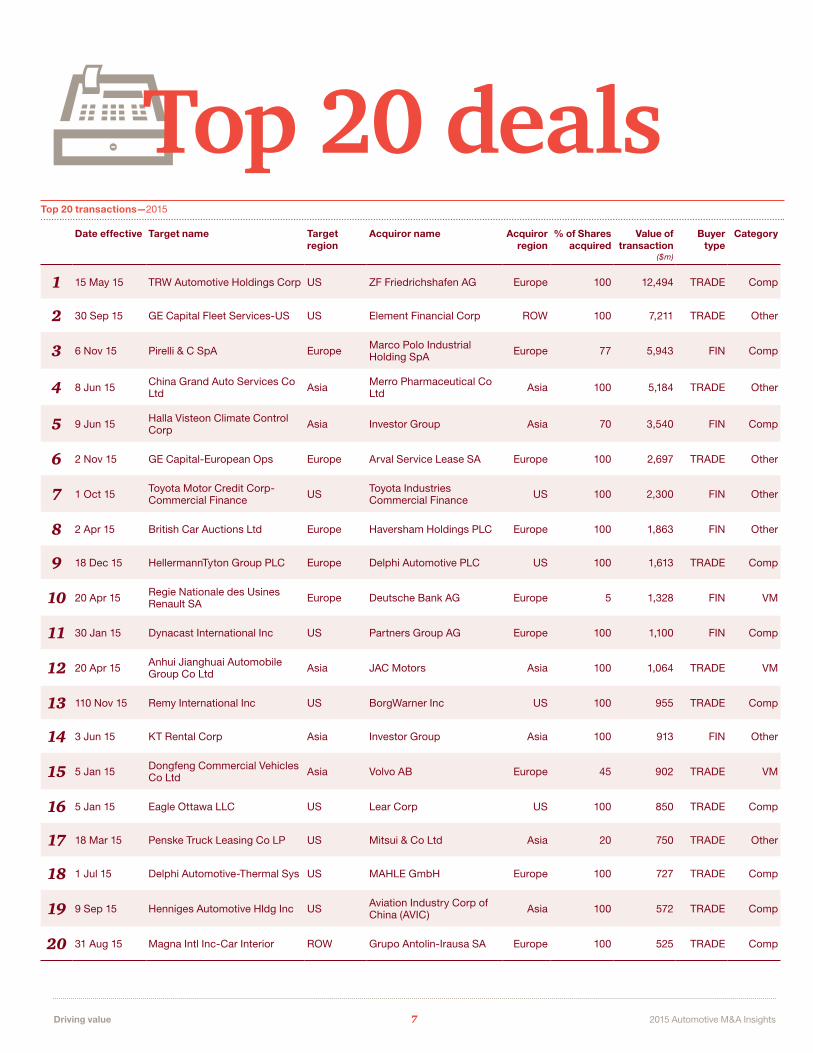
Top 20 dealsTop 20 transactions—2015
Date effective Target name Target region
Acquiror name Acquiror region
% of Shares acquired
Value of transaction
($m)
Buyer type
Category
1 15 May 15 TRW Automotive Holdings Corp US ZF Friedrichshafen AG Europe 100 12,494 TRADE Comp
2 30 Sep 15 GE Capital Fleet Services-US US Element Financial Corp ROW 100 7,211 TRADE Other
3 6 Nov 15 Pirelli & C SpA Europe Marco Polo Industrial Holding SpA Europe 77 5,943 FIN Comp
4 8 Jun 15 China Grand Auto Services Co Ltd Asia Merro Pharmaceutical Co
Ltd Asia 100 5,184 TRADE Other
5 9 Jun 15 Halla Visteon Climate Control Corp Asia Investor Group Asia 70 3,540 FIN Comp
6 2 Nov 15 GE Capital-European Ops Europe Arval Service Lease SA Europe 100 2,697 TRADE Other
7 1 Oct 15 Toyota Motor Credit Corp-Commercial Finance US Toyota Industries
Commercial Finance US 100 2,300 FIN Other
8 2 Apr 15 British Car Auctions Ltd Europe Haversham Holdings PLC Europe 100 1,863 FIN Other
9 18 Dec 15 HellermannTyton Group PLC Europe Delphi Automotive PLC US 100 1,613 TRADE Comp
10 20 Apr 15 Regie Nationale des Usines Renault SA Europe Deutsche Bank AG Europe 5 1,328 FIN VM
11 30 Jan 15 Dynacast International Inc US Partners Group AG Europe 100 1,100 FIN Comp
12 20 Apr 15 Anhui Jianghuai Automobile Group Co Ltd Asia JAC Motors Asia 100 1,064 TRADE VM
13 110 Nov 15 Remy International Inc US BorgWarner Inc US 100 955 TRADE Comp
14 3 Jun 15 KT Rental Corp Asia Investor Group Asia 100 913 FIN Other
15 5 Jan 15 Dongfeng Commercial Vehicles Co Ltd Asia Volvo AB Europe 45 902 TRADE VM
16 5 Jan 15 Eagle Ottawa LLC US Lear Corp US 100 850 TRADE Comp
17 18 Mar 15 Penske Truck Leasing Co LP US Mitsui & Co Ltd Asia 20 750 TRADE Other
18 1 Jul 15 Delphi Automotive-Thermal Sys US MAHLE GmbH Europe 100 727 TRADE Comp
19 9 Sep 15 Henniges Automotive Hldg Inc US Aviation Industry Corp of China (AVIC) Asia 100 572 TRADE Comp
20 31 Aug 15 Magna Intl Inc-Car Interior ROW Grupo Antolin-Irausa SA Europe 100 525 TRADE Comp
Driving value 8 2015 Automotive M&A Insights
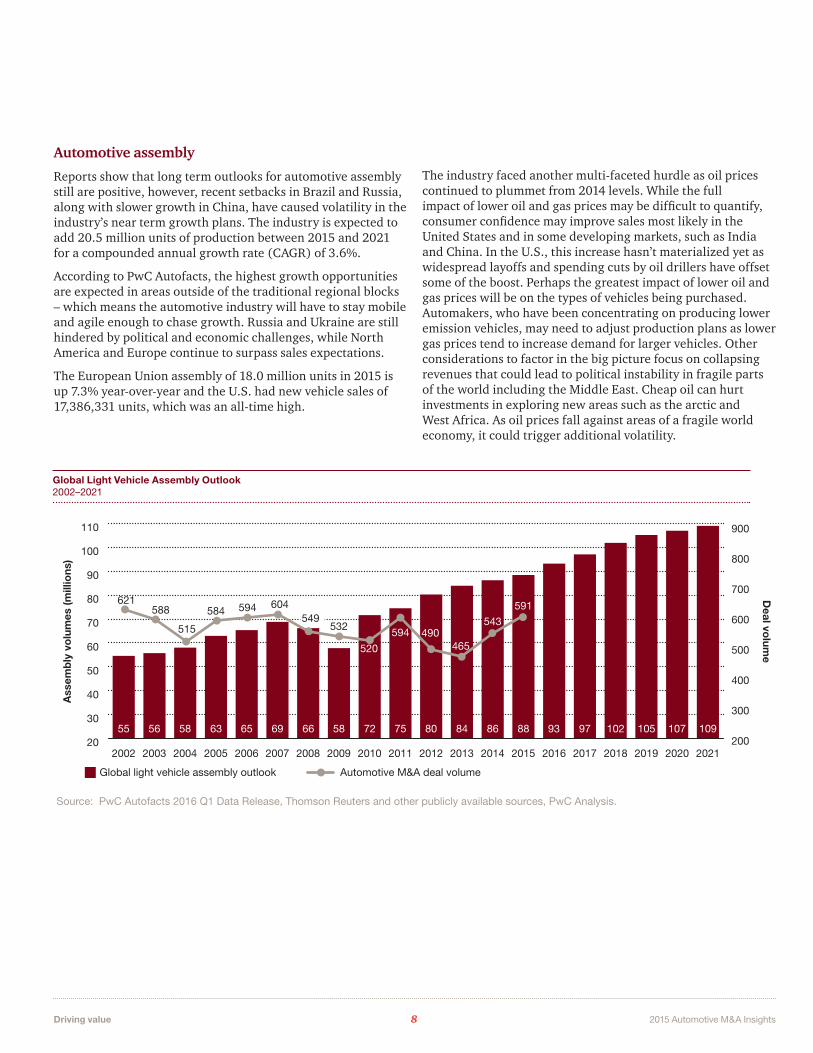
Automotive assembly
Reports show that long term outlooks for automotive assembly still are positive, however, recent setbacks in Brazil and Russia, along with slower growth in China, have caused volatility in the industry’s near term growth plans. The industry is expected to add 20.5 million units of production between 2015 and 2021 for a compounded annual growth rate (CAGR) of 3.6%.
According to PwC Autofacts, the highest growth opportunities are expected in areas outside of the traditional regional blocks – which means the automotive industry will have to stay mobile and agile enough to chase growth. Russia and Ukraine are still hindered by political and economic challenges, while North America and Europe continue to surpass sales expectations.
The European Union assembly of 18.0 million units in 2015 is up 7.3% year-over-year and the U.S. had new vehicle sales of 17,386,331 units, which was an all-time high.
The industry faced another multi-faceted hurdle as oil prices continued to plummet from 2014 levels. While the full impact of lower oil and gas prices may be difficult to quantify, consumer confidence may improve sales most likely in the United States and in some developing markets, such as India and China. In the U.S., this increase hasn’t materialized yet as widespread layoffs and spending cuts by oil drillers have offset some of the boost. Perhaps the greatest impact of lower oil and gas prices will be on the types of vehicles being purchased. Automakers, who have been concentrating on producing lower emission vehicles, may need to adjust production plans as lower gas prices tend to increase demand for larger vehicles. Other considerations to factor in the big picture focus on collapsing revenues that could lead to political instability in fragile parts of the world including the Middle East. Cheap oil can hurt investments in exploring new areas such as the arctic and West Africa. As oil prices fall against areas of a fragile world economy, it could trigger additional volatility.
Global Light Vehicle Assembly Outlook 2002–2021
Global light vehicle assembly outlook
Ass
emb
ly v
olu
mes
(mill
ions
)
Deal vo
lume
Automotive M&A deal volume
Source: PwC Autofacts 2016 Q1 Data Release, Thomson Reuters and other publicly available sources, PwC Analysis.
20
30
40
50
60
70
80
90
100
110
20212020201920182017201620152014201320122011201020092008200720062005200420032002
55
621588
515
584 594 604
532
520
594 490465
543
591
200
300
400
500
600
700
800
900
549
56 58 63 65 69 66 58 72 80 84 86 88 93 97 102 105 107 10975
Driving value 9 2015 Automotive M&A Insights
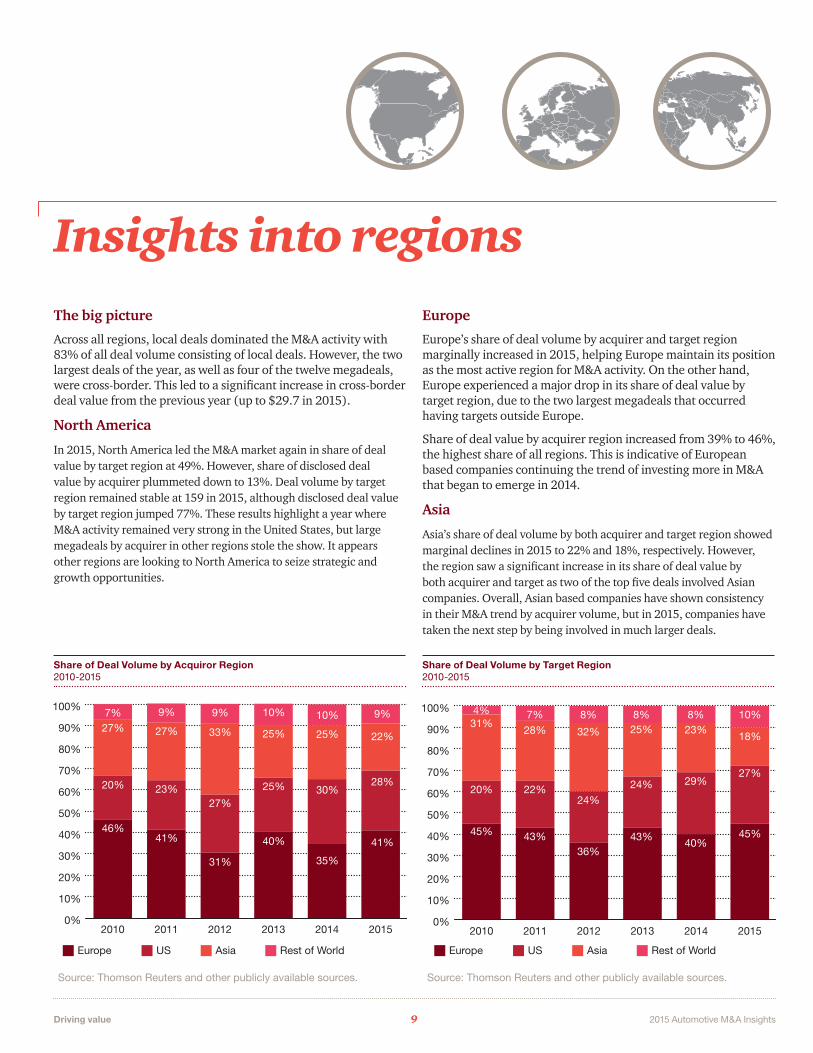
Insights into regionsThe big picture
Across all regions, local deals dominated the M&A activity with 83% of all deal volume consisting of local deals. However, the two largest deals of the year, as well as four of the twelve megadeals, were cross-border. This led to a significant increase in cross-border deal value from the previous year (up to $29.7 in 2015).
North America
In 2015, North America led the M&A market again in share of deal value by target region at 49%. However, share of disclosed deal value by acquirer plummeted down to 13%. Deal volume by target region remained stable at 159 in 2015, although disclosed deal value by target region jumped 77%. These results highlight a year where M&A activity remained very strong in the United States, but large megadeals by acquirer in other regions stole the show. It appears other regions are looking to North America to seize strategic and growth opportunities.
Europe
Europe’s share of deal volume by acquirer and target region marginally increased in 2015, helping Europe maintain its position as the most active region for M&A activity. On the other hand, Europe experienced a major drop in its share of deal value by target region, due to the two largest megadeals that occurred having targets outside Europe.
Share of deal value by acquirer region increased from 39% to 46%, the highest share of all regions. This is indicative of European based companies continuing the trend of investing more in M&A that began to emerge in 2014.
Asia
Asia’s share of deal volume by both acquirer and target region showed marginal declines in 2015 to 22% and 18%, respectively. However, the region saw a significant increase in its share of deal value by both acquirer and target as two of the top five deals involved Asian companies. Overall, Asian based companies have shown consistency in their M&A trend by acquirer volume, but in 2015, companies have taken the next step by being involved in much larger deals.
Source: PwC Analysis
Source: PwC Analysis
Source: PwC Analysis
Share of Deal Volume by Acquiror Region 2010-2015
Share of Deal Volume by Target Region 2010-2015
0%
10%
20%
30%
40%
50%
60%
70%
80%
90%
100%
201520142013201220112010
22%27% 27% 33% 25%
28%20% 23%27%
25%
41%46%
41%
31%
40%
9%7% 9% 10%
25%
30%
35%
10% 9%
Europe US Asia Rest of World
Source: Thomson Reuters and other publicly available sources.
0%
10%
20%
30%
40%
50%
60%
70%
80%
90%
100%
201520142013201220112010
Europe US Asia Rest of World
Source: Thomson Reuters and other publicly available sources.
4% 8% 8%31%
28% 32% 25%
20% 22%24%
24%
45% 43%36%
43%
8%23%
29%
40%
10%
18%
27%
45%
7%
Driving value 10 2015 Automotive M&A Insights
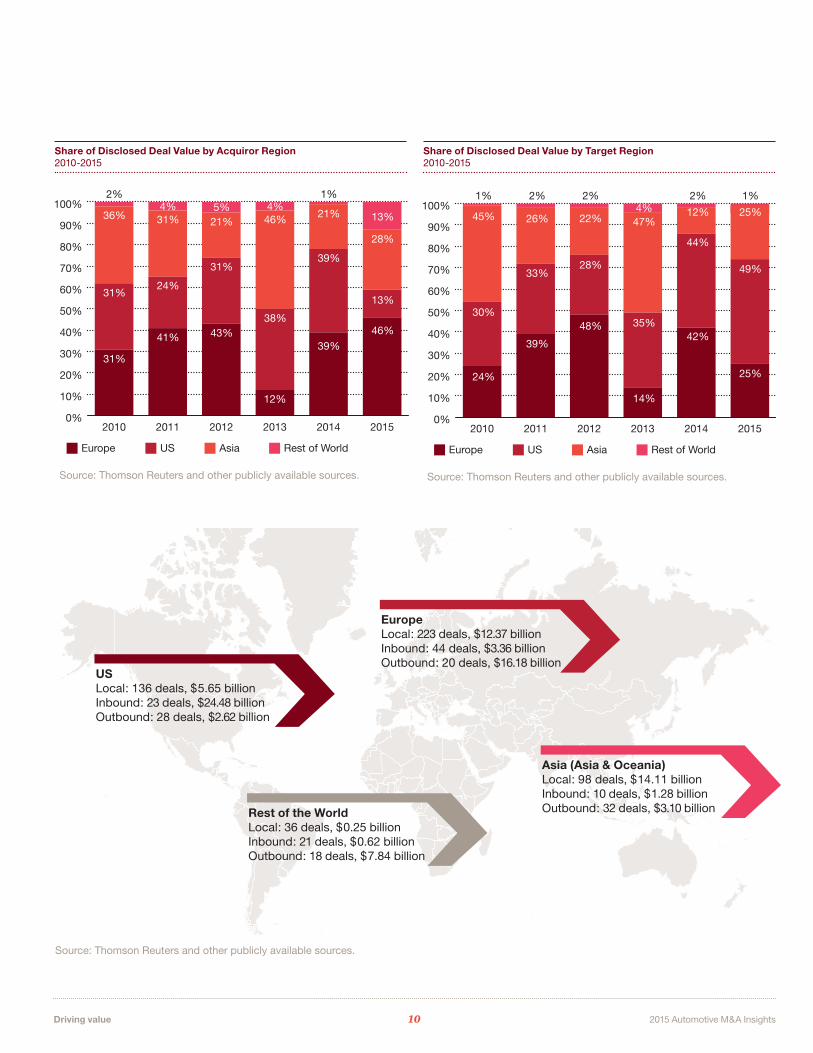
Share of Disclosed Deal Value by Acquiror Region 2010-2015
Share of Disclosed Deal Value by Target Region 2010-2015
USLocal: 136 deals, $5.65 billionInbound: 23 deals, $24.48 billionOutbound: 28 deals, $2.62 billion
Asia (Asia & Oceania)Local: 98 deals, $14.11 billionInbound: 10 deals, $1.28 billionOutbound: 32 deals, $3.10 billionRest of the World
Local: 36 deals, $0.25 billionInbound: 21 deals, $0.62 billionOutbound: 18 deals, $7.84 billion
EuropeLocal: 223 deals, $12.37 billionInbound: 44 deals, $3.36 billionOutbound: 20 deals, $16.18 billion
Source: Thomson Reuters and other publicly available sources.
0%
10%
20%
30%
40%
50%
60%
70%
80%
90%
100%
201520142013201220112010
36% 31% 21% 46% 21%
31%24%
31%
38%
39%
31%
41% 43%
12%
39%
5%4% 4%1%
28%
13%
46%
13%
2%
Europe US Asia Rest of World
Source: Thomson Reuters and other publicly available sources.
0%
10%
20%
30%
40%
50%
60%
70%
80%
90%
100%
201520142013201220112010
45% 26% 22% 47%12%
30%
33%28%
35%
44%
24%
39%
48%
14%
42%
4%2%
25%
49%
25%
1%1% 2% 2%
Europe US Asia Rest of World
Source: Thomson Reuters and other publicly available sources.
Driving value 11 2015 Automotive M&A Insights
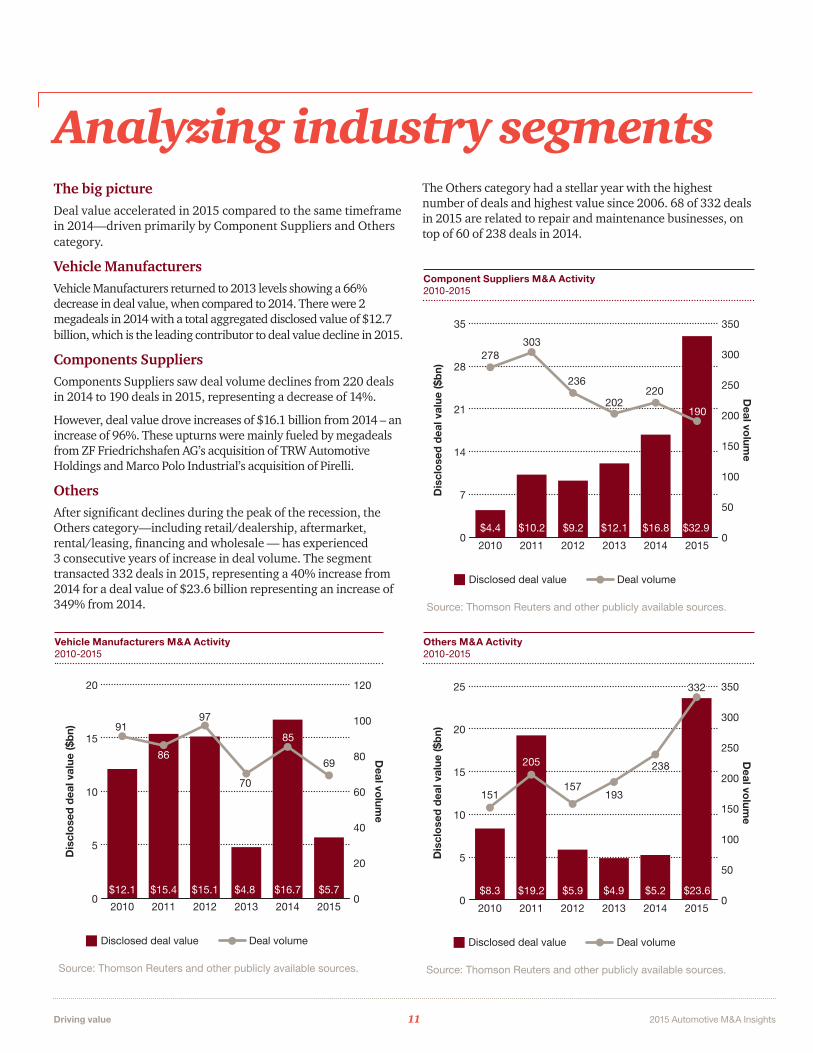
Analyzing industry segmentsThe big pictureDeal value accelerated in 2015 compared to the same timeframe in 2014—driven primarily by Component Suppliers and Others category.
Vehicle ManufacturersVehicle Manufacturers returned to 2013 levels showing a 66% decrease in deal value, when compared to 2014. There were 2 megadeals in 2014 with a total aggregated disclosed value of $12.7 billion, which is the leading contributor to deal value decline in 2015.
Components SuppliersComponents Suppliers saw deal volume declines from 220 deals in 2014 to 190 deals in 2015, representing a decrease of 14%.
However, deal value drove increases of $16.1 billion from 2014 – an increase of 96%. These upturns were mainly fueled by megadeals from ZF Friedrichshafen AG’s acquisition of TRW Automotive Holdings and Marco Polo Industrial’s acquisition of Pirelli.
OthersAfter significant declines during the peak of the recession, the Others category—including retail/dealership, aftermarket, rental/leasing, financing and wholesale — has experienced 3 consecutive years of increase in deal volume. The segment transacted 332 deals in 2015, representing a 40% increase from 2014 for a deal value of $23.6 billion representing an increase of 349% from 2014.
Vehicle Manufacturers M&A Activity 2010-2015
Others M&A Activity 2010-2015
Component Suppliers M&A Activity 2010-2015
Disclosed deal value
Dis
clo
sed
dea
l val
ue ($
bn)
Deal vo
lume
Deal volume
Source: Thomson Reuters and other publicly available sources.
157193
0
5
10
15
20
25
2010
205
0
50
100
150
200
250
300
350
20152014201320122011
$23.6$8.3 $19.2 $5.9 $4.9 $5.2
205
151
238
332
Disclosed deal value
Dis
clo
sed
dea
l val
ue ($
bn)
Deal vo
lume
Deal volume
Source: Thomson Reuters and other publicly available sources.
220
0
7
14
21
28
35
202190
303
236
0
50
100
150
200
250
300
350
201520142013201220112010
189
$4.4 $10.2 $9.2 $12.1 $16.8 $32.9
278
Disclosed deal value
Dis
clo
sed
dea
l val
ue ($
bn)
Deal vo
lume
Deal volume
Source: Thomson Reuters and other publicly available sources.
70
0
5
10
15
20
97
85
6986
0
20
40
60
80
100
120
201520142013201220112010
$12.1 $15.4 $15.1 $4.8 $16.7 $5.7
91
The Others category had a stellar year with the highest number of deals and highest value since 2006. 68 of 332 deals in 2015 are related to repair and maintenance businesses, on top of 60 of 238 deals in 2014.
Driving value 12 2015 Automotive M&A Insights
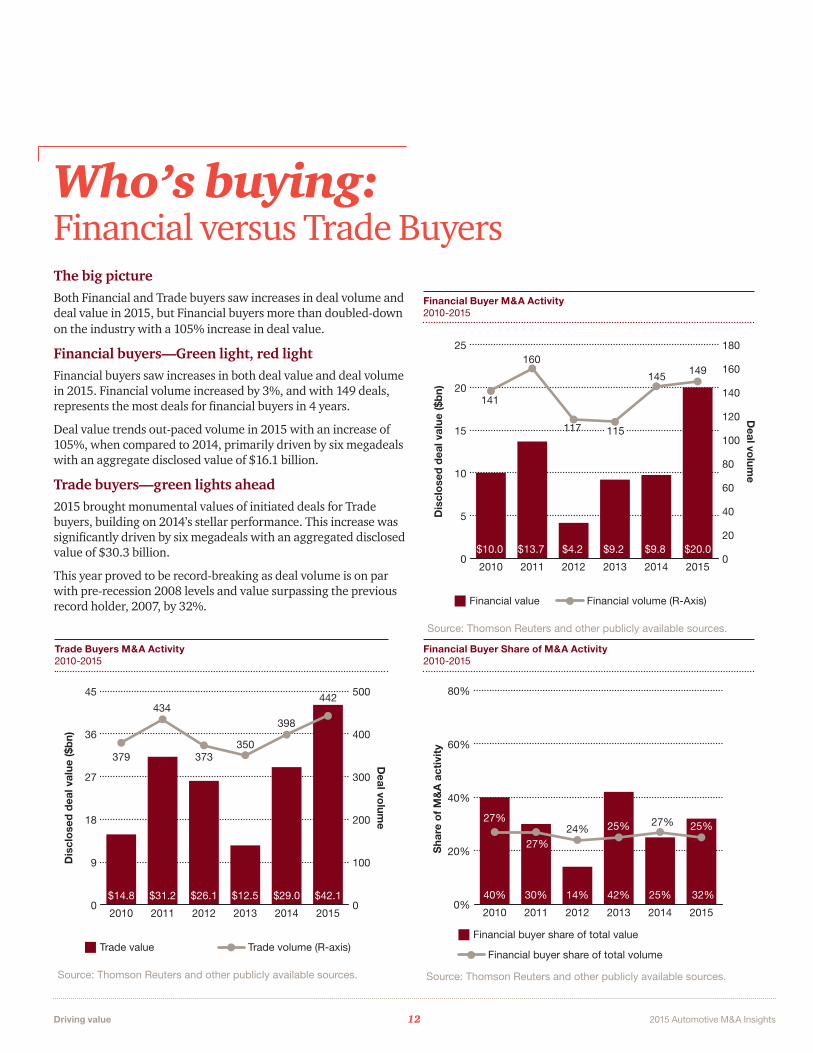
Who’s buying:Financial versus Trade BuyersThe big picture Both Financial and Trade buyers saw increases in deal volume and deal value in 2015, but Financial buyers more than doubled-down on the industry with a 105% increase in deal value.
Financial buyers—Green light, red lightFinancial buyers saw increases in both deal value and deal volume in 2015. Financial volume increased by 3%, and with 149 deals, represents the most deals for financial buyers in 4 years.
Deal value trends out-paced volume in 2015 with an increase of 105%, when compared to 2014, primarily driven by six megadeals with an aggregate disclosed value of $16.1 billion.
Trade buyers—green lights ahead2015 brought monumental values of initiated deals for Trade buyers, building on 2014’s stellar performance. This increase was significantly driven by six megadeals with an aggregated disclosed value of $30.3 billion.
This year proved to be record-breaking as deal volume is on par with pre-recession 2008 levels and value surpassing the previous record holder, 2007, by 32%.
Trade Buyers M&A Activity 2010-2015
Financial Buyer Share of M&A Activity 2010-2015
Financial Buyer M&A Activity 2010-2015
Trade value
Dis
clo
sed
dea
l val
ue ($
bn)
Deal vo
lume
Trade volume (R-axis)
Source: Thomson Reuters and other publicly available sources.
0
9
18
27
36
45
350373
398
442434
0
100
200
300
400
500
201520142013201220112010
379
$42.1$14.8 $31.2 $26.1 $12.5 $29.0
Financial value
Dis
clo
sed
dea
l val
ue ($
bn)
Deal vo
lume
Financial volume (R-Axis)
Source: Thomson Reuters and other publicly available sources.
0
5
10
15
20
25
117
145
160
0
20
40
60
80
100
120
140
160
180
201520142013201220112010
149
141
$10.0 $13.7 $9.2 $9.8 $20.0$4.2
115
Financial buyer share of total value
Sha
re o
f M
&A
act
ivit
y
Financial buyer share of total volume
Source: Thomson Reuters and other publicly available sources.
0%
20%
40%
60%
80%
201520142013201220112010
24%27%
25%25%
40% 30% 14% 42% 25% 32%
27%
27%
Driving value 13 2015 Automotive M&A Insights
The road aheadA positive outlook for Automotive M&AWhile the industry as a whole has faced challenging times over the past several years, the markets have pulled themselves out of the worst global economic downturn in recent history and are trending to surpass the peaks of the automotive industry in 2007 and 2008.
Given the robust Automotive Assembly outlook, PwC expects the M&A markets to continue to stay strong as companies continue to use M&A to drive efficiencies, grow market share, and expand their geographic footprint.
As regulations around safety and fuel economy change, we see M&A playing an increasingly vital role in the development and integration of new technologies into vehicles. Shifting consumer preferences toward a sharing economy are driving increased investments in electronics and alternative forms of mobility. Automotive is quickly becoming the largest consumer electronic and a new mobility industry is emerging. As a result, we expect increased investments in this new sharing economy as well as in electronics and mobility services.
Joint ventures and strategic alliances will ramp up, especially related to cross-border transactions, as traditional vehicle manufacturers and suppliers look to invest in mobility while managing risk. Megadeal activity will likely continue as trade buyers continue to maintain high levels of cash and PE funds have significant funds available. Within the U.S., shareholder activism is the new norm.
Driving value 14 2015 Automotive M&A Insights
A plateau for the automotive industry?As the automotive M&A activity returns to 2007 & 2008 levels, some experts wonder if the industry can continue to grow, before running into a cyclical downturn. Several automotive manufacturers experienced record sales, particular in the U.S. during 2015, begging the question of how often records can be broken.
The next few years will be a crucial for automotive companies to understand and predict the market trends in order to avoid inventory build-up and other issues faced in 2007 & 2008.
It is more important now than ever before for automotive companies to be agile and responsive to consumer demands for technology and other features. Automotive companies have invested in lower-emission cars as well as leveraging technology to create more of an “ultimate connected car”. These tech-boosted vehicles may help decrease cyclical downturns as consumers with higher disposable income become interested and buying habits change.
More elbow-grease needed for autonomous carsExperts predict that the automotive industry will change more in the next few years, than any other time in the industry. As automotive companies plan their moves regarding new technologies around connected and autonomous vehicles, business models across the industry will likely evolve over the next several years.
Driving value 15 2015 Automotive M&A Insights
Contact usTo have a deeper discussion about our point of view on automotive M&A, please contact:
Authors Automotive leadership
Automotive transaction services
Jeff Zaleski PwC US, US Automotive Deals Leader
[email protected] +1 (313) 394 3525
Christopher Becker PwC US, Senior Associate, Automotive Deals
[email protected] +1 (313) 394 3237
Richard Hanna PwC US, Global Automotive Leader
[email protected] +1 (313) 394 3450
Felix Kuhnert PwC Germany, European Automotive Leader and Global Automotive Advisory Leader
[email protected] +49 (711) 25034 3309
Hitoshi Kiuchi PwC, Japan, Asia Pacific Automotive Leader
[email protected] +81 (0)80 3158 6934
Evan Hirsh PwC US, US Automotive Advisory Leader
[email protected] +1 (312) 578 4725
Humberto Tognelli Brazil
[email protected] +55 (11) 3674 3855
Damiano Peluso Canada
[email protected] +1 (416) 814 5776
Leon Qian China
[email protected] +86 (10) 6533 2940
Tang Xun China
[email protected] +86 (21) 2323 3396
Steven Perrin France
[email protected] +33 (0)156 578 296
Martin Schwarzer Germany
[email protected] +49 (0) 69 9585 5667
Sanjeev Krishan India
[email protected] +91 (12) 4330 6017
Francesco Giordano Italy
[email protected] +39 348 1505447
Taizo Iwashima Japan
[email protected] +81 (3) 6266 5572
Jason Wakelam UK
[email protected] +44 (0) 77 1471 1133
Paul Elie US
[email protected] +1 (313) 394 3517
About PwC’s Automotive Practice
PwC’s global automotive practice leverages its extensive experience in the industry to help companies solve complex business challenges with efficiency and quality. One of PwC’s global automotive practice’s key competitive advantages is Autofacts®, a team of automotive industry specialists dedicated to ongoing analysis of sector trends. Autofacts provides our team of more than 5,000 automotive professionals and our clients with data and analysis to assess implications make recommendations, and support decisions to compete in the global marketplace.
About the Deals Practice
The PwC’s Deals practice provides due diligence on both the buy and sell side of a deal, along with advice on M&A strategy, valuation, accounting, financial reporting, and capital raising. For companies in distressed situations, we advise on crisis avoidance, financial and operational restructuring and bankruptcy. With approximately 1,000 deal professionals in 16 cities in the US and over 6,000 deal professionals in over 90 countries, experienced teams are deployed with deep industry and local market knowledge, and technical experience tailored to each client’s situation. Our field-proven, globally consistent, controlled deal process helps clients decrease minimize their risks, progress with the right deals, and capture value both at the deal table and after the deal closes.
About Autofacts®
Autofacts is a key strategic asset of PwC’s global automotive practice. Fully integrated with PwC’s more than 5,000 global automotive professionals, Autofacts provides ongoing auto industry analysis our clients use to shape business strategy, assess implications and support a variety of operational decisions. The Autofacts team also draws from the strengths of PwC’s marketing, sales and financial services groups to support other key areas of automotive companies’ functions. Since 1985, our market-tested approach, diverse service offerings and dedication to client service have made Autofacts a trusted advisor throughout the industry. For more information, visit www.autofacts.com.
Visit our automotive industry website at www.pwc.com/auto
PwC helps organisations and individuals create the value they’re looking for. We’re a network of firms in 157 countries with more than 195,000 people who are committed to delivering quality in assurance, tax and advisory services. Tell us what matters to you and find out more by visiting us at www.pwc.com. Learn more about PwC by following us online: @PwC_LLP, YouTube, LinkedIn, Facebook and Google +.
This publication has been prepared for general guidance on matters of interest only, and does not constitute professional advice. You should not act upon the information contained in this publication without obtaining specific professional advice. No representation or warranty (express or implied) is given as to the accuracy or completeness of the information contained in this publication, and, to the extent permitted by law, PwC does not accept or assume any liability, responsibility or duty of care for any consequences of you or anyone else acting, or refraining to act, in reliance on the information contained in this publication or for any decision based on it.
© 2016 PwC. All rights reserved. PwC refers to the PwC network and/or one or more of its member firms, each of which is a separate legal entity. Please see www.pwc.com/structure for further details.
This content is for general information purposes only, and should not be used as a substitute for consultation with professional advisors.
126972-2016
All dollar amounts are expressed in US dollars, unless otherwise noted.