driving global britain
TRANSCRIPT

UK AUTOMOTIVE TRADE REPORT 2021
DRIVING GLOBAL BRITAIN

CONTENTS
CONTENTS
3 FORWARD
4 EXECUTIVE SUMMARY
6 CHAPTER 1: UK AUTOMOTIVE TRADE IN 2020
16 CHAPTER 2: THE LONG WAY TO RECOVERY: ADJUSTING TO THE NEW NORMAL
22 CHAPTER 3: LIFE BEYOND BREXIT: TOWARDS A NEW EUROPEAN PARTNERSHIP
28 CHAPTER 4: CHASING GROWTH MARKETS: GLOBAL AUTOMOTIVE OUTLOOK
36 CHAPTER 5: GLOBAL BRITAIN: AUTOMOTIVE AS THE ENGINE OF A NEW UK TRADE STRATEGY
42 RECOMMENDATIONS
44 ANNEX
As the world re-emerges from the pandemic, the diversity and importance of Britain’s automotive industry should be a competitive advantage for the UK
2 THE SOCIETY OF MOTOR MANUFACTURERS AND TRADERS

FOREWARD
3THE SOCIETY OF MOTOR MANUFACTURERS AND TRADERS
In a year when markets around the world shut down as individual countries grappled with the pandemic, every sector had to readjust expectations. For the previous three years, the UK automotive sector had generated trade revenues of more than £100 billion a year. In the year of Covid-19, business was never going to be normal, but 2020 did confirm one vital fact that should fuel optimism for all those involved in automotive; road vehicles remained the UK’s single most valuable export, generating more wealth for the nation than power-generating equipment, pharmaceuticals, or even gold.
This is testament to the industry’s resilience, and its global excellence. Britain’s automotive sector is a powerhouse of international trade. Many countries have automotive industries, some larger in size. But no other nation can boast the depth and variety of the UK’s automotive sector. From specialist sports cars and high-end luxury vehicles to mass-market volume cars, from the vans and trucks that sustained supermarkets and broader society to the world renowned British buses and taxis, the UK produces (and exports) it all.
Although the picture is certainly improving, the pandemic is not yet over. Global shipping patterns are disrupted. Costs have risen. Key goods and components shortages remain. However, there are two further and significant challenges that will impact and determine automotive trade over the next decade.
The first is ongoing; how the industry adjusts to a post-Brexit world. The Trade and Co-operation Agreement (TCA) fundamentally changes the way we trade with our biggest and closest market. Furthermore, it gives the UK the opportunity to negotiate future terms of trade with the rest of the world, including growing markets in Eastern Europe and Asia.
The other challenge is to deliver shared ambitions on climate change. The UK has declared its intention to take a leading role which, for the automotive sector, most obviously means the end of sale of fossil-fuelled vehicles. The next decade will test us, and our trade performance will reveal how successfully the automotive sector adapts and takes advantage of the new opportunities.
To do so, and ensure automotive remains the trading powerhouse of Global Britain, there are two steps required. First, ensure we have a strong, globally competitive manufacturing sector, one that has transferred its undoubted excellence in internal combustion engines to expertise in electrified technologies. Second, take advantage of the TCA and forge new agreements with growth markets, break down any barriers to trade and attract investment into the UK.
We have left the EU but we have not left the European automotive sector. It is still our biggest market, our biggest source of vehicles and our biggest source of parts and components. The implications of this inter-dependence in trade terms cannot be ignored and any future trade agreements must reflect this with attainable origin requirements and tariff-free treatment in key markets. Britain must remain a destination for top global talent so our industry can deliver innovation and excellence with a global outlook.
As the world re-emerges from the pandemic, the diversity and importance of Britain’s automotive industry should be a competitive advantage for the UK. With automotive at the heart of future trade policy, and negotiations focused on the removal of both tariff and non-tariff barriers, we can drive the growth of Global Britain and sustain our place as an economic, industrial and environmental leader.
Mike Hawes Chief ExecutiveThe Society of Motor Manufacturers and Traders (SMMT)
FOREWORD

EXECUTIVE SUMMARY
4 5THE SOCIETY OF MOTOR MANUFACTURERS AND TRADERS THE SOCIETY OF MOTOR MANUFACTURERS AND TRADERS
A trade strategy that has automotive at its heart
Government’s consultative mechanisms must be functional
Future-proof the UK automotive industry through a competitive business environment
Align the UK’s international trade and domestic industrial objectives
Champion trade agreements which address regulatory barriers
Workable rules of origin which reflect the UK’s post-Brexit supplier base
Mitigate impacts of costly customs requirements
Make the UK an automotive global talent hub
Enhance resilience to protect against future global disruption
Maintaining a close relationship with our neighbours in the EU
TEN RECOMMENDATIONSFOR GOVERNMENT AND INDUSTRY
01
03
05
06
08
02
04
07
09
10
EXPO
RTS
1.82mSMMT Outlook at July
forecasts registrations to reach 1.82m in 2021
2020 HIGHLIGHTSUK AUTOMOTIVE TRADE: £74 billion
EU 78.1%
Japan 7.3%
South Korea 4.2%
Turkey 3.1%
South Africa 2.2%
China 1.6%
USA 1.5%
Mexico 1.0%
Morocco 0.7%
India 0.1%
Other 0.1%
£30 billion Value of exports
£43.8 billion Value of imports
93.9% of light commercial vehicles were imported
KEY MARKETS: UK EXPORTS %, NATIONAL MARKET GROWTH OUTLOOK AND TRADE NEGOTIATION STATUS
TOP EXPORT DESTINATIONS
TOP IMPORT DESTINATIONS FOR NEW CARS
Share UK LMC growth Trade deal exports ‘25 v ‘19 statusEU 53.5% 3.5% Agreed
Japan 3.5% -4.8% Agreed
Turkey 2.6% 107.3% Agreed
Switzerland 0.9% -1.3% Agreed
S Korea 1.7% 9.9% Renegotiating
Canada 1.5% -0.5% Renegotiating
Mexico 0.4% 13% Renegotiating
U.S.A. 17.7% -0.1% Negotiating
Australia 2.1% 16.7% Negotiating
India 0.1% 42.2% Negotiating
China 7.6% 21.6% No deal in view
Russia 1.1% 32.2% No deal in view
Brazil 0.3% 6.3% No deal in view
Britain’s automotive sector is a powerhouse of international trade
IMPO
RTS
80% UK made vehicles exported abroad
78.1% imported cars came from the EU
EU 53.5%
U.S.A. 17.7%
China 7.6%
Japan 3.5%
Turkey 2.6%
Australia 2.1%
S Korea 1.7%
Canada 1.5%
Russia 1.1%
Switzerland 0.9%
Mexico 0.4%
Brazil 0.3%
India 0.1%
Automotive makes up 10.9% of all UK manufactured goods exports (ONS)

CHAPTER 1
6 THE SOCIETY OF MOTOR MANUFACTURERS AND TRADERS
UK AUTOMOTIVE TRADE IN 2020→ UK automotive delivered £74billion in trade in 2020, despite one of the
worst years on record and so down on the five-year average of £97 billion. → Despite prolonged shutdowns, automotive has remained a crucial pillar
of the UK economy. Road vehicles remained the UK’s most exported commodities by value at £27 billion, performing better than power-generating equipment pharmaceuticals and gold. The automotive industry as a whole is the second most valuable exporter of goods.
→ Trade in parts significantly declined, with exports of UK-made engines performing relatively better than engine imports and a substantial reduction of the trade deficit in exchanges of typical parts and accessories.
TOTAL AUTOMOTIVE TRADE2020 was a year like no other; defined by turmoil and disruption, with no industry or country exempt from the widespread impact of Covid-19. Automotive, however, has clearly been amongst the worst hit sectors, seeing widespread market closure and production frozen. The early effects of the pandemic first halted advanced manufacturing in key East Asian automotive hubs, subsequently driving significant supply chain disruption. In the UK, and elsewhere in Europe, manufacturers faced shortages of crucial components, resulting in costly production line stoppages. As the pandemic worsened and spread globally, UK manufacturers endured numerous plant shutdowns, workers were furloughed, and showrooms were closed for much of the year.

CHAPTER 1
7THE SOCIETY OF MOTOR MANUFACTURERS AND TRADERS
EXPORTS OF UK FINISHED VEHICLESThe number of vehicles produced in the UK for export to the rest of the world dropped significantly in 2020. Already experiencing a steady decline for the past three years after a peak in 2016, the effects of the global pandemic clearly show consumers all over the world have held off on making ‘big-ticket’ purchases such as new vehicles. Lockdowns worldwide often resulted in the closure of showrooms and reduced mileage of both private owners and fleets, with significant impacts on vehicle demand. It is no surprise that, in 2020, the UK’s exports of all vehicles fell to less than one million for the first time in more than a decade, with the UK exporting less than 800,000 vehicles.
For British-built cars, which represents the vast majority of the finished vehicles that the UK exports, the decline was the most acute. Less than 750,000 cars built in the UK were exported abroad, compared with just over one million in 2019, a drop of -29.1%.
Commercial vehicle (CV) manufacturers also saw their total number of exported units decline, with exports of UK-built CVs falling by -17.9% on a year-to-year basis, to less than 38,000 exported units.
However, whilst the total volume of trade may have declined during the pandemic, the percentage of vehicle exports remained the same. The UK continues to export approximately 80% of its finished vehicles to the rest of the world, illustrating that manufacturers largely continue to build for markets other than the UK.
Chart 2 UK vehicle production for export market by volume
1,500
1,250
1,000
750
500
250
0
100
80
60
40
20
0
20202019201820172016201520142013201220112010
Source: SMMT Cars All vehicles CVs
Cars and All Vehicles – thousands CVs – thousands
And yet, in a year where a sector famed for cost-sensitivity, just-in-time manufacturing processes, and reliance on face-to-face business sales took perhaps its heaviest blow ever, automotive still delivered £74 billion in combined trade to the UK economy.
While these figures mark a significant fall, compared to the average of £97 billion recorded over 2015-2019, automotive remains a major economic contributor despite unprecedented challenges. In 2020, UK automotive businesses exported £30 billion worth of goods and imported £43 billion parts, components and finished vehicles.
Despite the great lockdown impacts, automotive stands as the second biggest exporter of manufactured goods after basic metals, while motor vehicles remained Britain’s most exported commodities by value – a remarkable feat under truly remarkable circumstances. In 2020, UK worldwide exports of basic metals stood at a slightly larger £30,042 billion versus £30,042 billion for automotive goods. The sector exports 10.9% of all UK manufactured goods and 5.2% of all UK exports, including services (ONS).
The UK’s overall automotive trade balance has had a deficit for over a decade and reaching its biggest gulf in 2015. Recent years have generally seen a positive trend of change, although exports have seen a small decline in 2018, and 2019 subsequently saw the trade deficit grow once more, possibly owing to the disruption and uncertainty around the UK’s departure from the European Union. Figures for 2020 show that the chasm between the value of imports and exports appears to be closing, albeit slowly. However, it is too early to understand if the deficit reduction in 2020 will be a prolonged trend, or merely a result of importing challenges caused by Covid-19, reduced domestic demand and Brexit, which have had a major impact on business decisions.
Exports Source: ONS Imports
60,000
2020
50,000
40,000
30,000
20,000
10,000
0
2019201820172016201520142013201220112010
£ Million
Chart 1 Total automotive trade value (Motor vehicles, trailers & semi-trailers, parts & components)

CHAPTER 1
8 THE SOCIETY OF MOTOR MANUFACTURERS AND TRADERS
In terms of value, motor vehicles remained the single most exported good from the UK to the rest of the world. This is despite four consecutive years of decline in the years preceding 2020, and extensive factory and showroom closures throughout 2020.
HMRC 2020 trade figures show road vehicles accounted for 8.8% of the UK’s exports in 2020, 1.6 percentage points more than the next biggest export good – power generating equipment and machinery – and £7 billion more valuable than exports of medicinal and pharmaceutical products. The extent of the automotive industry’s contribution to the UK’s export footprint highlights its significance to the wider economy. In a year when globally, many priorities changed, the tremendous resilience and global appeal of the UK’s automotive brands, and the products and services which they manufacture and deliver was keenly demonstrated.
Unsurprisingly, 2020 saw every segment of UK automotive export sales affected. In 2019, exports of finished vehicles from premium and volume manufacturers were already declining, affected by a decrease in overseas shipments and the slowdown of automotive in key trading partners, such as Japan and the US In contrast, exports of high-end, luxury vehicles from the UK’s Small Volume Manufactures (SVMs) showed greater resilience.
While the decline for SVMs in 2020 has been significant with -27.8% fewer luxury vehicles exported, SVMs were still able to export almost 1,000 more vehicles in 2020 than it did in 2018 – an achievement that illustrates the unparalleled value of this sector.1
Meanwhile, volume and premium manufacturers saw exports of their products continue to decline, but at a greater pace than pre-pandemic, illustrating the considerable damage caused by both the 2018-2019 slowdown in the international automotive arena and by the latest global crisis. In 2020, volume car exports fell by -28.5%, while exports of premium cars declined by -29.9%.
Chart 3 Top 10 UK goods exports 2020 (value)
Source: HMRC
Road vehicles (including air cushion vehicles)
Power generating machinery & equipment
Medicinal & pharmaceutical products
Petroleum, petroleum products & related materials
Gold Non-Monetary (Exc Ores & Concentrates)
Miscellaneous manufactured articles n.e.s.
Non-ferrous metals
General industrial machinery & eqp. & machine pt.n.e.s.
Ele machinery, app & appliances & ele pt thereof n.e.s.
Other transport equipment
£27,2418.8%
£22,3107.2%
£20,5046.6%
£18,9256.1%
£17,1215.5%
£16,3705.3%
£14,6234.7%
£13,4414.3%
£12,8244.1%
£12,1763.9%
£ Million
1 See also “UK Low Volume and Specialist Vehicle Manufacturers’ Report 2021, https://www.smmt.co.uk/reports/uk-low-volume-and-specialist-vehicle -manufacturers/
Chart 4 UK car exports by type (volume)
Source: SMMT
800
2019
700
600
500
400
300
200
100
0
30
25
20
15
10
5
0
2020201820172016
Volume and Premium manufacturers – thousands
SVMs – thousands
Volume Premium Small Volume Manufacturers
Total goods export: £311.2 Billion

CHAPTER 1
9THE SOCIETY OF MOTOR MANUFACTURERS AND TRADERS
In absolute terms, export volumes are down in all regions, including the EU, North America, Asia, Europe (outside the EU), the Oceania region and Africa.
Despite a decline of -2.5%, the EU remains the dominant market for UK manufacturers, with North America following as the next largest market, yet also seeing a fall of -2.7%. Exports to Asia and non-EU European countries were also proportionally greater than the previous year. Non-EU European countries could be considered the more stable export region given the smaller year-on-year decline, while Asia has two highly important growth markets in China and South Korea. Nevertheless, when examining the combined volume of the UK’s export footprint, more than 80% of car exports go to the broader European region (EU, other Europe) and North America, therefore demonstrating the importance of these regions as key market hubs. Unless growth in Asian markets makes up for the loss of Honda’s sales in the US following its discontinuation of UK production, it is likely that the EU and other European markets will receive an even greater proportion of UK car exports in the next future.
When considering the value of UK car exports, shipments to non-EU destinations have consistently performed better than movements to the EU since 2010 (HMRC).
Chart 5 UK 2020 car exports by destination (volume)
Source: SMMT
Chart 6 UK passenger car exports (value)
Source: HMRC
25
2020
20
15
10
5
0
40
35
30
25
20
15
10
5
0
20192018201720162015201420132012201120102009
£ Billions Total trade (Billions)
EU 53.5%
Other Europe 5.9%
America 20.9%
Oceania 2.6%
Asia 15.7%
Africa 1.3%
This might be explained by the diversification of export destinations by premium and small volume manufacturers. Export destination by vehicle type has been broadly unchanged in 2020. The EU continues to be the most important market for volume manufacturers by a considerable margin, with more than 70% of products destined for the region. Without Honda’s exports to the US, it is likely that volume manufacturers’ dependency on the European market will intensify in the next future. For premium manufacturers, the EU was also the largest market, but with a more modest 34.6% of cars exported there, whilst Asia remained the number one destination for exports for small volume manufacturers, holding strong at 46.9% of the market, illustrating the value that consumers in Asia place on British high-end brands (SMMT).
Other 0.2%
EU Non-EU Total

CHAPTER 1
10 THE SOCIETY OF MOTOR MANUFACTURERS AND TRADERS
Chart 7 Export destination by vehicle type
Source: SMMT
80
Other
70
60
50
40
30
20
10
0
Other EuropeOceaniaEUAsiaAmericaAfrica
£ Million
Volume Premium SVM
The world’s four biggest economies remained the main export markets for UK cars. In 2020 there was a significant decline in exports of volume cars to the EU and US. Manufacturers of volume and premium manufacturers had experienced this trend in 2019, however the decline in 2020 was much more substantial, with only 400,000 volume cars exported in 2020 compared to 578,000 in 2019.
In comparison, exports to China showed a slight increase from 2019 figures, an indication that demand in China is atypical of the rest of the world experience, but also that the country is experiencing a quicker recovery post-pandemic, with China exiting its lockdown earlier than other nations around the world and reigniting pent-up demand for vehicles. Similarly, exports to South Korea have increased slightly, further underscoring its position as one of the most important growth markets in Asia.
Elsewhere, Turkey and Switzerland are also back into the top 10 export destinations, replacing Israel and Ukraine. Turkey, therefore, returns to its traditional export ranking after an anomaly in 2019.
Chart 8 Top 10 car export destinations by volume
Source: SMMT
6005004003002001000
1 EU
2 U.S.A.
3 China
4 Japan
5 Turkey
6 Australia
7 S Korea
8 Canada
9 Russia
10 Switzerland
Thousands
2020 2019

CHAPTER 1
11THE SOCIETY OF MOTOR MANUFACTURERS AND TRADERS
The breakdown of EU export destinations by member states highlights the prominent role of Germany as the sector’s biggest trading partner in the region. Taken together, exports to the four largest EU markets account for 64% all exports to the EU and a third (33.3%) of total UK car exports.
Rank Country Share exports to EU Share total UK exports
1 Germany 28% 14.5%
2 France 14% 7.3%
3 Italy 12% 6.0%
4 Spain 10% 5.4%
5 Belgium 6% 3.2%
6 Poland 5% 2.4%
7 Netherlands 4% 2.3%
8 Denmark 4% 1.9%
9 Hungary 4% 1.9%
10 Sweden 2% 1.2%
Others 12%
The world’s four biggest economies remained the main export markets for UK cars
Source: SMMT

CHAPTER 1
12 THE SOCIETY OF MOTOR MANUFACTURERS AND TRADERS
IMPORTS OF FINISHED VEHICLESThe share of imported light commercial vehicles (LCVs) in the UK’s domestic market declined sharply in 2020 after hitting record highs the previous year. The slowdown meant a record fall in the volume of imported LCVs, with 75,000 fewer than in 2019. However, the import share for the wider LCV market still remains larger than in 2016, reflecting the overall trend of growth the sector has experienced over recent years.
Whilst successive lockdowns and Covid-19 restrictions across much of the UK’s European neighbours have continued to affect the major manufacturing nations of Europe and the wider supply chain, demand for LCVs did not fall off completely in 2020 and is expected to pick up strongly, with increasing demand for home deliveries and essential services picking up. The ongoing shortages of semiconductors, steel and other components will continue to affect the sector, however the resilience of these businesses and their importance to the economy is clearly growing.
Import volume Source: SMMT Import share
400 100
2020
300
200
100
0
95
80
70
85
75
201920182017201620152014201320122011201020092008
90
Volume – thousands
Chart 9 UK registrations of imported LCVs by volume
Share (%)
Volume Source: SMMT Share
2.5
2.0
1.5
1.0
0.5
0.0
100
80
60
40
20
0
20202019201820172016201520142013201220112010
Volume – millions
Chart 10 UK registrations of imported cars by volume
Share
For UK registrations of imported cars by volume, the global pandemic and subsequent slowdown of automotive markets has meant a record fall in the volume of imported cars, with 500,000 fewer volume vehicles imported than in 2019.
As with LCVs, although total sales have declined significantly, the share of imported cars by volume has only dropped by -1.2% compared to 2019 and remains above 2017 levels. In this regard, the share of the UK’s import market was similar to 2019, in spite of substantial headwinds and disruption, British consumers’ appetite for imported products and the UK’s openness to imports from global manufacturers remains pivotal despite the decline in volume terms.
With regards to the originating destination of imports into the UK, this footprint remains largely similar to 2019. The EU continues to account for most car imports, with 78.1% of cars travelling from the EU27 into the UK in 2020, despite a volume decline of -30.5% from 2019. Japan – the UK’s second-largest import market – also saw a decline with just over 100,000 vehicles imported.
Elsewhere, China was the only market to show an increase in the volume of its imports into the UK in 2020. However, the total share of Chinese imports in the entire UK market has seen only a marginal increase, and remains a modest 1.6% of all UK imports.
Source: SMMT
Chart 11 UK imported car registrations by origin 2020 (volume)
EU 78.1%
Turkey 3.1%
Japan 7.3%
S Africa 2.2%
S Korea 4.2%
China 1.6%USA 1.5%Mexico 1.0%Morocco 0.7%India 0.1%Others 0.1%

CHAPTER 1
13THE SOCIETY OF MOTOR MANUFACTURERS AND TRADERS
Contrary to exports, the dominant position of the EU is also reflected also in value terms, with EU imports worth more than £23 billion in 2020, dwarfing the value of imports from the rest of the world (HMRC).
However, of the top 10 originating EU destinations for car imports, the UK experienced major declines in import volumes from all during 2020, except Belgium, Romania and Hungary, which stand as the 7th, 9th and 10th largest EU import originators respectively. Germany, the UK’s largest import destination by far, declined by -31.8% compared to 2019 (SMMT).
Chart 12 Passenger car imports (value)
Source: HMRC
40
2020
35
30
25
20
15
10
5
0
45
40
35
30
25
20
15
10
5
0
2019201820172016201520142013201220112010
£ Billions Total car imports (Billions)
EU Non-EU Total
Chart 13 UK car registrations – top 10 originating from the EU
Source: SMMT
700,000
600,000
500,000
400,000
300,000
200,000
100,000
0
AustriaHungaryPolandBelgiumRomaniaSlovakiaFranceCzech Republic
SpainGermany
2019 2020
The share of imported light commercial vehicles in the UK’s domestic market declined sharply in 2020 after hitting record highs in 2019

CHAPTER 1
14 THE SOCIETY OF MOTOR MANUFACTURERS AND TRADERS
ENGINES TRADEIn 2020, the total value of engine trade in the UK fell by approximately £1 billion, with £2.6 billion worth of trade compared to £3.6 billion in 2019. Whilst engine exports and imports both experienced a drop, UK exports fared better, with the UK still exporting £2.2 billion worth of engines, in comparison to £2.8 billion in 2019 – an illustration of both the competitiveness of domestic manufacturers and the value of British-built engines.
In comparison, imports of engines to the UK almost halved, falling to around £455m. This decline has resulted in a £1.77 billion trade surplus between UK exports and imports of engines.
The EU remained the biggest destination for engines built in the UK, accounting for 45% of all exports in 2020. In value terms, the UK saw a fall of approximately £300m in line with the decline in total trade, however the share of exports headed to the EU remains on par with 2019, which stood at 46.6%.
Elsewhere, exports to Turkey held strong, despite the customs and trade challenges posed by the end of the transition period and the UK and Turkey’s bilateral FTA renegotiations. The share of the value of exports to Turkey grew from 31.3% in 2019 to 35.9% in 2020, subsequently reducing rest of the world trade in engines from the UK to less than 20%.
Exports of petrol and diesel engines in 2020 witnessed a decline much like the rest of the automotive trade. Petrol engines dropped below £1 billion for the first time since 2012, with the greatest fall in non-EU destined exports. In contrast, diesel engines exported to the EU experienced a more significant decline, contributing to a total of £1.28 billion exports of diesel engines, down from £1.53 billion in 2019.
Chart 14 Total engine trade (value)
Source: HMRC Engines exports Engines imports
4,000
0
3,000
2,000
1,000
5,000
20202019201820172016201520142013201220112010
£ Millions
Chart 15 UK engines exports 2020 (value)
Source: HMRC
Chart 16 Engines exports by engine type (value)
Source: HMRC
2,000
2019 2020
1,500
1,000
500
0
201820172016201520142013201220112010
£ Millions
EU 45.8%Turkey 35.9%ROW 18.3%
Exports Petrol Engines Exports Diesel Engines
Total

CHAPTER 1
15THE SOCIETY OF MOTOR MANUFACTURERS AND TRADERS
TRADE OF PARTS AND COMPONENTSIn 2020, total trade of parts and components fell below £14 billion for the first time since 2012, with £13.2 billion worth of combined exports and imports.
While the UK continues to import a greater value of automotive parts and components than it exports, the trade deficit closed significantly in 2020 as the UK imported less than £10 billion worth of parts and exported just short of £4 billion. The reduction of the UK’s trade deficit for parts and components is, in part, likely due to the global supply chain shortages, experienced throughout the pandemic, affecting British manufacturer imports to a great degree than their exports. Automotive is hopeful that recently negotiated FTAs will aid the sector’s goal of increasing exports of parts and components and further levelling up the trade balance.
Exports of typical parts, chassis and bodies were destined largely for the EU, underscoring the importance of the UK and Europe’s integrated continental supply chain and the critical need to maintain a close relationship with UK’s neighbours. £2.6 billion worth were sent to the EU in 2020, while £1.2 billion were destined for elsewhere in the world.
For imports into the UK, the reliance on EU-built parts, accessories and components was far greater. In 2020, the UK imported £7.5 billion worth of parts compared with just £1.7 billion brought in from the rest of the world. The significance of EU-built parts and components is unlikely to shift, given the regional origin requirements set out in the new UK-EU trade agreement and the assurance that trading with close geographical neighbours offers for UK manufacturers, especially at a time when global supply chain shortages are so prevalent.
Chart 17 Total trade of parts and components (value)
Source: HMRCParts Exports Parts Imports
20
2020
16
12
8
4
0
2019201820172016201520142013201220112010
£ Billions
Chart 18 Exports of parts, accessories & components (value)
Source:HMRC
4
3
2
1
0
6
5
4
3
2
1
0
20202019201820172016201520142013201220112010
Chart 19 Imports of parts, accessories & components (value)
Source: HMRC
12 14
10
8
6
4
2
0
12
10
8
6
4
2
0
20202019201820172016201520142013201220112010
£ Billions
EU Non-EU
£ Billions Total Trade Value (£ Billions)
Total
EU Non-EU Total
Total Trade Value (£ Billions)
While the UK continues to import a greater value of automotive parts and components than it exports, the trade deficit closed significantly in 2020
Total

CHAPTER 2
16 THE SOCIETY OF MOTOR MANUFACTURERS AND TRADERS
THE LONG WAY TO RECOVERY: ADJUSTING TO THE NEW NORMAL

CHAPTER 2
17THE SOCIETY OF MOTOR MANUFACTURERS AND TRADERS
→ A year and a half since the onset of the Covid-19 pandemic, the UK economy is poised to stage a robust post-recession recovery in 2021. However, the automotive industry is experiencing a slower restart.
→ Increased demand for electrified vehicles is a bright spot, with Battery Electric Vehicles (BEVs) and Plug-in Hybrids (PHEVs) bucking the trend. Consumers are continuing to respond in ever greater numbers to these new technologies, driven by increased product choice, with more than 140 models of electrified cars currently on the market, meaning one in three models available to purchase are now zero-emission capable.
→ While the UK’s economic outlook continues to strengthen, supply challenges, notably of semiconductors continue to throttle the automotive recovery. Hence urgent support to avoid exacerbating the impact is essential.
UK ON COURSE FOR STRONGER POST-PANDEMIC RECOVERYThe UK economy recorded its worst performance for more than 300 years in 2020 as it reeled from the initial shock of the coronavirus crisis before staging a better-than-expected recovery later in the year. Total output shrank by -9.8% last year, compared with 2019. This contraction was worse than the 1921 slump after the First World War and Spanish flu — and almost as bad as that during the Great Frost in 1709 when the UK was an agricultural economy.
During the first lockdown, UK GDP was -25% lower in April 2020 than it was only two months earlier in February. For some context, this is more than three times the -7% decline in GDP recorded during the financial crisis in 2008-09.
Economic activity picked up over the spring and summer of 2020, reflecting the opening of the economy and the release of pent-up consumer demand from the first lockdown. This was followed by a further short-lived lockdown in November, leading to another monthly fall in GDP of -2.2%. As a new variant of the virus drove up Covid-19 infection rates, stricter lockdowns were again introduced across the UK by early January 2021.
However, the economy adapted well to the lockdowns, with a much smaller decline in economic activity recorded in early 2021, when GDP fell by -2.5% in January, than in the lockdown of spring 2020. Nevertheless, the economy did witness a downturn, with GDP falling by -1.5% during the first quarter of 2021 compared with the previous quarter.
The labour market throughout the Covid-19 crisis has remained resilient given the scale of the recession. This may be at least partly due to the many Government support schemes, such as the Coronavirus Job Retention Scheme (CJRS) or the ‘furlough scheme’, introduced to support businesses and workers during the pandemic. The unemployment rate rose from 4.0% before the pandemic to 4.8% by the second half of 2021. The number of furloughed jobs declined from a peak of 8.9 million on 8 May 2020 to 1.9 million by the end of June 2021.
Economic activity picked up over the spring and summer of 2020, reflecting the opening of the economy and the release of pent-up consumer demand

CHAPTER 2
18 THE SOCIETY OF MOTOR MANUFACTURERS AND TRADERS
As the economy has gradually reopened in recent months, economic indicators suggest a solid recovery is underway. Data for the second quarter of 2021 showed the economy was 5.5% larger than it was between January and March when it was constrained by curbs on activity and GDP contracted by -1.6%. Between April and June, the UK grew at more than double the rate of the 2% in the eurozone and faster than the US, which grew at a quarterly rate of just over 1.5%. However, the economy remains -4.4% smaller than it was before the pandemic.
Looking ahead, the forecasters have markedly upgraded their growth predictions for 2021, with the Bank of England and CBI respectively revised their forecasts to 7.3% and 8.2% – the fastest rates since the Second World War, and up from around 5% and 6% made at the beginning of the year. The UK’s forecast growth rate would represent the joint-strongest rate in the G7 alongside the US, which is also expected to expand by 7%.
Most forecasters anticipate that the lifting of restrictions will coincide with an upswing in consumer spending. The rapid vaccination of the UK population accelerated the easing of restrictions. GDP growth in 2021 is expected to be further supported by fiscal measures that were announced in the March Budget with total Government support amounting to more than £400 billion.
Chart 20 Comparison of GDP growth projections – 2021
IMF
PWC
OECD
BoE
CBI
EU Commission
HMT
7.0%
7.2%
7.2%
7.3%
7.3%
5.0%
7.1%
Source: BoE, CBI, EU Commission, HMT, IMF, PWC & OECD
(%)
Accounting for nearly two-thirds of GDP, consumer spending – totalling £1.4 trillion in 2019 – is always a crucial factor determining the economy’s performance. Official statistics show consumer spending fell by -10.6% in 2020 due to lockdowns. Nevertheless, the Bank of England estimates that households have accumulated £150 billion of additional savings throughout the lockdown period. High levels of household savings combined with a growth in consumer confidence could create a potential spending boom in the months ahead. This, in turn, could underpin a strong economic recovery.
All in all, it looks like the economy is coming out of the other side of this pandemic, and a strong recovery is expected further ahead. This is a perfect platform for addressing both the near and longer-term challenges facing the economy, ultimately ensuring that this is a recovery that works for all. Beyond the state of the economy, Government’s focus is increasingly shifting towards driving a green recovery, underpinned by ambitious decarbonisation plans. The strengthening of environmental ambitions provides both a huge opportunity, but also potentially higher costs for doing business in the UK.
The Covid-19 pandemic remains the biggest near-term risk to the UK’s economic outlook – particularly the potential for the emergence of a strain of the virus that vaccines prove to be less effective against, necessitating the need for further containment measures. Similarly, downside risks from the shortages of key materials, such as semiconductors, and labour, along with the increasing cost pressures, are evident across many sectors of the economy. The upturn in demand is causing some friction for businesses in the form of growing recruitment difficulties and pipeline cost pressures. The latter is exacerbated further by ongoing disruption to global supply chains, as Covid-19 continues to hit shipping activity – further stoking shortages of raw materials and components. While it is likely that pricing pressures will be largely temporary, there is no doubt that higher costs will be taking the edge off of bottom lines for some companies. The Bank of England expects inflation to rise to 4% by the end of 2021, double the central bank’s 2% target.
The economic turbulence caused by Covid-19 has compounded the uncertainty faced by the automotive sector

CHAPTER 2
19THE SOCIETY OF MOTOR MANUFACTURERS AND TRADERS
AUTOMOTIVE INDUSTRY FACES UNEVEN ECONOMIC RECOVERYThe economic turbulence caused by Covid-19 has compounded the uncertainty faced by the automotive sector. Against a backdrop of Covid-19 disruptions, an acceleration of the end of sale date for petrol and diesel cars to 2030 and Brexit uncertainty, the new car market suffered a total turnover loss of more than £20 billion, and production losses topped more than £10 billion in 2020. The economy and automotive have benefitted from the Covid-19 support packages Government put in place, but unlike in other EU markets, or during the last financial crisis, there were no specific automotive support schemes.
Unsurprisingly, registrations in 2020 saw a steep decline, with 1.63 million cars registered, marking the lowest level of demand since 1992. There was, however, some good news as zero emission-capable cars accounted for one in 10 registrations, up from around one in 30 in 2019 and, with many new models on the rise, market growth is set to continue, helping meet industry’s shared environmental ambitions. Similarly, UK new light commercial vehicle (LCV) registrations ended 2020 down -20.0% to 292,657 units compared with 2019. Despite the sector stepping up to meet the demand brought about by the rise of online shopping and corresponding deliveries, the effect of the pandemic and uncertainty over the future trading relationship with the EU affected demand toward the end of the year.
Manufacturing operations were severely disrupted throughout 2020, with lockdowns and social distancing measures restricting factory output, the possibility of a no deal outcome to EU-UK FTA negotiations looming over businesses until Christmas Eve, and depressed market demand in key export destinations.
UK car production fell by -29.3% or some 380,000 units in 2020 to its lowest level since 1984, at 920,928 units. Despite the turbulence caused by the pandemic and Brexit uncertainty, the UK strengthened its focus on producing battery electric (BEV), plug-hybrid (PHEV) and hybrid vehicles (HEV). The combined production of these vehicles rose to an 18.8% share of all cars produced in Britain, up from 14.8% in 2019, with BEVs increasing to a 4.5% share (from 3.4%). Overall, the UK turned out 172,857 alternatively fuelled vehicles, with 79.6% of these exported – in line with overall export shares of 81.3%.
The strong economic recovery is not felt equally by everyone. GDP data for Q2 2021 showed a fall in the output of the manufacture of transport equipment, which was particularly impacted by microchip shortages. Motor vehicle production fell by -16.7% during the quarter, its second consecutive quarterly fall, as a global semiconductor shortage affecting the production of new cars disrupted supply chains. Output in the motor vehicle manufacturing sub-industry is now -24.6% below its pre-pandemic level.
While new car registrations and production levels have increased in 2021 to date, these were artificially lifted from a weak 2020 base. New car registrations in 2021 to September were up 5.9% on 2020, but down -31.6% on the five-year average (2015-2019). However, new car registrations in Q3 were down sharply (-31.1%) as a result of supply constraints – largely from the ongoing semiconductor shortage. LCV registrations were up more strongly on 2020, by 28% but also fell in September, and so were -6.8% below the five-year average. UK vehicle production has shown similar performance, over the January-August period being up 14% on 2020, but down -41.7% on the five-year average and falling in July and August on 2020 levels too. The ‘pingdemic’ – staff alerted by the NHS to self-isolate, has also reportedly impacted UK businesses. and a truck driver shortage has raised further issues alongside the ongoing material shortages.
Looking ahead, the UK’s economic outlook continues to strengthen, with most consumer indicators suggesting a greater appetite for spending, including on so-called ‘big ticket’ items. However, supply challenges will continue to throttle growth in the months ahead. As a result, the latest SMMT outlook, published in July, was been revised downward and forecasts registrations to reach around 1.82 million units in 2021. This is still some 11.7% up on 2020, but down from the 1.86 million forecast in April, and down around -21.8% on the average new car market recorded over the past decade.
Chart 21 New car registrations, rolling year (with July SMMT outlook)
Source: SMMT
2.75
Jan 22
2.50
2.25
2.00
1.75
1.50
1.25
Jan 20Jan 19Jan 18Jan 17Jan 16Jan 15Jan 14Jan 13Jan 12Jan 11Jan 10Jan 09Jan 08 Jan 21
12 MMAT – Millions

CHAPTER 2
20 THE SOCIETY OF MOTOR MANUFACTURERS AND TRADERS
Given the recent slowdown in the market, notably in September, unless the chip issues can be resolved quickly, the outlook is likely to be trimmed further in SMMT’s next review of the market outlook in October.
The bright spot, however, remains the increasing demand for electrified vehicles as consumers respond in ever greater numbers to these new technologies, driven by increased product choice, fiscal and financial incentives and an enjoyable driving experience. Given the continued strengthening of the electric vehicle market, SMMT now estimates that BEVs will account for 9.5% of registrations by year end, while PHEVs are forecast to comprise 6.5% of the market, collectively totalling around 290,000 units by the end of the year.
The ongoing shortage of supply of semiconductors is having a profound impact on the global automotive sector.
The disruption began in 2020, with Covid-19 causing disruption in semiconductors production, albeit briefly. Global lockdowns then caused a surge in the tech sector/consumer electronics demand, which contrasted with initially depressed new vehicle markets and hence weaker automotive supply-chain demand. The impact was initially less visible as there were also parts delays caused by new customs arrangements and border Covid-19 testing requirements.
By late 2020 many global automotive markets had recovered more quickly than semiconductor manufacturers expected, which has led to a shortage as production had already been allocated to other sectors. A global shortage of semiconductors became apparent during the first six months of 2021, with some experts now forecasting it to last well into 2022.
SEMICONDUCTOR SHORTAGE IMPACTS
Production stoppages, with mitigation measures such as ‘time banking’ or other flexibilities exhausted, having already been stretched by 2020 Covid-19 disruption and Brexit issues
Production delays from weeks to months (or even longer in some cases),
in particular for those who convert finished vehicles (e.g. for wheelchair accessibility)
Contract/order changes, with direct costs,
Substantial resource costs in sourcing alternative supplies, managing impacts and business disruption, in addition to an increased (and therefore decreasingly competitive) cost-base due to recent low-sales volumes, increased input, transport and trading costs.
New vehicle supply challenges causing delays to customer deliveries,
increase in second-hand market values, with fleet renewal benefits impacted.
financial and business viability impacts
The situation for automakers has now become acute with major volume car manufacturers, specialist manufacturers, commercial vehicle, supply-chain businesses, aftermarket, vehicle converters and more, all being affected. This has led to:
The global semiconductor chip shortage will cost automakers $210 billion (£155 billion) in lost revenue this year, almost double the May estimate of $110 billion (£81 billion), according to consulting firm AlixPartners, as it forecast in September 2021 that the crisis would hit the production of some 7.7 million vehicles. Similarly, Automakers issued warnings in earnings reports in summer 2021 that the chip shortage would get worse before it gets better.
The SMMT’s independently commissioned UK car and van production forecast, as of July 2021, sees ongoing shortages and Covid-19 impacts putting at risk almost 100,000 units this year (base forecast of 1.134m and impacted forecast of 1.041m). In addition, permanent structural and other changes in supply chains are already happening as companies seek to address the challenge.
Major global automotive nations are developing generous response packages, support which potentially puts UK operations at a competitive disadvantage. The chipmakers are also ramping up production to tide over the crisis. However, estimates suggest that chip shortage will continue to haunt automakers for at least another year.

CHAPTER 2
21THE SOCIETY OF MOTOR MANUFACTURERS AND TRADERS
The situation remains extremely unpredictable, and the disruption is likely to continue well into 2022. Recent outbreaks of the Covid-19 Delta variant in some of the key producing nations in East Asia are adding renewed and potentially extended uncertainty. The timing of this Covid-related issue is significant, with the furlough scheme (CJRS) terms having already changed and ending well before the situation is expected to be resolved. Hence urgent support to avoid exacerbating the impact is essential.
Long-term solutions (such as enhanced UK semiconductor manufacturing capability) should be expedited but, in the short-term, the immediate and sector-specific support/relief could prove crucial in sustaining the fragile recovery of the automotive sector.
Support measures could include:
→ Government utilising its diplomatic and global influence to strengthen UK supplies.
→ High-level and in-depth government engagement on the broader semiconductor supply chain and technology development landscape is critical and commensurate with actions taken in other key automotive nations.
→ Extension of the Coronavirus Job Retention Scheme or other employment support for the duration the impacts are felt.
The ongoing shortage of supply of semiconductors is having a profound impact on the global automotive sector
SEMICONDUCTOR CRISIS RESPONSE – SELECTED MEASURES
US In April, President Biden met automotive manufacturers and the Senate has unveiled $52 billion to fund the CHIPS for America Act, a bill aimed at boosting the country’s semiconductor production (R&D and production focused). Furthermore, the US is looking into tax incentives for US manufacturers to make critical parts in America to avoid shortages in the future, as well as launching a ‘100 day of
Supply Chain Review’ to seek solutions.
EU The EU has announced a semiconductor alliance and is ready to commit “significant” funds to expand Europe’s semiconductor manufacturing industry, to achieve a goal of doubling Europe’s share of global semiconductor production to 20% by 2030.
INDIA The Indian Government is reportedly working on a plan to offer around $1 billion in cash to every company that sets up a chip manufacturing unit in India.
SOUTH KOREA JAPAN OTHER COUNTRIES – INCLUDING CHINASouth Korea will spend over $450 billion
on domestic semiconductor production over the next decade. The South Korean Government will provide tax breaks, lower interest rates, cut regulation, and help prioritise and fund necessary infrastructure. Also, the Government will help fund the training of 36,000 semiconductor experts, spend $1.3 billion
on chip R&D and has promised more chip-friendly legislation.
The Japanese Government is expected to publish a draft strategy (as early as this month) which will expand the existing ¥200 billion (about £1.3 billion) fund to support the local chipmaking industry, and to boost advanced semiconductor and battery production.
Announced production investment and tax exemptions/support measures. Under the so-called “Made in China 2025” industrial plan, the country aims to produce 40% of the semiconductors it uses by 2020 and 70% by 2025.

22 THE SOCIETY OF MOTOR MANUFACTURERS AND TRADERS
→ The end of the transition period has forced manufacturers to dedicate more time and resources to moving goods between Great Britain, the EU, Northern Ireland and the rest of the world.
→ In 2021, bilateral trade exchanges between the EU and the UK have lost ground compared with imports and exports of automotive products with the rest of the world. However, UK businesses and consumers still depend on imports from the EU, while the proportion of car exports to the EU might increase in the future due to a potential reduction in volume of vehicles shipped to the US.
→ The conclusion of the Trade and Cooperation Agreement EU sets a new path forward for the Anglo-European automotive sector. However, adjusting to the new trading relationship is costly and the future sustainability of the agreement will depend on the development of a robust regional supply chain for electric powertrains and the development of an enhanced cooperative framework.
CHAPTER 3
LIFE BEYOND BREXIT: TOWARDS A NEW EUROPEAN PARTNERSHIP

CHAPTER 3
23THE SOCIETY OF MOTOR MANUFACTURERS AND TRADERS
THE NEW UK-EU TRADE RELATIONSHIP AND ITS COSTSOver the course of the last two years, the global automotive industry has focused all its efforts to grapple with the impacts of the ongoing pandemic. However, over the same period, the UK automotive sector has also faced the unique challenge of adjusting to the new trading relationship with its biggest trading partner.
Although the UK’s withdrawal from the EU was formally concluded in February 2020, the impacts of the UK’s exit from the EU were delayed until the end of a transition period on 1 January 2021.
The announcement on Christmas Eve 2020 of a new Trade and Cooperation Agreement (TCA) with the EU was a huge relief for the UK automotive industry. The deal offers an opportunity to avoid tariffs after 40 years of deep economic integration, foundations on which the industry can build.
However, the opportunity to avoid tariffs does not mean zero cost. With the parties failing to agree on an adjustment period for customs requirements, UK and EU automotive
Chart 22 Relative to your 2020 operations, are you spending more or less time and resource managing the following? (Manufacturers only, Q1 member survey)
70
60
50
40
30
20
10
0
Trade and goods movementbetween GB and Rest of the World
Trade and goods movementbetween GB and Northern Ireland
Trade and goods movementbetween GB and EU
Significantly more A little more The same A little less Significantly less Unsure N/A Source: SMMT
%
businesses had only few days to prepare between the announcement of the TCA and its provisional entry into force on 1 January. According to an SMMT survey, the abrupt end of the transition period has negatively impacted manufacturers across all trade routes.
In the first quarter of 2021, 91% of UK automotive manufacturers were spending more time and resources on managing trade between the EU and Great Britain, with 62% of them spending significantly more time and resources on the movement of products across the Channel. Notably, 25% of manufactures indicated significant impacts in moving goods between Great Britain and Northern Ireland, while 36% of manufacturers had to dedicate at least some additional resources to support trade between Great Britain and the rest of the world. The need to dedicate additional resources to trade with the rest of the world might result from the entry into force of continuity deals with more than 65 countries at the end of the transition period. Although these deals are meant to provide continuity of effects, they are effectively new agreements bilateralising preferential trade relations between the UK and pre-existing trading partners.

24 THE SOCIETY OF MOTOR MANUFACTURERS AND TRADERS
CHAPTER 3
THE END OF THE TRANSITION PERIOD: IMPACTS ON BILATERAL TRADE FLOWSThe overlap between the end of the transition period, lockdowns in the UK and key export markets, shortages of key production inputs and other major trade restrictions stemming from the pandemic means it is not possible to isolate the impact of the UK’s withdrawal from the EU on bilateral automotive trade in 2021.
A key question is whether new trade barriers imposed after the end of the transition period have delayed the recovery in bilateral trade of automotive goods.
The comparison of average values in exchanges of cars and typical parts between the EU, the UK and the rest of the world before and after the end of the transition period could help identify certain trends in bilateral trade of automotive goods from the moment the TCA took effect. Given that the UK offers unilateral flexibilities allowing delayed import declarations on goods shipped from EU ports while the EU applies full customs formalities on all movements to and from the UK, the table below is based on Eurostat data. Since the end of the transition period, bilateral trade of automotive commodities between the EU and the UK seems to be underperforming compared with trade between the EU and the rest of the world.
Car exports from the EU (€ Million)
PartnerQ4 2020 Avg.
Jan-May 2021 Avg.
Difference % Difference
UK 2,865 1,934 -931 -32.5%
Rest-of the world 9,935 9,153 -781 -7.9%
Although the end of the transition period is likely to have had an impact on bilateral exchanges, these results should be considered as indicative trends rather than conclusive evidence of a deep structural adjustment of UK automotive trade patterns. A broad variety of factors could have an impact on trade flows over this period. For a start, the comparison of different quarters can lead to very misleading conclusions, with consumers usually more willing to spend at the end of the year rather than in the first quarter. Also, trading conditions differed enormously in the UK and the rest of the world between the end of 2020 and the beginning of 2021, with the UK implementing stringent lockdown measures to front the surge in cases of the Beta variant, while some major markets were adopting far less restrictive containment actions. Also, it is possible that several automotive businesses decided to increase stocks in view of the end of the transition period, hence inflating the differential with the first quarter of 2021.
However, data from HMRC shows a similar picture, with exports and imports between the UK and non-EU countries consistently performing better than bilateral trade with the EU.
In terms of value of finished vehicles, imports from the EU have lost ground compared with imports from the rest of the world after the end of the transition period. Taking January 2019 as the reference month for both EU and non-EU automotive trade flows, the value of finished vehicles imported from the EU was relatively higher than the value of vehicles imported from the rest of the world in December 2020 and both inflows were on par with January 2019 levels.
Source: Eurostat
Typical parts exports from the EU (€ Million)
PartnerQ4 2020 Avg.
Jan-May 2021 Avg.
Difference % Difference
UK 763 725 -38 -5.0%
Rest-of the world 3,572 3,610 105 2.9%
Car imports into the EU (€ Million)
PartnerQ4 2020 Avg.
Jan-May 2021 Avg.
Difference % Difference
UK 987 715 -273 -27.6%
Rest-of the world 4,192 3,691 -501 -12.0%
Typical parts imports into the EU (€ Million)
PartnerQ4 2020 Avg.
Jan-May 2021 Avg.
Difference % Difference
UK 301 228 -73 -24.2%
Rest-of the world 1,671 1,782 111 6.6%

CHAPTER 3
25THE SOCIETY OF MOTOR MANUFACTURERS AND TRADERS
Chart 23 Finished vehicles imports (Jan-19=100)
Source: HMRCEU imports Non-EU imports
160
Jan 21 Jul 21
120
80
40
0
Jul 20Jan 20Jul 19Jan 19
Chart 24 UK Finished vehicle exports (Jan19=100)
Source: HMRC
160
Jan 21 Jul 21
120
80
40
0
Jul 20Jan 20Jul 19Jan 19
However, from the end of the transition period, imports of finished vehicles from the EU dropped by -27% in the first half of 2021, while imports from the rest of the world increased by 39.7% in six months, after reaching an increase of 46.5% in May compared with the end of 2020, The value of imports of finished vehicles from non-EU countries in June were 34.1% higher than the value of imports in January 2019.
However, in the first half of 2021, the value of trade of EU imports in absolute terms (£12.1 billion) far exceeds the value of imports of finished vehicles from the rest of the world (£3.4 billion).
Notably, exports of UK finished vehicles have not experienced a significant change, with the ratio of EU and non-EU exports remaining fairly consistent throughout the first six months of the year. With the foreseeable reduction of exports from volume manufacturers to the US, the proportion of exports to the EU is likely to further increase in the next future.
In volume terms, there is little evidence of significant trade diversion in exports of UK cars from the EU to other destinations. According to SMMT data, the share of UK car exports to the EU fell in the first half of 2021 to 51.7%, slightly below the 2018-2020 average of 53.6%. The decline is bigger when considering the first half of 2020, when shipments to the EU represented 56.5% of UK car exports. Although this might be indicative of some businesses redirecting trade to other destinations as a consequence of Brexit, the impact of the first great lockdown in the European region on 2020 data is too significant to ascribe the decline to the end of the transition period alone.
EU exports Non-EU exports
In the first half of 2021, the value of trade of EU imports in absolute terms far exceeds the value of imports of finished vehicles from the rest of the world
26 THE SOCIETY OF MOTOR MANUFACTURERS AND TRADERS
CHAPTER 3
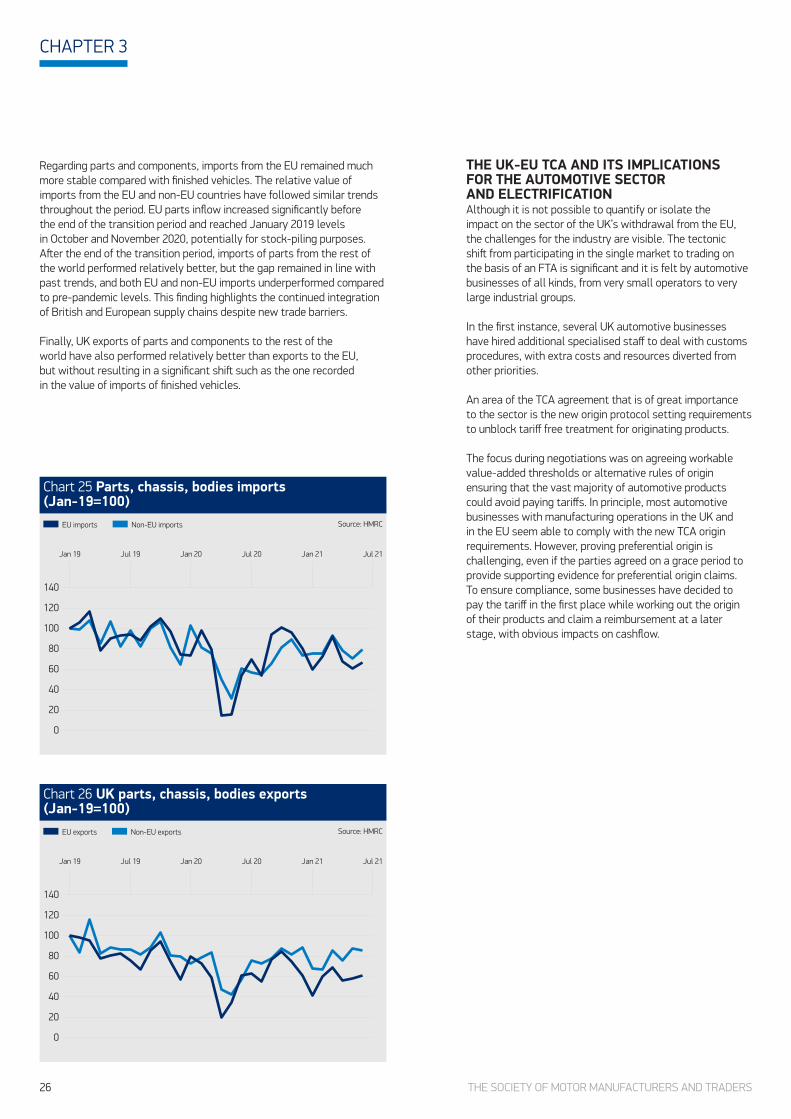
Regarding parts and components, imports from the EU remained much more stable compared with finished vehicles. The relative value of imports from the EU and non-EU countries have followed similar trends throughout the period. EU parts inflow increased significantly before the end of the transition period and reached January 2019 levels in October and November 2020, potentially for stock-piling purposes. After the end of the transition period, imports of parts from the rest of the world performed relatively better, but the gap remained in line with past trends, and both EU and non-EU imports underperformed compared to pre-pandemic levels. This finding highlights the continued integration of British and European supply chains despite new trade barriers. Finally, UK exports of parts and components to the rest of the world have also performed relatively better than exports to the EU, but without resulting in a significant shift such as the one recorded in the value of imports of finished vehicles.
Chart 26 UK parts, chassis, bodies exports (Jan-19=100)
Source: HMRC
Jul 20Jan 20Jul 19Jan 19 Jan 21 Jul 21
140
120
80
40
0
20
60
100
EU exports Non-EU exports
THE UK-EU TCA AND ITS IMPLICATIONS FOR THE AUTOMOTIVE SECTOR AND ELECTRIFICATIONAlthough it is not possible to quantify or isolate the impact on the sector of the UK’s withdrawal from the EU, the challenges for the industry are visible. The tectonic shift from participating in the single market to trading on the basis of an FTA is significant and it is felt by automotive businesses of all kinds, from very small operators to very large industrial groups.
In the first instance, several UK automotive businesses have hired additional specialised staff to deal with customs procedures, with extra costs and resources diverted from other priorities.
An area of the TCA agreement that is of great importance to the sector is the new origin protocol setting requirements to unblock tariff free treatment for originating products.
The focus during negotiations was on agreeing workable value-added thresholds or alternative rules of origin ensuring that the vast majority of automotive products could avoid paying tariffs. In principle, most automotive businesses with manufacturing operations in the UK and in the EU seem able to comply with the new TCA origin requirements. However, proving preferential origin is challenging, even if the parties agreed on a grace period to provide supporting evidence for preferential origin claims. To ensure compliance, some businesses have decided to pay the tariff in the first place while working out the origin of their products and claim a reimbursement at a later stage, with obvious impacts on cashflow.
Chart 25 Parts, chassis, bodies imports (Jan-19=100)
Source: HMRC
140
120
80
40
0
Jul 20Jan 20Jul 19Jan 19
20
60
100
Jan 21 Jul 21
EU imports Non-EU imports

CHAPTER 3
27THE SOCIETY OF MOTOR MANUFACTURERS AND TRADERS
Businesses with significant manufacturing operations in the UK sourcing materials from Euro-Mediterranean countries have also struggled to comply. Preferential origin of automotive products manufactured in the EU/UK region is not maintained when the goods are further processed in third countries. For example, the process of upfitting vehicles in the UK to become wheelchair accessible might not be enough to avoid tariffs on exports to the EU of these essential products if the vehicles upfitted in the UK are sourced from Turkey – even if they incorporate British-made engines.
All businesses without manufacturing operations in the EU or in the UK have suddenly faced major tariff risks, with origin requirements applicable exclusively to goods that are further processed in the territory of the parties. In particular, UK-based regional distribution centres of auto parts servicing the Republic of Ireland and other EU destinations have often faced the risk of paying tariffs on all movements into and out of the UK.
Bilateral exchanges of used automotive goods have also suffered a significant setback. Proving preferential origin of used cars and car parts is virtually impossible, given that supporting documentation for preferential origin claims must provide a clear chain of evidence from the manufacturer to the exporter/importer which demonstrates originating status. This is not an option for importers and exporters of used goods. Accordingly, exports of used vehicles to the Republic of Ireland and other EU destinations, temporary admission and recalls simply cannot comply with origin requirements and face significant tariff risks, unless they can benefit from customs facilitations such as returned goods relief.
Similarly, UK and EU remanufacturers have often faced tariffs on imports of so-called “cores”. Cores are used or defective auto parts that are used as input materials by remanufacturers to return them to at least their original performance. With remanufacturers operating on very thin margins to ensure remanufacturing is a preferable option compared with producing new parts, the imposition of tariffs on cores could become a very burdensome hurdle in building a strong circular economy.
Despite these challenges, the TCA has successfully averted a no-deal scenario which would have implied major – or even unsurmountable – challenges for the sector and set a path forward to build a new Anglo-European automotive partnership. In particular, the agreement forces the EU and the UK to develop an integrated supply chain for e-drives if the respective automotive sectors are to trade electrified vehicles tariff-free in the future.
Although origin rules for electrified vehicles and batteries are very accommodating until the end of 2023, everything will change from 2024 onwards, when much tougher requirements will be phased in. The end rule demands originating batteries to be incorporated in BEVs and PHEVs by 2027 to trade these vehicles tariff-free. Localising a significant proportion of manufacturing processing for cells and battery packs will be essential to maintain tariff-free market access, including through production of active cathode materials and coating of cathodes. A competitive Anglo-European supply chain for electrified vehicles and associated technologies will be a key determinant for the future relationship of the UK and EU automotive industries.
To allow a new solid partnership to thrive between the two biggest automotive trading partners in the European region, the TCA institutional framework must become operational as soon as possible, including the Working Group on Motor Vehicles. This group can represent a fundamental platform to enhance regulatory dialogue and monitor the implementation of the TCA’s Annex on Motor Vehicles. To date, the group has yet to be convened for the first time, fuelling concerns that lack of communication between the parties might ultimately result in diverging or incompatible regulations, to the detriment of UK businesses and consumers.
Although it is not possible to quantify or isolate the impact on the sector of the UK’s withdrawal from the EU, the challenges for the industry are visible

CHAPTER 4
28 THE SOCIETY OF MOTOR MANUFACTURERS AND TRADERS
→ Global market and production were better than feared in 2020, – but challenges remain, notably around competitiveness, supply chain and decarbonisation of product and production processes.
→ Asia is key to global growth, but other markers – such as non-EU Europe, and the Middle East, also offer strong growth potential.
→ Positive announcements around investment in LCVs in UK should be supported by global LCV market growth of 17% by 2025 and 12% in the EU from a 2019 base.
UK CAR PRODUCTION OUTLOOKWith the UK and EU agreeing the TCA, a major element of uncertainty to the trade outlook has been removed, creating a more positive setting to encourage inward investment in the UK – and we have already seen some high-profile announcements follow – and so secure future production volumes. However, as previously noted in this report, other issues, largely around the supply side, are making the outlook challenging. The ongoing impacts of Covid-19 are still an issue, and have contributed to supply side shortages, notably of semiconductors (chips) as well as other raw materials, and staff shortages have also impacted. Covid-19 has also had short term impacts on demand, but moreover, the longer-term impacts, with changes in work and travel patterns, are still to be resolved. This has meant forecasting vehicle demand has become more difficult.
The shift to zero emission vehicles will have a major impact on the market, whilst the question of where those vehicles are to be produced creates an added level of uncertainty, with the opportunity for a radical shift.
CHASING GROWTH MARKETS: GLOBAL AUTOMOTIVE OUTLOOK

CHAPTER 4
29THE SOCIETY OF MOTOR MANUFACTURERS AND TRADERS
Chart 27 UK Light vehicle production outlook (AutoAnalyis, March 2021)
Source: AutoAnalysis
1.5
2025
1.4
1.3
1.2
1.1
1.0
0.9
2026202420232022202120202019
Base forecast Chip shortages & 3rd COVID wave
SMMT has developed a central view on the short-term UK marketplace with the quarterly Market Outlook and also for the first time a longer-term view to 2035 by powertrain type – including different scenarios, and noting the range of influencers and enablers on both the overall size of the market and technology shift over this period.
SMMT also publishes for members the Production Outlook, produced by AutoAnalysis. The SMMT March outlook, produced by AutoAnalysis, gives a view to 2026 which sees volumes recover from the low of 2020, but with the loss of Honda output, only recovering to around 1.25-1.3 million units, remaining still below 2019 levels. The chip issue could see up to 100,000 units knocked off planned 2021 output. A more optimistic scenario, assuming a ‘new model boost’ in the second half of the outlook horizon, sees some 200,000 units added to the base outlook if realised. With recently announced new investment intentions by Nissan, Stellantis and Lotus in the UK, the longer-term outlook is becoming a little more positive, but all new players would be necessary to really boost output in the long-term. The move to zero-emission vehicles may enable this.
Millions
Model boost impact

CHAPTER 4
30 THE SOCIETY OF MOTOR MANUFACTURERS AND TRADERS
GLOBAL CAR MARKET OUTLOOK TO 2025With more than 80% of vehicle production in the UK destined for exports, the recovery and long-term outlook for the UK is heavily dependent on the global market outlook. Given automotive’s prominence in UK exports and the broader economy, the strength of global vehicle demand and the UK’s ability to access it are therefore very important.
The global outlook data presented below was taken from LMC (www.lmc.com) in July 2021. At the start of 2020, the global new car market was expected to show a very modest -0.4% dip on 2019 levels to 75.8 million units, as the subdued economic setting was expected to soften demand further, before population and economic growth, helped lift output to more than 86 million units by 2024. The impact of Covid-19 was expected to knock some 16 million units off the 2020 outlook and an average of 6.5 million per annum over the following four years, based on the LMC outlook in May 2020 (as presented in our Trade Report last year).
The actual outturn was just over 5 million units better than this view in 2020, but that was still a loss of over 11 million units, or -14.8% on 2019. As shown below, despite increasing concerns about supply shortages, the outlook as of July 2021 has been revised upwards – by a net 14.6 million units or 3.8% between 2021 and 2025, but is still sub the pre-Covid outlook, in effect a year behind (86 million is reached in 2025, not 2024).
It is still a ‘V’ shaped recovery for the global market, with significant global growth potential. 2018 volumes are expected to be surpassed by 2023 and sales will surpass 86 million units in 2025 – more than 10 million up on 2019 levels.
The breakdown of growth across the globe shows that Asia is key and is expected to contribute more than 6.3 million units in 2025 compared with 2019 levels, more than 60% of the growth volume over this period. The Middle East and Eastern Europe add more than one million apiece, to collectively account for around 25% of the net growth. The rest of the world adds much smaller volumes (450,000 or below each) – with more mature markets like North America and Europe seemingly close to peak car levels, whilst other markets, such as Africa, being relatively small, despite strong percentage growth.
Chart 29 Global car market outlook
Source: LMC
45
30
15
0
80
60
40
20
0
Oth
er
Afric
a
Mid
dle
East
Sout
hAm
eric
a
Oth
erEu
ropeUK
EU
Nor
thAm
eric
a
Asia
Paci
fic
Chart 30 Global car market growth outlook – volume change
Source: LMC
8
6
4
2
0
-2
-4
Oth
er
Afric
a
Mid
dle
East
Sout
hAm
eric
a
Oth
erEu
ropeUK
EU
Nor
thAm
eric
a
Asia
Paci
fic
Millions
2020 v 2019 2025 v 2019
Chart 28 Global new car sales
Source: LMCJuly ‘21 May ‘20
90
2024
80
70
60
50
20252023202220212020201920182017
Millions
Pre-covid
Millions
2019 2020 2025 Growth 2025 v 2019

CHAPTER 4
31THE SOCIETY OF MOTOR MANUFACTURERS AND TRADERS
Source: LMC
Within Asia, China is the key driver – providing on its own an expected 4.8 million gain in 2025 compared with 2019. This is equal to over three-quarters of all the growth in Asia and almost half (47%) of the world’s gain. India is expected to grow by 1.2 million units between 2019 and 2025 and surpass Japan as Asia’s second largest market by 2026.
Russia and Turkey are expected to grow by over 500,000 and 400,000 units in 2025 compared with 2019. In the Middle East, Iran’s market is expected to more than double and add almost 700,000 units to the global market, with the rest of the Middle East up around 50% compared with 2019 levels by 2025.
Within the EU, Germany is expected to plateau below 2019 levels, and much of the rest of Europe is expected to be broadly flat. Overall EU growth over this period is constrained by the expected contraction in German market of more than 1/4 million sales (264,000 units), although it will remain by far the largest market in the EU at more than 3.3 million units.
Poland looks set to see the strongest growth among EU member states between 2019 and 2025, up 126,000 units in volume terms. This is equivalent to 23% of all sales growth in the EU. Spain and Italy add to volume of growth, although Greece, Ireland and Hungary see some of best rate of growth among the top 10 EU growth markets.
The UK, reflecting a weak and Brexit-hit 2019 market, offers firmer growth (versus 2019) by 2025, up more than 200,000 units to more than 2.5 million units.
Noting this regional growth outlook, the UK automotive industry remains well positioned to benefit from increased global demand. Britain’s premium and specialist manufacturers have the global footprint to feed into the market, and whilst the volume manufacturers have a strong EU focus, this market is set to remain robust, and growth in other parts of Europe is potentially an area to capitalise on.
% ch Vol ch – '000s
EU 3.5% 450
1 Poland 22.7% 126
2 Spain 6.7% 85
3 Italy 4.4% 83
4 Greece 48.2% 55
5 Ireland 43.8% 51
6 Netherlands 11.0% 50
7 Hungary 31.4% 50
8 Romania 25.7% 41
9 Czech Republic 14.7% 37
10 Croatia 35.1% 22
Chart 31 UK Export focus, by producer type
100
80
60
40
20
0
Global sales (2025)All UKSVMPremiumVolume
Source: LMC, SMMT
%
Africa America Asia EU Other Europe Other

CHAPTER 4
32 THE SOCIETY OF MOTOR MANUFACTURERS AND TRADERS
The top 10 individual growth markets, by volume, are presented in the chart below. As noted earlier, China dominates growth, but India is expected to grow by more than one million units between 2019 and 2025, Iran by almost 700,000 units and Russia by more than half a million units.
The below table shows the size of selected international car markets (in thousands) now and to 2025. It also shows what proportion of the UK exports these countries take (e.g. 2.1% of UK car exports go to Australia) and what proportion of the local market UK export volume represents (understanding exports do not equal registrations and there would be lags between exports and actual registrations). Several of these markets have strong growth potential – notably Turkey and India, account for a reasonable proportion of UK exports (e.g. USA and Japan), and all offer scope for growth.
The above markets include ones that have agreed key trade deals with the UK, are in the process of making trade deals with the UK, or could be very important to the UK automotive sector.
Of the countries selected, the USA is the largest as a share of UK export volumes, at 17.7%. The USA is important to premium and small volume manufacturers in particular (accounting for 23.4% and 26.7% of their exports respectively). It should be noted that currently 12.5% of volume producers exports also go there, the majority from Honda, which will cease production this year. Honda accounted for 38% of all UK exports to the USA, with almost 50,000 units exported in 2020 (and more than 65,000 in 2019).
Chart 32 Top 10 growth car markets (volume gain) 2015 v 2019
Source: LMC
India 1.20
Iran 0.69
Russia 0.52
EU 0.45
Turkey 0.42
UK 0.22
Korea 0.15
China 4.80
Brazil 0.14
Mexico 0.14
Millions
The USA, like Canada and Japan, is expected to see a net contraction in market size in 2025 compared with 2019. Growth in Malaysia and New Zealand is also expected to be minimal. Turkey is expected to see the strongest growth, with a market more than doubling by 2025, whilst India expects to see more than 40% growth, equivalent to more than one million new sales. India, however, only represents a very small proportion of UK exports (0.1%). Currently 2.6% of UK exports go to Turkey and the UK-built cars look to be a relatively large player in the market, accounting for more than 3% of local sales, in this list only New Zealand has higher figure, at nearly 4%.
Selected national car markets (‘000s)
2019 2020 2025 2025 v 2019 % UK exports UK X as % mkt
Australia 801 679 934 16.7% 2.1% 2.3%
Canada 1,482 1,147 1,474 -0.5% 1.5% 1.0%
India 2,837 2,349 4,035 42.2% 0.1% 0.0%
Japan 4,296 3,805 4,088 -4.8% 3.5% 0.7%
Malaysia 548 487 556 1.4% 0.1% 0.1%
Mexico 1,092 774 1,234 13.0% 0.4% 0.4%
N Zealand 106 82 111 4.9% 0.4% 3.8%
Turkey 387 610 802 107.3% 2.6% 3.2%
USA 13,457 11,199 13,447 -0.1% 17.7% 1.2%
Source: LMC, SMMT

CHAPTER 4
33THE SOCIETY OF MOTOR MANUFACTURERS AND TRADERS
2025 GLOBAL CAR PRODUCTION OUTLOOKGlobal car production fell by more than 12 million units, or -16.5% in 2020 as Covid-19 resulted in plants shutting and lines running more slowly, as well as demand being heavily curbed. The outturn was about 2 million units, or 4% better than expected at the time of writing the last report. Whilst the outlook for 2025 has also been raised up, it is by a more modest 1.5% or 1.26 million units to 85.4 million (from 84.2 million). The growth trajectory is being constrained by the ongoing impacts of Covid-19, which includes well-documented supply constraints. However, the outlook for strong growth remains – up 10.8 million units on the 2019 outturn by 2025, with a further two million unit growth pencilled in for 2026.
Asia remains key to overall growth, expected to add almost seven million units (some two-thirds of growth) between 2019 and 2025. The EU is expected to grow by almost 10% over this period and add some 1.5 million units. The Middle East is expected to add around 0.75 million units to output, as growth of almost 120% takes output towards 1.4 million cars. Africa also sees strong growth, from a low base, whilst LMC forecasts the UK to grow to 1.275 million units in 2025, a level almost unchanged (-2.5%) from 2019.
Global car production fell by more than 12 million units, or -16.5% in 2020
Chart 33 Global car production outlook
Source: LMC
50 120
45
100
40
35
30
25
20
15
10
5
0
80
60
40
20
0
-20
Oth
er
Mid
dle
East
Afric
a
Sout
hAm
eric
a
Oth
erEu
ropeUK
EU
Nor
thAm
eric
a
Asia
Paci
fic
2019 2020
Millions
2025 Growth 2025 v 2019%
(%)

CHAPTER 4
34 THE SOCIETY OF MOTOR MANUFACTURERS AND TRADERS
The growth in global car production, and notably the recovery and growth expected in Europe, should be supportive of UK-based suppliers. The flat outlook for the UK belies the loss of Honda in 2021, and so this too gives some positivity for suppliers within the UK.
During this period, we will see the greater emergence of powertrain electrification, and the supply chain will need to move to reflect this change. The transitional and fluid nature of this move means there is still uncertainty where the battery plants will be located, whether they need to be close to vehicle production plants, and where suppliers to those new battery plants need to locate. But as outlined in the Full Throttle report there are several measures which can be taken to best ensure the UK is at the centre of this transformation and benefits fully from the shift. This in turn would benefit those other sectors reliant on the auto sector, such as metal forming, chemicals, glass and textiles, as well as logistics and many more.
Rank Country Volume change 000’s
% growth
1 China 5,020 23.9%
2 EU 1,516 10.3%
3 India 1,193 34.2%
4 USA 949 12.7%
5 Iran 713 121.4%
6 S Korea 441 12.4%
7 Russia 353 23.2%
8 Morocco 239 76.3%
9 Mexico 224 7.8%
10 Argentina 192 185.7%
Top 10 growth countries for car production, 2025 v 2019
China remains the focal point of global car production growth, expected to increase by more than five million units by 2025, compared with a 2019 base, growing by almost a quarter to 26 million units. Some 27% of small volume manufacturers’ exports go to China, whilst 15.8% of premium manufacturers’ exports are shipped there.
Within the EU, Germany is expected to account for around 70% of the volume growth between 2019 and 2025, with a more than one million unit increase. Italy and Spain are also expected to grow by more than 300,000 units each, whilst output in France and the Netherlands is amongst those expected to slip.
The outlook for India is now much more positive than a year ago, placing it within the top 10 growth countries, in third place. Turkey meanwhile drops out of the list compared with a year ago, with output now expected to be sub-2019 levels by 2025.
Note the importance of Asia to both growth in market size and production volumes. Growth in output is just over half a million units greater than market growth, suggesting a (slightly) greater focus on exports ahead. Whilst the growth in Asia dwarfs changes in the other regions, it is again noticeable that in the EU, production growth is expected to significantly outweigh sales growth, showing a strong export focus. Meanwhile, sales in the Middle East and Other (East) Europe are expected to outstrip production growth in the regions, suggesting market growth will be primarily met by imports.
Source: LMC
The global market for light commercial vehicles (LCVs) fell by -7.4% in 2020, or just over one million units

CHAPTER 4
35THE SOCIETY OF MOTOR MANUFACTURERS AND TRADERS
LCVsThe global market for light commercial vehicles (LCVs) fell by -7.4% in 2020, or just over one million units, to 13.3 million. The EU27 market fell by a more pronounced -17.5% to 1.48 million units in 2020 and accounted for 30% of the global market’s loss despite representing only 11% of global sales. The losses, however, were less than expected in May 2020 (in the last Trade Report), when the global market had been expected to fall by -21% and the EU market by -28%.
By 2025 the global LCV market is expected to have grown by 17.4% to 16.8 million units, a rise of 2.5 million units on 2019. Over the same period the EU LCV market is forecast to rise by 11.7%, or more than 200,000 units, to two million units.
Given that UK LCV manufacturers almost exclusively export to the EU this suggests modest growth to aim for. However, the UK has recently been successful in attracting new investment. The Stellantis plant at Luton, making the Vivaro, has seen output rise, and Stellantis has recently announced that the Ellesmere Port plant, which currently makes the Astra car, will instead make a new electric van. LEVC also makes its plug-in hybrid taxi and van at Coventry, with plans for strong growth and increased exports. Arrival also plans to produce its electric truck in the UK and there have been media reports of further electric commercial vehicles coming to the UK, which should help shore up the UK CV output and future-proof it for several years to come.
Chart 34 Volume changes, 2025 vs 2019
EU
UK
Other Europe
Middle East
Africa
North America
South America
Asia Pacific
Others
6 7543210-1
Source: LMC
Millions
Production Sales
Chart 35 LCV Market outlook (million units)
2024
17
16
15
14
13
12
11
10
18 2.1
2.0
2025
1.9
1.8
1.7
1.6
1.5
1.4
202320222021202020192018
Source: LMC World EU
World registrations EU registrations

CHAPTER 5
36 THE SOCIETY OF MOTOR MANUFACTURERS AND TRADERS
GLOB
AL B
RITA
IN:
AUTO
MOT
IVE
AS T
HE
ENGI
NE
OF A
NEW
UK
TRAD
E ST
RATE
GY
→ Future deals with India, Australia and New Zealand can support an ambitious Indo-Pacific strategy and unlock global growth opportunities for UK automotive. CPTPP could offer an alternative to current bilateral deals, with some benefits for UK suppliers. However, joining the Pacific trading bloc should not undermine the benefits of continuity deals successfully negotiated before the end of the transition period.
→ The renegotiation of agreements with Mexico and Canada and continued engagement with the US to improve Trans-Atlantic trade relations can rebuild the foundations of automotive trade relations between the UK and the entire North American region, with significant opportunities for UK businesses.
→ Trade policy can serve far-reaching environmental and competitiveness objectives. Ensuring that electrified vehicles, batteries, related technologies and raw materials can be traded freely thanks to future deals should be the top priority in all upcoming negotiations, while other trade policy instruments such as Carbon-border-tax adjustments should not result in undue restrictions to trade.
→ Non-tariff barriers and taxation can offset tariff benefits offered by FTAs and disproportionately affect exports of high-value, iconic UK vehicles to key markets worldwide.
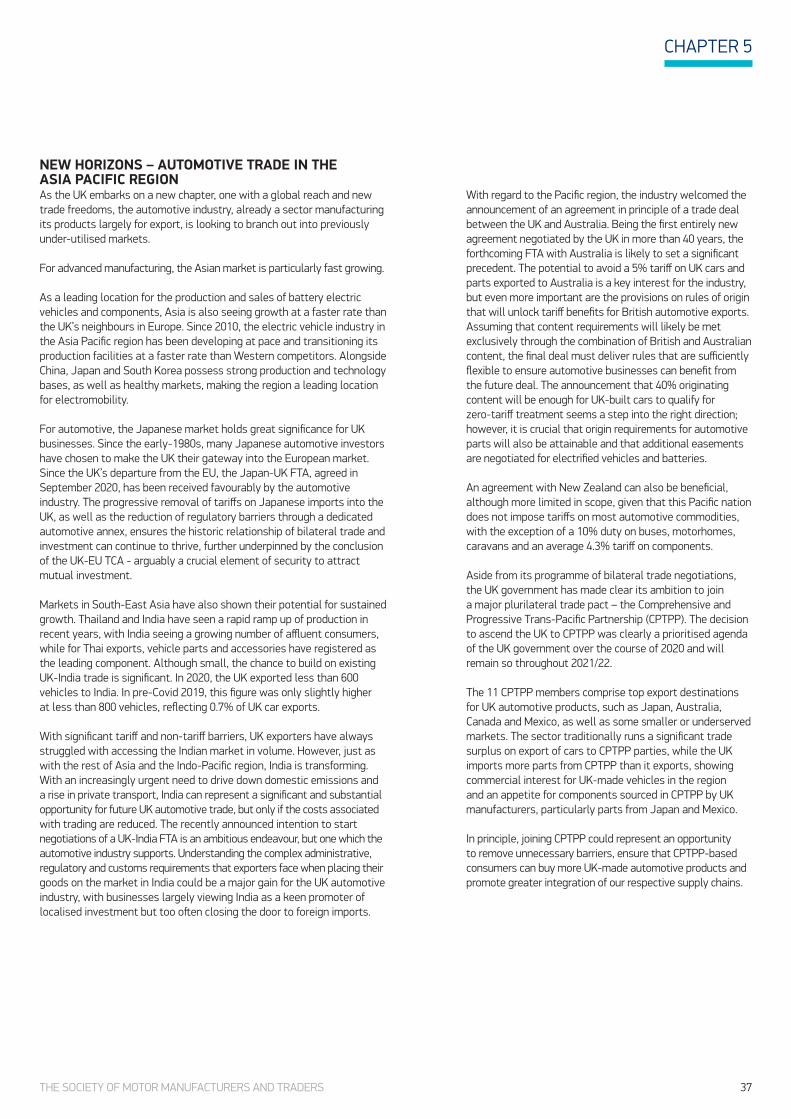
CHAPTER 5
37THE SOCIETY OF MOTOR MANUFACTURERS AND TRADERS
NEW HORIZONS – AUTOMOTIVE TRADE IN THE ASIA PACIFIC REGIONAs the UK embarks on a new chapter, one with a global reach and new trade freedoms, the automotive industry, already a sector manufacturing its products largely for export, is looking to branch out into previously under-utilised markets.
For advanced manufacturing, the Asian market is particularly fast growing.
As a leading location for the production and sales of battery electric vehicles and components, Asia is also seeing growth at a faster rate than the UK’s neighbours in Europe. Since 2010, the electric vehicle industry in the Asia Pacific region has been developing at pace and transitioning its production facilities at a faster rate than Western competitors. Alongside China, Japan and South Korea possess strong production and technology bases, as well as healthy markets, making the region a leading location for electromobility.
For automotive, the Japanese market holds great significance for UK businesses. Since the early-1980s, many Japanese automotive investors have chosen to make the UK their gateway into the European market. Since the UK’s departure from the EU, the Japan-UK FTA, agreed in September 2020, has been received favourably by the automotive industry. The progressive removal of tariffs on Japanese imports into the UK, as well as the reduction of regulatory barriers through a dedicated automotive annex, ensures the historic relationship of bilateral trade and investment can continue to thrive, further underpinned by the conclusion of the UK-EU TCA - arguably a crucial element of security to attract mutual investment.
Markets in South-East Asia have also shown their potential for sustained growth. Thailand and India have seen a rapid ramp up of production in recent years, with India seeing a growing number of affluent consumers, while for Thai exports, vehicle parts and accessories have registered as the leading component. Although small, the chance to build on existing UK-India trade is significant. In 2020, the UK exported less than 600 vehicles to India. In pre-Covid 2019, this figure was only slightly higher at less than 800 vehicles, reflecting 0.7% of UK car exports.
With significant tariff and non-tariff barriers, UK exporters have always struggled with accessing the Indian market in volume. However, just as with the rest of Asia and the Indo-Pacific region, India is transforming. With an increasingly urgent need to drive down domestic emissions and a rise in private transport, India can represent a significant and substantial opportunity for future UK automotive trade, but only if the costs associated with trading are reduced. The recently announced intention to start negotiations of a UK-India FTA is an ambitious endeavour, but one which the automotive industry supports. Understanding the complex administrative, regulatory and customs requirements that exporters face when placing their goods on the market in India could be a major gain for the UK automotive industry, with businesses largely viewing India as a keen promoter of localised investment but too often closing the door to foreign imports.
With regard to the Pacific region, the industry welcomed the announcement of an agreement in principle of a trade deal between the UK and Australia. Being the first entirely new agreement negotiated by the UK in more than 40 years, the forthcoming FTA with Australia is likely to set a significant precedent. The potential to avoid a 5% tariff on UK cars and parts exported to Australia is a key interest for the industry, but even more important are the provisions on rules of origin that will unlock tariff benefits for British automotive exports. Assuming that content requirements will likely be met exclusively through the combination of British and Australian content, the final deal must deliver rules that are sufficiently flexible to ensure automotive businesses can benefit from the future deal. The announcement that 40% originating content will be enough for UK-built cars to qualify for zero-tariff treatment seems a step into the right direction; however, it is crucial that origin requirements for automotive parts will also be attainable and that additional easements are negotiated for electrified vehicles and batteries.
An agreement with New Zealand can also be beneficial, although more limited in scope, given that this Pacific nation does not impose tariffs on most automotive commodities, with the exception of a 10% duty on buses, motorhomes, caravans and an average 4.3% tariff on components.
Aside from its programme of bilateral trade negotiations, the UK government has made clear its ambition to join a major plurilateral trade pact – the Comprehensive and Progressive Trans-Pacific Partnership (CPTPP). The decision to ascend the UK to CPTPP was clearly a prioritised agenda of the UK government over the course of 2020 and will remain so throughout 2021/22.
The 11 CPTPP members comprise top export destinations for UK automotive products, such as Japan, Australia, Canada and Mexico, as well as some smaller or underserved markets. The sector traditionally runs a significant trade surplus on export of cars to CPTPP parties, while the UK imports more parts from CPTPP than it exports, showing commercial interest for UK-made vehicles in the region and an appetite for components sourced in CPTPP by UK manufacturers, particularly parts from Japan and Mexico.
In principle, joining CPTPP could represent an opportunity to remove unnecessary barriers, ensure that CPTPP-based consumers can buy more UK-made automotive products and promote greater integration of our respective supply chains.

CHAPTER 5
38 THE SOCIETY OF MOTOR MANUFACTURERS AND TRADERS
However, benefits to the sector are expected to be somewhat limited. The UK already has in place bilateral deals with seven out of the 11 CPTPP nations whilst FTAs with Australia and New Zealand should be concluded in the next future. Accordingly, major tariff gains are unlikely, with the sector already trading tariff-free with most CPTPP members. A further reduction of non-tariff barriers is also doubtful. The trade pact is not a Single Market and it does not include a specific annex on automotive products applicable to its membership, leaving individual parties to agree bilateral side instruments in this area.
Furthermore, joining without negotiating some necessary carveouts risks undermining the balanced outcome of existing bilateral agreements, including the progressive phase-out of tariffs on imports of cars into the UK.
Nevertheless, there are several areas where CPTPP could be beneficial to UK automotive.
First, joining CPTPP could improve market access to countries that do not have a bilateral deal in place with the UK. Brunei and Malaysia are the two markets where bilateral talks have not progressed. Liberalising trade with Malaysia would certainly be of interest for the sector, but the country has not ratified the deal and it is very unclear whether they will do so any time soon.
Second, businesses could benefit from having alternative options to claim zero tariff treatment and to choose between using bilateral deals or CPTPP.
For example, CPTPP origin requirements for most common parts and components – including lithium-ion batteries – are generally more relaxed compared with existing UK FTAs and manufacturers with production of parts in the UK or in the CPTPP region might benefit significantly from these provisions.
However, these potential gains should be carefully weighed against any potential downside. In particular the careful balance of existing bilateral deals should not be upset by a rushed accession, and renegotiations of continuity deals with Canada and Mexico should not be disincentivised as a result of the UK’s bid to join CPTPP. Finally, the UK should evaluate the impact of CPTPP on OEMs and suppliers without an Asia-Pacific footprint.
Beyond FTA negotiations, there is scope to discuss reducing non-tariff barriers in other key Asian markets. China retains its position as the world’s largest automotive manufacturing industry and the largest automotive market, with more than 30% of worldwide vehicle production based within its borders, and remains a challenging market for UK businesses to penetrate. Despite these difficulties, efforts to tackle behind-the-border barriers and promote greater recognition of international regulations and testing results where possible must continue. China is a significant factor in the expected growth of the Asian market over the next five years and, despite its challenges, still represents a viable market, especially for premium and high-end luxury vehicle manufacturers. Improving the ease at which these products can be placed on the market in China would be hugely beneficial given the attractiveness of these brands to Chinese consumers.
REBUILDING AUTOMOTIVE TRADE TIES ACROSS THE POND North America has always represented a significant trade market for UK automotive businesses, with 20.9% of UK cars exported to North America in 2020. The UK is home to more than 30 sites operated by US automotive manufacturers and suppliers, whilst bilateral trade of finished vehicles, parts, components, and engines to both Canada and Mexico are some of the UK’s most valuable imports and exports.
Trade in this region is further developing. The US, Canada and Mexico are parties to the USMCA deal, the successor of the North American Free Trade Agreement, concluded in 2019 and implemented from July 2020. The deal contains several provisions of importance for the regional automotive sector, including very ambitious – and very demanding – origin rules strengthening the role of North American supply chains. At the same time, the US, Canada and Mexico are all engaged in different discussions with the UK to redefine some key aspects of their trading relations.
As both a major export destination and a key market for imports, the US remains one of the UK’s most crucial trading partners. The US is responsible for the largest share of the UK’s export volumes at 17.7%. As a single country, this ranks first amongst the UK’s trading partners, and second only to the EU when taken as a group.
With the US market looking to compete with China as a major hub for electric vehicle and battery production, it is likely to remain a major market for UK-based automotive businesses, especially for sports, premium and luxury manufacturers. Moreover, the US has been ranked the fourth largest growth market in production terms, with the sector predicted to grow by more than 12% by 2025.
Despite reciprocal trade and investment between both countries leading to high-value jobs and generating millions of pounds for both economies, recent years have shown a rise in trade tensions and successive restrictive measures in the form of tariff hikes on a large swathe of commodities.

CHAPTER 5
39THE SOCIETY OF MOTOR MANUFACTURERS AND TRADERS
The launch of formal FTA negotiations between the US and the UK in 2020 was a welcome first step to promote bilateral trade and ensure predictability by defusing tensions. However, the election of President Joe Biden has changed the US priorities in the trade policy area, with the new Administration focused on resetting trans-Atlantic trade relations by engaging in discussions of pre-existing trade disputes and systemic reforms of the global trading framework with European allies. The resulting stall in bilateral negotiations of a deal between the US and the UK does not encourage optimism for a prompt deal, but the automotive sector would still greatly benefit from a final settling of trade irritants and from a bold restart of trans-Atlantic trade relations on a new, more solid basis.
Efforts by the UK government to diffuse trade tensions have been greatly welcomed by the automotive industry over the past year. The suspension of retaliatory tariffs in the Airbus-Boeing dispute was a major achievement for the US, the EU and the UK. Further progress on questions regarding national security and ongoing talks to de-escalate tariffs on steel and aluminium can potentially stabilise trade routes across the Atlantic, with great benefit for manufacturers and consumers. The UK should also work closely with the US on issues such as WTO reform, as well as in its industrial transition towards automated, connected and electric technologies.
In the absence of a UK-US FTA, the UK government must seek to receive assurances from the US administration that UK businesses will not be subject to further trade restrictive measures and tariff hikes. The impact of recent international trade tensions for some businesses within our sector has been substantial disruption. With the potential for further Section 232 tariffs following the Biden Administrations review of the previous Trump-era trade policies, automotive businesses need as much certainty as possible that the recent relaxation of measures will not be undermined by new, uncoordinated unilateral actions.
It is also important that any tariff rebalancing measures, enforced by the UK on US imports in response to additional tariffs on steel and aluminium, do not weaken the UK’s manufacturing capabilities with regards to battery and electric vehicle production. Understanding the value of imports of US parts for electric accumulators – a key component in the manufacturing of battery fuel cells – will be important to understanding the potential impact should the UK chooses to impose additional tariffs on these products.
Elsewhere in North America, automotive has been engaged with the UK’s renegotiation of its trade arrangements with Canada and Mexico. These negotiations are a key focus for UK automotive manufacturers, since the continuity deals currently in place, although welcomed as providing the necessary stability for businesses following the UK’s departure of the EU, still require updating to secure advanced manufacturing competitiveness.
The UK-Mexico deal, for example, does not accurately reflect the reality of an industry that has undergone major changes over the last two decades and it should undergo a complete overhaul. An agreement to modern rules of origin and a dedicated automotive annex would greatly improve the terms of trade between the two countries, with increased market access for both parties, lower regulatory barriers and more automotive products qualifying for tariff-free treatment.
Meanwhile, Canada represents the eighth largest export market for UK-assembled vehicles with 11,500 cars shipped in 2020. In value terms, Canada is also an important destination for UK engines and most typical parts and components, with exports of these products worth more than £61 million.
While the UK-Canada continuity agreement already incorporates modern provisions compared with the deal with Mexico, there is still ample margin to improve the deal and correct some aspects of the agreement, including origin rules and automotive quotas.
Given the composition of the UK supplier base and the deadline to transform the industry, the UK’s trade agenda and its arrangements with markets such as Mexico and Canada must reflect and support the domestic agenda, particularly around decarbonisation. In this regard, agreeing on modern rules that will promote trade of new-generation vehicles and related technologies must be a priority for UK negotiators.

CHAPTER 5
40 THE SOCIETY OF MOTOR MANUFACTURERS AND TRADERS
GREAT BRITISH BRANDS – THE UK’S GLOBAL LOW VOLUME MARKETThe UK automotive sector is a global industry, one with a depth and diversity of product and technology that makes it truly unique and provides an invaluable place on the world stage. This uniqueness cannot be taken for granted, nor should it be under-valued. The diversity of products designed, built, and remanufactured in the UK can be found nowhere else on the earth. No other nation has thriving sports, premium, volume, commercial and specialist markets together. From instantly recognisable, global brands in the premium space, to niche and highly customised specialist converters, the UK builds and exports it all.
The export footprint of the low volume, premium and specialist vehicle manufacturers is a consequence of the world-class technologies and products which are on offer. With such global brands and products highly valued by consumers, many low volume producers find significant value in distributing their exports widely across the world, with a prevalence in North America and Asia, as well as Europe. In 2020, the UK’s low volume manufacturers exported more than 18,500 units and are one of the few segments within UK automotive to register consecutive years on growth preceding the global pandemic. Securing preferential market access in these regions will undoubtedly be critical for the future competitiveness of the segment.
When opening up access to foreign markets, tariffs are only one factor. For businesses smaller in size, administrative burdens and complex customs and regulatory requirements often pose a bigger barrier for increasing exports. Additional administrative tasks are time consuming and often require an increase in headcount and technical expertise, a luxury not always affordable to low volume manufacturers. These manufacturers are already required to build their vehicles and products to different standards depending on the end destination of sale. Aligning standards and regulations at a UN level where possible, and avoiding creating new regulatory barriers in the future will help prevent markets, being closed off.
One of the most damaging non-tariff barriers prohibiting a wider sale of premium and luxury cars in markets such as Australia, and soon in Canada, is the Luxury Car Tax (LCT). In Australia, manufacturers of high-end automotive vehicles pay a tax of 33%, applicable above the value of AUS$ 64,132 (approximately £35,000) for regular cars and AUS$ 75,526 (approximately £40,000) for fuel efficient vehicles. Canada, likewise, will impose its own LCT on vehicles costing more than CA$100,000 in 2023. No tax on other ‘luxury goods’ exists in Australia, where local automobile production ceased in 2017, whilst Canada also lacks a competitive luxury industry. While negotiating for a change in these domestic policies, efforts should be made by the UK government to advocate for the removal, or at least the reform, of these extreme taxes to support the UK industry, especially where the products support domestic decarbonisation agendas.
The diversity of products designed,built, and remanufactured in the UK can be found nowhere else on the earth

CHAPTER 5
41THE SOCIETY OF MOTOR MANUFACTURERS AND TRADERS
A GREEN AGENDA FOR AUTOMOTIVE TRADEThere has been much attention given to the impact trade deals have on the environment at a global level. For UK automotive businesses, tariff-free trade of electrified vehicles and battery packs must be a top priority for UK negotiators.
Most UK FTAs set achievable content requirements for internal combustion engines (ICE) vehicles. However, content requirements for electrified vehicles, batteries and related technologies often do not reflect the current manufacturing capabilities for these products in the broader European region. Accordingly, new generation vehicles produced in the UK face much bigger challenges than ICE vehicles in claiming zero-tariff treatment under most existing deals. This has the contradictory effect of hampering global trade of green technologies while governments worldwide set ambitious environmental agendas. Future FTAs must offer electrified vehicles the same opportunities offered to ICE vehicles to benefit from tariff-free treatment. This can be achieved by agreeing workable origin requirements and further easements, such as applying far more flexible rules on EVs and batteries for the duration of a reasonable phase-in period. This would encourage the progressive development of domestic supply chains without renouncing the benefits of free trade and larger economies of scale while manufacturing capabilities are further developed.
Modern trade agreements are not the only option available to support ambitious environmental objectives. The impact of the TCA on the European remanufacturing sector has illustrated how unfit FTAs are for supporting the circular economy. In this area, an option to facilitate sourcing of cores is to adopt unilateral measures allowing faulty or used materials imported for remanufacturing purposes to avoid tariffs.
However, governments are often treading on a fine line when developing trade-related measures to pursue legitimate environmental objectives. The EU has recently produced a proposal to introduce a Carbon Border Adjustment Mechanism (CBAM), possibly as early as 2023, which would see certain imported products face a charge to reflect the carbon content of their product to ensure the competitiveness of domestic manufacturers. In the EU it is proposed to start with several products covered by the EU’s Emissions Trading Scheme (EU ETS), such as steel, iron and cement. Imports to the EU will buy carbon certificates corresponding to the carbon price that would have been paid had the goods been produced under the EU’s carbon pricing rules (if the importer can demonstrate they have already paid that price they would not need to pay the EU). This mechanism also will lead to the removal of free allocations of allowances to those within the EU ETS to protect them from carbon leakage.
Other countries, including the US, are reportedly looking to introduce CBAMs, and there are particular schemes already in place. The UK is also looking at such proposals but has yet to make any firm decisions. CBAMs could generate significant revenues for the local government.
There is concern that CBAMs will lead to increased costs downstream for users of covered products, as well as lead to retaliatory measures from the exporting nation which could then spill over into other products. The EU CBAMs are not expected to cover automotive in the first instance (automotive is in the ETS, but have very complex products), but could still result in higher costs to auto manufacturers, either through material prices rising or a rise in the price of carbon. The complexity of automotive supply chains might make participation in a CBAM administratively burdensome for the sector.
For UK automotive businesses, tariff-free trade of electrified vehicles and battery packs must be a top priority for UK negotiators

RECOMMENDATIONS
42 THE SOCIETY OF MOTOR MANUFACTURERS AND TRADERS
A TRADE STRATEGY THAT HAS AUTOMOTIVE AT ITS HEART→ More than 80% of cars and some 60% of commercial
vehicles produced in the UK are built for export, with the UK selling into 150 markets worldwide.
→ The UK government should target access to global markets where automotive businesses can see worthwhile gains. Government trade policies and strategies must also work for the entire UK automotive industry, including volume and low volume manufacturers, specialist builders and service providers.
GOVERNMENT’S CONSULTATIVE MECHANISMS MUST BE FUNCTIONAL → Government and industry collaboration during trade
negotiation rounds is essential to ensure that any Free Trade Agreements negotiated will work for business. Exporters should have more functional input to identify areas for improvement, such as negotiating workable origin requirements.
→ Even where negotiations become sensitive, businesses must be kept abreast of the latest developments to help find technical solutions where possible. A review into how working groups and sectors engagement with government is essential, to create the right balance between preserving confidentiality while providing business with access to negotiating proposals.
FUTURE-PROOF THE UK AUTOMOTIVE INDUSTRY THROUGH A COMPETITIVE BUSINESS ENVIRONMENT→ To secure the future competitiveness of UK automotive,
government must ensure the UK remains an attractive destination for both foreign and inward investment. Competitive domestic policies are required to support the UK’s trade agenda and ensure manufacturers can reap the rewards of accessing new markets.
→ For manufacturers to meet the necessary levels of domestic content required to qualify for preferential access, the UK will need significant battery production capabilities. To catch up with international competitors, the UK government must commit to ambitious investment in battery production incentives, charging networks and affordable clean energy.
ALIGN THE UK’S INTERNATIONAL TRADE AND DOMESTIC INDUSTRIAL OBJECTIVES→ The UK’s bilateral and regional trade deals must support
the domestic agendas of the UK automotive industry which is undergoing its most substantial transformation since the invention of the car. Negotiating accessible trading terms to support the sector’s electrification and digitalisation transformation is essential.
→ A central and frequently reviewed roadmap that matches the UK’s trade strategy with domestic technology and innovation, and manufacturing competitiveness agendas, should also be developed to ensure the UK remains on the right path.
CHAMPION TRADE AGREEMENTS WHICH ADDRESS REGULATORY BARRIERS→ During bilateral and multilateral talks, government should
utilise its negotiating capital to push for greater market access, by ensuring future trade agreements include an automotive annex to tackle regulatory barriers.
→ Addressing such issues will be beneficial to the entire automotive industry, especially small, premium and luxury manufacturers who operate global brands, with an equally global footprint, but must adhere to vast, complex and sometimes excessively stringent regional regulations and standards.
RECOMMENDATIONS FOR GOVERNMENT AND INDUSTRY
1
2
3
4
5

RECOMMENDATIONS
43THE SOCIETY OF MOTOR MANUFACTURERS AND TRADERS
WORKABLE RULES OF ORIGIN WHICH REFLECT THE UK’S POST-BREXIT SUPPLIER BASE→ In all upcoming trade agreements, preferential rules
of origin must reflect the UK supplier base, following its withdrawal from the EU.
→ Given the long history and intricate nature of embedded European supply chains, cumulation of EU content is the easiest option to reach ambitious content requirements in UK FTAs. In absence of such a cumulation provision negotiators should seek to agree lower value-added thresholds and more flexible alternative rules.
→ UK deals must ensure that electrified vehicles, batteries and related technologies can also benefit from future FTAs.
MITIGATE IMPACTS OF COSTLY CUSTOMS REQUIREMENTS → Customs requirements can be extremely complex and
burdensome for businesses. With the UK’s departure from the EU, businesses have already needed to understand the new customs formalities when moving goods across the border. Further changes are due on 1 January 2022 when the UK’s full customs controls come into force. The introduction of full customs controls should be accompanied by an awareness campaign and resources should be dedicated to offer technical support to businesses.
→ Government is also working towards a 2025 Border Strategy, a unique chance to develop a coordinated and holistic approach to the border.
MAKE THE UK AN AUTOMOTIVE GLOBAL TALENT HUB→ The UK is home to one of the most productive and skilled
automotive labour markets in the world, present in every region of the UK. Complimenting this workforce is a highly valuable Research & Design network and world-class university system.
→ The UK’s trade agenda should help protect promote these critical employees by negotiating easements and provisions which help to facilitate intra-corporate transferees, movement of service providers, professionals, investors, and business visitors.
ENHANCE RESILIENCE TO PROTECT AGAINST FUTURE GLOBAL DISRUPTION→ As part of a global industry, UK automotive operates
a globally diverse supply chain. The effects of the global pandemic, as well as recent semiconductor shortages, have undoubtedly highlighted weaknesses in the global, as well as local supplier base. Diversifying one’s customer base and export markets can help build flexibility if specific countries become temporarily inaccessible. The focus should therefore be on automotive relevant regions which are likely to see growth in vehicle production in the next five years
→ New innovation chapters included in UK FTAs could be useful instruments to secure commitments to provide stable supplies of key materials for new generation vehicles, including semiconductors and raw materials for batteries.
MAINTAINING A CLOSE RELATIONSHIP WITH OUR NEIGHBOURS IN THE EU → While UK automotive is undoubtedly a global industry,
most vehicles produced in the UK are still destined for the EU and given the close proximity and shared history, extensive supply chains between the UK and Europe are likely remain.
→ Leaving the Single Market may have inherently increased friction, as well as risk amongst the pan-European supply chain. However, a collaborative and responsive working relationship with the European Union is essential to ensure smooth trade flows and the continued ease of market access with our biggest trading partner.
6
7
8
9
10

ANNEX
44 THE SOCIETY OF MOTOR MANUFACTURERS AND TRADERS
ANNEX: DATA SOURCESSMMT has used four key sources for the trade data – ONS, HMRC, Eurostat and our own SMMT data sets. SMMT data on car exports to individual EU member states has been amended to reallocate some outbound flows from OEMs who export to regional hubs before further distributing their vehiclesThe three government sources are used for value of exports and imports. HMRC and ONS use slightly different classifications and approaches, but the overall difference is relatively small in this context. We have used ONS and HMRC data for the headline figures and HMRC data for country specific information (which is not available from the ONs data). SMMT data is used for volumes of vehicle production destined for export and new registrations by origin.For more information on SMMT data and for additional data please contact [email protected].
The ONS data uses the change in ownership balance of payments methodology, whilst HMRC uses physical movement of goods.
The ONS data uses SIC29 and covers all motor vehicles, including engines and parts and accessories. The ONS data gives both home and export details and a split between EU and non-EU. See https://www.ons.gov.uk/economy/nationalaccounts/balanceofpayments/bulletins/uktrade/previousReleases for data and http://www.siccodesupport.co.uk/sic-division.php for SIC29 definition.
The HMRC data uses SITC division 78 for the headline figure on road vehicle exports and commodity codes for all other figures - for the purposes of this report certain codes in 87 (motor vehicles and parts and accessories) and 84 (engines). The detailed codes are given below. See: https://www.uktradeinfo.com/
Throughout 2020, the new HMRC database that has replaced the previous “Build Your Own Table” function has experienced significant challenges, including at the time of writing. Despite SMMT’s best efforts to ensure the accuracy of data, the HMRC has informed the authors of the report that there are technical issues with the platform and that may reflect within the data, in particular for finished vehicles.
HMRC Codes used→ 8701 Tractors
→ 8702 Motor vehicles for the transport of >= 10 persons
→ 8703 Motor cars and other motor vehicles principally designed for the transport of <10 persons, incl. station wagons and racing cars
→ 8704 Motor vehicles for the transport of goods, incl. chassis with engine and cab
→ 8705 Special purpose motor vehicles
→ 8706 Chassis fitted with engines, for tractors, motor vehicles
→ 8707 Bodies, incl. cabs, for tractors, motor vehicles
→ 8708 Parts and accessories for tractors, motor vehicles
→ 8709 Works trucks
→ 8716 Trailers and semi-trailers
→ 840731, 840732, 840733, 840734 Petrol Engines
→ 840820 Diesel Engines

THE SOCIETY OF MOTOR MANUFACTURERS AND TRADERS LIMITED 71 Great Peter Street, London, SW1P 2BN Tel: +44 (0)20 7235 7000 E-mail: [email protected]
@SMMT SMMT
www.smmt.co.uk
SMMT, the ‘S’ symbol and the ‘Driving the motor industry’ brandline are registered trademarks of SMMT Ltd
Disclaimer This publication contains general information and although SMMT endeavours to ensure that the content is accurate and up-to-date at the date of publication, no representation or warranty, express or implied, is made as to its accuracy or completeness and therefore the information in this publication should not be relied upon. Readers should allow seek appropriate advice from a suitably qualified expert before taking, or refraining from taking, any action. The content of this publication should not be construed as advice or guidance and SMMT disclaims liability for any loss, however caused, arising directly from reliance on the information in this publication.