driving change defining our future - anglo …/media/files/a/anglo... · driving change defining...
TRANSCRIPT

2016 INTERIM RESULTS
26 JULY 2016
DRIVING CHANGE
DEFINING OUR
FUTURE
Certain statements made in this presentation constitute forward-looking statements. Forward-looking statements
are typically identified by the use of forward-looking terminology such as ‘believes’, ‘expects’, ‘may’, ‘will’, ‘could’,
‘should’, ‘intends’, ‘estimates’, ‘plans’, ‘assumes’ or ‘anticipates’ or the negative thereof or other variations thereon
or comparable terminology, or by discussions of, e.g. future plans, present or future events, or strategy that
involve risks and uncertainties. Such forward-looking statements are subject to a number of risks and
uncertainties, many of which are beyond the company's control and all of which are based on the company's
current beliefs and expectations about future events. Such statements are based on current expectations and, by
their nature, are subject to a number of risks and uncertainties that could cause actual results and performance to
differ materially from any expected future results or performance, expressed or implied, by the forward-looking
statement. No assurance can be given that such future results will be achieved; actual events or results may differ
materially as a result of risks and uncertainties facing the company and its subsidiaries. The forward-looking
statements contained in this presentation speak only as of the date of this presentation
and the company undertakes no duty to, and will not necessarily, update any of them
in light of new information or future events, except to the extent required by applicable law or regulation.
DISCLAIMER
1

• Iron ore reference price down 13% to $52/t
• Production down 21% to 17.8Mt consistent with revised Sishen mine plan
• Resilient financial performance underpinned by successful cash preservation initiatives
• HEPS up 20% to R9.41 per share, normalised earnings down 4%
• Further efficiency and productivity improvements expected in 2H16 at Sishen
• Pipeline of value accretive growth opportunities at advanced stage
Key features
RESULTS SUMMARY
2
Asset portfolio revised
• Sishen reconfiguration and restructure to lower cost pit shell implemented
• Kolomela production on track, and in line to achieve 13Mtpa in 2017
• Thabazimbi mining and processing activity ceased
Cash breakeven at $34/t in the lower end of targeted range of $32–$40/t
• Substantial R3.1bn reduction in controllable costs achieved
• Capex reduced 61% to R1.3bn
Strengthened balance sheet to net cash position of R548m
Repositioning of business for lower prices continues
SIGNIFICANT CHANGES DELIVERED
3

Safety performance a concern
• Regrettably, 2 loss of life incidents
• Priorities for 2H16: safety turnaround, behaviour, culture and leadership initiatives
Organisational restructure completed
• Total workforce reduced by 31% end 2015 to 1H16
• Sishen restructuring completed without work stoppage
• Workforce stabilisation and culture programme underway
Sishen transitioned to lower cost pit shell
• New mine plan refined and optimised to further increase confidence in delivery
• Production lower in line with plan; exacerbated by rainfall and safety stoppage
Exports declined on lower production
Emphasis on stabilising production and improving efficiency going forward
CHALLENGING FIRST HALF
4
34
18
37
0
5
10
15
20
25
30
35
40
1H15 2H15 1H16
Return on Capital Employed (%)
5.7
2.3
6.7
0
1
2
3
4
5
6
7
8
1H15 2H15 1H16
Operating Free Cash Flow (Rbn)1
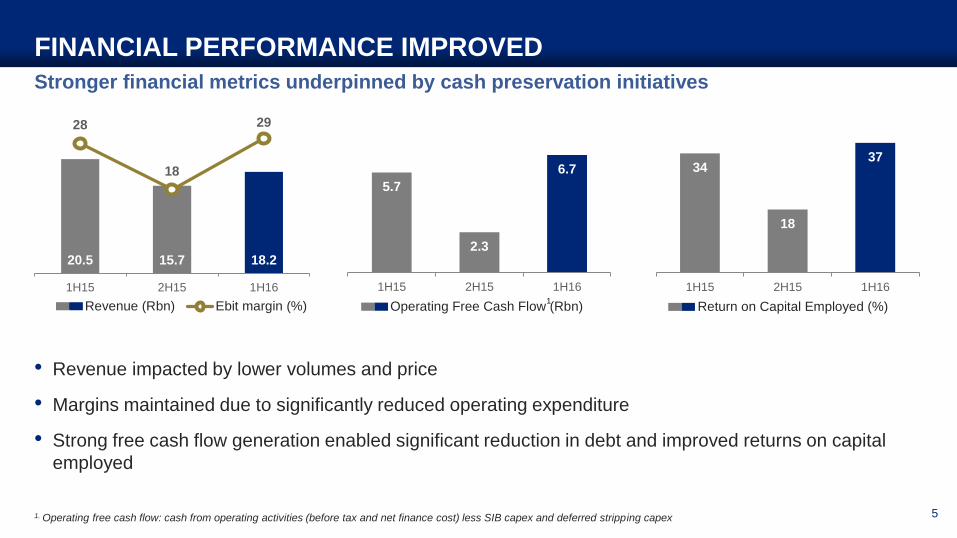
Stronger financial metrics underpinned by cash preservation initiatives
FINANCIAL PERFORMANCE IMPROVED
• Revenue impacted by lower volumes and price
• Margins maintained due to significantly reduced operating expenditure
• Strong free cash flow generation enabled significant reduction in debt and improved returns on capital
employed
5
20.5 15.7 18.2
28
18
29
0
5
10
15
20
25
30
0
5
10
15
20
25
1H15 2H15 1H16
Revenue (Rbn) Ebit margin (%)
1. Operating free cash flow: cash from operating activities (before tax and net finance cost) less SIB capex and deferred stripping capex
MARKET
OVERVIEW

Recovering from historic lows but supply-demand fundamentals remain challenging
IRON ORE PRICES
7
• Iron ore prices (62% Fe Platts CFR China) averaged US$52/dmt in 1H16, down 13%
• Improving steel mill margins drive stronger iron ore prices, recovering from historic lows in late 2015
• Prices capped by mine restarts and seasonal supply recovery, with further pressure expected as major
projects ramp up
• Lump premium benefiting from strong demand for direct charge materials
• Steel and iron ore futures contribute to significant price volatility
30
50
70
90
110
130
150
170
US
$/d
mt
CF
R Q
ing
dao 2013 Ave
$135
2014 Ave$97
1H15 Ave$60 2H15 Ave
$51
1H16 Ave $52
Platts IODEX Monthly Average (dmt) Platts Lump Premium Monthly Average (dmtu)
0.00
0.05
0.10
0.15
0.20
0.25
0.30
0.352013 Ave
$0.21
2014 Ave$0.17
1H15 Ave$0.20
2H15 Ave $0.09
1H16 Ave $0.15
US
$/d
mtu
CF
R Q
ing
dao
Source: Platts

Ongoing ramp-ups and new projects drive seaborne supply growth
SEABORNE IRON ORE SUPPLY
8
• Australia exports increased 4%
• Despite closure of Samarco’s
operations, Brazil exports up 7%
• Recent price rally incentivising
non-traditional supply sources
back into the market
• Ongoing ramp-ups and new
projects drive seaborne supply
growth
Global seaborne iron ore exports*
6 months
30 Jun 2016
6 months
30 Jun 2015%
6 months
30 Dec 2016%
Mt Mt % Mt %
Australia 406 391 4% 419 (3%)
Brazil 175 164 7% 195 (10%)
S. Africa 31 33 (6%) 32 (3%)
India 6 2 200% 2 200%
RoW 81 77 5% 75 8%
Total 699 667 5% 723 (3%)
Source: GTIS, *Raw basis

Down in all major regions but up on 2H15
GLOBAL CRUDE STEEL PRODUCTION
Source: WSA, GTIS, * Based on 5M16 actuals
1. JKT – Japan, South Korea and Taiwan 9
• Global crude steel production contracted 2.5%,
but up 1.3% on 2H15
• Chinese crude steel production eased 1.7% despite
a 5.7% rise in Chinese steel exports
• JKT’s1 steel production moderating on subdued domestic
demand and increased export competition
• Rising steel imports and capacity closures impacted
European crude steel output
408 408 396 401
82 88 78 82
103 99 98 96
224 219 212 215
2H14 1H15 2H15 1H16e*
Global Crude Steel Production (Mt)
China EU-28 JKT RoW
82
104 105
118 111
1H14 2H14 1H15 2H15 1H16e*
Chinese Steel Exports (Mt annualised)
814784
817794
-0.4% -3.7% +1.3%
-2.5%
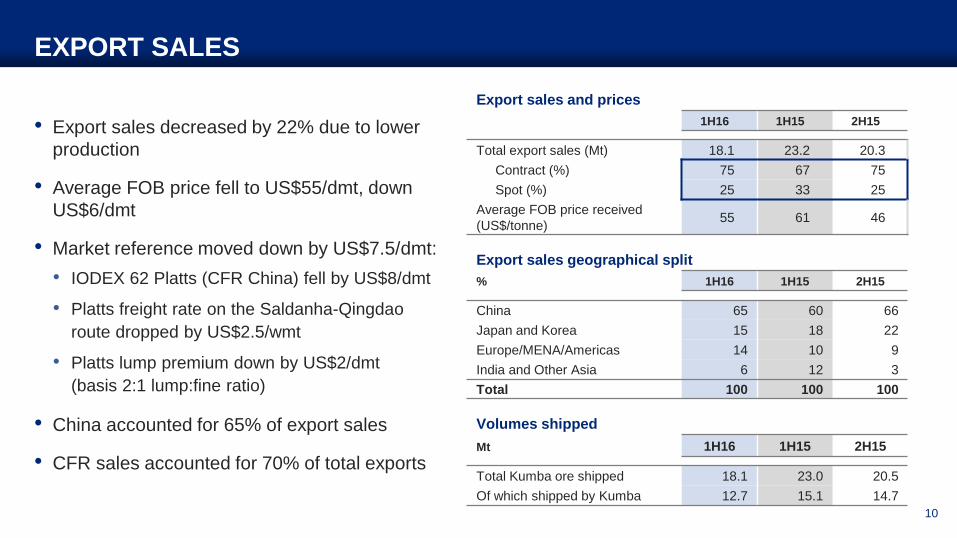
Export sales and prices
1H16 1H15 2H15
Total export sales (Mt) 18.1 23.2 20.3
Contract (%) 75 67 75
Spot (%) 25 33 25
Average FOB price received
(US$/tonne)55 61 46
Export sales geographical split
% 1H16 1H15 2H15
China 65 60 66
Japan and Korea 15 18 22
Europe/MENA/Americas 14 10 9
India and Other Asia 6 12 3
Total 100 100 100
Volumes shipped
Mt 1H16 1H15 2H15
Total Kumba ore shipped 18.1 23.0 20.5
Of which shipped by Kumba 12.7 15.1 14.7
EXPORT SALES
10
• Export sales decreased by 22% due to lower
production
• Average FOB price fell to US$55/dmt, down
US$6/dmt
• Market reference moved down by US$7.5/dmt:
• IODEX 62 Platts (CFR China) fell by US$8/dmt
• Platts freight rate on the Saldanha-Qingdao
route dropped by US$2.5/wmt
• Platts lump premium down by US$2/dmt
(basis 2:1 lump:fine ratio)
• China accounted for 65% of export sales
• CFR sales accounted for 70% of total exports
OPERATIONAL
OVERVIEW
Mar
2016
Apr
2016
May
2016
June
2016
0
100
200
300
400
500
600
700
800
‘000
Mt
6 months
30 Jun 2016
6 months
30 Jun 2015
%
change
6 months
31 Dec 2015
%
change
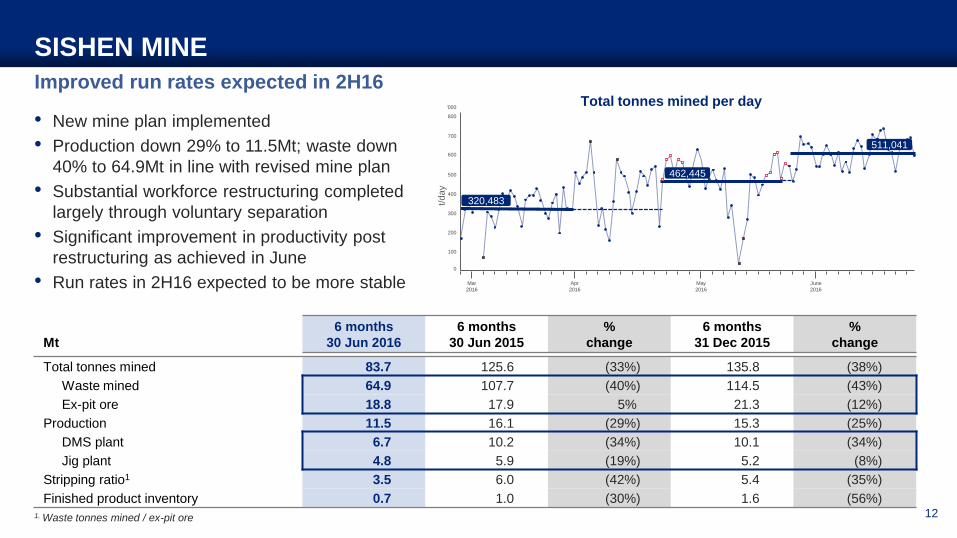
Total tonnes mined 83.7 125.6 (33%) 135.8 (38%)
Waste mined 64.9 107.7 (40%) 114.5 (43%)
Ex-pit ore 18.8 17.9 5% 21.3 (12%)
Production 11.5 16.1 (29%) 15.3 (25%)
DMS plant 6.7 10.2 (34%) 10.1 (34%)
Jig plant 4.8 5.9 (19%) 5.2 (8%)
Stripping ratio1 3.5 6.0 (42%) 5.4 (35%)
Finished product inventory 0.7 1.0 (30%) 1.6 (56%)
Improved run rates expected in 2H16
SISHEN MINE
1. Waste tonnes mined / ex-pit ore 12
• New mine plan implemented
• Production down 29% to 11.5Mt; waste down
40% to 64.9Mt in line with revised mine plan
• Substantial workforce restructuring completed
largely through voluntary separation
• Significant improvement in productivity post
restructuring as achieved in June
• Run rates in 2H16 expected to be more stable
Total tonnes mined per day
t/day
462,445
511,041
320,483

Daily plant throughput
Production target achieved
KOLOMELA MINE
1. Waste tonnes mined / ex-pit ore
• Production of 5.9Mt
• Waste mined 20.2Mt, 23% lower, in line with
mine optimisation
• Work continues to achieve planned target of
13Mtpa in 2017
• Further improvement in plant efficiency and
throughput rate expected
13
Mt
6 months
30 Jun 2016
6 months
30 Jun 2015
%
change
6 months
31 Dec 2015
%
change
Total tonnes mined 26.7 34.9 (24%) 25.7 4%
Waste mined 20.2 26.3 (23%) 19.4 4%
Ex-pit ore 6.5 8.6 (24%) 6.3 3%
Production 5.9 5.9 - 6.2 (5%)
Stripping ratio1 3.2 3.1 3% 3.1 3%
Finished product inventory 0.4 1.3 (69%) 1.2 (67%)
Mar
2016
Apr
2016
May
2016
June
2016
Feb
2016
Jan
2016
10
20
30
0
40
50
60
‘000
t/day 31,871
37,742
43,502
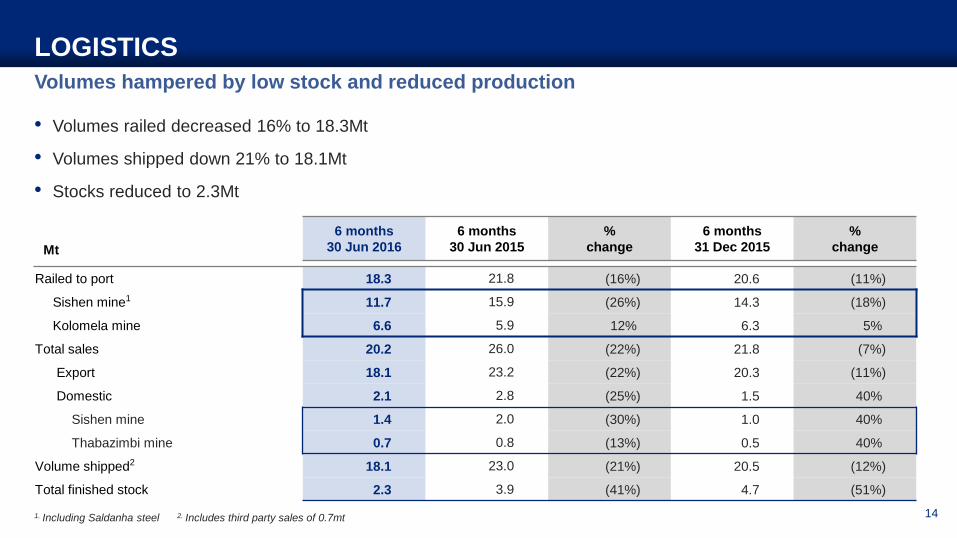
Volumes hampered by low stock and reduced production
LOGISTICS
1. Including Saldanha steel 2. Includes third party sales of 0.7mt 14
• Volumes railed decreased 16% to 18.3Mt
• Volumes shipped down 21% to 18.1Mt
• Stocks reduced to 2.3Mt
Mt
6 months
30 Jun 2016
6 months
30 Jun 2015
%
change
6 months
31 Dec 2015
%
change
Railed to port 18.3 21.8 (16%) 20.6 (11%)
Sishen mine1 11.7 15.9 (26%) 14.3 (18%)
Kolomela mine 6.6 5.9 12% 6.3 5%
Total sales 20.2 26.0 (22%) 21.8 (7%)
Export 18.1 23.2 (22%) 20.3 (11%)
Domestic 2.1 2.8 (25%) 1.5 40%
Sishen mine 1.4 2.0 (30%) 1.0 40%
Thabazimbi mine 0.7 0.8 (13%) 0.5 40%
Volume shipped2 18.1 23.0 (21%) 20.5 (12%)
Total finished stock 2.3 3.9 (41%) 4.7 (51%)
FINANCIAL
OVERVIEW
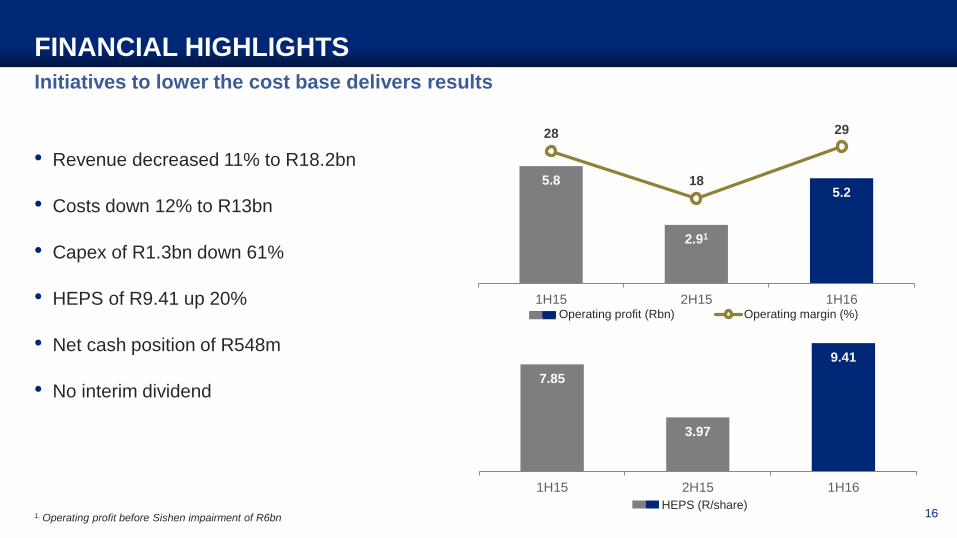
Initiatives to lower the cost base delivers results
FINANCIAL HIGHLIGHTS
1. Operating profit before Sishen impairment of R6bn 16
• Revenue decreased 11% to R18.2bn
• Costs down 12% to R13bn
• Capex of R1.3bn down 61%
• HEPS of R9.41 up 20%
• Net cash position of R548m
• No interim dividend7.85
3.97
9.41
1H15 2H15 1H16
HEPS (R/share)
5.8
2.91
5.2
28
18
29
0
1
2
3
4
5
6
7
1H15 2H15 1H16
0
5
10
15
20
25
30
Operating profit (Rbn) Operating margin (%)
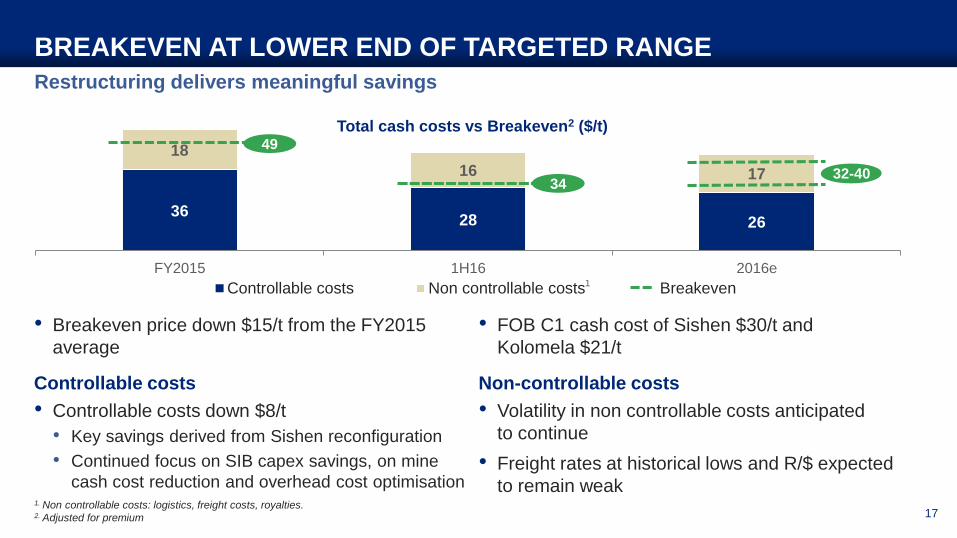
Restructuring delivers meaningful savings
BREAKEVEN AT LOWER END OF TARGETED RANGE
1. Non controllable costs: logistics, freight costs, royalties.2. Adjusted for premium
3628 26
18
16 17
FY2015 1H16 2016e
Total cash costs vs Breakeven2 ($/t)
Controllable costs Non controllable costs Breakeven
49
34
1
32-4032-40
• Breakeven price down $15/t from the FY2015
average
Controllable costs
• Controllable costs down $8/t
• Key savings derived from Sishen reconfiguration
• Continued focus on SIB capex savings, on mine
cash cost reduction and overhead cost optimisation
• FOB C1 cash cost of Sishen $30/t and
Kolomela $21/t
Non-controllable costs
• Volatility in non controllable costs anticipated
to continue
• Freight rates at historical lows and R/$ expected
to remain weak
17

Robust operating margin and healthy cash generation
FINANCIAL REVIEW
18
Rm
6 months
30 Jun 20161
6 months
30 Jun 2015 % change
6 months
31 Dec 2015 % change
Revenue 18,182 20,469 (11%) 15,669 16%
Operating expenses (12,976) (14,699) (12%) (18,795) (31%)
Operating expenses (13,190) (16,088) (18%) (14,089) (6%)
Mineral royalty (248) (96) 158% (95) 161%
Impairment (4) - 100% (5,978) (100%)
Deferred waste stripping 466 1,485 (69%) 1,367 (66%)
Operating profit 5,206 5,770 (10%) (3,126) 267%
Operating margin (%)2 29 28 18
Profit for the period 3,820 3,273 17% (2,646) 244%
Equity holders of Kumba 2,974 2,508 19% (2,039) 246%
Non-controlling interest 846 765 11% (607) 239%
Headline earnings 3,009 2,519 20% 1,273 136%
Effective tax rate (%)3 23 24 21
Cash generated from operations 7,632 8,680 (12%) 5,161 48%
Capital expenditure 1,294 3,331 (61%) 3,421 (62%)
1. Including Thabazimbi2. Excluding the impairment charge3. Excluding the mineral royalty and de-recognition of deferred tax asset (2015)

Planned reduction in volumes offset by weaker currency
REVENUE
• Revenue decreased by 11%
• Total sales volumes reduced as planned by 5.8 Mt to 20.2 Mt as a result of revised Sishen mine plan
• 29% weaker average ZAR/$ exchange rate of R15.40 (1H15: R11.91)
• Realised average FOB export prices decreased by 10% to $55/t (1H15: $61/t)
18,892
17,140
1,577
1,042
3,495
4,211
1,036
535
1H15 Volume Currency Price Shipping 1H16
Rm
Mining operations Shipping
20,469
18,182
19

9,9388,733
1,774
1,317
1,034 291
2,298
232
457 217
2,891
2,674
1H15 Mining operations Stockmovement
Deferred stripping Other Shipping Selling anddistribution
1H16
Rm
Mining operations Shipping Selling and distribution
14,603
1
Cost contained through stringent management
OPERATING EXPENDITURE
• Mining costs down 12% mainly from lower mining volumes, fuel prices and contractor rates partially offset by a
decrease in waste stripping costs deferred to the balance sheet
• Lower shipping costs as freight rates declined to historical lows reaching $4/t during Jan 2016 and volumes
shipped from Saldanha port down 4.9Mt
• Selling and distribution costs down due to lower volumes railed to Saldanha
12,724
Mining
(1,205)
1. Excluding the mineral royalty and impairment 20
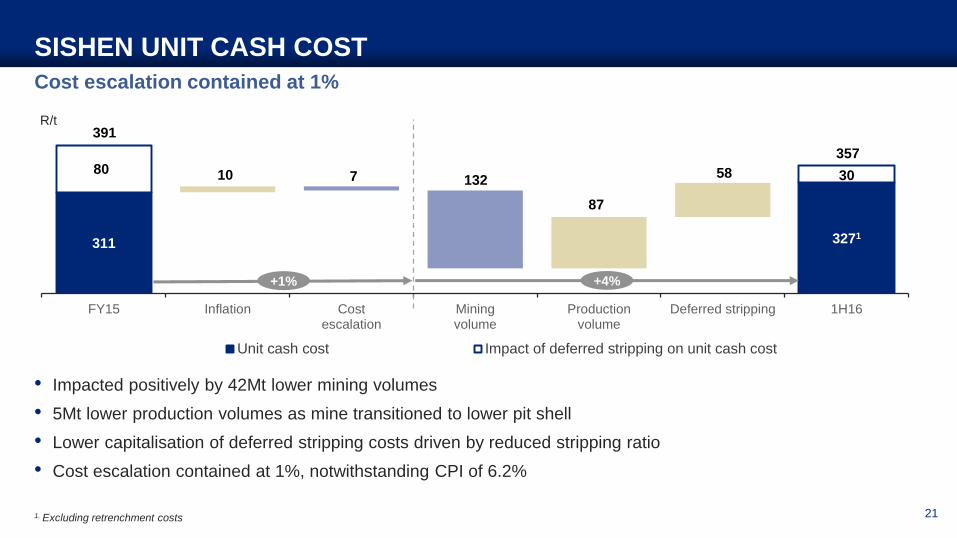
Cost escalation contained at 1%
SISHEN UNIT CASH COST
• Impacted positively by 42Mt lower mining volumes
• 5Mt lower production volumes as mine transitioned to lower pit shell
• Lower capitalisation of deferred stripping costs driven by reduced stripping ratio
• Cost escalation contained at 1%, notwithstanding CPI of 6.2%
10
87
587 132
311 3271
80 30
FY15 Inflation Costescalation
Miningvolume
Productionvolume
Deferred stripping 1H16
R/t
Unit cash cost Impact of deferred stripping on unit cash cost
391
357
21
+1% +4%
1. Excluding retrenchment costs

Lower mining volumes and overhead cost savings drive exceptional unit cost performance
KOLOMELA UNIT CASH COST
• Impacted positively by 8Mt lower mining volumes in line with mine optimisation
• Input cost savings from reduced mining contractor rates and other third party service provider costs
• Maintenance cost anticipated to increase in 2H16 as mining fleet reaches 6 years in operation
6
4 8
3 21
178 172
2821
FY15 Inflation Costescalation
Miningvolume
Productionvolume
Deferred stripping 1H16
R/t
Unit cash cost Impact of deferred stripping on unit cash cost
206
193
22
+2% (5%)
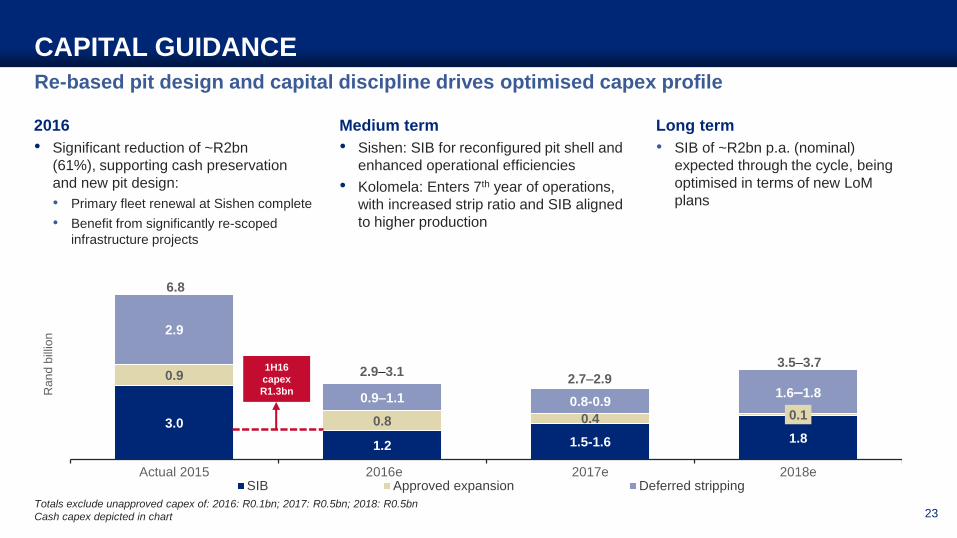
3.0
1.2 1.5-1.6 1.8
0.9
0.8 0.4 0.1
2.9
0.9–1.1 0.8-0.91.6–1.8
Actual 2015 2016e 2017e 2018e
Ran
d b
illio
n
SIB Approved expansion Deferred stripping
Re-based pit design and capital discipline drives optimised capex profile
CAPITAL GUIDANCE
Totals exclude unapproved capex of: 2016: R0.1bn; 2017: R0.5bn; 2018: R0.5bn
Cash capex depicted in chart
2016
• Significant reduction of ~R2bn
(61%), supporting cash preservation
and new pit design:
• Primary fleet renewal at Sishen complete
• Benefit from significantly re-scoped
infrastructure projects
Long term
• SIB of ~R2bn p.a. (nominal)
expected through the cycle, being
optimised in terms of new LoM
plans
Medium term
• Sishen: SIB for reconfigured pit shell and
enhanced operational efficiencies
• Kolomela: Enters 7th year of operations,
with increased strip ratio and SIB aligned
to higher production
2.7–2.9
6.8
3.5–3.72.9–3.11H16
capex
R1.3bn
23

Net cash position of R548m
STRENGTHENED BALANCE SHEET
24
(7,929)
(6,062)
(4,604)
548
Dec-14 Jun-15 Dec-15 Jun-16
Net (debt)/cash (Rm)Rm
6 months
30 Jun 2016
6 months
30 Jun 2015
12 months
31 Dec 2015
Net cash/(debt) 548 (6,062) (4,604)
Total equity 29,114 27,453 25,167
Net debt:EBITDA N/A 14 0.39
Interest cover (times) 16 14 4
Net debt/equity (%) N/A 22 18
Net debt/market capitalisation (%) N/A 12 35
Committed debt facilities 16,500 16,500 16,500
Net financial guarantees to DMR 2,371 1,852 1,852

OUTLOOK
Contingent tax liability
• Objection to the assessment lodged on 18 July 2016
• SARS granted suspension pending further engagement
• Field audit covering 2011 to 2013 years of assessment in progress
21.4% Sishen Mining Right
• Awaiting response from DMR
REGULATORY UPDATE
26
Ongoing engagement with authorities
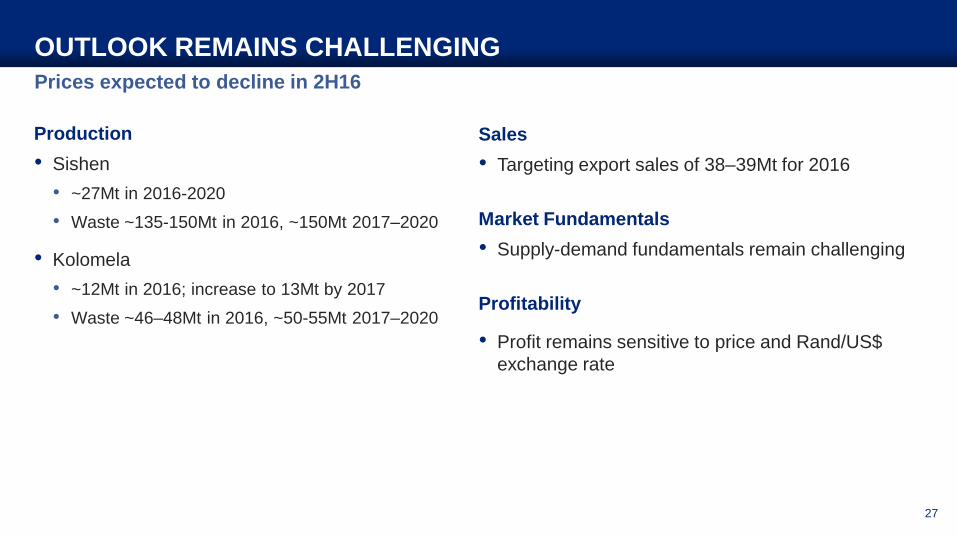
Prices expected to decline in 2H16
OUTLOOK REMAINS CHALLENGING
Production
• Sishen
• ~27Mt in 2016-2020
• Waste ~135-150Mt in 2016, ~150Mt 2017–2020
• Kolomela
• ~12Mt in 2016; increase to 13Mt by 2017
• Waste ~46–48Mt in 2016, ~50-55Mt 2017–2020
Sales
• Targeting export sales of 38–39Mt for 2016
Market Fundamentals
• Supply-demand fundamentals remain challenging
Profitability
• Profit remains sensitive to price and Rand/US$
exchange rate
27
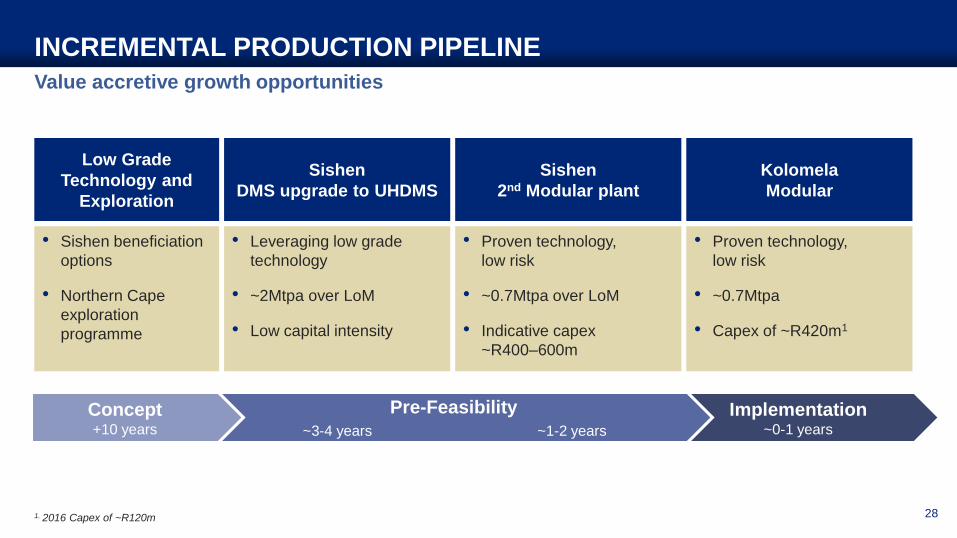
Implementation~0-1 years
Pre-Feasibility
~3-4 years ~1-2 years
Value accretive growth opportunities
INCREMENTAL PRODUCTION PIPELINE
28
Low Grade
Technology and
Exploration
• Sishen beneficiation
options
• Northern Cape
exploration
programme
Concept+10 years
Sishen
DMS upgrade to UHDMS
• Leveraging low grade
technology
• ~2Mtpa over LoM
• Low capital intensity
Sishen
2nd Modular plant
• Proven technology,
low risk
• ~0.7Mtpa over LoM
• Indicative capex
~R400–600m
Kolomela
Modular
• Proven technology,
low risk
• ~0.7Mtpa
• Capex of ~R420m1
1. 2016 Capex of ~R120m
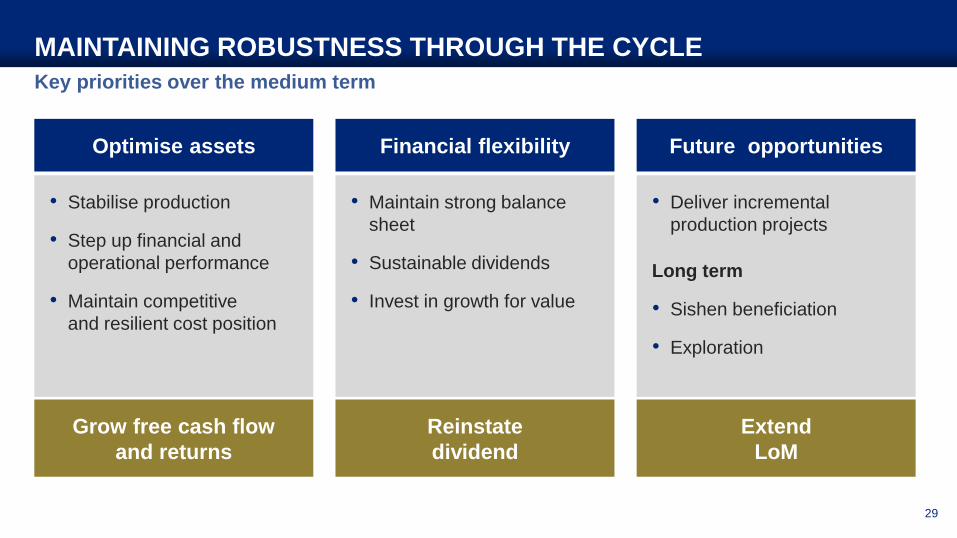
Key priorities over the medium term
MAINTAINING ROBUSTNESS THROUGH THE CYCLE
29
Grow free cash flow
and returns
Reinstate
dividend
Extend
LoM
• Stabilise production
• Step up financial and
operational performance
• Maintain competitive
and resilient cost position
• Maintain strong balance
sheet
• Sustainable dividends
• Invest in growth for value
• Deliver incremental
production projects
Long term
• Sishen beneficiation
• Exploration
Optimise assets Financial flexibility Future opportunities
THANK YOU

ANNEXURES

6 months
30 Jun 2016
6 months
30 Jun 2015 % change
6 months
31 Dec 2015 % change
Export (Rm) 15,412 16,823 (8%) 12,748 21%
Tonnes sold (Mt) 18.1 23.2 (22%) 20.3 (11%)
US Dollar per tonne 55 61 (10%) 46 20%
Rand per tonne 851 725 17% 625 36%
Domestic (Rm) 1,728 2,069 (16%) 1,086 59%
Tonnes sold (Mt) 2.1 2.8 (25%) 1.5 40%
Rand per tonne 823 739 11% 724 14%
Shipping operations (Rm) 1,042 1,577 (34%) 1,835 (43%)
Total revenue 18,182 20,469 (11%) 15,669 16%
Rand/US Dollar exchange rate 15.40 11.91 29% 12.34 25%
Revenue: Sector analyses
ANNEXURE 1
32

Rm
6 months
30 Jun 2016
6 months
30 Jun 2015 % change
6 months
31 Dec 2015 % change
Cost of goods sold 8,733 9,938 (12%) 8,224 6%
Cost of goods produced 7,123 8,254 (14%) 8,287 (14%)
Production costs 7,353 8,531 (14%) 8,396 (12%)
Sishen mine 5,527 6,115 (10%) 6,661 (17%)
Kolomela mine 1,631 1,823 (11%) 1,544 6%
Thabazimbi mine 187 551 (66%) 145 29%
Other 8 42 (81%) 46 (83%)
Inventory movement WIP (230) (277) 17% (109) (111%)
A grade 2 (336) 101% (32) 106%
B grade (232) 59 (493%) (77) (201%)
Inventory movement finished product 959 1,238 (23%) 84 1,042%
Corporate support and studies 508 648 (22%) 506 66%
Forex, non-cash and other 143 (202) 171% (653) 122%
Mineral royalty 248 96 158% 95 161%
Impairment charge 4 - 100% 5,978 (100%)
Selling and distribution 2,674 2,891 (8%) 2,615 2%
Shipping operations 1,317 1,774 (26%) 1,883 (30%)
Operating expenses 12,976 14,699 (12%) 18,795 (31%)
Aggregate operating expenditure
ANNEXURE 2
33

1H1612 months
31 Dec 2015
12 months
31 Dec 2016
12 months
31 Dec 2017
12 Months
31 Dec 2018
Rm Medium term forecast
Approved expansion 340 870 800 400 100
Deferred stripping 466 2,852 900–1,100 800–900 1,600–1,800
Sishen 340 2,508 700–800 600–700 1,300–1,400
Kolomela 126 344 200–300 200 300–400
SIB Sishen 375 2,418 900 900–1,000 1,100
SIB Kolomela 113 612 300 600 700
Total approved capital expenditure 1,294 6,752 2,900–3,100 2,700–2,900 3,500–3,700
Unapproved expansion1 - - 100 500 500
Total approved and unapproved
capital expenditure1,294 6,752 3,000–3,200 3,200–3,400 4,000–4,200
Capital expenditure analyses
ANNEXURE 3
1. Unapproved capex includes high-level estimates for the incremental production pipeline
All guidance based on current forecast exchange rates
Cash capex depicted in table 34

(79.9)(29.5) (28.5) (21.4)
59.7 67.234.7 26.9
9.2 10.1
3.2 3.4
17.9 15.5
13.2 11.3
101.1 73.0
66.9 57.9
63.8
47.6
26.7 21.3
54.4
47.0
21.4 24.6
84.6
96.0
40.1 47.5
Sishen mineFY15
Sishen mine1H16
Kolomela mineFY15
Kolomela mine1H16
Deferred stripping Other Energy Drilling and blasting Outside services Fuel Maintenance Labour
310.8
326.9
177.7171.5
Sishen and Kolomela mines’ unit cash cost structure (R/t)
ANNEXURE 4
35

15 19 15 13
23
2 25
46 6
26 21 3330
16 13
1311
1413
1113
22 2720 25
Sishen mineFY15
Sishen mine1H16
Kolomela mineFY15
Kolomela mine1H16
Other Energy Drilling and blasting Maintenance Outside services Fuel Labour
Sishen and Kolomela mines’ unit cash cost structure before deferred stripping (%)
ANNEXURE 5
36
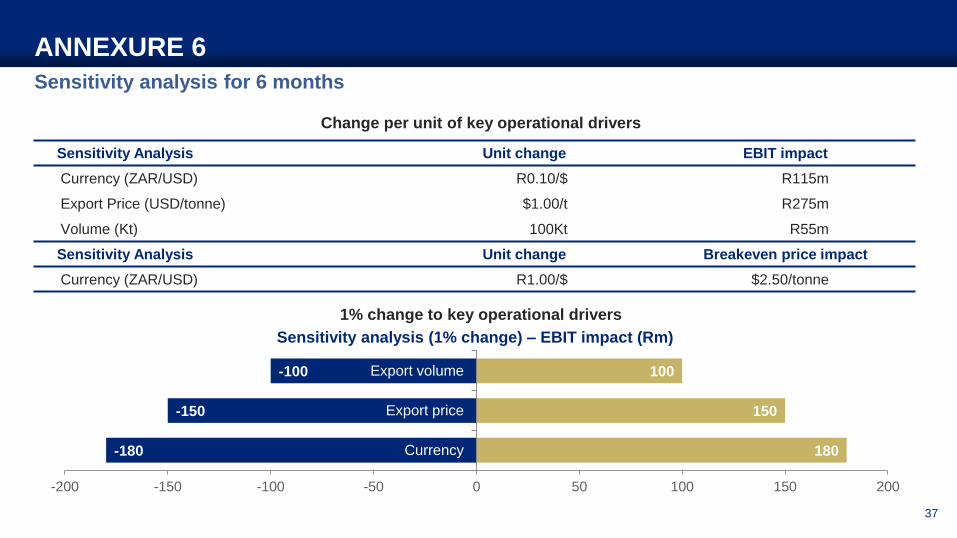
Sensitivity analysis for 6 months
ANNEXURE 6
Sensitivity Analysis Unit change EBIT impact
Currency (ZAR/USD) R0.10/$ R115m
Export Price (USD/tonne) $1.00/t R275m
Volume (Kt) 100Kt R55m
Sensitivity Analysis Unit change Breakeven price impact
Currency (ZAR/USD) R1.00/$ $2.50/tonne
-180
-150
-100
180
150
100
-200 -150 -100 -50 0 50 100 150 200
Currency
Export price
Export volume
Sensitivity analysis (1% change) – EBIT impact (Rm)
Change per unit of key operational drivers
1% change to key operational drivers
37