driving change: a national study of candian nonprofit ... · pdf file4 table of contents...
TRANSCRIPT

1
Driving Change: A National Study of Canadian Nonprofit Executive Leaders

2
The HR Council takes action on nonprofit labour force issues.
As a catalyst, the HR Council sparks awareness and action on labour force issues. As a convenor, we bring together people, information and ideas in the spirit of collaborative action. As a research instigator we are building knowledge and improving our understanding of the nonprofit labour force.
© 2012 HR Council for the Nonprofit Sector
Copyright is waived for charitable and nonprofit organizations for non-commercial use, with attribution. All other rights reserved.
ISBN: 978-1-926754-09-3
Aussi disponible en français
201-291 Dalhousie Street | Ottawa, Ontario K1N 7E5 t: 613.244.8332 | tf: 866.594.8332 | f: 613.241.2252 www: hrcouncil.ca | Twitter: @HR_Council
The HR Council is funded by the Government of Canada’s Sector Council Program. The opinions and interpretations in this publication are those of the author and do not necessarily reflect those of the Government of Canada.

3
GlobeScan’s mission is to be the world’s centre of excellence for global public opinion, customer, and stakeholder research and for evidence-based strategic counsel.
We deliver research-based insight to companies, governments, multilaterals and NGOs in pursuit of a prosperous and sustainable world.
The survey questions and results reported herein are provided on a confidential basis to the Client. The Client is free to use the findings in whatever manner it chooses, including releasing them to the public or media.
GlobeScan Incorporated subscribes to the standards of the World Association of Opinion and Marketing Research Professionals (ESOMAR). ESOMAR sets minimum disclosure standards for studies that are released to the public or the media. The purpose is to maintain the integrity of market research by avoiding misleading interpretations. If you are considering the dissemination of the findings, please consult with us regarding the form and content of publication. ESOMAR standards require us to correct any misinterpretation.
Project: 2433, GlobeScan®
For more information, contact: James Morris, Associate Director Gwen Cottle, Associate Director
GlobeScan Incorporated 65 St. Clair Avenue East, Suite 900, Toronto, Ontario, Canada , M4T 2Y3
[email protected] [email protected]
www.GlobeScan.com

4
Table of Contents
Introduction and Methodology 6
Executive Summary 8
Key Finding 1: 12 Despite many challenges, executive directors report high levels of satisfaction with their job
Key Finding 2: 15 Within four years, over half of executive directors say they will leave their current position
Key Finding 3: 19 The support provided by the board is an important driver of executive director satisfaction and retention
Key Finding 4: 26 Executive directors get the least support for the most challenging tasks
Key Finding 5: 29 Many executive directors are dealing with high levels of stress

5
Table of Contents (cont.)
Key Finding 6: 35 Just four in ten nonprofit leaders say they are most likely to remain in the sector when they leave their current role
Key Finding 7: 37 The mission of the organization and the ability to make a difference are the key motivators for leaders to work in the sector
Key Finding 8: 40 Remuneration is not the top motivator for working in the sector, but it is important for retaining leaders
Key Finding 9: 44 Leadership skills are the most important attributes that prospective executive directors need to possess
Appendix 46 Respondent profiles

6
Introduction and Methodology
The HR Council for the Nonprofit Sector is asking an important question: Is there a leadership deficit? As the HR Council points out, there have been several Canadian and American studies conducted that highlight concerns about leadership success, and where the future leaders of nonprofits will come from. They highlight that there are many questions about the executive director occupation, but there has been very little evidence to either confirm the existence of the issue, or build strategies to address the problem. To provide this necessary information, the HR Council wished to understand more about the people currently occupying the executive director or equivalent role within Canada’s nonprofits. GlobeScan was selected to conduct a research project among both executive directors and nonprofit boards, to examine current perceptions of the executive director role in order to understand the key leadership challenges of note for the sector as a whole. Two online surveys were conducted:
Executive Director Survey: The HR Council provided GlobeScan with contact details of nonprofit leaders drawn from various lists they hold internally. Each contact with a valid email address was asked to take part in the research online. The survey link was also advertised on the HR Council’s website and in other communications to its stakeholders. Only executive directors or their equivalent were asked to take part in the research.
In total, 1,251 nonprofit leaders completed the survey. The research was conducted between September 28 and November 2, 2011. A random representative sample could not be conducted for this research (as the universe is unknown) and therefore the results should not be viewed as covering a statistically representative sample of the nonprofit sector.
Unless otherwise stated the n size for all charts showing the Executive Director survey results is 1,251.
7
Introduction and Methodology
Board Member Survey: The HR Council provided GlobeScan with contact details of a small number of board chairs and members drawn from various lists they hold internally. Each contact with a valid email address was asked to take part in the research online. The survey link was also advertised on the HR Council’s website and in other communications to its stakeholders. Moreover, the executive directors who were invited to take part in the research were also asked to forward a link for the board member survey to a board member who had the most involvement in the hiring of the executive director.
From all contact methods only board members who had been involved in the hiring of their executive directors were asked to take part in the research. In total, 231 nonprofit leaders completed the survey. The research was conducted between September 28 and November 2, 2011.
Unless otherwise stated the n size for all charts showing the board member survey results is 231.
8
Executive Summary
Key Finding 1: Despite many challenges, executive directors report high levels of satisfaction with their job. • Excluding salary as a factor, eight in ten executive directors are completely or fairly satisfied with
their current job role.
• Satisfaction is relatively high when examined in conjunction with a number of other key perceptions. For example, those executive directors who are experiencing a high level of stress are less satisfied than those experiencing low levels of stress. However, executive directors who report that they are experiencing considerable stress are still reporting fairly high levels of job satisfaction.
• Therefore, despite the fact that the remaining key findings in this report highlight some significant challenges faced by executive directors, most still appear to like their jobs.
Key Finding 2: Within four years, over half of executive directors say they will leave their current position. • Both the board members and executive directors surveyed have a very similar perspective on how
long executive directors will stay in the role.
• While few executive directors say they are likely to leave their current position within a year (13%), a total of 55 per cent of those interviewed indicate that they could leave their current role within four years.
• Despite recognizing that their executive director could leave their organization in the near future, most board members say that their nonprofit does not have a succession plan in place.

9
Executive Summary
Key Finding 3: The support provided by the board is an important driver of executive director satisfaction and retention. • Many executive directors are not satisfied with the overall support and direction they receive from
their board, and also do not feel highly supported by their board of directors for many key tasks.
• While one-half feel well supported in strategic planning (54%) and financial management (50%), few executive directors feel supported by their board for such key tasks as marketing and fundraising/development (20% and 28%, respectively).
• Board support has a clear relationship to overall job satisfaction. Where executive directors feel less supported for each of the key tasks included in the survey, significantly lower levels of job satisfaction exist.
Key Finding 4: Executive directors get the least support for the most challenging tasks. • Executive directors highlight a number of key tasks that they find the most challenging, including
fundraising and development, marketing, and program evaluation.
• It is for these most challenging tasks that executive directors say they are receiving the least amount of support from their board.

10
Executive Summary
Key Finding 5: Many executive directors are dealing with high levels of stress. • Nearly half of executive directors are experiencing levels of day-to-day stress that are excessive or
approaching excessive, and those with higher levels of stress are more likely to indicate they will leave their current job earlier than those with lower levels of stress.
• The amount of hours worked in an average week has a clear relationship with the level of stress felt by executive directors. Over one-half (52%) of executive directors work more than 45 hours in an average week, with a sixth (17%) working more than 50 hours. For a majority of those who work fewer than 45 hours a week, the level of stress is relatively low.
Key Finding 6: Just four in ten nonprofit leaders say they are most likely to remain in the sector when they leave their current role. • While a quarter of executive directors indicate that they are most likely to retire when they leave
their current role, the high level of likely attrition from the sector is significant (just 39% indicate they are most likely to stay in the sector).

11
Executive Summary
Key Finding 7: The mission of the organization and the ability to make a difference are the key motivators for leaders to work in the sector. • Making a positive difference to society and the community is the biggest motivator for working in
the nonprofit sector.
• More than the responsibilities of the role, it is the mission of the organization that is the biggest motivator for executive directors.
Key Finding 8: Remuneration is not the top motivator for working in the sector, but it is important for retaining leaders. • One-half (49%) of executive directors say they are making a personal financial sacrifice to work in
their current job in the nonprofit sector. The strongest sense of this are among those executive directors who are earning less than $50,000.
• There is a higher sense of personal financial sacrifice among those who indicate they are only likely to remain in their position for up to two more years.
Key Finding 9: Leadership skills are the most important attribute that prospective executive directors need to possess. • Board members and executive directors agree that leadership skills are the most fundamental
attribute that nonprofit leaders should possess.

12
Key Finding 1: Despite many challenges, executive directors report high levels of satisfaction with their job

13
Driving Change: A National Study of Nonprofit Executive Leaders
The executive directors in this survey report a high level of satisfaction with their current job. Very few report being dissatisfied in any way. Most executive directors, despite the many challenges they face, say they like their jobs. This high level of satisfaction is consistent across demographic factors including gender and age. Satisfaction also remains consistently high across executive directors from different types of organizations; for example, a similar high level of satisfaction is recorded among executive directors
Overall Satisfaction
Excluding salary as a factor, eight in ten executive directors are completely or fairly satisfied with their current job role.
39 41 16 2
Completely satisfied (10+9)
(8+7) (6+5+4) (3+2) Completely dissatisfied (1+0)
DK/NA
from both large and small organizations, and from organizations with diverse operational areas. Likewise, those executive directors new to their position report a similar (if a little lower) level of satisfaction to those who have been in their positions longer. On the next page, executive directors’ overall satisfaction is examined in conjunction with four other key perceptions and experiences measured in the research. Although some executive director’s experience has left them less satisfied, the overall levels of satisfaction remain fairly high. However, this fairly high level of overall satisfaction does not mean an absence of challenges for the sector. Indeed, as the charts on the following slide show, there are some crucial leadership challenges facing the sector, including board support, leadership retention, and stress levels. The remainder of the key findings included in this report explore these challenges in detail.
All executive directors, 2011
Q. Excluding salary and benefits, please rate your overall satisfaction with your current job.

14
Driving Change: A National Study of Nonprofit Executive Leaders
Each chart shows the mean overall satisfaction score which used an 11-point scale (0–10).
Overall Satisfaction
Despite significant difficulties and areas of dissatisfaction, the overall level of job satisfaction remains fairly high.
8.4
7.0
Satisfied with board support and advice**
Dissatisfied with board support and
advice*
8.7
8.0
7.6
6.7
Little stress
Some stress
Significant stress
Excessive stress
8.3 8.0
7.6 7.0 6.9
Retire
Nonprofit
Self-employed
Private sector
Public sector
6.8 7.3
8.1 8.3 8.7
One year or less
Two years
Three to four years
Five to seven years
Eight or more
By predicted time of leaving current job, 2011 By satisfaction with board advice and support, 2011
Q. Excluding salary and benefits, please rate your overall satisfaction with your current job.
By most likely destination when leaving current role, 2011 By level of day-to-day stress, 2011
*0–6 on 11-point scale **7–10 on 11-point scale

15
Key Finding 2: Within four years, over half of executive directors say they will leave their current position

16
Driving Change: A National Study of Nonprofit Executive Leaders
Both the board members and executive directors surveyed have a very similar perspective on how long executive directors will stay in the role. While few executive directors say they are likely to leave their current position within a year, in total 55% of those interviewed indicate that they could leave their current role within four years. Significantly for the sector, it is not just those executive directors who have been in their positions for a long time who are considering leaving soon. Many executive directors who have been in their role for a shorter time also indicate they could leave in the near future.
Twenty-nine per cent of executive directors who have been in their position for less than two years say they are only likely to be in their position for another two years or less. This figure rises to 39 per cent for those who have been in their position for between two and five years.
7%
6%
17%
24%
18%
8%
5%
13%
5%
4%
18%
30%
21%
6%
7%
7%
Less than a year
One year
Two years
Three to four years
Five to seven years
Eight to ten years
Ten years or more
DK/NA
Executive Directors
Board members
Retention
Within four years over one-half of executive directors say they will leave their current position.
Q. Although the future is hard to predict, how much longer do you think you will stay in your current position?
Q. Although the future is hard to predict, how much longer do you think the current executive director of your nonprofit will remain in the position?
All executive directors, 2011

17
Driving Change: A National Study of Nonprofit Executive Leaders
Board members were asked to rate a number factors that may or may not be challenges to retaining the executive director of their organization. Just over one-half (52%) rate the level of compensation that can be offered as a significant challenge to the retention of their executive director. The next biggest challenge is the level of stress associated with the role, followed by the ability to ensure the executive director has a good work-life balance. These three factors have a clear relationship to the satisfaction and retention of executive directors. The perceptions of executive directors on these issues is detailed in other key findings sections of this report.
Retention
Board members see the level of compensation that they can offer as the biggest challenge to retaining executive directors.
52%
39%
29%
23%
23%
20%
20%
13%
The level of compensation that can be offered
The level of stress associated with the role
Being able to ensure a good work-life balance
The ability to offer career development opportunities
The opportunities the Executive Director has to grow and develop
the organization
Competition from other nonprofit organizations
Competition from the private sector
The ability to offer training
Q. To what extent, if at all, are the factors listed below a challenge to the retention of executive directors of the organization?
Percentage ‘some challenge’ (7+8+9+10 on 11-point scale), all board members, 2011

18
Driving Change: A National Study of Nonprofit Executive Leaders
With so many executive directors indicating that they are likely to leave their role within the next four years—and a recognition from board members of this timescale—it is significant that such a high proportion of board members say that their organization does not have a plan in place to deal with the loss of their executive director (see chart below left). Moreover, the experience of having to find a new leader is not uncommon, with 48 per cent of board members saying that their organization has had three or more executive directors in the last ten years. While a higher proportion of organizations have an emergency succession plan in place for who will run the organization in the absence of an executive director, only one-half of board members surveyed indicate this is in place (see chart below right). “There is no succession planning happening at a senior level. When leaders leave, all the knowledge leaves.” – Executive Director, community development nonprofit.
Succession Planning
Most board members say that their nonprofit does not have a succession plan in place for the position of executive director.
Yes 52
No 45
Don't know
3 Yes 25
No 72
Don't know
3
All board members, 2011 All board members, 2011
Q. Does the board of the organization have a succession plan in place for the position of executive director?
Q. Does the board of the organization have an emergency succession plan in place for who will run the organization in the absence of an executive director?

19
Key Finding 3: The support provided by the board is an important driver of executive director satisfaction and retention

20
Driving Change: A National Study of Nonprofit Executive Leaders
Executive directors were asked to rate their level of satisfaction with a number of key attributes of their job role. As the chart shows, compared to most other attributes, there is a lower level of satisfaction with the support and direction provided by the board of directors. This remains consistent across many key organizational demographics. For instance, the level of satisfaction with board support and direction is similar regardless of organization size. Executive directors from the smallest organizations (those with less than $50k in annual revenue) have a similar perception about their board as their peers in the largest organizations (those with annual revenues of $1m or more).
Moreover, there are no significant differences between the types of organizations that executive directors are leading. For example, the level of satisfaction with board support and direction is very similar when comparing the views of leaders of health and medical nonprofits with those of the leaders of arts and culture nonprofits.
88%
88%
87%
86%
75%
74%
57%
53%
47%
41%
Ability to have a positive impact on the cause
Ease of fitting into the culture of the organization
Flexibility of working practices/ conditions
Ability to influence the direction of your organization
Clarity of your responsibilities
Opportunities to grow and develop in the role
Support and advice provided by the board of directors
Ability to achieve a good work-life balance
Strategic direction provided by the board of directors
Resources available to do effective job
Board Support
Many executive directors are not satisfied with the overall support and direction they receive from their board.
Q. Rate your satisfaction with the following elements of your current job.
Percentage ‘satisfied,’* all executive directors, 2011
*7+8+9+10 on 11-point scale

21
Driving Change: A National Study of Nonprofit Executive Leaders
For many key tasks and responsibilities, executive directors do not believe they are being well supported by their boards. One-half feel well supported in strategic planning (54%) and financial management (50%). However, for such key tasks as marketing and fundraising/development, few executive directors feel supported by their board.
While the level of support is never high, executive directors from the smallest nonprofits (less than $50,000) feel relatively more supported by their board than peers from larger nonprofits. This is most significant for fundraising and development, marketing, external communications, and program evaluation. “Most boards do not understand their governance role and do not feel they are responsible to help with fundraising.” – Executive Director, education nonprofit.
54%
50%
41%
40%
34%
30%
28%
28%
20%
Strategic planning
Financial management / budgeting
Human Resources
Program/policy development
Stakeholder/partner relations
Program evaluation
External communications / media
Fundraising/development
Marketing
Board Support
For many key tasks, executive directors do not feel highly supported by their board of directors.
Q. Please rate the level of support the board of directors provides you in each of the following areas.
*7+8+9+10 on 11-point scale
Percentage ‘supportive,’* all executive directors, 2011

22
Driving Change: A National Study of Nonprofit Executive Leaders
There is a clear relationship between the level of support executive directors perceive they get from their board, and the level of overall satisfaction they have with their current role. Those executive directors who indicate that they are currently satisfied with their current job role feel significantly more supported by their boards, compared to those who are not satisfied with their overall job role. However, it is important to note that the level of reported board support, even among those who feel satisfied with their overall job role is still quite low, particularly for fundraising/development and marketing. “I have a very supportive board, who support me at the right level. They are definitely involved in fundraising.” – Executive Director, medical nonprofit
Board Support
Where executive directors feel less supported, lower levels of job satisfaction exist.
6.8
6.5
5.9
5.9
5.5
5.1
5
5
4.5
5.1
4.8
4.3
4.1
4
3.4
3.7
3.5
3.3
Strategic planning
Financial management / budgeting
Human Resources
Program/policy development
Stakeholder/partner relations
Program evaluation
External communications / media
Fundraising/development
Marketing
Satisfied Not satisfied Overall job satisfaction
Q. Please rate the level of support the board of directors provides you in each of the following areas.
Mean score (11-Point Scale), by overall job satisfaction, 2011

23
Driving Change: A National Study of Nonprofit Executive Leaders
While a causal relationship cannot be established here, those executive directors who feel their nonprofit was more successful over the past year also feel more supported by their board across all key tasks and responsibilities. The largest gaps between those that say they were very successful and those that say they were less successful exist for ‘strategic planning’ and ‘financial management / budgeting.’ “Most of my board are invisible in terms of support. This is true of many boards I see. They want to be seen to be doing something good for the community, and will attend the board meeting, but after that it stops.” – Executive Director, community development nonprofit.
Board Support
Where executive directors feel more supported, there is also a feeling of greater organizational success.
7.2
6.9
6.2
6.2
5.9
5.4
5.4
5.2
4.7
6.5
6.1
5.5
5.5
5.1
4.8
4.6
4.7
4.2
5.5
5.3
5.0
4.9
4.4
4.0
4.2
4.0
3.8
Strategic planning
Financial management / budgeting
Human Resources
Program/policy development
Stakeholder/partner relations
Program evaluation
External communications / media
Fundraising/development
Marketing
Very successful (9+10) Successful (6+7+8) Less successful (≤5) Organizational success in past 12 months
Q. Please rate the level of support the board of directors provides you in each of the following areas.
Mean score (11-Point Scale), by organizational success, 2011

24
Driving Change: A National Study of Nonprofit Executive Leaders
The results clearly show that among those executive directors who are likely to leave their position within the next few years, the level of support they say they are receiving from their board is significantly lower than those who indicate they will remain in their positions for a longer period of time; particularly those who are likely to stay in their role for five years or more. However, this does not mean that those executive directors who indicate they will remain in their role for longer are necessarily happy with the level of support they receive from their board. Their scores are comparatively higher, but still relatively low.
Board Support
Among those executive directors who are likely to leave their position in the near future, there is a perception that their board is less supportive.
1 year or less
2 years
3–4 years
5–7 years
8 + years
Strategic planning 6.1 6.5 6.5 6.8 7.0
Financial management / budgeting 5.5 6.0 6.3 6.6 6.5
Human resources 5.1 5.6 5.5 6.0 6.0
Program / policy development 4.9 5.4 5.7 5.8 6.1
Stakeholder relations 4.7 5.3 5.3 5.3 5.5
Program evaluation 4.1 4.6 4.7 5.0 5.4
External communications 4.0 4.7 4.8 4.8 5.3
Fundraising / development 3.9 4.6 4.7 4.8 5.3
Marketing 3.8 4.3 4.2 4.3 4.7
Q. Please rate the level of support the board of directors provides you in each of the following areas.
Mean score (11-Point Scale), by predicted time of leaving current Job, 2011
Figure is statistically significantly higher than the results of those executive directors likely to leave in a year or less
25
Driving Change: A National Study of Nonprofit Executive Leaders
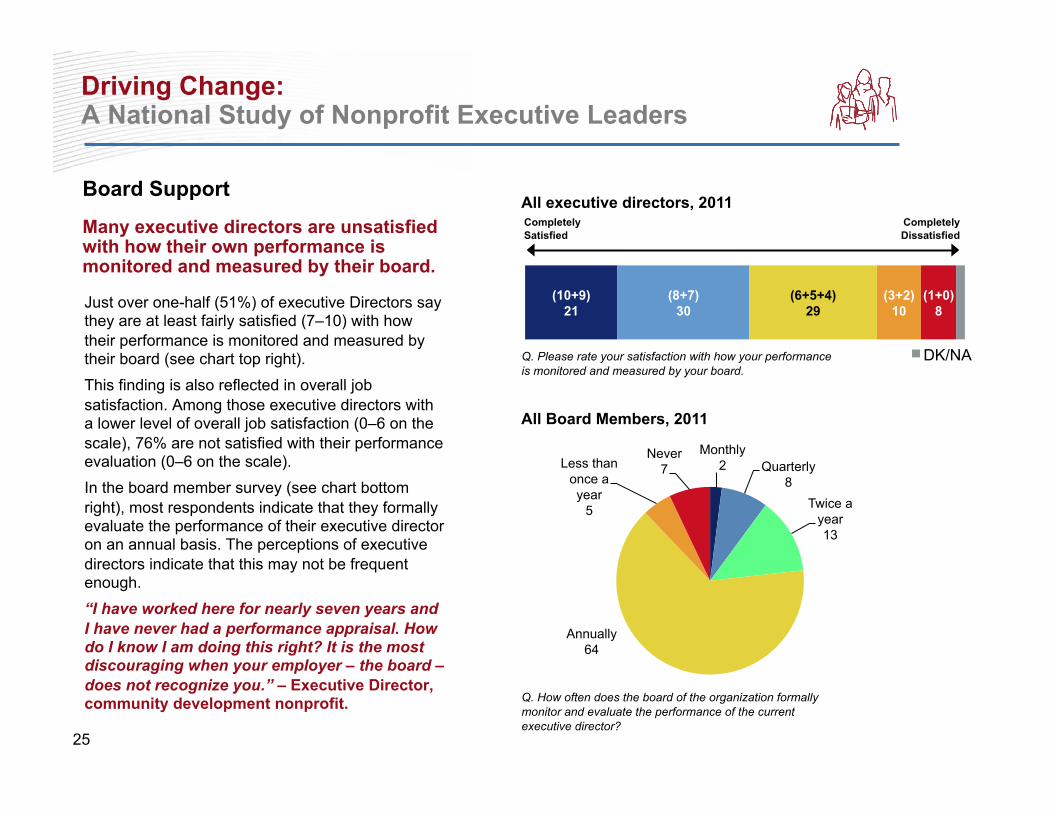
Just over one-half (51%) of executive Directors say they are at least fairly satisfied (7–10) with how their performance is monitored and measured by their board (see chart top right). This finding is also reflected in overall job satisfaction. Among those executive directors with a lower level of overall job satisfaction (0–6 on the scale), 76% are not satisfied with their performance evaluation (0–6 on the scale). In the board member survey (see chart bottom right), most respondents indicate that they formally evaluate the performance of their executive director on an annual basis. The perceptions of executive directors indicate that this may not be frequent enough. “I have worked here for nearly seven years and I have never had a performance appraisal. How do I know I am doing this right? It is the most discouraging when your employer – the board – does not recognize you.” – Executive Director, community development nonprofit.
Board Support
Many executive directors are unsatisfied with how their own performance is monitored and measured by their board.
(10+9) 21
(8+7) 30
(6+5+4) 29
(3+2) 10
(1+0) 8
DK/NA
Completely Satisfied
Completely Dissatisfied
Monthly 2 Quarterly
8 Twice a
year 13
Annually 64
Less than once a year
5
Never 7
Q. Please rate your satisfaction with how your performance is monitored and measured by your board.
All executive directors, 2011
All Board Members, 2011
Q. How often does the board of the organization formally monitor and evaluate the performance of the current executive director?

26
Key Finding 4: Executive directors get the least support for the most challenging tasks
27
Driving Change: A National Study of Nonprofit Executive Leaders
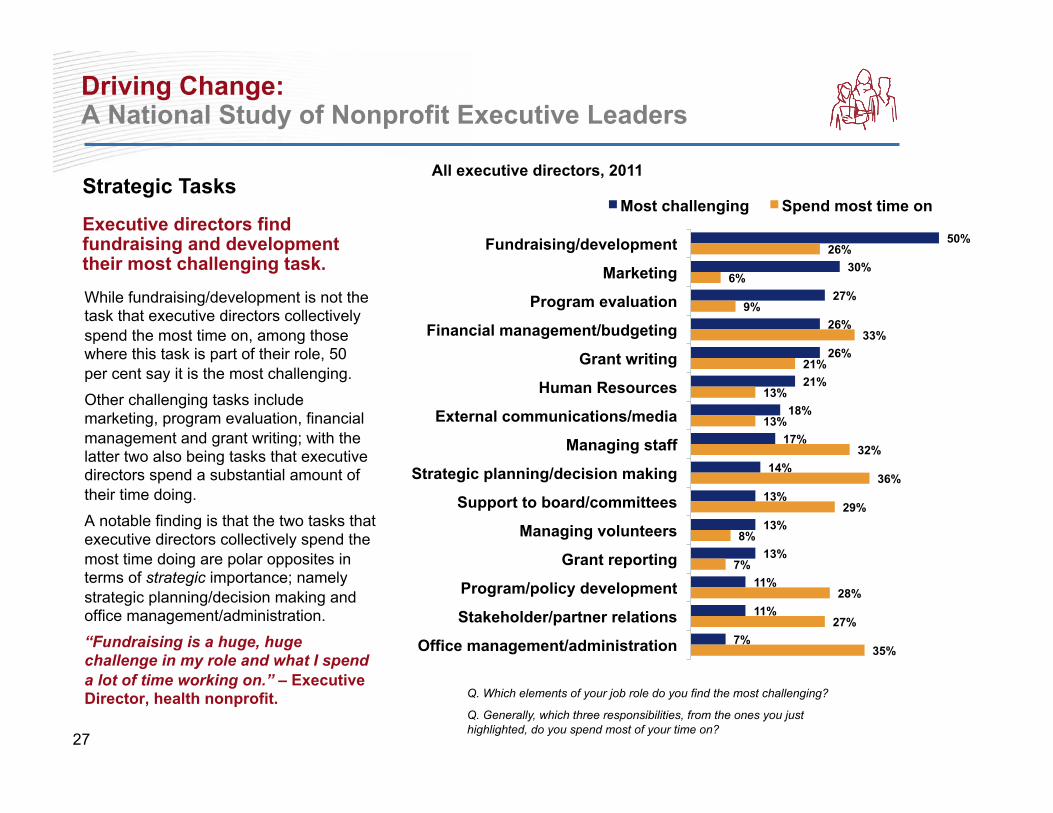
While fundraising/development is not the task that executive directors collectively spend the most time on, among those where this task is part of their role, 50 per cent say it is the most challenging. Other challenging tasks include marketing, program evaluation, financial management and grant writing; with the latter two also being tasks that executive directors spend a substantial amount of their time doing. A notable finding is that the two tasks that executive directors collectively spend the most time doing are polar opposites in terms of strategic importance; namely strategic planning/decision making and office management/administration. “Fundraising is a huge, huge challenge in my role and what I spend a lot of time working on.” – Executive Director, health nonprofit.
Strategic Tasks
Executive directors find fundraising and development their most challenging task.
50%
30%
27%
26%
26%
21%
18%
17%
14%
13%
13%
13%
11%
11%
7%
26%
6%
9%
33%
21%
13%
13%
32%
36%
29%
8%
7%
28%
27%
35%
Fundraising/development
Marketing
Program evaluation
Financial management/budgeting
Grant writing
Human Resources
External communications/media
Managing staff
Strategic planning/decision making
Support to board/committees
Managing volunteers
Grant reporting
Program/policy development
Stakeholder/partner relations
Office management/administration
Most challenging Spend most time on
Q. Generally, which three responsibilities, from the ones you just highlighted, do you spend most of your time on?
All executive directors, 2011
Q. Which elements of your job role do you find the most challenging?

28
Driving Change: A National Study of Nonprofit Executive Leaders
Fundraising and development is the task that executive directors find the most challenging. This is also a task for which they report receiving low levels of board support. Marketing is also in a similar position; executive directors find it a significant challenge for which they receive little support. While the data cannot prove a causal relationship between these two perceptions, it is clear that where boards are providing the most support, for example with strategic planning, executive directors find these tasks the least challenging. “I get very little support from my board for fundraising. You mention fundraising to the board and everyone looks at the floor. They are uncomfortable with it. They feel if they have given their time as a board member, they shouldn’t be expected to fundraise as well.” – Executive Director, health nonprofit
Strategic Tasks
Executive directors get the least amount of support from their board for some of the most challenging tasks.
Task
Cha
lleng
e
Level of Board Support*
Fundraising / development
Marketing
Program evaluation Financial management / budgeting
Human resources
External communications / media
relations Strategic planning / decision making
Program / policy development
Stakeholder / partner relations
All executive directors, 2011
Q. Which elements of your job role do you find the most challenging?
Q. Please rate the level of support the board of directors provides you in each of the following areas.
*7+8+9+10 on 11-point scale

29
Key Finding 5: Many executive directors are dealing with high levels of stress

30
Driving Change: A National Study of Nonprofit Executive Leaders
One in eight (12%) executive directors are dealing with excessive levels of day-to-day stress, with a further one-third (33%) indicating that their level of stress is high (see chart top right). Just one-seventh (14%) of executive directors indicate that they feel little or no stress in their job. Executive directors in larger organizations are more likely to be experiencing higher levels of stress than those from small nonprofits (see chart bottom right). Around one-half of all executive directors from nonprofits with budgets of $150k or higher say their stress levels are high. “There is a lot to juggle. I’d say on the stress scale, my stress is very high. There is a lot of worry about financial challenges, and need for services has grown. It is always stressful.” – Executive Director, social services nonprofit
Stress
Nearly half of executive directors are experiencing levels of day-to-day stress that are excessive or approaching excessive.
29%
34%
46%
51%
47%
50%
Less than $50,000
$50,000 to $149,999
$150,000 to $249,999
$250,000 to $499,999
$500,000 to $999,999
$1,000,000 or more
4 10 39 33 12
DK/NA
No stress Excessive stress
*7+8+9+10 on 11-point scale
Q. Please rate your day-to-day level of stress
Q. Please rate your day-to-day level of stress
All executive directors, 2011
Percentage “significant stress,”* by revenue of nonprofit, 2011

31
Driving Change: A National Study of Nonprofit Executive Leaders
While few executive directors, regardless of reported stress levels, say they are only likely to stay in their current position for a year or less, those reporting a higher level of stress are more likely to say they will leave their position earlier than those with lower stress levels.
For those with higher levels of stress, the predicted leaving time peaks at two years, whereas for those with lower stress levels the peak is later at three to four years.
Stress
Executive directors with higher levels of stress are more likely to indicate they will leave their current job earlier than those with lower levels of stress.
0
10
20
30
40
Less than a year
One year Two years Three to four years
Five to seven years
Eight to ten years
More than ten years
Little stress (0+1+2+3) Some stress (4+5+6)
Significant stress (7+8) Excessive stress (9+10)
Note: subsample excludes respondents who answered ‘Don’t know.’ Q. Please rate your day-to-day level of stress
All executive directors, predicted time of leaving current job, by stress levels, 2011
Q. Although the future is hard to predict, how much longer do you think you will stay in your current position?
Per
cent
age

32
Driving Change: A National Study of Nonprofit Executive Leaders
While the data cannot prove a causal relationship, it is clear that among those executive directors who feel the most day-to-day stress, the support they say they are getting from their board of directors is significantly lower compared to their peers who feel little or no stress. Comparatively, these latter executive directors report receiving substantially higher levels of support from their board. However, the level of support these less-stressed executive directors report receiving on some tasks is still relatively low.
Stress
Among those executive directors who feel less day-to-day stress, there is a perception that their board is more supportive.
Little stress
Some stress
Significant Stress
Excessive stress
Strategic planning 7.3 6.6 6.3 5.8 Financial management / budgeting 6.9 6.3 6.0 5.3
Program / policy development 6.6 5.6 5.5 4.2
Human resources 6.5 5.7 5.3 4.9
Stakeholder relations 6.5 5.2 5.0 4.3
Program evaluation 6.0 4.8 4.6 3.8 Fundraising / development 5.9 4.7 4.4 3.8
External communications 5.8 4.8 4.5 3.9
Marketing 5.3 4.4 4.0 3.5
Q. Please rate your day-to-day level of stress
Q. Please rate the level of support the board of directors provides you in each of the following areas.
Mean score (11-point scale), by stress levels, 2011

33
Driving Change: A National Study of Nonprofit Executive Leaders
Over one-half (52%) of executive directors work more than 45 hours in an average week, with one-sixth (17%) working more than 50 hours. The amount of hours worked in an average week correlates with the level of stress felt by executive directors. For a majority of those who work less than 45 hours a week, the level of stress is relatively low. However, as the average working week increases towards 50 hours, the stress level felt by a majority of executive directors is significantly higher. Among those who work more than 50 hours in an average week, almost two-thirds (64%) report stress levels that are excessive or approaching excessive. “It is exceedingly difficult work with high stress load and very long hours.” – Executive Director, social services nonprofit.
32
14
11
9
41
46
39
27
24
32
36
42
3
8
14
22
Less than 35 hours
35 to 44 hours
45 to 50 hours
More than 50 hours
Little Some Significant Excessive
Level of stress by average weekly working hours, 2011
Working Hours
Longer working hours correspond to higher levels of stress.
Q. Please rate your day-to-day level of stress
Q. In an average week, how many hours do you work?
All executive directors, 2011
Q. In an average week, how many hours do you work?
12 28 35 17 8
Less than 35 hours 35 to 44 hours 45 to 50 hours More than 50 hours DK/NA

34
Driving Change: A National Study of Nonprofit Executive Leaders
Work-Life Balance
The ability to achieve a good work-life balance is significantly affected by the length of the average work week.
Mean score (11-point scale), by average weekly working hours, 2011
7.4
7.1
6.0
5.0
Less than 35 hours
35 to 44 hours
45 to 50 hours
More than 50 hours
Q. Please rate your satisfaction with the ability to achieve a good work-life balance
Only one-half of executive directors (53%) say they are satisfied with their ability to achieve a good work-life balance (see page 17).
“Work-life balance and the nonprofit sector in the same sentence? I am not sure you can say that.” – Executive Director, health nonprofit The ability to maintain a good work-life balance is significantly affected by the number of hours that executive directors work. The chart to the top right indicates that the level of satisfaction that executive directors have with their ability to achieve a good work-life balance significantly declines once an average working week goes beyond 45 hours, and even more when it exceeds 50 hours.
The ability to maintain a good work-life balance also appears to be a factor tied to the likelihood of an executive director leaving their current role. The bottom right chart indicates that when compared to their peers who plan to stay in their current role longer, executive directors who are likely to leave their position within the next two years are significantly less satisfied with the ability to achieve a good work-life balance.
Mean score (11-point scale), by predicted time of leaving current job, 2011
5.8
5.7
6.4
7.0
6.8
One year or less
Two years
Three to four years
Five to seven years
More than eight years
Q. Please rate your satisfaction with the ability to achieve a good work-life balance

35
Key Finding 6: Just four in ten nonprofit leaders say they are most likely to remain in the sector when they leave their current role

36
Driving Change: A National Study of Nonprofit Executive Leaders
While a quarter of executive directors indicate that they are most likely to retire when they leave their current role, the high level of likely attrition from the sector is significant. In examining this question by age, it is no surprise that a high proportion of those aged 55 and older indicate that when they leave their current position they are likely to retire (40%). However, the results still indicate a relatively high attrition rate among younger executive directors, with 40 per cent of 18–34 year olds saying they are more likely to leave the sector than stay, 47 per cent of 35–44 year olds, and 56 per cent of 45–54 year olds (15 per cent of the latter group say they will retire). Among those who were employed in the nonprofit sector immediately prior to taking up their current role, 48 per cent say they are most likely to remain in the sector (with 21 per cent indicating they will retire). However, among those who were employed in the private sector immediately prior to joining their nonprofit, just 32 per cent say they are most likely to remain in the nonprofit sector. A fifth (20%) say they will return to the private sector (26 per cent say they will retire).
39%
24%
18%
11%
6%
2%
Nonprofit sector
Retire
Self-employed
Private sector
Public sector
DK/NA
Sector Retention
Less than four in ten executive directors indicate that when they leave their current position their next role will most likely be within the nonprofit sector.
Executive directors were asked to indicate on an 11-point scale, how likely they would be to take each of the stated options. The option with the highest rating was then selected to present the results in this chart.
All executive directors, 2011

37
Key Finding 7: The mission of the organization and the ability to make a difference are the key motivators for leaders to work in the sector

38
Driving Change: A National Study of Nonprofit Executive Leaders
The thing that attracted executive directors to the sector more than anything else is the ability to make a positive difference to society and the community through the work that they will do. “In the nonprofit sector you can have bad and good days, but unlike the private sector, at the end of a bad day when you think ‘why am I doing this again?’ you just think ‘what I do every day makes a lot of difference to people’s lives.’ And that’s a really good feeling” – Executive Director, health nonprofit. The next most mentioned reason is the ability to work for a cause that they care deeply about.
This latter reason was mentioned by a third of executive directors aged 65 or older as the reason why they joined the nonprofit sector in the first place. Only about one-fifth of other age groups indicate this as the most important reason.
Motivations
Making a positive difference to society and the community is the biggest motivator for working in the nonprofit sector. 54%
20%
12%
12%
1%
Doing work that makes a positive difference to society/
community
Having the ability to work for a cause I care deeply about
Being able to use my skills, knowledge, or education
Having the ability to focus on creating change over the long-
term
Working for an organization that does not have to make a profit
Q. We would like to understand people’s motivations for working in the nonprofit sector. Looking at the list of reasons below, please select the one that is the most important to you.
Prompted, all executive directors, 2011
39
Driving Change: A National Study of Nonprofit Executive Leaders
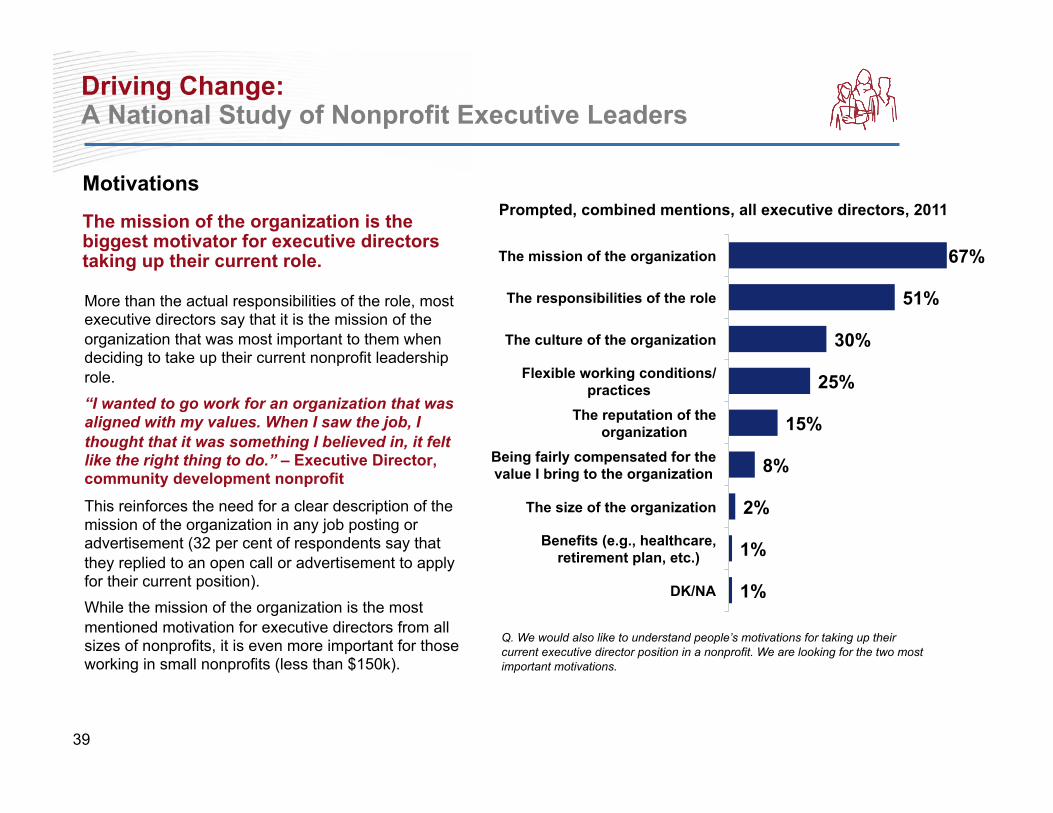
More than the actual responsibilities of the role, most executive directors say that it is the mission of the organization that was most important to them when deciding to take up their current nonprofit leadership role. “I wanted to go work for an organization that was aligned with my values. When I saw the job, I thought that it was something I believed in, it felt like the right thing to do.” – Executive Director, community development nonprofit
This reinforces the need for a clear description of the mission of the organization in any job posting or advertisement (32 per cent of respondents say that they replied to an open call or advertisement to apply for their current position). While the mission of the organization is the most mentioned motivation for executive directors from all sizes of nonprofits, it is even more important for those working in small nonprofits (less than $150k).
Motivations
The mission of the organization is the biggest motivator for executive directors taking up their current role. 67%
51%
30%
25%
15%
8%
2%
1%
1%
The mission of the organization
The responsibilities of the role
The culture of the organization
Flexible working conditions/practices
The reputation of the organization
Being fairly compensated for the value I bring to the organization
The size of the organization
Benefits (e.g., healthcare, retirement plan, etc.)
DK/NA
Prompted, combined mentions, all executive directors, 2011
Q. We would also like to understand people’s motivations for taking up their current executive director position in a nonprofit. We are looking for the two most important motivations.
40
Key Finding 8: Remuneration is not the top motivator for working in the sector, but it is important for retaining leaders

41
Driving Change: A National Study of Nonprofit Executive Leaders
While compensation is not a key motivator for taking up an executive director role (see Key Finding 7), it should not be dismissed as unimportant. “While salary may not be the first thing we look at as executive directors, it doesn’t mean that it is not important.” – Executive Director, social services nonprofit One-half (49%) of executive directors say they are making a personal financial sacrifice to work in their current job in the nonprofit sector. The strongest sense of this is among those executive directors who are earning less than $50,000. Here 60 per cent rate their personal financial sacrifice as ‘7’ or higher.
This sense of personal financial sacrifice is important when viewed against the two key retention measures. There is a greater sense of personal financial sacrifice among those who indicate they are likely to remain in their position for up to two more years. Also, the sense of personal financial sacrifice is significantly lower among those who indicate their next position will still be in the nonprofit sector, compared to those who are likely to look towards other sectors for their next position.
Salary and Benefits
The sense of personal financial sacrifice felt by executive directors has a clear link to retention.
49%
56% 57%
40% 48%
43% 55%
43% 64% 63%
61% 40%
Overall
One year or less
Two years
Three to four years
Five to seven years
Eight years or more
Don't know
Nonprofit sector
Private sector
Public sector
Self employed
Retire
Length of time likely to remain in current position
Likely destination when leaving current position
Percentage ‘sacrifice,’* all executive directors, 2011
*7+8+9+10 on 11-point scale from ‘None at all (0) to ‘A great deal’ (10)
Q. To what extent, if at all, are you making a personal financial sacrifice to work in your current job in the nonprofit sector?

42
Driving Change: A National Study of Nonprofit Executive Leaders
Overall, executive directors are divided when asked whether they agree or disagree that, compared with the rest of the nonprofit sector, they are well compensated for their work. However, when the results of this question are examined across annual salary bands, it is clear that those executive directors with the lowest salaries believe that they are not well compensated for their work when compared to the sector as a whole.
As with the sense of personal financial sacrifice, how well executive directors feel they are compensated compared to the rest of the sector also has bearing on the length of time respondents feel they will remain in their current position. For example among those who completely disagreed with this statement (0+1), 44 per cent are likely to leave their position within the next two years. This compared to just 23 per cent among those who completely agreed with the statement (9+10).
Salary and Benefits
Executive directors with lower annual salaries have a strong sense that, compared to the rest of the nonprofit sector, they are not well compensated.
7
4
4
7
8
15
32
17
6
8
12
23
29
38
40
21
40
43
44
40
24
19
22
29
23
15
12
4
13
43
18
15
6
3
4
4
4
All Executive Directors
Less than $30,000
$30,000 to $39,999
$40,000 to $49,999
$50,000 to $69,999
$70,000 to $99,999
$100,000 or more
DK/NA
Completely Agree
Completely Disagree
Comparison to the rest of the sector by annual salary
All executive directors and by annual salary, 2011
Q. Compared to the rest of the nonprofit sector as a whole, I am well compensated for my work
1

43
Driving Change: A National Study of Nonprofit Executive Leaders
Four in ten board members state that the level of compensation they were able to offer was a significant hindrance to their ability to recruit a new executive director. This was much more of a hindrance than other factors such as internal resources and knowledge, and competition from other sectors. When asked, unprompted, to state what the biggest challenge was in recruiting their current executive director, the most mentioned challenge is that the job is poorly paid (20%).
Salary and Benefits
The compensation level of the executive director position is a recruitment challenge recognized by many board members. 20
10
9
8
8
5
5
4
22
10
16
12
12
6
2
9
29
22
36
19
17
25
21
24
10
17
15
20
16
21
17
21
15
37
20
37
41
39
50
37
4
4
4
4
6
4
5
5
The level of compensation able to be offered
Lack of resources to conduct effective recruitment
The specialized skills needed for the position
Lack of time
Competition from the private/public sector
The ability of the board to support career development opportunities
Lack of knowledge about how to recruit an Executive Director
Competition from other nonprofit organizations
DK/NA
Hindered a lot
No hindrance
All board members, 2011
Q. To what extent, if at all, did each of the factors listed below hinder the organization’s recruitment of a new executive director?

44
Key Finding 9: Leadership skills are the most important attributes that prospective Executive Directors need to possess

45
Driving Change: A National Study of Nonprofit Executive Leaders
Executive directors were asked which attributes or skills they possess that made them the most attractive candidate for their current position. Most select leadership skills (56%), followed by specific subject area or sector knowledge (31%). “I love being an executive director, but I think it is only a suitable job for those people who are good leaders.” – Executive Director, health nonprofit.
This corresponds to what board members indicate were the most important criteria in the selection of the current executive director of their organization. Leadership skills in general seem to outweigh management experience, whether it be in nonprofits or just generally.
Recruitment
Board members and executive directors agree that leadership skills are the most fundamental attribute that nonprofit leaders should possess.
68
47
46
38
29
29
29
27
26
25
25
22
20
16
15
9
6
27
39
40
41
50
37
51
52
39
37
46
46
44
54
53
32
7
3
10
7
17
18
27
17
15
25
19
21
25
24
24
22
43
29
0
2
3
1
3
6
1
2
8
15
5
5
8
4
7
13
56
2
2
4
3
1
2
4
2
4
3
2
4
2
3
3
2
Leadership skills
Staff/volunteer management skills
Good references
Subject area/sector knowledge
Nonprofit management experience
Fundraising experience
Experience working with boards
Public relations experience
Grant writing experience
Cultural fit
Human resources experience
General senior management experience
Field experience
General nonprofit experience
Educational qualifications
Private sector/business experience
Bilingualism (English/French)
Essential Important Nice to have Not considered DK/NA
All Board Members, 2011
Q. From the list below, please indicate how important each of these criteria was in your selection of the executive director.

46
Appendix: Respondent profiles
47
Driving Change: A National Study of Nonprofit Executive Leaders
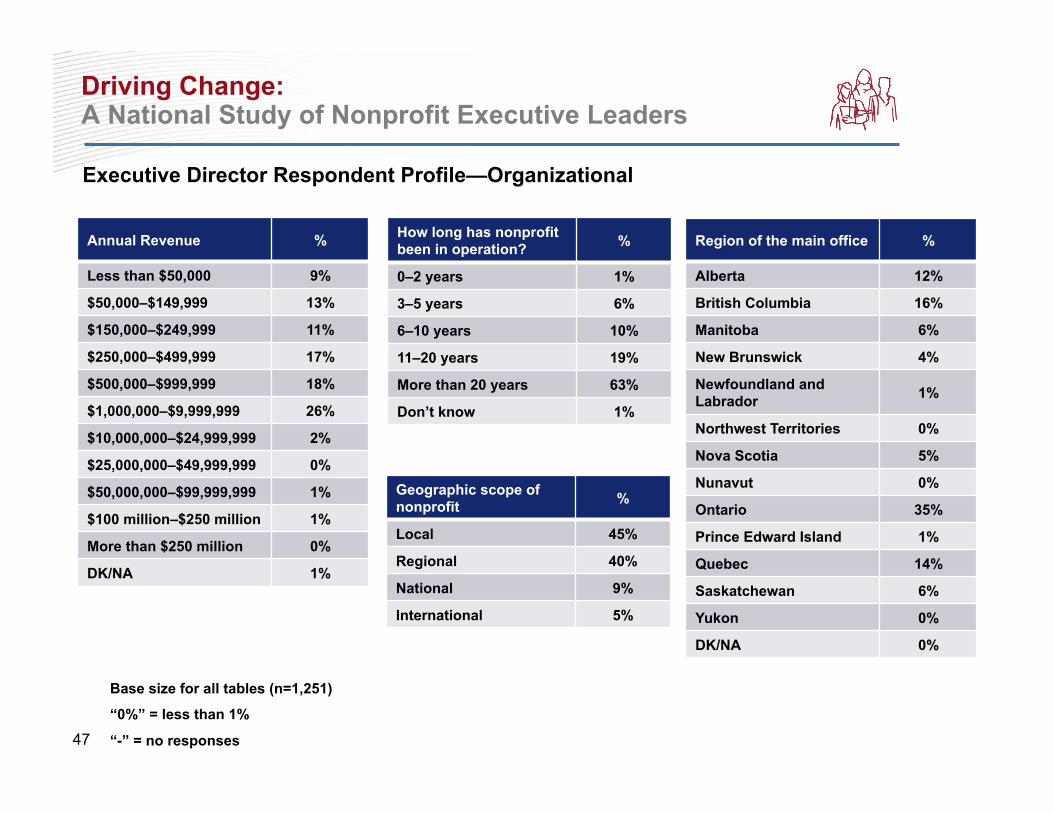
Executive Director Respondent Profile—Organizational
Annual Revenue %
Less than $50,000 9%
$50,000–$149,999 13%
$150,000–$249,999 11%
$250,000–$499,999 17%
$500,000–$999,999 18%
$1,000,000–$9,999,999 26%
$10,000,000–$24,999,999 2%
$25,000,000–$49,999,999 0%
$50,000,000–$99,999,999 1%
$100 million–$250 million 1%
More than $250 million 0%
DK/NA 1%
How long has nonprofit been in operation? %
0–2 years 1%
3–5 years 6%
6–10 years 10%
11–20 years 19%
More than 20 years 63%
Don’t know 1%
Geographic scope of nonprofit %
Local 45%
Regional 40%
National 9%
International 5%
Region of the main office %
Alberta 12%
British Columbia 16%
Manitoba 6%
New Brunswick 4%
Newfoundland and Labrador 1%
Northwest Territories 0%
Nova Scotia 5%
Nunavut 0%
Ontario 35%
Prince Edward Island 1%
Quebec 14%
Saskatchewan 6%
Yukon 0%
DK/NA 0%
Base size for all tables (n=1,251)
“0%” = less than 1%
“-” = no responses

48
Driving Change: A National Study of Nonprofit Executive Leaders
Executive Director Respondent Profile—Organizational (cont.)
Operation Area %
Aboriginal communities/interests 1%
Animals 1%
Arts/culture 12%
Business/professional associations/ unions 2%
Community development 6%
Disability 7%
Education/training 10%
Employment 1%
Environment/conservation 3%
Grant-making/fundraising/voluntarism promotion 2%
Health/medical/sickness 10%
Heritage 2%
Hospital 0%
Base size for all tables (n=1,251)
“0%” = less than 1%
“-” = no responses
Operation Area %
Housing 4%
Human rights 1%
Human services (e.g., daycare, senior center) 8%
Humanitarian relief 1%
International development/overseas aid 2%
Law/advocacy/politics 1%
Poverty relief 3%
Religion 5%
Research organization/think tank 1%
Social services 19%
Sports/recreation 3%
University/college 0%
Other (please specify) 2%

49
Driving Change: A National Study of Nonprofit Executive Leaders
Executive Director Respondent Profile—Personal
Gender %
Male 31%
Female 69%
Transgender -
Base size for all tables (n=1,251)
“0%” = less than 1%. “-” = no responses
*Multi-response
Age %
18–24 0%
25–34 4%
35–44 14%
45–54 35%
55–64 36%
65–74 9%
75 or older 1%
No answer 0%
Highest level of education achieved %
Less than high school 0%
High school graduate 3%
Some college or university 15%
Completed community/ vocational college 15%
Completed Bachelor’s degree 35%
Master’s degree 25%
Doctoral degree 3%
Professional degree 4%
Race / ethnic origin* %
White 93%
Aboriginal 2%
Black 2%
South Asian 1%
Chinese 1%
Filipino 1%
Latin American 1%
Other 2%
Language fluent in %
English 92%
French 24%
German 2%
Other 7%
Job title %
Executive Director 78%
President 10%
CEO 7%
General Manager 2%
Director 2%
50
Driving Change: A National Study of Nonprofit Executive Leaders
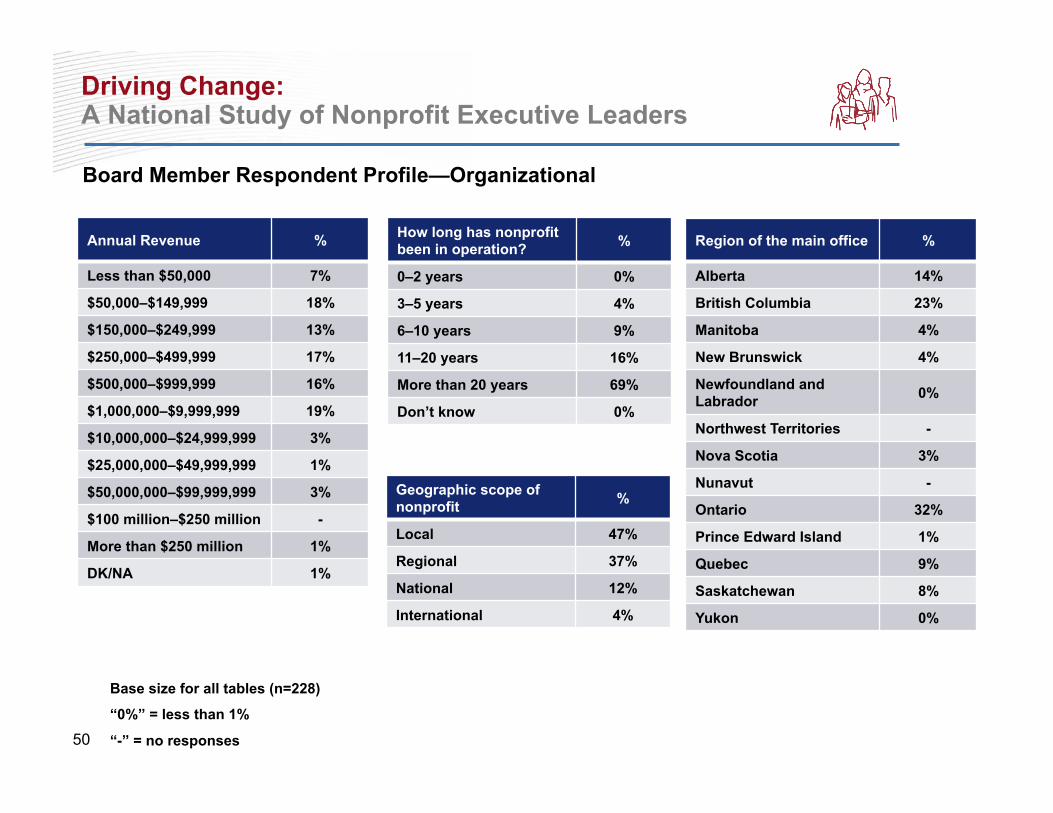
Board Member Respondent Profile—Organizational
Annual Revenue %
Less than $50,000 7%
$50,000–$149,999 18%
$150,000–$249,999 13%
$250,000–$499,999 17%
$500,000–$999,999 16%
$1,000,000–$9,999,999 19%
$10,000,000–$24,999,999 3%
$25,000,000–$49,999,999 1%
$50,000,000–$99,999,999 3%
$100 million–$250 million -
More than $250 million 1%
DK/NA 1%
How long has nonprofit been in operation? %
0–2 years 0%
3–5 years 4%
6–10 years 9%
11–20 years 16%
More than 20 years 69%
Don’t know 0%
Geographic scope of nonprofit %
Local 47%
Regional 37%
National 12%
International 4%
Region of the main office %
Alberta 14%
British Columbia 23%
Manitoba 4%
New Brunswick 4%
Newfoundland and Labrador 0%
Northwest Territories -
Nova Scotia 3%
Nunavut -
Ontario 32%
Prince Edward Island 1%
Quebec 9%
Saskatchewan 8%
Yukon 0%
Base size for all tables (n=228)
“0%” = less than 1%
“-” = no responses

51
Driving Change: A National Study of Nonprofit Executive Leaders
Board Member Respondent Profile—Organizational (cont.)
Operation Area %
Aboriginal communities/interests 2%
Animals 0%
Arts/culture 11%
Business/professional associations/ unions 6%
Community development 9%
Disability 9%
Education/training 10%
Employment 1%
Environment/conservation 1%
Grant-making/fundraising/voluntarism promotion 4%
Health/medical/sickness 8%
Heritage 3%
Hospital -
Base size for all tables (n=228)
“0%” = less than 1%
“-” = no responses
Operation Area %
Housing 4%
Human rights 2%
Human services (e.g., daycare, senior center) 8%
Humanitarian relief 0%
International development/overseas aid 0%
Law/advocacy/politics 1%
Poverty relief 3%
Religion 6%
Research organization/think tank 2%
Social services 17%
Sports/recreation 3%
University/college 1%
Other (please specify) 4%

52
Driving Change: A National Study of Nonprofit Executive Leaders
Board Member Respondent Profile—Personal
Gender %
Male 46%
Female 54%
Transgender -
Base size for all tables (n=228)
“0%” = less than 1%. “-” = no responses
*Multi-response
Age %
18–24 1%
25–34 5%
35–44 7%
45–54 21%
55–64 40%
65–74 21%
75 or older 4%
No answer 1%
Highest level of education achieved %
Less than high school 3%
High school graduate 4%
Some college or university 15%
Completed community/ vocational college 9%
Completed Bachelor’s degree 28%
Master’s degree 25%
Doctoral degree 4%
Professional degree 13%
Board role %
Board Chair 50%
Board member 45%
Hiring committee member 4%
Other 1%
Race / ethnic origin* %
White 92%
Aboriginal 4%
South Asian 2%
Arab 1%
Other 2%
No answer 3%
Language fluent in %
English 96%
French 22%
Other 8%

53